Springfield, KY Map & Demographics
Springfield Map
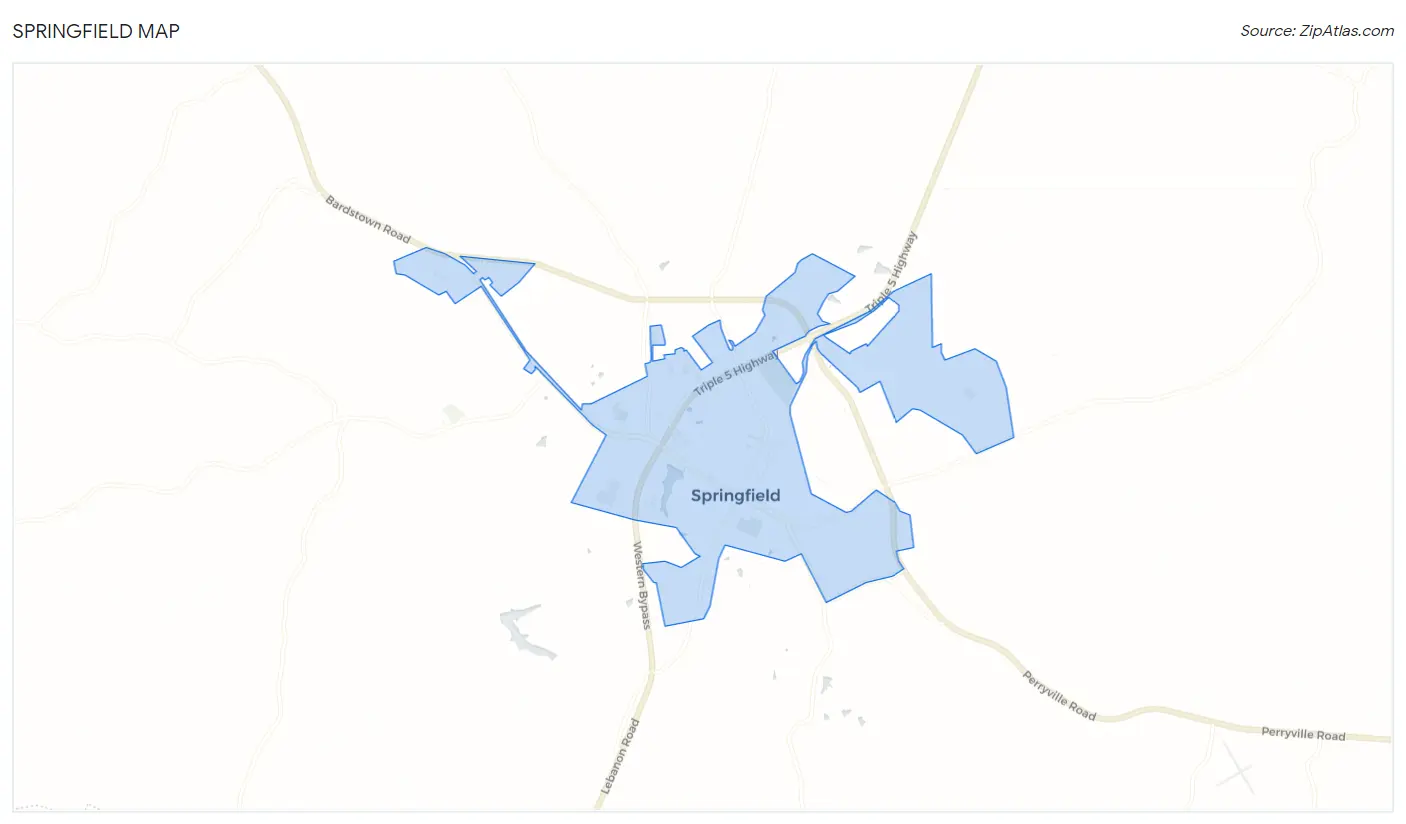
Springfield Overview
$29,140
PER CAPITA INCOME
$88,288
AVG FAMILY INCOME
$48,333
AVG HOUSEHOLD INCOME
12.4%
WAGE / INCOME GAP [ % ]
87.6¢/ $1
WAGE / INCOME GAP [ $ ]
0.44
INEQUALITY / GINI INDEX
2,846
TOTAL POPULATION
1,342
MALE POPULATION
1,504
FEMALE POPULATION
89.23
MALES / 100 FEMALES
112.07
FEMALES / 100 MALES
36.8
MEDIAN AGE
3.0
AVG FAMILY SIZE
2.0
AVG HOUSEHOLD SIZE
1,481
LABOR FORCE [ PEOPLE ]
64.8%
PERCENT IN LABOR FORCE
0.5%
UNEMPLOYMENT RATE
Springfield Zip Codes
Springfield Area Codes
Income in Springfield
Income Overview in Springfield
Per Capita Income in Springfield is $29,140, while median incomes of families and households are $88,288 and $48,333 respectively.
| Characteristic | Number | Measure |
| Per Capita Income | 2,846 | $29,140 |
| Median Family Income | 613 | $88,288 |
| Mean Family Income | 613 | $84,945 |
| Median Household Income | 1,266 | $48,333 |
| Mean Household Income | 1,266 | $60,924 |
| Income Deficit | 613 | $0 |
| Wage / Income Gap (%) | 2,846 | 12.36% |
| Wage / Income Gap ($) | 2,846 | 87.64¢ per $1 |
| Gini / Inequality Index | 2,846 | 0.44 |
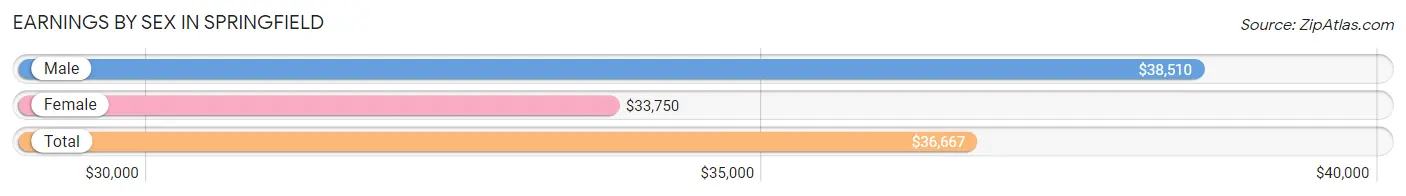
Earnings by Sex in Springfield
Average Earnings in Springfield are $36,667, $38,510 for men and $33,750 for women, a difference of 12.4%.
| Sex | Number | Average Earnings |
| Male | 839 (53.6%) | $38,510 |
| Female | 725 (46.4%) | $33,750 |
| Total | 1,564 (100.0%) | $36,667 |
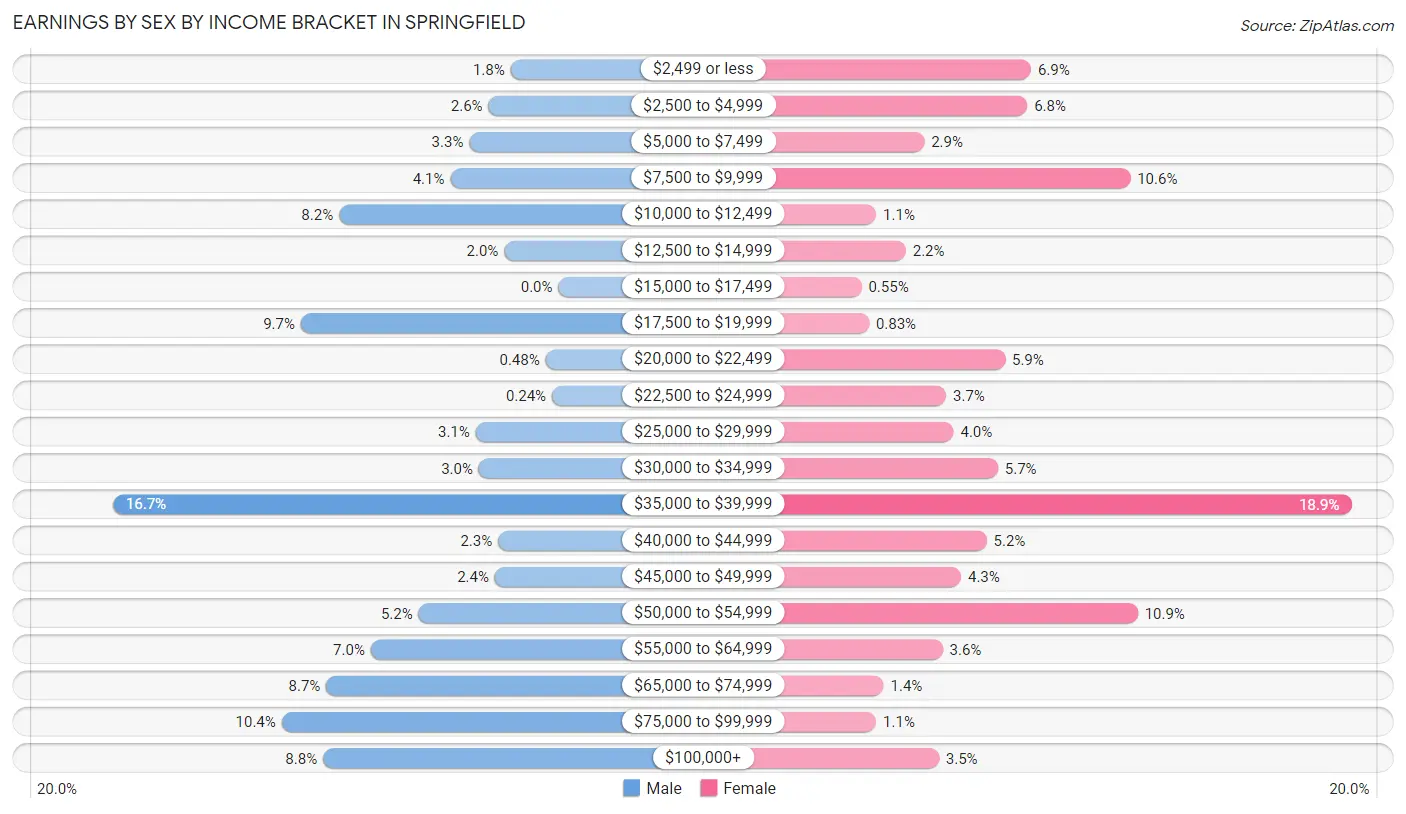
Earnings by Sex by Income Bracket in Springfield
The most common earnings brackets in Springfield are $35,000 to $39,999 for men (140 | 16.7%) and $35,000 to $39,999 for women (137 | 18.9%).
| Income | Male | Female |
| $2,499 or less | 15 (1.8%) | 50 (6.9%) |
| $2,500 to $4,999 | 22 (2.6%) | 49 (6.8%) |
| $5,000 to $7,499 | 28 (3.3%) | 21 (2.9%) |
| $7,500 to $9,999 | 34 (4.1%) | 77 (10.6%) |
| $10,000 to $12,499 | 69 (8.2%) | 8 (1.1%) |
| $12,500 to $14,999 | 17 (2.0%) | 16 (2.2%) |
| $15,000 to $17,499 | 0 (0.0%) | 4 (0.5%) |
| $17,500 to $19,999 | 81 (9.7%) | 6 (0.8%) |
| $20,000 to $22,499 | 4 (0.5%) | 43 (5.9%) |
| $22,500 to $24,999 | 2 (0.2%) | 27 (3.7%) |
| $25,000 to $29,999 | 26 (3.1%) | 29 (4.0%) |
| $30,000 to $34,999 | 25 (3.0%) | 41 (5.7%) |
| $35,000 to $39,999 | 140 (16.7%) | 137 (18.9%) |
| $40,000 to $44,999 | 19 (2.3%) | 38 (5.2%) |
| $45,000 to $49,999 | 20 (2.4%) | 31 (4.3%) |
| $50,000 to $54,999 | 44 (5.2%) | 79 (10.9%) |
| $55,000 to $64,999 | 59 (7.0%) | 26 (3.6%) |
| $65,000 to $74,999 | 73 (8.7%) | 10 (1.4%) |
| $75,000 to $99,999 | 87 (10.4%) | 8 (1.1%) |
| $100,000+ | 74 (8.8%) | 25 (3.5%) |
| Total | 839 (100.0%) | 725 (100.0%) |
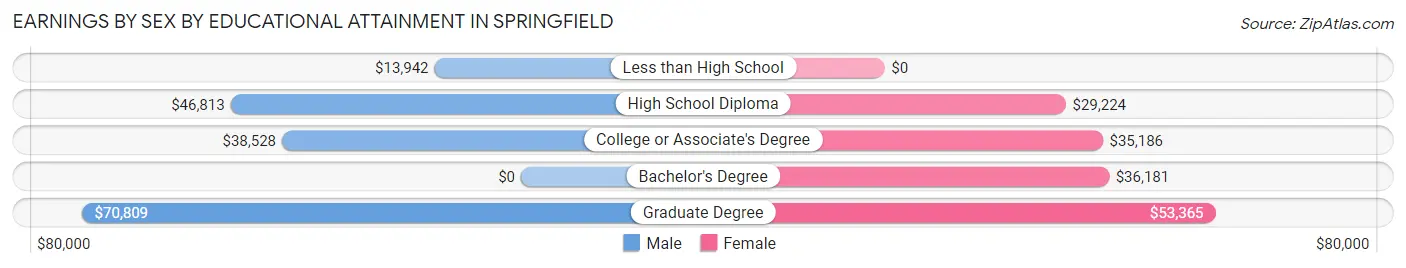
Earnings by Sex by Educational Attainment in Springfield
Average earnings in Springfield are $41,316 for men and $36,346 for women, a difference of 12.0%. Men with an educational attainment of graduate degree enjoy the highest average annual earnings of $70,809, while those with less than high school education earn the least with $13,942. Women with an educational attainment of graduate degree earn the most with the average annual earnings of $53,365, while those with high school diploma education have the smallest earnings of $29,224.
| Educational Attainment | Male Income | Female Income |
| Less than High School | $13,942 | $0 |
| High School Diploma | $46,813 | $29,224 |
| College or Associate's Degree | $38,528 | $35,186 |
| Bachelor's Degree | - | - |
| Graduate Degree | $70,809 | $53,365 |
| Total | $41,316 | $36,346 |
Family Income in Springfield
Family Income Brackets in Springfield
According to the Springfield family income data, there are 215 families falling into the $75,000 to $99,999 income range, which is the most common income bracket and makes up 35.1% of all families. Conversely, the less than $10,000 income bracket is the least frequent group with only 24 families (3.9%) belonging to this category.
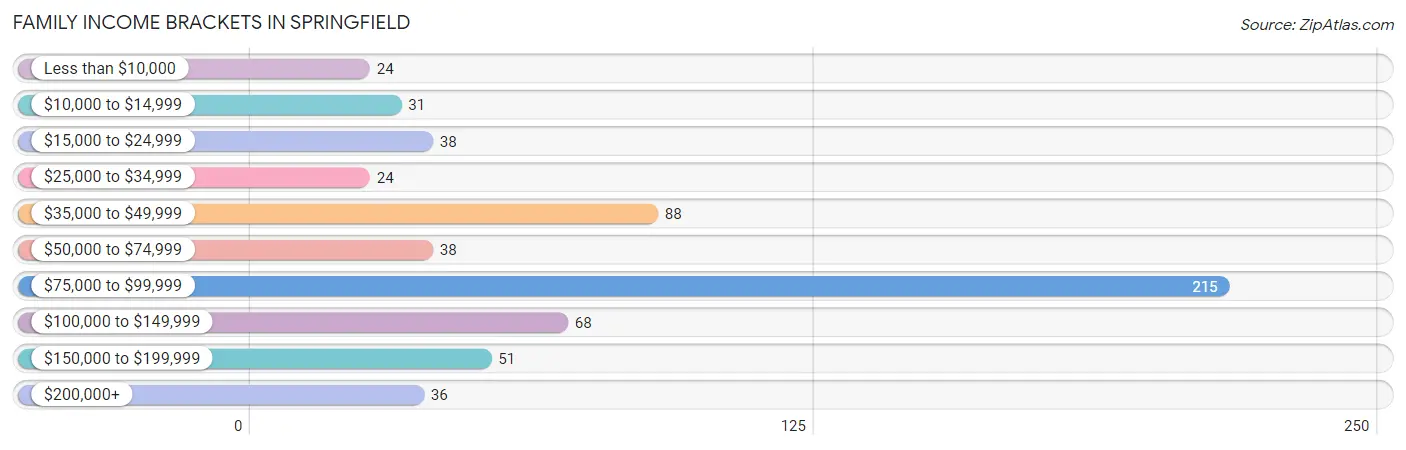
| Income Bracket | # Families | % Families |
| Less than $10,000 | 24 | 3.9% |
| $10,000 to $14,999 | 31 | 5.1% |
| $15,000 to $24,999 | 38 | 6.2% |
| $25,000 to $34,999 | 24 | 3.9% |
| $35,000 to $49,999 | 88 | 14.4% |
| $50,000 to $74,999 | 38 | 6.2% |
| $75,000 to $99,999 | 215 | 35.1% |
| $100,000 to $149,999 | 68 | 11.1% |
| $150,000 to $199,999 | 51 | 8.3% |
| $200,000+ | 36 | 5.9% |
Family Income by Famaliy Size in Springfield
4-person families (117 | 19.1%) account for the highest median family income in Springfield with $90,905 per family, while 2-person families (335 | 54.6%) have the highest median income of $41,469 per family member.
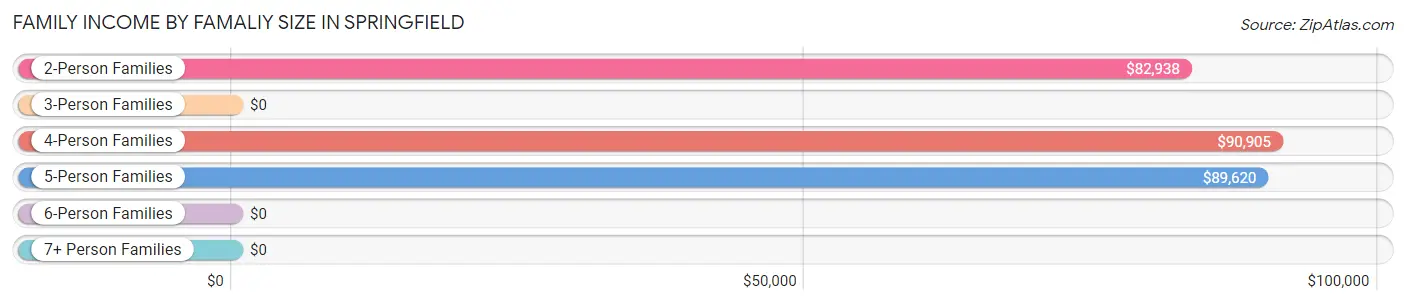
| Income Bracket | # Families | Median Income |
| 2-Person Families | 335 (54.6%) | $82,938 |
| 3-Person Families | 78 (12.7%) | $0 |
| 4-Person Families | 117 (19.1%) | $90,905 |
| 5-Person Families | 78 (12.7%) | $89,620 |
| 6-Person Families | 5 (0.8%) | $0 |
| 7+ Person Families | 0 (0.0%) | $0 |
| Total | 613 (100.0%) | $88,288 |
Family Income by Number of Earners in Springfield
The median family income in Springfield is $88,288, with families comprising 2 earners (327) having the highest median family income of $95,417, while families with no earners (95) have the lowest median family income of $22,250, accounting for 53.3% and 15.5% of families, respectively.
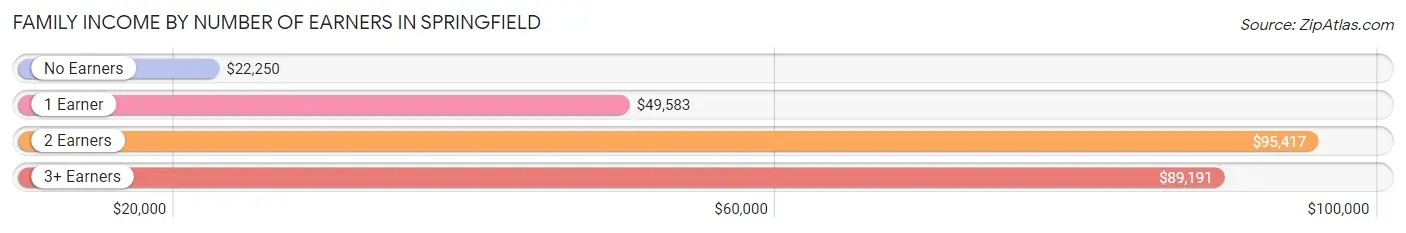
| Number of Earners | # Families | Median Income |
| No Earners | 95 (15.5%) | $22,250 |
| 1 Earner | 152 (24.8%) | $49,583 |
| 2 Earners | 327 (53.3%) | $95,417 |
| 3+ Earners | 39 (6.4%) | $89,191 |
| Total | 613 (100.0%) | $88,288 |
Household Income in Springfield
Household Income Brackets in Springfield
With 249 households falling in the category, the $75,000 to $99,999 income range is the most frequent in Springfield, accounting for 19.7% of all households. In contrast, only 35 households (2.8%) fall into the $200,000+ income bracket, making it the least populous group.
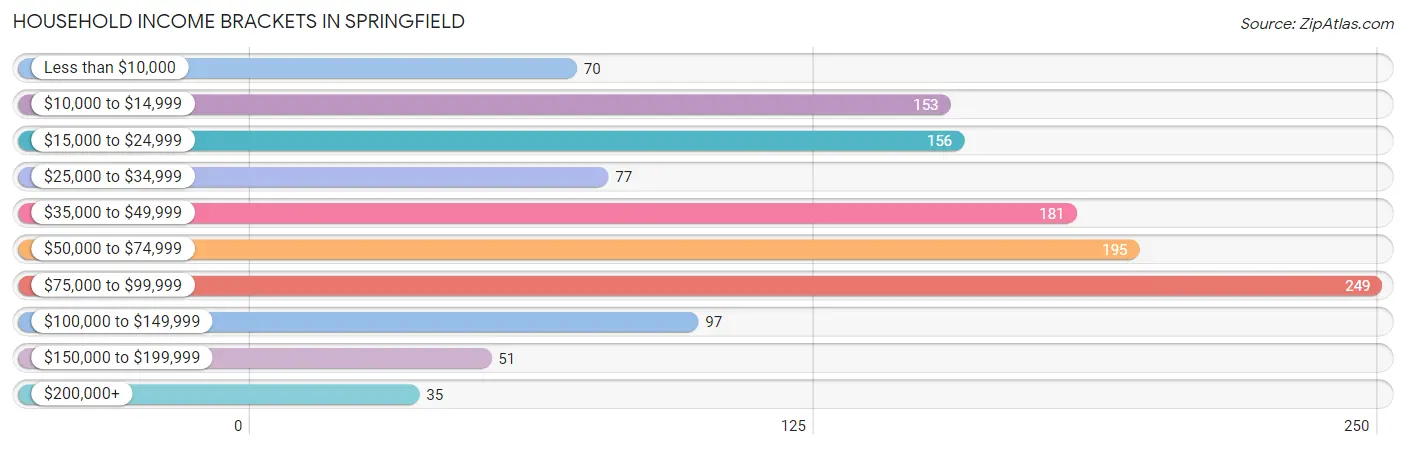
| Income Bracket | # Households | % Households |
| Less than $10,000 | 70 | 5.5% |
| $10,000 to $14,999 | 153 | 12.1% |
| $15,000 to $24,999 | 156 | 12.3% |
| $25,000 to $34,999 | 77 | 6.1% |
| $35,000 to $49,999 | 181 | 14.3% |
| $50,000 to $74,999 | 195 | 15.4% |
| $75,000 to $99,999 | 249 | 19.7% |
| $100,000 to $149,999 | 97 | 7.7% |
| $150,000 to $199,999 | 51 | 4.0% |
| $200,000+ | 35 | 2.8% |
Household Income by Householder Age in Springfield
The median household income in Springfield is $48,333, with the highest median household income of $72,736 found in the 45 to 64 years age bracket for the primary householder. A total of 465 households (36.7%) fall into this category. Meanwhile, the 15 to 24 years age bracket for the primary householder has the lowest median household income of $0, with 50 households (4.0%) in this group.
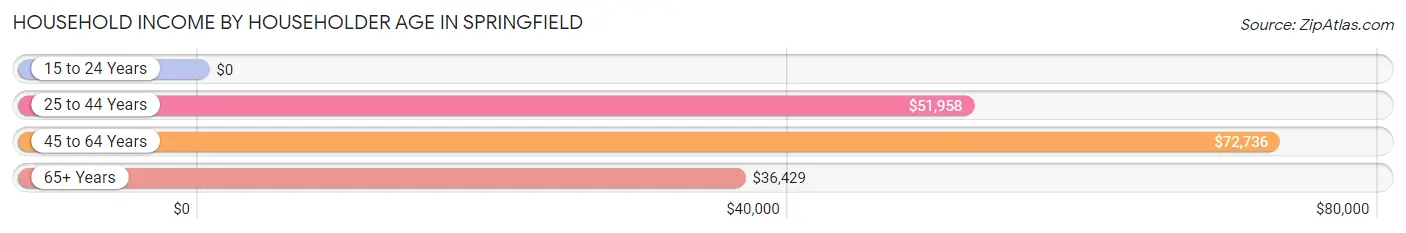
| Income Bracket | # Households | Median Income |
| 15 to 24 Years | 50 (4.0%) | $0 |
| 25 to 44 Years | 373 (29.5%) | $51,958 |
| 45 to 64 Years | 465 (36.7%) | $72,736 |
| 65+ Years | 378 (29.9%) | $36,429 |
| Total | 1,266 (100.0%) | $48,333 |
Poverty in Springfield
Income Below Poverty by Sex and Age in Springfield
With 15.7% poverty level for males and 21.5% for females among the residents of Springfield, 18 to 24 year old males and 5 year old females are the most vulnerable to poverty, with 16 males (43.2%) and 11 females (100.0%) in their respective age groups living below the poverty level.
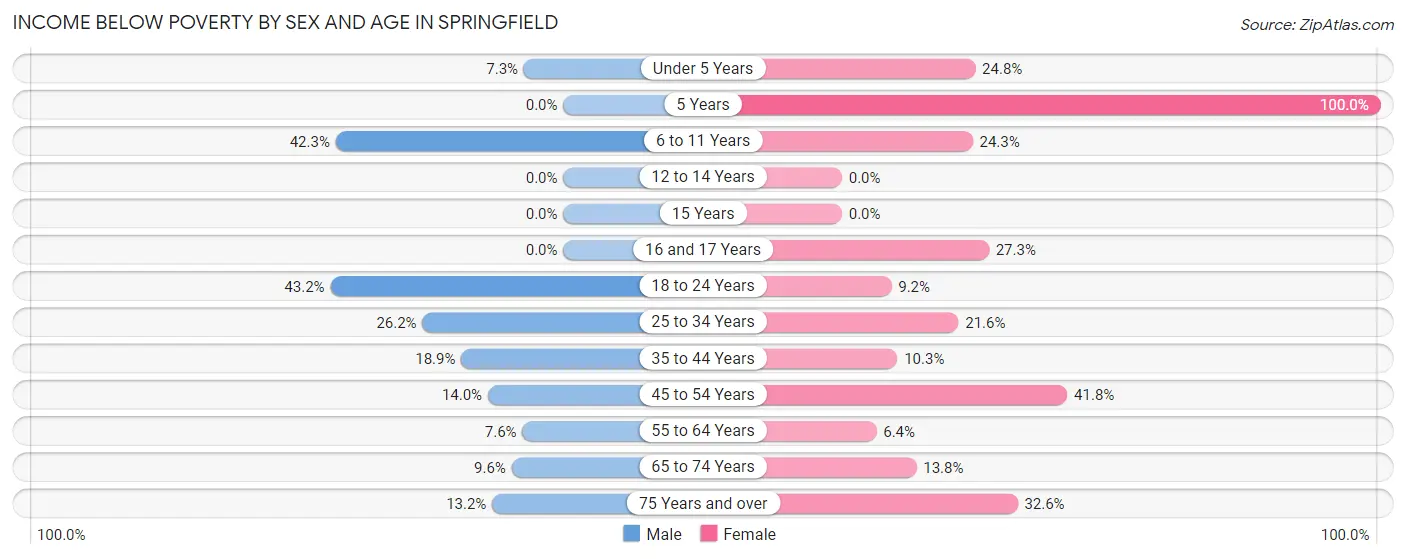
| Age Bracket | Male | Female |
| Under 5 Years | 6 (7.3%) | 25 (24.7%) |
| 5 Years | 0 (0.0%) | 11 (100.0%) |
| 6 to 11 Years | 30 (42.2%) | 25 (24.3%) |
| 12 to 14 Years | 0 (0.0%) | 0 (0.0%) |
| 15 Years | 0 (0.0%) | 0 (0.0%) |
| 16 and 17 Years | 0 (0.0%) | 12 (27.3%) |
| 18 to 24 Years | 16 (43.2%) | 9 (9.2%) |
| 25 to 34 Years | 68 (26.2%) | 56 (21.6%) |
| 35 to 44 Years | 25 (18.9%) | 7 (10.3%) |
| 45 to 54 Years | 14 (14.0%) | 64 (41.8%) |
| 55 to 64 Years | 18 (7.6%) | 11 (6.4%) |
| 65 to 74 Years | 14 (9.6%) | 21 (13.8%) |
| 75 Years and over | 7 (13.2%) | 59 (32.6%) |
| Total | 198 (15.7%) | 300 (21.5%) |
Income Above Poverty by Sex and Age in Springfield
According to the poverty statistics in Springfield, males aged 5 years and females aged 12 to 14 years are the age groups that are most secure financially, with 100.0% of males and 100.0% of females in these age groups living above the poverty line.
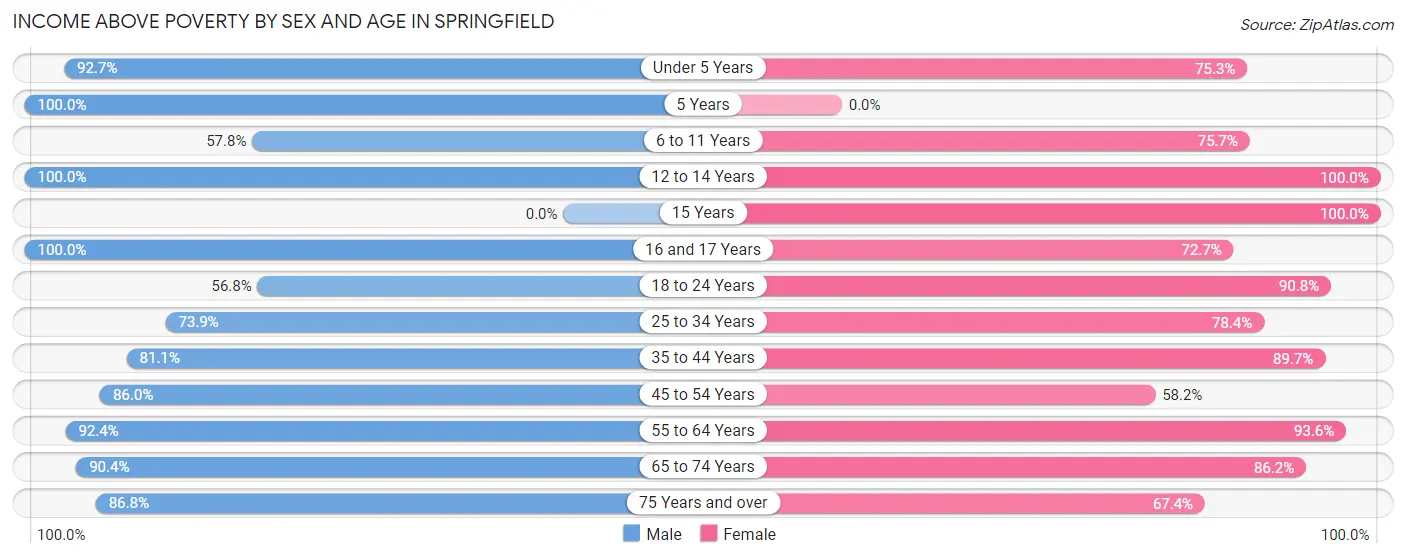
| Age Bracket | Male | Female |
| Under 5 Years | 76 (92.7%) | 76 (75.2%) |
| 5 Years | 15 (100.0%) | 0 (0.0%) |
| 6 to 11 Years | 41 (57.8%) | 78 (75.7%) |
| 12 to 14 Years | 114 (100.0%) | 25 (100.0%) |
| 15 Years | 0 (0.0%) | 29 (100.0%) |
| 16 and 17 Years | 18 (100.0%) | 32 (72.7%) |
| 18 to 24 Years | 21 (56.8%) | 89 (90.8%) |
| 25 to 34 Years | 192 (73.9%) | 203 (78.4%) |
| 35 to 44 Years | 107 (81.1%) | 61 (89.7%) |
| 45 to 54 Years | 86 (86.0%) | 89 (58.2%) |
| 55 to 64 Years | 219 (92.4%) | 161 (93.6%) |
| 65 to 74 Years | 132 (90.4%) | 131 (86.2%) |
| 75 Years and over | 46 (86.8%) | 122 (67.4%) |
| Total | 1,067 (84.4%) | 1,096 (78.5%) |
Income Below Poverty Among Married-Couple Families in Springfield
The poverty statistics for married-couple families in Springfield show that 0.7% or 3 of the total 400 families live below the poverty line. Families with 3 or 4 children have the highest poverty rate of 8.8%, comprising of 3 families. On the other hand, families with no children have the lowest poverty rate of 0.0%, which includes 0 families.
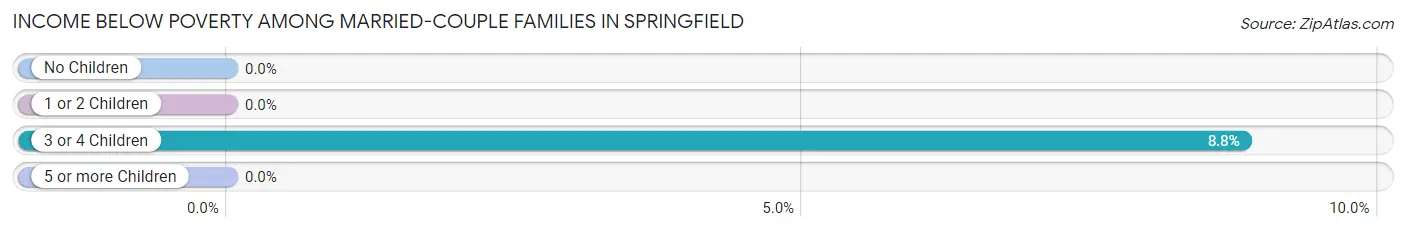
| Children | Above Poverty | Below Poverty |
| No Children | 253 (100.0%) | 0 (0.0%) |
| 1 or 2 Children | 113 (100.0%) | 0 (0.0%) |
| 3 or 4 Children | 31 (91.2%) | 3 (8.8%) |
| 5 or more Children | 0 (0.0%) | 0 (0.0%) |
| Total | 397 (99.3%) | 3 (0.7%) |
Income Below Poverty Among Single-Parent Households in Springfield
According to the poverty data in Springfield, 28.3% or 15 single-father households and 41.9% or 67 single-mother households are living below the poverty line. Among single-father households, those with 1 or 2 children have the highest poverty rate, with 15 households (100.0%) experiencing poverty. Likewise, among single-mother households, those with no children have the highest poverty rate, with 5 households (100.0%) falling below the poverty line.
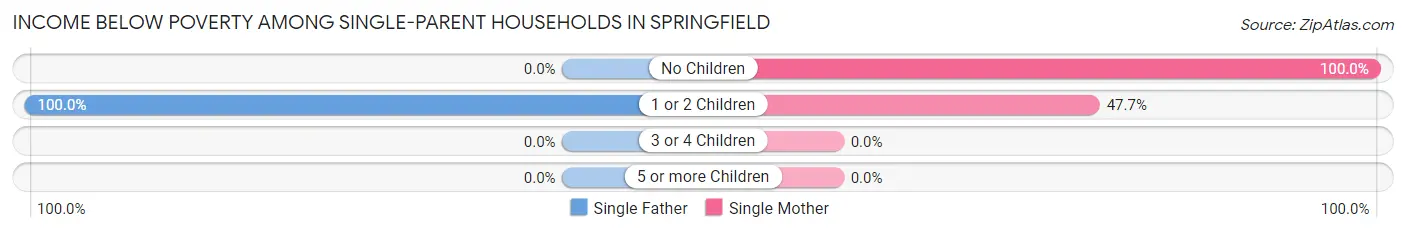
| Children | Single Father | Single Mother |
| No Children | 0 (0.0%) | 5 (100.0%) |
| 1 or 2 Children | 15 (100.0%) | 62 (47.7%) |
| 3 or 4 Children | 0 (0.0%) | 0 (0.0%) |
| 5 or more Children | 0 (0.0%) | 0 (0.0%) |
| Total | 15 (28.3%) | 67 (41.9%) |
Income Below Poverty Among Married-Couple vs Single-Parent Households in Springfield
The poverty data for Springfield shows that 3 of the married-couple family households (0.7%) and 82 of the single-parent households (38.5%) are living below the poverty level. Within the married-couple family households, those with 3 or 4 children have the highest poverty rate, with 3 households (8.8%) falling below the poverty line. Among the single-parent households, those with 1 or 2 children have the highest poverty rate, with 77 household (53.1%) living below poverty.
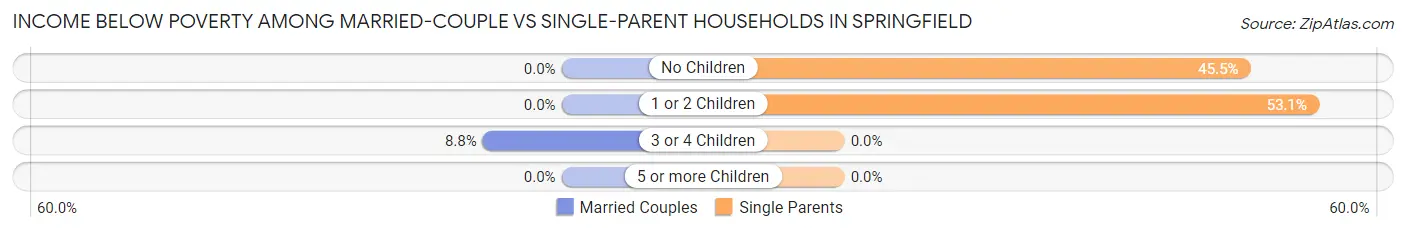
| Children | Married-Couple Families | Single-Parent Households |
| No Children | 0 (0.0%) | 5 (45.5%) |
| 1 or 2 Children | 0 (0.0%) | 77 (53.1%) |
| 3 or 4 Children | 3 (8.8%) | 0 (0.0%) |
| 5 or more Children | 0 (0.0%) | 0 (0.0%) |
| Total | 3 (0.7%) | 82 (38.5%) |
Race in Springfield
The most populous races in Springfield are White / Caucasian (2,037 | 71.6%), Black / African American (554 | 19.5%), and Two or more Races (218 | 7.7%).
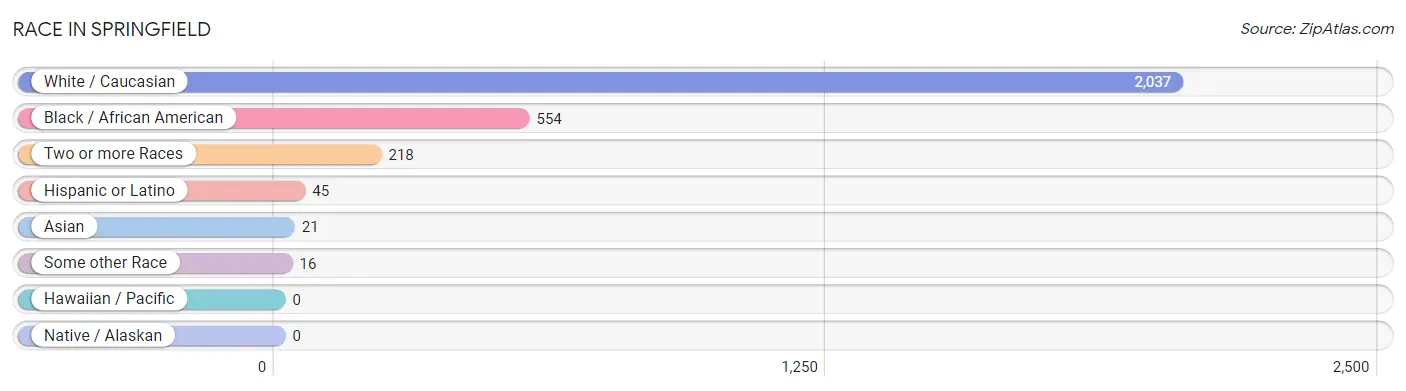
| Race | # Population | % Population |
| Asian | 21 | 0.7% |
| Black / African American | 554 | 19.5% |
| Hawaiian / Pacific | 0 | 0.0% |
| Hispanic or Latino | 45 | 1.6% |
| Native / Alaskan | 0 | 0.0% |
| White / Caucasian | 2,037 | 71.6% |
| Two or more Races | 218 | 7.7% |
| Some other Race | 16 | 0.6% |
| Total | 2,846 | 100.0% |
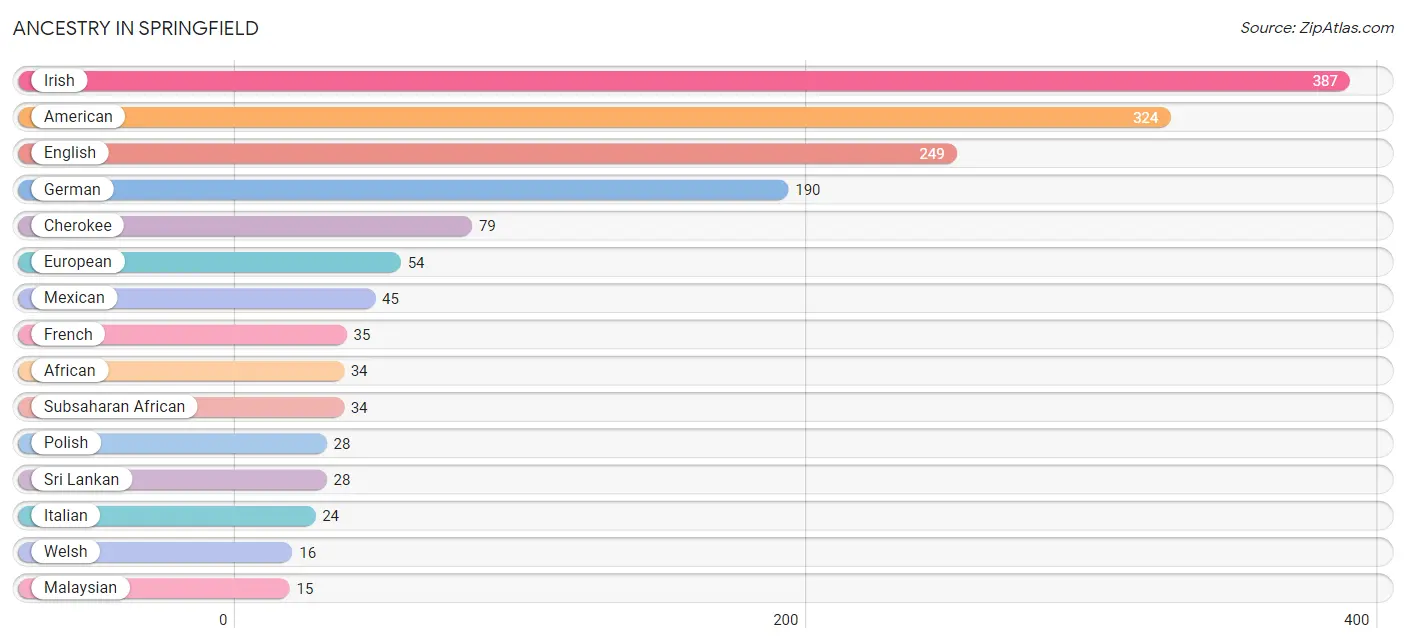
Ancestry in Springfield
The most populous ancestries reported in Springfield are Irish (387 | 13.6%), American (324 | 11.4%), English (249 | 8.7%), German (190 | 6.7%), and Cherokee (79 | 2.8%), together accounting for 43.2% of all Springfield residents.
| Ancestry | # Population | % Population |
| African | 34 | 1.2% |
| American | 324 | 11.4% |
| Australian | 10 | 0.4% |
| Bhutanese | 6 | 0.2% |
| Cherokee | 79 | 2.8% |
| Dutch | 7 | 0.3% |
| English | 249 | 8.7% |
| European | 54 | 1.9% |
| French | 35 | 1.2% |
| French Canadian | 9 | 0.3% |
| German | 190 | 6.7% |
| Irish | 387 | 13.6% |
| Italian | 24 | 0.8% |
| Malaysian | 15 | 0.5% |
| Mexican | 45 | 1.6% |
| Northern European | 3 | 0.1% |
| Norwegian | 2 | 0.1% |
| Polish | 28 | 1.0% |
| Scottish | 5 | 0.2% |
| Sri Lankan | 28 | 1.0% |
| Subsaharan African | 34 | 1.2% |
| Welsh | 16 | 0.6% | View All 22 Rows |
Immigrants in Springfield
The most numerous immigrant groups reported in Springfield came from Central America (45 | 1.6%), Latin America (45 | 1.6%), Mexico (45 | 1.6%), Asia (6 | 0.2%), and Eastern Asia (6 | 0.2%), together accounting for 5.2% of all Springfield residents.
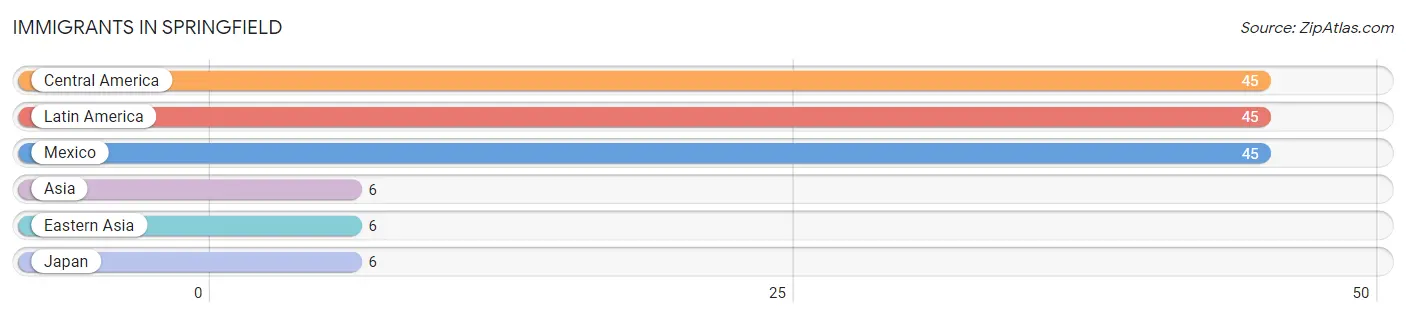
| Immigration Origin | # Population | % Population |
| Asia | 6 | 0.2% |
| Central America | 45 | 1.6% |
| Eastern Asia | 6 | 0.2% |
| Japan | 6 | 0.2% |
| Latin America | 45 | 1.6% |
| Mexico | 45 | 1.6% | View All 6 Rows |
Sex and Age in Springfield
Sex and Age in Springfield
The most populous age groups in Springfield are 55 to 59 Years (168 | 12.5%) for men and 15 to 19 Years (165 | 11.0%) for women.
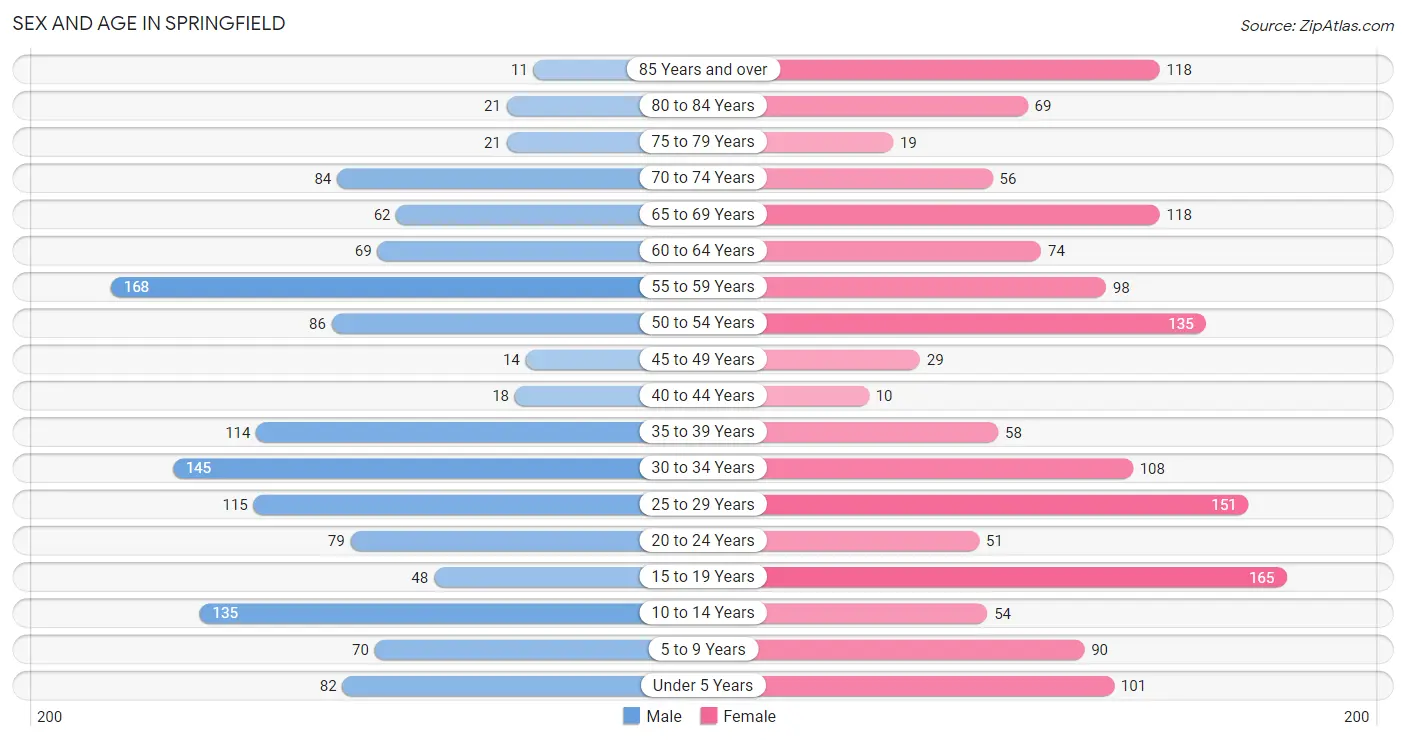
| Age Bracket | Male | Female |
| Under 5 Years | 82 (6.1%) | 101 (6.7%) |
| 5 to 9 Years | 70 (5.2%) | 90 (6.0%) |
| 10 to 14 Years | 135 (10.1%) | 54 (3.6%) |
| 15 to 19 Years | 48 (3.6%) | 165 (11.0%) |
| 20 to 24 Years | 79 (5.9%) | 51 (3.4%) |
| 25 to 29 Years | 115 (8.6%) | 151 (10.0%) |
| 30 to 34 Years | 145 (10.8%) | 108 (7.2%) |
| 35 to 39 Years | 114 (8.5%) | 58 (3.9%) |
| 40 to 44 Years | 18 (1.3%) | 10 (0.7%) |
| 45 to 49 Years | 14 (1.0%) | 29 (1.9%) |
| 50 to 54 Years | 86 (6.4%) | 135 (9.0%) |
| 55 to 59 Years | 168 (12.5%) | 98 (6.5%) |
| 60 to 64 Years | 69 (5.1%) | 74 (4.9%) |
| 65 to 69 Years | 62 (4.6%) | 118 (7.9%) |
| 70 to 74 Years | 84 (6.3%) | 56 (3.7%) |
| 75 to 79 Years | 21 (1.6%) | 19 (1.3%) |
| 80 to 84 Years | 21 (1.6%) | 69 (4.6%) |
| 85 Years and over | 11 (0.8%) | 118 (7.9%) |
| Total | 1,342 (100.0%) | 1,504 (100.0%) |
Families and Households in Springfield
Median Family Size in Springfield
The median family size in Springfield is 2.95 persons per family, with single male/father families (53 | 8.6%) accounting for the largest median family size of 3.08 persons per family. On the other hand, single female/mother families (160 | 26.1%) represent the smallest median family size with 2.89 persons per family.
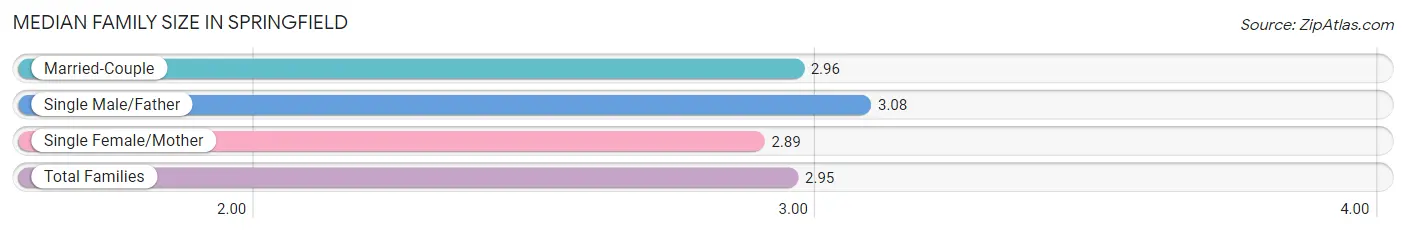
| Family Type | # Families | Family Size |
| Married-Couple | 400 (65.2%) | 2.96 |
| Single Male/Father | 53 (8.6%) | 3.08 |
| Single Female/Mother | 160 (26.1%) | 2.89 |
| Total Families | 613 (100.0%) | 2.95 |
Median Household Size in Springfield
The median household size in Springfield is 2.04 persons per household, with single female/mother households (160 | 12.6%) accounting for the largest median household size of 3.28 persons per household. non-family households (653 | 51.6%) represent the smallest median household size with 1.07 persons per household.
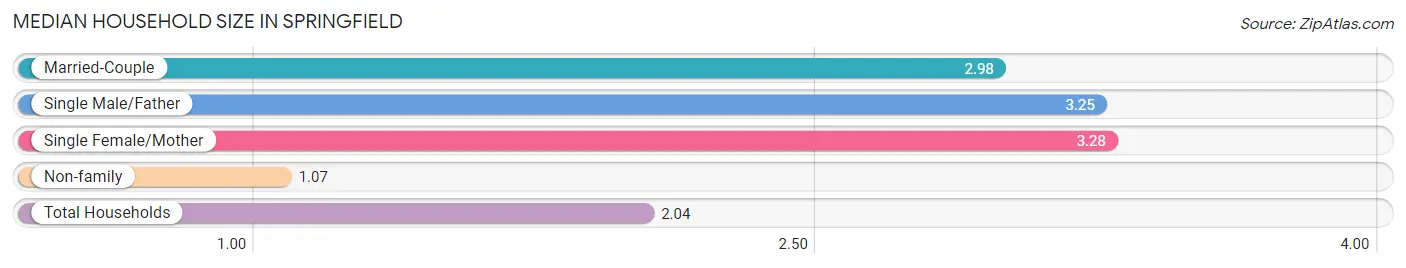
| Household Type | # Households | Household Size |
| Married-Couple | 400 (31.6%) | 2.98 |
| Single Male/Father | 53 (4.2%) | 3.25 |
| Single Female/Mother | 160 (12.6%) | 3.28 |
| Non-family | 653 (51.6%) | 1.07 |
| Total Households | 1,266 (100.0%) | 2.04 |
Household Size by Marriage Status in Springfield
Out of a total of 1,266 households in Springfield, 613 (48.4%) are family households, while 653 (51.6%) are nonfamily households. The most numerous type of family households are 2-person households, comprising 304, and the most common type of nonfamily households are 1-person households, comprising 611.
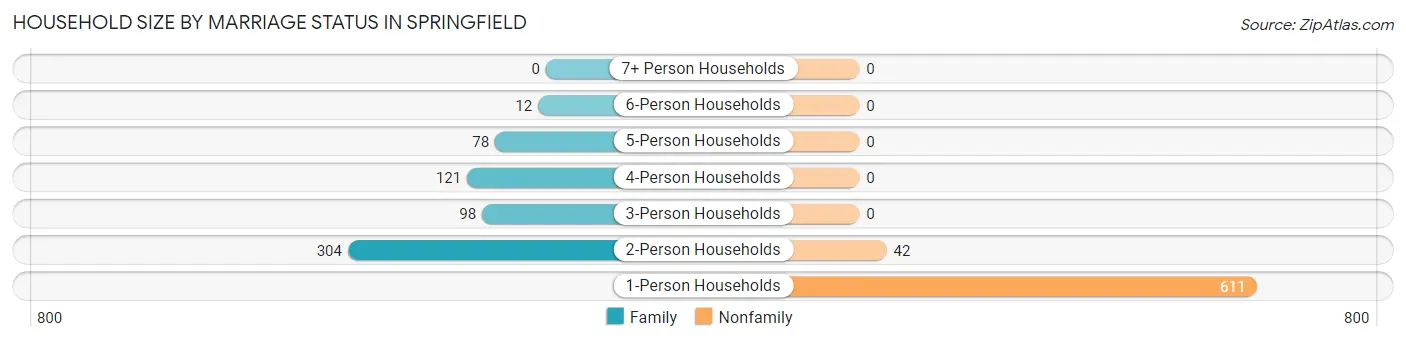
| Household Size | Family Households | Nonfamily Households |
| 1-Person Households | - | 611 (48.3%) |
| 2-Person Households | 304 (24.0%) | 42 (3.3%) |
| 3-Person Households | 98 (7.7%) | 0 (0.0%) |
| 4-Person Households | 121 (9.6%) | 0 (0.0%) |
| 5-Person Households | 78 (6.2%) | 0 (0.0%) |
| 6-Person Households | 12 (0.9%) | 0 (0.0%) |
| 7+ Person Households | 0 (0.0%) | 0 (0.0%) |
| Total | 613 (48.4%) | 653 (51.6%) |
Female Fertility in Springfield
Fertility by Age in Springfield
| Age Bracket | Women with Births | Births / 1,000 Women |
| 15 to 19 years | 0 (0.0%) | 0.0 |
| 20 to 34 years | 0 (0.0%) | 0.0 |
| 35 to 50 years | 0 (0.0%) | 0.0 |
| Total | 0 (0.0%) | 0.0 |
Fertility by Age by Marriage Status in Springfield
| Age Bracket | Married | Unmarried |
| 15 to 19 years | 0 (0.0%) | 0 (0.0%) |
| 20 to 34 years | 0 (0.0%) | 0 (0.0%) |
| 35 to 50 years | 0 (0.0%) | 0 (0.0%) |
| Total | 0 (0.0%) | 0 (0.0%) |
Fertility by Education in Springfield
| Educational Attainment | Women with Births | Births / 1,000 Women |
| Less than High School | 0 (0.0%) | 0.0 |
| High School Diploma | 0 (0.0%) | 0.0 |
| College or Associate's Degree | 0 (0.0%) | 0.0 |
| Bachelor's Degree | 0 (0.0%) | 0.0 |
| Graduate Degree | 0 (0.0%) | 0.0 |
| Total | 0 (0.0%) | 0.0 |
Fertility by Education by Marriage Status in Springfield
| Educational Attainment | Married | Unmarried |
| Less than High School | 0 (0.0%) | 0 (0.0%) |
| High School Diploma | 0 (0.0%) | 0 (0.0%) |
| College or Associate's Degree | 0 (0.0%) | 0 (0.0%) |
| Bachelor's Degree | 0 (0.0%) | 0 (0.0%) |
| Graduate Degree | 0 (0.0%) | 0 (0.0%) |
| Total | 0 (0.0%) | 0 (0.0%) |
Employment Characteristics in Springfield
Employment by Class of Employer in Springfield
Among the 1,453 employed individuals in Springfield, private company employees (1,081 | 74.4%), not-for-profit organizations (132 | 9.1%), and self-employed (not incorporated) (85 | 5.9%) make up the most common classes of employment.
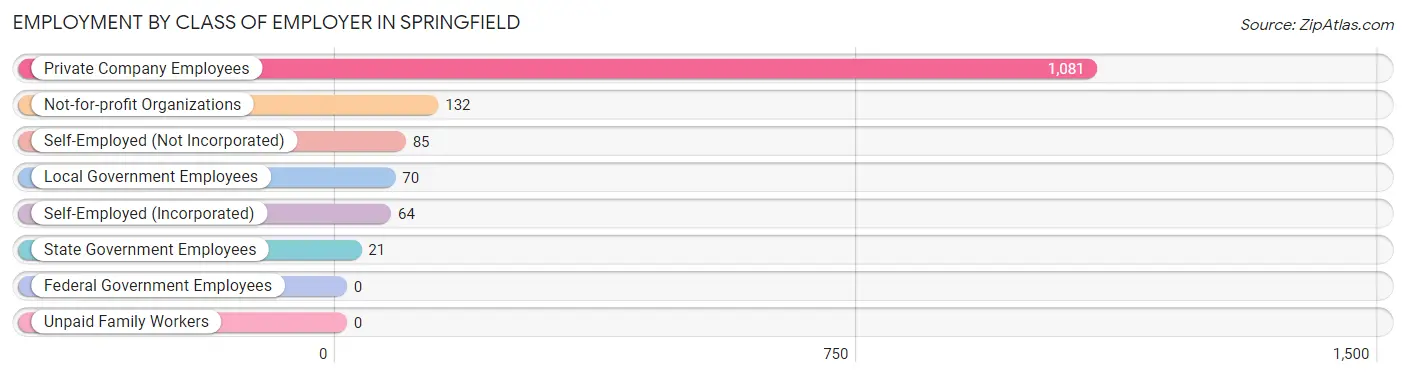
| Employer Class | # Employees | % Employees |
| Private Company Employees | 1,081 | 74.4% |
| Self-Employed (Incorporated) | 64 | 4.4% |
| Self-Employed (Not Incorporated) | 85 | 5.9% |
| Not-for-profit Organizations | 132 | 9.1% |
| Local Government Employees | 70 | 4.8% |
| State Government Employees | 21 | 1.5% |
| Federal Government Employees | 0 | 0.0% |
| Unpaid Family Workers | 0 | 0.0% |
| Total | 1,453 | 100.0% |
Employment Status by Age in Springfield
According to the labor force statistics for Springfield, out of the total population over 16 years of age (2,285), 64.8% or 1,481 individuals are in the labor force, with 0.5% or 7 of them unemployed. The age group with the highest labor force participation rate is 55 to 59 years, with 94.7% or 252 individuals in the labor force. Within the labor force, the 45 to 54 years age range has the highest percentage of unemployed individuals, with 4.3% or 8 of them being unemployed.
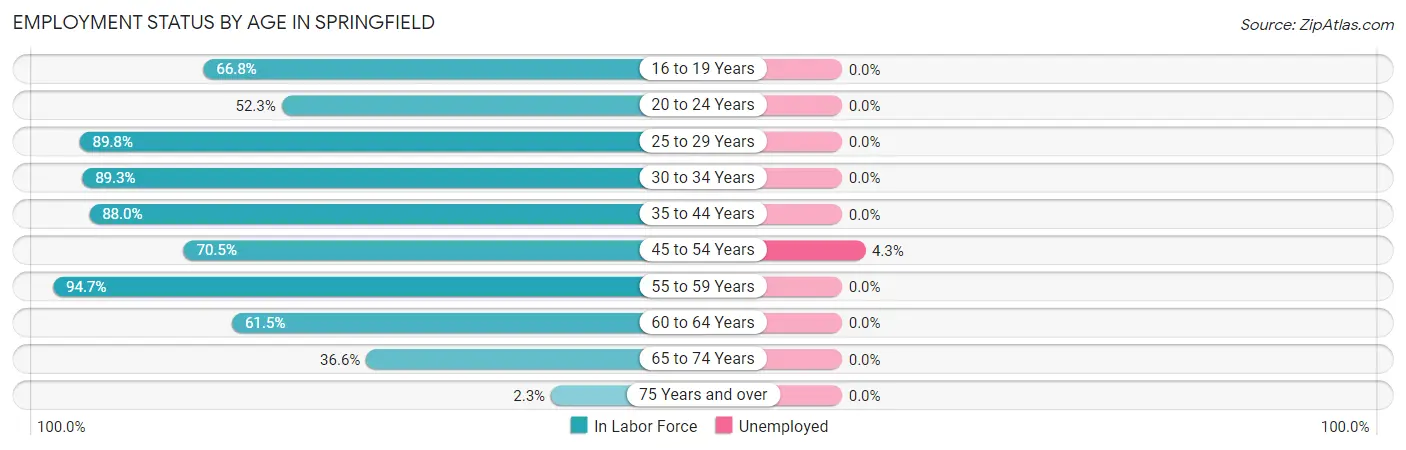
| Age Bracket | In Labor Force | Unemployed |
| 16 to 19 Years | 123 (66.8%) | 0 (0.0%) |
| 20 to 24 Years | 68 (52.3%) | 0 (0.0%) |
| 25 to 29 Years | 239 (89.8%) | 0 (0.0%) |
| 30 to 34 Years | 226 (89.3%) | 0 (0.0%) |
| 35 to 44 Years | 176 (88.0%) | 0 (0.0%) |
| 45 to 54 Years | 186 (70.5%) | 8 (4.3%) |
| 55 to 59 Years | 252 (94.7%) | 0 (0.0%) |
| 60 to 64 Years | 88 (61.5%) | 0 (0.0%) |
| 65 to 74 Years | 117 (36.6%) | 0 (0.0%) |
| 75 Years and over | 6 (2.3%) | 0 (0.0%) |
| Total | 1,481 (64.8%) | 7 (0.5%) |
Employment Status by Educational Attainment in Springfield
According to labor force statistics for Springfield, 83.8% of individuals (1,166) out of the total population between 25 and 64 years of age (1,392) are in the labor force, with 0.7% or 8 of them being unemployed. The group with the highest labor force participation rate are those with the educational attainment of bachelor's degree or higher, with 96.3% or 312 individuals in the labor force. Within the labor force, individuals with college / associate degree education have the highest percentage of unemployment, with 2.4% or 8 of them being unemployed.
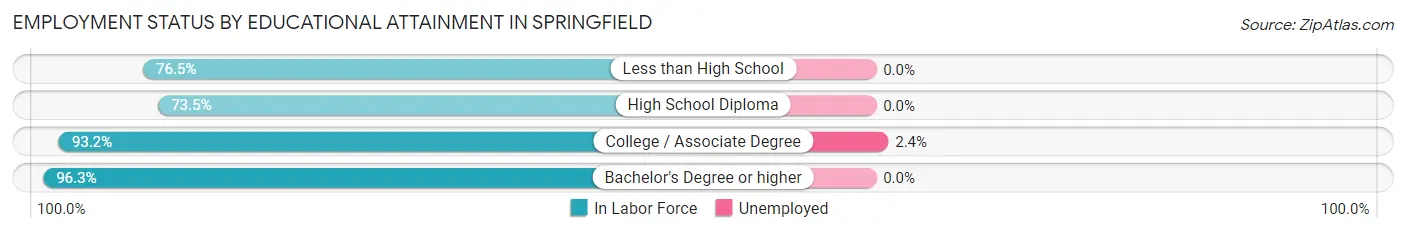
| Educational Attainment | In Labor Force | Unemployed |
| Less than High School | 26 (76.5%) | 0 (0.0%) |
| High School Diploma | 502 (73.5%) | 0 (0.0%) |
| College / Associate Degree | 327 (93.2%) | 8 (2.4%) |
| Bachelor's Degree or higher | 312 (96.3%) | 0 (0.0%) |
| Total | 1,166 (83.8%) | 10 (0.7%) |
Employment Occupations by Sex in Springfield
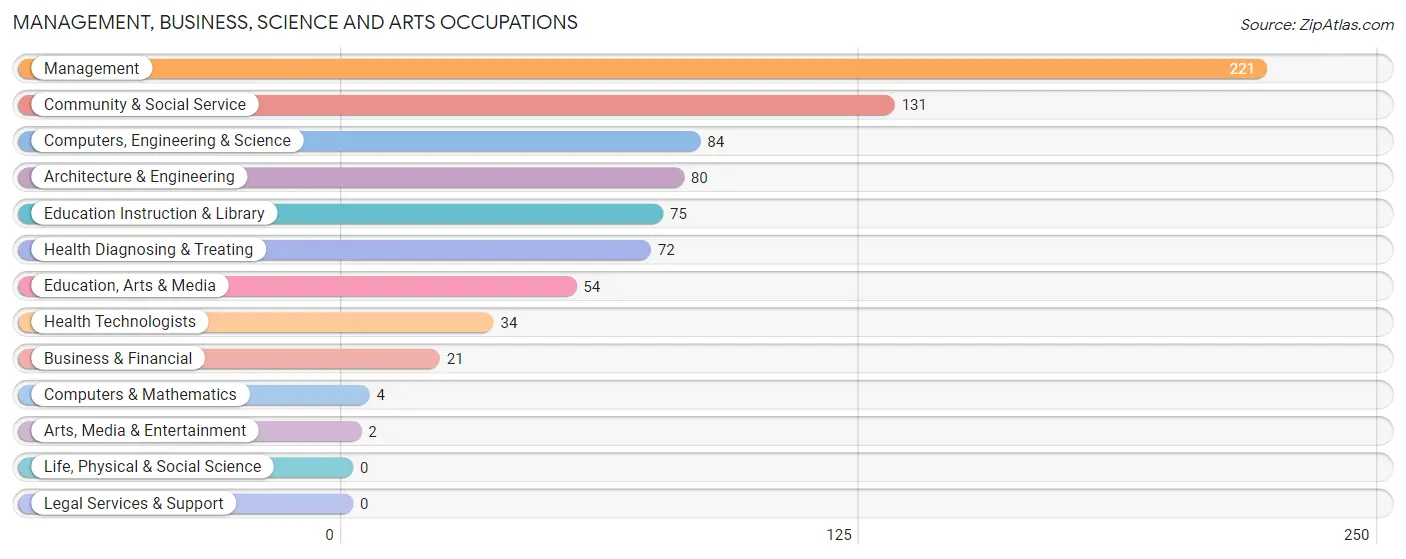
Management, Business, Science and Arts Occupations
The most common Management, Business, Science and Arts occupations in Springfield are Management (221 | 15.0%), Community & Social Service (131 | 8.9%), Computers, Engineering & Science (84 | 5.7%), Architecture & Engineering (80 | 5.4%), and Education Instruction & Library (75 | 5.1%).
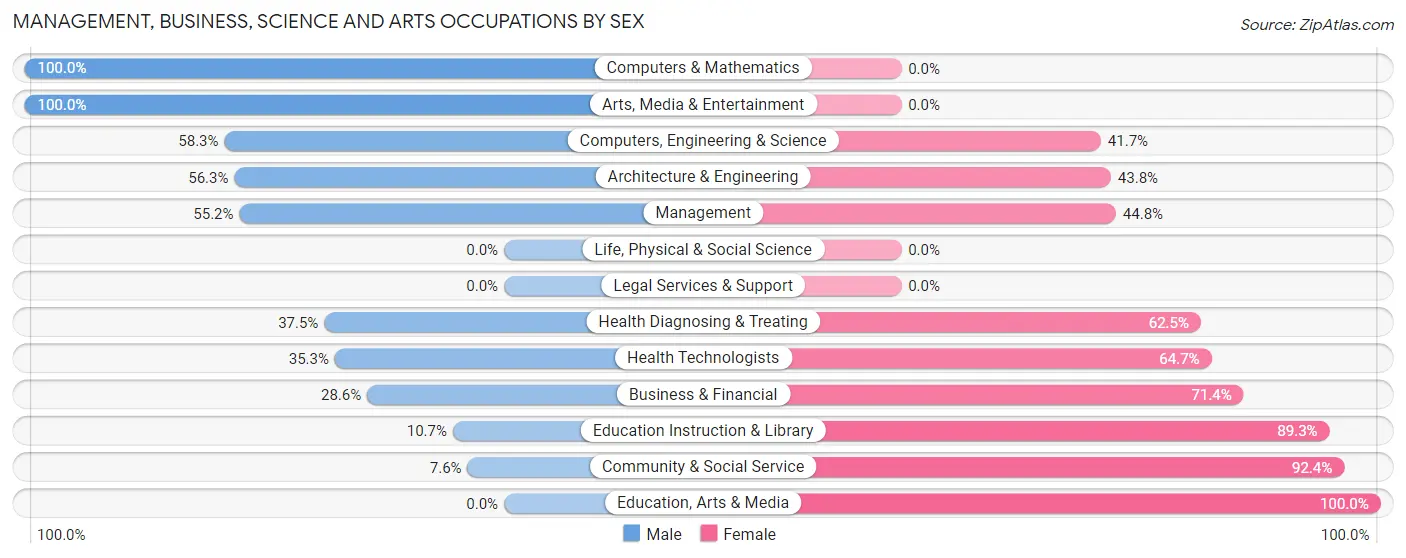
Management, Business, Science and Arts Occupations by Sex
Within the Management, Business, Science and Arts occupations in Springfield, the most male-oriented occupations are Computers & Mathematics (100.0%), Arts, Media & Entertainment (100.0%), and Computers, Engineering & Science (58.3%), while the most female-oriented occupations are Education, Arts & Media (100.0%), Community & Social Service (92.4%), and Education Instruction & Library (89.3%).
| Occupation | Male | Female |
| Management | 122 (55.2%) | 99 (44.8%) |
| Business & Financial | 6 (28.6%) | 15 (71.4%) |
| Computers, Engineering & Science | 49 (58.3%) | 35 (41.7%) |
| Computers & Mathematics | 4 (100.0%) | 0 (0.0%) |
| Architecture & Engineering | 45 (56.2%) | 35 (43.8%) |
| Life, Physical & Social Science | 0 (0.0%) | 0 (0.0%) |
| Community & Social Service | 10 (7.6%) | 121 (92.4%) |
| Education, Arts & Media | 0 (0.0%) | 54 (100.0%) |
| Legal Services & Support | 0 (0.0%) | 0 (0.0%) |
| Education Instruction & Library | 8 (10.7%) | 67 (89.3%) |
| Arts, Media & Entertainment | 2 (100.0%) | 0 (0.0%) |
| Health Diagnosing & Treating | 27 (37.5%) | 45 (62.5%) |
| Health Technologists | 12 (35.3%) | 22 (64.7%) |
| Total (Category) | 214 (40.5%) | 315 (59.6%) |
| Total (Overall) | 808 (54.8%) | 665 (45.2%) |
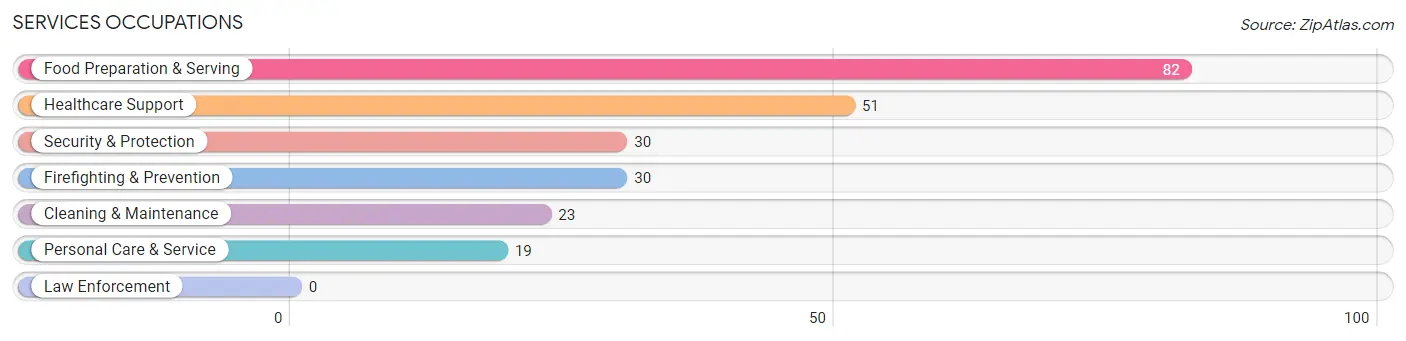
Services Occupations
The most common Services occupations in Springfield are Food Preparation & Serving (82 | 5.6%), Healthcare Support (51 | 3.5%), Security & Protection (30 | 2.0%), Firefighting & Prevention (30 | 2.0%), and Cleaning & Maintenance (23 | 1.6%).
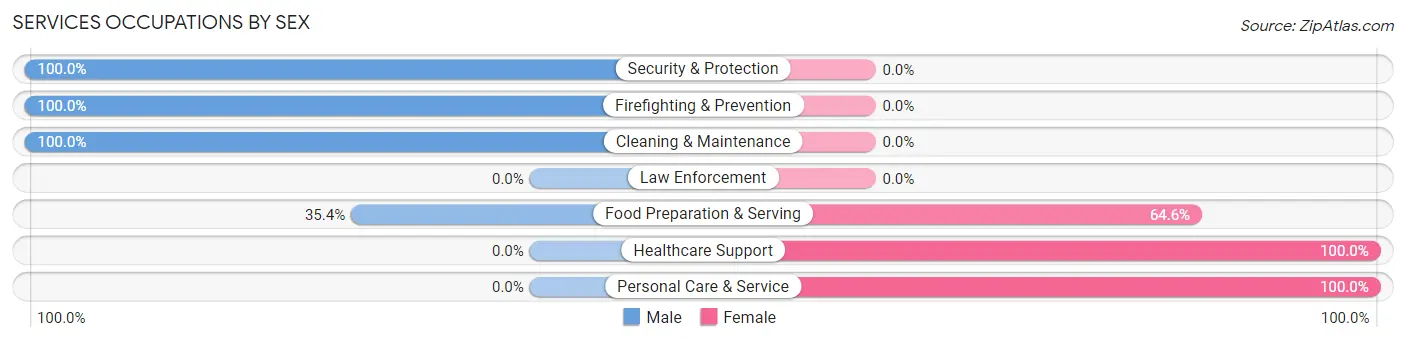
Services Occupations by Sex
Within the Services occupations in Springfield, the most male-oriented occupations are Security & Protection (100.0%), Firefighting & Prevention (100.0%), and Cleaning & Maintenance (100.0%), while the most female-oriented occupations are Healthcare Support (100.0%), Personal Care & Service (100.0%), and Food Preparation & Serving (64.6%).
| Occupation | Male | Female |
| Healthcare Support | 0 (0.0%) | 51 (100.0%) |
| Security & Protection | 30 (100.0%) | 0 (0.0%) |
| Firefighting & Prevention | 30 (100.0%) | 0 (0.0%) |
| Law Enforcement | 0 (0.0%) | 0 (0.0%) |
| Food Preparation & Serving | 29 (35.4%) | 53 (64.6%) |
| Cleaning & Maintenance | 23 (100.0%) | 0 (0.0%) |
| Personal Care & Service | 0 (0.0%) | 19 (100.0%) |
| Total (Category) | 82 (40.0%) | 123 (60.0%) |
| Total (Overall) | 808 (54.8%) | 665 (45.2%) |
Sales and Office Occupations
The most common Sales and Office occupations in Springfield are Sales & Related (138 | 9.4%), and Office & Administration (77 | 5.2%).
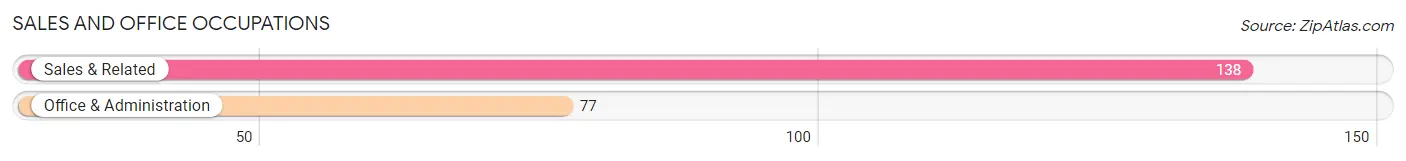
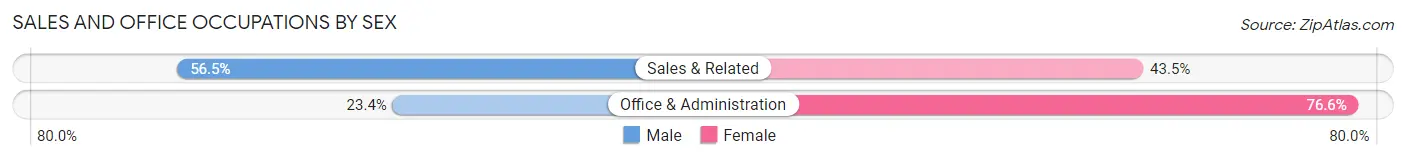
Sales and Office Occupations by Sex
| Occupation | Male | Female |
| Sales & Related | 78 (56.5%) | 60 (43.5%) |
| Office & Administration | 18 (23.4%) | 59 (76.6%) |
| Total (Category) | 96 (44.7%) | 119 (55.3%) |
| Total (Overall) | 808 (54.8%) | 665 (45.2%) |
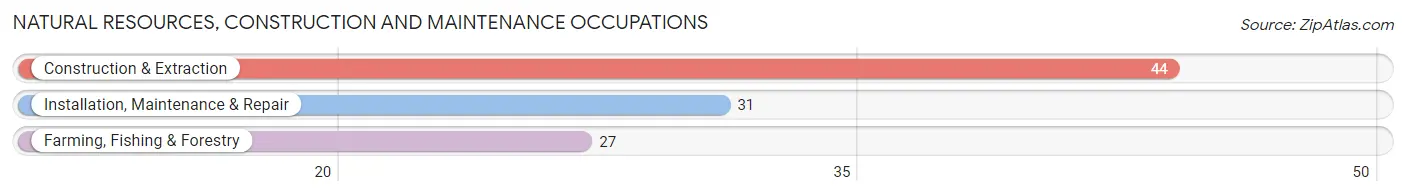
Natural Resources, Construction and Maintenance Occupations
The most common Natural Resources, Construction and Maintenance occupations in Springfield are Construction & Extraction (44 | 3.0%), Installation, Maintenance & Repair (31 | 2.1%), and Farming, Fishing & Forestry (27 | 1.8%).
Natural Resources, Construction and Maintenance Occupations by Sex
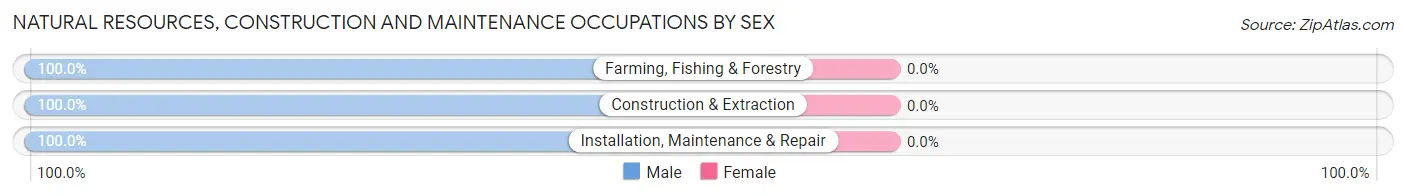
| Occupation | Male | Female |
| Farming, Fishing & Forestry | 27 (100.0%) | 0 (0.0%) |
| Construction & Extraction | 44 (100.0%) | 0 (0.0%) |
| Installation, Maintenance & Repair | 31 (100.0%) | 0 (0.0%) |
| Total (Category) | 102 (100.0%) | 0 (0.0%) |
| Total (Overall) | 808 (54.8%) | 665 (45.2%) |
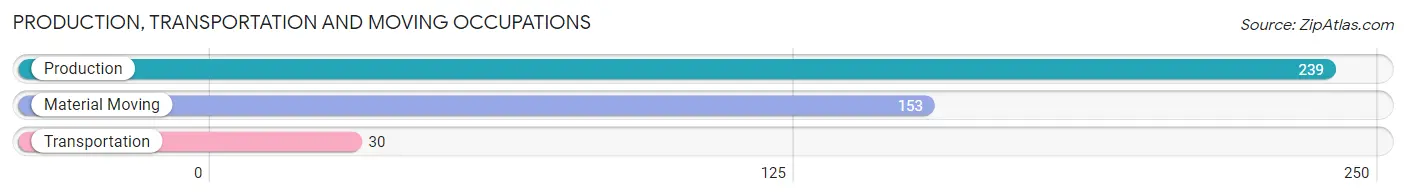
Production, Transportation and Moving Occupations
The most common Production, Transportation and Moving occupations in Springfield are Production (239 | 16.2%), Material Moving (153 | 10.4%), and Transportation (30 | 2.0%).
Production, Transportation and Moving Occupations by Sex
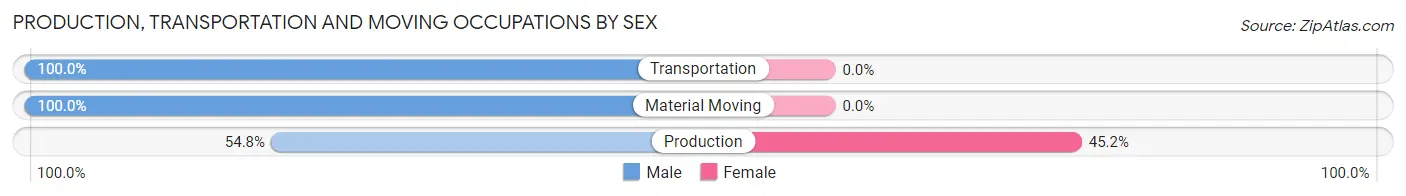
| Occupation | Male | Female |
| Production | 131 (54.8%) | 108 (45.2%) |
| Transportation | 30 (100.0%) | 0 (0.0%) |
| Material Moving | 153 (100.0%) | 0 (0.0%) |
| Total (Category) | 314 (74.4%) | 108 (25.6%) |
| Total (Overall) | 808 (54.8%) | 665 (45.2%) |
Employment Industries by Sex in Springfield
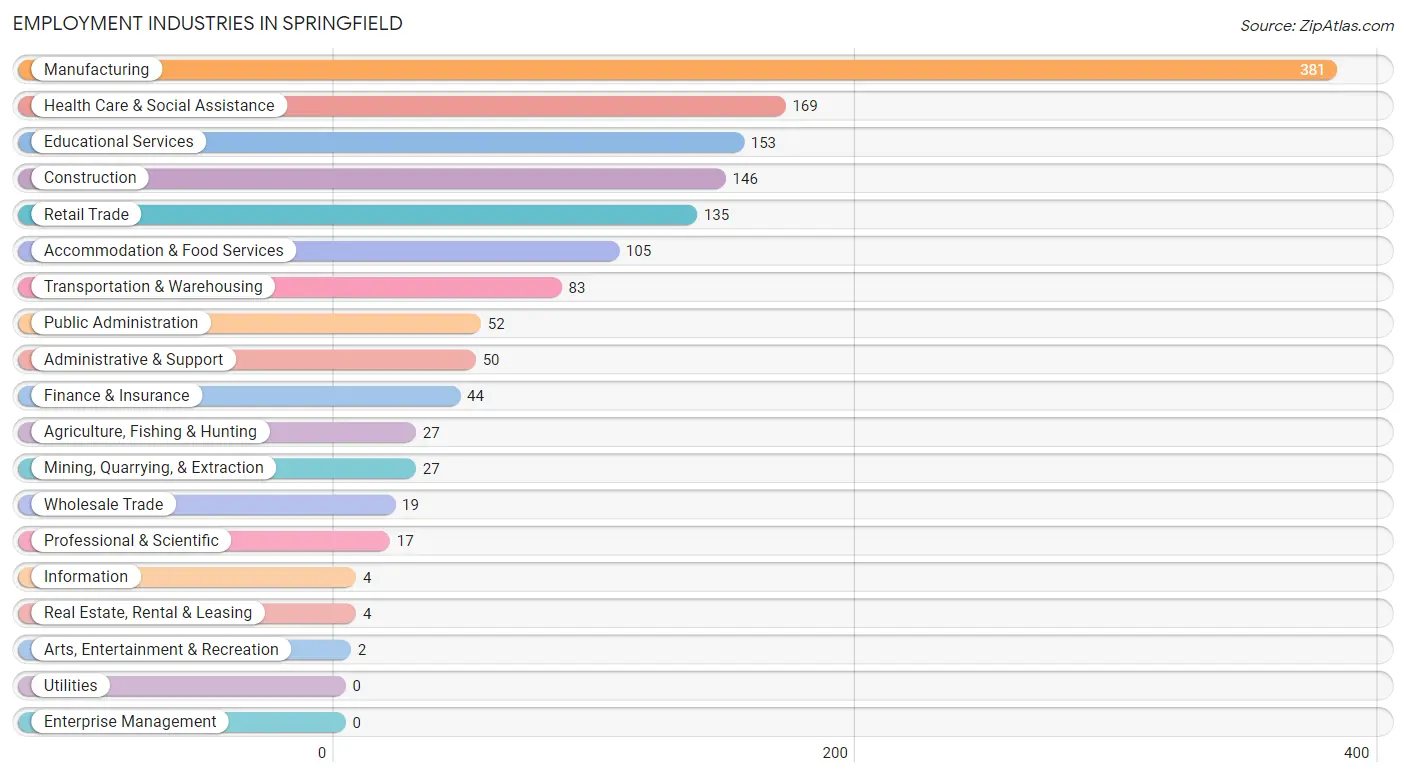
Employment Industries in Springfield
The major employment industries in Springfield include Manufacturing (381 | 25.9%), Health Care & Social Assistance (169 | 11.5%), Educational Services (153 | 10.4%), Construction (146 | 9.9%), and Retail Trade (135 | 9.2%).
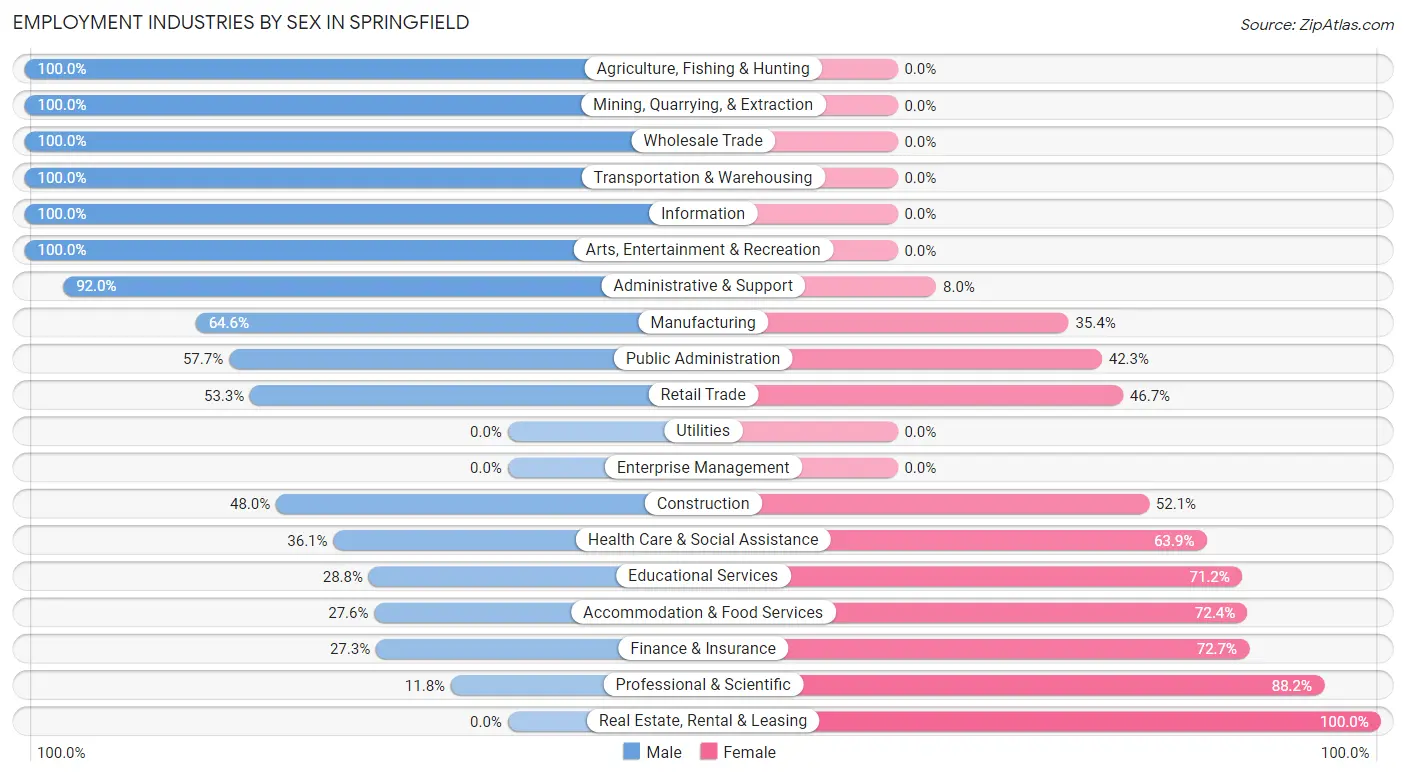
Employment Industries by Sex in Springfield
The Springfield industries that see more men than women are Agriculture, Fishing & Hunting (100.0%), Mining, Quarrying, & Extraction (100.0%), and Wholesale Trade (100.0%), whereas the industries that tend to have a higher number of women are Real Estate, Rental & Leasing (100.0%), Professional & Scientific (88.2%), and Finance & Insurance (72.7%).
| Industry | Male | Female |
| Agriculture, Fishing & Hunting | 27 (100.0%) | 0 (0.0%) |
| Mining, Quarrying, & Extraction | 27 (100.0%) | 0 (0.0%) |
| Construction | 70 (47.9%) | 76 (52.0%) |
| Manufacturing | 246 (64.6%) | 135 (35.4%) |
| Wholesale Trade | 19 (100.0%) | 0 (0.0%) |
| Retail Trade | 72 (53.3%) | 63 (46.7%) |
| Transportation & Warehousing | 83 (100.0%) | 0 (0.0%) |
| Utilities | 0 (0.0%) | 0 (0.0%) |
| Information | 4 (100.0%) | 0 (0.0%) |
| Finance & Insurance | 12 (27.3%) | 32 (72.7%) |
| Real Estate, Rental & Leasing | 0 (0.0%) | 4 (100.0%) |
| Professional & Scientific | 2 (11.8%) | 15 (88.2%) |
| Enterprise Management | 0 (0.0%) | 0 (0.0%) |
| Administrative & Support | 46 (92.0%) | 4 (8.0%) |
| Educational Services | 44 (28.8%) | 109 (71.2%) |
| Health Care & Social Assistance | 61 (36.1%) | 108 (63.9%) |
| Arts, Entertainment & Recreation | 2 (100.0%) | 0 (0.0%) |
| Accommodation & Food Services | 29 (27.6%) | 76 (72.4%) |
| Public Administration | 30 (57.7%) | 22 (42.3%) |
| Total | 808 (54.8%) | 665 (45.2%) |
Education in Springfield
School Enrollment in Springfield
The most common levels of schooling among the 666 students in Springfield are middle school (187 | 28.1%), college / undergraduate (178 | 26.7%), and elementary school (122 | 18.3%).
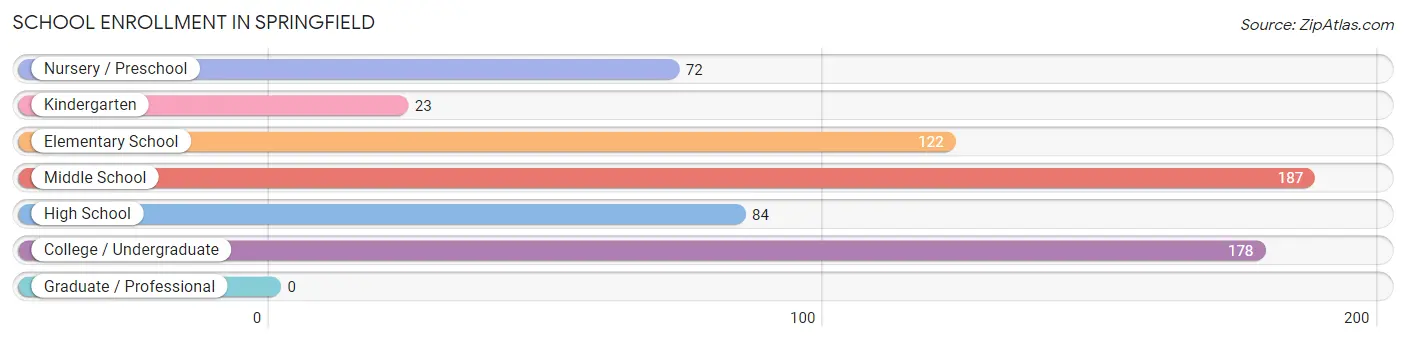
| School Level | # Students | % Students |
| Nursery / Preschool | 72 | 10.8% |
| Kindergarten | 23 | 3.5% |
| Elementary School | 122 | 18.3% |
| Middle School | 187 | 28.1% |
| High School | 84 | 12.6% |
| College / Undergraduate | 178 | 26.7% |
| Graduate / Professional | 0 | 0.0% |
| Total | 666 | 100.0% |
School Enrollment by Age by Funding Source in Springfield
Out of a total of 666 students who are enrolled in schools in Springfield, 107 (16.1%) attend a private institution, while the remaining 559 (83.9%) are enrolled in public schools. The age group of 18 to 19 year olds has the highest likelihood of being enrolled in private schools, with 51 (50.5% in the age bracket) enrolled. Conversely, the age group of 35 years and over has the lowest likelihood of being enrolled in a private school, with 14 (100.0% in the age bracket) attending a public institution.
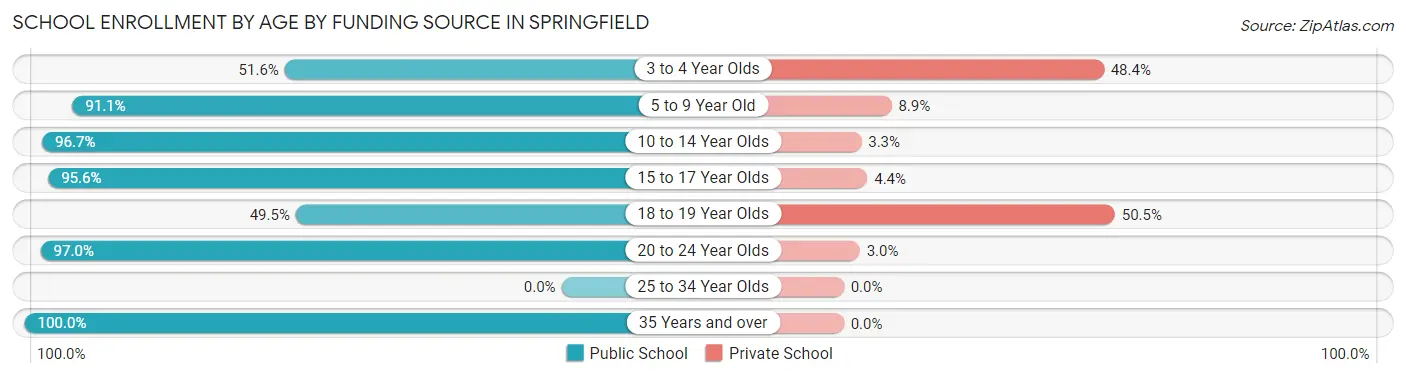
| Age Bracket | Public School | Private School |
| 3 to 4 Year Olds | 33 (51.6%) | 31 (48.4%) |
| 5 to 9 Year Old | 133 (91.1%) | 13 (8.9%) |
| 10 to 14 Year Olds | 177 (96.7%) | 6 (3.3%) |
| 15 to 17 Year Olds | 87 (95.6%) | 4 (4.4%) |
| 18 to 19 Year Olds | 50 (49.5%) | 51 (50.5%) |
| 20 to 24 Year Olds | 65 (97.0%) | 2 (3.0%) |
| 25 to 34 Year Olds | 0 (0.0%) | 0 (0.0%) |
| 35 Years and over | 14 (100.0%) | 0 (0.0%) |
| Total | 559 (83.9%) | 107 (16.1%) |
Educational Attainment by Field of Study in Springfield
Education (120 | 25.3%), science & technology (111 | 23.4%), business (67 | 14.1%), arts & humanities (63 | 13.3%), and visual & performing arts (38 | 8.0%) are the most common fields of study among 474 individuals in Springfield who have obtained a bachelor's degree or higher.
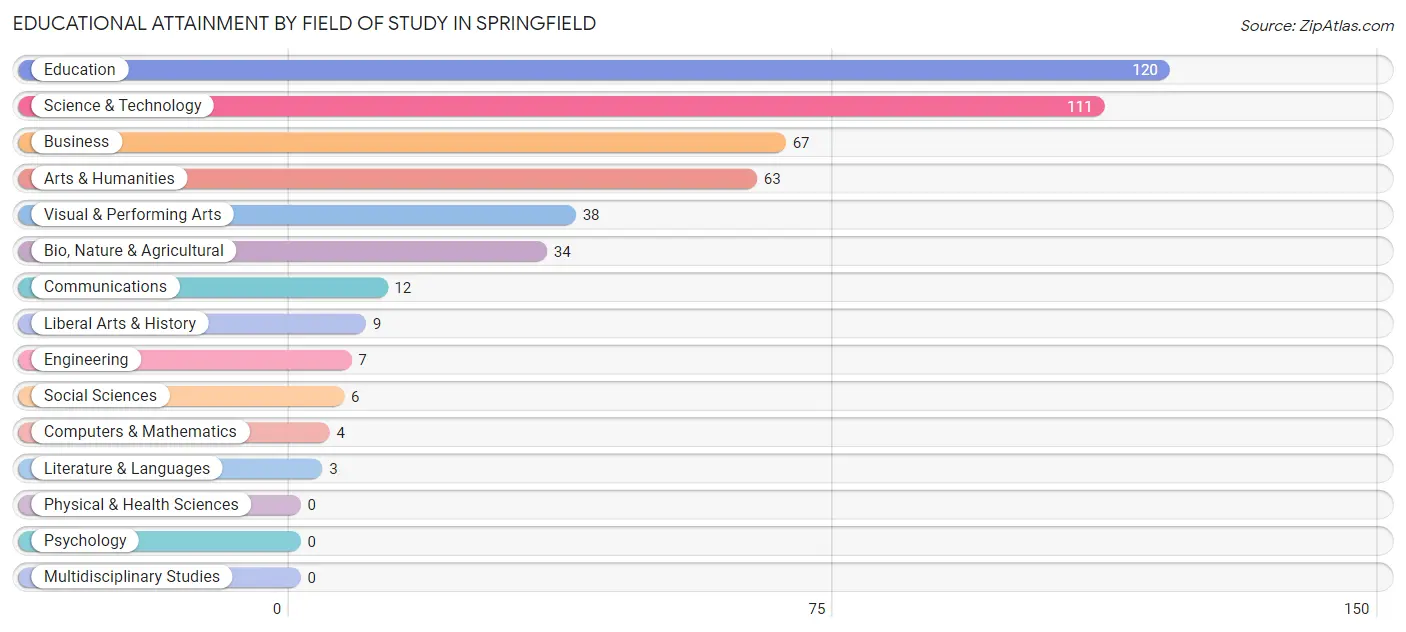
| Field of Study | # Graduates | % Graduates |
| Computers & Mathematics | 4 | 0.8% |
| Bio, Nature & Agricultural | 34 | 7.2% |
| Physical & Health Sciences | 0 | 0.0% |
| Psychology | 0 | 0.0% |
| Social Sciences | 6 | 1.3% |
| Engineering | 7 | 1.5% |
| Multidisciplinary Studies | 0 | 0.0% |
| Science & Technology | 111 | 23.4% |
| Business | 67 | 14.1% |
| Education | 120 | 25.3% |
| Literature & Languages | 3 | 0.6% |
| Liberal Arts & History | 9 | 1.9% |
| Visual & Performing Arts | 38 | 8.0% |
| Communications | 12 | 2.5% |
| Arts & Humanities | 63 | 13.3% |
| Total | 474 | 100.0% |
Transportation & Commute in Springfield
Vehicle Availability by Sex in Springfield
The most prevalent vehicle ownership categories in Springfield are males with 2 vehicles (265, accounting for 35.1%) and females with 2 vehicles (259, making up 42.3%).
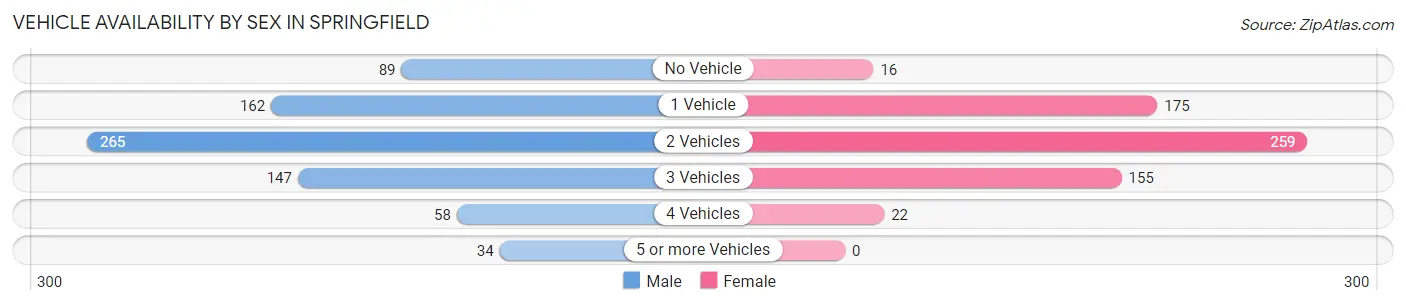
| Vehicles Available | Male | Female |
| No Vehicle | 89 (11.8%) | 16 (2.5%) |
| 1 Vehicle | 162 (21.5%) | 175 (27.9%) |
| 2 Vehicles | 265 (35.1%) | 259 (41.3%) |
| 3 Vehicles | 147 (19.5%) | 155 (24.7%) |
| 4 Vehicles | 58 (7.7%) | 22 (3.5%) |
| 5 or more Vehicles | 34 (4.5%) | 0 (0.0%) |
| Total | 755 (100.0%) | 627 (100.0%) |
Commute Time in Springfield
The most frequently occuring commute durations in Springfield are 5 to 9 minutes (417 commuters, 30.3%), 10 to 14 minutes (260 commuters, 18.9%), and less than 5 minutes (228 commuters, 16.6%).
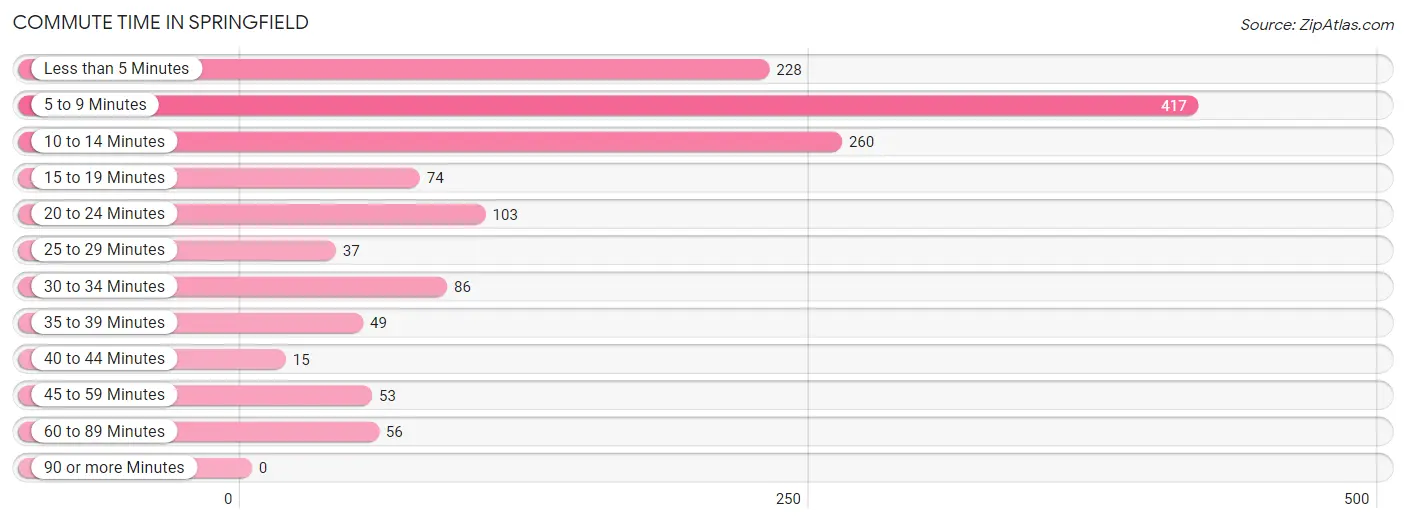
| Commute Time | # Commuters | % Commuters |
| Less than 5 Minutes | 228 | 16.6% |
| 5 to 9 Minutes | 417 | 30.3% |
| 10 to 14 Minutes | 260 | 18.9% |
| 15 to 19 Minutes | 74 | 5.4% |
| 20 to 24 Minutes | 103 | 7.5% |
| 25 to 29 Minutes | 37 | 2.7% |
| 30 to 34 Minutes | 86 | 6.2% |
| 35 to 39 Minutes | 49 | 3.6% |
| 40 to 44 Minutes | 15 | 1.1% |
| 45 to 59 Minutes | 53 | 3.8% |
| 60 to 89 Minutes | 56 | 4.1% |
| 90 or more Minutes | 0 | 0.0% |
Commute Time by Sex in Springfield
The most common commute times in Springfield are 5 to 9 minutes (230 commuters, 29.0%) for males and 5 to 9 minutes (187 commuters, 32.0%) for females.
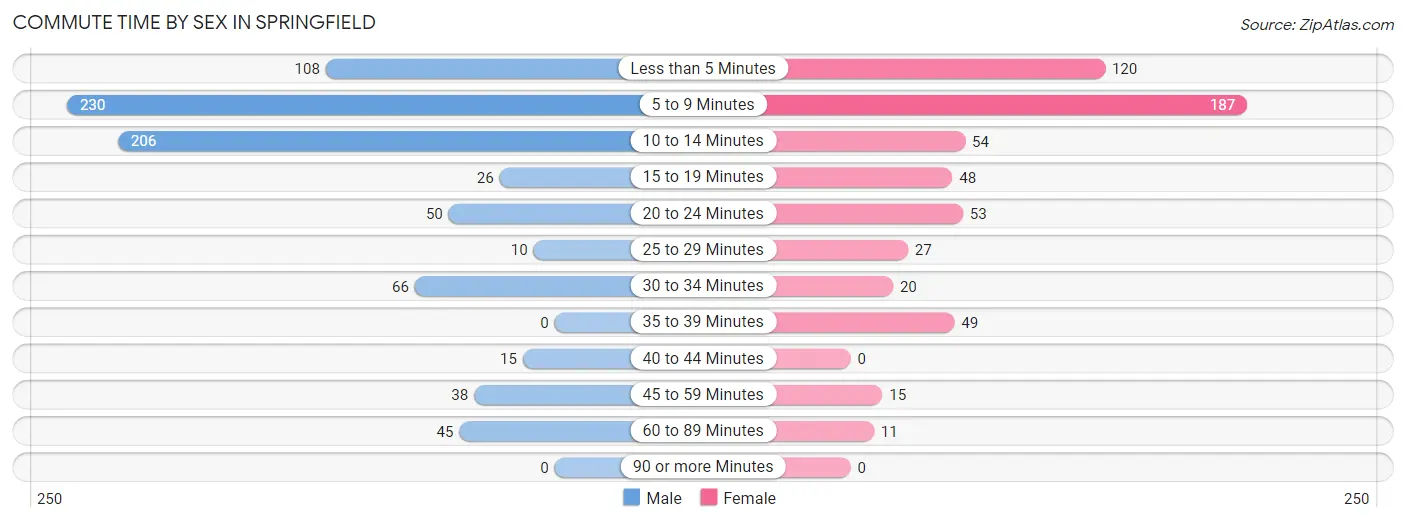
| Commute Time | Male | Female |
| Less than 5 Minutes | 108 (13.6%) | 120 (20.5%) |
| 5 to 9 Minutes | 230 (29.0%) | 187 (32.0%) |
| 10 to 14 Minutes | 206 (25.9%) | 54 (9.2%) |
| 15 to 19 Minutes | 26 (3.3%) | 48 (8.2%) |
| 20 to 24 Minutes | 50 (6.3%) | 53 (9.1%) |
| 25 to 29 Minutes | 10 (1.3%) | 27 (4.6%) |
| 30 to 34 Minutes | 66 (8.3%) | 20 (3.4%) |
| 35 to 39 Minutes | 0 (0.0%) | 49 (8.4%) |
| 40 to 44 Minutes | 15 (1.9%) | 0 (0.0%) |
| 45 to 59 Minutes | 38 (4.8%) | 15 (2.6%) |
| 60 to 89 Minutes | 45 (5.7%) | 11 (1.9%) |
| 90 or more Minutes | 0 (0.0%) | 0 (0.0%) |
Time of Departure to Work by Sex in Springfield
The most frequent times of departure to work in Springfield are 7:00 AM to 7:29 AM (256, 32.2%) for males and 8:00 AM to 8:29 AM (120, 20.5%) for females.
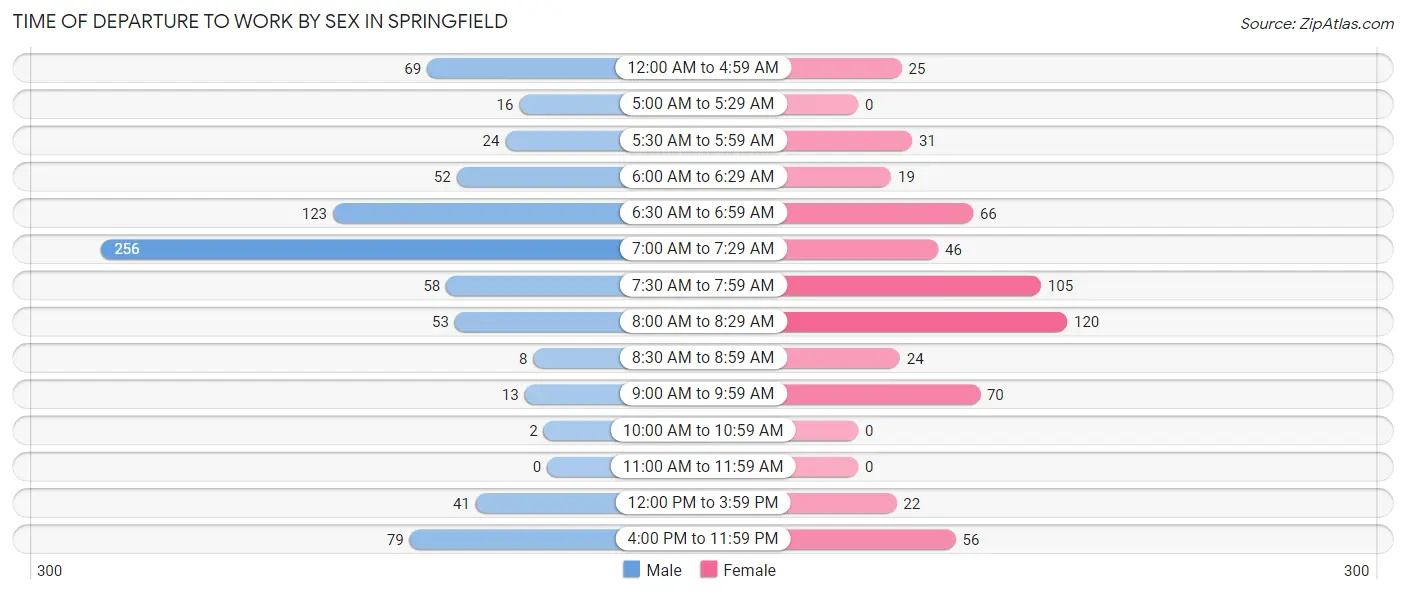
| Time of Departure | Male | Female |
| 12:00 AM to 4:59 AM | 69 (8.7%) | 25 (4.3%) |
| 5:00 AM to 5:29 AM | 16 (2.0%) | 0 (0.0%) |
| 5:30 AM to 5:59 AM | 24 (3.0%) | 31 (5.3%) |
| 6:00 AM to 6:29 AM | 52 (6.6%) | 19 (3.3%) |
| 6:30 AM to 6:59 AM | 123 (15.5%) | 66 (11.3%) |
| 7:00 AM to 7:29 AM | 256 (32.2%) | 46 (7.9%) |
| 7:30 AM to 7:59 AM | 58 (7.3%) | 105 (18.0%) |
| 8:00 AM to 8:29 AM | 53 (6.7%) | 120 (20.5%) |
| 8:30 AM to 8:59 AM | 8 (1.0%) | 24 (4.1%) |
| 9:00 AM to 9:59 AM | 13 (1.6%) | 70 (12.0%) |
| 10:00 AM to 10:59 AM | 2 (0.3%) | 0 (0.0%) |
| 11:00 AM to 11:59 AM | 0 (0.0%) | 0 (0.0%) |
| 12:00 PM to 3:59 PM | 41 (5.2%) | 22 (3.8%) |
| 4:00 PM to 11:59 PM | 79 (10.0%) | 56 (9.6%) |
| Total | 794 (100.0%) | 584 (100.0%) |
Housing Occupancy in Springfield
Occupancy by Ownership in Springfield
Of the total 1,266 dwellings in Springfield, owner-occupied units account for 748 (59.1%), while renter-occupied units make up 518 (40.9%).
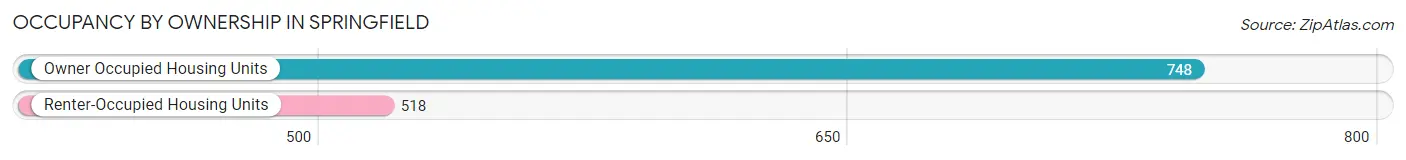
| Occupancy | # Housing Units | % Housing Units |
| Owner Occupied Housing Units | 748 | 59.1% |
| Renter-Occupied Housing Units | 518 | 40.9% |
| Total Occupied Housing Units | 1,266 | 100.0% |
Occupancy by Household Size in Springfield
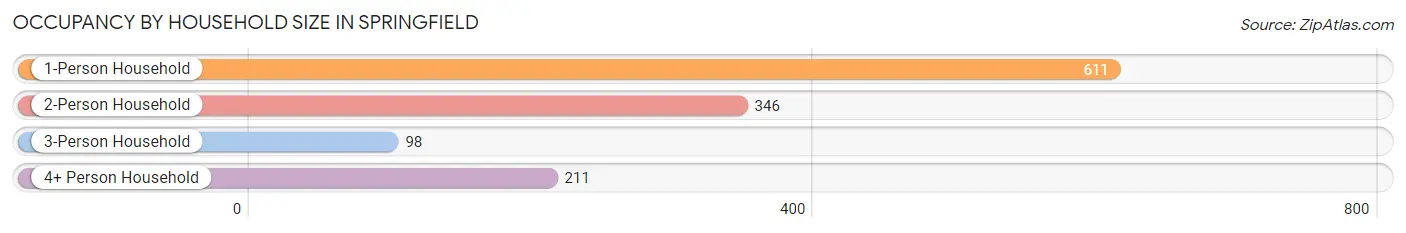
| Household Size | # Housing Units | % Housing Units |
| 1-Person Household | 611 | 48.3% |
| 2-Person Household | 346 | 27.3% |
| 3-Person Household | 98 | 7.7% |
| 4+ Person Household | 211 | 16.7% |
| Total Housing Units | 1,266 | 100.0% |
Occupancy by Ownership by Household Size in Springfield
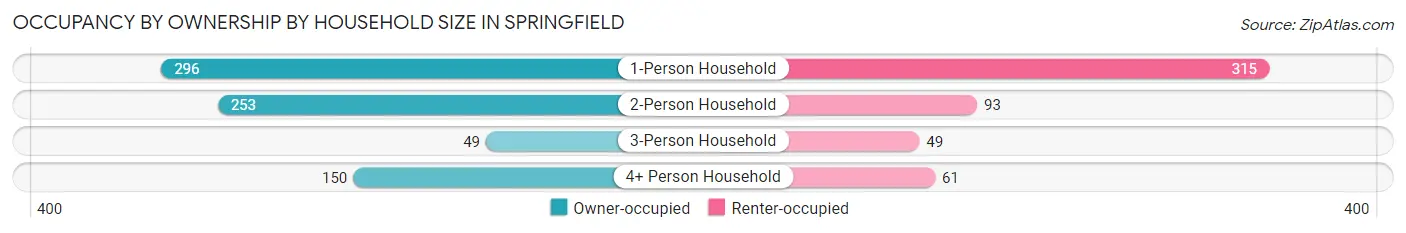
| Household Size | Owner-occupied | Renter-occupied |
| 1-Person Household | 296 (48.4%) | 315 (51.5%) |
| 2-Person Household | 253 (73.1%) | 93 (26.9%) |
| 3-Person Household | 49 (50.0%) | 49 (50.0%) |
| 4+ Person Household | 150 (71.1%) | 61 (28.9%) |
| Total Housing Units | 748 (59.1%) | 518 (40.9%) |
Occupancy by Educational Attainment in Springfield
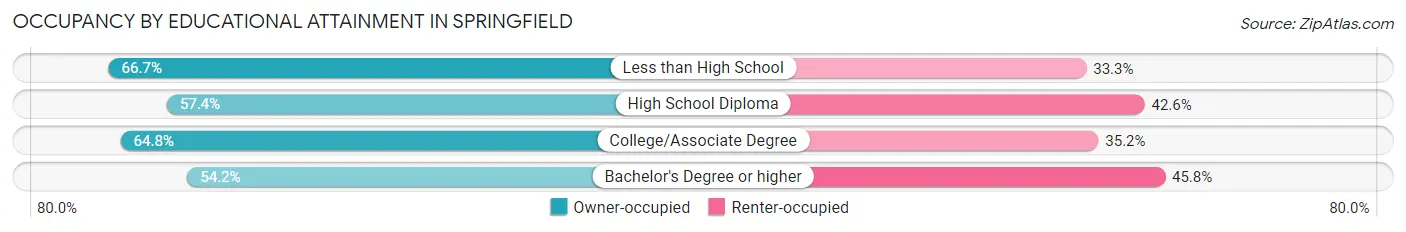
| Household Size | Owner-occupied | Renter-occupied |
| Less than High School | 48 (66.7%) | 24 (33.3%) |
| High School Diploma | 286 (57.4%) | 212 (42.6%) |
| College/Associate Degree | 226 (64.8%) | 123 (35.2%) |
| Bachelor's Degree or higher | 188 (54.2%) | 159 (45.8%) |
Occupancy by Age of Householder in Springfield
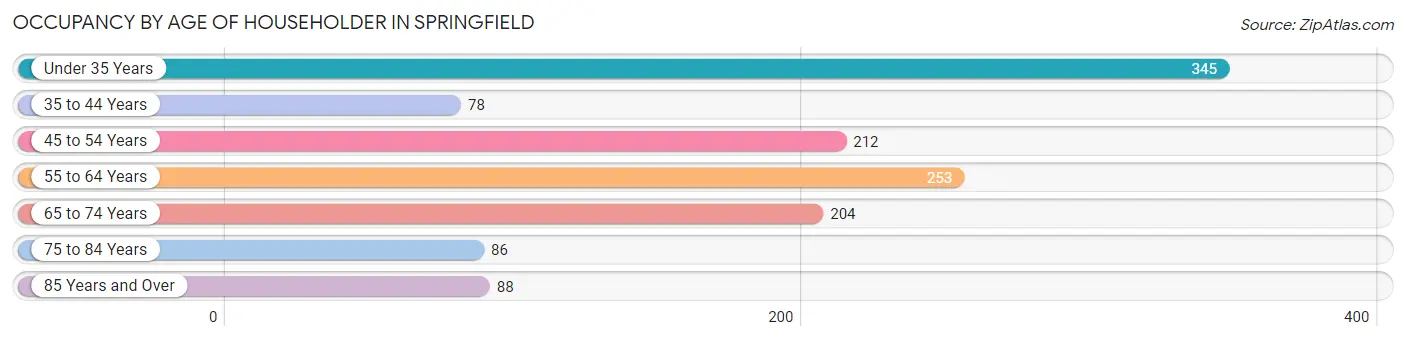
| Age Bracket | # Households | % Households |
| Under 35 Years | 345 | 27.3% |
| 35 to 44 Years | 78 | 6.2% |
| 45 to 54 Years | 212 | 16.8% |
| 55 to 64 Years | 253 | 20.0% |
| 65 to 74 Years | 204 | 16.1% |
| 75 to 84 Years | 86 | 6.8% |
| 85 Years and Over | 88 | 7.0% |
| Total | 1,266 | 100.0% |
Housing Finances in Springfield
Median Income by Occupancy in Springfield
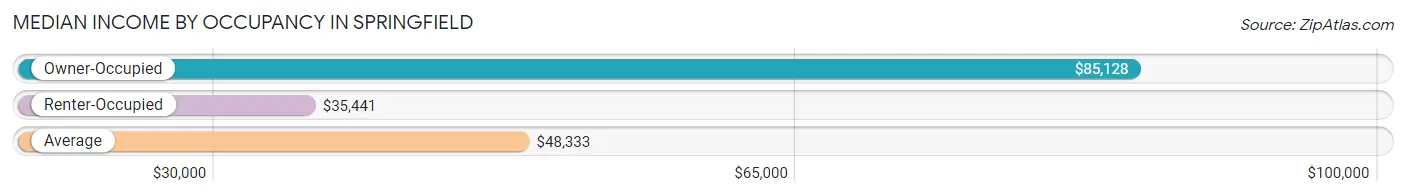
| Occupancy Type | # Households | Median Income |
| Owner-Occupied | 748 (59.1%) | $85,128 |
| Renter-Occupied | 518 (40.9%) | $35,441 |
| Average | 1,266 (100.0%) | $48,333 |
Occupancy by Householder Income Bracket in Springfield
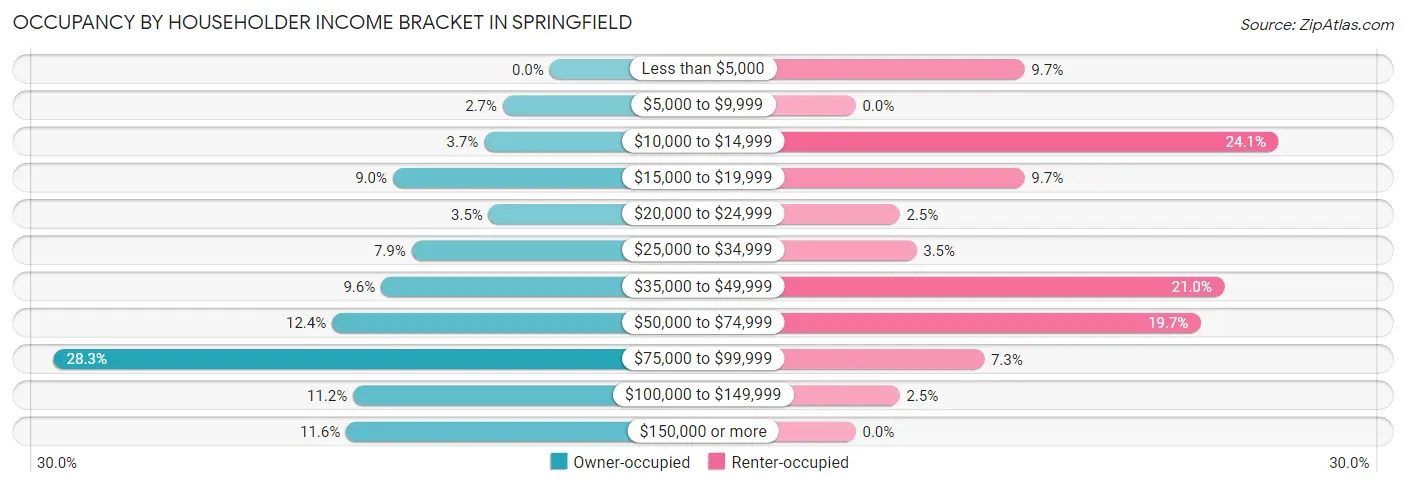
| Income Bracket | Owner-occupied | Renter-occupied |
| Less than $5,000 | 0 (0.0%) | 50 (9.7%) |
| $5,000 to $9,999 | 20 (2.7%) | 0 (0.0%) |
| $10,000 to $14,999 | 28 (3.7%) | 125 (24.1%) |
| $15,000 to $19,999 | 67 (9.0%) | 50 (9.7%) |
| $20,000 to $24,999 | 26 (3.5%) | 13 (2.5%) |
| $25,000 to $34,999 | 59 (7.9%) | 18 (3.5%) |
| $35,000 to $49,999 | 72 (9.6%) | 109 (21.0%) |
| $50,000 to $74,999 | 93 (12.4%) | 102 (19.7%) |
| $75,000 to $99,999 | 212 (28.3%) | 38 (7.3%) |
| $100,000 to $149,999 | 84 (11.2%) | 13 (2.5%) |
| $150,000 or more | 87 (11.6%) | 0 (0.0%) |
| Total | 748 (100.0%) | 518 (100.0%) |
Monthly Housing Cost Tiers in Springfield
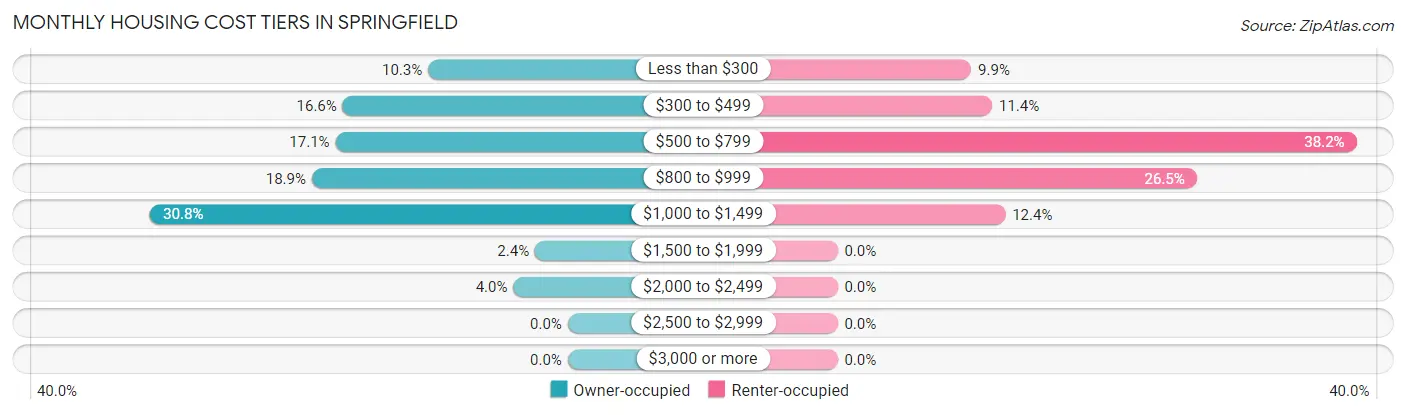
| Monthly Cost | Owner-occupied | Renter-occupied |
| Less than $300 | 77 (10.3%) | 51 (9.9%) |
| $300 to $499 | 124 (16.6%) | 59 (11.4%) |
| $500 to $799 | 128 (17.1%) | 198 (38.2%) |
| $800 to $999 | 141 (18.9%) | 137 (26.5%) |
| $1,000 to $1,499 | 230 (30.7%) | 64 (12.4%) |
| $1,500 to $1,999 | 18 (2.4%) | 0 (0.0%) |
| $2,000 to $2,499 | 30 (4.0%) | 0 (0.0%) |
| $2,500 to $2,999 | 0 (0.0%) | 0 (0.0%) |
| $3,000 or more | 0 (0.0%) | 0 (0.0%) |
| Total | 748 (100.0%) | 518 (100.0%) |
Physical Housing Characteristics in Springfield
Housing Structures in Springfield
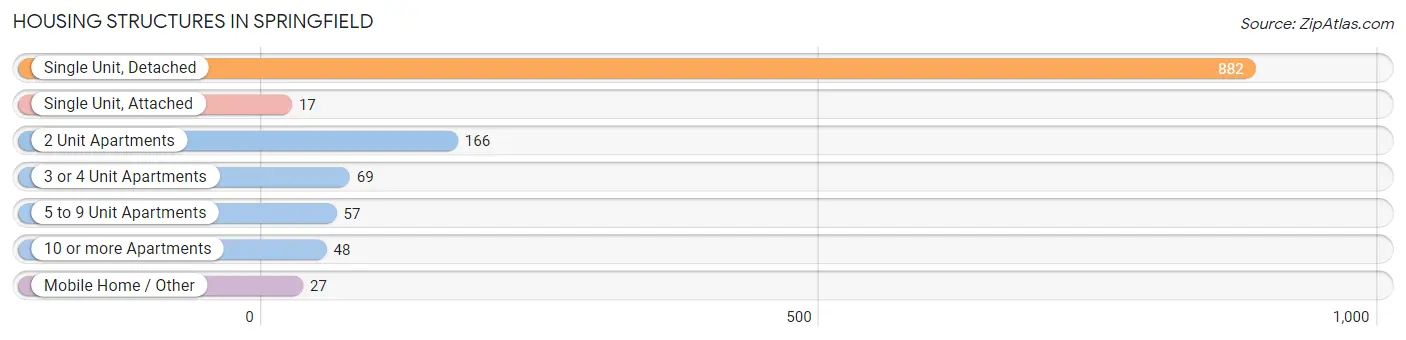
| Structure Type | # Housing Units | % Housing Units |
| Single Unit, Detached | 882 | 69.7% |
| Single Unit, Attached | 17 | 1.3% |
| 2 Unit Apartments | 166 | 13.1% |
| 3 or 4 Unit Apartments | 69 | 5.4% |
| 5 to 9 Unit Apartments | 57 | 4.5% |
| 10 or more Apartments | 48 | 3.8% |
| Mobile Home / Other | 27 | 2.1% |
| Total | 1,266 | 100.0% |
Housing Structures by Occupancy in Springfield
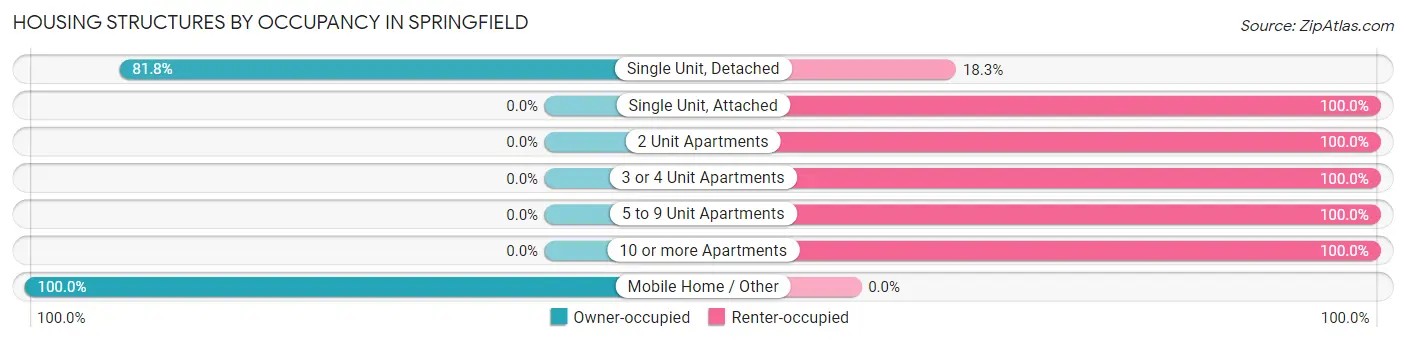
| Structure Type | Owner-occupied | Renter-occupied |
| Single Unit, Detached | 721 (81.8%) | 161 (18.2%) |
| Single Unit, Attached | 0 (0.0%) | 17 (100.0%) |
| 2 Unit Apartments | 0 (0.0%) | 166 (100.0%) |
| 3 or 4 Unit Apartments | 0 (0.0%) | 69 (100.0%) |
| 5 to 9 Unit Apartments | 0 (0.0%) | 57 (100.0%) |
| 10 or more Apartments | 0 (0.0%) | 48 (100.0%) |
| Mobile Home / Other | 27 (100.0%) | 0 (0.0%) |
| Total | 748 (59.1%) | 518 (40.9%) |
Housing Structures by Number of Rooms in Springfield
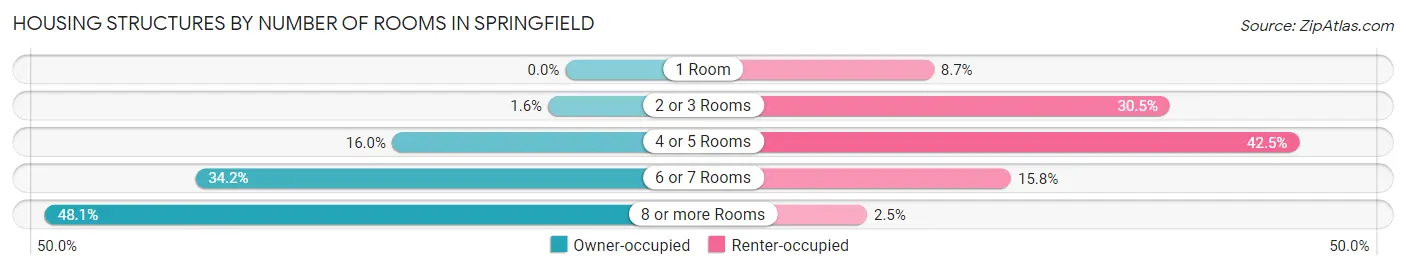
| Number of Rooms | Owner-occupied | Renter-occupied |
| 1 Room | 0 (0.0%) | 45 (8.7%) |
| 2 or 3 Rooms | 12 (1.6%) | 158 (30.5%) |
| 4 or 5 Rooms | 120 (16.0%) | 220 (42.5%) |
| 6 or 7 Rooms | 256 (34.2%) | 82 (15.8%) |
| 8 or more Rooms | 360 (48.1%) | 13 (2.5%) |
| Total | 748 (100.0%) | 518 (100.0%) |
Housing Structure by Heating Type in Springfield
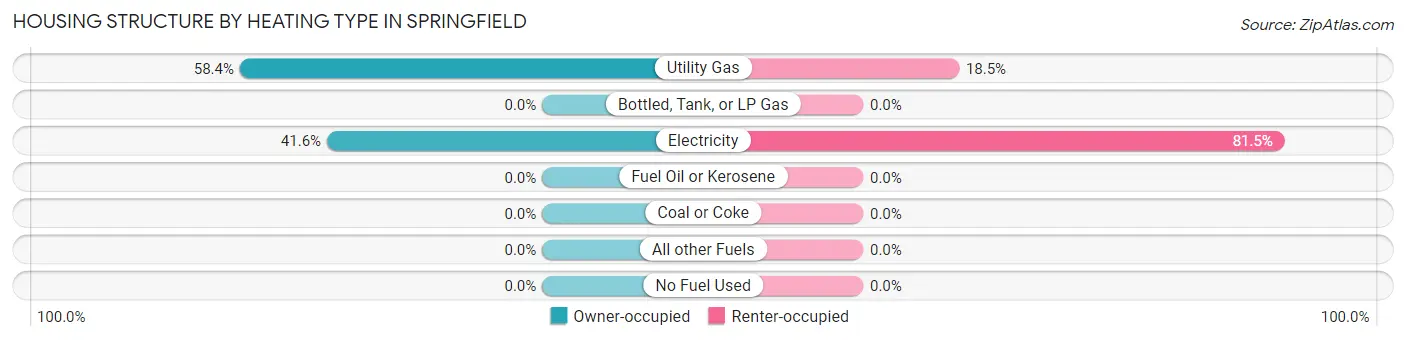
| Heating Type | Owner-occupied | Renter-occupied |
| Utility Gas | 437 (58.4%) | 96 (18.5%) |
| Bottled, Tank, or LP Gas | 0 (0.0%) | 0 (0.0%) |
| Electricity | 311 (41.6%) | 422 (81.5%) |
| Fuel Oil or Kerosene | 0 (0.0%) | 0 (0.0%) |
| Coal or Coke | 0 (0.0%) | 0 (0.0%) |
| All other Fuels | 0 (0.0%) | 0 (0.0%) |
| No Fuel Used | 0 (0.0%) | 0 (0.0%) |
| Total | 748 (100.0%) | 518 (100.0%) |
Household Vehicle Usage in Springfield
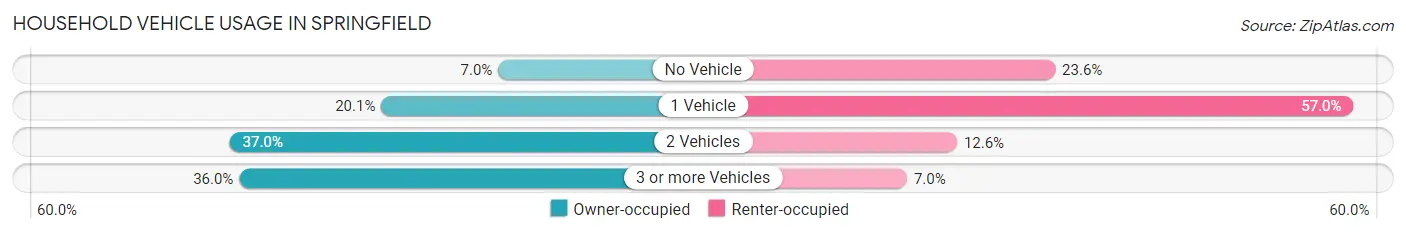
| Vehicles per Household | Owner-occupied | Renter-occupied |
| No Vehicle | 52 (7.0%) | 122 (23.5%) |
| 1 Vehicle | 150 (20.1%) | 295 (57.0%) |
| 2 Vehicles | 277 (37.0%) | 65 (12.6%) |
| 3 or more Vehicles | 269 (36.0%) | 36 (7.0%) |
| Total | 748 (100.0%) | 518 (100.0%) |
Real Estate & Mortgages in Springfield
Real Estate and Mortgage Overview in Springfield
| Characteristic | Without Mortgage | With Mortgage |
| Housing Units | 343 | 405 |
| Median Property Value | $160,300 | $156,500 |
| Median Household Income | $63,750 | $25 |
| Monthly Housing Costs | $402 | $0 |
| Real Estate Taxes | $1,225 | $0 |
Property Value by Mortgage Status in Springfield
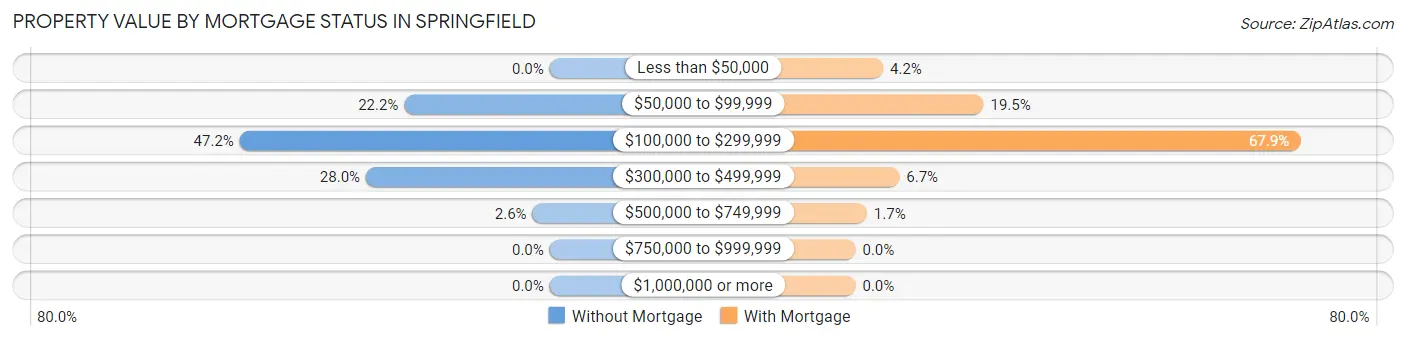
| Property Value | Without Mortgage | With Mortgage |
| Less than $50,000 | 0 (0.0%) | 17 (4.2%) |
| $50,000 to $99,999 | 76 (22.2%) | 79 (19.5%) |
| $100,000 to $299,999 | 162 (47.2%) | 275 (67.9%) |
| $300,000 to $499,999 | 96 (28.0%) | 27 (6.7%) |
| $500,000 to $749,999 | 9 (2.6%) | 7 (1.7%) |
| $750,000 to $999,999 | 0 (0.0%) | 0 (0.0%) |
| $1,000,000 or more | 0 (0.0%) | 0 (0.0%) |
| Total | 343 (100.0%) | 405 (100.0%) |
Household Income by Mortgage Status in Springfield
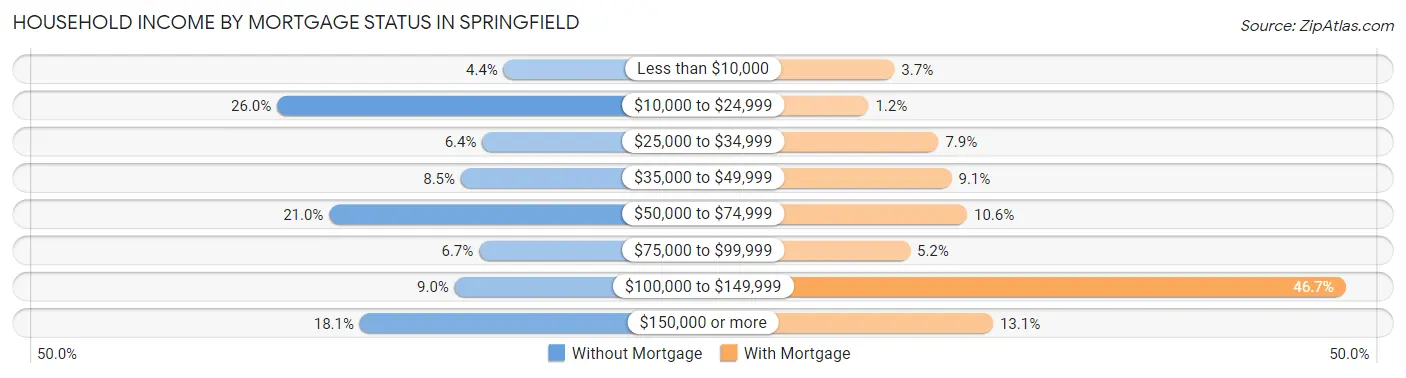
| Household Income | Without Mortgage | With Mortgage |
| Less than $10,000 | 15 (4.4%) | 15 (3.7%) |
| $10,000 to $24,999 | 89 (26.0%) | 5 (1.2%) |
| $25,000 to $34,999 | 22 (6.4%) | 32 (7.9%) |
| $35,000 to $49,999 | 29 (8.5%) | 37 (9.1%) |
| $50,000 to $74,999 | 72 (21.0%) | 43 (10.6%) |
| $75,000 to $99,999 | 23 (6.7%) | 21 (5.2%) |
| $100,000 to $149,999 | 31 (9.0%) | 189 (46.7%) |
| $150,000 or more | 62 (18.1%) | 53 (13.1%) |
| Total | 343 (100.0%) | 405 (100.0%) |
Property Value to Household Income Ratio in Springfield
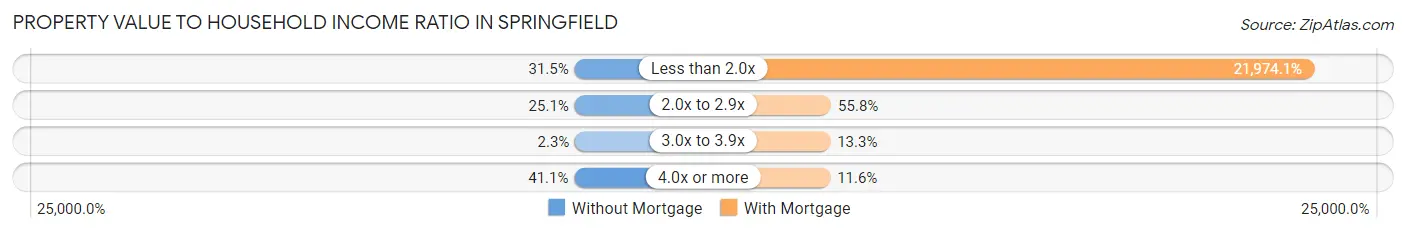
| Value-to-Income Ratio | Without Mortgage | With Mortgage |
| Less than 2.0x | 108 (31.5%) | 88,995 (21,974.1%) |
| 2.0x to 2.9x | 86 (25.1%) | 226 (55.8%) |
| 3.0x to 3.9x | 8 (2.3%) | 54 (13.3%) |
| 4.0x or more | 141 (41.1%) | 47 (11.6%) |
| Total | 343 (100.0%) | 405 (100.0%) |
Real Estate Taxes by Mortgage Status in Springfield
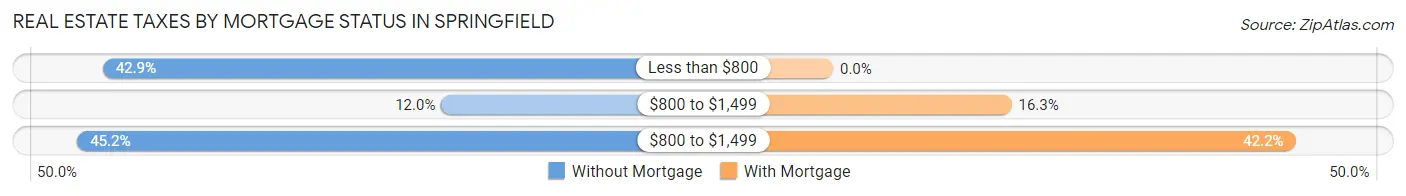
| Property Taxes | Without Mortgage | With Mortgage |
| Less than $800 | 147 (42.9%) | 0 (0.0%) |
| $800 to $1,499 | 41 (11.9%) | 66 (16.3%) |
| $800 to $1,499 | 155 (45.2%) | 171 (42.2%) |
| Total | 343 (100.0%) | 405 (100.0%) |
Health & Disability in Springfield
Health Insurance Coverage by Age in Springfield
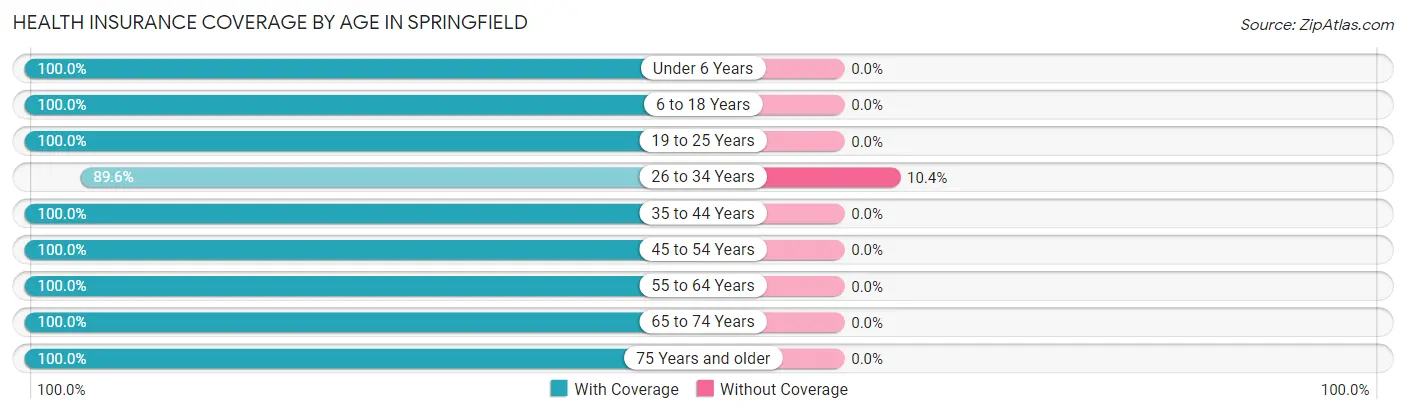
| Age Bracket | With Coverage | Without Coverage |
| Under 6 Years | 214 (100.0%) | 0 (0.0%) |
| 6 to 18 Years | 442 (100.0%) | 0 (0.0%) |
| 19 to 25 Years | 247 (100.0%) | 0 (0.0%) |
| 26 to 34 Years | 440 (89.6%) | 51 (10.4%) |
| 35 to 44 Years | 200 (100.0%) | 0 (0.0%) |
| 45 to 54 Years | 253 (100.0%) | 0 (0.0%) |
| 55 to 64 Years | 409 (100.0%) | 0 (0.0%) |
| 65 to 74 Years | 298 (100.0%) | 0 (0.0%) |
| 75 Years and older | 234 (100.0%) | 0 (0.0%) |
| Total | 2,737 (98.2%) | 51 (1.8%) |
Health Insurance Coverage by Citizenship Status in Springfield
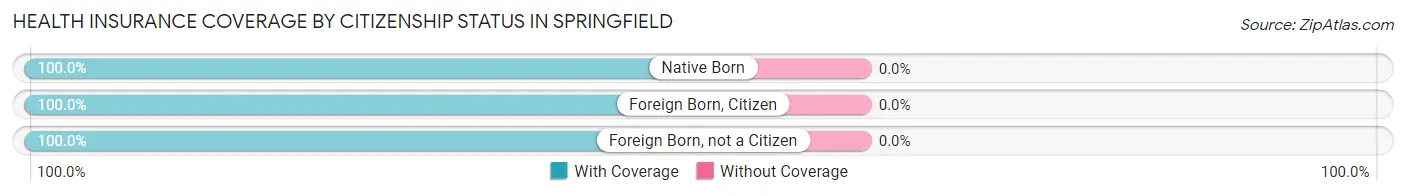
| Citizenship Status | With Coverage | Without Coverage |
| Native Born | 214 (100.0%) | 0 (0.0%) |
| Foreign Born, Citizen | 442 (100.0%) | 0 (0.0%) |
| Foreign Born, not a Citizen | 247 (100.0%) | 0 (0.0%) |
Health Insurance Coverage by Household Income in Springfield
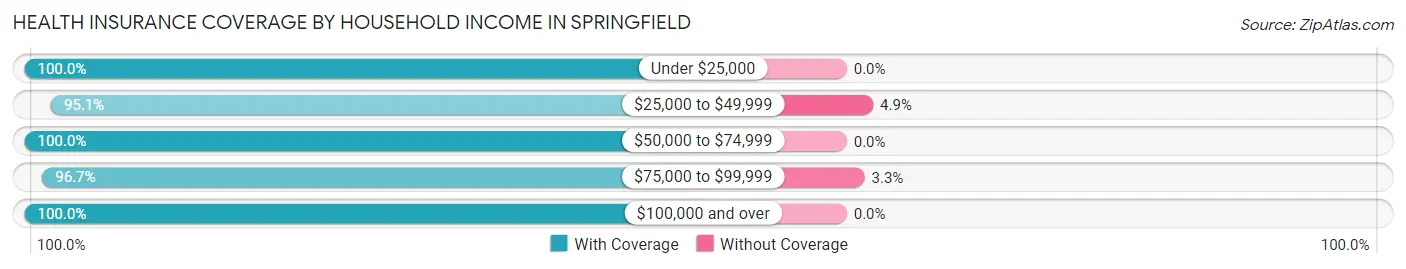
| Household Income | With Coverage | Without Coverage |
| Under $25,000 | 468 (100.0%) | 0 (0.0%) |
| $25,000 to $49,999 | 462 (95.1%) | 24 (4.9%) |
| $50,000 to $74,999 | 371 (100.0%) | 0 (0.0%) |
| $75,000 to $99,999 | 783 (96.7%) | 27 (3.3%) |
| $100,000 and over | 453 (100.0%) | 0 (0.0%) |
Public vs Private Health Insurance Coverage by Age in Springfield
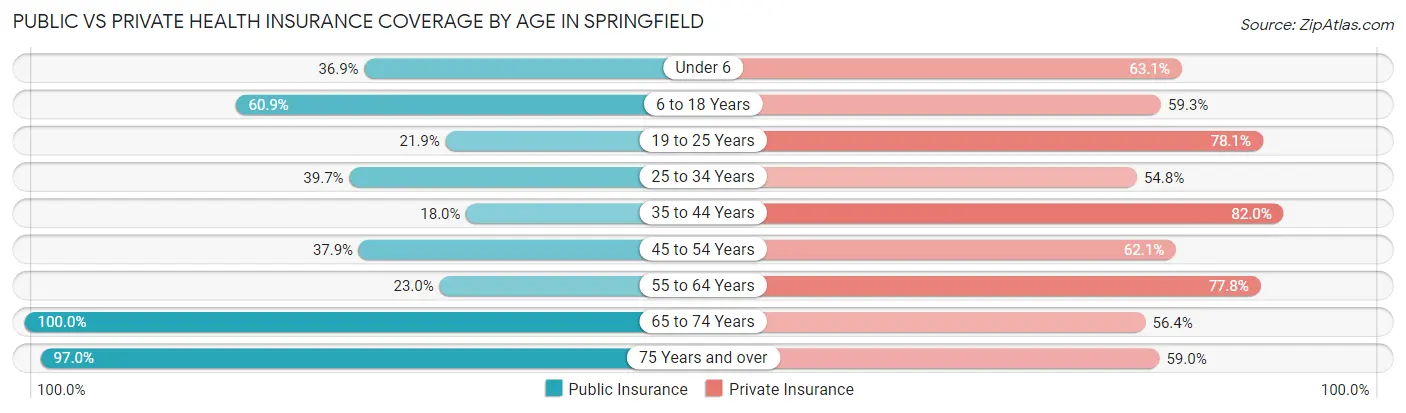
| Age Bracket | Public Insurance | Private Insurance |
| Under 6 | 79 (36.9%) | 135 (63.1%) |
| 6 to 18 Years | 269 (60.9%) | 262 (59.3%) |
| 19 to 25 Years | 54 (21.9%) | 193 (78.1%) |
| 25 to 34 Years | 195 (39.7%) | 269 (54.8%) |
| 35 to 44 Years | 36 (18.0%) | 164 (82.0%) |
| 45 to 54 Years | 96 (37.9%) | 157 (62.1%) |
| 55 to 64 Years | 94 (23.0%) | 318 (77.7%) |
| 65 to 74 Years | 298 (100.0%) | 168 (56.4%) |
| 75 Years and over | 227 (97.0%) | 138 (59.0%) |
| Total | 1,348 (48.3%) | 1,804 (64.7%) |
Disability Status by Sex by Age in Springfield
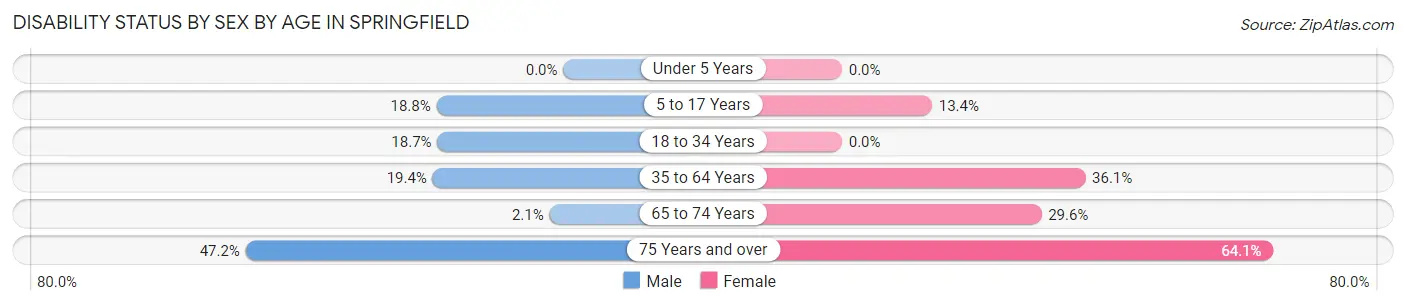
| Age Bracket | Male | Female |
| Under 5 Years | 0 (0.0%) | 0 (0.0%) |
| 5 to 17 Years | 42 (18.8%) | 29 (13.4%) |
| 18 to 34 Years | 69 (18.7%) | 0 (0.0%) |
| 35 to 64 Years | 91 (19.4%) | 142 (36.1%) |
| 65 to 74 Years | 3 (2.1%) | 45 (29.6%) |
| 75 Years and over | 25 (47.2%) | 116 (64.1%) |
Disability Class by Sex by Age in Springfield
Disability Class: Hearing Difficulty
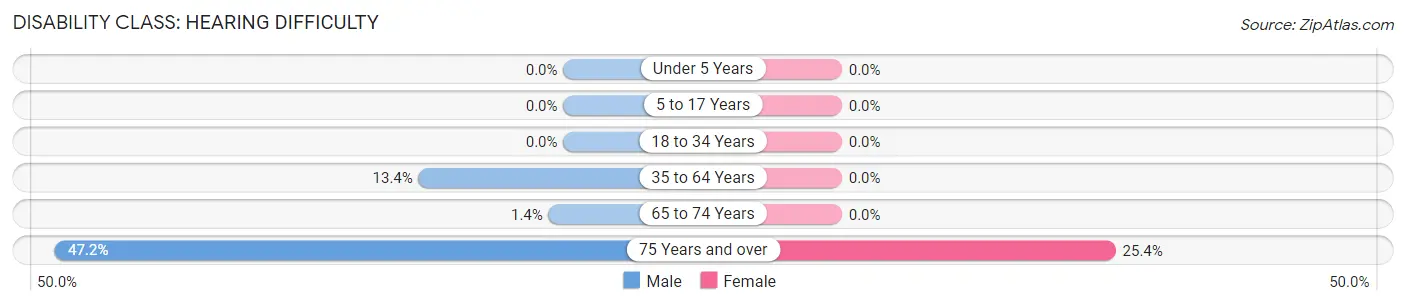
| Age Bracket | Male | Female |
| Under 5 Years | 0 (0.0%) | 0 (0.0%) |
| 5 to 17 Years | 0 (0.0%) | 0 (0.0%) |
| 18 to 34 Years | 0 (0.0%) | 0 (0.0%) |
| 35 to 64 Years | 63 (13.4%) | 0 (0.0%) |
| 65 to 74 Years | 2 (1.4%) | 0 (0.0%) |
| 75 Years and over | 25 (47.2%) | 46 (25.4%) |
Disability Class: Vision Difficulty
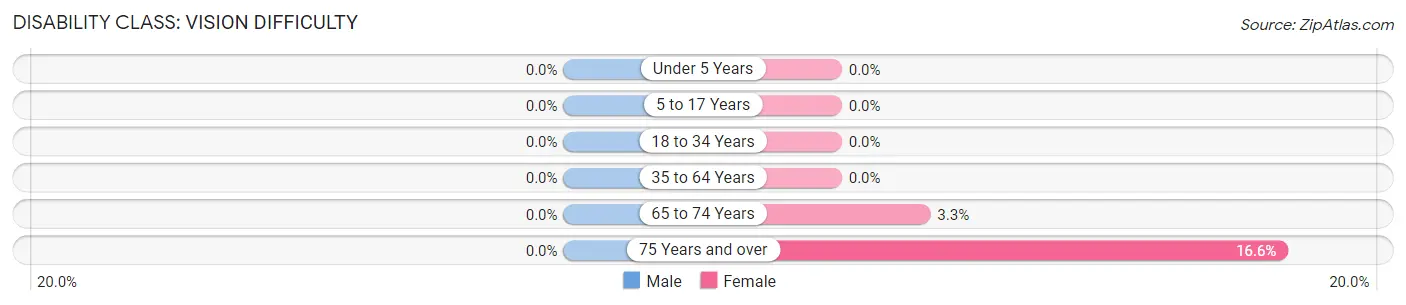
| Age Bracket | Male | Female |
| Under 5 Years | 0 (0.0%) | 0 (0.0%) |
| 5 to 17 Years | 0 (0.0%) | 0 (0.0%) |
| 18 to 34 Years | 0 (0.0%) | 0 (0.0%) |
| 35 to 64 Years | 0 (0.0%) | 0 (0.0%) |
| 65 to 74 Years | 0 (0.0%) | 5 (3.3%) |
| 75 Years and over | 0 (0.0%) | 30 (16.6%) |
Disability Class: Cognitive Difficulty
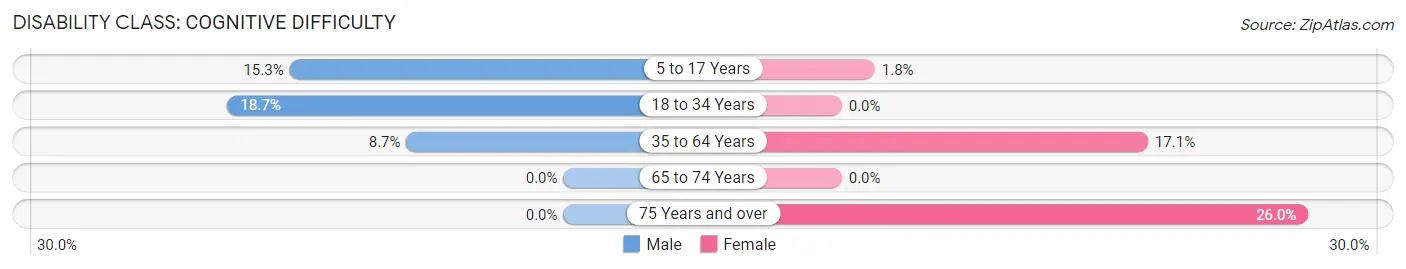
| Age Bracket | Male | Female |
| 5 to 17 Years | 34 (15.2%) | 4 (1.8%) |
| 18 to 34 Years | 69 (18.7%) | 0 (0.0%) |
| 35 to 64 Years | 41 (8.7%) | 67 (17.1%) |
| 65 to 74 Years | 0 (0.0%) | 0 (0.0%) |
| 75 Years and over | 0 (0.0%) | 47 (26.0%) |
Disability Class: Ambulatory Difficulty
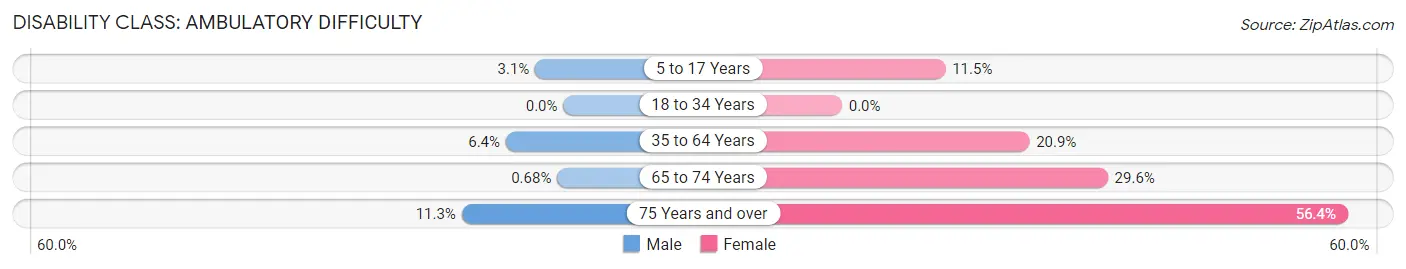
| Age Bracket | Male | Female |
| 5 to 17 Years | 7 (3.1%) | 25 (11.5%) |
| 18 to 34 Years | 0 (0.0%) | 0 (0.0%) |
| 35 to 64 Years | 30 (6.4%) | 82 (20.9%) |
| 65 to 74 Years | 1 (0.7%) | 45 (29.6%) |
| 75 Years and over | 6 (11.3%) | 102 (56.4%) |
Disability Class: Self-Care Difficulty
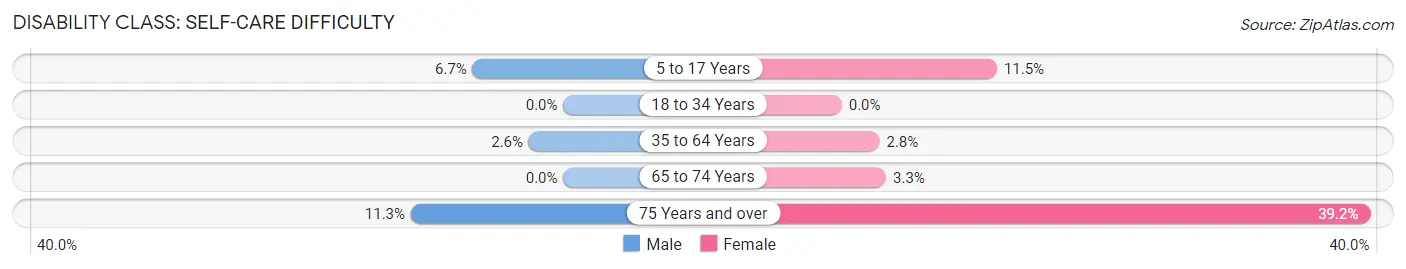
| Age Bracket | Male | Female |
| 5 to 17 Years | 15 (6.7%) | 25 (11.5%) |
| 18 to 34 Years | 0 (0.0%) | 0 (0.0%) |
| 35 to 64 Years | 12 (2.6%) | 11 (2.8%) |
| 65 to 74 Years | 0 (0.0%) | 5 (3.3%) |
| 75 Years and over | 6 (11.3%) | 71 (39.2%) |
Technology Access in Springfield
Computing Device Access in Springfield
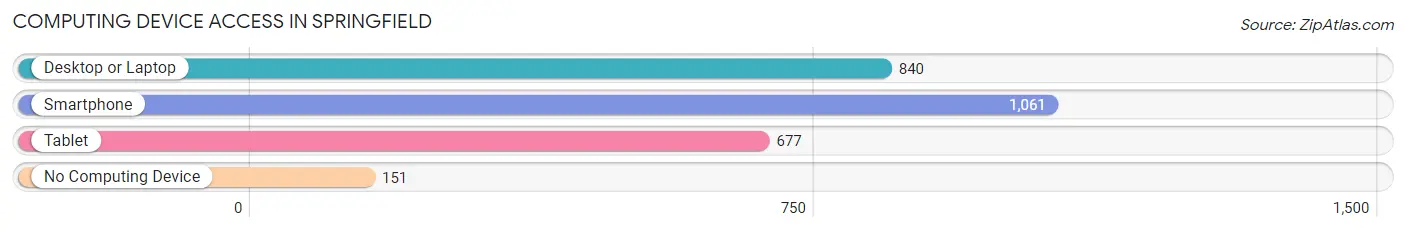
| Device Type | # Households | % Households |
| Desktop or Laptop | 840 | 66.3% |
| Smartphone | 1,061 | 83.8% |
| Tablet | 677 | 53.5% |
| No Computing Device | 151 | 11.9% |
| Total | 1,266 | 100.0% |
Internet Access in Springfield
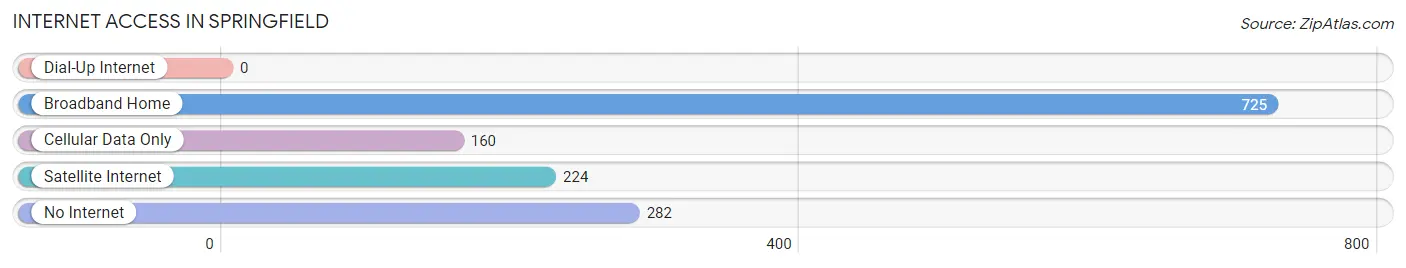
| Internet Type | # Households | % Households |
| Dial-Up Internet | 0 | 0.0% |
| Broadband Home | 725 | 57.3% |
| Cellular Data Only | 160 | 12.6% |
| Satellite Internet | 224 | 17.7% |
| No Internet | 282 | 22.3% |
| Total | 1,266 | 100.0% |
Springfield Summary
Springfield, Kentucky is a small city located in Washington County, Kentucky. It is the county seat of Washington County and is located about 25 miles south of Louisville. The city has a population of approximately 3,400 people and is part of the Springfield-Washington County Metropolitan Statistical Area.
History
The area that is now Springfield was first settled in 1780 by a group of settlers from Pennsylvania. The settlement was originally known as Springfield Station and was located on the Louisville and Nashville Railroad. The town was officially incorporated in 1867 and was named after Springfield, Massachusetts.
The city was an important stop on the Louisville and Nashville Railroad and was the site of a major Civil War battle in 1862. The Battle of Springfield was a Confederate victory and resulted in the Union forces retreating from the area.
Geography
Springfield is located in the Bluegrass region of Kentucky. The city is situated in the rolling hills of the region and is surrounded by farmland. The city is located at the intersection of Interstate 64 and US Highway 150. The city is located about 25 miles south of Louisville and is about an hour and a half drive from Lexington.
The climate in Springfield is humid subtropical with hot summers and mild winters. The average temperature in the summer is around 80 degrees Fahrenheit and the average temperature in the winter is around 40 degrees Fahrenheit.
Economy
The economy of Springfield is largely based on agriculture and manufacturing. The city is home to several large manufacturing companies including a paper mill, a furniture factory, and a plastics factory. The city is also home to several small businesses and retail stores.
The unemployment rate in Springfield is slightly higher than the national average. The median household income in the city is around $35,000.
Demographics
As of the 2010 census, the population of Springfield was 3,400. The racial makeup of the city was 95.3% White, 2.2% African American, 0.3% Native American, 0.3% Asian, 0.1% Pacific Islander, 0.7% from other races, and 1.3% from two or more races. Hispanic or Latino of any race were 1.7% of the population.
The median age in Springfield is 38.5 years. About 24.3% of the population is under the age of 18 and 11.2% is over the age of 65. The city has a higher percentage of females than males, with 51.3% of the population being female and 48.7% being male.
Conclusion
Springfield, Kentucky is a small city located in Washington County, Kentucky. It is the county seat of Washington County and is located about 25 miles south of Louisville. The city has a population of approximately 3,400 people and is part of the Springfield-Washington County Metropolitan Statistical Area. The economy of Springfield is largely based on agriculture and manufacturing. The city is home to several large manufacturing companies and small businesses. The racial makeup of the city is 95.3% White, 2.2% African American, 0.3% Native American, 0.3% Asian, 0.1% Pacific Islander, 0.7% from other races, and 1.3% from two or more races. The median age in Springfield is 38.5 years and the median household income is around $35,000.
Common Questions
What is Per Capita Income in Springfield?
Per Capita income in Springfield is $29,140.
What is the Median Family Income in Springfield?
Median Family Income in Springfield is $88,288.
What is the Median Household income in Springfield?
Median Household Income in Springfield is $48,333.
What is Income or Wage Gap in Springfield?
Income or Wage Gap in Springfield is 12.4%.
Women in Springfield earn 87.6 cents for every dollar earned by a man.
What is Inequality or Gini Index in Springfield?
Inequality or Gini Index in Springfield is 0.44.
What is the Total Population of Springfield?
Total Population of Springfield is 2,846.
What is the Total Male Population of Springfield?
Total Male Population of Springfield is 1,342.
What is the Total Female Population of Springfield?
Total Female Population of Springfield is 1,504.
What is the Ratio of Males per 100 Females in Springfield?
There are 89.23 Males per 100 Females in Springfield.
What is the Ratio of Females per 100 Males in Springfield?
There are 112.07 Females per 100 Males in Springfield.
What is the Median Population Age in Springfield?
Median Population Age in Springfield is 36.8 Years.
What is the Average Family Size in Springfield
Average Family Size in Springfield is 3.0 People.
What is the Average Household Size in Springfield
Average Household Size in Springfield is 2.0 People.
How Large is the Labor Force in Springfield?
There are 1,481 People in the Labor Forcein in Springfield.
What is the Percentage of People in the Labor Force in Springfield?
64.8% of People are in the Labor Force in Springfield.
What is the Unemployment Rate in Springfield?
Unemployment Rate in Springfield is 0.5%.