Zip Codes with the Highest Poverty Level in Wichita, KS

RELATED REPORTS & OPTIONS

Highest Poverty
Population
Families and Households
Female Fertility
Female Fertility (Unmarried)
Race (Community Size)
Race (Percentage)
Ancestry (Community Size)
AfricanAlaska NativeAmericanApacheArabArapahoArgentineanArmenianAustralianAustrianBangladeshiBarbadianBelgianBhutaneseBlackfeetBolivianBrazilianBritishBulgarianBurmeseCajunCanadianCelticCentral AmericanCentral American IndianCherokeeCheyenneChickasawChileanChippewaChoctawColombianComancheCosta RicanCreekCroatianCubanCzechCzechoslovakianDanishDelawareDominicanDutchDutch West IndianEastern EuropeanEcuadorianEgyptianEnglishEthiopianEuropeanFilipinoFinnishFrenchFrench American IndianFrench CanadianGermanGerman RussianGhanaianGreekGuamanian / ChamorroGuatemalanHaitianHonduranHungarianIcelanderIndian (Asian)IndonesianInupiatIranianIrishIroquoisItalianJamaicanJapaneseJordanianKenyanKiowaKoreanLaotianLebaneseLithuanianLuxembourgerMalaysianMexicanMexican American IndianMongolianMoroccanNative HawaiianNavajoNicaraguanNigerianNorthern EuropeanNorwegianOsageOttawaPakistaniPalestinianPanamanianParaguayanPennsylvania GermanPeruvianPimaPolishPortuguesePotawatomiPuebloPuerto RicanRomanianRussianSalvadoranSamoanScandinavianScotch-IrishScottishSeminoleSiouxSlavicSlovakSloveneSouth AfricanSouth AmericanSpaniardSpanishSpanish AmericanSpanish American IndianSri LankanSubsaharan AfricanSwedishSwissSyrianThaiTrinidadian and TobagonianTurkishUgandanUkrainianVenezuelanWelshWest IndianYugoslavian
Ancestry (Percentage)
AfricanAlaska NativeAmericanApacheArabArapahoArgentineanArmenianAustralianAustrianBangladeshiBarbadianBelgianBhutaneseBlackfeetBolivianBrazilianBritishBulgarianBurmeseCajunCanadianCelticCentral AmericanCentral American IndianCherokeeCheyenneChickasawChileanChippewaChoctawColombianComancheCosta RicanCreekCroatianCubanCzechCzechoslovakianDanishDelawareDominicanDutchDutch West IndianEastern EuropeanEcuadorianEgyptianEnglishEthiopianEuropeanFilipinoFinnishFrenchFrench American IndianFrench CanadianGermanGerman RussianGhanaianGreekGuamanian / ChamorroGuatemalanHaitianHonduranHungarianIcelanderIndian (Asian)IndonesianInupiatIranianIrishIroquoisItalianJamaicanJapaneseJordanianKenyanKiowaKoreanLaotianLebaneseLithuanianLuxembourgerMalaysianMexicanMexican American IndianMongolianMoroccanNative HawaiianNavajoNicaraguanNigerianNorthern EuropeanNorwegianOsageOttawaPakistaniPalestinianPanamanianParaguayanPennsylvania GermanPeruvianPimaPolishPortuguesePotawatomiPuebloPuerto RicanRomanianRussianSalvadoranSamoanScandinavianScotch-IrishScottishSeminoleSiouxSlavicSlovakSloveneSouth AfricanSouth AmericanSpaniardSpanishSpanish AmericanSpanish American IndianSri LankanSubsaharan AfricanSwedishSwissSyrianThaiTrinidadian and TobagonianTurkishUgandanUkrainianVenezuelanWelshWest IndianYugoslavian
Immigrant Origin (Total)
Immigrant Origin (Percentage)
Income
Income (Families)
Income (Households)
Poverty
Poverty (Families)
Unemployment
Employment Occupations
Employment Industries
Employer Class
Commute Time
Commute Means
School Enrollment
Education by Degree Field
Occupancy
Finances
Physical Characteristics
Wichita
Compare Zip Codes
Comparison Subject

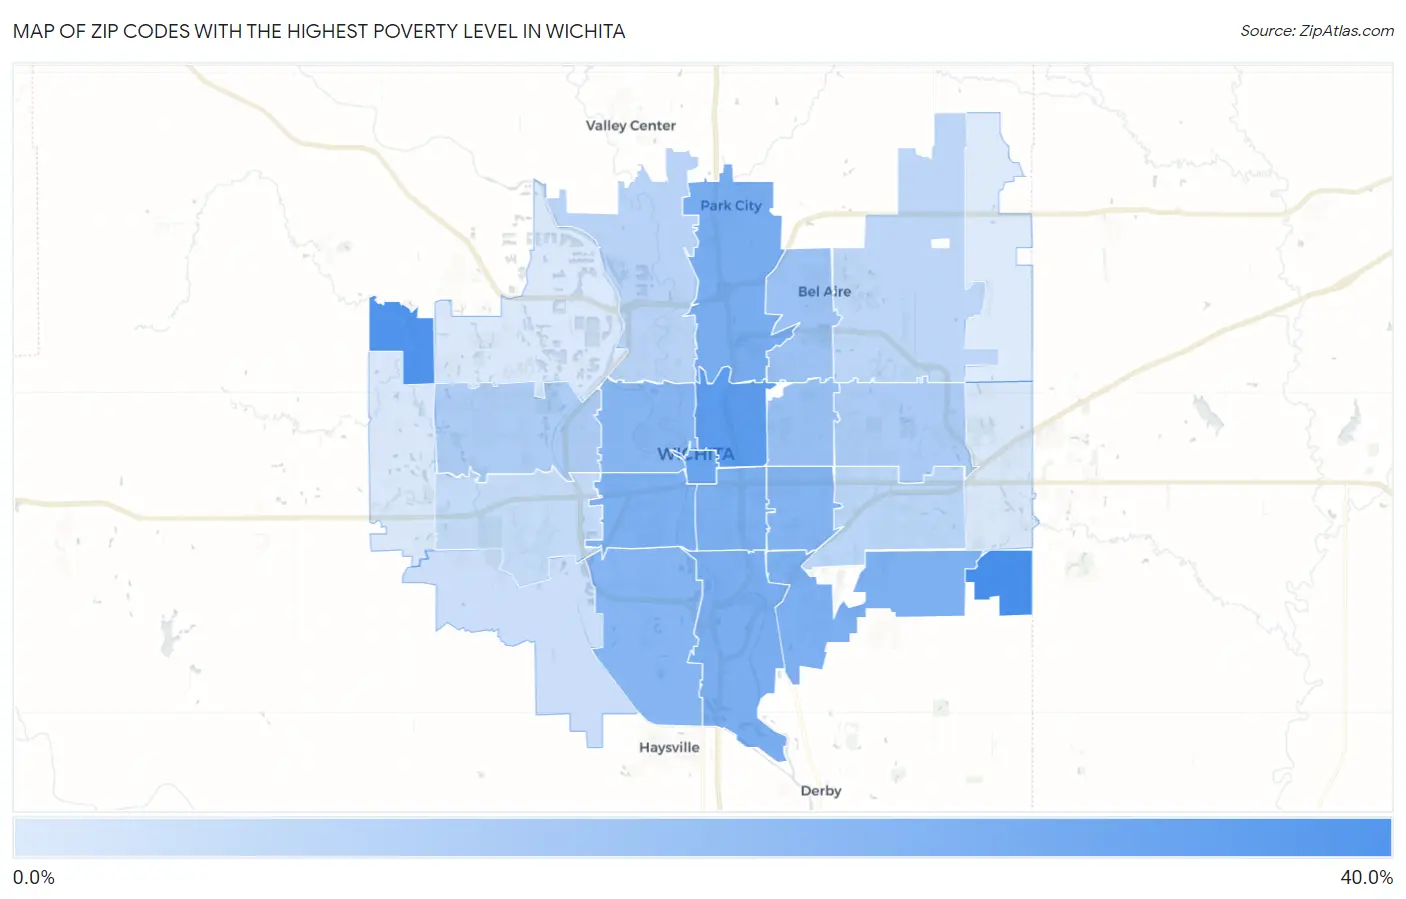
Map of Zip Codes with the Highest Poverty Level in Wichita

0.0%
40.0%
Zip Codes with the Highest Poverty Level in Wichita Map

Zip Codes with the Highest Poverty Level in Wichita, KS

Zip Code Poverty vs State vs National
1.6723237.3%11.6%(+25.7)#1112.5%(+24.7)#1,286
2.6722334.5%11.6%(+22.9)#1612.5%(+22.0)#1,601
3.6721432.1%11.6%(+20.5)#2312.5%(+19.5)#1,999
4.6720227.5%11.6%(+16.0)#4012.5%(+15.0)#2,898
5.6721924.7%11.6%(+13.1)#5312.5%(+12.1)#3,781
6.6721623.8%11.6%(+12.2)#5912.5%(+11.2)#4,118
7.6721123.5%11.6%(+11.9)#6212.5%(+10.9)#4,224
8.6721023.5%11.6%(+11.9)#6312.5%(+10.9)#4,237
9.6721323.2%11.6%(+11.6)#6412.5%(+10.6)#4,355
10.6721821.7%11.6%(+10.1)#7812.5%(+9.15)#5,042
11.6721720.8%11.6%(+9.21)#8612.5%(+8.26)#5,571
12.6720320.5%11.6%(+8.93)#8812.5%(+7.97)#5,756
13.6720816.4%11.6%(+4.80)#15012.5%(+3.85)#8,962
14.6722015.8%11.6%(+4.22)#16812.5%(+3.27)#9,566
15.6720612.4%11.6%(+0.797)#26012.5%(-0.157)#13,727
16.6721211.9%11.6%(+0.325)#27012.5%(-0.629)#14,405
17.672049.0%11.6%(-2.58)#36312.5%(-3.53)#19,151
18.672078.7%11.6%(-2.93)#37712.5%(-3.88)#19,788
19.672268.4%11.6%(-3.17)#38812.5%(-4.12)#20,241
20.672096.9%11.6%(-4.64)#44212.5%(-5.60)#22,941
21.672155.0%11.6%(-6.60)#53212.5%(-7.55)#26,391
22.672302.3%11.6%(-9.24)#63312.5%(-10.2)#30,097
23.672352.3%11.6%(-9.24)#63412.5%(-10.2)#30,099
24.672051.6%11.6%(-9.95)#65012.5%(-10.9)#30,644
25.672281.4%11.6%(-10.2)#65712.5%(-11.2)#30,803

Common Questions

What are the Top 10 Zip Codes with the Highest Poverty Level in Wichita, KS?
Top 10 Zip Codes with the Highest Poverty Level in Wichita, KS are:
#1
37.3%
#2
34.5%
#3
32.1%
#4
27.5%
#5
24.7%
#6
23.8%
#7
23.5%
#8
23.5%
#9
23.2%
#10
21.7%
What zip code has the Highest Poverty Level in Wichita, KS?
67232 has the Highest Poverty Level in Wichita, KS with 37.3%.
What is the Poverty Level in Wichita, KS?
Poverty Level in Wichita is 15.5%.
What is the Poverty Level in Kansas?
Poverty Level in Kansas is 11.6%.
What is the Poverty Level in the United States?
Poverty Level in the United States is 12.5%.