Zip Codes with the Highest Percentage of Population Employed in Construction & Extraction in Wichita, KS
RELATED REPORTS & OPTIONS
Construction & Extraction
Wichita
Compare Zip Codes
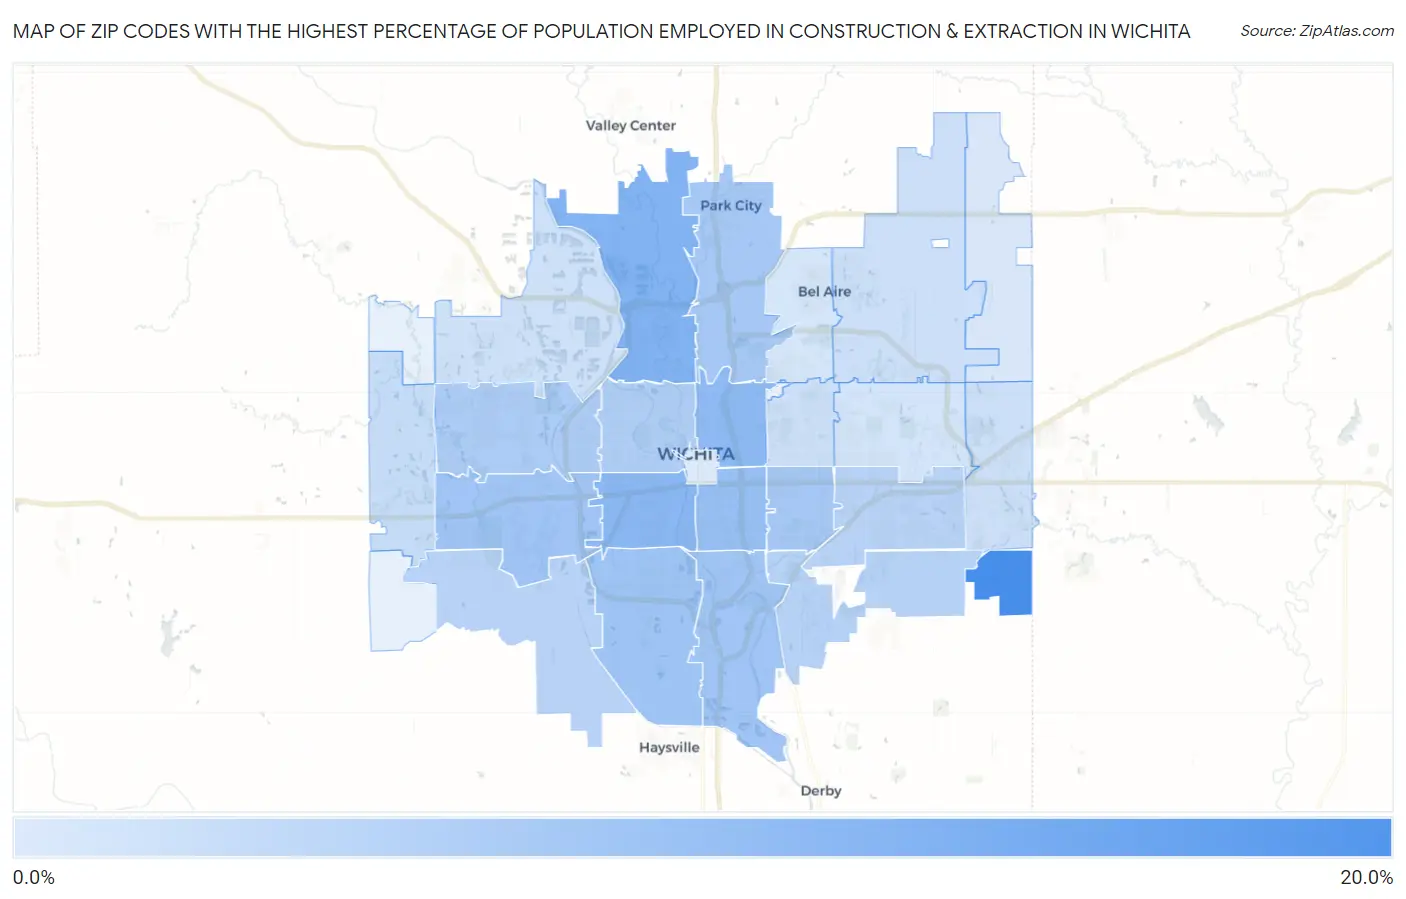
Map of Zip Codes with the Highest Percentage of Population Employed in Construction & Extraction in Wichita
0.0%
20.0%
Zip Codes with the Highest Percentage of Population Employed in Construction & Extraction in Wichita, KS
| Zip Code | % Employed | vs State | vs National | |
| 1. | 67232 | 19.3% | 4.8%(+14.5)#28 | 5.0%(+14.3)#1,083 |
| 2. | 67204 | 11.4% | 4.8%(+6.63)#90 | 5.0%(+6.46)#3,998 |
| 3. | 67213 | 10.2% | 4.8%(+5.42)#122 | 5.0%(+5.24)#5,151 |
| 4. | 67214 | 9.9% | 4.8%(+5.06)#131 | 5.0%(+4.88)#5,560 |
| 5. | 67211 | 8.7% | 4.8%(+3.88)#155 | 5.0%(+3.70)#7,258 |
| 6. | 67217 | 7.7% | 4.8%(+2.90)#192 | 5.0%(+2.72)#9,061 |
| 7. | 67209 | 7.3% | 4.8%(+2.49)#215 | 5.0%(+2.32)#9,967 |
| 8. | 67216 | 7.3% | 4.8%(+2.47)#218 | 5.0%(+2.29)#10,020 |
| 9. | 67219 | 6.9% | 4.8%(+2.12)#234 | 5.0%(+1.94)#10,910 |
| 10. | 67218 | 6.8% | 4.8%(+1.96)#239 | 5.0%(+1.78)#11,300 |
| 11. | 67212 | 5.9% | 4.8%(+1.04)#293 | 5.0%(+0.864)#13,909 |
| 12. | 67203 | 5.6% | 4.8%(+0.831)#305 | 5.0%(+0.652)#14,557 |
| 13. | 67210 | 4.9% | 4.8%(+0.052)#354 | 5.0%(-0.127)#17,222 |
| 14. | 67207 | 4.5% | 4.8%(-0.277)#380 | 5.0%(-0.456)#18,371 |
| 15. | 67215 | 4.4% | 4.8%(-0.388)#387 | 5.0%(-0.567)#18,786 |
| 16. | 67235 | 2.8% | 4.8%(-2.04)#510 | 5.0%(-2.22)#24,258 |
| 17. | 67226 | 2.1% | 4.8%(-2.76)#550 | 5.0%(-2.94)#26,194 |
| 18. | 67208 | 2.0% | 4.8%(-2.85)#558 | 5.0%(-3.03)#26,426 |
| 19. | 67230 | 2.0% | 4.8%(-2.85)#559 | 5.0%(-3.03)#26,432 |
| 20. | 67205 | 1.7% | 4.8%(-3.13)#571 | 5.0%(-3.31)#27,028 |
| 21. | 67206 | 1.1% | 4.8%(-3.71)#596 | 5.0%(-3.89)#28,125 |
| 22. | 67220 | 0.97% | 4.8%(-3.84)#603 | 5.0%(-4.02)#28,364 |
| 23. | 67228 | 0.62% | 4.8%(-4.20)#612 | 5.0%(-4.38)#28,797 |
| 24. | 67202 | 0.086% | 4.8%(-4.73)#619 | 5.0%(-4.91)#29,147 |
1
Common Questions
What are the Top 10 Zip Codes with the Highest Percentage of Population Employed in Construction & Extraction in Wichita, KS?
Top 10 Zip Codes with the Highest Percentage of Population Employed in Construction & Extraction in Wichita, KS are:
What zip code has the Highest Percentage of Population Employed in Construction & Extraction in Wichita, KS?
67232 has the Highest Percentage of Population Employed in Construction & Extraction in Wichita, KS with 19.3%.
What is the Percentage of Population Employed in Construction & Extraction in Wichita, KS?
Percentage of Population Employed in Construction & Extraction in Wichita is 5.6%.
What is the Percentage of Population Employed in Construction & Extraction in Kansas?
Percentage of Population Employed in Construction & Extraction in Kansas is 4.8%.
What is the Percentage of Population Employed in Construction & Extraction in the United States?
Percentage of Population Employed in Construction & Extraction in the United States is 5.0%.