Zip Codes with the Highest Percentage of Population Employed in Health Diagnosing & Treating in Olathe, KS
RELATED REPORTS & OPTIONS
Health Diagnosing & Treating
Olathe
Compare Zip Codes
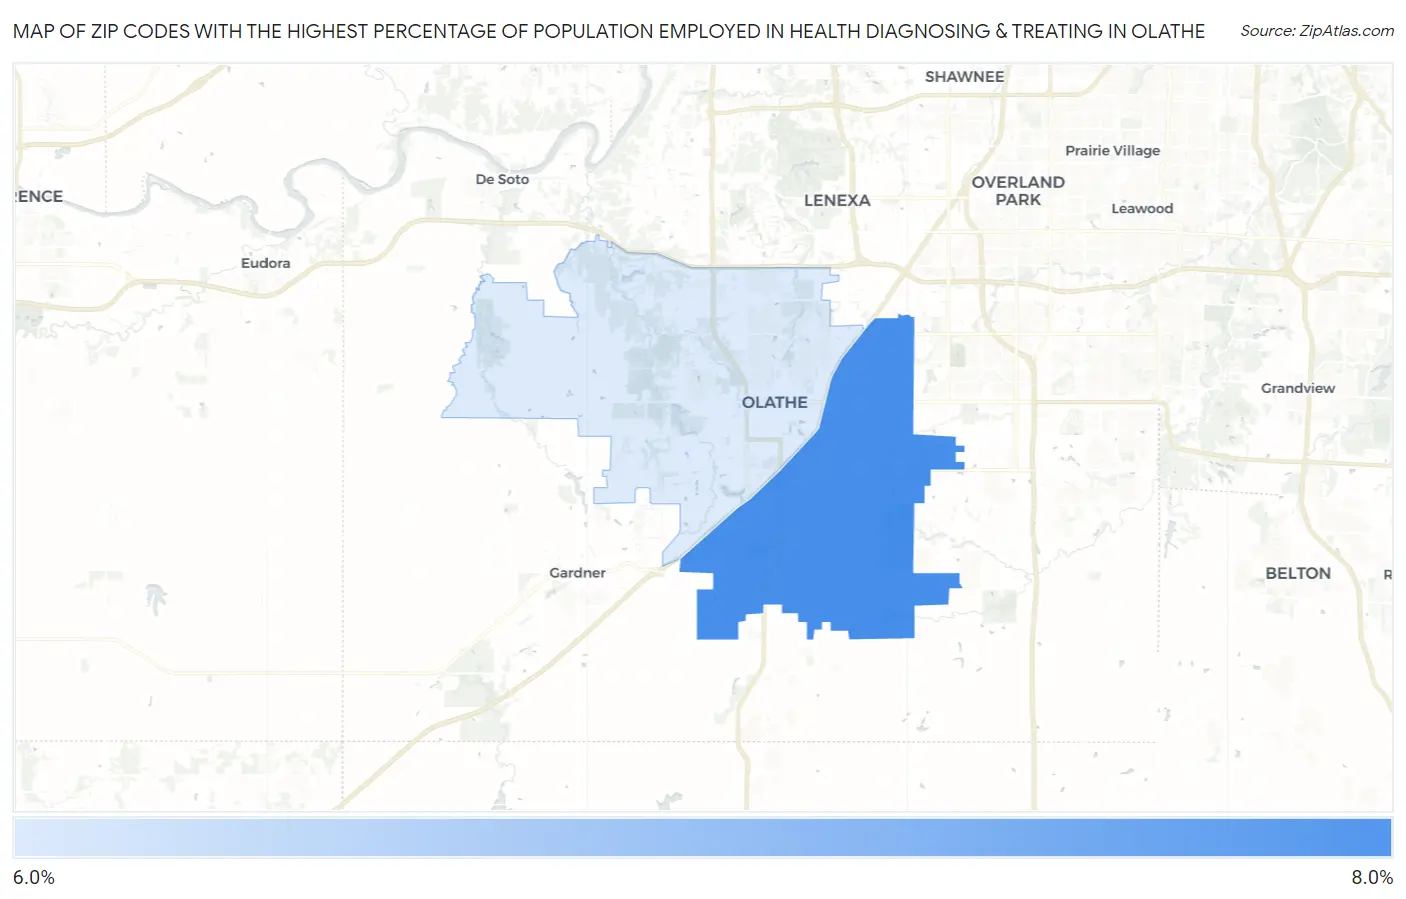
Map of Zip Codes with the Highest Percentage of Population Employed in Health Diagnosing & Treating in Olathe
6.4%
7.4%
Zip Codes with the Highest Percentage of Population Employed in Health Diagnosing & Treating in Olathe, KS
| Zip Code | % Employed | vs State | vs National | |
| 1. | 66062 | 7.4% | 6.6%(+0.833)#198 | 6.2%(+1.18)#9,030 |
| 2. | 66061 | 6.4% | 6.6%(-0.245)#265 | 6.2%(+0.106)#12,563 |
1
Common Questions
What are the Top Zip Codes with the Highest Percentage of Population Employed in Health Diagnosing & Treating in Olathe, KS?
Top Zip Codes with the Highest Percentage of Population Employed in Health Diagnosing & Treating in Olathe, KS are:
What zip code has the Highest Percentage of Population Employed in Health Diagnosing & Treating in Olathe, KS?
66062 has the Highest Percentage of Population Employed in Health Diagnosing & Treating in Olathe, KS with 7.4%.
What is the Percentage of Population Employed in Health Diagnosing & Treating in Olathe, KS?
Percentage of Population Employed in Health Diagnosing & Treating in Olathe is 7.0%.
What is the Percentage of Population Employed in Health Diagnosing & Treating in Kansas?
Percentage of Population Employed in Health Diagnosing & Treating in Kansas is 6.6%.
What is the Percentage of Population Employed in Health Diagnosing & Treating in the United States?
Percentage of Population Employed in Health Diagnosing & Treating in the United States is 6.2%.