Zip Codes with the Highest Percentage of Population Employed in Architecture & Engineering in Lafayette, IN
RELATED REPORTS & OPTIONS
Architecture & Engineering
Lafayette
Compare Zip Codes
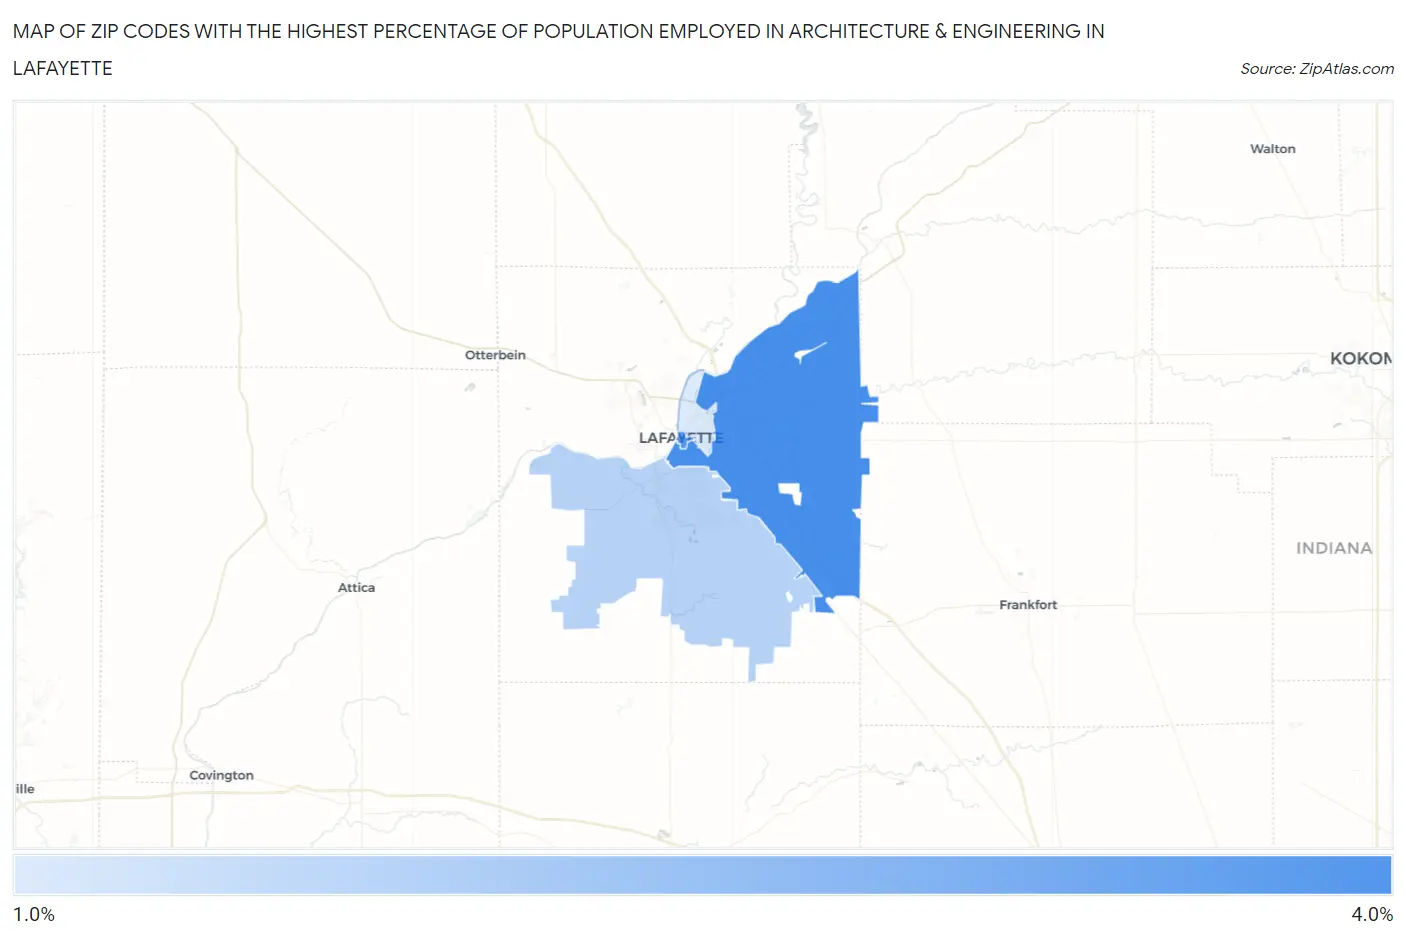
Map of Zip Codes with the Highest Percentage of Population Employed in Architecture & Engineering in Lafayette
1.8%
3.9%
Zip Codes with the Highest Percentage of Population Employed in Architecture & Engineering in Lafayette, IN
| Zip Code | % Employed | vs State | vs National | |
| 1. | 47905 | 3.9% | 2.2%(+1.67)#92 | 2.1%(+1.74)#2,955 |
| 2. | 47901 | 3.7% | 2.2%(+1.46)#105 | 2.1%(+1.53)#3,340 |
| 3. | 47909 | 2.3% | 2.2%(+0.085)#234 | 2.1%(+0.157)#7,906 |
| 4. | 47904 | 1.8% | 2.2%(-0.452)#324 | 2.1%(-0.380)#11,012 |
1
Common Questions
What are the Top 3 Zip Codes with the Highest Percentage of Population Employed in Architecture & Engineering in Lafayette, IN?
Top 3 Zip Codes with the Highest Percentage of Population Employed in Architecture & Engineering in Lafayette, IN are:
What zip code has the Highest Percentage of Population Employed in Architecture & Engineering in Lafayette, IN?
47905 has the Highest Percentage of Population Employed in Architecture & Engineering in Lafayette, IN with 3.9%.
What is the Percentage of Population Employed in Architecture & Engineering in Lafayette, IN?
Percentage of Population Employed in Architecture & Engineering in Lafayette is 2.7%.
What is the Percentage of Population Employed in Architecture & Engineering in Indiana?
Percentage of Population Employed in Architecture & Engineering in Indiana is 2.2%.
What is the Percentage of Population Employed in Architecture & Engineering in the United States?
Percentage of Population Employed in Architecture & Engineering in the United States is 2.1%.