Zip Codes with the Highest Percentage of Population Employed in Architecture & Engineering in Bloomington, IN
RELATED REPORTS & OPTIONS
Architecture & Engineering
Bloomington
Compare Zip Codes
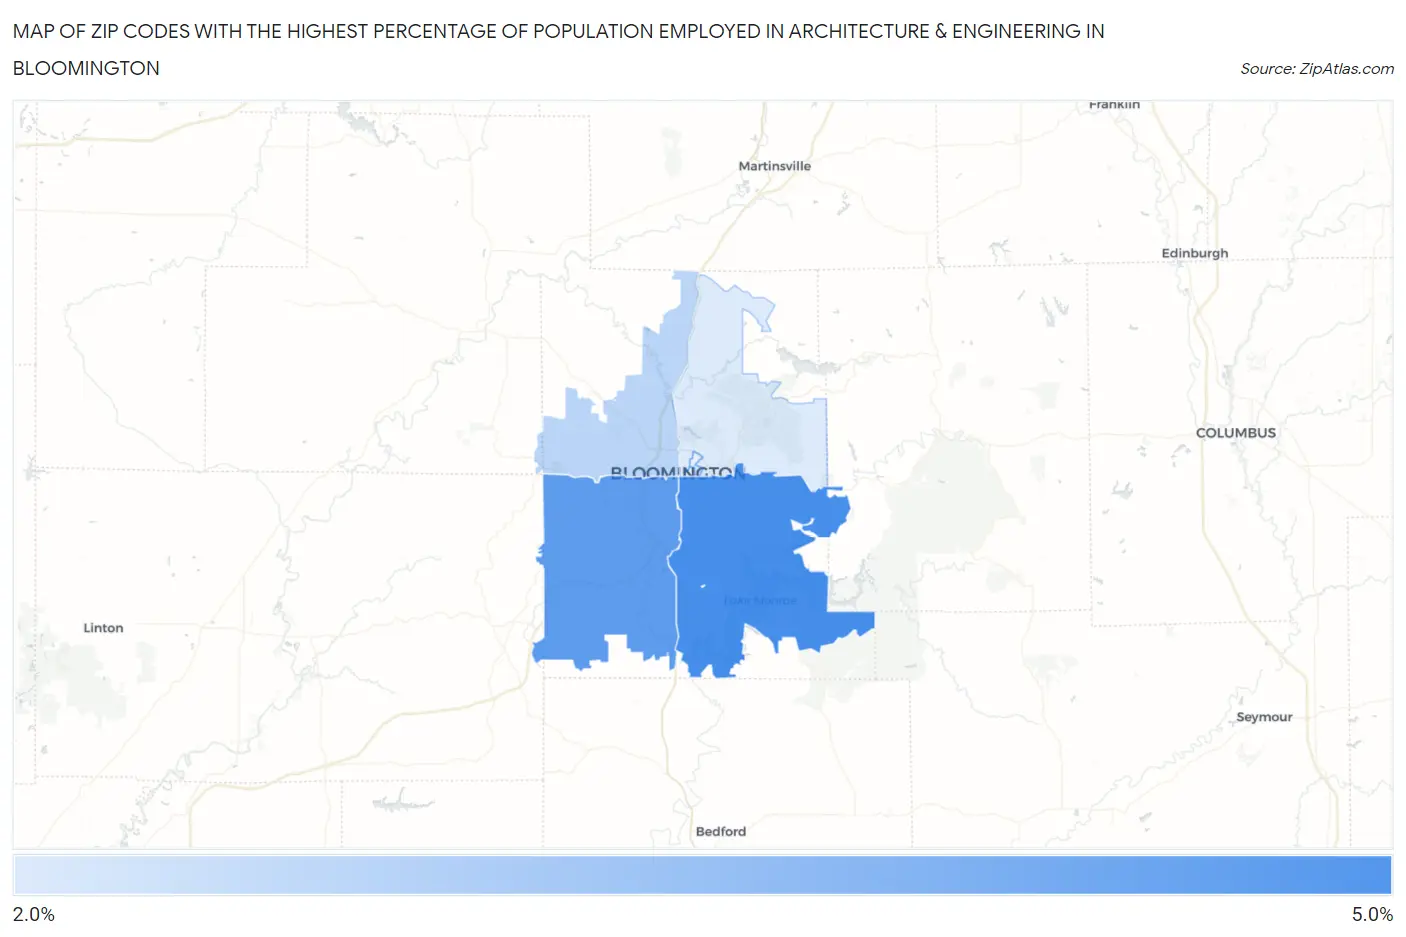
Map of Zip Codes with the Highest Percentage of Population Employed in Architecture & Engineering in Bloomington
2.1%
4.1%
Zip Codes with the Highest Percentage of Population Employed in Architecture & Engineering in Bloomington, IN
| Zip Code | % Employed | vs State | vs National | |
| 1. | 47401 | 4.1% | 2.2%(+1.85)#83 | 2.1%(+1.92)#2,660 |
| 2. | 47403 | 3.8% | 2.2%(+1.54)#99 | 2.1%(+1.61)#3,174 |
| 3. | 47404 | 2.6% | 2.2%(+0.348)#198 | 2.1%(+0.421)#6,700 |
| 4. | 47408 | 2.1% | 2.2%(-0.112)#274 | 2.1%(-0.040)#8,981 |
1
Common Questions
What are the Top 5 Zip Codes with the Highest Percentage of Population Employed in Architecture & Engineering in Bloomington, IN?
Top 5 Zip Codes with the Highest Percentage of Population Employed in Architecture & Engineering in Bloomington, IN are:
What zip code has the Highest Percentage of Population Employed in Architecture & Engineering in Bloomington, IN?
47401 has the Highest Percentage of Population Employed in Architecture & Engineering in Bloomington, IN with 4.1%.
What is the Percentage of Population Employed in Architecture & Engineering in Bloomington, IN?
Percentage of Population Employed in Architecture & Engineering in Bloomington is 3.1%.
What is the Percentage of Population Employed in Architecture & Engineering in Indiana?
Percentage of Population Employed in Architecture & Engineering in Indiana is 2.2%.
What is the Percentage of Population Employed in Architecture & Engineering in the United States?
Percentage of Population Employed in Architecture & Engineering in the United States is 2.1%.