Zip Codes with the Highest Percentage of Population Employed in Architecture & Engineering in Fort Wayne, IN

RELATED REPORTS & OPTIONS

Architecture & Engineering
Population
Families and Households
Female Fertility
Female Fertility (Unmarried)
Race (Community Size)
Race (Percentage)
Ancestry (Community Size)
AfricanAlbanianAmericanApacheArabArgentineanArmenianAustralianAustrianBelgianBhutaneseBlackfeetBrazilianBritishBulgarianBurmeseCanadianCarpatho RusynCelticCentral AmericanCentral American IndianCherokeeChickasawChippewaChoctawColombianCroatianCubanCzechCzechoslovakianDanishDominicanDutchEastern EuropeanEcuadorianEnglishEthiopianEuropeanFilipinoFinnishFrenchFrench American IndianFrench CanadianGermanGerman RussianGhanaianGreekGuamanian / ChamorroGuatemalanHaitianHonduranHungarianIndian (Asian)IndonesianIranianIraqiIrishIroquoisIsraeliItalianJamaicanJordanianKenyanKoreanLatvianLebaneseLiberianLithuanianLuxembourgerMacedonianMalaysianMexicanMexican American IndianMongolianMoroccanNative HawaiianNavajoNicaraguanNigerianNorthern EuropeanNorwegianOttawaPakistaniPalestinianPanamanianPennsylvania GermanPeruvianPolishPortuguesePuerto RicanRomanianRussianSalvadoranScandinavianScotch-IrishScottishSerbianSiouxSlavicSlovakSloveneSouth AfricanSouth AmericanSouth American IndianSpaniardSpanishSri LankanSubsaharan AfricanSudaneseSwedishSwissSyrianThaiTrinidadian and TobagonianUkrainianVenezuelanVietnameseWelshWest IndianYugoslavian
Ancestry (Percentage)
AfricanAlbanianAmericanApacheArabArgentineanArmenianAustralianAustrianBelgianBhutaneseBlackfeetBrazilianBritishBulgarianBurmeseCanadianCarpatho RusynCelticCentral AmericanCentral American IndianCherokeeChickasawChippewaChoctawColombianCroatianCubanCzechCzechoslovakianDanishDominicanDutchEastern EuropeanEcuadorianEnglishEthiopianEuropeanFilipinoFinnishFrenchFrench American IndianFrench CanadianGermanGerman RussianGhanaianGreekGuamanian / ChamorroGuatemalanHaitianHonduranHungarianIndian (Asian)IndonesianIranianIraqiIrishIroquoisIsraeliItalianJamaicanJordanianKenyanKoreanLatvianLebaneseLiberianLithuanianLuxembourgerMacedonianMalaysianMexicanMexican American IndianMongolianMoroccanNative HawaiianNavajoNicaraguanNigerianNorthern EuropeanNorwegianOttawaPakistaniPalestinianPanamanianPennsylvania GermanPeruvianPolishPortuguesePuerto RicanRomanianRussianSalvadoranScandinavianScotch-IrishScottishSerbianSiouxSlavicSlovakSloveneSouth AfricanSouth AmericanSouth American IndianSpaniardSpanishSri LankanSubsaharan AfricanSudaneseSwedishSwissSyrianThaiTrinidadian and TobagonianUkrainianVenezuelanVietnameseWelshWest IndianYugoslavian
Immigrant Origin (Total)
Immigrant Origin (Percentage)
Income
Income (Families)
Income (Households)
Poverty
Poverty (Families)
Unemployment
Employment Occupations
Employment Industries
Employer Class
Commute Time
Commute Means
School Enrollment
Education by Degree Field
Occupancy
Finances
Physical Characteristics
Fort Wayne
Compare Zip Codes
Comparison Subject

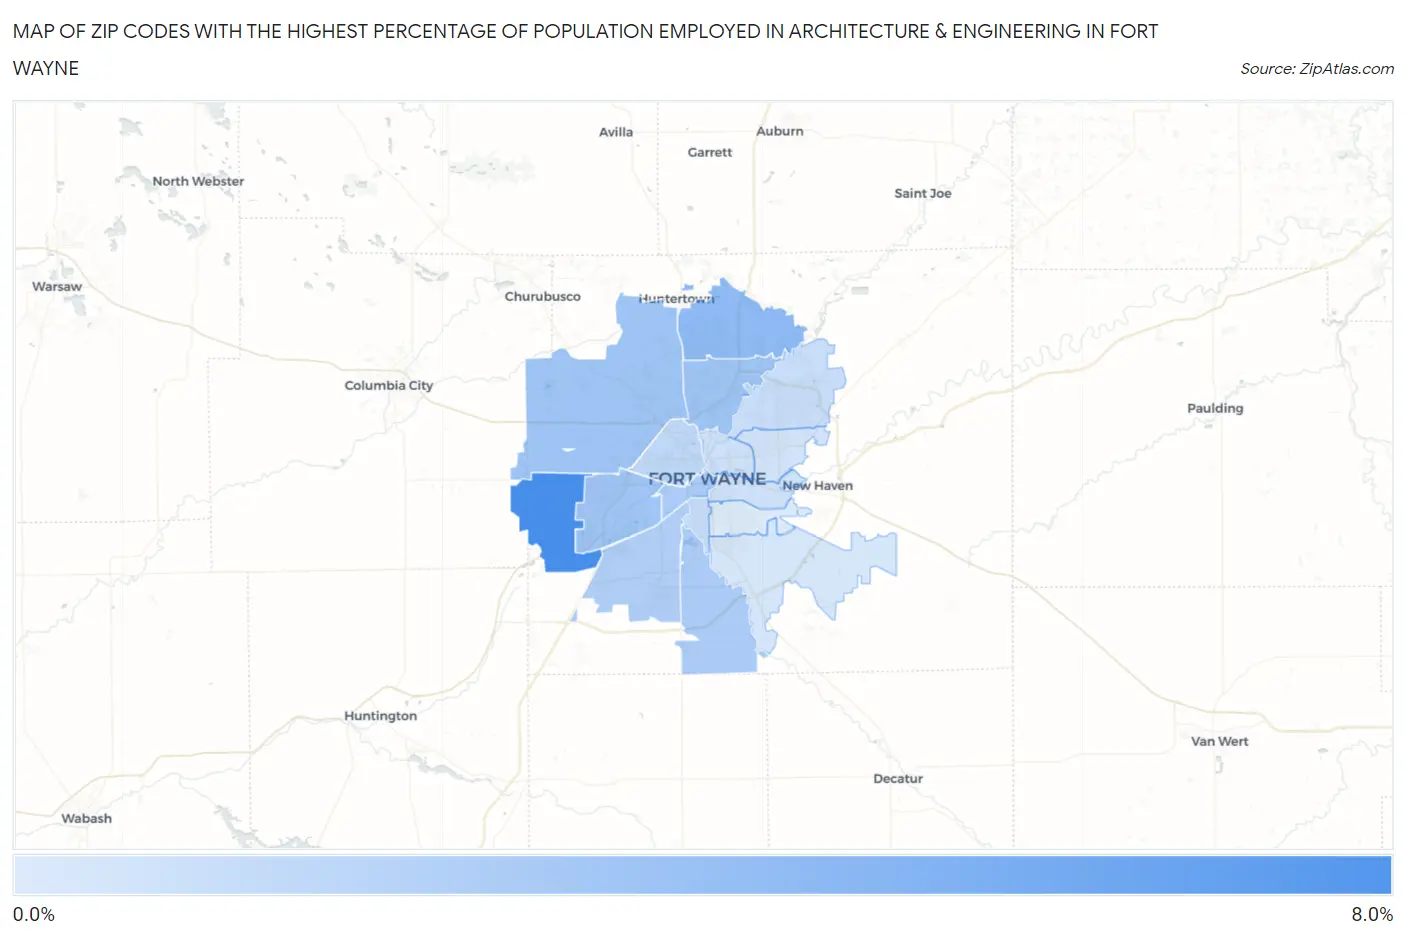
Map of Zip Codes with the Highest Percentage of Population Employed in Architecture & Engineering in Fort Wayne

0.0%
8.0%
Zip Codes with the Highest Percentage of Population Employed in Architecture & Engineering in Fort Wayne Map

Zip Codes with the Highest Percentage of Population Employed in Architecture & Engineering in Fort Wayne, IN

Zip Code % Employed vs State vs National
1.468147.6%2.2%(+5.40)#182.1%(+5.47)#634
2.468454.1%2.2%(+1.87)#812.1%(+1.94)#2,629
3.468253.4%2.2%(+1.17)#1252.1%(+1.24)#3,976
4.468183.4%2.2%(+1.16)#1272.1%(+1.23)#3,992
5.468043.2%2.2%(+0.984)#1402.1%(+1.06)#4,447
6.468192.8%2.2%(+0.612)#1792.1%(+0.685)#5,645
7.468022.8%2.2%(+0.561)#1862.1%(+0.633)#5,849
8.468092.5%2.2%(+0.324)#2052.1%(+0.396)#6,810
9.468081.8%2.2%(-0.414)#3182.1%(-0.341)#10,781
10.468351.4%2.2%(-0.817)#3822.1%(-0.744)#13,553
11.468071.4%2.2%(-0.837)#3892.1%(-0.765)#13,698
12.468051.1%2.2%(-1.13)#4542.1%(-1.06)#15,978
13.468031.1%2.2%(-1.16)#4582.1%(-1.08)#16,137
14.468150.99%2.2%(-1.23)#4752.1%(-1.16)#16,681
15.468160.76%2.2%(-1.46)#5142.1%(-1.38)#18,411
16.468060.40%2.2%(-1.82)#5612.1%(-1.75)#20,967

Common Questions

What are the Top 10 Zip Codes with the Highest Percentage of Population Employed in Architecture & Engineering in Fort Wayne, IN?
Top 10 Zip Codes with the Highest Percentage of Population Employed in Architecture & Engineering in Fort Wayne, IN are:
#1
7.6%
#2
4.1%
#3
3.4%
#4
3.4%
#5
3.2%
#6
2.8%
#7
2.8%
#8
2.5%
#9
1.8%
#10
1.4%
What zip code has the Highest Percentage of Population Employed in Architecture & Engineering in Fort Wayne, IN?
46814 has the Highest Percentage of Population Employed in Architecture & Engineering in Fort Wayne, IN with 7.6%.
What is the Percentage of Population Employed in Architecture & Engineering in Fort Wayne, IN?
Percentage of Population Employed in Architecture & Engineering in Fort Wayne is 2.0%.
What is the Percentage of Population Employed in Architecture & Engineering in Indiana?
Percentage of Population Employed in Architecture & Engineering in Indiana is 2.2%.
What is the Percentage of Population Employed in Architecture & Engineering in the United States?
Percentage of Population Employed in Architecture & Engineering in the United States is 2.1%.