Zip Codes with the Highest Percentage of Population Employed in Education, Arts & Media in Hammond, IN
RELATED REPORTS & OPTIONS
Education, Arts & Media
Hammond
Compare Zip Codes
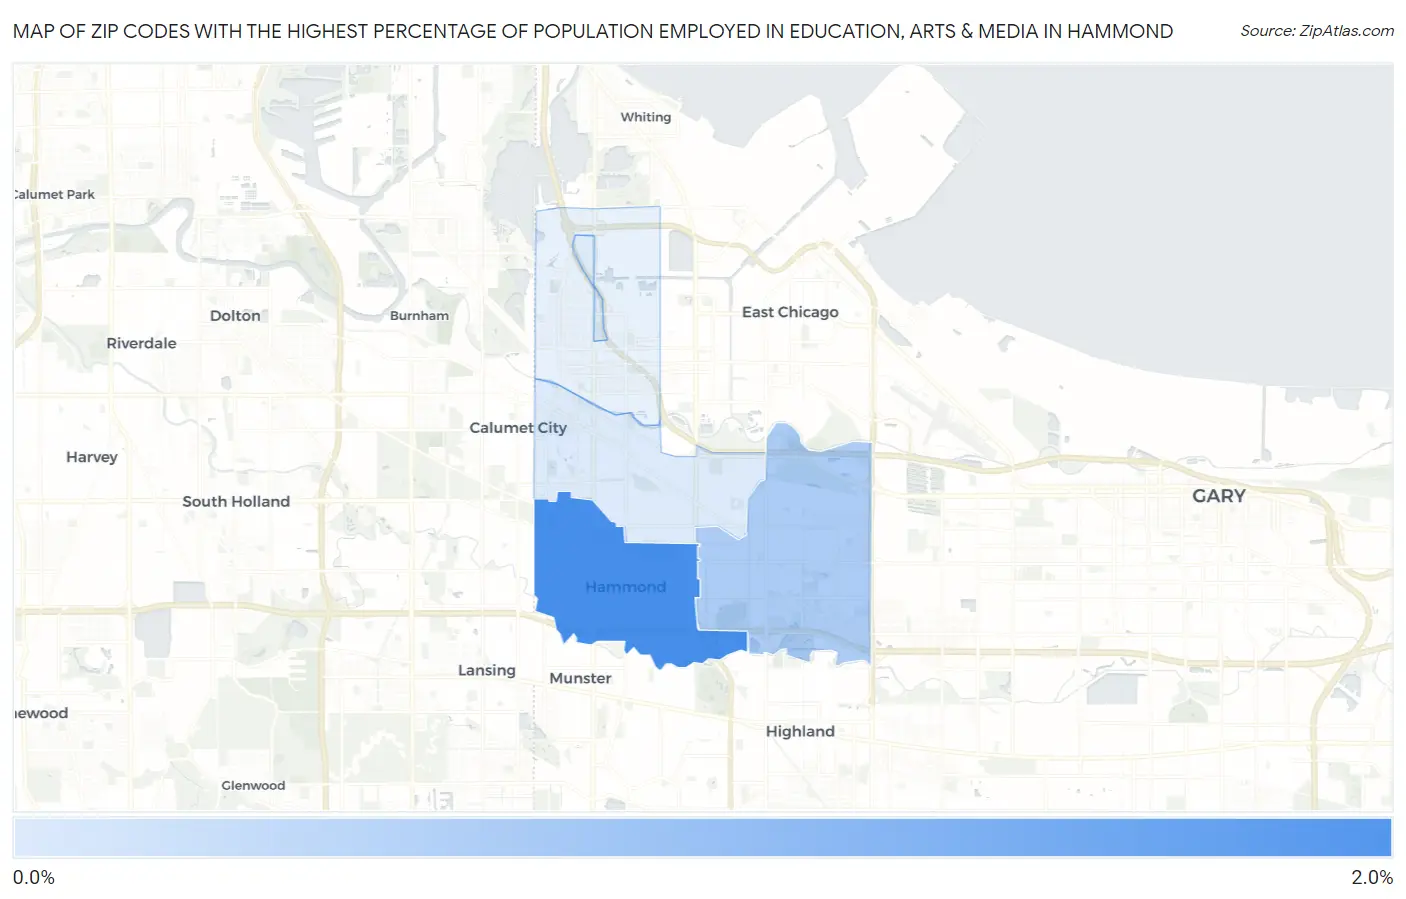
Map of Zip Codes with the Highest Percentage of Population Employed in Education, Arts & Media in Hammond
0.77%
1.6%
Zip Codes with the Highest Percentage of Population Employed in Education, Arts & Media in Hammond, IN
| Zip Code | % Employed | vs State | vs National | |
| 1. | 46324 | 1.6% | 1.8%(-0.161)#278 | 1.8%(-0.155)#12,571 |
| 2. | 46323 | 1.0% | 1.8%(-0.743)#415 | 1.8%(-0.736)#18,042 |
| 3. | 46320 | 0.77% | 1.8%(-1.02)#478 | 1.8%(-1.02)#20,477 |
1
Common Questions
What are the Top 3 Zip Codes with the Highest Percentage of Population Employed in Education, Arts & Media in Hammond, IN?
Top 3 Zip Codes with the Highest Percentage of Population Employed in Education, Arts & Media in Hammond, IN are:
What zip code has the Highest Percentage of Population Employed in Education, Arts & Media in Hammond, IN?
46324 has the Highest Percentage of Population Employed in Education, Arts & Media in Hammond, IN with 1.6%.
What is the Percentage of Population Employed in Education, Arts & Media in Hammond, IN?
Percentage of Population Employed in Education, Arts & Media in Hammond is 1.1%.
What is the Percentage of Population Employed in Education, Arts & Media in Indiana?
Percentage of Population Employed in Education, Arts & Media in Indiana is 1.8%.
What is the Percentage of Population Employed in Education, Arts & Media in the United States?
Percentage of Population Employed in Education, Arts & Media in the United States is 1.8%.