Zip Codes with the Highest Percentage of Households Without a Vehicle in Hammond, IN
RELATED REPORTS & OPTIONS
Households without a Cars
Hammond
Compare Zip Codes
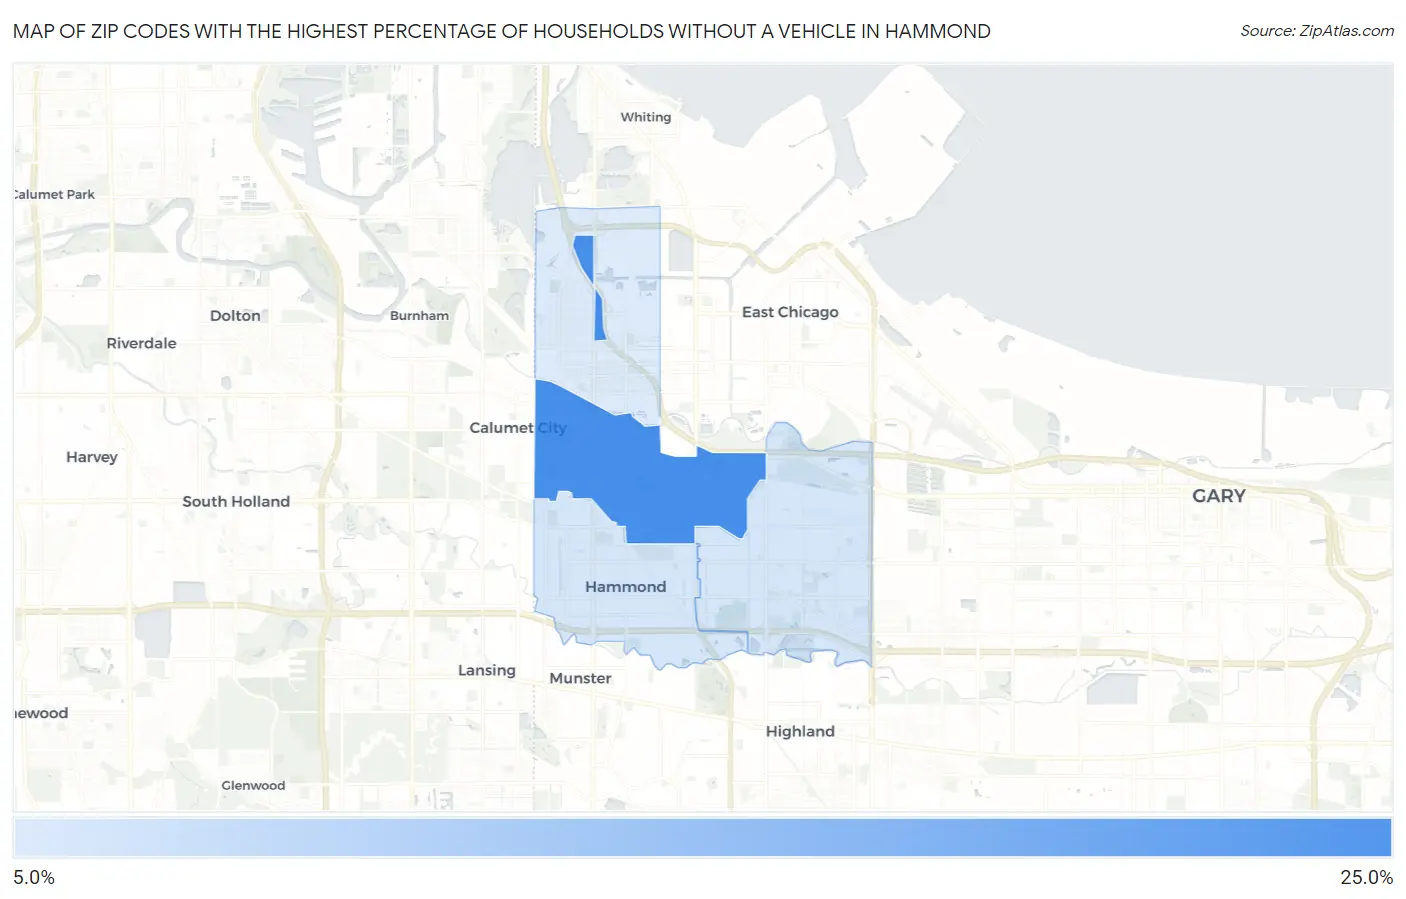
Map of Zip Codes with the Highest Percentage of Households Without a Vehicle in Hammond
6.6%
20.7%
Zip Codes with the Highest Percentage of Households Without a Vehicle in Hammond, IN
| Zip Code | Housholds Without a Car | vs State | vs National | |
| 1. | 46320 | 20.7% | 6.2%(+14.5)#28 | 8.3%(+12.4)#1,418 |
| 2. | 46323 | 7.2% | 6.2%(+1.00)#164 | 8.3%(-1.10)#8,223 |
| 3. | 46324 | 7.2% | 6.2%(+1.00)#165 | 8.3%(-1.10)#8,225 |
| 4. | 46327 | 6.6% | 6.2%(+0.400)#190 | 8.3%(-1.70)#9,243 |
1
Common Questions
What are the Top 3 Zip Codes with the Highest Percentage of Households Without a Vehicle in Hammond, IN?
Top 3 Zip Codes with the Highest Percentage of Households Without a Vehicle in Hammond, IN are:
What zip code has the Highest Percentage of Households Without a Vehicle in Hammond, IN?
46320 has the Highest Percentage of Households Without a Vehicle in Hammond, IN with 20.7%.
What is the Percentage of Households Without a Vehicle in Hammond, IN?
Percentage of Households Without a Vehicle in Hammond is 9.6%.
What is the Percentage of Households Without a Vehicle in Indiana?
Percentage of Households Without a Vehicle in Indiana is 6.2%.
What is the Percentage of Households Without a Vehicle in the United States?
Percentage of Households Without a Vehicle in the United States is 8.3%.