Zip Codes with the Highest Percentage of Population Employed in Installation, Maintenance & Repair in Hammond, IN
RELATED REPORTS & OPTIONS
Installation, Maintenance & Repair
Hammond
Compare Zip Codes
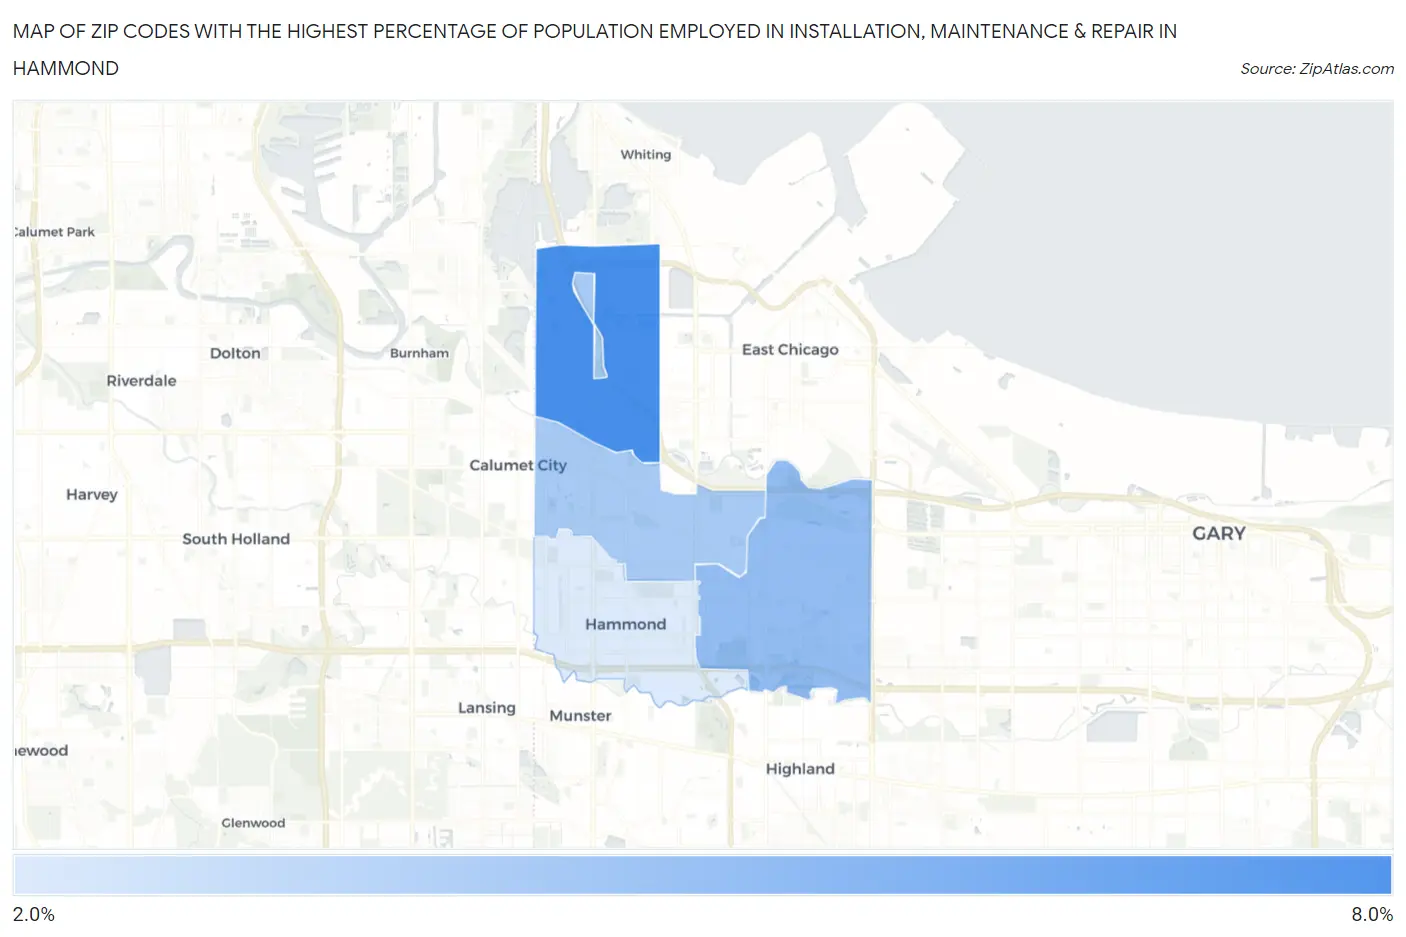
Map of Zip Codes with the Highest Percentage of Population Employed in Installation, Maintenance & Repair in Hammond
2.9%
6.7%
Zip Codes with the Highest Percentage of Population Employed in Installation, Maintenance & Repair in Hammond, IN
| Zip Code | % Employed | vs State | vs National | |
| 1. | 46327 | 6.7% | 3.5%(+3.14)#147 | 3.1%(+3.61)#4,920 |
| 2. | 46323 | 4.7% | 3.5%(+1.21)#280 | 3.1%(+1.68)#9,513 |
| 3. | 46320 | 4.2% | 3.5%(+0.672)#347 | 3.1%(+1.15)#11,459 |
| 4. | 46324 | 2.9% | 3.5%(-0.670)#500 | 3.1%(-0.196)#17,653 |
1
Common Questions
What are the Top 3 Zip Codes with the Highest Percentage of Population Employed in Installation, Maintenance & Repair in Hammond, IN?
Top 3 Zip Codes with the Highest Percentage of Population Employed in Installation, Maintenance & Repair in Hammond, IN are:
What zip code has the Highest Percentage of Population Employed in Installation, Maintenance & Repair in Hammond, IN?
46327 has the Highest Percentage of Population Employed in Installation, Maintenance & Repair in Hammond, IN with 6.7%.
What is the Percentage of Population Employed in Installation, Maintenance & Repair in Hammond, IN?
Percentage of Population Employed in Installation, Maintenance & Repair in Hammond is 4.2%.
What is the Percentage of Population Employed in Installation, Maintenance & Repair in Indiana?
Percentage of Population Employed in Installation, Maintenance & Repair in Indiana is 3.5%.
What is the Percentage of Population Employed in Installation, Maintenance & Repair in the United States?
Percentage of Population Employed in Installation, Maintenance & Repair in the United States is 3.1%.