Zip Codes with the Highest Percentage of Population with a Degree in Arts and Humanities in Evansville, IN
RELATED REPORTS & OPTIONS
Arts and Humanities
Evansville
Compare Zip Codes
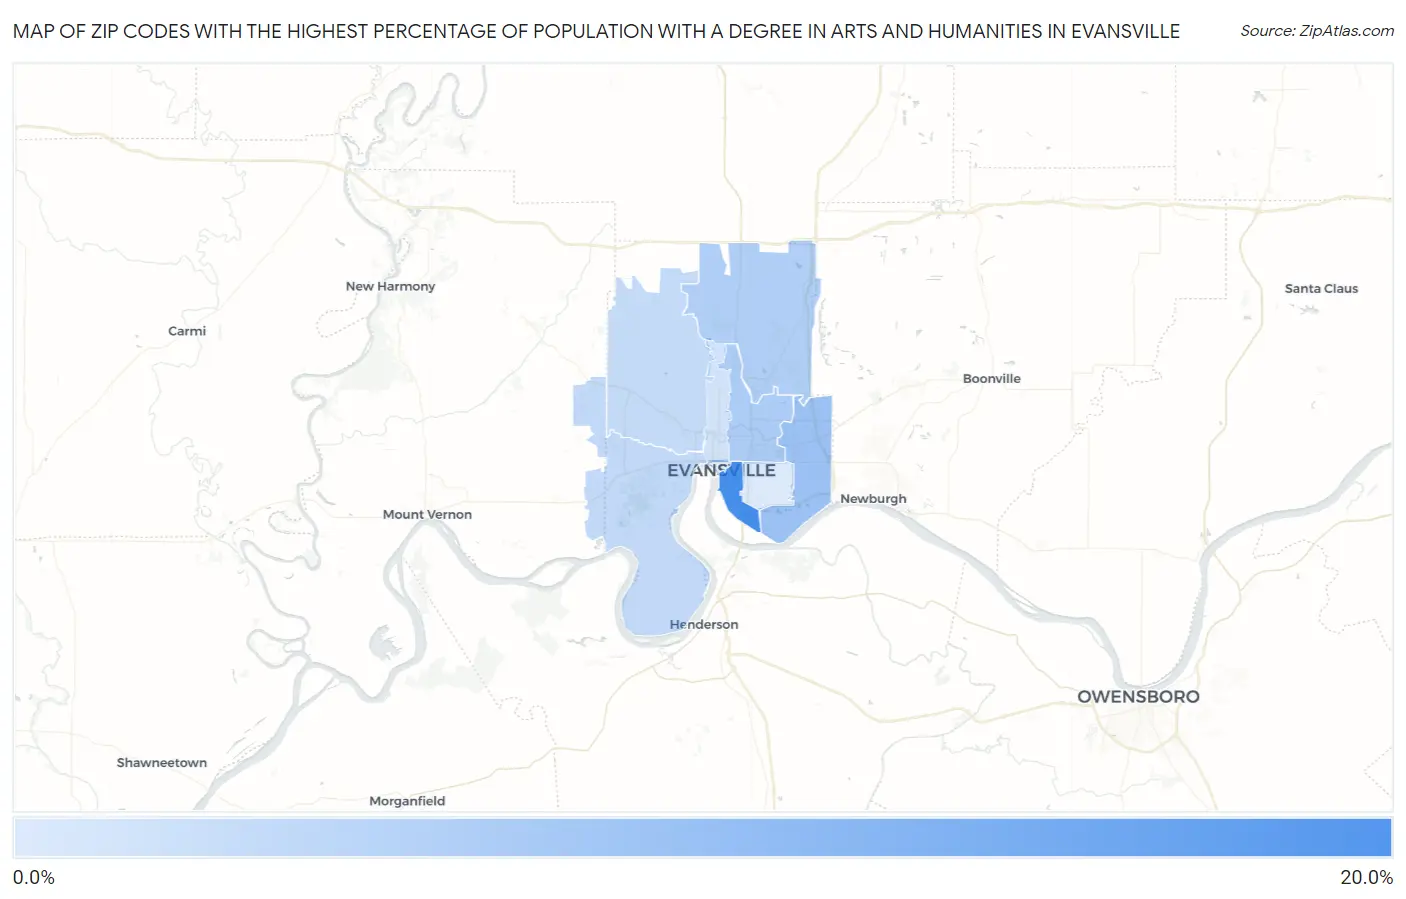
Map of Zip Codes with the Highest Percentage of Population with a Degree in Arts and Humanities in Evansville
4.1%
15.6%
Zip Codes with the Highest Percentage of Population with a Degree in Arts and Humanities in Evansville, IN
| Zip Code | % Graduates | vs State | vs National | |
| 1. | 47713 | 15.6% | 6.3%(+9.26)#64 | 6.0%(+9.57)#2,471 |
| 2. | 47715 | 9.0% | 6.3%(+2.69)#174 | 6.0%(+3.00)#7,746 |
| 3. | 47711 | 7.7% | 6.3%(+1.37)#235 | 6.0%(+1.68)#10,359 |
| 4. | 47725 | 7.3% | 6.3%(+0.972)#256 | 6.0%(+1.28)#11,270 |
| 5. | 47712 | 6.1% | 6.3%(-0.186)#323 | 6.0%(+0.123)#14,342 |
| 6. | 47720 | 6.0% | 6.3%(-0.345)#338 | 6.0%(-0.036)#14,778 |
| 7. | 47710 | 5.0% | 6.3%(-1.28)#405 | 6.0%(-0.972)#17,507 |
| 8. | 47714 | 4.1% | 6.3%(-2.19)#465 | 6.0%(-1.88)#20,028 |
1
Common Questions
What are the Top 5 Zip Codes with the Highest Percentage of Population with a Degree in Arts and Humanities in Evansville, IN?
Top 5 Zip Codes with the Highest Percentage of Population with a Degree in Arts and Humanities in Evansville, IN are:
What zip code has the Highest Percentage of Population with a Degree in Arts and Humanities in Evansville, IN?
47713 has the Highest Percentage of Population with a Degree in Arts and Humanities in Evansville, IN with 15.6%.
What is the Percentage of Population with a Degree in Arts and Humanities in Evansville, IN?
Percentage of Population with a Degree in Arts and Humanities in Evansville is 6.3%.
What is the Percentage of Population with a Degree in Arts and Humanities in Indiana?
Percentage of Population with a Degree in Arts and Humanities in Indiana is 6.3%.
What is the Percentage of Population with a Degree in Arts and Humanities in the United States?
Percentage of Population with a Degree in Arts and Humanities in the United States is 6.0%.