Zip Codes with the Highest Percentage of Population Employed in Office & Administration in Evansville, IN
RELATED REPORTS & OPTIONS
Office & Administration
Evansville
Compare Zip Codes
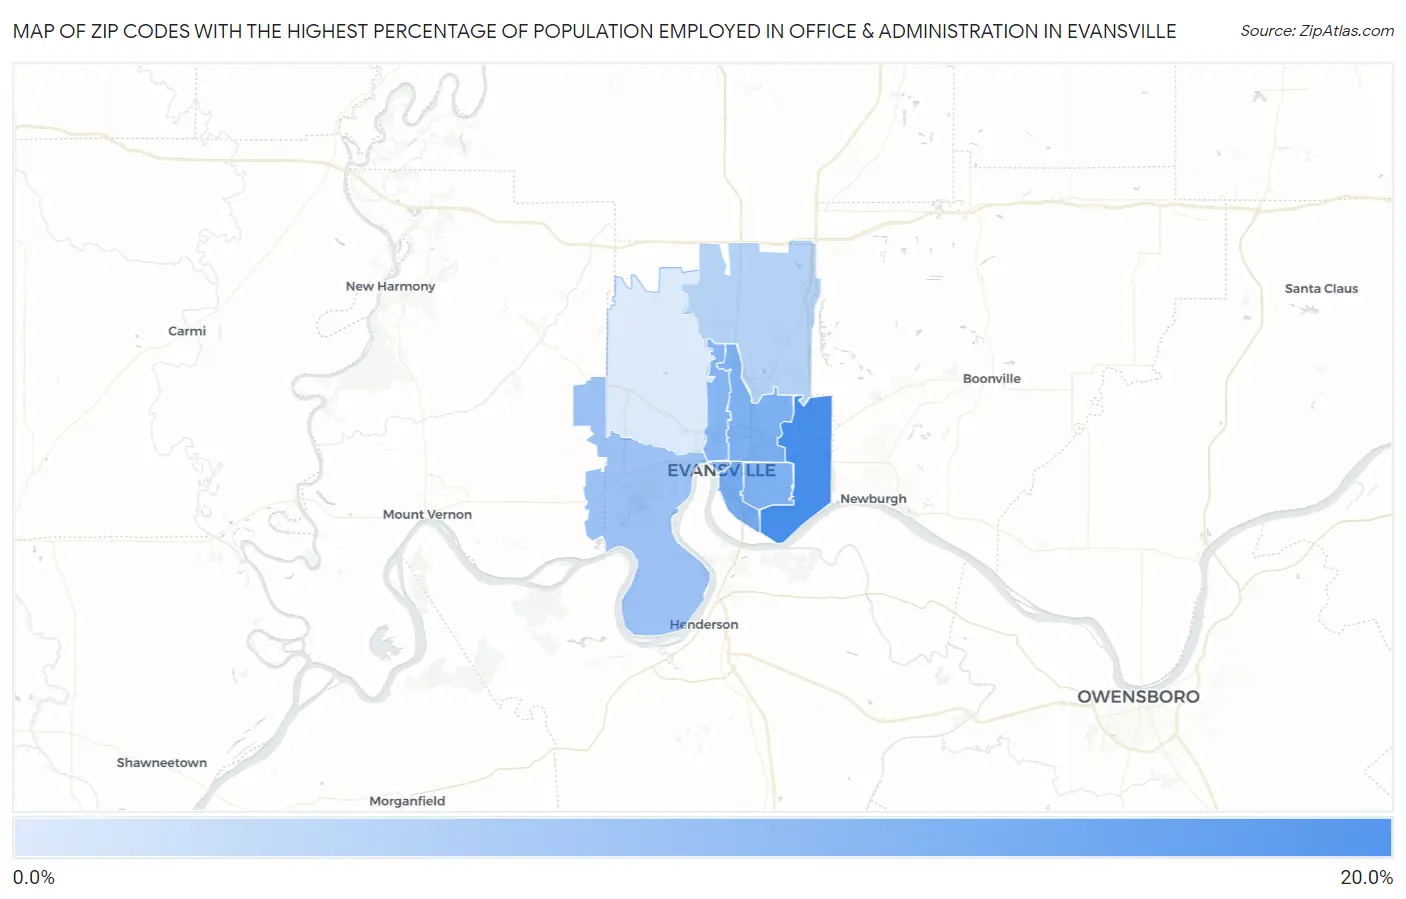
Map of Zip Codes with the Highest Percentage of Population Employed in Office & Administration in Evansville
6.5%
15.3%
Zip Codes with the Highest Percentage of Population Employed in Office & Administration in Evansville, IN
| Zip Code | % Employed | vs State | vs National | |
| 1. | 47715 | 15.3% | 11.0%(+4.29)#82 | 10.9%(+4.43)#4,228 |
| 2. | 47713 | 12.5% | 11.0%(+1.51)#190 | 10.9%(+1.64)#9,314 |
| 3. | 47711 | 12.1% | 11.0%(+1.08)#221 | 10.9%(+1.21)#10,528 |
| 4. | 47714 | 12.0% | 11.0%(+1.01)#230 | 10.9%(+1.14)#10,758 |
| 5. | 47710 | 11.5% | 11.0%(+0.542)#273 | 10.9%(+0.673)#12,177 |
| 6. | 47708 | 11.0% | 11.0%(-0.019)#311 | 10.9%(+0.113)#13,928 |
| 7. | 47712 | 10.2% | 11.0%(-0.802)#384 | 10.9%(-0.670)#16,520 |
| 8. | 47725 | 8.7% | 11.0%(-2.27)#505 | 10.9%(-2.14)#21,109 |
| 9. | 47720 | 6.5% | 11.0%(-4.45)#627 | 10.9%(-4.32)#26,028 |
1
Common Questions
What are the Top 5 Zip Codes with the Highest Percentage of Population Employed in Office & Administration in Evansville, IN?
Top 5 Zip Codes with the Highest Percentage of Population Employed in Office & Administration in Evansville, IN are:
What zip code has the Highest Percentage of Population Employed in Office & Administration in Evansville, IN?
47715 has the Highest Percentage of Population Employed in Office & Administration in Evansville, IN with 15.3%.
What is the Percentage of Population Employed in Office & Administration in Evansville, IN?
Percentage of Population Employed in Office & Administration in Evansville is 12.9%.
What is the Percentage of Population Employed in Office & Administration in Indiana?
Percentage of Population Employed in Office & Administration in Indiana is 11.0%.
What is the Percentage of Population Employed in Office & Administration in the United States?
Percentage of Population Employed in Office & Administration in the United States is 10.9%.