Wood River, IL Map & Demographics
Wood River Map
Wood River Overview
$31,582
PER CAPITA INCOME
$67,115
AVG FAMILY INCOME
$58,813
AVG HOUSEHOLD INCOME
22.4%
WAGE / INCOME GAP [ % ]
77.6¢/ $1
WAGE / INCOME GAP [ $ ]
0.42
INEQUALITY / GINI INDEX
10,313
TOTAL POPULATION
4,975
MALE POPULATION
5,338
FEMALE POPULATION
93.20
MALES / 100 FEMALES
107.30
FEMALES / 100 MALES
34.6
MEDIAN AGE
2.8
AVG FAMILY SIZE
2.3
AVG HOUSEHOLD SIZE
5,430
LABOR FORCE [ PEOPLE ]
67.1%
PERCENT IN LABOR FORCE
6.1%
UNEMPLOYMENT RATE
Wood River Zip Codes
Wood River Area Codes
Income in Wood River
Income Overview in Wood River
Per Capita Income in Wood River is $31,582, while median incomes of families and households are $67,115 and $58,813 respectively.
| Characteristic | Number | Measure |
| Per Capita Income | 10,313 | $31,582 |
| Median Family Income | 2,682 | $67,115 |
| Mean Family Income | 2,682 | $77,152 |
| Median Household Income | 4,378 | $58,813 |
| Mean Household Income | 4,378 | $72,817 |
| Income Deficit | 2,682 | $0 |
| Wage / Income Gap (%) | 10,313 | 22.36% |
| Wage / Income Gap ($) | 10,313 | 77.64¢ per $1 |
| Gini / Inequality Index | 10,313 | 0.42 |
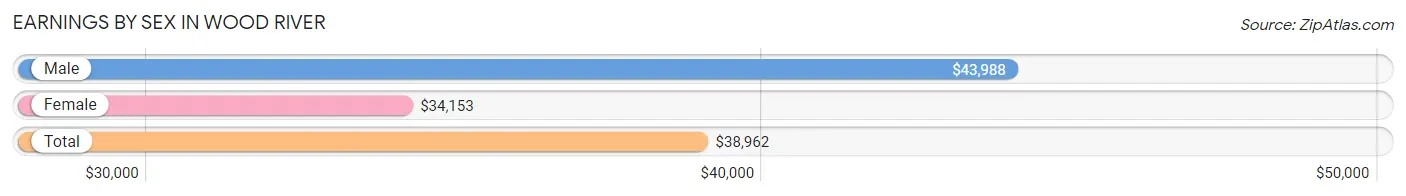
Earnings by Sex in Wood River
Average Earnings in Wood River are $38,962, $43,988 for men and $34,153 for women, a difference of 22.4%.
| Sex | Number | Average Earnings |
| Male | 2,677 (49.2%) | $43,988 |
| Female | 2,766 (50.8%) | $34,153 |
| Total | 5,443 (100.0%) | $38,962 |
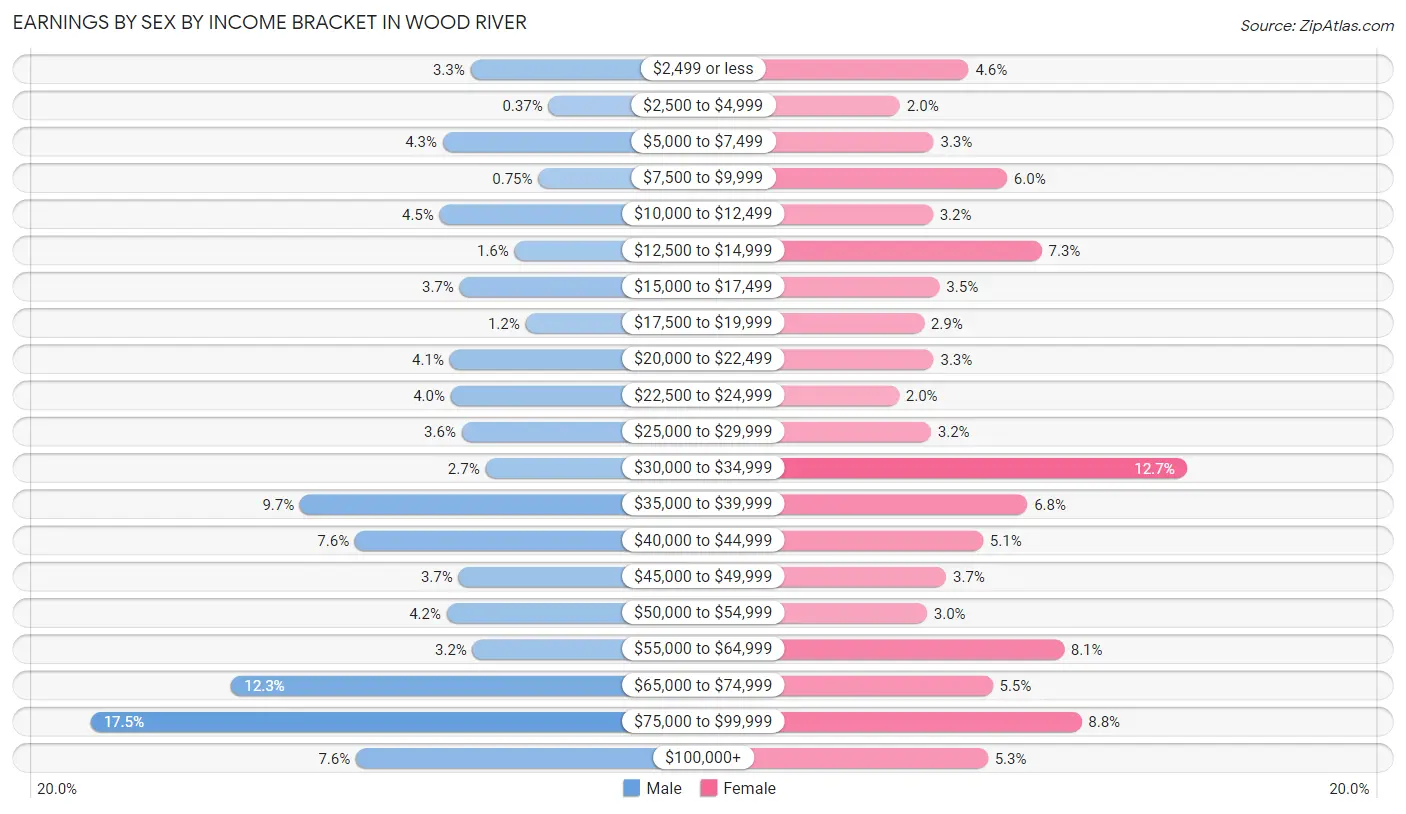
Earnings by Sex by Income Bracket in Wood River
The most common earnings brackets in Wood River are $75,000 to $99,999 for men (469 | 17.5%) and $30,000 to $34,999 for women (352 | 12.7%).
| Income | Male | Female |
| $2,499 or less | 88 (3.3%) | 126 (4.6%) |
| $2,500 to $4,999 | 10 (0.4%) | 55 (2.0%) |
| $5,000 to $7,499 | 116 (4.3%) | 90 (3.3%) |
| $7,500 to $9,999 | 20 (0.7%) | 166 (6.0%) |
| $10,000 to $12,499 | 119 (4.4%) | 89 (3.2%) |
| $12,500 to $14,999 | 44 (1.6%) | 202 (7.3%) |
| $15,000 to $17,499 | 99 (3.7%) | 96 (3.5%) |
| $17,500 to $19,999 | 33 (1.2%) | 80 (2.9%) |
| $20,000 to $22,499 | 109 (4.1%) | 90 (3.3%) |
| $22,500 to $24,999 | 108 (4.0%) | 54 (1.9%) |
| $25,000 to $29,999 | 97 (3.6%) | 87 (3.2%) |
| $30,000 to $34,999 | 73 (2.7%) | 352 (12.7%) |
| $35,000 to $39,999 | 259 (9.7%) | 187 (6.8%) |
| $40,000 to $44,999 | 204 (7.6%) | 141 (5.1%) |
| $45,000 to $49,999 | 100 (3.7%) | 103 (3.7%) |
| $50,000 to $54,999 | 112 (4.2%) | 83 (3.0%) |
| $55,000 to $64,999 | 86 (3.2%) | 225 (8.1%) |
| $65,000 to $74,999 | 328 (12.2%) | 151 (5.5%) |
| $75,000 to $99,999 | 469 (17.5%) | 243 (8.8%) |
| $100,000+ | 203 (7.6%) | 146 (5.3%) |
| Total | 2,677 (100.0%) | 2,766 (100.0%) |
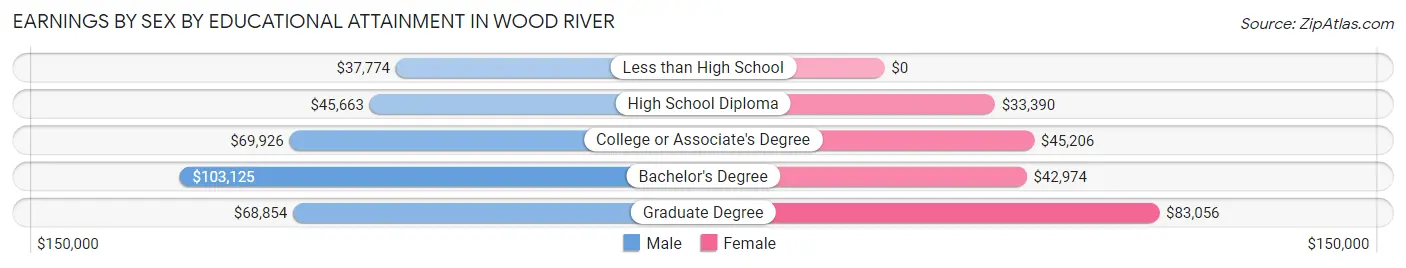
Earnings by Sex by Educational Attainment in Wood River
Average earnings in Wood River are $51,090 for men and $38,529 for women, a difference of 24.6%. Men with an educational attainment of bachelor's degree enjoy the highest average annual earnings of $103,125, while those with less than high school education earn the least with $37,774. Women with an educational attainment of graduate degree earn the most with the average annual earnings of $83,056, while those with high school diploma education have the smallest earnings of $33,390.
| Educational Attainment | Male Income | Female Income |
| Less than High School | $37,774 | $0 |
| High School Diploma | $45,663 | $33,390 |
| College or Associate's Degree | $69,926 | $45,206 |
| Bachelor's Degree | $103,125 | $42,974 |
| Graduate Degree | $68,854 | $83,056 |
| Total | $51,090 | $38,529 |
Family Income in Wood River
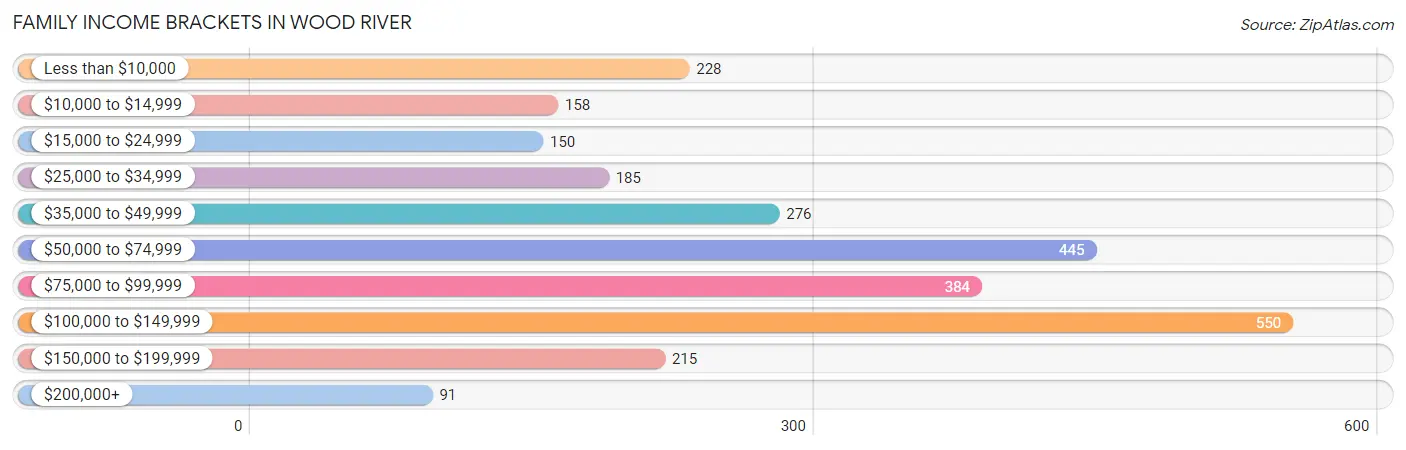
Family Income Brackets in Wood River
According to the Wood River family income data, there are 550 families falling into the $100,000 to $149,999 income range, which is the most common income bracket and makes up 20.5% of all families. Conversely, the $200,000+ income bracket is the least frequent group with only 91 families (3.4%) belonging to this category.
| Income Bracket | # Families | % Families |
| Less than $10,000 | 228 | 8.5% |
| $10,000 to $14,999 | 158 | 5.9% |
| $15,000 to $24,999 | 150 | 5.6% |
| $25,000 to $34,999 | 185 | 6.9% |
| $35,000 to $49,999 | 276 | 10.3% |
| $50,000 to $74,999 | 445 | 16.6% |
| $75,000 to $99,999 | 384 | 14.3% |
| $100,000 to $149,999 | 550 | 20.5% |
| $150,000 to $199,999 | 215 | 8.0% |
| $200,000+ | 91 | 3.4% |
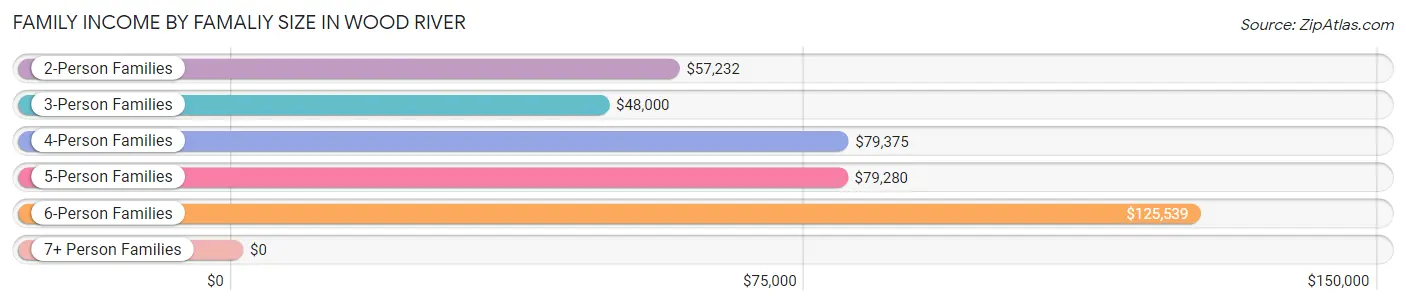
Family Income by Famaliy Size in Wood River
6-person families (91 | 3.4%) account for the highest median family income in Wood River with $125,539 per family, while 2-person families (1,477 | 55.1%) have the highest median income of $28,616 per family member.
| Income Bracket | # Families | Median Income |
| 2-Person Families | 1,477 (55.1%) | $57,232 |
| 3-Person Families | 518 (19.3%) | $48,000 |
| 4-Person Families | 451 (16.8%) | $79,375 |
| 5-Person Families | 145 (5.4%) | $79,280 |
| 6-Person Families | 91 (3.4%) | $125,539 |
| 7+ Person Families | 0 (0.0%) | $0 |
| Total | 2,682 (100.0%) | $67,115 |
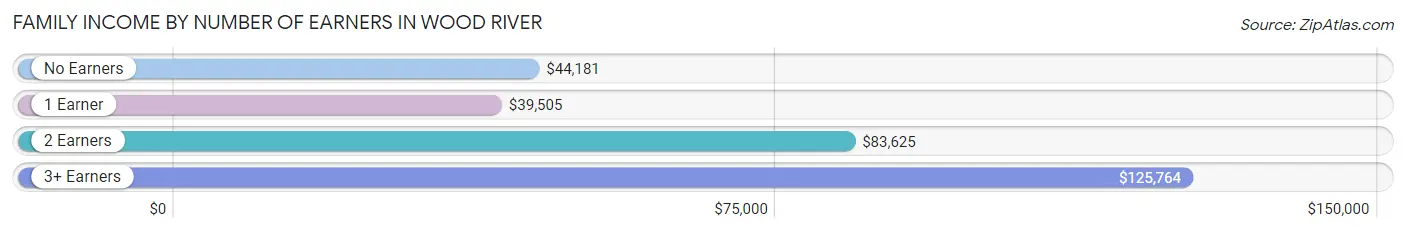
Family Income by Number of Earners in Wood River
The median family income in Wood River is $67,115, with families comprising 3+ earners (176) having the highest median family income of $125,764, while families with 1 earner (1,029) have the lowest median family income of $39,505, accounting for 6.6% and 38.4% of families, respectively.
| Number of Earners | # Families | Median Income |
| No Earners | 465 (17.3%) | $44,181 |
| 1 Earner | 1,029 (38.4%) | $39,505 |
| 2 Earners | 1,012 (37.7%) | $83,625 |
| 3+ Earners | 176 (6.6%) | $125,764 |
| Total | 2,682 (100.0%) | $67,115 |
Household Income in Wood River
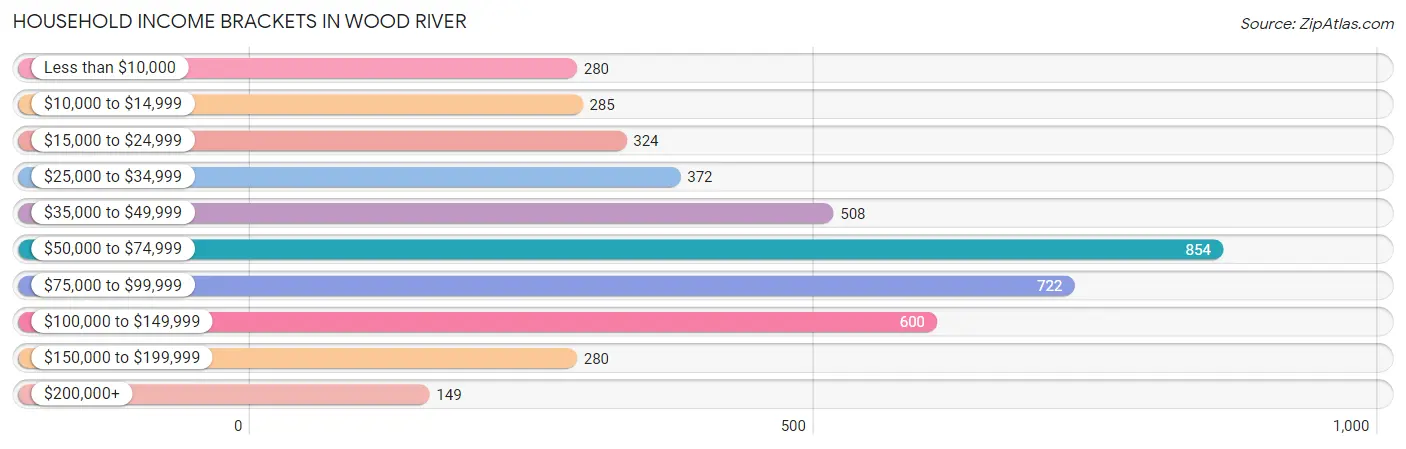
Household Income Brackets in Wood River
With 854 households falling in the category, the $50,000 to $74,999 income range is the most frequent in Wood River, accounting for 19.5% of all households. In contrast, only 149 households (3.4%) fall into the $200,000+ income bracket, making it the least populous group.
| Income Bracket | # Households | % Households |
| Less than $10,000 | 280 | 6.4% |
| $10,000 to $14,999 | 285 | 6.5% |
| $15,000 to $24,999 | 324 | 7.4% |
| $25,000 to $34,999 | 372 | 8.5% |
| $35,000 to $49,999 | 508 | 11.6% |
| $50,000 to $74,999 | 854 | 19.5% |
| $75,000 to $99,999 | 722 | 16.5% |
| $100,000 to $149,999 | 600 | 13.7% |
| $150,000 to $199,999 | 280 | 6.4% |
| $200,000+ | 149 | 3.4% |
Household Income by Householder Age in Wood River
The median household income in Wood River is $58,813, with the highest median household income of $69,970 found in the 45 to 64 years age bracket for the primary householder. A total of 1,544 households (35.3%) fall into this category. Meanwhile, the 15 to 24 years age bracket for the primary householder has the lowest median household income of $0, with 268 households (6.1%) in this group.
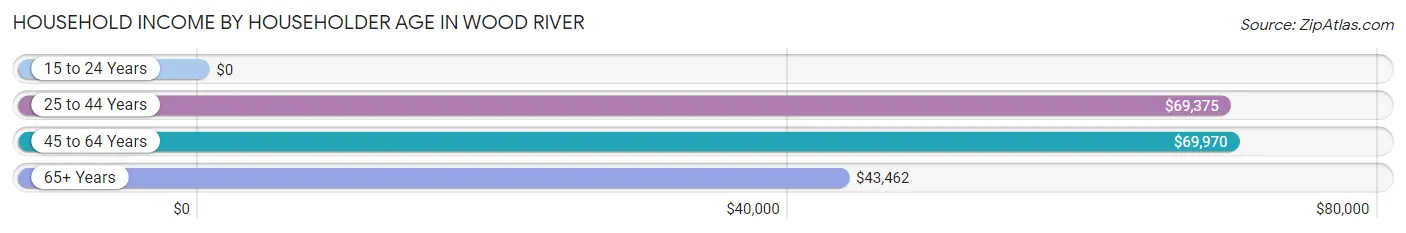
| Income Bracket | # Households | Median Income |
| 15 to 24 Years | 268 (6.1%) | $0 |
| 25 to 44 Years | 1,676 (38.3%) | $69,375 |
| 45 to 64 Years | 1,544 (35.3%) | $69,970 |
| 65+ Years | 890 (20.3%) | $43,462 |
| Total | 4,378 (100.0%) | $58,813 |
Poverty in Wood River
Income Below Poverty by Sex and Age in Wood River
With 14.3% poverty level for males and 24.4% for females among the residents of Wood River, under 5 year old males and 15 year old females are the most vulnerable to poverty, with 129 males (40.6%) and 58 females (100.0%) in their respective age groups living below the poverty level.
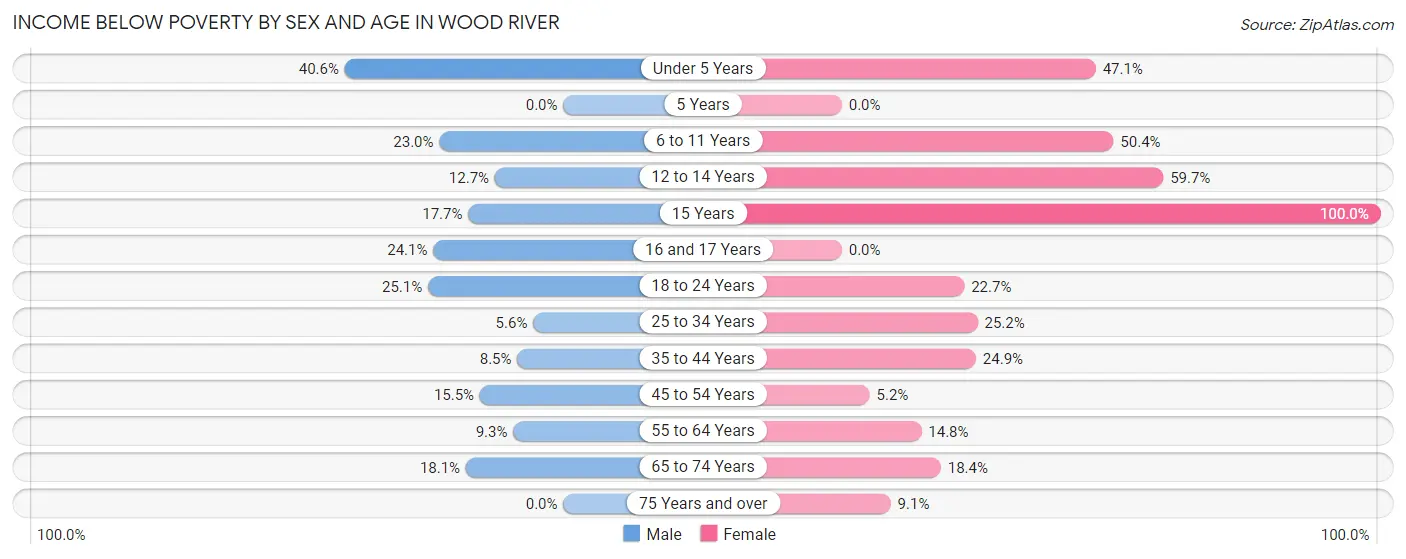
| Age Bracket | Male | Female |
| Under 5 Years | 129 (40.6%) | 148 (47.1%) |
| 5 Years | 0 (0.0%) | 0 (0.0%) |
| 6 to 11 Years | 96 (23.0%) | 241 (50.4%) |
| 12 to 14 Years | 16 (12.7%) | 71 (59.7%) |
| 15 Years | 6 (17.6%) | 58 (100.0%) |
| 16 and 17 Years | 28 (24.1%) | 0 (0.0%) |
| 18 to 24 Years | 117 (25.1%) | 143 (22.7%) |
| 25 to 34 Years | 52 (5.6%) | 199 (25.2%) |
| 35 to 44 Years | 49 (8.5%) | 167 (24.9%) |
| 45 to 54 Years | 76 (15.5%) | 31 (5.2%) |
| 55 to 64 Years | 65 (9.3%) | 87 (14.8%) |
| 65 to 74 Years | 62 (18.1%) | 72 (18.4%) |
| 75 Years and over | 0 (0.0%) | 33 (9.1%) |
| Total | 696 (14.3%) | 1,250 (24.4%) |
Income Above Poverty by Sex and Age in Wood River
According to the poverty statistics in Wood River, males aged 5 years and females aged 5 years are the age groups that are most secure financially, with 100.0% of males and 100.0% of females in these age groups living above the poverty line.
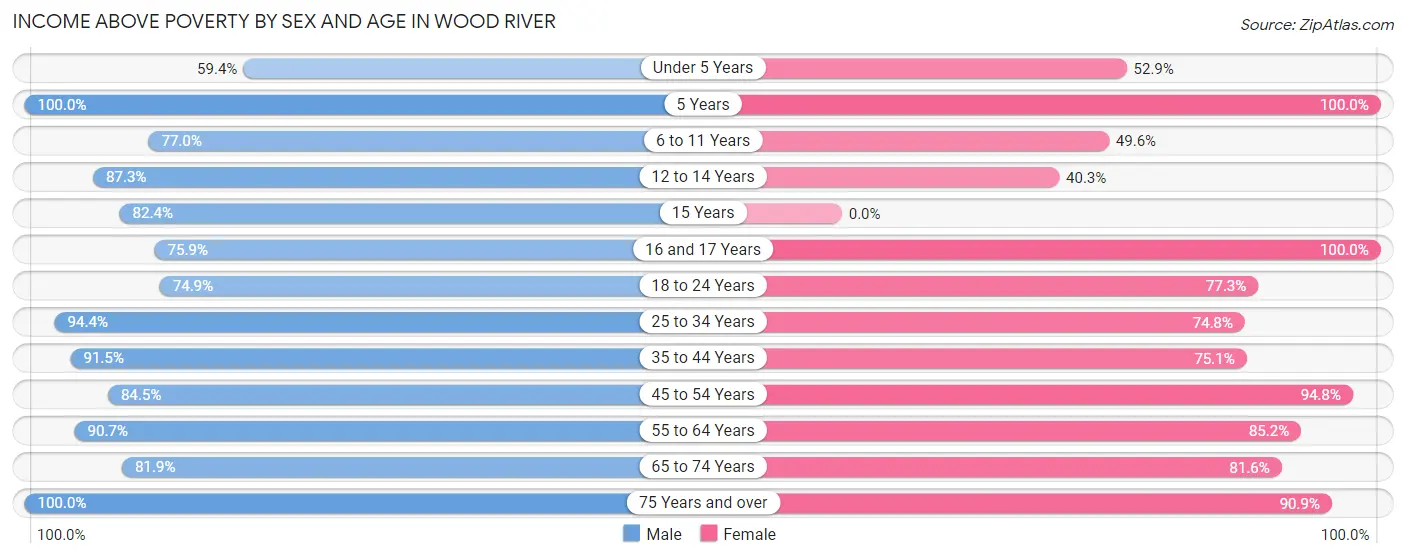
| Age Bracket | Male | Female |
| Under 5 Years | 189 (59.4%) | 166 (52.9%) |
| 5 Years | 70 (100.0%) | 30 (100.0%) |
| 6 to 11 Years | 321 (77.0%) | 237 (49.6%) |
| 12 to 14 Years | 110 (87.3%) | 48 (40.3%) |
| 15 Years | 28 (82.4%) | 0 (0.0%) |
| 16 and 17 Years | 88 (75.9%) | 82 (100.0%) |
| 18 to 24 Years | 349 (74.9%) | 486 (77.3%) |
| 25 to 34 Years | 878 (94.4%) | 591 (74.8%) |
| 35 to 44 Years | 525 (91.5%) | 504 (75.1%) |
| 45 to 54 Years | 415 (84.5%) | 570 (94.8%) |
| 55 to 64 Years | 635 (90.7%) | 502 (85.2%) |
| 65 to 74 Years | 281 (81.9%) | 320 (81.6%) |
| 75 Years and over | 287 (100.0%) | 331 (90.9%) |
| Total | 4,176 (85.7%) | 3,867 (75.6%) |
Income Below Poverty Among Married-Couple Families in Wood River
The poverty statistics for married-couple families in Wood River show that 4.2% or 61 of the total 1,458 families live below the poverty line. Families with 3 or 4 children have the highest poverty rate of 23.7%, comprising of 28 families. On the other hand, families with no children have the lowest poverty rate of 1.5%, which includes 13 families.
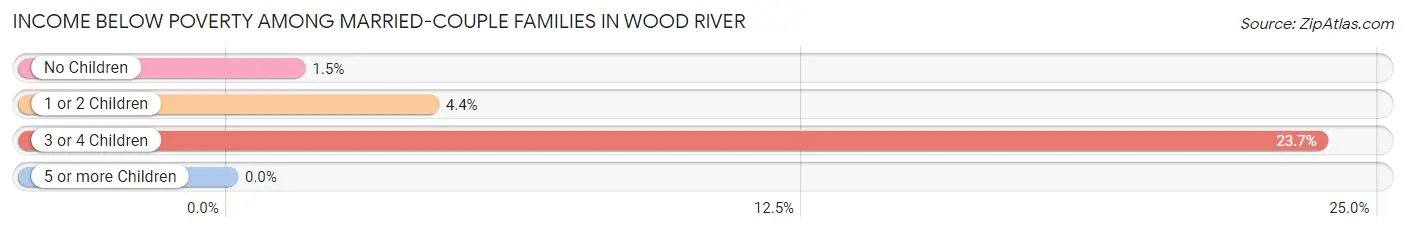
| Children | Above Poverty | Below Poverty |
| No Children | 869 (98.5%) | 13 (1.5%) |
| 1 or 2 Children | 438 (95.6%) | 20 (4.4%) |
| 3 or 4 Children | 90 (76.3%) | 28 (23.7%) |
| 5 or more Children | 0 (0.0%) | 0 (0.0%) |
| Total | 1,397 (95.8%) | 61 (4.2%) |
Income Below Poverty Among Single-Parent Households in Wood River
According to the poverty data in Wood River, 10.8% or 32 single-father households and 42.2% or 391 single-mother households are living below the poverty line. Among single-father households, those with no children have the highest poverty rate, with 32 households (14.8%) experiencing poverty. Likewise, among single-mother households, those with 3 or 4 children have the highest poverty rate, with 97 households (79.5%) falling below the poverty line.
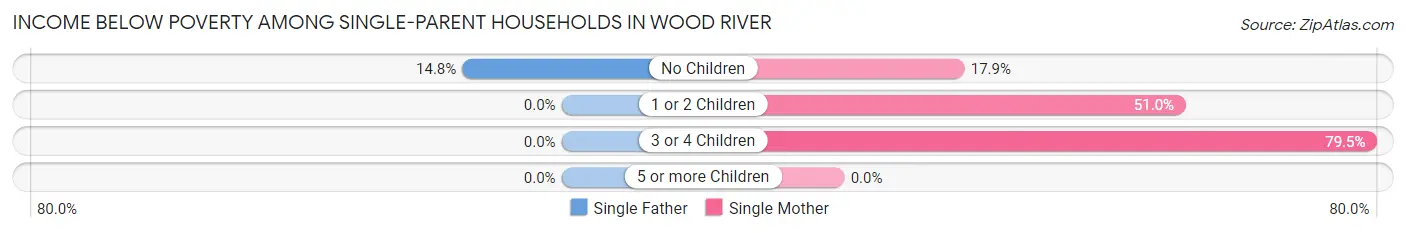
| Children | Single Father | Single Mother |
| No Children | 32 (14.8%) | 63 (17.9%) |
| 1 or 2 Children | 0 (0.0%) | 231 (51.0%) |
| 3 or 4 Children | 0 (0.0%) | 97 (79.5%) |
| 5 or more Children | 0 (0.0%) | 0 (0.0%) |
| Total | 32 (10.8%) | 391 (42.2%) |
Income Below Poverty Among Married-Couple vs Single-Parent Households in Wood River
The poverty data for Wood River shows that 61 of the married-couple family households (4.2%) and 423 of the single-parent households (34.6%) are living below the poverty level. Within the married-couple family households, those with 3 or 4 children have the highest poverty rate, with 28 households (23.7%) falling below the poverty line. Among the single-parent households, those with 3 or 4 children have the highest poverty rate, with 97 household (79.5%) living below poverty.
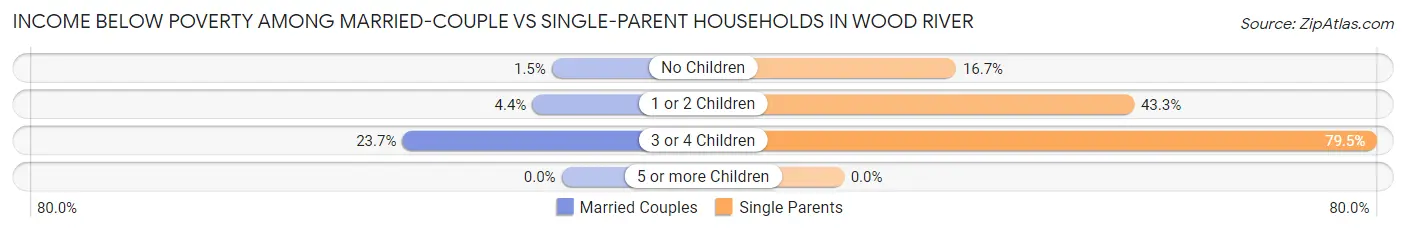
| Children | Married-Couple Families | Single-Parent Households |
| No Children | 13 (1.5%) | 95 (16.7%) |
| 1 or 2 Children | 20 (4.4%) | 231 (43.3%) |
| 3 or 4 Children | 28 (23.7%) | 97 (79.5%) |
| 5 or more Children | 0 (0.0%) | 0 (0.0%) |
| Total | 61 (4.2%) | 423 (34.6%) |
Race in Wood River
The most populous races in Wood River are White / Caucasian (8,976 | 87.0%), Black / African American (808 | 7.8%), and Two or more Races (483 | 4.7%).
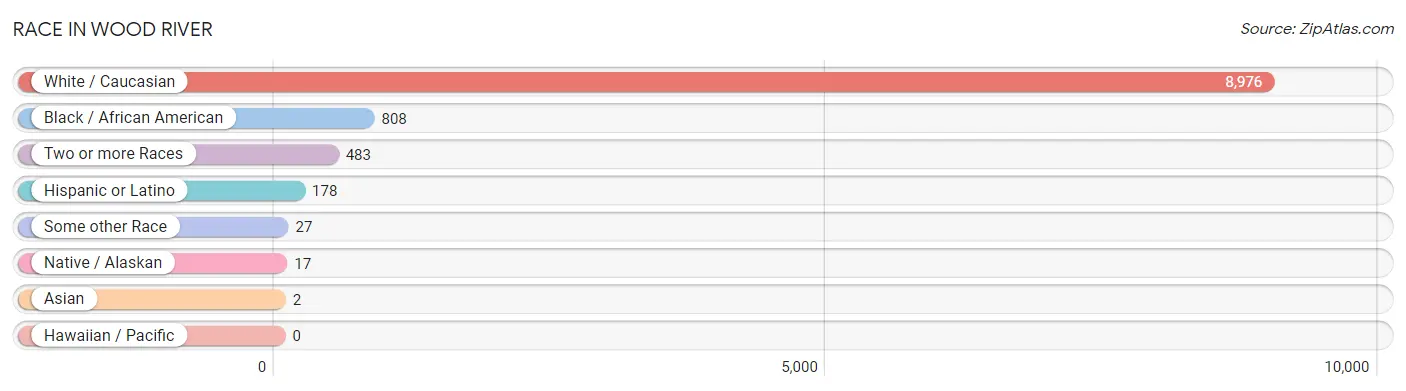
| Race | # Population | % Population |
| Asian | 2 | 0.0% |
| Black / African American | 808 | 7.8% |
| Hawaiian / Pacific | 0 | 0.0% |
| Hispanic or Latino | 178 | 1.7% |
| Native / Alaskan | 17 | 0.2% |
| White / Caucasian | 8,976 | 87.0% |
| Two or more Races | 483 | 4.7% |
| Some other Race | 27 | 0.3% |
| Total | 10,313 | 100.0% |
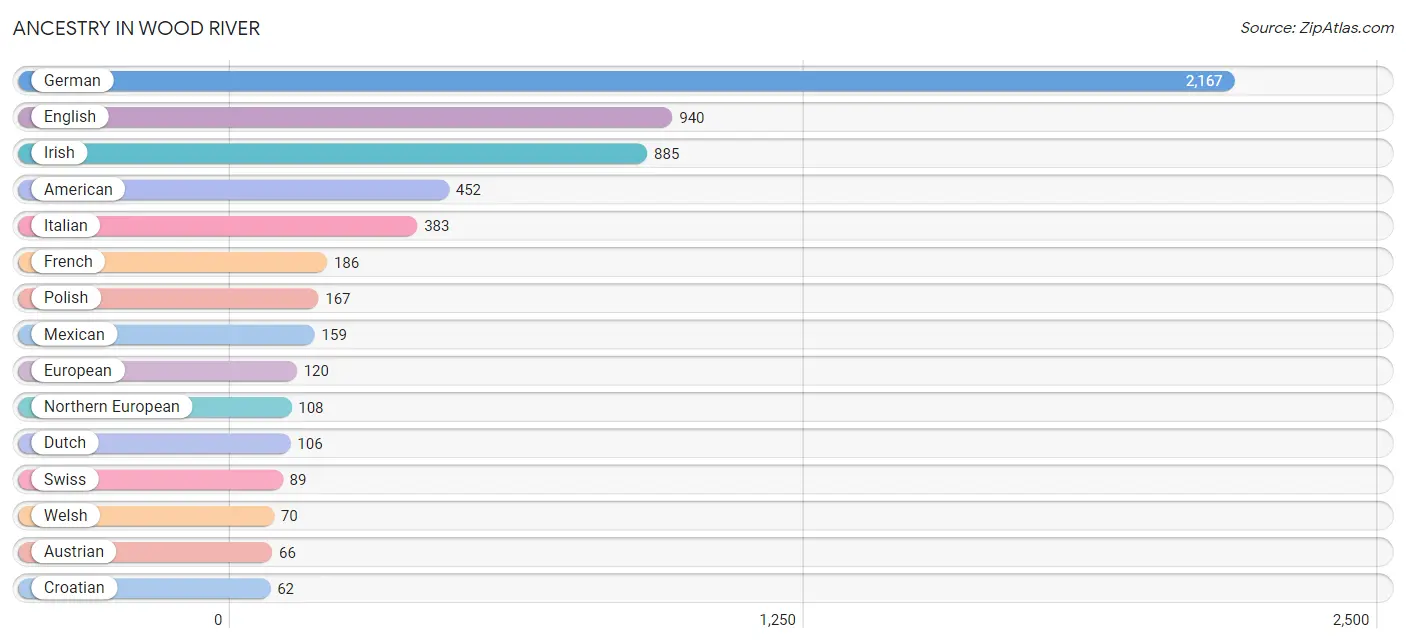
Ancestry in Wood River
The most populous ancestries reported in Wood River are German (2,167 | 21.0%), English (940 | 9.1%), Irish (885 | 8.6%), American (452 | 4.4%), and Italian (383 | 3.7%), together accounting for 46.8% of all Wood River residents.
| Ancestry | # Population | % Population |
| African | 15 | 0.2% |
| American | 452 | 4.4% |
| Austrian | 66 | 0.6% |
| Bhutanese | 10 | 0.1% |
| Blackfeet | 6 | 0.1% |
| British | 15 | 0.2% |
| Burmese | 8 | 0.1% |
| Cherokee | 21 | 0.2% |
| Chippewa | 2 | 0.0% |
| Colombian | 11 | 0.1% |
| Croatian | 62 | 0.6% |
| Czech | 10 | 0.1% |
| Czechoslovakian | 5 | 0.1% |
| Dutch | 106 | 1.0% |
| Eastern European | 38 | 0.4% |
| English | 940 | 9.1% |
| European | 120 | 1.2% |
| French | 186 | 1.8% |
| French Canadian | 4 | 0.0% |
| German | 2,167 | 21.0% |
| Hungarian | 22 | 0.2% |
| Iranian | 14 | 0.1% |
| Irish | 885 | 8.6% |
| Italian | 383 | 3.7% |
| Mexican | 159 | 1.5% |
| Mexican American Indian | 6 | 0.1% |
| Navajo | 12 | 0.1% |
| Northern European | 108 | 1.1% |
| Polish | 167 | 1.6% |
| Puerto Rican | 8 | 0.1% |
| Romanian | 14 | 0.1% |
| Russian | 14 | 0.1% |
| Scandinavian | 18 | 0.2% |
| Scotch-Irish | 18 | 0.2% |
| Scottish | 46 | 0.4% |
| Slovak | 8 | 0.1% |
| South American | 11 | 0.1% |
| Subsaharan African | 15 | 0.2% |
| Swedish | 46 | 0.4% |
| Swiss | 89 | 0.9% |
| Thai | 4 | 0.0% |
| Ukrainian | 22 | 0.2% |
| Welsh | 70 | 0.7% |
| Yugoslavian | 11 | 0.1% | View All 44 Rows |
Immigrants in Wood River
The most numerous immigrant groups reported in Wood River came from Canada (31 | 0.3%), Latin America (21 | 0.2%), Europe (14 | 0.1%), Colombia (12 | 0.1%), and South America (12 | 0.1%), together accounting for 0.9% of all Wood River residents.
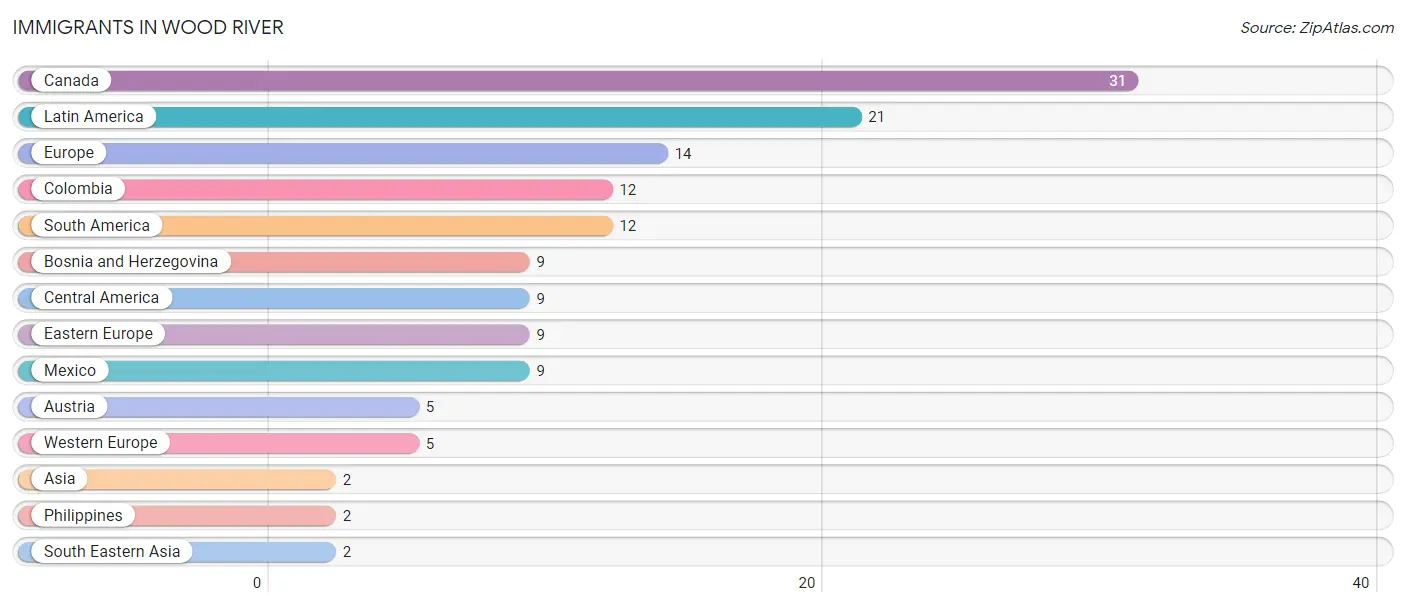
| Immigration Origin | # Population | % Population |
| Asia | 2 | 0.0% |
| Austria | 5 | 0.1% |
| Bosnia and Herzegovina | 9 | 0.1% |
| Canada | 31 | 0.3% |
| Central America | 9 | 0.1% |
| Colombia | 12 | 0.1% |
| Eastern Europe | 9 | 0.1% |
| Europe | 14 | 0.1% |
| Latin America | 21 | 0.2% |
| Mexico | 9 | 0.1% |
| Philippines | 2 | 0.0% |
| South America | 12 | 0.1% |
| South Eastern Asia | 2 | 0.0% |
| Western Europe | 5 | 0.1% | View All 14 Rows |
Sex and Age in Wood River
Sex and Age in Wood River
The most populous age groups in Wood River are 30 to 34 Years (542 | 10.9%) for men and 20 to 24 Years (549 | 10.3%) for women.
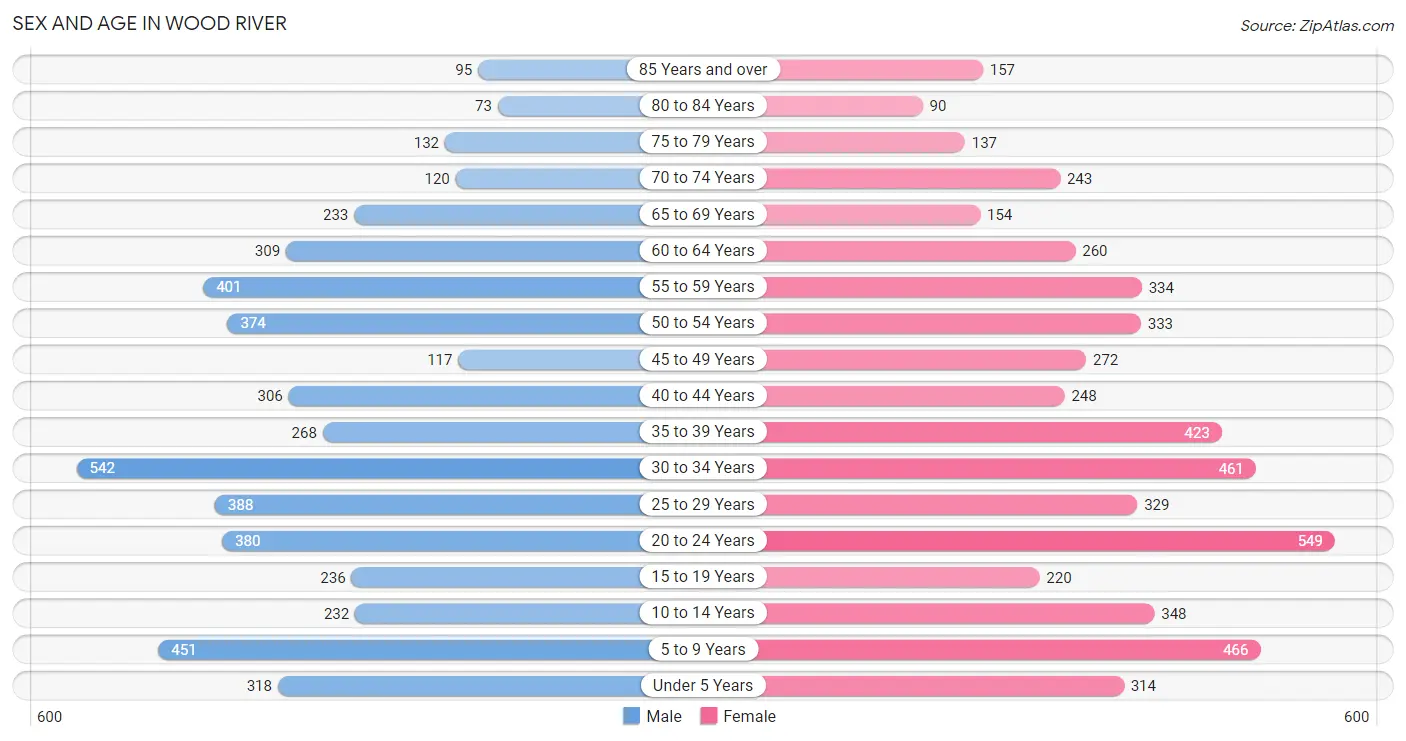
| Age Bracket | Male | Female |
| Under 5 Years | 318 (6.4%) | 314 (5.9%) |
| 5 to 9 Years | 451 (9.1%) | 466 (8.7%) |
| 10 to 14 Years | 232 (4.7%) | 348 (6.5%) |
| 15 to 19 Years | 236 (4.7%) | 220 (4.1%) |
| 20 to 24 Years | 380 (7.6%) | 549 (10.3%) |
| 25 to 29 Years | 388 (7.8%) | 329 (6.2%) |
| 30 to 34 Years | 542 (10.9%) | 461 (8.6%) |
| 35 to 39 Years | 268 (5.4%) | 423 (7.9%) |
| 40 to 44 Years | 306 (6.1%) | 248 (4.6%) |
| 45 to 49 Years | 117 (2.4%) | 272 (5.1%) |
| 50 to 54 Years | 374 (7.5%) | 333 (6.2%) |
| 55 to 59 Years | 401 (8.1%) | 334 (6.3%) |
| 60 to 64 Years | 309 (6.2%) | 260 (4.9%) |
| 65 to 69 Years | 233 (4.7%) | 154 (2.9%) |
| 70 to 74 Years | 120 (2.4%) | 243 (4.5%) |
| 75 to 79 Years | 132 (2.6%) | 137 (2.6%) |
| 80 to 84 Years | 73 (1.5%) | 90 (1.7%) |
| 85 Years and over | 95 (1.9%) | 157 (2.9%) |
| Total | 4,975 (100.0%) | 5,338 (100.0%) |
Families and Households in Wood River
Median Family Size in Wood River
The median family size in Wood River is 2.82 persons per family, with married-couple families (1,458 | 54.4%) accounting for the largest median family size of 3.02 persons per family. On the other hand, single male/father families (297 | 11.1%) represent the smallest median family size with 2.20 persons per family.
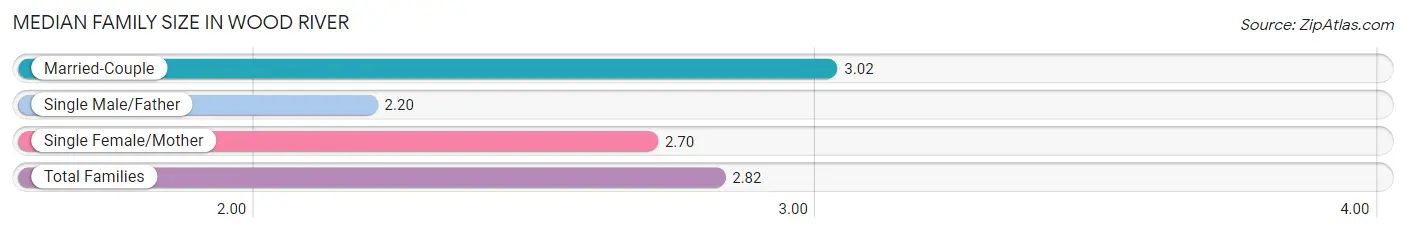
| Family Type | # Families | Family Size |
| Married-Couple | 1,458 (54.4%) | 3.02 |
| Single Male/Father | 297 (11.1%) | 2.20 |
| Single Female/Mother | 927 (34.6%) | 2.70 |
| Total Families | 2,682 (100.0%) | 2.82 |
Median Household Size in Wood River
The median household size in Wood River is 2.33 persons per household, with married-couple households (1,458 | 33.3%) accounting for the largest median household size of 3.06 persons per household. non-family households (1,696 | 38.7%) represent the smallest median household size with 1.30 persons per household.
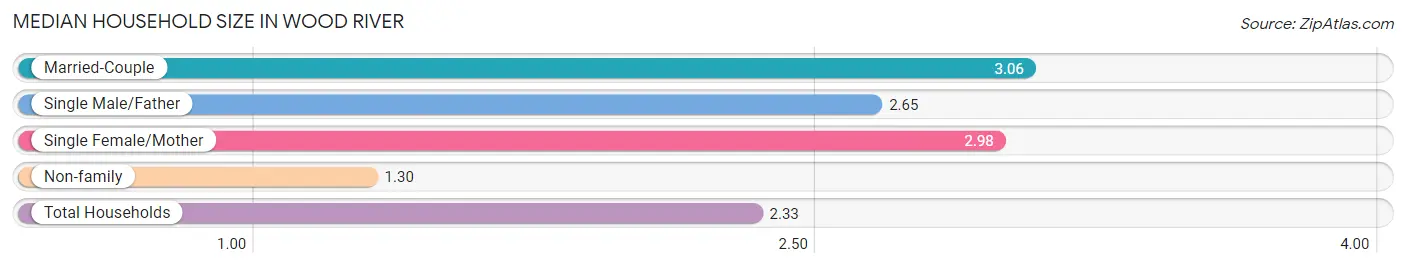
| Household Type | # Households | Household Size |
| Married-Couple | 1,458 (33.3%) | 3.06 |
| Single Male/Father | 297 (6.8%) | 2.65 |
| Single Female/Mother | 927 (21.2%) | 2.98 |
| Non-family | 1,696 (38.7%) | 1.30 |
| Total Households | 4,378 (100.0%) | 2.33 |
Household Size by Marriage Status in Wood River
Out of a total of 4,378 households in Wood River, 2,682 (61.3%) are family households, while 1,696 (38.7%) are nonfamily households. The most numerous type of family households are 2-person households, comprising 1,300, and the most common type of nonfamily households are 1-person households, comprising 1,399.
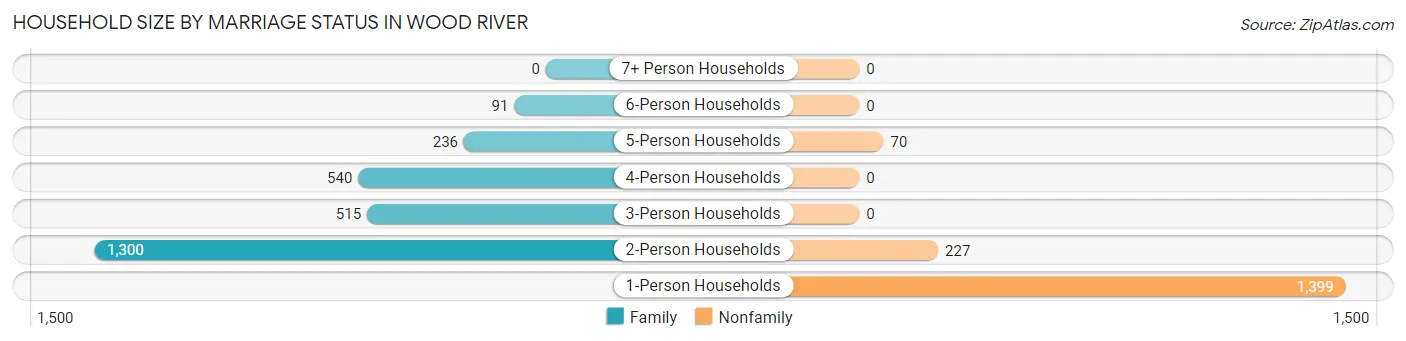
| Household Size | Family Households | Nonfamily Households |
| 1-Person Households | - | 1,399 (32.0%) |
| 2-Person Households | 1,300 (29.7%) | 227 (5.2%) |
| 3-Person Households | 515 (11.8%) | 0 (0.0%) |
| 4-Person Households | 540 (12.3%) | 0 (0.0%) |
| 5-Person Households | 236 (5.4%) | 70 (1.6%) |
| 6-Person Households | 91 (2.1%) | 0 (0.0%) |
| 7+ Person Households | 0 (0.0%) | 0 (0.0%) |
| Total | 2,682 (61.3%) | 1,696 (38.7%) |
Female Fertility in Wood River
Fertility by Age in Wood River
Average fertility rate in Wood River is 47.0 births per 1,000 women. Women in the age bracket of 35 to 50 years have the highest fertility rate with 60.0 births per 1,000 women. Women in the age bracket of 35 to 50 years acount for 50.8% of all women with births.
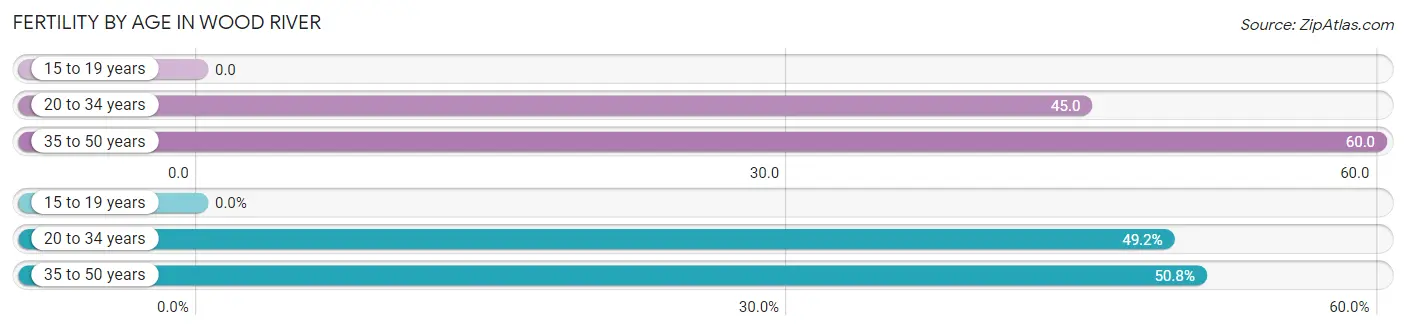
| Age Bracket | Women with Births | Births / 1,000 Women |
| 15 to 19 years | 0 (0.0%) | 0.0 |
| 20 to 34 years | 60 (49.2%) | 45.0 |
| 35 to 50 years | 62 (50.8%) | 60.0 |
| Total | 122 (100.0%) | 47.0 |
Fertility by Age by Marriage Status in Wood River
53.3% of women with births (122) in Wood River are married. The highest percentage of unmarried women with births falls into 35 to 50 years age bracket with 91.9% of them unmarried at the time of birth, while the lowest percentage of unmarried women with births belong to 20 to 34 years age bracket with 0.0% of them unmarried.
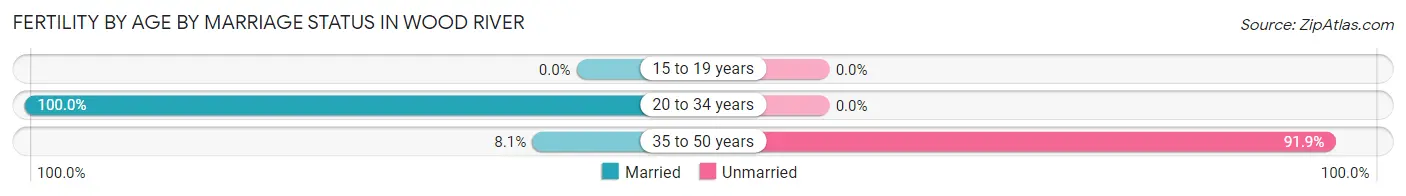
| Age Bracket | Married | Unmarried |
| 15 to 19 years | 0 (0.0%) | 0 (0.0%) |
| 20 to 34 years | 60 (100.0%) | 0 (0.0%) |
| 35 to 50 years | 5 (8.1%) | 57 (91.9%) |
| Total | 65 (53.3%) | 57 (46.7%) |
Fertility by Education in Wood River
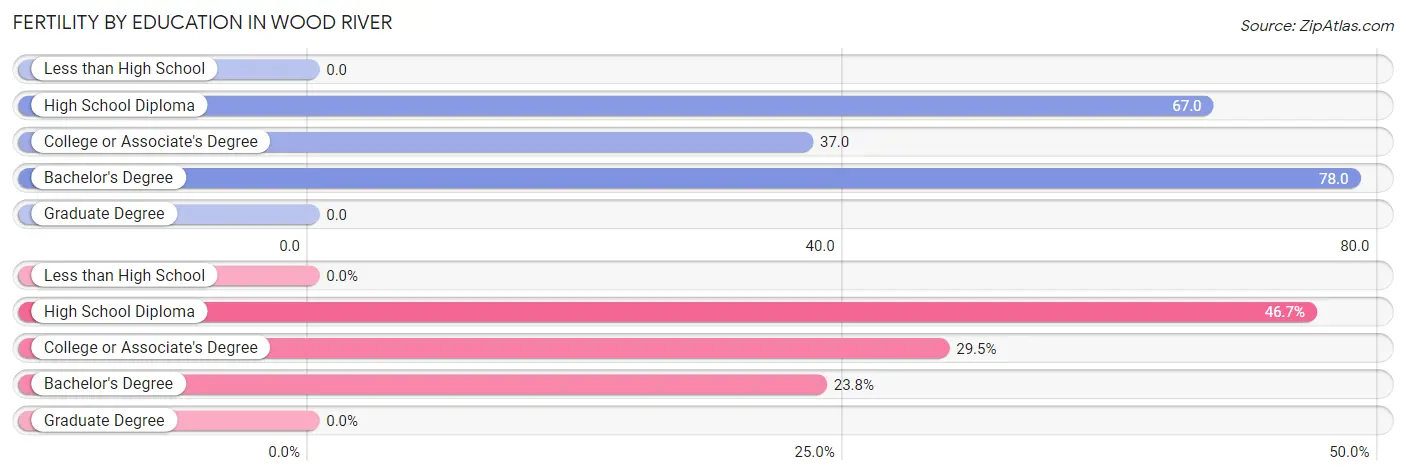
| Educational Attainment | Women with Births | Births / 1,000 Women |
| Less than High School | 0 (0.0%) | 0.0 |
| High School Diploma | 57 (46.7%) | 67.0 |
| College or Associate's Degree | 36 (29.5%) | 37.0 |
| Bachelor's Degree | 29 (23.8%) | 78.0 |
| Graduate Degree | 0 (0.0%) | 0.0 |
| Total | 122 (100.0%) | 47.0 |
Fertility by Education by Marriage Status in Wood River
46.7% of women with births in Wood River are unmarried. Women with the educational attainment of college or associate's degree are most likely to be married with 100.0% of them married at childbirth, while women with the educational attainment of high school diploma are least likely to be married with 100.0% of them unmarried at childbirth.
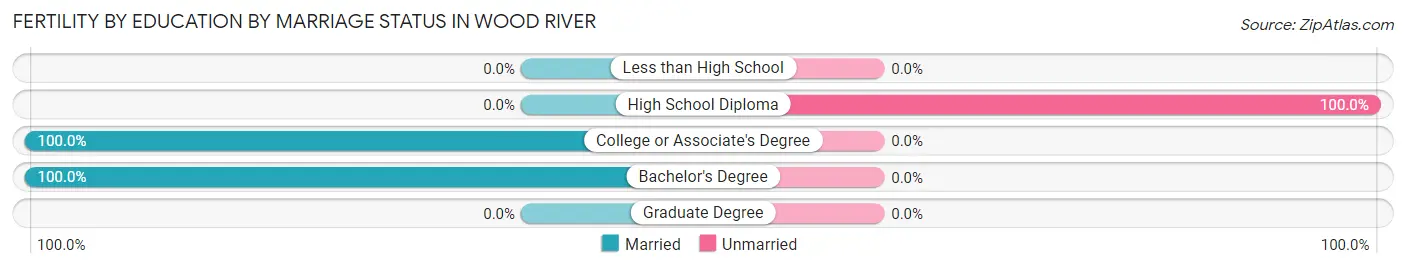
| Educational Attainment | Married | Unmarried |
| Less than High School | 0 (0.0%) | 0 (0.0%) |
| High School Diploma | 0 (0.0%) | 57 (100.0%) |
| College or Associate's Degree | 36 (100.0%) | 0 (0.0%) |
| Bachelor's Degree | 29 (100.0%) | 0 (0.0%) |
| Graduate Degree | 0 (0.0%) | 0 (0.0%) |
| Total | 65 (53.3%) | 57 (46.7%) |
Employment Characteristics in Wood River
Employment by Class of Employer in Wood River
Among the 4,827 employed individuals in Wood River, private company employees (3,721 | 77.1%), not-for-profit organizations (334 | 6.9%), and local government employees (316 | 6.6%) make up the most common classes of employment.
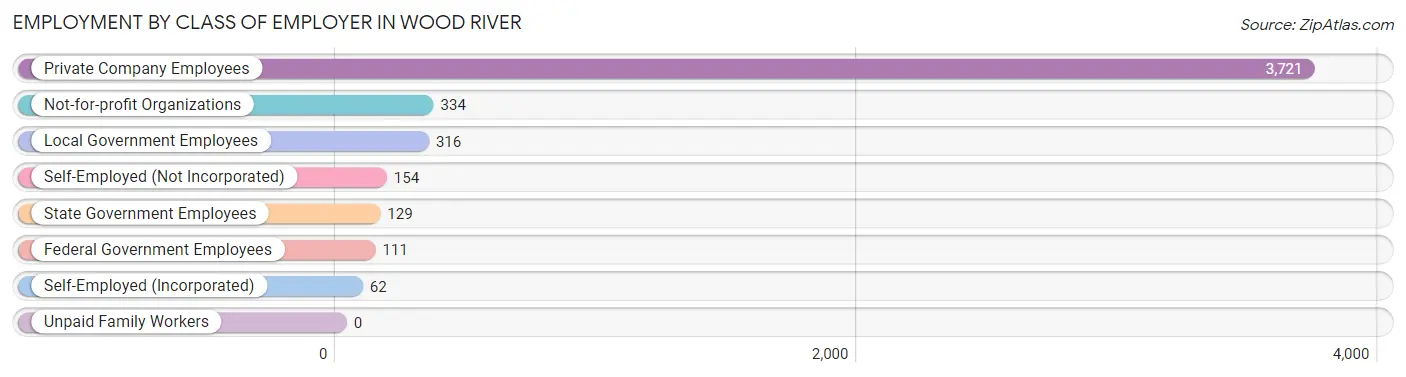
| Employer Class | # Employees | % Employees |
| Private Company Employees | 3,721 | 77.1% |
| Self-Employed (Incorporated) | 62 | 1.3% |
| Self-Employed (Not Incorporated) | 154 | 3.2% |
| Not-for-profit Organizations | 334 | 6.9% |
| Local Government Employees | 316 | 6.6% |
| State Government Employees | 129 | 2.7% |
| Federal Government Employees | 111 | 2.3% |
| Unpaid Family Workers | 0 | 0.0% |
| Total | 4,827 | 100.0% |
Employment Status by Age in Wood River
According to the labor force statistics for Wood River, out of the total population over 16 years of age (8,092), 67.1% or 5,430 individuals are in the labor force, with 6.1% or 331 of them unemployed. The age group with the highest labor force participation rate is 20 to 24 years, with 91.1% or 846 individuals in the labor force. Within the labor force, the 20 to 24 years age range has the highest percentage of unemployed individuals, with 11.1% or 94 of them being unemployed.
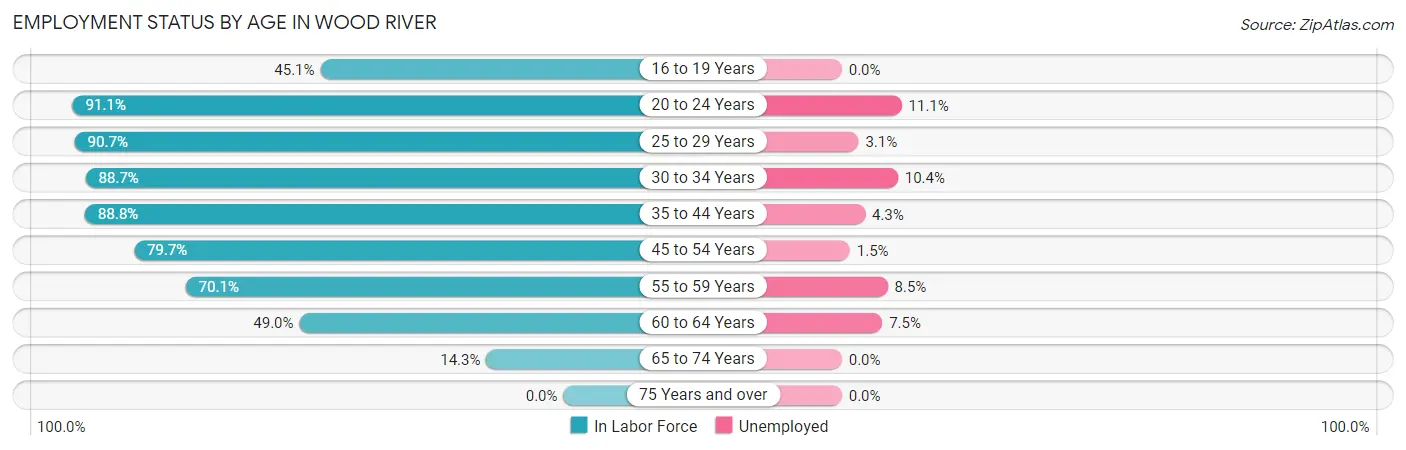
| Age Bracket | In Labor Force | Unemployed |
| 16 to 19 Years | 164 (45.1%) | 0 (0.0%) |
| 20 to 24 Years | 846 (91.1%) | 94 (11.1%) |
| 25 to 29 Years | 650 (90.7%) | 20 (3.1%) |
| 30 to 34 Years | 890 (88.7%) | 93 (10.4%) |
| 35 to 44 Years | 1,106 (88.8%) | 48 (4.3%) |
| 45 to 54 Years | 874 (79.7%) | 13 (1.5%) |
| 55 to 59 Years | 515 (70.1%) | 44 (8.5%) |
| 60 to 64 Years | 279 (49.0%) | 21 (7.5%) |
| 65 to 74 Years | 107 (14.3%) | 0 (0.0%) |
| 75 Years and over | 0 (0.0%) | 0 (0.0%) |
| Total | 5,430 (67.1%) | 331 (6.1%) |
Employment Status by Educational Attainment in Wood River
According to labor force statistics for Wood River, 80.4% of individuals (4,313) out of the total population between 25 and 64 years of age (5,365) are in the labor force, with 5.5% or 237 of them being unemployed. The group with the highest labor force participation rate are those with the educational attainment of bachelor's degree or higher, with 88.4% or 723 individuals in the labor force. Within the labor force, individuals with bachelor's degree or higher education have the highest percentage of unemployment, with 12.6% or 91 of them being unemployed.
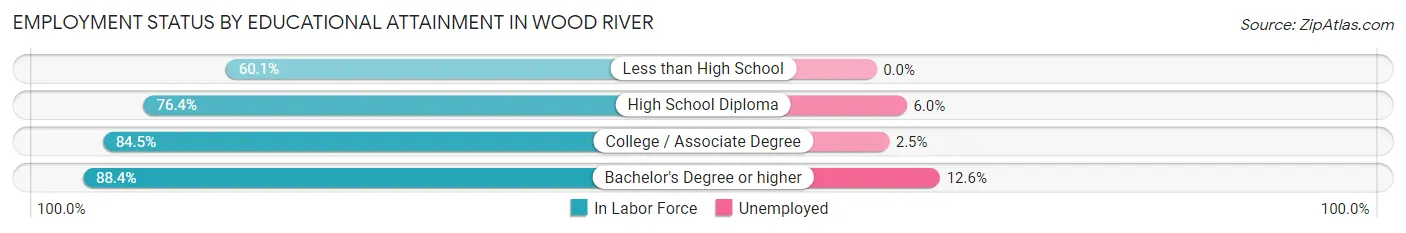
| Educational Attainment | In Labor Force | Unemployed |
| Less than High School | 161 (60.1%) | 0 (0.0%) |
| High School Diploma | 1,761 (76.4%) | 138 (6.0%) |
| College / Associate Degree | 1,668 (84.5%) | 49 (2.5%) |
| Bachelor's Degree or higher | 723 (88.4%) | 103 (12.6%) |
| Total | 4,313 (80.4%) | 295 (5.5%) |
Employment Occupations by Sex in Wood River
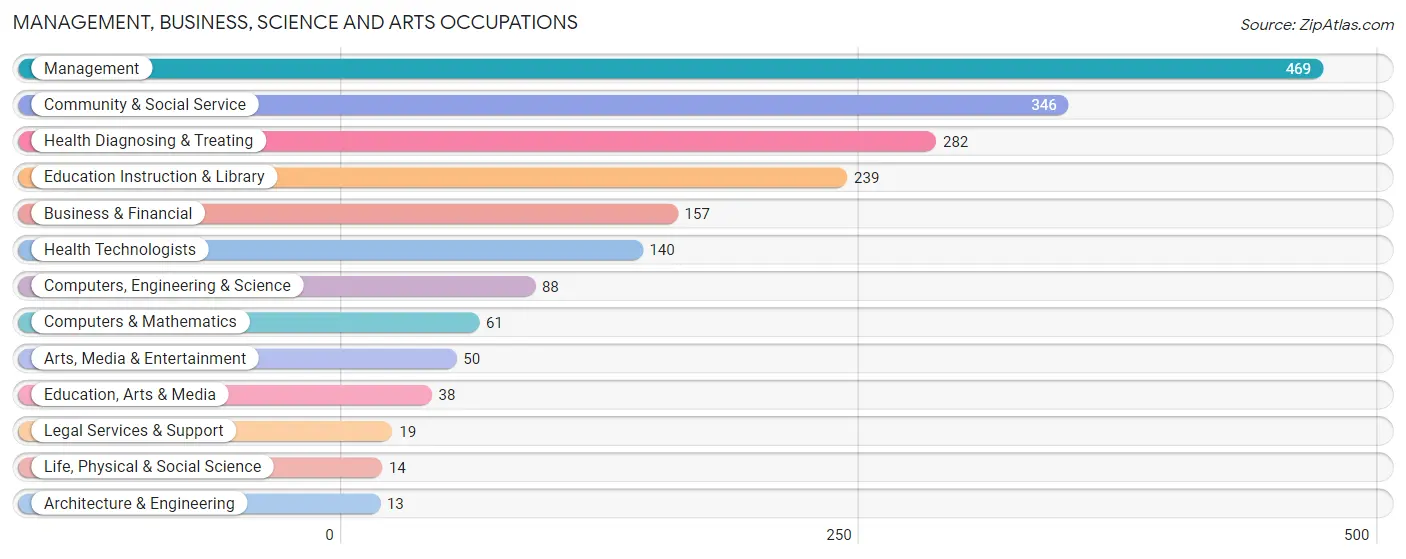
Management, Business, Science and Arts Occupations
The most common Management, Business, Science and Arts occupations in Wood River are Management (469 | 9.2%), Community & Social Service (346 | 6.8%), Health Diagnosing & Treating (282 | 5.5%), Education Instruction & Library (239 | 4.7%), and Business & Financial (157 | 3.1%).
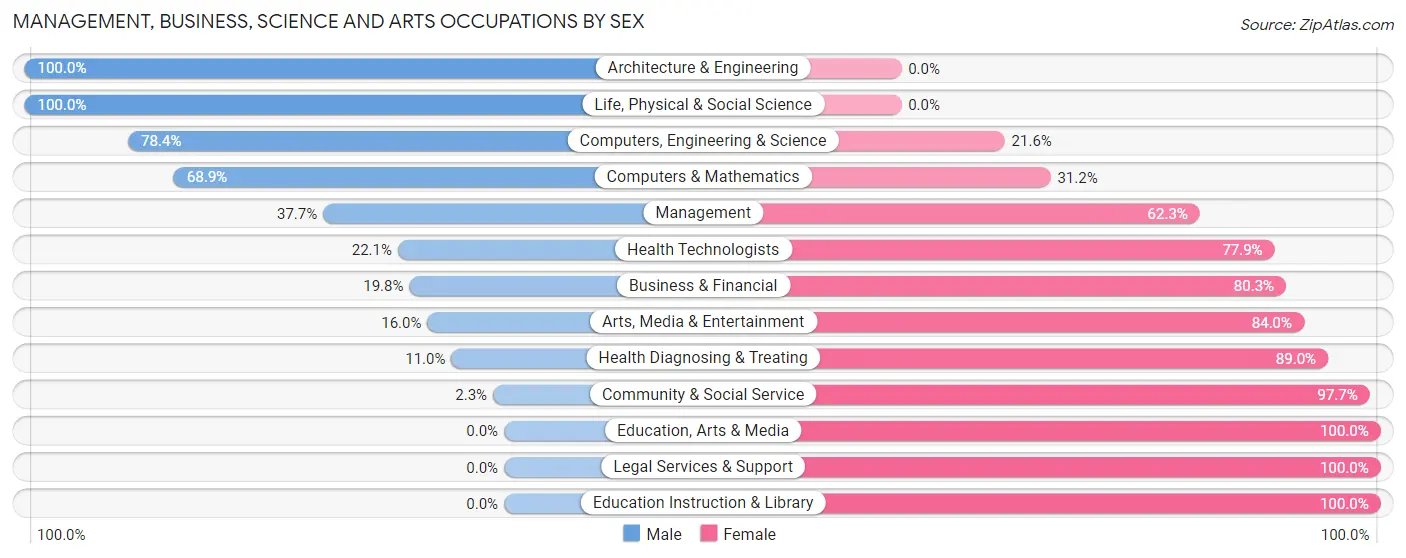
Management, Business, Science and Arts Occupations by Sex
Within the Management, Business, Science and Arts occupations in Wood River, the most male-oriented occupations are Architecture & Engineering (100.0%), Life, Physical & Social Science (100.0%), and Computers, Engineering & Science (78.4%), while the most female-oriented occupations are Education, Arts & Media (100.0%), Legal Services & Support (100.0%), and Education Instruction & Library (100.0%).
| Occupation | Male | Female |
| Management | 177 (37.7%) | 292 (62.3%) |
| Business & Financial | 31 (19.8%) | 126 (80.2%) |
| Computers, Engineering & Science | 69 (78.4%) | 19 (21.6%) |
| Computers & Mathematics | 42 (68.9%) | 19 (31.1%) |
| Architecture & Engineering | 13 (100.0%) | 0 (0.0%) |
| Life, Physical & Social Science | 14 (100.0%) | 0 (0.0%) |
| Community & Social Service | 8 (2.3%) | 338 (97.7%) |
| Education, Arts & Media | 0 (0.0%) | 38 (100.0%) |
| Legal Services & Support | 0 (0.0%) | 19 (100.0%) |
| Education Instruction & Library | 0 (0.0%) | 239 (100.0%) |
| Arts, Media & Entertainment | 8 (16.0%) | 42 (84.0%) |
| Health Diagnosing & Treating | 31 (11.0%) | 251 (89.0%) |
| Health Technologists | 31 (22.1%) | 109 (77.9%) |
| Total (Category) | 316 (23.5%) | 1,026 (76.4%) |
| Total (Overall) | 2,458 (48.2%) | 2,638 (51.8%) |
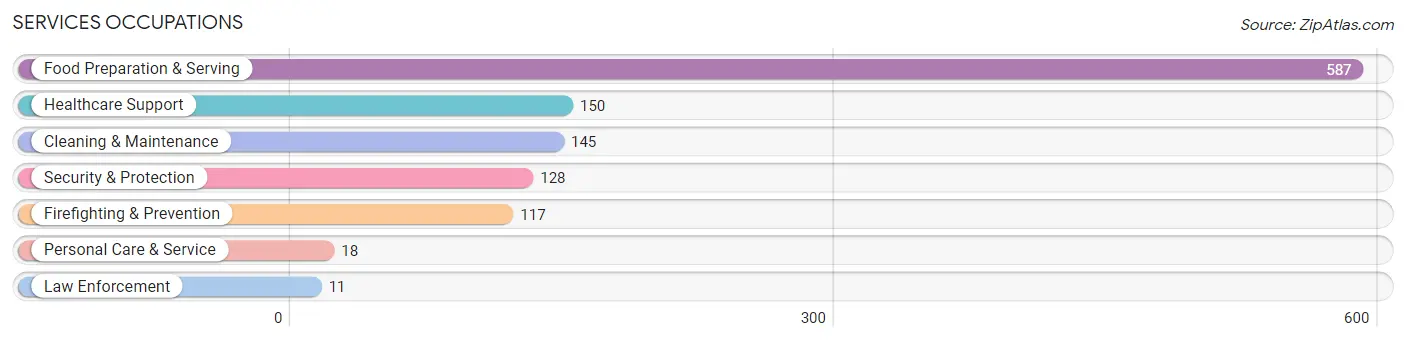
Services Occupations
The most common Services occupations in Wood River are Food Preparation & Serving (587 | 11.5%), Healthcare Support (150 | 2.9%), Cleaning & Maintenance (145 | 2.9%), Security & Protection (128 | 2.5%), and Firefighting & Prevention (117 | 2.3%).
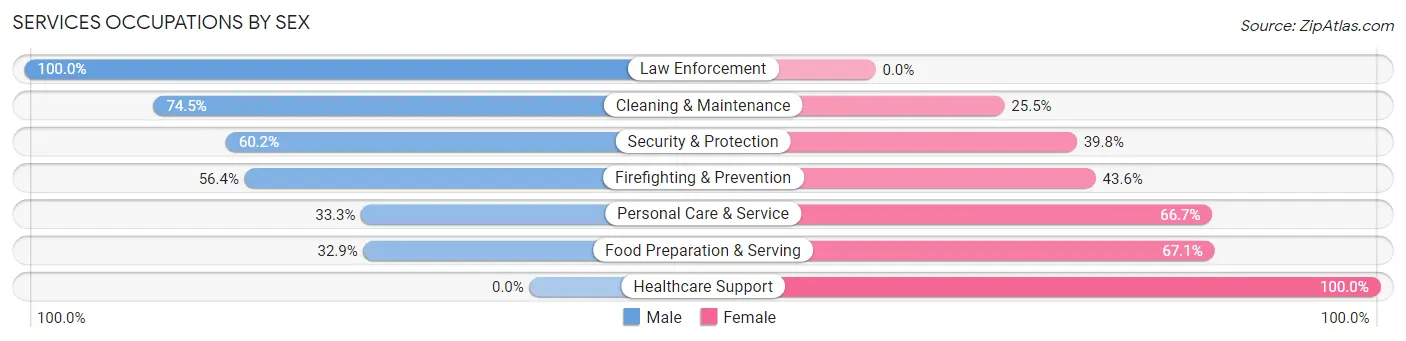
Services Occupations by Sex
Within the Services occupations in Wood River, the most male-oriented occupations are Law Enforcement (100.0%), Cleaning & Maintenance (74.5%), and Security & Protection (60.2%), while the most female-oriented occupations are Healthcare Support (100.0%), Food Preparation & Serving (67.1%), and Personal Care & Service (66.7%).
| Occupation | Male | Female |
| Healthcare Support | 0 (0.0%) | 150 (100.0%) |
| Security & Protection | 77 (60.2%) | 51 (39.8%) |
| Firefighting & Prevention | 66 (56.4%) | 51 (43.6%) |
| Law Enforcement | 11 (100.0%) | 0 (0.0%) |
| Food Preparation & Serving | 193 (32.9%) | 394 (67.1%) |
| Cleaning & Maintenance | 108 (74.5%) | 37 (25.5%) |
| Personal Care & Service | 6 (33.3%) | 12 (66.7%) |
| Total (Category) | 384 (37.3%) | 644 (62.6%) |
| Total (Overall) | 2,458 (48.2%) | 2,638 (51.8%) |
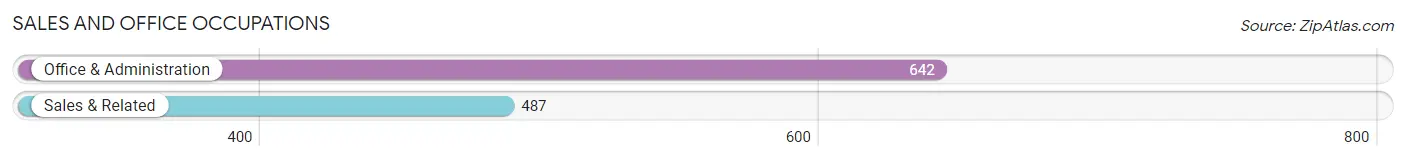
Sales and Office Occupations
The most common Sales and Office occupations in Wood River are Office & Administration (642 | 12.6%), and Sales & Related (487 | 9.6%).
Sales and Office Occupations by Sex
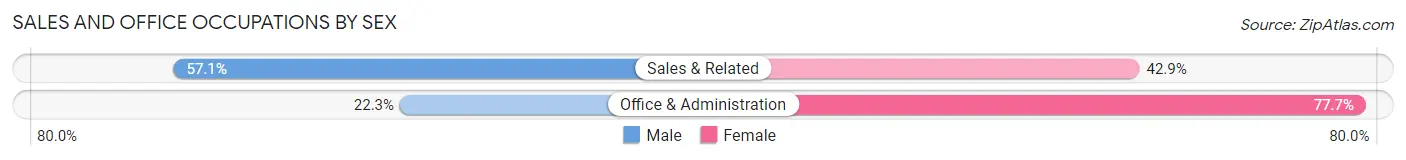
| Occupation | Male | Female |
| Sales & Related | 278 (57.1%) | 209 (42.9%) |
| Office & Administration | 143 (22.3%) | 499 (77.7%) |
| Total (Category) | 421 (37.3%) | 708 (62.7%) |
| Total (Overall) | 2,458 (48.2%) | 2,638 (51.8%) |
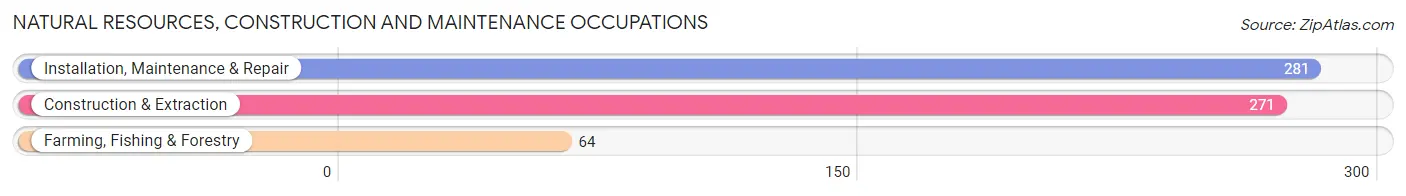
Natural Resources, Construction and Maintenance Occupations
The most common Natural Resources, Construction and Maintenance occupations in Wood River are Installation, Maintenance & Repair (281 | 5.5%), Construction & Extraction (271 | 5.3%), and Farming, Fishing & Forestry (64 | 1.3%).
Natural Resources, Construction and Maintenance Occupations by Sex
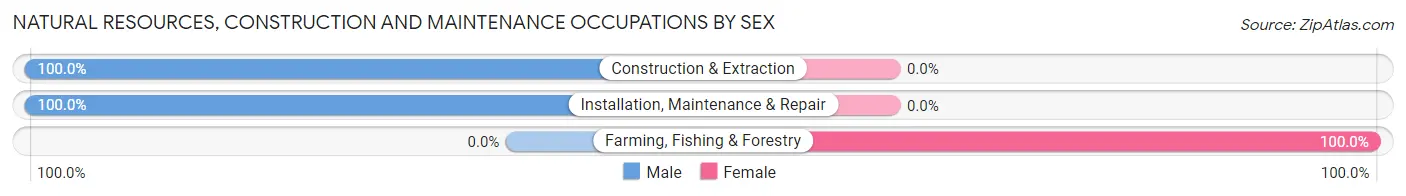
| Occupation | Male | Female |
| Farming, Fishing & Forestry | 0 (0.0%) | 64 (100.0%) |
| Construction & Extraction | 271 (100.0%) | 0 (0.0%) |
| Installation, Maintenance & Repair | 281 (100.0%) | 0 (0.0%) |
| Total (Category) | 552 (89.6%) | 64 (10.4%) |
| Total (Overall) | 2,458 (48.2%) | 2,638 (51.8%) |
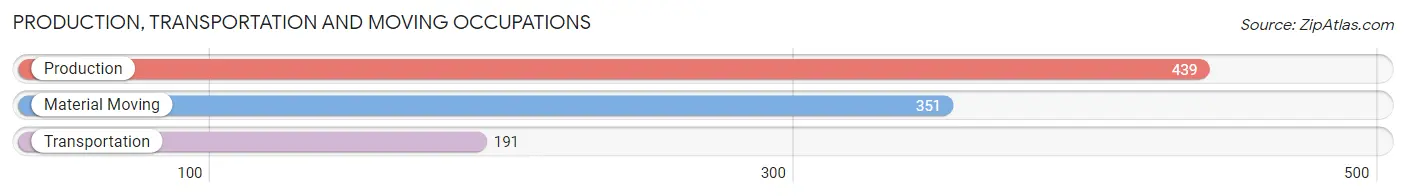
Production, Transportation and Moving Occupations
The most common Production, Transportation and Moving occupations in Wood River are Production (439 | 8.6%), Material Moving (351 | 6.9%), and Transportation (191 | 3.7%).
Production, Transportation and Moving Occupations by Sex
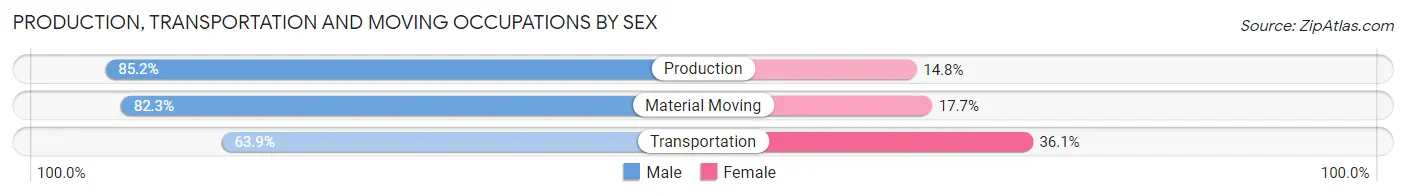
| Occupation | Male | Female |
| Production | 374 (85.2%) | 65 (14.8%) |
| Transportation | 122 (63.9%) | 69 (36.1%) |
| Material Moving | 289 (82.3%) | 62 (17.7%) |
| Total (Category) | 785 (80.0%) | 196 (20.0%) |
| Total (Overall) | 2,458 (48.2%) | 2,638 (51.8%) |
Employment Industries by Sex in Wood River
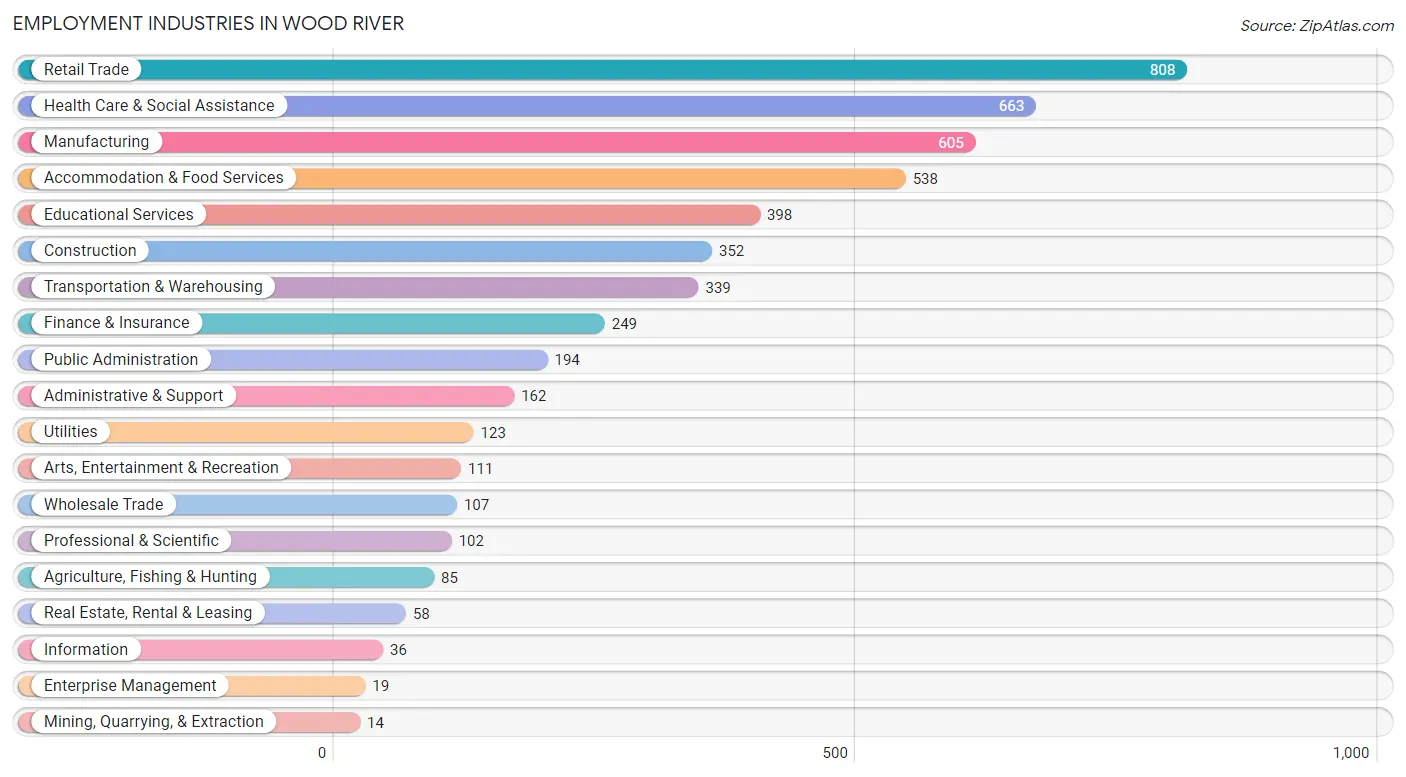
Employment Industries in Wood River
The major employment industries in Wood River include Retail Trade (808 | 15.9%), Health Care & Social Assistance (663 | 13.0%), Manufacturing (605 | 11.9%), Accommodation & Food Services (538 | 10.6%), and Educational Services (398 | 7.8%).
Employment Industries by Sex in Wood River
The Wood River industries that see more men than women are Mining, Quarrying, & Extraction (100.0%), Construction (96.3%), and Transportation & Warehousing (90.0%), whereas the industries that tend to have a higher number of women are Enterprise Management (100.0%), Health Care & Social Assistance (94.4%), and Educational Services (88.2%).
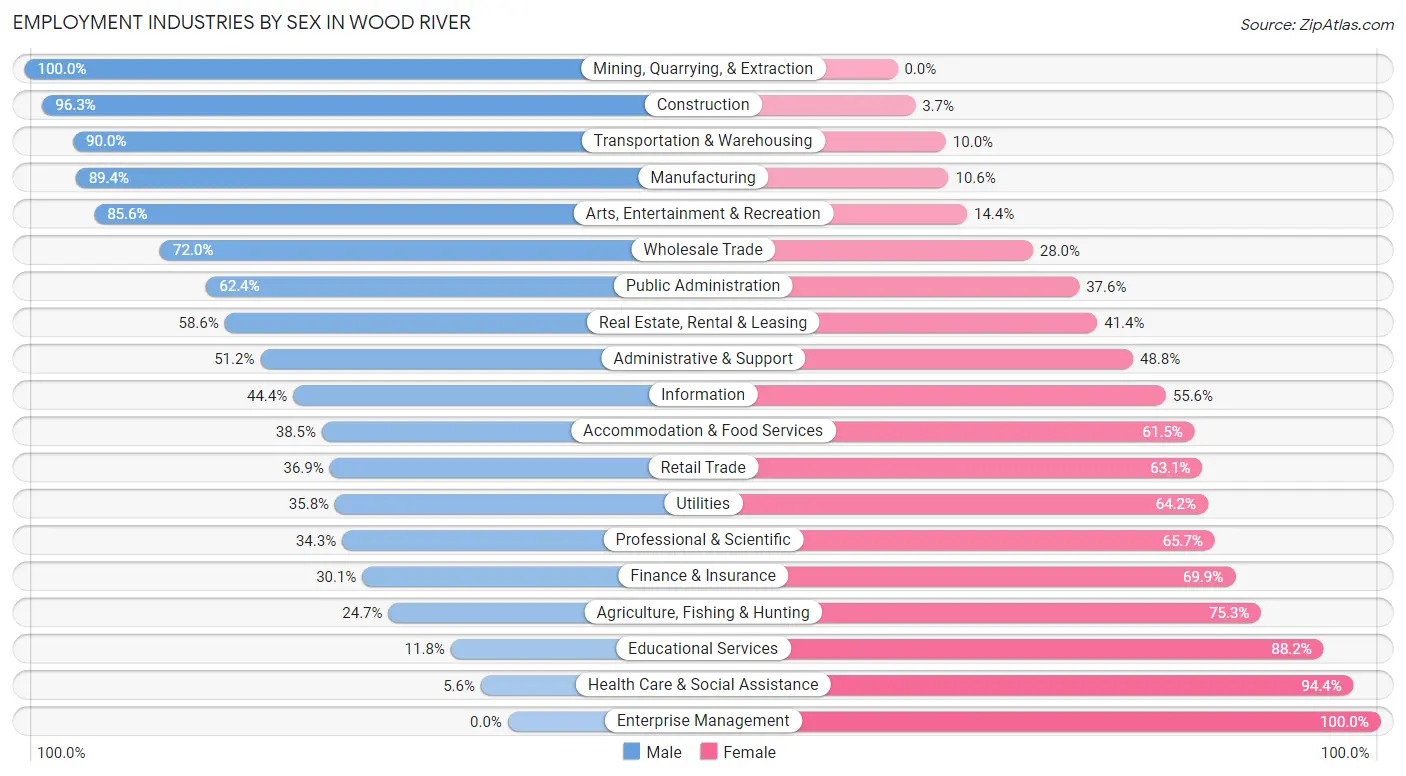
| Industry | Male | Female |
| Agriculture, Fishing & Hunting | 21 (24.7%) | 64 (75.3%) |
| Mining, Quarrying, & Extraction | 14 (100.0%) | 0 (0.0%) |
| Construction | 339 (96.3%) | 13 (3.7%) |
| Manufacturing | 541 (89.4%) | 64 (10.6%) |
| Wholesale Trade | 77 (72.0%) | 30 (28.0%) |
| Retail Trade | 298 (36.9%) | 510 (63.1%) |
| Transportation & Warehousing | 305 (90.0%) | 34 (10.0%) |
| Utilities | 44 (35.8%) | 79 (64.2%) |
| Information | 16 (44.4%) | 20 (55.6%) |
| Finance & Insurance | 75 (30.1%) | 174 (69.9%) |
| Real Estate, Rental & Leasing | 34 (58.6%) | 24 (41.4%) |
| Professional & Scientific | 35 (34.3%) | 67 (65.7%) |
| Enterprise Management | 0 (0.0%) | 19 (100.0%) |
| Administrative & Support | 83 (51.2%) | 79 (48.8%) |
| Educational Services | 47 (11.8%) | 351 (88.2%) |
| Health Care & Social Assistance | 37 (5.6%) | 626 (94.4%) |
| Arts, Entertainment & Recreation | 95 (85.6%) | 16 (14.4%) |
| Accommodation & Food Services | 207 (38.5%) | 331 (61.5%) |
| Public Administration | 121 (62.4%) | 73 (37.6%) |
| Total | 2,458 (48.2%) | 2,638 (51.8%) |
Education in Wood River
School Enrollment in Wood River
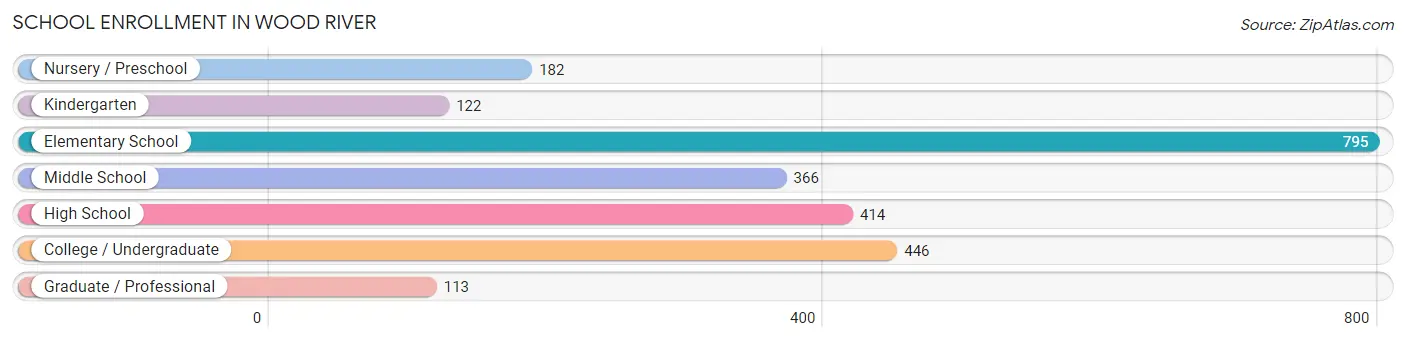
The most common levels of schooling among the 2,438 students in Wood River are elementary school (795 | 32.6%), college / undergraduate (446 | 18.3%), and high school (414 | 17.0%).
| School Level | # Students | % Students |
| Nursery / Preschool | 182 | 7.5% |
| Kindergarten | 122 | 5.0% |
| Elementary School | 795 | 32.6% |
| Middle School | 366 | 15.0% |
| High School | 414 | 17.0% |
| College / Undergraduate | 446 | 18.3% |
| Graduate / Professional | 113 | 4.6% |
| Total | 2,438 | 100.0% |
School Enrollment by Age by Funding Source in Wood River
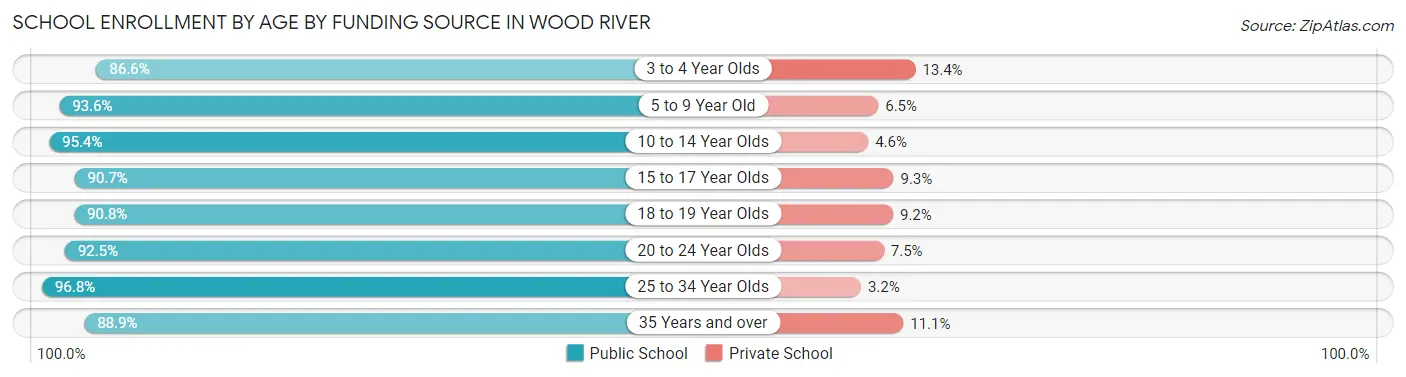
Out of a total of 2,438 students who are enrolled in schools in Wood River, 171 (7.0%) attend a private institution, while the remaining 2,267 (93.0%) are enrolled in public schools. The age group of 3 to 4 year olds has the highest likelihood of being enrolled in private schools, with 23 (13.4% in the age bracket) enrolled. Conversely, the age group of 25 to 34 year olds has the lowest likelihood of being enrolled in a private school, with 180 (96.8% in the age bracket) attending a public institution.
| Age Bracket | Public School | Private School |
| 3 to 4 Year Olds | 149 (86.6%) | 23 (13.4%) |
| 5 to 9 Year Old | 769 (93.5%) | 53 (6.5%) |
| 10 to 14 Year Olds | 543 (95.4%) | 26 (4.6%) |
| 15 to 17 Year Olds | 254 (90.7%) | 26 (9.3%) |
| 18 to 19 Year Olds | 79 (90.8%) | 8 (9.2%) |
| 20 to 24 Year Olds | 198 (92.5%) | 16 (7.5%) |
| 25 to 34 Year Olds | 180 (96.8%) | 6 (3.2%) |
| 35 Years and over | 96 (88.9%) | 12 (11.1%) |
| Total | 2,267 (93.0%) | 171 (7.0%) |
Educational Attainment by Field of Study in Wood River
Business (259 | 25.9%), education (254 | 25.4%), science & technology (103 | 10.3%), psychology (83 | 8.3%), and communications (68 | 6.8%) are the most common fields of study among 999 individuals in Wood River who have obtained a bachelor's degree or higher.
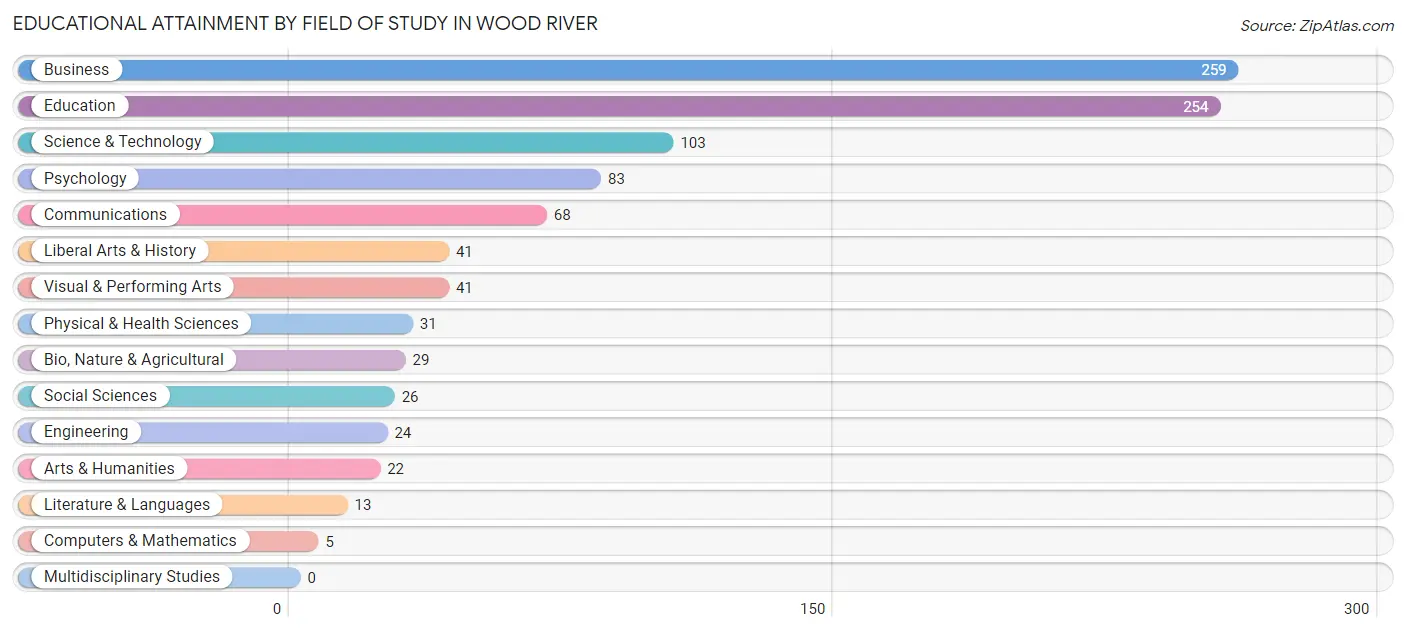
| Field of Study | # Graduates | % Graduates |
| Computers & Mathematics | 5 | 0.5% |
| Bio, Nature & Agricultural | 29 | 2.9% |
| Physical & Health Sciences | 31 | 3.1% |
| Psychology | 83 | 8.3% |
| Social Sciences | 26 | 2.6% |
| Engineering | 24 | 2.4% |
| Multidisciplinary Studies | 0 | 0.0% |
| Science & Technology | 103 | 10.3% |
| Business | 259 | 25.9% |
| Education | 254 | 25.4% |
| Literature & Languages | 13 | 1.3% |
| Liberal Arts & History | 41 | 4.1% |
| Visual & Performing Arts | 41 | 4.1% |
| Communications | 68 | 6.8% |
| Arts & Humanities | 22 | 2.2% |
| Total | 999 | 100.0% |
Transportation & Commute in Wood River
Vehicle Availability by Sex in Wood River
The most prevalent vehicle ownership categories in Wood River are males with 2 vehicles (1,252, accounting for 54.8%) and females with 2 vehicles (1,030, making up 49.2%).
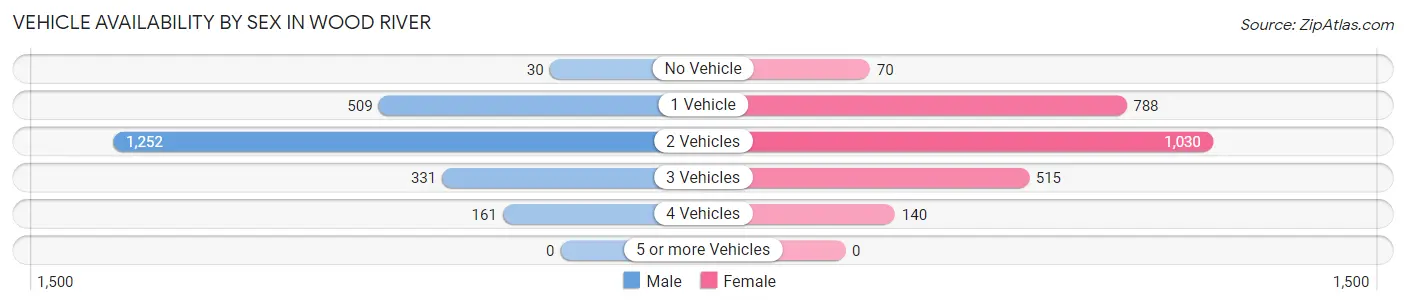
| Vehicles Available | Male | Female |
| No Vehicle | 30 (1.3%) | 70 (2.8%) |
| 1 Vehicle | 509 (22.3%) | 788 (31.0%) |
| 2 Vehicles | 1,252 (54.8%) | 1,030 (40.5%) |
| 3 Vehicles | 331 (14.5%) | 515 (20.3%) |
| 4 Vehicles | 161 (7.0%) | 140 (5.5%) |
| 5 or more Vehicles | 0 (0.0%) | 0 (0.0%) |
| Total | 2,283 (100.0%) | 2,543 (100.0%) |
Commute Time in Wood River
The most frequently occuring commute durations in Wood River are 15 to 19 minutes (932 commuters, 20.2%), 20 to 24 minutes (629 commuters, 13.6%), and 30 to 34 minutes (574 commuters, 12.4%).
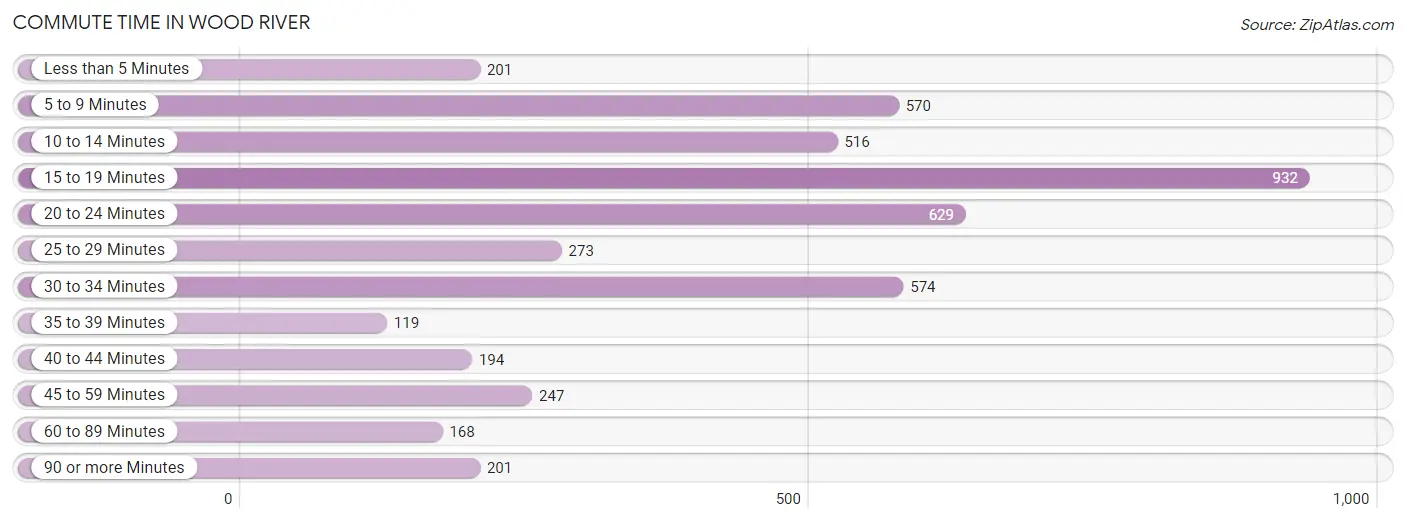
| Commute Time | # Commuters | % Commuters |
| Less than 5 Minutes | 201 | 4.3% |
| 5 to 9 Minutes | 570 | 12.3% |
| 10 to 14 Minutes | 516 | 11.2% |
| 15 to 19 Minutes | 932 | 20.2% |
| 20 to 24 Minutes | 629 | 13.6% |
| 25 to 29 Minutes | 273 | 5.9% |
| 30 to 34 Minutes | 574 | 12.4% |
| 35 to 39 Minutes | 119 | 2.6% |
| 40 to 44 Minutes | 194 | 4.2% |
| 45 to 59 Minutes | 247 | 5.3% |
| 60 to 89 Minutes | 168 | 3.6% |
| 90 or more Minutes | 201 | 4.3% |
Commute Time by Sex in Wood River
The most common commute times in Wood River are 15 to 19 minutes (484 commuters, 21.9%) for males and 15 to 19 minutes (448 commuters, 18.6%) for females.
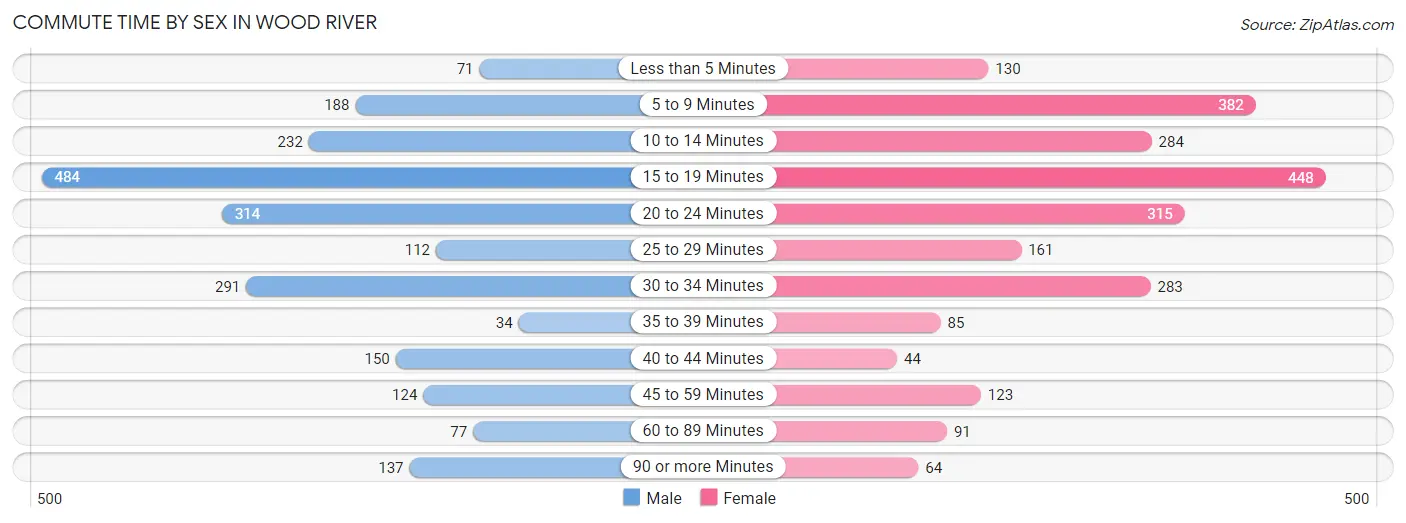
| Commute Time | Male | Female |
| Less than 5 Minutes | 71 (3.2%) | 130 (5.4%) |
| 5 to 9 Minutes | 188 (8.5%) | 382 (15.9%) |
| 10 to 14 Minutes | 232 (10.5%) | 284 (11.8%) |
| 15 to 19 Minutes | 484 (21.9%) | 448 (18.6%) |
| 20 to 24 Minutes | 314 (14.2%) | 315 (13.1%) |
| 25 to 29 Minutes | 112 (5.1%) | 161 (6.7%) |
| 30 to 34 Minutes | 291 (13.1%) | 283 (11.7%) |
| 35 to 39 Minutes | 34 (1.5%) | 85 (3.5%) |
| 40 to 44 Minutes | 150 (6.8%) | 44 (1.8%) |
| 45 to 59 Minutes | 124 (5.6%) | 123 (5.1%) |
| 60 to 89 Minutes | 77 (3.5%) | 91 (3.8%) |
| 90 or more Minutes | 137 (6.2%) | 64 (2.7%) |
Time of Departure to Work by Sex in Wood River
The most frequent times of departure to work in Wood River are 12:00 AM to 4:59 AM (401, 18.1%) for males and 7:30 AM to 7:59 AM (391, 16.2%) for females.
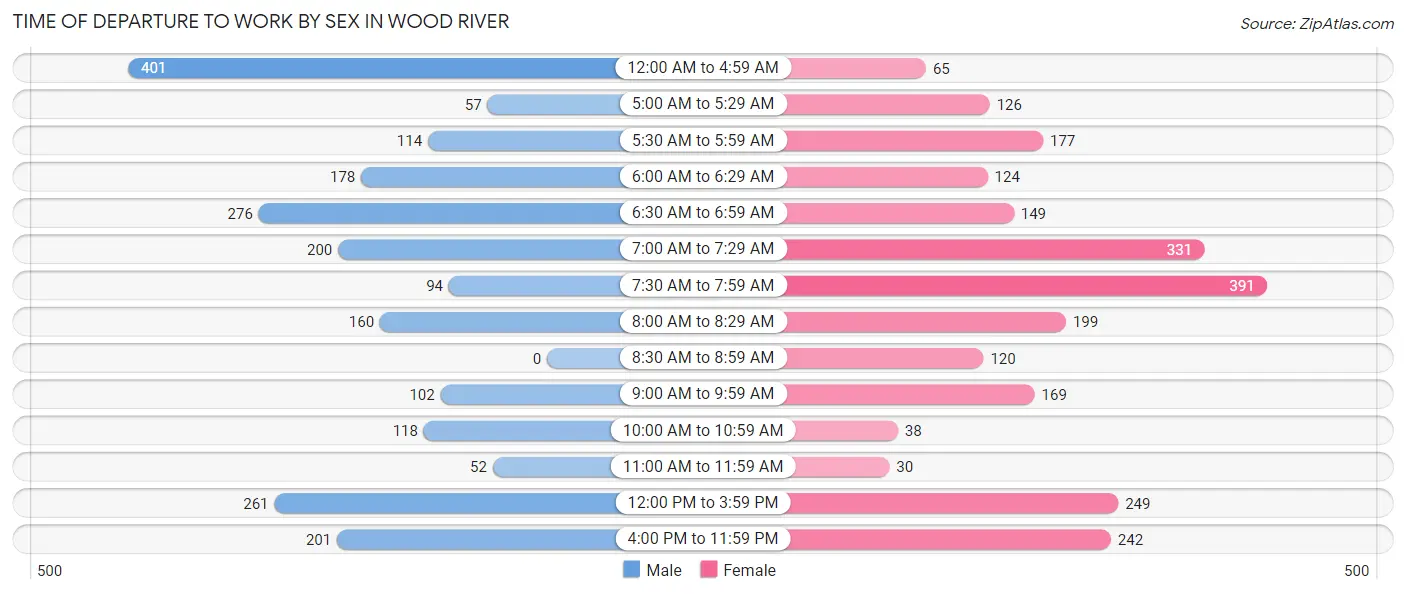
| Time of Departure | Male | Female |
| 12:00 AM to 4:59 AM | 401 (18.1%) | 65 (2.7%) |
| 5:00 AM to 5:29 AM | 57 (2.6%) | 126 (5.2%) |
| 5:30 AM to 5:59 AM | 114 (5.1%) | 177 (7.3%) |
| 6:00 AM to 6:29 AM | 178 (8.0%) | 124 (5.1%) |
| 6:30 AM to 6:59 AM | 276 (12.5%) | 149 (6.2%) |
| 7:00 AM to 7:29 AM | 200 (9.0%) | 331 (13.7%) |
| 7:30 AM to 7:59 AM | 94 (4.3%) | 391 (16.2%) |
| 8:00 AM to 8:29 AM | 160 (7.2%) | 199 (8.3%) |
| 8:30 AM to 8:59 AM | 0 (0.0%) | 120 (5.0%) |
| 9:00 AM to 9:59 AM | 102 (4.6%) | 169 (7.0%) |
| 10:00 AM to 10:59 AM | 118 (5.3%) | 38 (1.6%) |
| 11:00 AM to 11:59 AM | 52 (2.4%) | 30 (1.2%) |
| 12:00 PM to 3:59 PM | 261 (11.8%) | 249 (10.3%) |
| 4:00 PM to 11:59 PM | 201 (9.1%) | 242 (10.0%) |
| Total | 2,214 (100.0%) | 2,410 (100.0%) |
Housing Occupancy in Wood River
Occupancy by Ownership in Wood River
Of the total 4,378 dwellings in Wood River, owner-occupied units account for 3,045 (69.6%), while renter-occupied units make up 1,333 (30.4%).
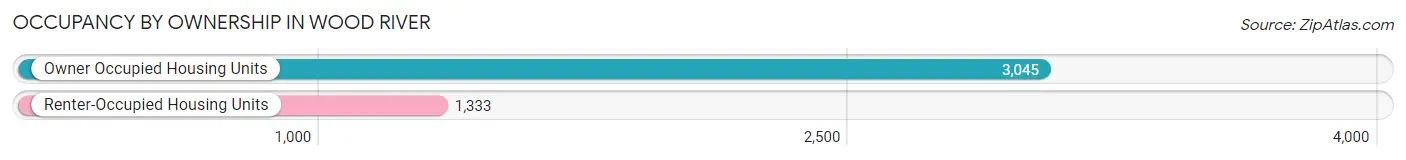
| Occupancy | # Housing Units | % Housing Units |
| Owner Occupied Housing Units | 3,045 | 69.6% |
| Renter-Occupied Housing Units | 1,333 | 30.4% |
| Total Occupied Housing Units | 4,378 | 100.0% |
Occupancy by Household Size in Wood River
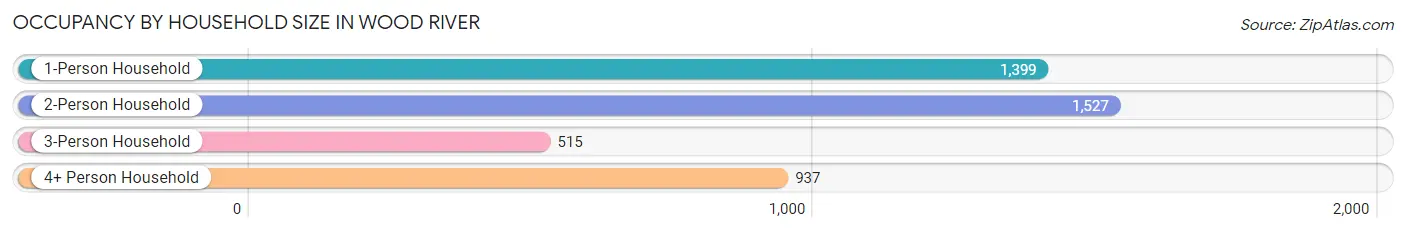
| Household Size | # Housing Units | % Housing Units |
| 1-Person Household | 1,399 | 32.0% |
| 2-Person Household | 1,527 | 34.9% |
| 3-Person Household | 515 | 11.8% |
| 4+ Person Household | 937 | 21.4% |
| Total Housing Units | 4,378 | 100.0% |
Occupancy by Ownership by Household Size in Wood River
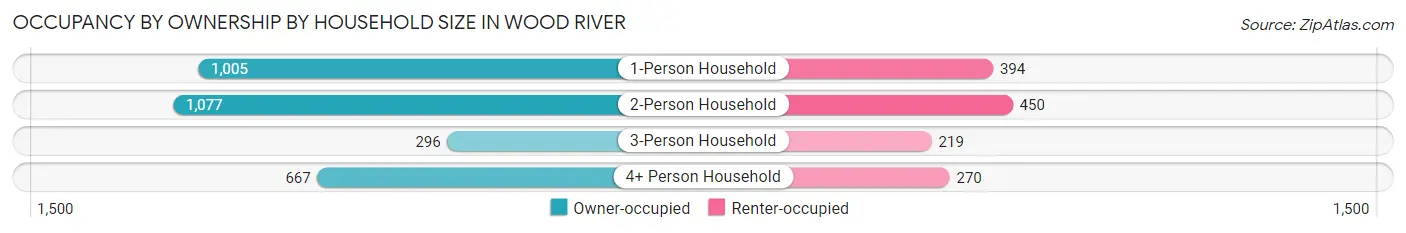
| Household Size | Owner-occupied | Renter-occupied |
| 1-Person Household | 1,005 (71.8%) | 394 (28.2%) |
| 2-Person Household | 1,077 (70.5%) | 450 (29.5%) |
| 3-Person Household | 296 (57.5%) | 219 (42.5%) |
| 4+ Person Household | 667 (71.2%) | 270 (28.8%) |
| Total Housing Units | 3,045 (69.6%) | 1,333 (30.4%) |
Occupancy by Educational Attainment in Wood River
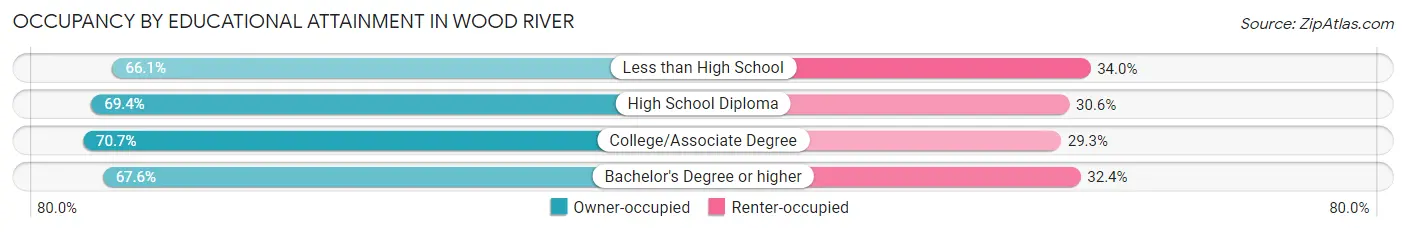
| Household Size | Owner-occupied | Renter-occupied |
| Less than High School | 107 (66.0%) | 55 (34.0%) |
| High School Diploma | 1,125 (69.4%) | 496 (30.6%) |
| College/Associate Degree | 1,335 (70.7%) | 553 (29.3%) |
| Bachelor's Degree or higher | 478 (67.6%) | 229 (32.4%) |
Occupancy by Age of Householder in Wood River
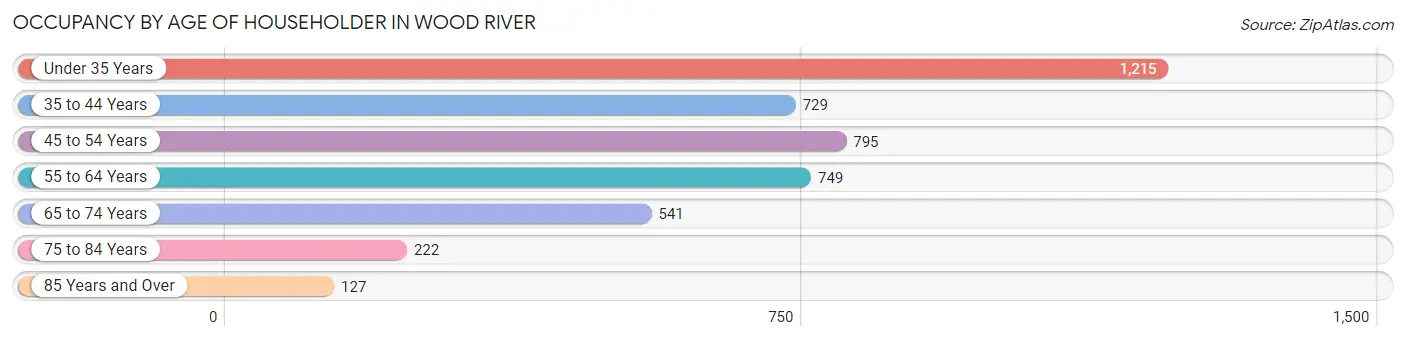
| Age Bracket | # Households | % Households |
| Under 35 Years | 1,215 | 27.8% |
| 35 to 44 Years | 729 | 16.7% |
| 45 to 54 Years | 795 | 18.2% |
| 55 to 64 Years | 749 | 17.1% |
| 65 to 74 Years | 541 | 12.4% |
| 75 to 84 Years | 222 | 5.1% |
| 85 Years and Over | 127 | 2.9% |
| Total | 4,378 | 100.0% |
Housing Finances in Wood River
Median Income by Occupancy in Wood River
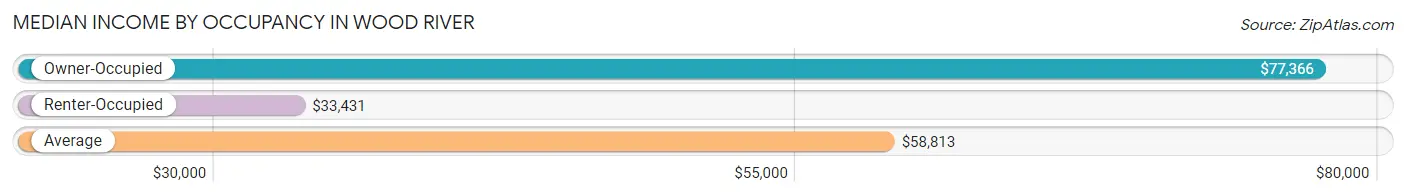
| Occupancy Type | # Households | Median Income |
| Owner-Occupied | 3,045 (69.6%) | $77,366 |
| Renter-Occupied | 1,333 (30.4%) | $33,431 |
| Average | 4,378 (100.0%) | $58,813 |
Occupancy by Householder Income Bracket in Wood River
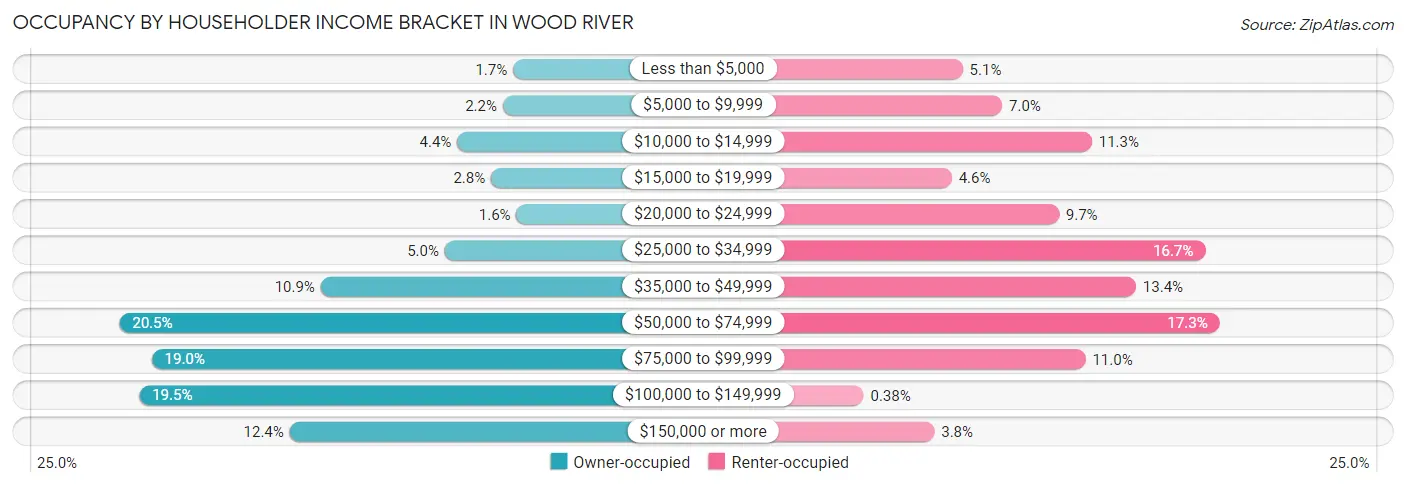
| Income Bracket | Owner-occupied | Renter-occupied |
| Less than $5,000 | 53 (1.7%) | 68 (5.1%) |
| $5,000 to $9,999 | 68 (2.2%) | 93 (7.0%) |
| $10,000 to $14,999 | 134 (4.4%) | 150 (11.3%) |
| $15,000 to $19,999 | 85 (2.8%) | 61 (4.6%) |
| $20,000 to $24,999 | 48 (1.6%) | 129 (9.7%) |
| $25,000 to $34,999 | 152 (5.0%) | 222 (16.7%) |
| $35,000 to $49,999 | 332 (10.9%) | 178 (13.4%) |
| $50,000 to $74,999 | 624 (20.5%) | 231 (17.3%) |
| $75,000 to $99,999 | 577 (19.0%) | 146 (11.0%) |
| $100,000 to $149,999 | 595 (19.5%) | 5 (0.4%) |
| $150,000 or more | 377 (12.4%) | 50 (3.7%) |
| Total | 3,045 (100.0%) | 1,333 (100.0%) |
Monthly Housing Cost Tiers in Wood River
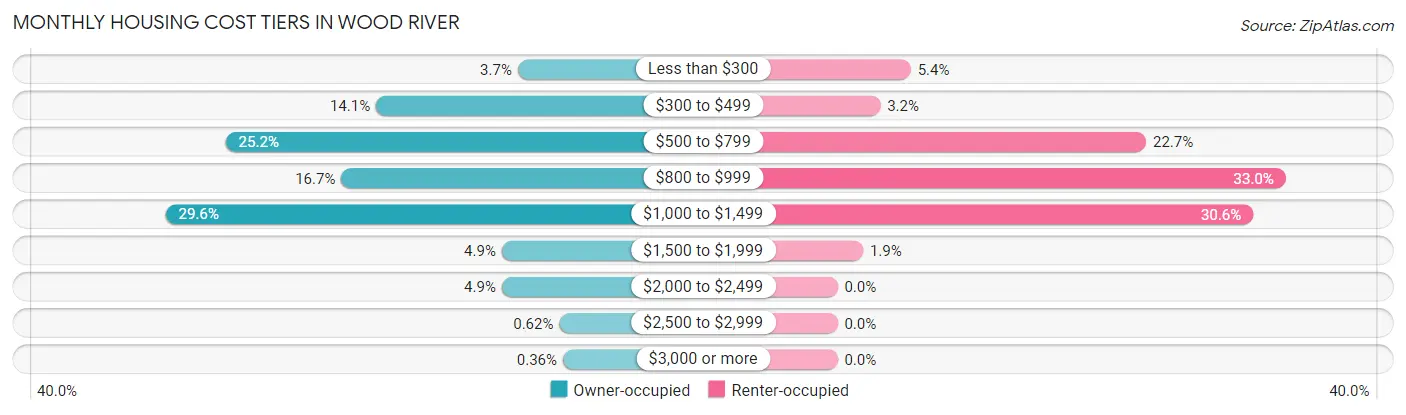
| Monthly Cost | Owner-occupied | Renter-occupied |
| Less than $300 | 112 (3.7%) | 72 (5.4%) |
| $300 to $499 | 430 (14.1%) | 42 (3.2%) |
| $500 to $799 | 767 (25.2%) | 303 (22.7%) |
| $800 to $999 | 508 (16.7%) | 440 (33.0%) |
| $1,000 to $1,499 | 902 (29.6%) | 408 (30.6%) |
| $1,500 to $1,999 | 148 (4.9%) | 25 (1.9%) |
| $2,000 to $2,499 | 148 (4.9%) | 0 (0.0%) |
| $2,500 to $2,999 | 19 (0.6%) | 0 (0.0%) |
| $3,000 or more | 11 (0.4%) | 0 (0.0%) |
| Total | 3,045 (100.0%) | 1,333 (100.0%) |
Physical Housing Characteristics in Wood River
Housing Structures in Wood River
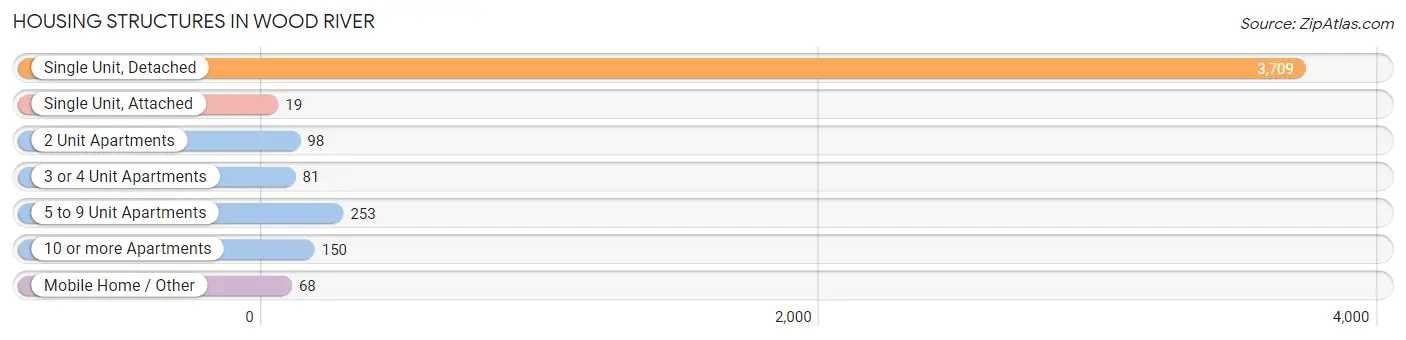
| Structure Type | # Housing Units | % Housing Units |
| Single Unit, Detached | 3,709 | 84.7% |
| Single Unit, Attached | 19 | 0.4% |
| 2 Unit Apartments | 98 | 2.2% |
| 3 or 4 Unit Apartments | 81 | 1.8% |
| 5 to 9 Unit Apartments | 253 | 5.8% |
| 10 or more Apartments | 150 | 3.4% |
| Mobile Home / Other | 68 | 1.5% |
| Total | 4,378 | 100.0% |
Housing Structures by Occupancy in Wood River
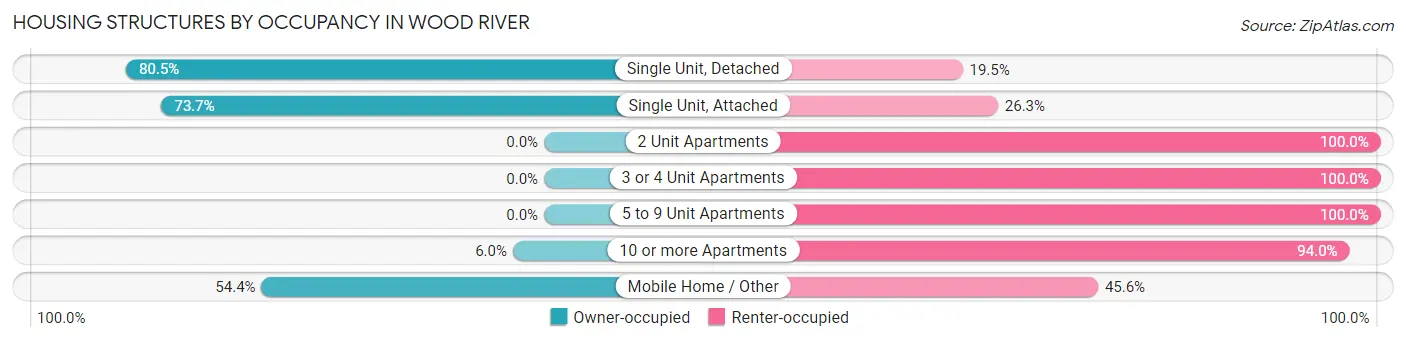
| Structure Type | Owner-occupied | Renter-occupied |
| Single Unit, Detached | 2,985 (80.5%) | 724 (19.5%) |
| Single Unit, Attached | 14 (73.7%) | 5 (26.3%) |
| 2 Unit Apartments | 0 (0.0%) | 98 (100.0%) |
| 3 or 4 Unit Apartments | 0 (0.0%) | 81 (100.0%) |
| 5 to 9 Unit Apartments | 0 (0.0%) | 253 (100.0%) |
| 10 or more Apartments | 9 (6.0%) | 141 (94.0%) |
| Mobile Home / Other | 37 (54.4%) | 31 (45.6%) |
| Total | 3,045 (69.6%) | 1,333 (30.4%) |
Housing Structures by Number of Rooms in Wood River
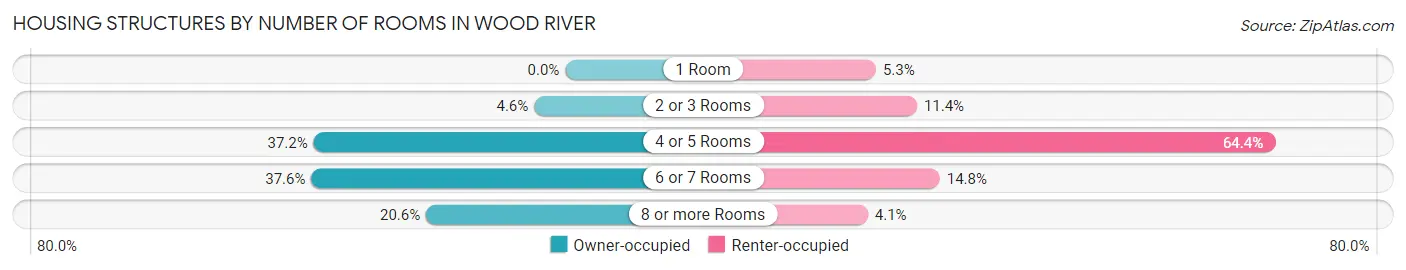
| Number of Rooms | Owner-occupied | Renter-occupied |
| 1 Room | 0 (0.0%) | 71 (5.3%) |
| 2 or 3 Rooms | 140 (4.6%) | 152 (11.4%) |
| 4 or 5 Rooms | 1,134 (37.2%) | 858 (64.4%) |
| 6 or 7 Rooms | 1,144 (37.6%) | 197 (14.8%) |
| 8 or more Rooms | 627 (20.6%) | 55 (4.1%) |
| Total | 3,045 (100.0%) | 1,333 (100.0%) |
Housing Structure by Heating Type in Wood River
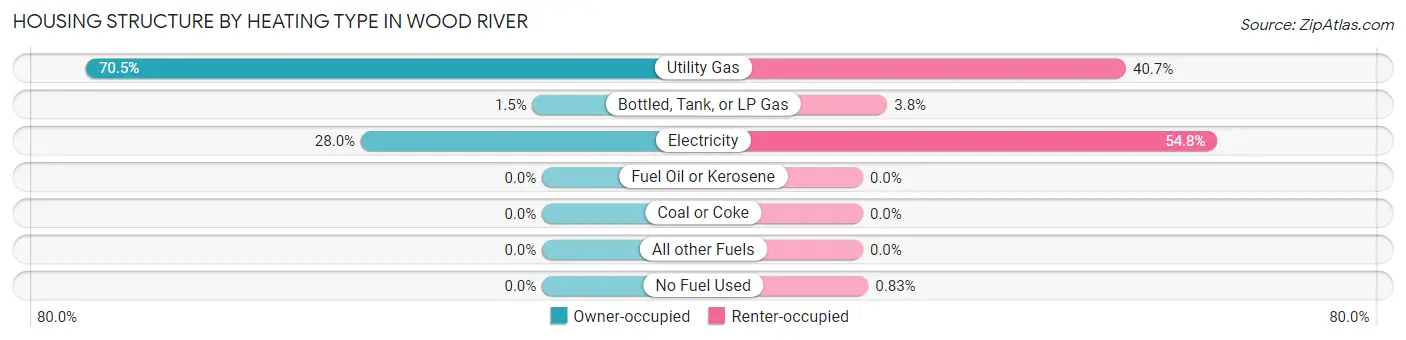
| Heating Type | Owner-occupied | Renter-occupied |
| Utility Gas | 2,147 (70.5%) | 542 (40.7%) |
| Bottled, Tank, or LP Gas | 45 (1.5%) | 50 (3.7%) |
| Electricity | 853 (28.0%) | 730 (54.8%) |
| Fuel Oil or Kerosene | 0 (0.0%) | 0 (0.0%) |
| Coal or Coke | 0 (0.0%) | 0 (0.0%) |
| All other Fuels | 0 (0.0%) | 0 (0.0%) |
| No Fuel Used | 0 (0.0%) | 11 (0.8%) |
| Total | 3,045 (100.0%) | 1,333 (100.0%) |
Household Vehicle Usage in Wood River
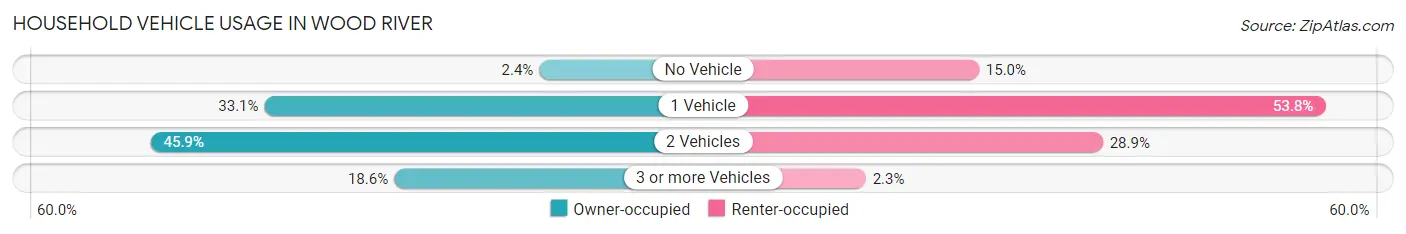
| Vehicles per Household | Owner-occupied | Renter-occupied |
| No Vehicle | 72 (2.4%) | 200 (15.0%) |
| 1 Vehicle | 1,009 (33.1%) | 717 (53.8%) |
| 2 Vehicles | 1,397 (45.9%) | 385 (28.9%) |
| 3 or more Vehicles | 567 (18.6%) | 31 (2.3%) |
| Total | 3,045 (100.0%) | 1,333 (100.0%) |
Real Estate & Mortgages in Wood River
Real Estate and Mortgage Overview in Wood River
| Characteristic | Without Mortgage | With Mortgage |
| Housing Units | 1,079 | 1,966 |
| Median Property Value | $92,700 | $104,800 |
| Median Household Income | $68,256 | $267 |
| Monthly Housing Costs | $515 | $11 |
| Real Estate Taxes | $1,927 | $107 |
Property Value by Mortgage Status in Wood River
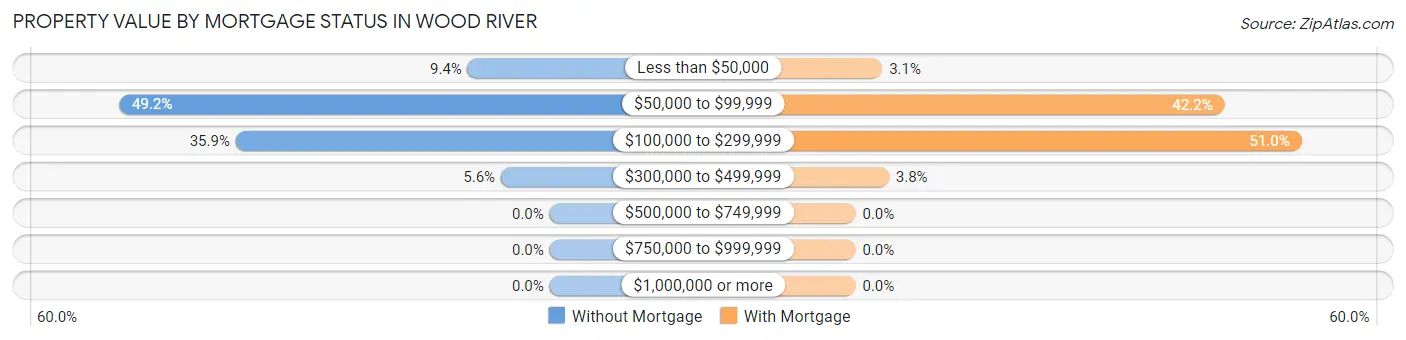
| Property Value | Without Mortgage | With Mortgage |
| Less than $50,000 | 101 (9.4%) | 60 (3.0%) |
| $50,000 to $99,999 | 531 (49.2%) | 829 (42.2%) |
| $100,000 to $299,999 | 387 (35.9%) | 1,002 (51.0%) |
| $300,000 to $499,999 | 60 (5.6%) | 75 (3.8%) |
| $500,000 to $749,999 | 0 (0.0%) | 0 (0.0%) |
| $750,000 to $999,999 | 0 (0.0%) | 0 (0.0%) |
| $1,000,000 or more | 0 (0.0%) | 0 (0.0%) |
| Total | 1,079 (100.0%) | 1,966 (100.0%) |
Household Income by Mortgage Status in Wood River
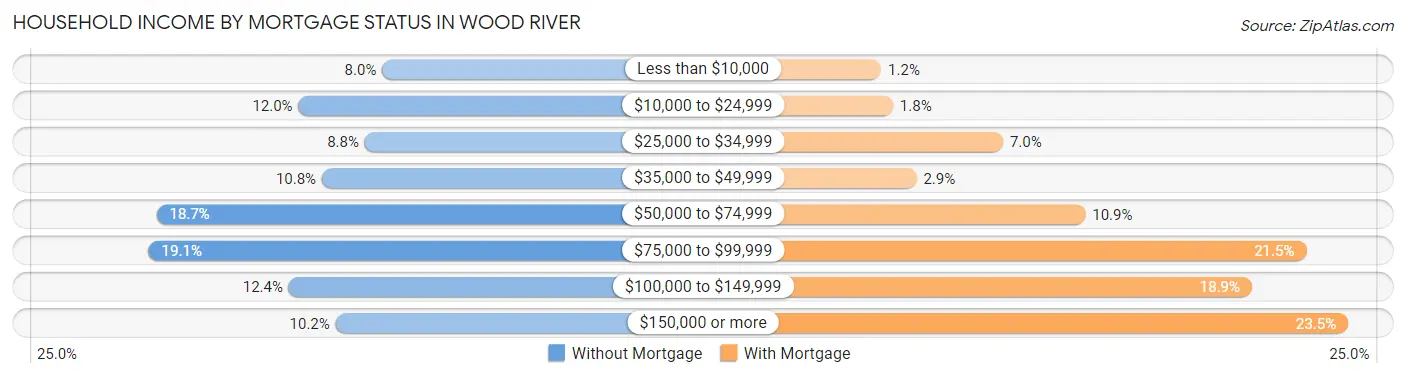
| Household Income | Without Mortgage | With Mortgage |
| Less than $10,000 | 86 (8.0%) | 24 (1.2%) |
| $10,000 to $24,999 | 129 (12.0%) | 35 (1.8%) |
| $25,000 to $34,999 | 95 (8.8%) | 138 (7.0%) |
| $35,000 to $49,999 | 117 (10.8%) | 57 (2.9%) |
| $50,000 to $74,999 | 202 (18.7%) | 215 (10.9%) |
| $75,000 to $99,999 | 206 (19.1%) | 422 (21.5%) |
| $100,000 to $149,999 | 134 (12.4%) | 371 (18.9%) |
| $150,000 or more | 110 (10.2%) | 461 (23.4%) |
| Total | 1,079 (100.0%) | 1,966 (100.0%) |
Property Value to Household Income Ratio in Wood River
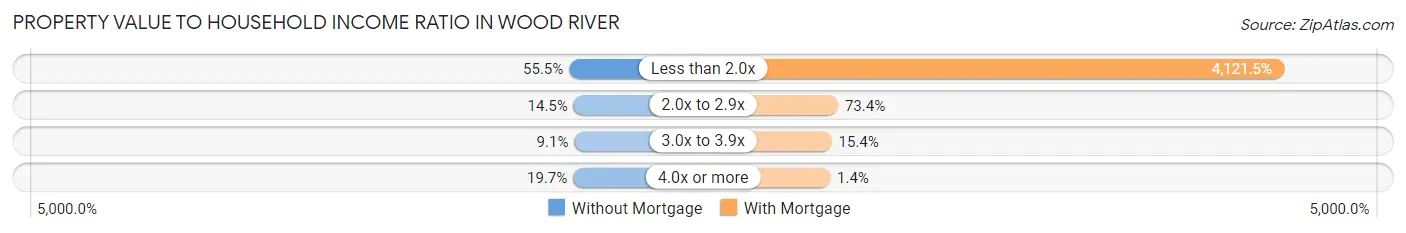
| Value-to-Income Ratio | Without Mortgage | With Mortgage |
| Less than 2.0x | 599 (55.5%) | 81,029 (4,121.5%) |
| 2.0x to 2.9x | 156 (14.5%) | 1,443 (73.4%) |
| 3.0x to 3.9x | 98 (9.1%) | 302 (15.4%) |
| 4.0x or more | 212 (19.7%) | 27 (1.4%) |
| Total | 1,079 (100.0%) | 1,966 (100.0%) |
Real Estate Taxes by Mortgage Status in Wood River
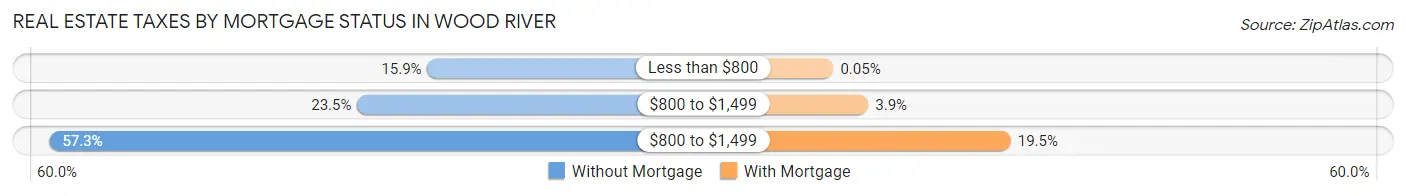
| Property Taxes | Without Mortgage | With Mortgage |
| Less than $800 | 171 (15.9%) | 1 (0.1%) |
| $800 to $1,499 | 254 (23.5%) | 76 (3.9%) |
| $800 to $1,499 | 618 (57.3%) | 383 (19.5%) |
| Total | 1,079 (100.0%) | 1,966 (100.0%) |
Health & Disability in Wood River
Health Insurance Coverage by Age in Wood River
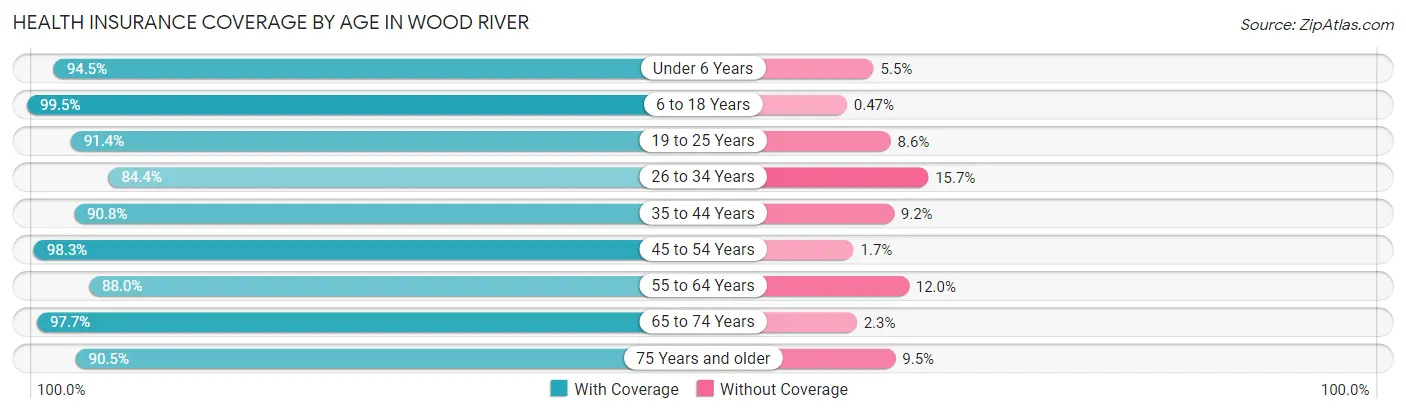
| Age Bracket | With Coverage | Without Coverage |
| Under 6 Years | 744 (94.5%) | 43 (5.5%) |
| 6 to 18 Years | 1,702 (99.5%) | 8 (0.5%) |
| 19 to 25 Years | 1,059 (91.4%) | 100 (8.6%) |
| 26 to 34 Years | 1,331 (84.4%) | 247 (15.7%) |
| 35 to 44 Years | 1,130 (90.8%) | 115 (9.2%) |
| 45 to 54 Years | 1,073 (98.3%) | 19 (1.7%) |
| 55 to 64 Years | 1,134 (88.0%) | 155 (12.0%) |
| 65 to 74 Years | 718 (97.7%) | 17 (2.3%) |
| 75 Years and older | 589 (90.5%) | 62 (9.5%) |
| Total | 9,480 (92.5%) | 766 (7.5%) |
Health Insurance Coverage by Citizenship Status in Wood River
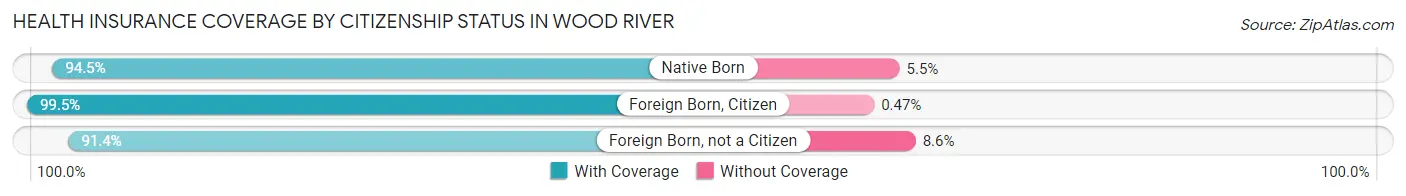
| Citizenship Status | With Coverage | Without Coverage |
| Native Born | 744 (94.5%) | 43 (5.5%) |
| Foreign Born, Citizen | 1,702 (99.5%) | 8 (0.5%) |
| Foreign Born, not a Citizen | 1,059 (91.4%) | 100 (8.6%) |
Health Insurance Coverage by Household Income in Wood River
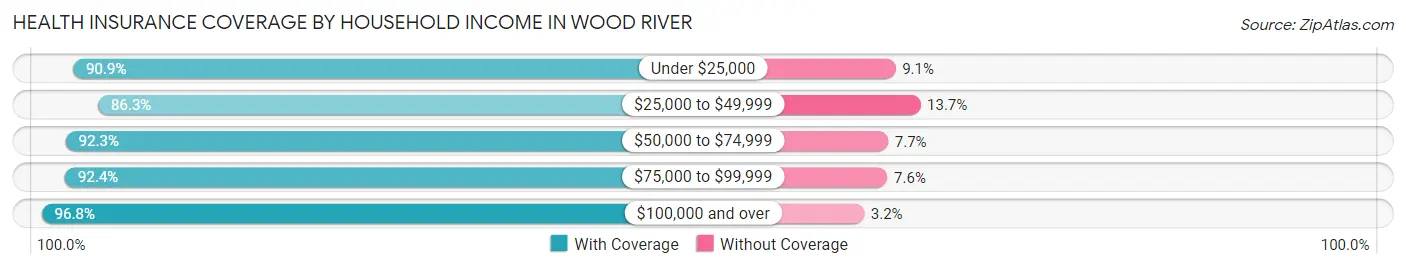
| Household Income | With Coverage | Without Coverage |
| Under $25,000 | 1,654 (90.9%) | 165 (9.1%) |
| $25,000 to $49,999 | 1,545 (86.3%) | 246 (13.7%) |
| $50,000 to $74,999 | 1,392 (92.3%) | 116 (7.7%) |
| $75,000 to $99,999 | 1,613 (92.4%) | 132 (7.6%) |
| $100,000 and over | 3,243 (96.8%) | 107 (3.2%) |
Public vs Private Health Insurance Coverage by Age in Wood River
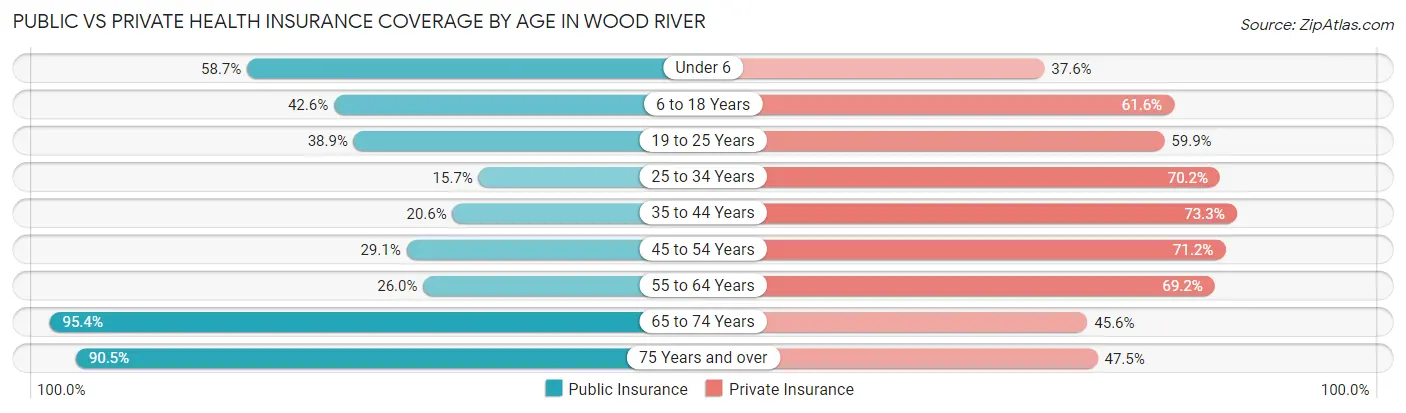
| Age Bracket | Public Insurance | Private Insurance |
| Under 6 | 462 (58.7%) | 296 (37.6%) |
| 6 to 18 Years | 728 (42.6%) | 1,054 (61.6%) |
| 19 to 25 Years | 451 (38.9%) | 694 (59.9%) |
| 25 to 34 Years | 248 (15.7%) | 1,107 (70.2%) |
| 35 to 44 Years | 256 (20.6%) | 912 (73.3%) |
| 45 to 54 Years | 318 (29.1%) | 777 (71.2%) |
| 55 to 64 Years | 335 (26.0%) | 892 (69.2%) |
| 65 to 74 Years | 701 (95.4%) | 335 (45.6%) |
| 75 Years and over | 589 (90.5%) | 309 (47.5%) |
| Total | 4,088 (39.9%) | 6,376 (62.2%) |
Disability Status by Sex by Age in Wood River
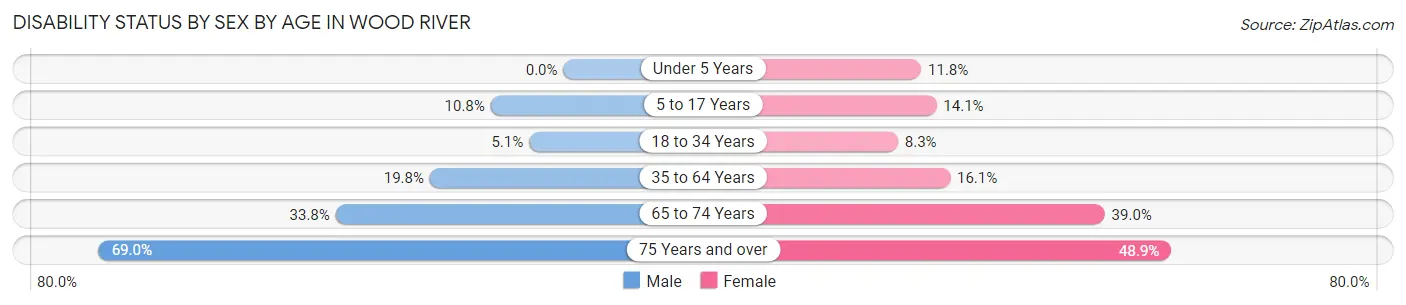
| Age Bracket | Male | Female |
| Under 5 Years | 0 (0.0%) | 37 (11.8%) |
| 5 to 17 Years | 90 (10.8%) | 134 (14.1%) |
| 18 to 34 Years | 71 (5.1%) | 118 (8.3%) |
| 35 to 64 Years | 350 (19.8%) | 299 (16.1%) |
| 65 to 74 Years | 116 (33.8%) | 153 (39.0%) |
| 75 Years and over | 198 (69.0%) | 178 (48.9%) |
Disability Class by Sex by Age in Wood River
Disability Class: Hearing Difficulty
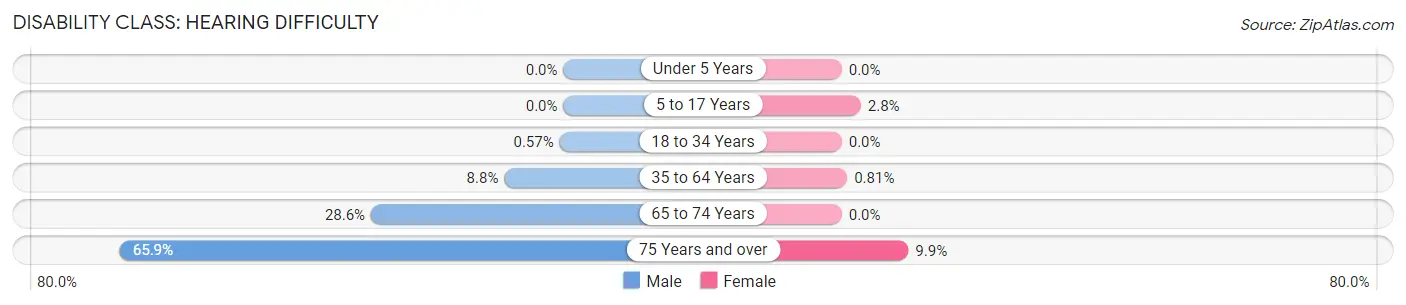
| Age Bracket | Male | Female |
| Under 5 Years | 0 (0.0%) | 0 (0.0%) |
| 5 to 17 Years | 0 (0.0%) | 27 (2.8%) |
| 18 to 34 Years | 8 (0.6%) | 0 (0.0%) |
| 35 to 64 Years | 155 (8.8%) | 15 (0.8%) |
| 65 to 74 Years | 98 (28.6%) | 0 (0.0%) |
| 75 Years and over | 189 (65.8%) | 36 (9.9%) |
Disability Class: Vision Difficulty
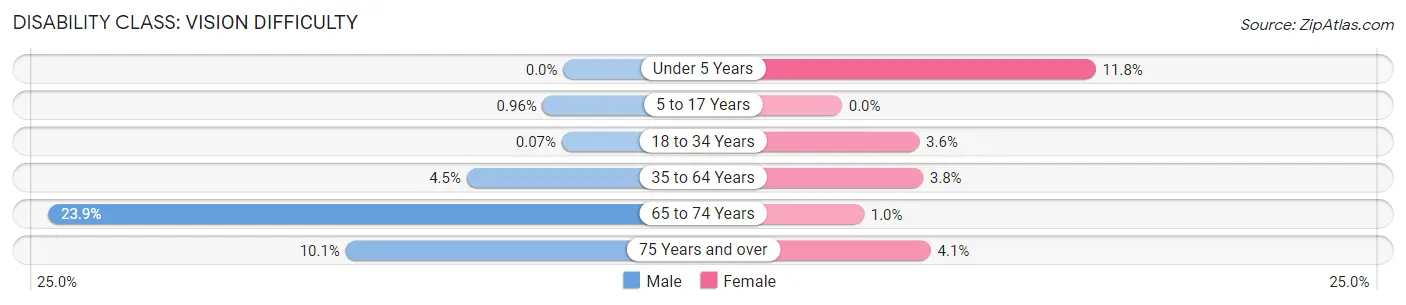
| Age Bracket | Male | Female |
| Under 5 Years | 0 (0.0%) | 37 (11.8%) |
| 5 to 17 Years | 8 (1.0%) | 0 (0.0%) |
| 18 to 34 Years | 1 (0.1%) | 51 (3.6%) |
| 35 to 64 Years | 79 (4.5%) | 70 (3.8%) |
| 65 to 74 Years | 82 (23.9%) | 4 (1.0%) |
| 75 Years and over | 29 (10.1%) | 15 (4.1%) |
Disability Class: Cognitive Difficulty
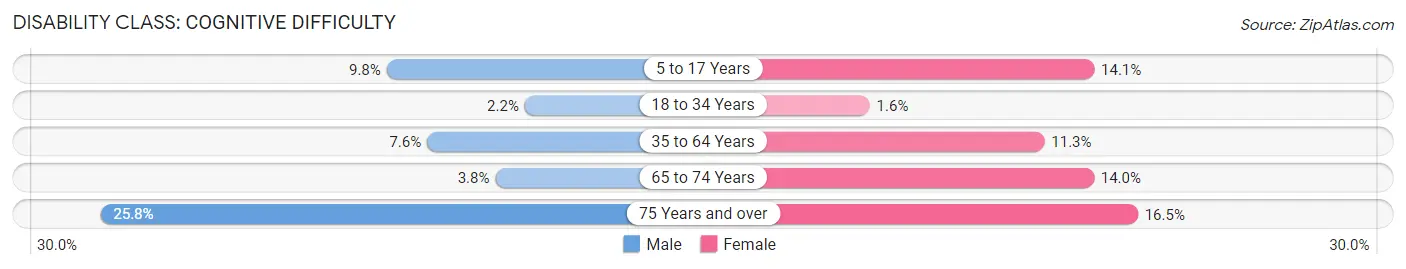
| Age Bracket | Male | Female |
| 5 to 17 Years | 82 (9.8%) | 134 (14.1%) |
| 18 to 34 Years | 30 (2.1%) | 22 (1.5%) |
| 35 to 64 Years | 134 (7.6%) | 210 (11.3%) |
| 65 to 74 Years | 13 (3.8%) | 55 (14.0%) |
| 75 Years and over | 74 (25.8%) | 60 (16.5%) |
Disability Class: Ambulatory Difficulty
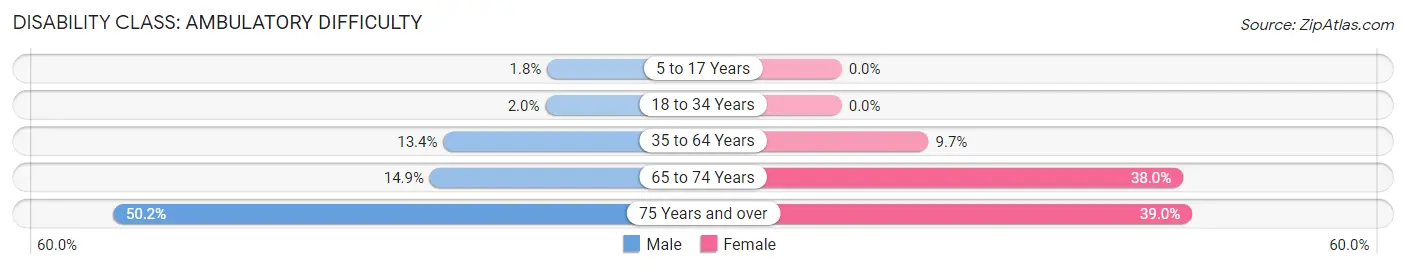
| Age Bracket | Male | Female |
| 5 to 17 Years | 15 (1.8%) | 0 (0.0%) |
| 18 to 34 Years | 28 (2.0%) | 0 (0.0%) |
| 35 to 64 Years | 236 (13.4%) | 180 (9.7%) |
| 65 to 74 Years | 51 (14.9%) | 149 (38.0%) |
| 75 Years and over | 144 (50.2%) | 142 (39.0%) |
Disability Class: Self-Care Difficulty
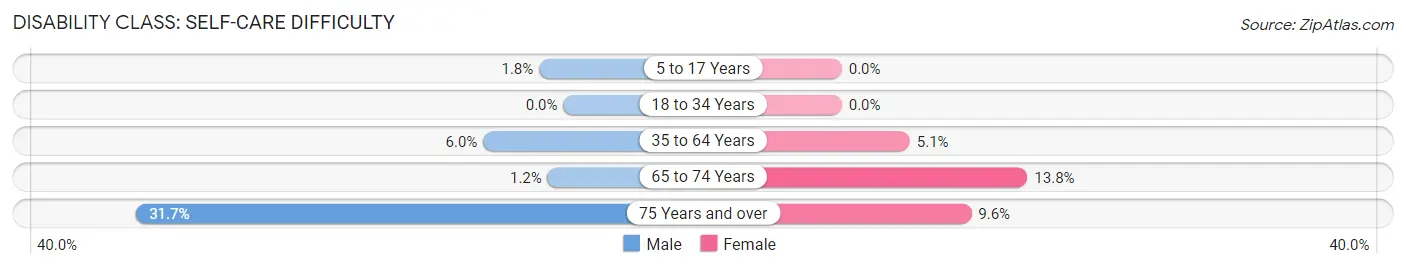
| Age Bracket | Male | Female |
| 5 to 17 Years | 15 (1.8%) | 0 (0.0%) |
| 18 to 34 Years | 0 (0.0%) | 0 (0.0%) |
| 35 to 64 Years | 105 (5.9%) | 94 (5.1%) |
| 65 to 74 Years | 4 (1.2%) | 54 (13.8%) |
| 75 Years and over | 91 (31.7%) | 35 (9.6%) |
Technology Access in Wood River
Computing Device Access in Wood River
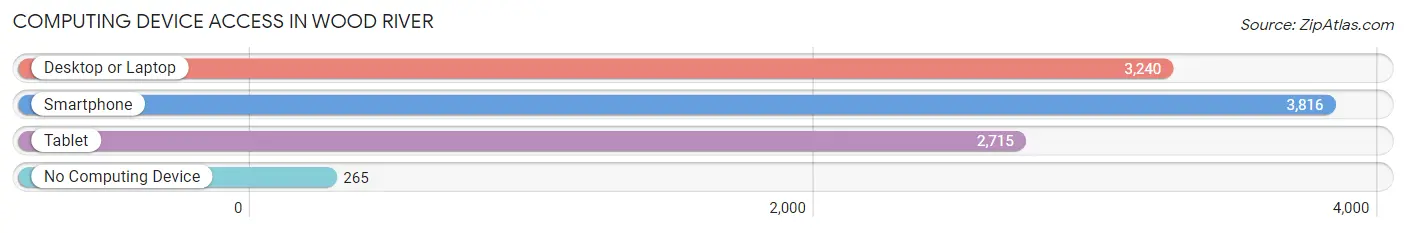
| Device Type | # Households | % Households |
| Desktop or Laptop | 3,240 | 74.0% |
| Smartphone | 3,816 | 87.2% |
| Tablet | 2,715 | 62.0% |
| No Computing Device | 265 | 6.0% |
| Total | 4,378 | 100.0% |
Internet Access in Wood River
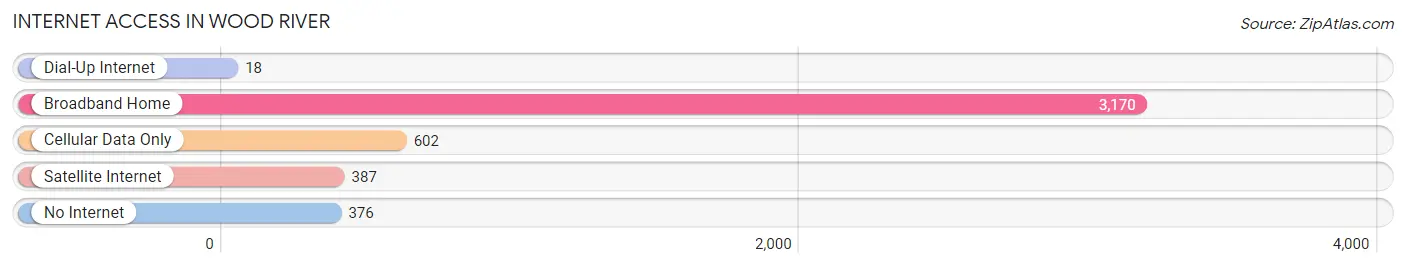
| Internet Type | # Households | % Households |
| Dial-Up Internet | 18 | 0.4% |
| Broadband Home | 3,170 | 72.4% |
| Cellular Data Only | 602 | 13.8% |
| Satellite Internet | 387 | 8.8% |
| No Internet | 376 | 8.6% |
| Total | 4,378 | 100.0% |
Wood River Summary
River Wood, Illinois is a small city located in Madison County, Illinois. It is situated on the banks of the Mississippi River, just north of St. Louis, Missouri. The city has a population of approximately 8,000 people and is part of the Greater St. Louis metropolitan area.
History
The area that is now River Wood was first settled in the early 1800s by French and German immigrants. The city was originally known as “Riviere des Bois”, which translates to “River of the Woods”. The city was officially incorporated in 1872 and was named after the nearby Wood River.
The city experienced a period of growth in the late 19th century, when the railroad was built through the area. This allowed for the transportation of goods and people to and from the city. The city also experienced a period of industrialization in the early 20th century, when several factories were built in the area.
Geography
River Wood is located in Madison County, Illinois, on the banks of the Mississippi River. The city is situated on the western edge of the St. Louis metropolitan area. The city is bordered by the cities of Alton, East Alton, and Wood River. The city is located approximately 25 miles north of St. Louis.
The city has a total area of 4.2 square miles, of which 4.1 square miles is land and 0.1 square miles is water. The city is located at an elevation of approximately 500 feet above sea level.
Economy
The economy of River Wood is largely based on manufacturing and services. The city is home to several factories, including a paper mill, a steel mill, and a chemical plant. The city is also home to several retail stores, restaurants, and other businesses.
The city is also home to several educational institutions, including Lewis and Clark Community College and the University of Illinois at Edwardsville.
Demographics
As of the 2010 census, the population of River Wood was 8,000. The racial makeup of the city was 87.3% White, 8.2% African American, 0.7% Native American, 0.7% Asian, 0.2% Pacific Islander, and 2.1% from other races. Hispanic or Latino of any race were 2.7% of the population.
The median income for a household in the city was $41,250, and the median income for a family was $50,000. The per capita income for the city was $20,845. About 11.2% of families and 14.2% of the population were below the poverty line, including 19.2% of those under age 18 and 8.2% of those age 65 or over.
River Wood is a small city with a rich history and a diverse population. The city has a strong economy based on manufacturing and services, and is home to several educational institutions. The city is also located on the banks of the Mississippi River, providing residents with access to a variety of recreational activities.
Common Questions
What is Per Capita Income in Wood River?
Per Capita income in Wood River is $31,582.
What is the Median Family Income in Wood River?
Median Family Income in Wood River is $67,115.
What is the Median Household income in Wood River?
Median Household Income in Wood River is $58,813.
What is Income or Wage Gap in Wood River?
Income or Wage Gap in Wood River is 22.4%.
Women in Wood River earn 77.6 cents for every dollar earned by a man.
What is Inequality or Gini Index in Wood River?
Inequality or Gini Index in Wood River is 0.42.
What is the Total Population of Wood River?
Total Population of Wood River is 10,313.
What is the Total Male Population of Wood River?
Total Male Population of Wood River is 4,975.
What is the Total Female Population of Wood River?
Total Female Population of Wood River is 5,338.
What is the Ratio of Males per 100 Females in Wood River?
There are 93.20 Males per 100 Females in Wood River.
What is the Ratio of Females per 100 Males in Wood River?
There are 107.30 Females per 100 Males in Wood River.
What is the Median Population Age in Wood River?
Median Population Age in Wood River is 34.6 Years.
What is the Average Family Size in Wood River
Average Family Size in Wood River is 2.8 People.
What is the Average Household Size in Wood River
Average Household Size in Wood River is 2.3 People.
How Large is the Labor Force in Wood River?
There are 5,430 People in the Labor Forcein in Wood River.
What is the Percentage of People in the Labor Force in Wood River?
67.1% of People are in the Labor Force in Wood River.
What is the Unemployment Rate in Wood River?
Unemployment Rate in Wood River is 6.1%.