West Peoria, IL Map & Demographics
West Peoria Map
West Peoria Overview
$34,034
PER CAPITA INCOME
$74,850
AVG FAMILY INCOME
$55,000
AVG HOUSEHOLD INCOME
19.1%
WAGE / INCOME GAP [ % ]
80.9¢/ $1
WAGE / INCOME GAP [ $ ]
$15,909
FAMILY INCOME DEFICIT
0.44
INEQUALITY / GINI INDEX
4,248
TOTAL POPULATION
2,131
MALE POPULATION
2,117
FEMALE POPULATION
100.66
MALES / 100 FEMALES
99.34
FEMALES / 100 MALES
46.2
MEDIAN AGE
2.7
AVG FAMILY SIZE
2.1
AVG HOUSEHOLD SIZE
2,074
LABOR FORCE [ PEOPLE ]
58.6%
PERCENT IN LABOR FORCE
5.3%
UNEMPLOYMENT RATE
West Peoria Area Codes
Income in West Peoria
Income Overview in West Peoria
Per Capita Income in West Peoria is $34,034, while median incomes of families and households are $74,850 and $55,000 respectively.
| Characteristic | Number | Measure |
| Per Capita Income | 4,248 | $34,034 |
| Median Family Income | 1,077 | $74,850 |
| Mean Family Income | 1,077 | $89,151 |
| Median Household Income | 1,886 | $55,000 |
| Mean Household Income | 1,886 | $71,826 |
| Income Deficit | 1,077 | $15,909 |
| Wage / Income Gap (%) | 4,248 | 19.08% |
| Wage / Income Gap ($) | 4,248 | 80.92¢ per $1 |
| Gini / Inequality Index | 4,248 | 0.44 |
Earnings by Sex in West Peoria
Average Earnings in West Peoria are $43,276, $44,655 for men and $36,136 for women, a difference of 19.1%.
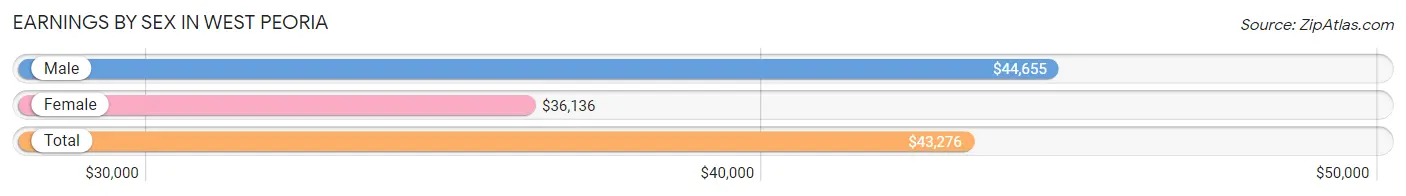
| Sex | Number | Average Earnings |
| Male | 964 (46.5%) | $44,655 |
| Female | 1,110 (53.5%) | $36,136 |
| Total | 2,074 (100.0%) | $43,276 |
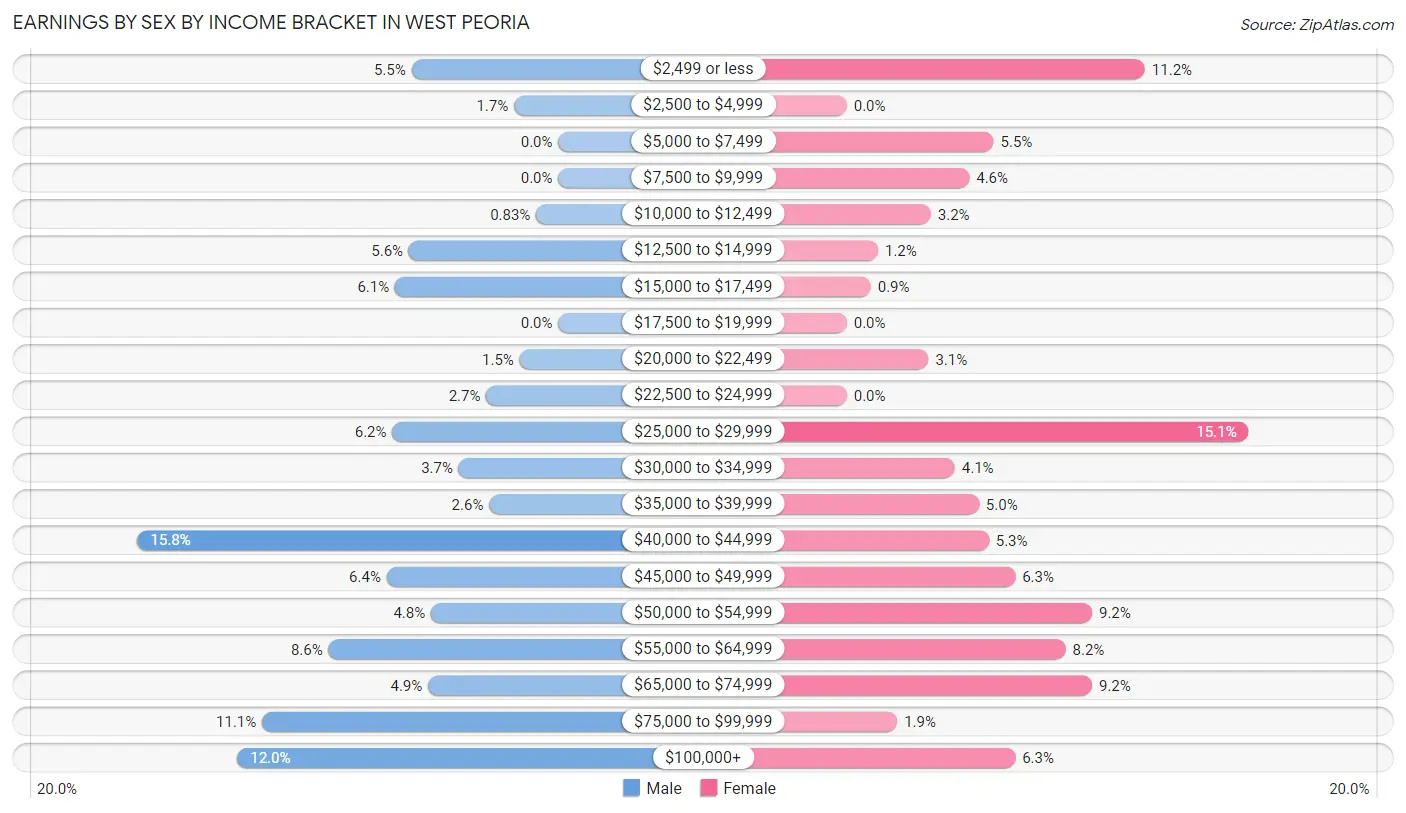
Earnings by Sex by Income Bracket in West Peoria
The most common earnings brackets in West Peoria are $40,000 to $44,999 for men (152 | 15.8%) and $25,000 to $29,999 for women (167 | 15.0%).
| Income | Male | Female |
| $2,499 or less | 53 (5.5%) | 124 (11.2%) |
| $2,500 to $4,999 | 16 (1.7%) | 0 (0.0%) |
| $5,000 to $7,499 | 0 (0.0%) | 61 (5.5%) |
| $7,500 to $9,999 | 0 (0.0%) | 51 (4.6%) |
| $10,000 to $12,499 | 8 (0.8%) | 35 (3.2%) |
| $12,500 to $14,999 | 54 (5.6%) | 13 (1.2%) |
| $15,000 to $17,499 | 59 (6.1%) | 10 (0.9%) |
| $17,500 to $19,999 | 0 (0.0%) | 0 (0.0%) |
| $20,000 to $22,499 | 14 (1.5%) | 34 (3.1%) |
| $22,500 to $24,999 | 26 (2.7%) | 0 (0.0%) |
| $25,000 to $29,999 | 60 (6.2%) | 167 (15.0%) |
| $30,000 to $34,999 | 36 (3.7%) | 45 (4.1%) |
| $35,000 to $39,999 | 25 (2.6%) | 55 (5.0%) |
| $40,000 to $44,999 | 152 (15.8%) | 59 (5.3%) |
| $45,000 to $49,999 | 62 (6.4%) | 70 (6.3%) |
| $50,000 to $54,999 | 46 (4.8%) | 102 (9.2%) |
| $55,000 to $64,999 | 83 (8.6%) | 91 (8.2%) |
| $65,000 to $74,999 | 47 (4.9%) | 102 (9.2%) |
| $75,000 to $99,999 | 107 (11.1%) | 21 (1.9%) |
| $100,000+ | 116 (12.0%) | 70 (6.3%) |
| Total | 964 (100.0%) | 1,110 (100.0%) |
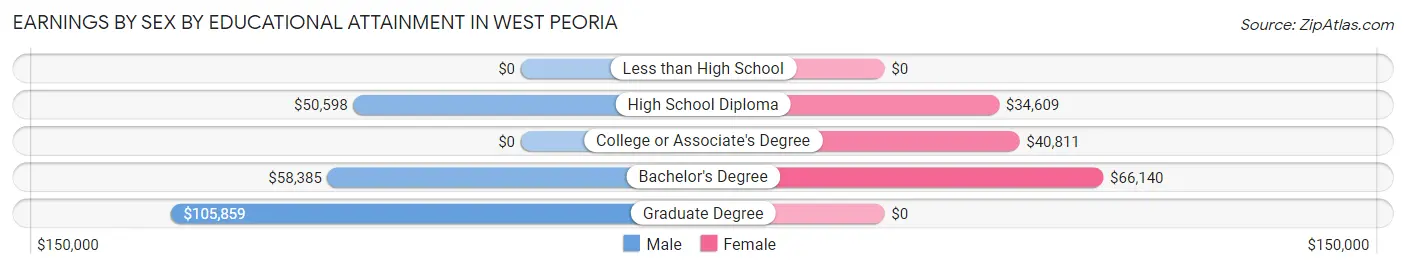
Earnings by Sex by Educational Attainment in West Peoria
Average earnings in West Peoria are $47,406 for men and $42,955 for women, a difference of 9.4%. Men with an educational attainment of graduate degree enjoy the highest average annual earnings of $105,859, while those with high school diploma education earn the least with $50,598. Women with an educational attainment of bachelor's degree earn the most with the average annual earnings of $66,140, while those with high school diploma education have the smallest earnings of $34,609.
| Educational Attainment | Male Income | Female Income |
| Less than High School | - | - |
| High School Diploma | $50,598 | $34,609 |
| College or Associate's Degree | - | - |
| Bachelor's Degree | $58,385 | $66,140 |
| Graduate Degree | $105,859 | $0 |
| Total | $47,406 | $42,955 |
Family Income in West Peoria
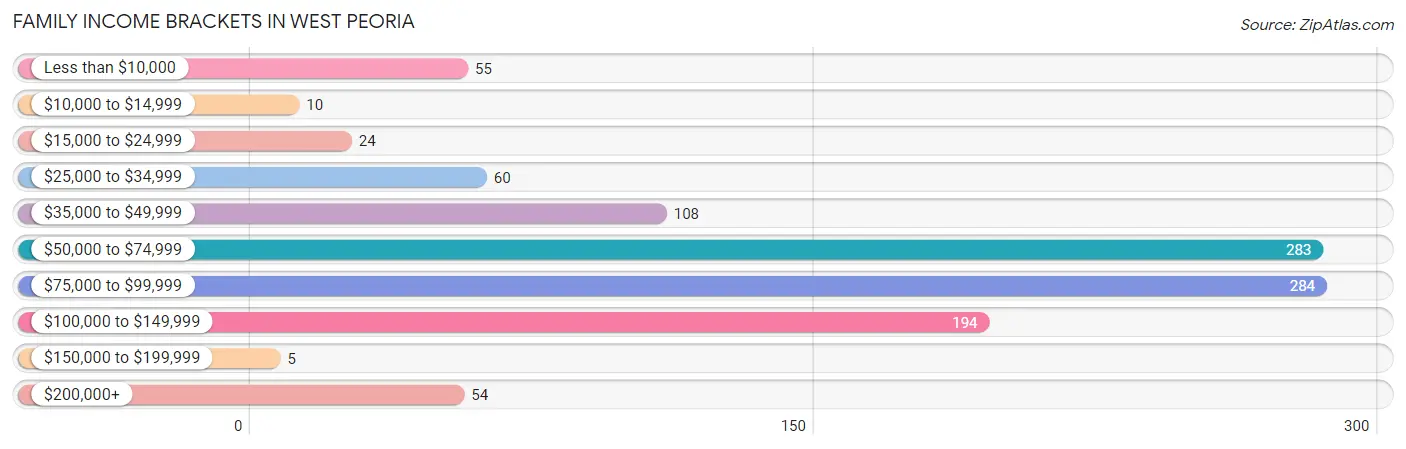
Family Income Brackets in West Peoria
According to the West Peoria family income data, there are 284 families falling into the $75,000 to $99,999 income range, which is the most common income bracket and makes up 26.4% of all families. Conversely, the $150,000 to $199,999 income bracket is the least frequent group with only 5 families (0.5%) belonging to this category.
| Income Bracket | # Families | % Families |
| Less than $10,000 | 55 | 5.1% |
| $10,000 to $14,999 | 10 | 0.9% |
| $15,000 to $24,999 | 24 | 2.2% |
| $25,000 to $34,999 | 60 | 5.6% |
| $35,000 to $49,999 | 108 | 10.0% |
| $50,000 to $74,999 | 283 | 26.3% |
| $75,000 to $99,999 | 284 | 26.4% |
| $100,000 to $149,999 | 194 | 18.0% |
| $150,000 to $199,999 | 5 | 0.5% |
| $200,000+ | 54 | 5.0% |
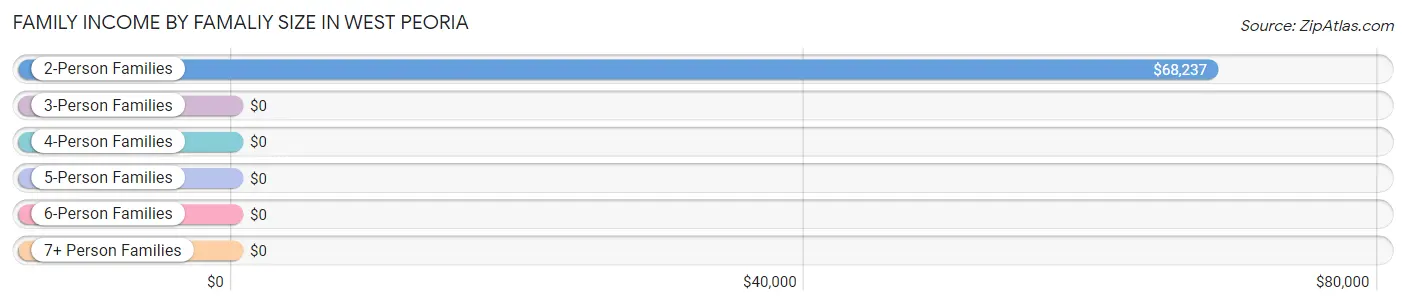
Family Income by Famaliy Size in West Peoria
2-person families (669 | 62.1%) account for the highest median family income in West Peoria with $68,237 per family, while 2-person families (669 | 62.1%) have the highest median income of $34,118 per family member.
| Income Bracket | # Families | Median Income |
| 2-Person Families | 669 (62.1%) | $68,237 |
| 3-Person Families | 168 (15.6%) | $0 |
| 4-Person Families | 177 (16.4%) | $0 |
| 5-Person Families | 51 (4.7%) | $0 |
| 6-Person Families | 12 (1.1%) | $0 |
| 7+ Person Families | 0 (0.0%) | $0 |
| Total | 1,077 (100.0%) | $74,850 |
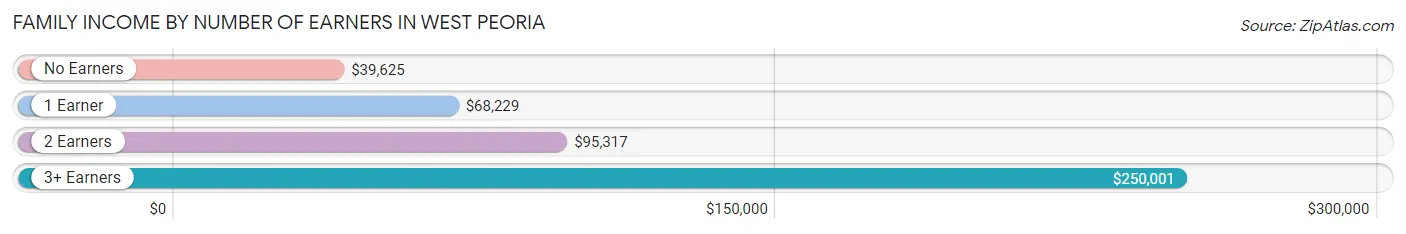
Family Income by Number of Earners in West Peoria
The median family income in West Peoria is $74,850, with families comprising 3+ earners (63) having the highest median family income of $250,001, while families with no earners (200) have the lowest median family income of $39,625, accounting for 5.9% and 18.6% of families, respectively.
| Number of Earners | # Families | Median Income |
| No Earners | 200 (18.6%) | $39,625 |
| 1 Earner | 374 (34.7%) | $68,229 |
| 2 Earners | 440 (40.8%) | $95,317 |
| 3+ Earners | 63 (5.9%) | $250,001 |
| Total | 1,077 (100.0%) | $74,850 |
Household Income in West Peoria
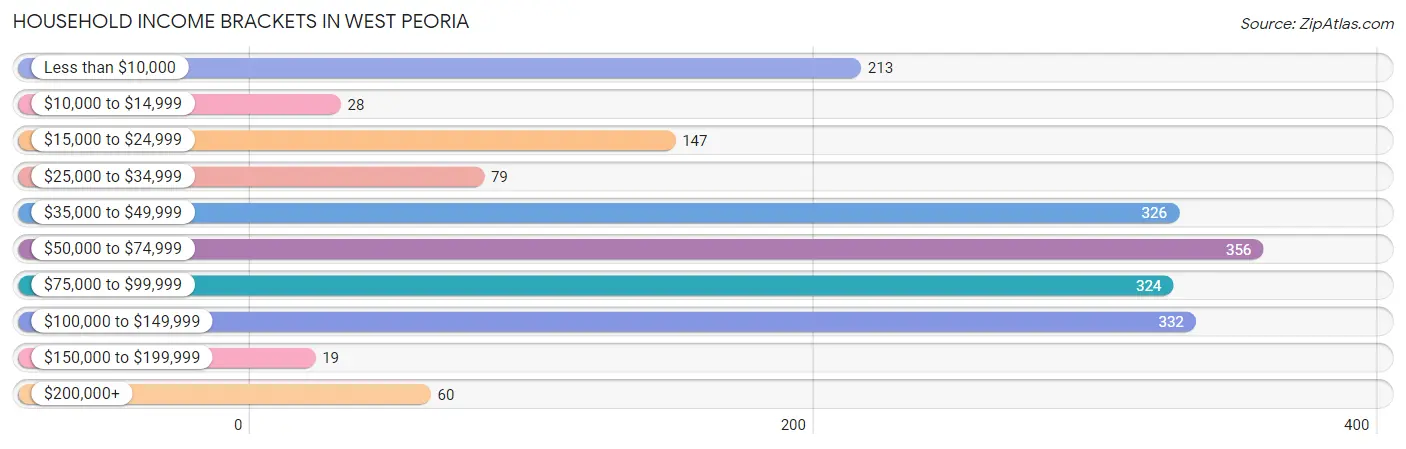
Household Income Brackets in West Peoria
With 356 households falling in the category, the $50,000 to $74,999 income range is the most frequent in West Peoria, accounting for 18.9% of all households. In contrast, only 19 households (1.0%) fall into the $150,000 to $199,999 income bracket, making it the least populous group.
| Income Bracket | # Households | % Households |
| Less than $10,000 | 213 | 11.3% |
| $10,000 to $14,999 | 28 | 1.5% |
| $15,000 to $24,999 | 147 | 7.8% |
| $25,000 to $34,999 | 79 | 4.2% |
| $35,000 to $49,999 | 326 | 17.3% |
| $50,000 to $74,999 | 356 | 18.9% |
| $75,000 to $99,999 | 324 | 17.2% |
| $100,000 to $149,999 | 332 | 17.6% |
| $150,000 to $199,999 | 19 | 1.0% |
| $200,000+ | 60 | 3.2% |
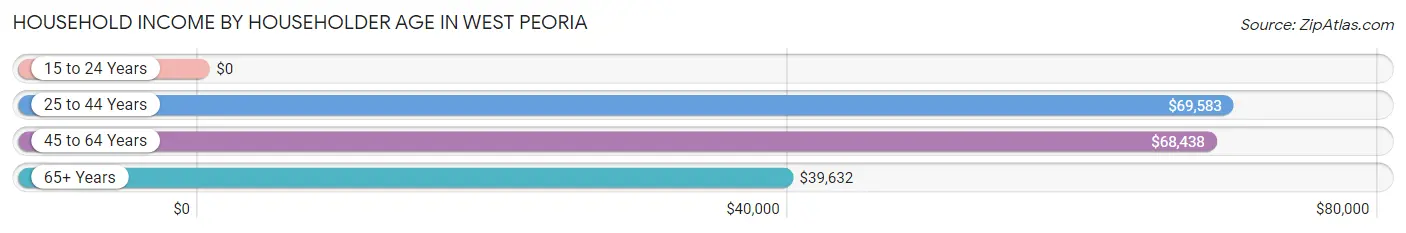
Household Income by Householder Age in West Peoria
The median household income in West Peoria is $55,000, with the highest median household income of $69,583 found in the 25 to 44 years age bracket for the primary householder. A total of 589 households (31.2%) fall into this category. Meanwhile, the 15 to 24 years age bracket for the primary householder has the lowest median household income of $0, with 17 households (0.9%) in this group.
| Income Bracket | # Households | Median Income |
| 15 to 24 Years | 17 (0.9%) | $0 |
| 25 to 44 Years | 589 (31.2%) | $69,583 |
| 45 to 64 Years | 775 (41.1%) | $68,438 |
| 65+ Years | 505 (26.8%) | $39,632 |
| Total | 1,886 (100.0%) | $55,000 |
Poverty in West Peoria
Income Below Poverty by Sex and Age in West Peoria
With 12.4% poverty level for males and 8.9% for females among the residents of West Peoria, 55 to 64 year old males and 18 to 24 year old females are the most vulnerable to poverty, with 134 males (31.9%) and 12 females (25.5%) in their respective age groups living below the poverty level.
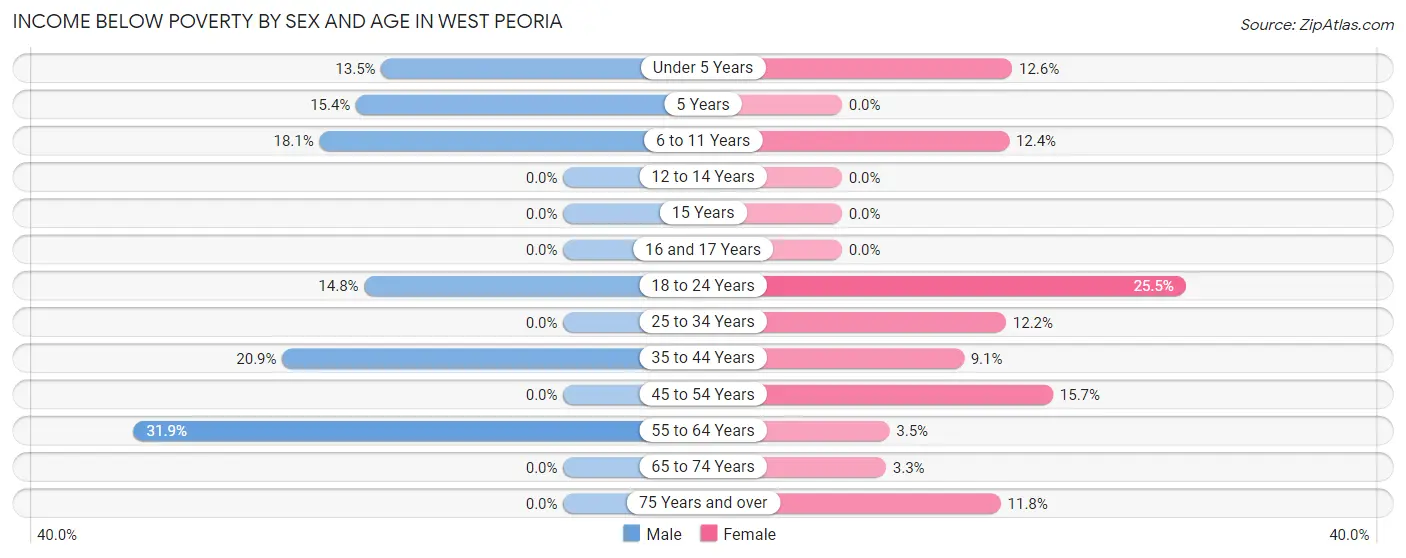
| Age Bracket | Male | Female |
| Under 5 Years | 15 (13.5%) | 11 (12.6%) |
| 5 Years | 10 (15.4%) | 0 (0.0%) |
| 6 to 11 Years | 40 (18.1%) | 17 (12.4%) |
| 12 to 14 Years | 0 (0.0%) | 0 (0.0%) |
| 15 Years | 0 (0.0%) | 0 (0.0%) |
| 16 and 17 Years | 0 (0.0%) | 0 (0.0%) |
| 18 to 24 Years | 22 (14.8%) | 12 (25.5%) |
| 25 to 34 Years | 0 (0.0%) | 24 (12.2%) |
| 35 to 44 Years | 29 (20.9%) | 20 (9.0%) |
| 45 to 54 Years | 0 (0.0%) | 42 (15.7%) |
| 55 to 64 Years | 134 (31.9%) | 11 (3.5%) |
| 65 to 74 Years | 0 (0.0%) | 9 (3.3%) |
| 75 Years and over | 0 (0.0%) | 27 (11.8%) |
| Total | 250 (12.4%) | 173 (8.9%) |
Income Above Poverty by Sex and Age in West Peoria
According to the poverty statistics in West Peoria, males aged 15 years and females aged 5 years are the age groups that are most secure financially, with 100.0% of males and 100.0% of females in these age groups living above the poverty line.
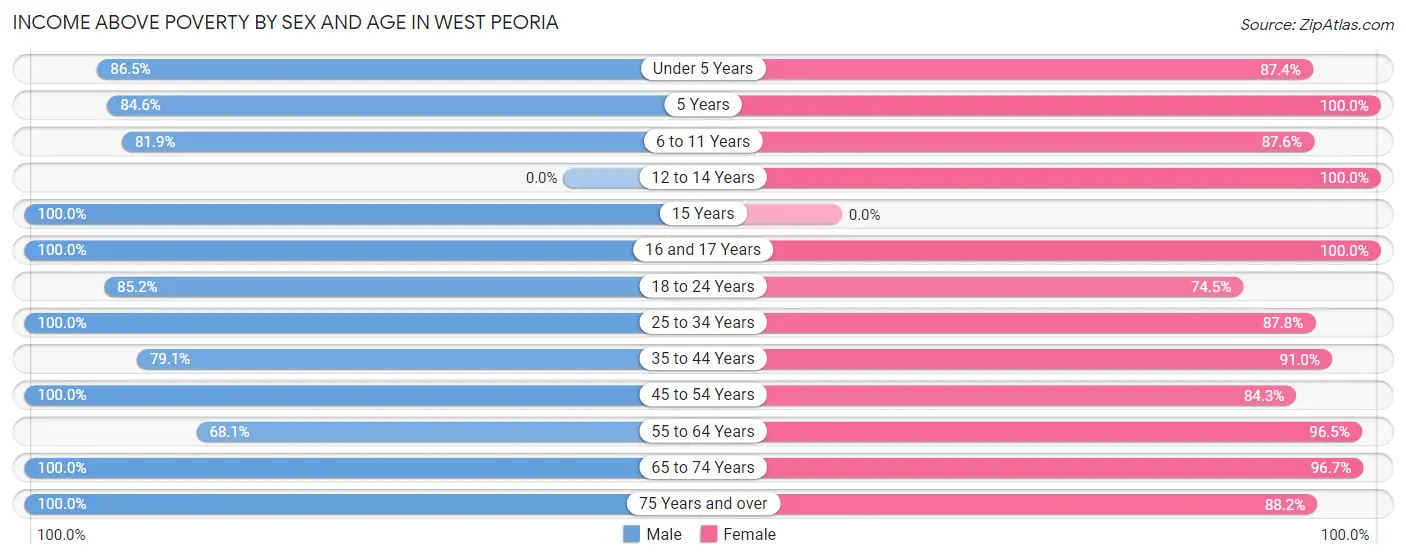
| Age Bracket | Male | Female |
| Under 5 Years | 96 (86.5%) | 76 (87.4%) |
| 5 Years | 55 (84.6%) | 25 (100.0%) |
| 6 to 11 Years | 181 (81.9%) | 120 (87.6%) |
| 12 to 14 Years | 0 (0.0%) | 15 (100.0%) |
| 15 Years | 47 (100.0%) | 0 (0.0%) |
| 16 and 17 Years | 8 (100.0%) | 130 (100.0%) |
| 18 to 24 Years | 127 (85.2%) | 35 (74.5%) |
| 25 to 34 Years | 424 (100.0%) | 173 (87.8%) |
| 35 to 44 Years | 110 (79.1%) | 201 (90.9%) |
| 45 to 54 Years | 154 (100.0%) | 226 (84.3%) |
| 55 to 64 Years | 286 (68.1%) | 301 (96.5%) |
| 65 to 74 Years | 176 (100.0%) | 266 (96.7%) |
| 75 Years and over | 106 (100.0%) | 202 (88.2%) |
| Total | 1,770 (87.6%) | 1,770 (91.1%) |
Income Below Poverty Among Married-Couple Families in West Peoria
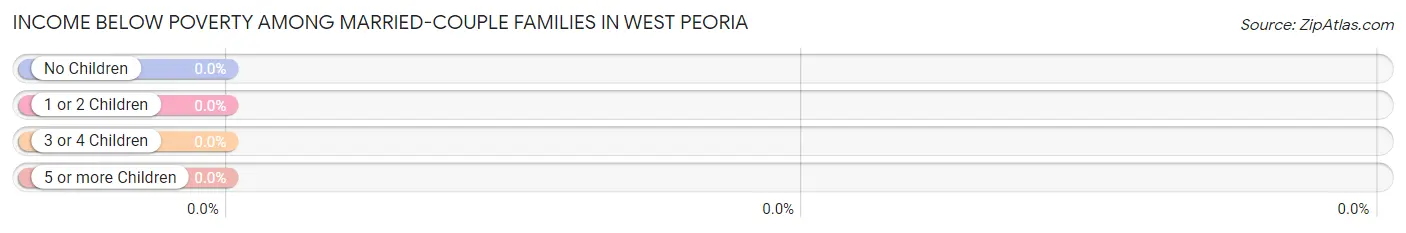
| Children | Above Poverty | Below Poverty |
| No Children | 428 (100.0%) | 0 (0.0%) |
| 1 or 2 Children | 122 (100.0%) | 0 (0.0%) |
| 3 or 4 Children | 36 (100.0%) | 0 (0.0%) |
| 5 or more Children | 0 (0.0%) | 0 (0.0%) |
| Total | 586 (100.0%) | 0 (0.0%) |
Income Below Poverty Among Single-Parent Households in West Peoria
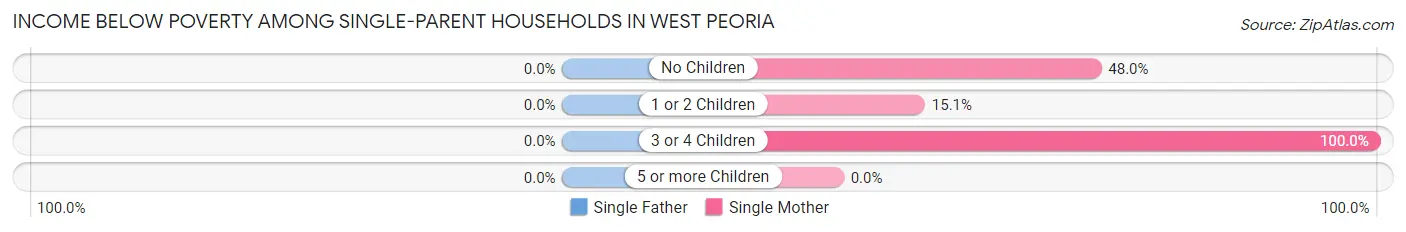
| Children | Single Father | Single Mother |
| No Children | 0 (0.0%) | 36 (48.0%) |
| 1 or 2 Children | 0 (0.0%) | 26 (15.1%) |
| 3 or 4 Children | 0 (0.0%) | 13 (100.0%) |
| 5 or more Children | 0 (0.0%) | 0 (0.0%) |
| Total | 0 (0.0%) | 75 (28.8%) |
Income Below Poverty Among Married-Couple vs Single-Parent Households in West Peoria
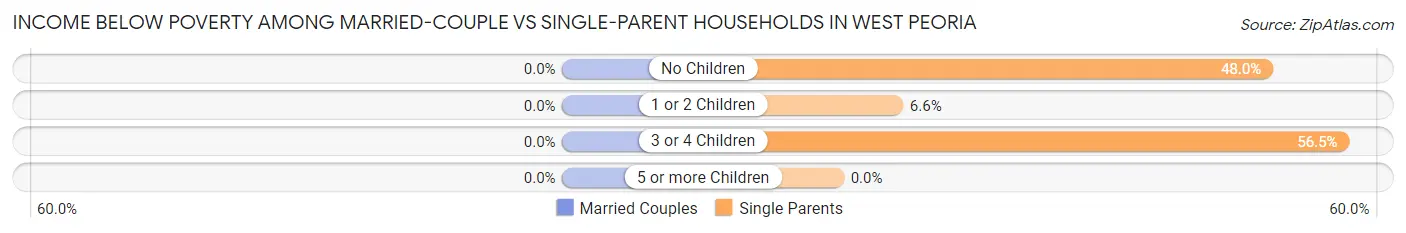
| Children | Married-Couple Families | Single-Parent Households |
| No Children | 0 (0.0%) | 36 (48.0%) |
| 1 or 2 Children | 0 (0.0%) | 26 (6.6%) |
| 3 or 4 Children | 0 (0.0%) | 13 (56.5%) |
| 5 or more Children | 0 (0.0%) | 0 (0.0%) |
| Total | 0 (0.0%) | 75 (15.3%) |
Race in West Peoria
The most populous races in West Peoria are White / Caucasian (2,953 | 69.5%), Black / African American (780 | 18.4%), and Two or more Races (355 | 8.4%).
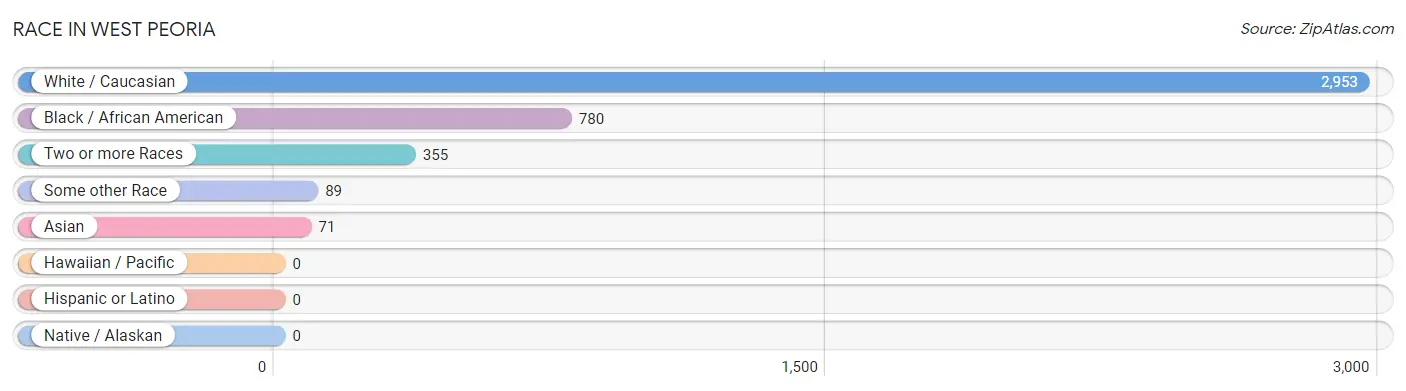
| Race | # Population | % Population |
| Asian | 71 | 1.7% |
| Black / African American | 780 | 18.4% |
| Hawaiian / Pacific | 0 | 0.0% |
| Hispanic or Latino | 0 | 0.0% |
| Native / Alaskan | 0 | 0.0% |
| White / Caucasian | 2,953 | 69.5% |
| Two or more Races | 355 | 8.4% |
| Some other Race | 89 | 2.1% |
| Total | 4,248 | 100.0% |
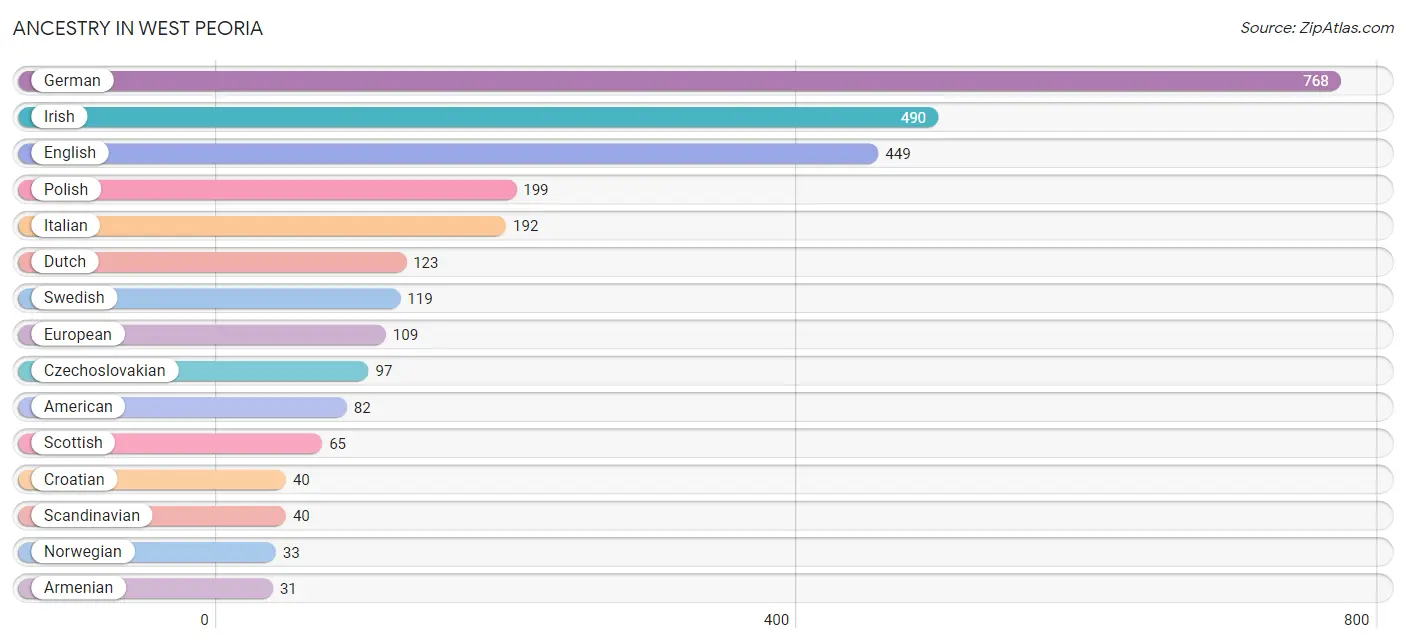
Ancestry in West Peoria
The most populous ancestries reported in West Peoria are German (768 | 18.1%), Irish (490 | 11.5%), English (449 | 10.6%), Polish (199 | 4.7%), and Italian (192 | 4.5%), together accounting for 49.4% of all West Peoria residents.
| Ancestry | # Population | % Population |
| African | 17 | 0.4% |
| American | 82 | 1.9% |
| Arab | 18 | 0.4% |
| Armenian | 31 | 0.7% |
| Bhutanese | 8 | 0.2% |
| British | 12 | 0.3% |
| Canadian | 16 | 0.4% |
| Cherokee | 6 | 0.1% |
| Croatian | 40 | 0.9% |
| Czechoslovakian | 97 | 2.3% |
| Danish | 10 | 0.2% |
| Dutch | 123 | 2.9% |
| Eastern European | 16 | 0.4% |
| Egyptian | 18 | 0.4% |
| English | 449 | 10.6% |
| European | 109 | 2.6% |
| French | 30 | 0.7% |
| German | 768 | 18.1% |
| Irish | 490 | 11.5% |
| Italian | 192 | 4.5% |
| Norwegian | 33 | 0.8% |
| Polish | 199 | 4.7% |
| Potawatomi | 4 | 0.1% |
| Scandinavian | 40 | 0.9% |
| Scotch-Irish | 12 | 0.3% |
| Scottish | 65 | 1.5% |
| Sri Lankan | 12 | 0.3% |
| Subsaharan African | 17 | 0.4% |
| Swedish | 119 | 2.8% |
| Swiss | 11 | 0.3% |
| Welsh | 31 | 0.7% | View All 31 Rows |
Immigrants in West Peoria
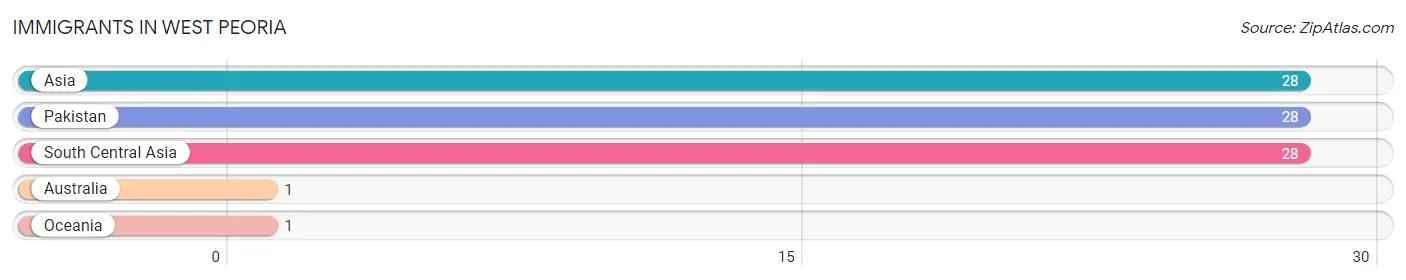
The most numerous immigrant groups reported in West Peoria came from Asia (28 | 0.7%), Pakistan (28 | 0.7%), South Central Asia (28 | 0.7%), Australia (1 | 0.0%), and Oceania (1 | 0.0%), together accounting for 2.0% of all West Peoria residents.
| Immigration Origin | # Population | % Population |
| Asia | 28 | 0.7% |
| Australia | 1 | 0.0% |
| Oceania | 1 | 0.0% |
| Pakistan | 28 | 0.7% |
| South Central Asia | 28 | 0.7% | View All 5 Rows |
Sex and Age in West Peoria
Sex and Age in West Peoria
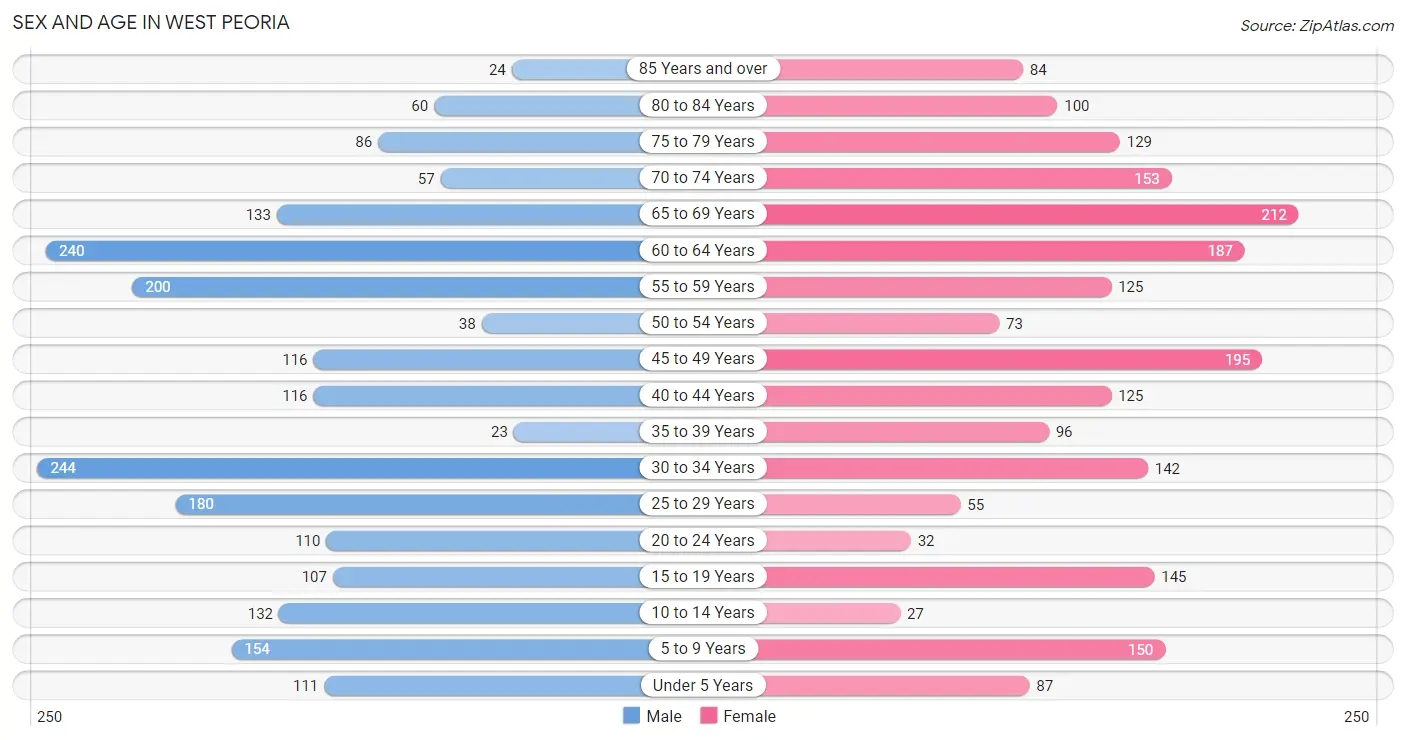
The most populous age groups in West Peoria are 30 to 34 Years (244 | 11.5%) for men and 65 to 69 Years (212 | 10.0%) for women.
| Age Bracket | Male | Female |
| Under 5 Years | 111 (5.2%) | 87 (4.1%) |
| 5 to 9 Years | 154 (7.2%) | 150 (7.1%) |
| 10 to 14 Years | 132 (6.2%) | 27 (1.3%) |
| 15 to 19 Years | 107 (5.0%) | 145 (6.9%) |
| 20 to 24 Years | 110 (5.2%) | 32 (1.5%) |
| 25 to 29 Years | 180 (8.5%) | 55 (2.6%) |
| 30 to 34 Years | 244 (11.5%) | 142 (6.7%) |
| 35 to 39 Years | 23 (1.1%) | 96 (4.5%) |
| 40 to 44 Years | 116 (5.4%) | 125 (5.9%) |
| 45 to 49 Years | 116 (5.4%) | 195 (9.2%) |
| 50 to 54 Years | 38 (1.8%) | 73 (3.5%) |
| 55 to 59 Years | 200 (9.4%) | 125 (5.9%) |
| 60 to 64 Years | 240 (11.3%) | 187 (8.8%) |
| 65 to 69 Years | 133 (6.2%) | 212 (10.0%) |
| 70 to 74 Years | 57 (2.7%) | 153 (7.2%) |
| 75 to 79 Years | 86 (4.0%) | 129 (6.1%) |
| 80 to 84 Years | 60 (2.8%) | 100 (4.7%) |
| 85 Years and over | 24 (1.1%) | 84 (4.0%) |
| Total | 2,131 (100.0%) | 2,117 (100.0%) |
Families and Households in West Peoria
Median Family Size in West Peoria
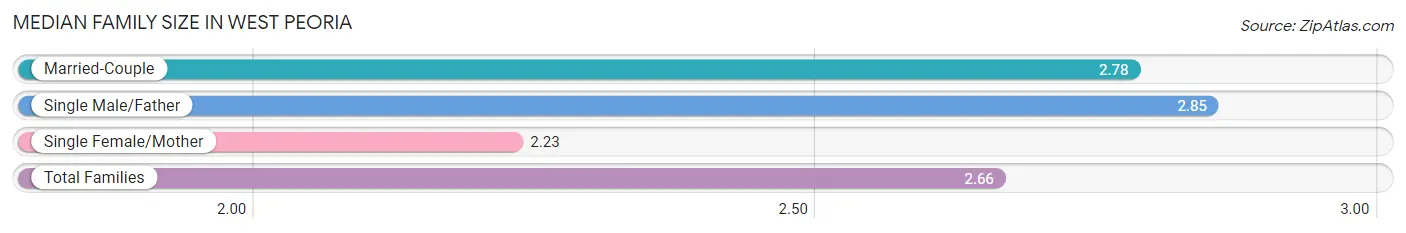
The median family size in West Peoria is 2.66 persons per family, with single male/father families (231 | 21.4%) accounting for the largest median family size of 2.85 persons per family. On the other hand, single female/mother families (260 | 24.1%) represent the smallest median family size with 2.23 persons per family.
| Family Type | # Families | Family Size |
| Married-Couple | 586 (54.4%) | 2.78 |
| Single Male/Father | 231 (21.4%) | 2.85 |
| Single Female/Mother | 260 (24.1%) | 2.23 |
| Total Families | 1,077 (100.0%) | 2.66 |
Median Household Size in West Peoria
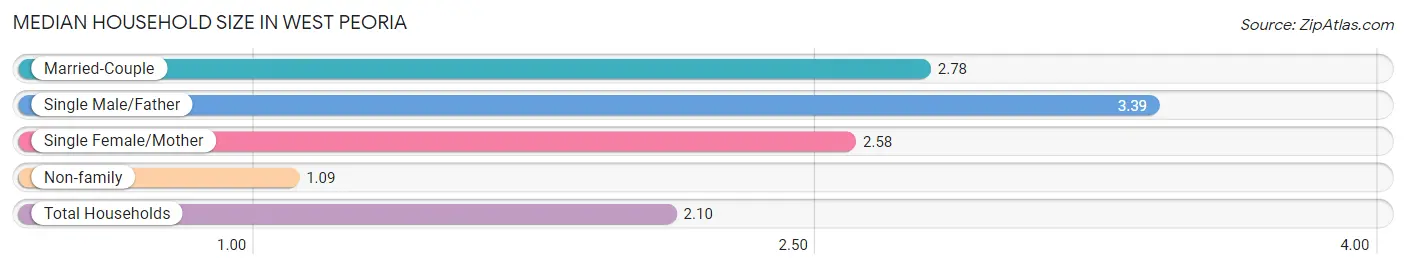
The median household size in West Peoria is 2.10 persons per household, with single male/father households (231 | 12.2%) accounting for the largest median household size of 3.39 persons per household. non-family households (809 | 42.9%) represent the smallest median household size with 1.09 persons per household.
| Household Type | # Households | Household Size |
| Married-Couple | 586 (31.1%) | 2.78 |
| Single Male/Father | 231 (12.2%) | 3.39 |
| Single Female/Mother | 260 (13.8%) | 2.58 |
| Non-family | 809 (42.9%) | 1.09 |
| Total Households | 1,886 (100.0%) | 2.10 |
Household Size by Marriage Status in West Peoria
Out of a total of 1,886 households in West Peoria, 1,077 (57.1%) are family households, while 809 (42.9%) are nonfamily households. The most numerous type of family households are 2-person households, comprising 561, and the most common type of nonfamily households are 1-person households, comprising 747.
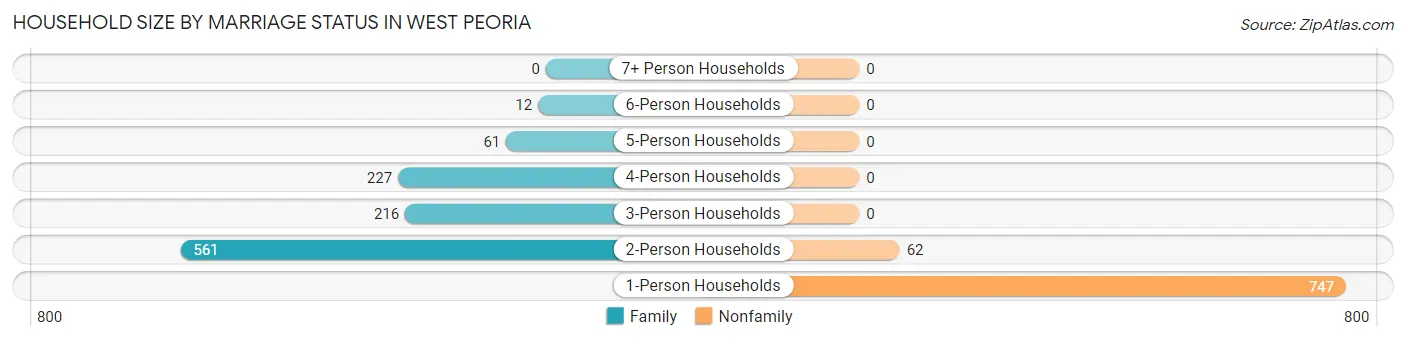
| Household Size | Family Households | Nonfamily Households |
| 1-Person Households | - | 747 (39.6%) |
| 2-Person Households | 561 (29.7%) | 62 (3.3%) |
| 3-Person Households | 216 (11.5%) | 0 (0.0%) |
| 4-Person Households | 227 (12.0%) | 0 (0.0%) |
| 5-Person Households | 61 (3.2%) | 0 (0.0%) |
| 6-Person Households | 12 (0.6%) | 0 (0.0%) |
| 7+ Person Households | 0 (0.0%) | 0 (0.0%) |
| Total | 1,077 (57.1%) | 809 (42.9%) |
Female Fertility in West Peoria
Fertility by Age in West Peoria
Average fertility rate in West Peoria is 27.0 births per 1,000 women. Women in the age bracket of 20 to 34 years have the highest fertility rate with 48.0 births per 1,000 women. Women in the age bracket of 20 to 34 years acount for 52.4% of all women with births.
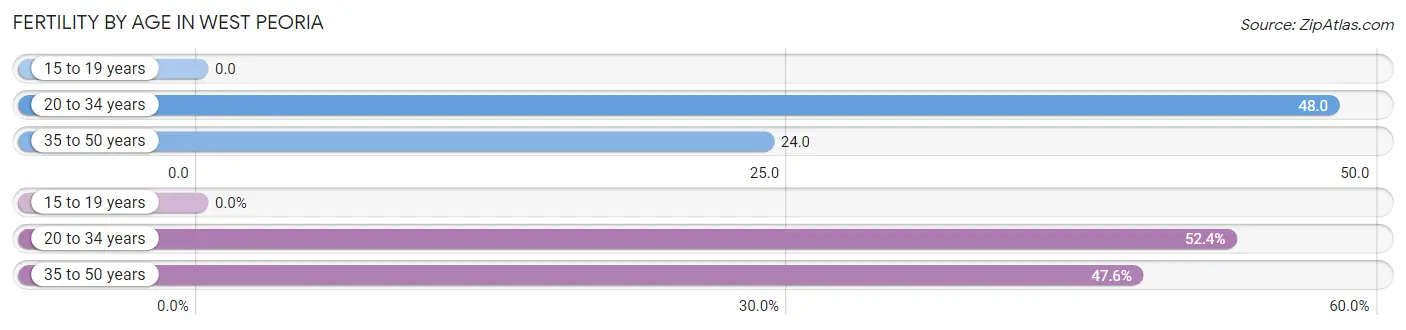
| Age Bracket | Women with Births | Births / 1,000 Women |
| 15 to 19 years | 0 (0.0%) | 0.0 |
| 20 to 34 years | 11 (52.4%) | 48.0 |
| 35 to 50 years | 10 (47.6%) | 24.0 |
| Total | 21 (100.0%) | 27.0 |
Fertility by Age by Marriage Status in West Peoria
47.6% of women with births (21) in West Peoria are married. The highest percentage of unmarried women with births falls into 20 to 34 years age bracket with 100.0% of them unmarried at the time of birth, while the lowest percentage of unmarried women with births belong to 35 to 50 years age bracket with 0.0% of them unmarried.
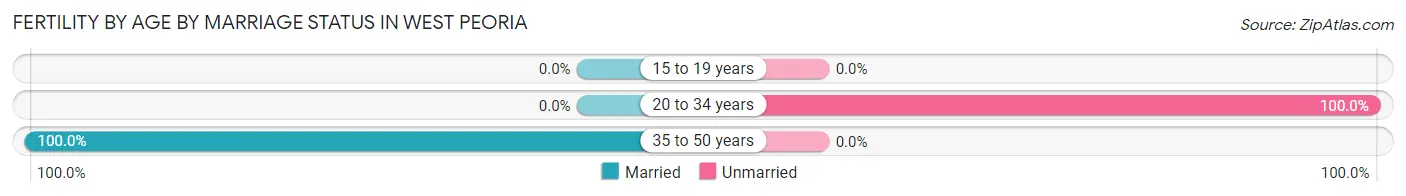
| Age Bracket | Married | Unmarried |
| 15 to 19 years | 0 (0.0%) | 0 (0.0%) |
| 20 to 34 years | 0 (0.0%) | 11 (100.0%) |
| 35 to 50 years | 10 (100.0%) | 0 (0.0%) |
| Total | 10 (47.6%) | 11 (52.4%) |
Fertility by Education in West Peoria
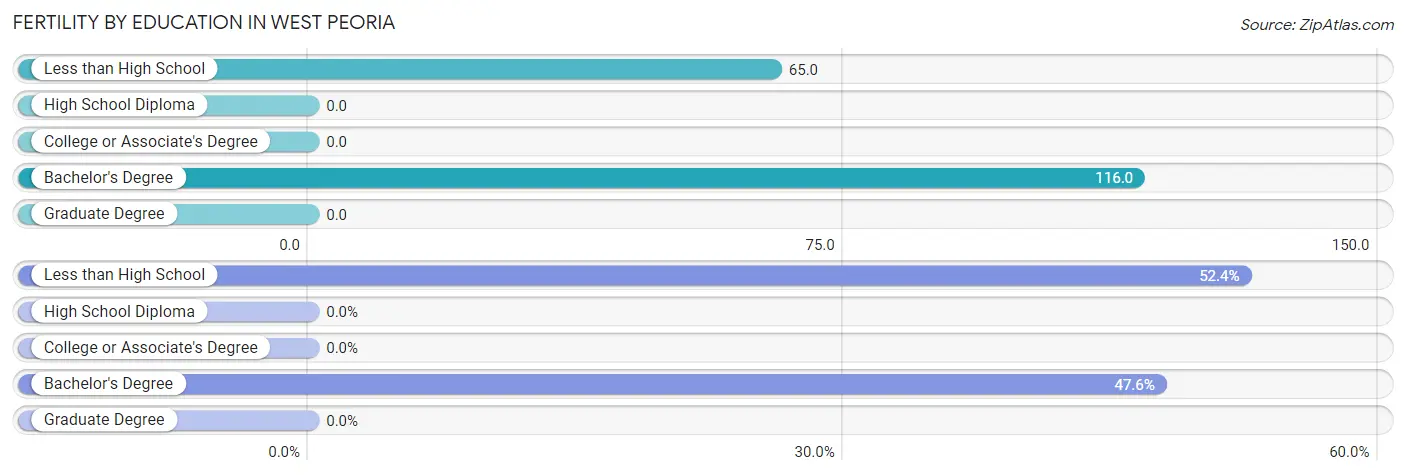
| Educational Attainment | Women with Births | Births / 1,000 Women |
| Less than High School | 11 (52.4%) | 65.0 |
| High School Diploma | 0 (0.0%) | 0.0 |
| College or Associate's Degree | 0 (0.0%) | 0.0 |
| Bachelor's Degree | 10 (47.6%) | 116.0 |
| Graduate Degree | 0 (0.0%) | 0.0 |
| Total | 21 (100.0%) | 27.0 |
Fertility by Education by Marriage Status in West Peoria
52.4% of women with births in West Peoria are unmarried. Women with the educational attainment of bachelor's degree are most likely to be married with 100.0% of them married at childbirth, while women with the educational attainment of less than high school are least likely to be married with 100.0% of them unmarried at childbirth.
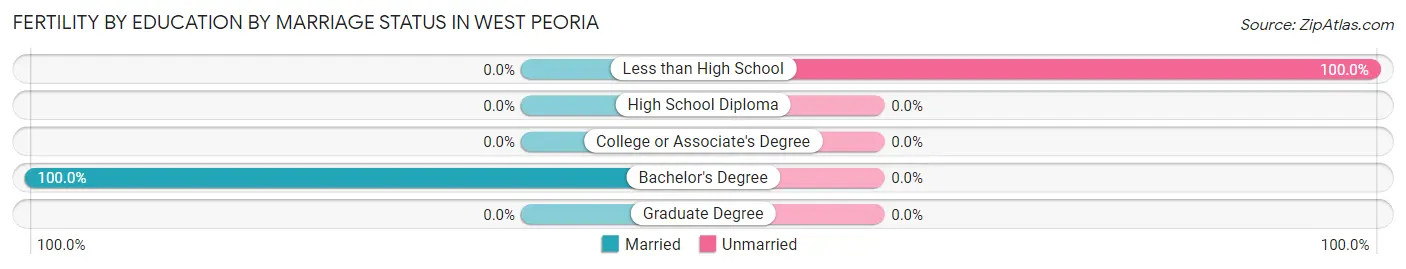
| Educational Attainment | Married | Unmarried |
| Less than High School | 0 (0.0%) | 11 (100.0%) |
| High School Diploma | 0 (0.0%) | 0 (0.0%) |
| College or Associate's Degree | 0 (0.0%) | 0 (0.0%) |
| Bachelor's Degree | 10 (100.0%) | 0 (0.0%) |
| Graduate Degree | 0 (0.0%) | 0 (0.0%) |
| Total | 10 (47.6%) | 11 (52.4%) |
Employment Characteristics in West Peoria
Employment by Class of Employer in West Peoria
Among the 1,921 employed individuals in West Peoria, private company employees (1,527 | 79.5%), not-for-profit organizations (190 | 9.9%), and local government employees (110 | 5.7%) make up the most common classes of employment.
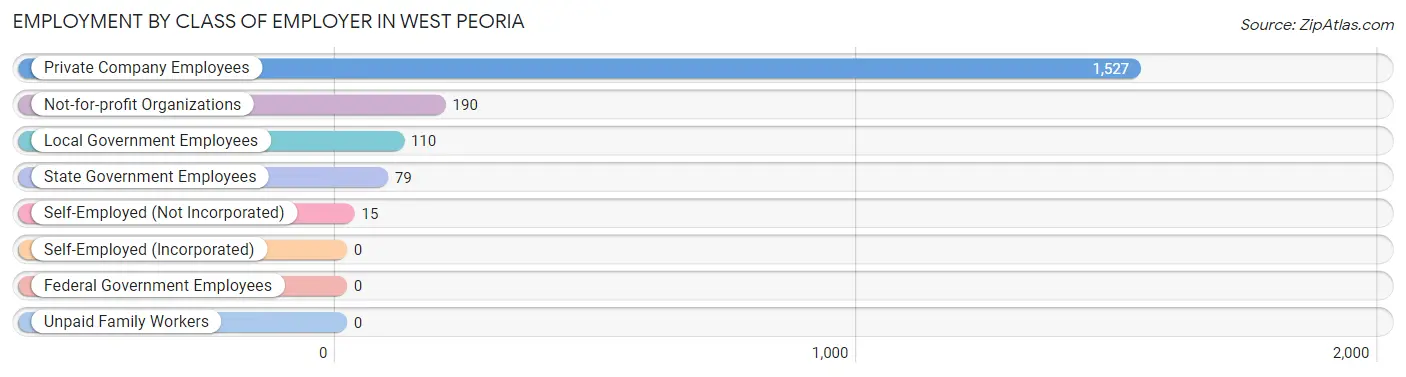
| Employer Class | # Employees | % Employees |
| Private Company Employees | 1,527 | 79.5% |
| Self-Employed (Incorporated) | 0 | 0.0% |
| Self-Employed (Not Incorporated) | 15 | 0.8% |
| Not-for-profit Organizations | 190 | 9.9% |
| Local Government Employees | 110 | 5.7% |
| State Government Employees | 79 | 4.1% |
| Federal Government Employees | 0 | 0.0% |
| Unpaid Family Workers | 0 | 0.0% |
| Total | 1,921 | 100.0% |
Employment Status by Age in West Peoria
According to the labor force statistics for West Peoria, out of the total population over 16 years of age (3,540), 58.6% or 2,074 individuals are in the labor force, with 5.3% or 110 of them unemployed. The age group with the highest labor force participation rate is 30 to 34 years, with 98.2% or 379 individuals in the labor force. Within the labor force, the 25 to 29 years age range has the highest percentage of unemployed individuals, with 46.2% or 90 of them being unemployed.
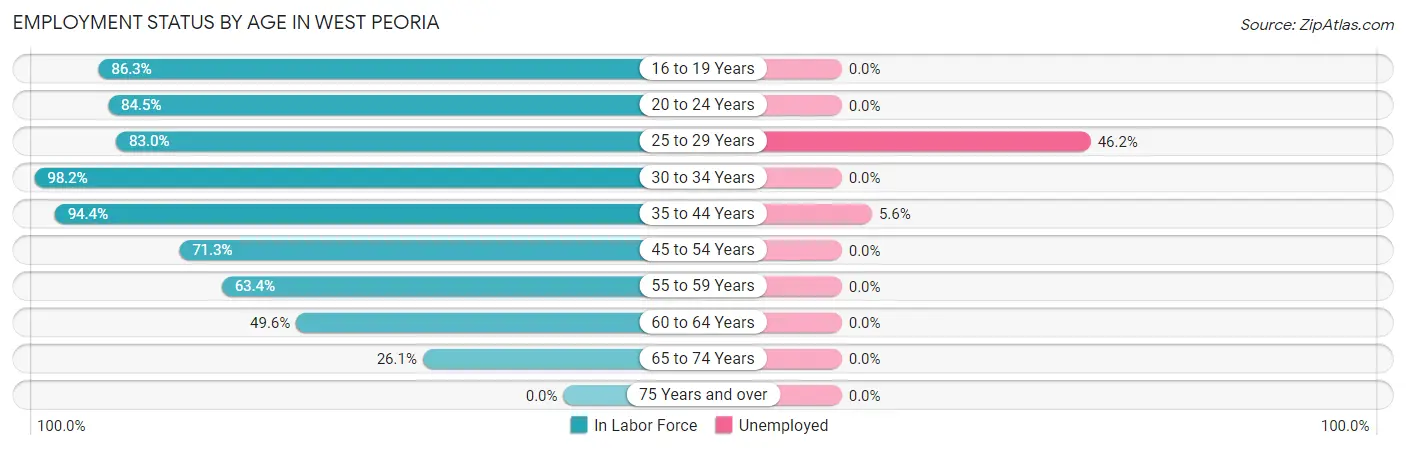
| Age Bracket | In Labor Force | Unemployed |
| 16 to 19 Years | 177 (86.3%) | 0 (0.0%) |
| 20 to 24 Years | 120 (84.5%) | 0 (0.0%) |
| 25 to 29 Years | 195 (83.0%) | 90 (46.2%) |
| 30 to 34 Years | 379 (98.2%) | 0 (0.0%) |
| 35 to 44 Years | 340 (94.4%) | 19 (5.6%) |
| 45 to 54 Years | 301 (71.3%) | 0 (0.0%) |
| 55 to 59 Years | 206 (63.4%) | 0 (0.0%) |
| 60 to 64 Years | 212 (49.6%) | 0 (0.0%) |
| 65 to 74 Years | 145 (26.1%) | 0 (0.0%) |
| 75 Years and over | 0 (0.0%) | 0 (0.0%) |
| Total | 2,074 (58.6%) | 110 (5.3%) |
Employment Status by Educational Attainment in West Peoria
According to labor force statistics for West Peoria, 75.8% of individuals (1,633) out of the total population between 25 and 64 years of age (2,155) are in the labor force, with 6.7% or 109 of them being unemployed. The group with the highest labor force participation rate are those with the educational attainment of less than high school, with 82.1% or 179 individuals in the labor force. Within the labor force, individuals with less than high school education have the highest percentage of unemployment, with 50.3% or 90 of them being unemployed.
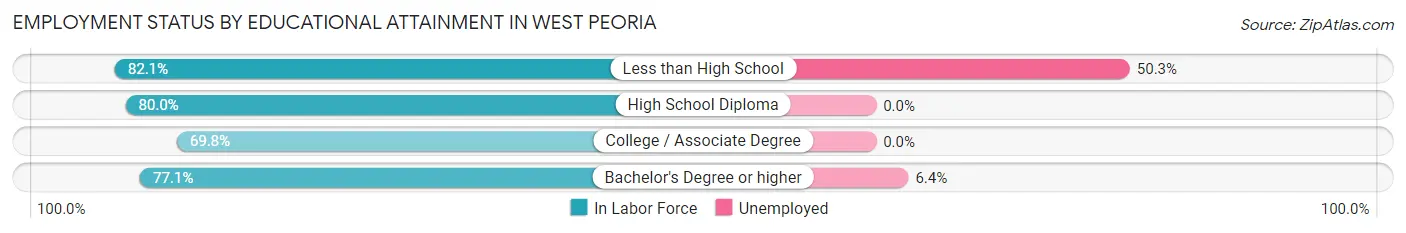
| Educational Attainment | In Labor Force | Unemployed |
| Less than High School | 179 (82.1%) | 110 (50.3%) |
| High School Diploma | 581 (80.0%) | 0 (0.0%) |
| College / Associate Degree | 577 (69.8%) | 0 (0.0%) |
| Bachelor's Degree or higher | 296 (77.1%) | 25 (6.4%) |
| Total | 1,633 (75.8%) | 144 (6.7%) |
Employment Occupations by Sex in West Peoria
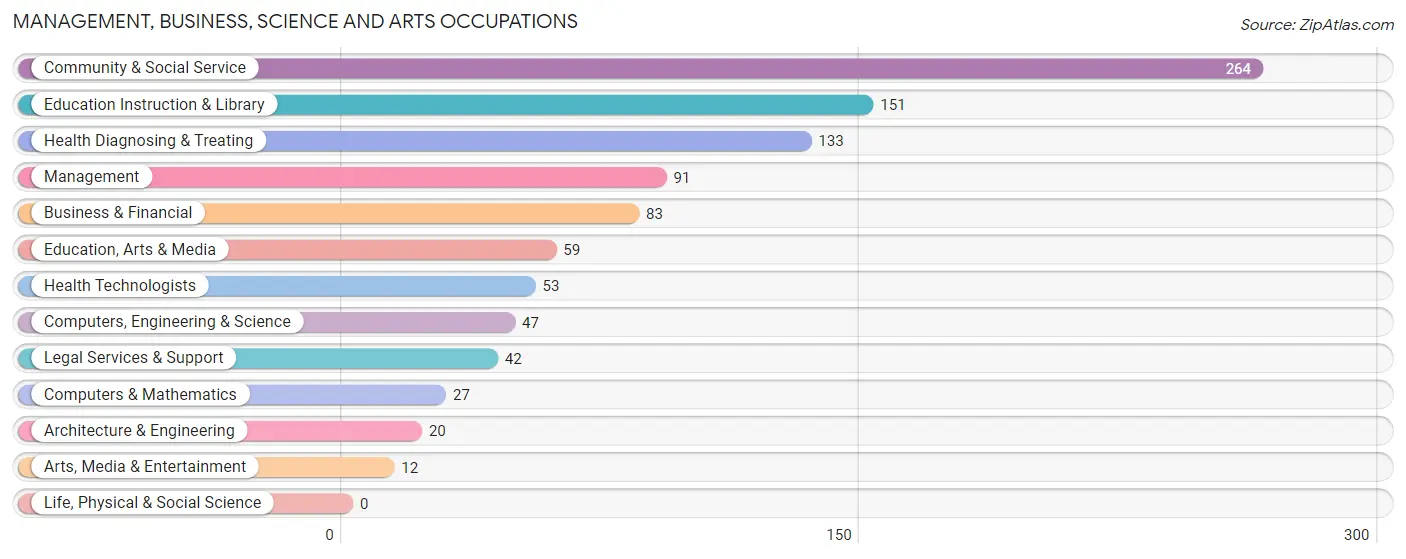
Management, Business, Science and Arts Occupations
The most common Management, Business, Science and Arts occupations in West Peoria are Community & Social Service (264 | 13.4%), Education Instruction & Library (151 | 7.7%), Health Diagnosing & Treating (133 | 6.8%), Management (91 | 4.6%), and Business & Financial (83 | 4.2%).
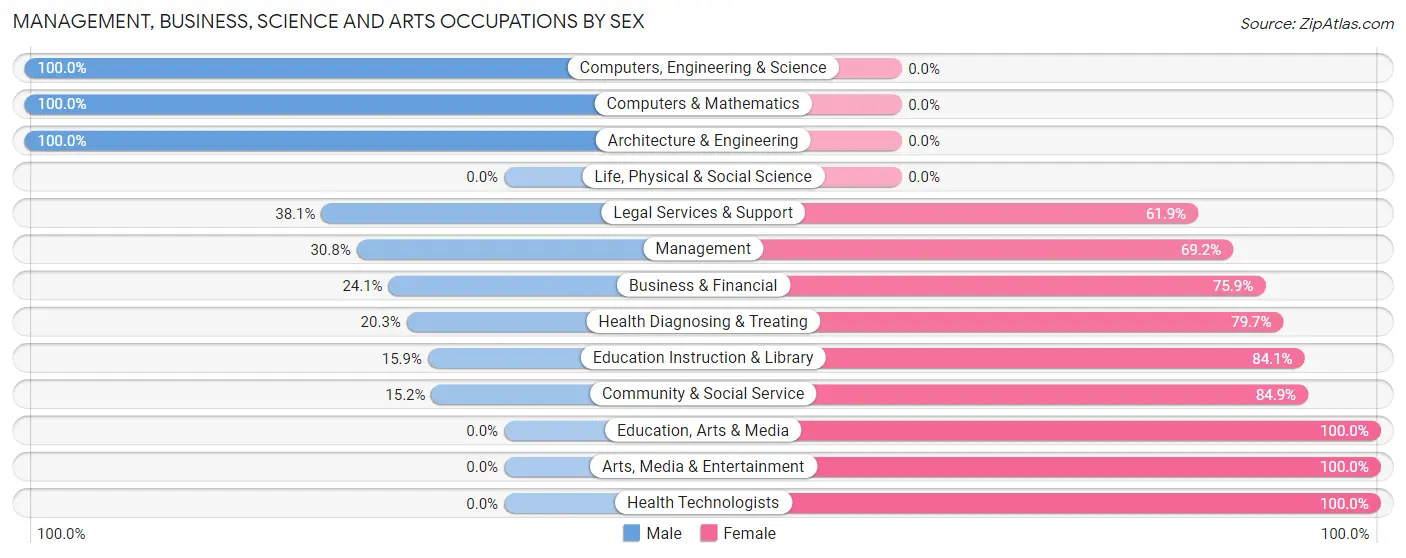
Management, Business, Science and Arts Occupations by Sex
Within the Management, Business, Science and Arts occupations in West Peoria, the most male-oriented occupations are Computers, Engineering & Science (100.0%), Computers & Mathematics (100.0%), and Architecture & Engineering (100.0%), while the most female-oriented occupations are Education, Arts & Media (100.0%), Arts, Media & Entertainment (100.0%), and Health Technologists (100.0%).
| Occupation | Male | Female |
| Management | 28 (30.8%) | 63 (69.2%) |
| Business & Financial | 20 (24.1%) | 63 (75.9%) |
| Computers, Engineering & Science | 47 (100.0%) | 0 (0.0%) |
| Computers & Mathematics | 27 (100.0%) | 0 (0.0%) |
| Architecture & Engineering | 20 (100.0%) | 0 (0.0%) |
| Life, Physical & Social Science | 0 (0.0%) | 0 (0.0%) |
| Community & Social Service | 40 (15.1%) | 224 (84.9%) |
| Education, Arts & Media | 0 (0.0%) | 59 (100.0%) |
| Legal Services & Support | 16 (38.1%) | 26 (61.9%) |
| Education Instruction & Library | 24 (15.9%) | 127 (84.1%) |
| Arts, Media & Entertainment | 0 (0.0%) | 12 (100.0%) |
| Health Diagnosing & Treating | 27 (20.3%) | 106 (79.7%) |
| Health Technologists | 0 (0.0%) | 53 (100.0%) |
| Total (Category) | 162 (26.2%) | 456 (73.8%) |
| Total (Overall) | 882 (44.9%) | 1,084 (55.1%) |
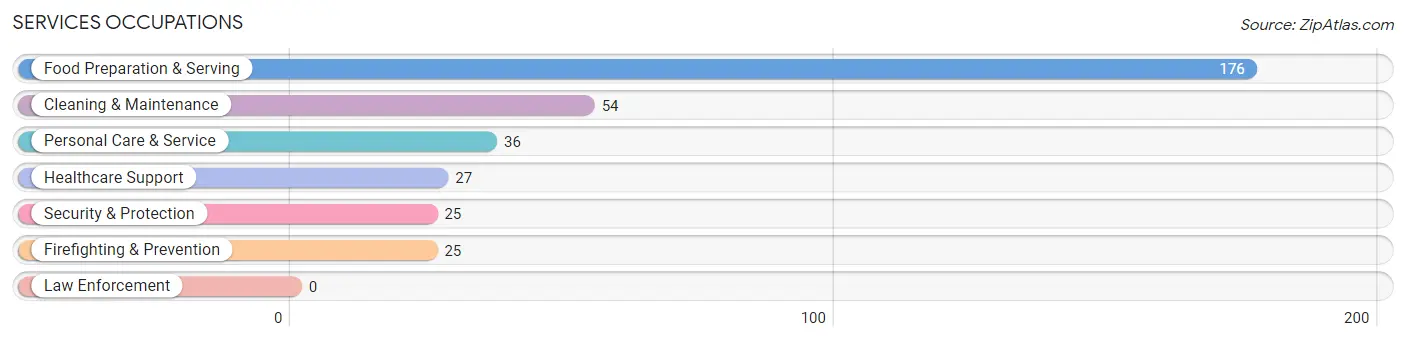
Services Occupations
The most common Services occupations in West Peoria are Food Preparation & Serving (176 | 8.9%), Cleaning & Maintenance (54 | 2.8%), Personal Care & Service (36 | 1.8%), Healthcare Support (27 | 1.4%), and Security & Protection (25 | 1.3%).
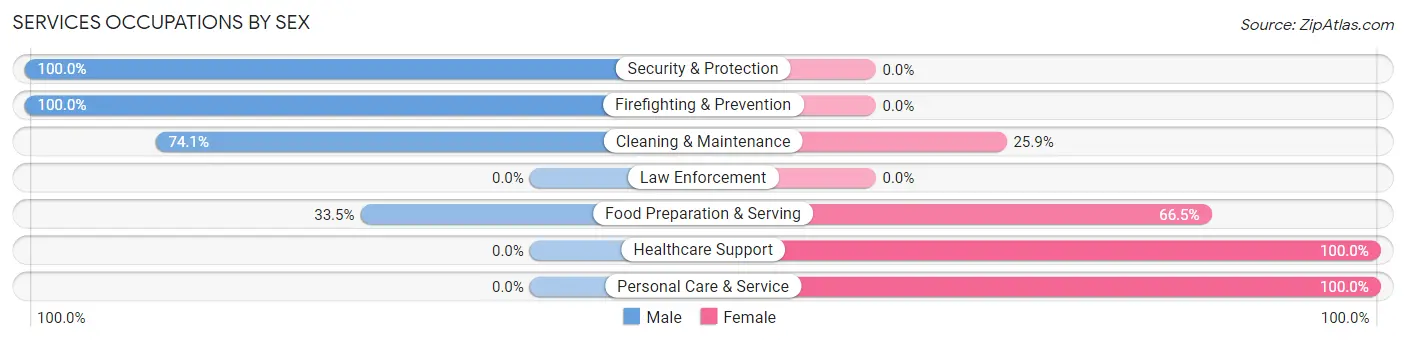
Services Occupations by Sex
Within the Services occupations in West Peoria, the most male-oriented occupations are Security & Protection (100.0%), Firefighting & Prevention (100.0%), and Cleaning & Maintenance (74.1%), while the most female-oriented occupations are Healthcare Support (100.0%), Personal Care & Service (100.0%), and Food Preparation & Serving (66.5%).
| Occupation | Male | Female |
| Healthcare Support | 0 (0.0%) | 27 (100.0%) |
| Security & Protection | 25 (100.0%) | 0 (0.0%) |
| Firefighting & Prevention | 25 (100.0%) | 0 (0.0%) |
| Law Enforcement | 0 (0.0%) | 0 (0.0%) |
| Food Preparation & Serving | 59 (33.5%) | 117 (66.5%) |
| Cleaning & Maintenance | 40 (74.1%) | 14 (25.9%) |
| Personal Care & Service | 0 (0.0%) | 36 (100.0%) |
| Total (Category) | 124 (39.0%) | 194 (61.0%) |
| Total (Overall) | 882 (44.9%) | 1,084 (55.1%) |
Sales and Office Occupations
The most common Sales and Office occupations in West Peoria are Sales & Related (271 | 13.8%), and Office & Administration (190 | 9.7%).

Sales and Office Occupations by Sex

| Occupation | Male | Female |
| Sales & Related | 43 (15.9%) | 228 (84.1%) |
| Office & Administration | 79 (41.6%) | 111 (58.4%) |
| Total (Category) | 122 (26.5%) | 339 (73.5%) |
| Total (Overall) | 882 (44.9%) | 1,084 (55.1%) |
Natural Resources, Construction and Maintenance Occupations
The most common Natural Resources, Construction and Maintenance occupations in West Peoria are Construction & Extraction (109 | 5.5%), and Installation, Maintenance & Repair (23 | 1.2%).

Natural Resources, Construction and Maintenance Occupations by Sex
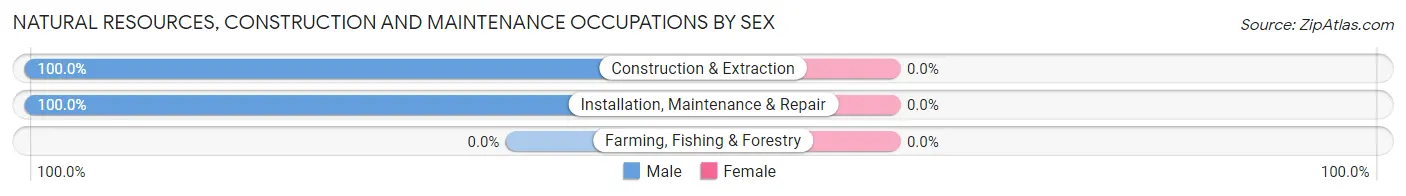
| Occupation | Male | Female |
| Farming, Fishing & Forestry | 0 (0.0%) | 0 (0.0%) |
| Construction & Extraction | 109 (100.0%) | 0 (0.0%) |
| Installation, Maintenance & Repair | 23 (100.0%) | 0 (0.0%) |
| Total (Category) | 132 (100.0%) | 0 (0.0%) |
| Total (Overall) | 882 (44.9%) | 1,084 (55.1%) |
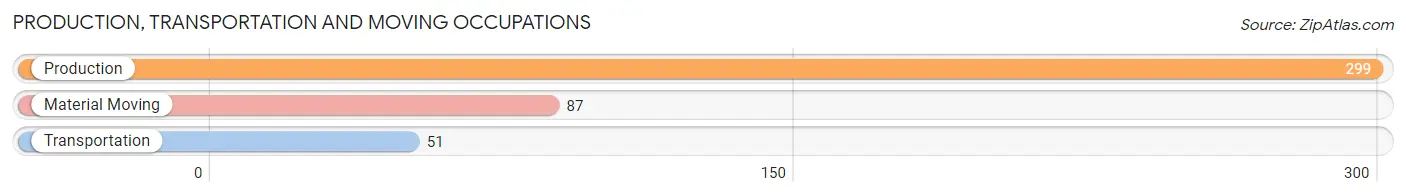
Production, Transportation and Moving Occupations
The most common Production, Transportation and Moving occupations in West Peoria are Production (299 | 15.2%), Material Moving (87 | 4.4%), and Transportation (51 | 2.6%).
Production, Transportation and Moving Occupations by Sex
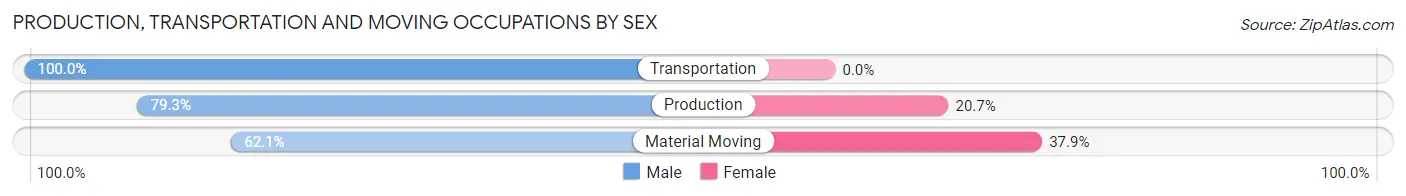
| Occupation | Male | Female |
| Production | 237 (79.3%) | 62 (20.7%) |
| Transportation | 51 (100.0%) | 0 (0.0%) |
| Material Moving | 54 (62.1%) | 33 (37.9%) |
| Total (Category) | 342 (78.3%) | 95 (21.7%) |
| Total (Overall) | 882 (44.9%) | 1,084 (55.1%) |
Employment Industries by Sex in West Peoria
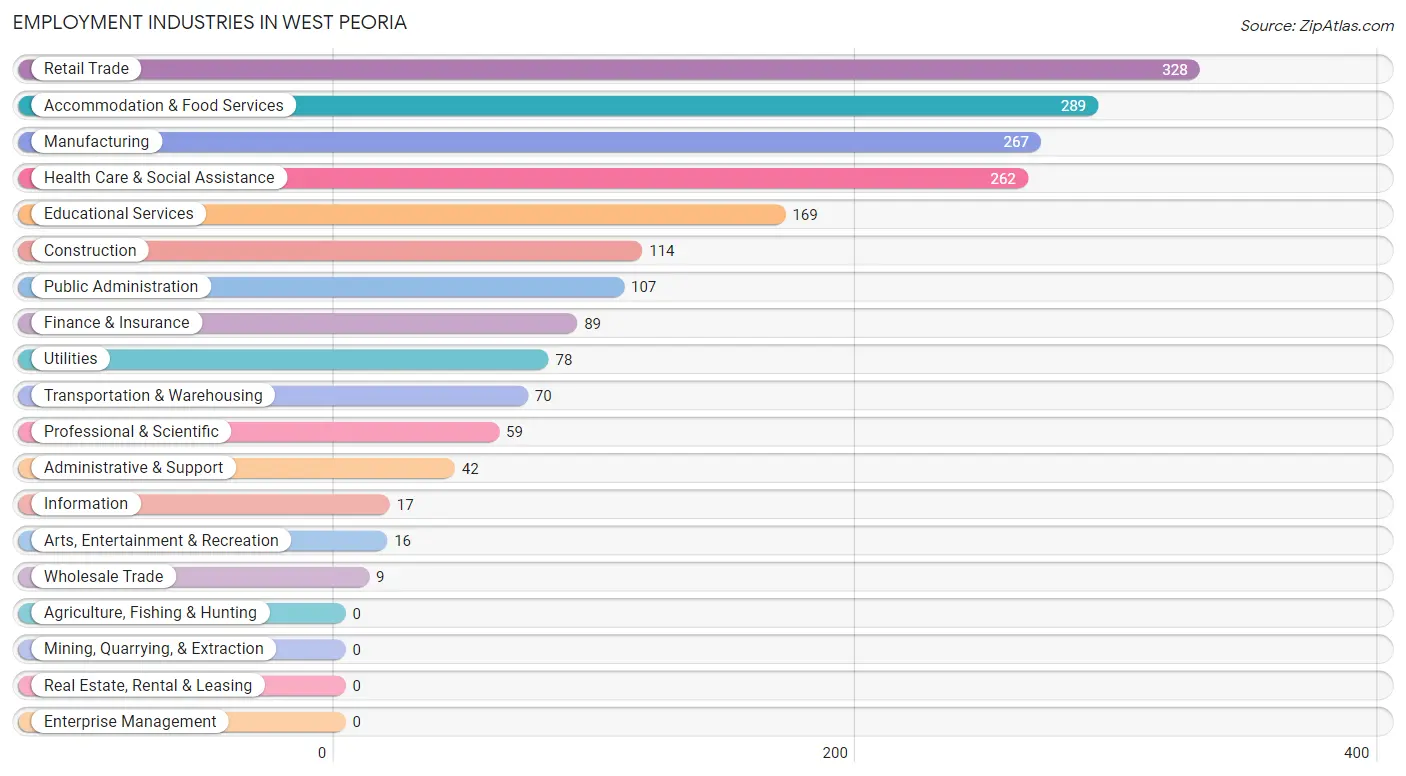
Employment Industries in West Peoria
The major employment industries in West Peoria include Retail Trade (328 | 16.7%), Accommodation & Food Services (289 | 14.7%), Manufacturing (267 | 13.6%), Health Care & Social Assistance (262 | 13.3%), and Educational Services (169 | 8.6%).
Employment Industries by Sex in West Peoria
The West Peoria industries that see more men than women are Wholesale Trade (100.0%), Manufacturing (86.1%), and Construction (86.0%), whereas the industries that tend to have a higher number of women are Arts, Entertainment & Recreation (100.0%), Finance & Insurance (76.4%), and Health Care & Social Assistance (75.9%).
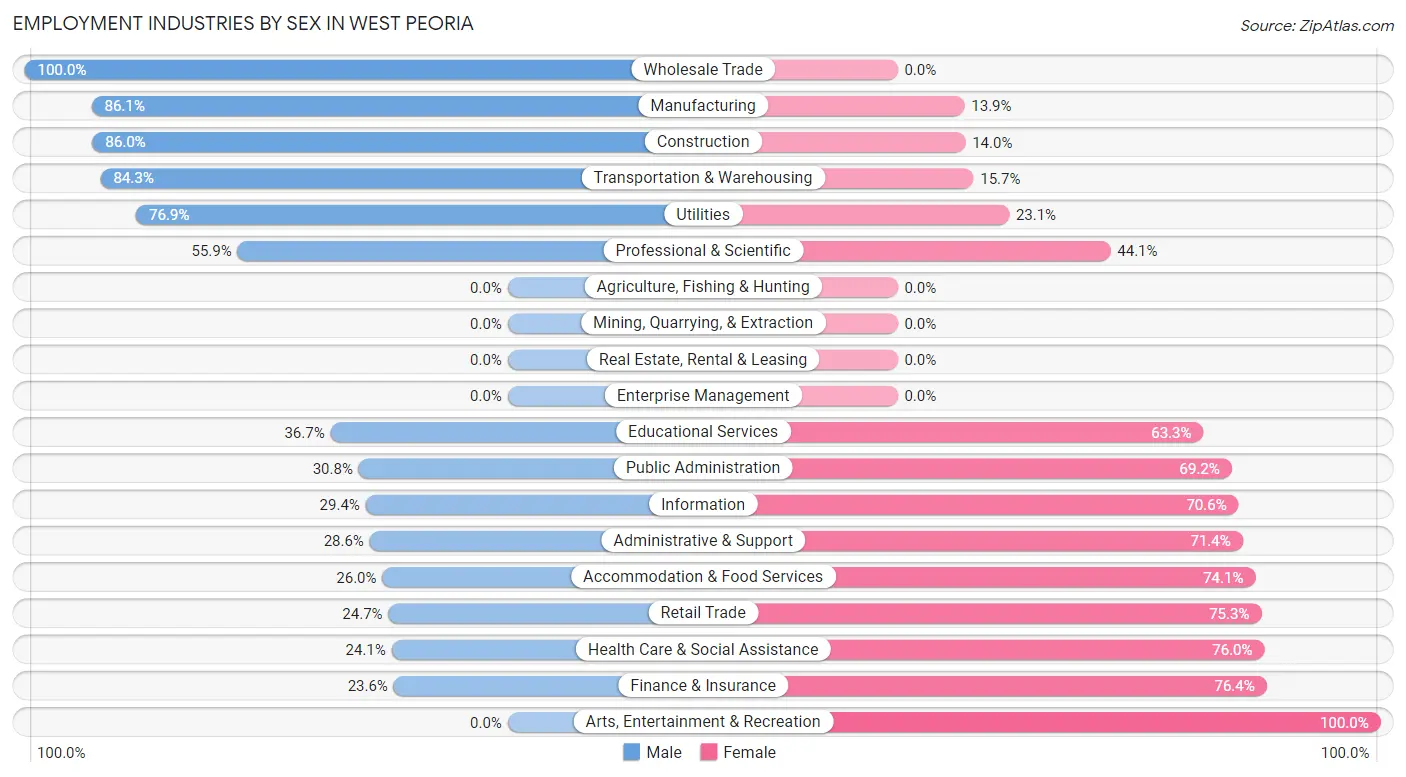
| Industry | Male | Female |
| Agriculture, Fishing & Hunting | 0 (0.0%) | 0 (0.0%) |
| Mining, Quarrying, & Extraction | 0 (0.0%) | 0 (0.0%) |
| Construction | 98 (86.0%) | 16 (14.0%) |
| Manufacturing | 230 (86.1%) | 37 (13.9%) |
| Wholesale Trade | 9 (100.0%) | 0 (0.0%) |
| Retail Trade | 81 (24.7%) | 247 (75.3%) |
| Transportation & Warehousing | 59 (84.3%) | 11 (15.7%) |
| Utilities | 60 (76.9%) | 18 (23.1%) |
| Information | 5 (29.4%) | 12 (70.6%) |
| Finance & Insurance | 21 (23.6%) | 68 (76.4%) |
| Real Estate, Rental & Leasing | 0 (0.0%) | 0 (0.0%) |
| Professional & Scientific | 33 (55.9%) | 26 (44.1%) |
| Enterprise Management | 0 (0.0%) | 0 (0.0%) |
| Administrative & Support | 12 (28.6%) | 30 (71.4%) |
| Educational Services | 62 (36.7%) | 107 (63.3%) |
| Health Care & Social Assistance | 63 (24.0%) | 199 (75.9%) |
| Arts, Entertainment & Recreation | 0 (0.0%) | 16 (100.0%) |
| Accommodation & Food Services | 75 (26.0%) | 214 (74.1%) |
| Public Administration | 33 (30.8%) | 74 (69.2%) |
| Total | 882 (44.9%) | 1,084 (55.1%) |
Education in West Peoria
School Enrollment in West Peoria
The most common levels of schooling among the 947 students in West Peoria are high school (345 | 36.4%), elementary school (239 | 25.2%), and kindergarten (99 | 10.4%).
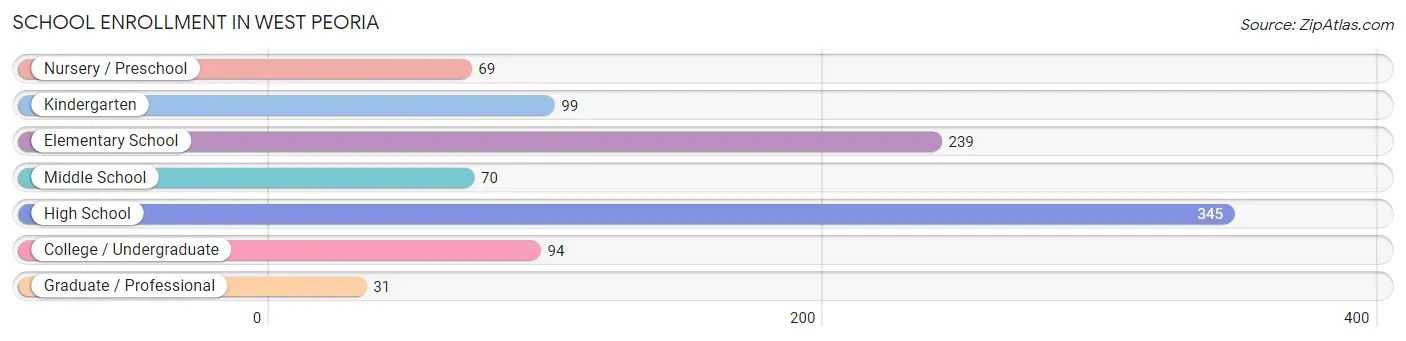
| School Level | # Students | % Students |
| Nursery / Preschool | 69 | 7.3% |
| Kindergarten | 99 | 10.4% |
| Elementary School | 239 | 25.2% |
| Middle School | 70 | 7.4% |
| High School | 345 | 36.4% |
| College / Undergraduate | 94 | 9.9% |
| Graduate / Professional | 31 | 3.3% |
| Total | 947 | 100.0% |
School Enrollment by Age by Funding Source in West Peoria
Out of a total of 947 students who are enrolled in schools in West Peoria, 135 (14.3%) attend a private institution, while the remaining 812 (85.7%) are enrolled in public schools. The age group of 5 to 9 year old has the highest likelihood of being enrolled in private schools, with 91 (29.9% in the age bracket) enrolled. Conversely, the age group of 3 to 4 year olds has the lowest likelihood of being enrolled in a private school, with 14 (100.0% in the age bracket) attending a public institution.
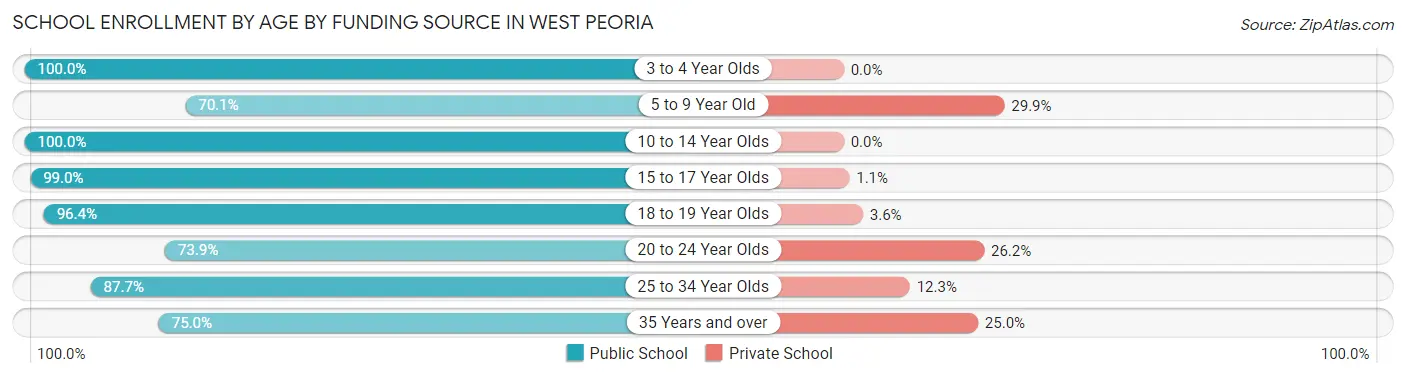
| Age Bracket | Public School | Private School |
| 3 to 4 Year Olds | 14 (100.0%) | 0 (0.0%) |
| 5 to 9 Year Old | 213 (70.1%) | 91 (29.9%) |
| 10 to 14 Year Olds | 159 (100.0%) | 0 (0.0%) |
| 15 to 17 Year Olds | 189 (99.0%) | 2 (1.1%) |
| 18 to 19 Year Olds | 54 (96.4%) | 2 (3.6%) |
| 20 to 24 Year Olds | 48 (73.9%) | 17 (26.2%) |
| 25 to 34 Year Olds | 114 (87.7%) | 16 (12.3%) |
| 35 Years and over | 21 (75.0%) | 7 (25.0%) |
| Total | 812 (85.7%) | 135 (14.3%) |
Educational Attainment by Field of Study in West Peoria
Education (169 | 22.2%), visual & performing arts (96 | 12.6%), arts & humanities (93 | 12.2%), science & technology (75 | 9.9%), and business (70 | 9.2%) are the most common fields of study among 760 individuals in West Peoria who have obtained a bachelor's degree or higher.
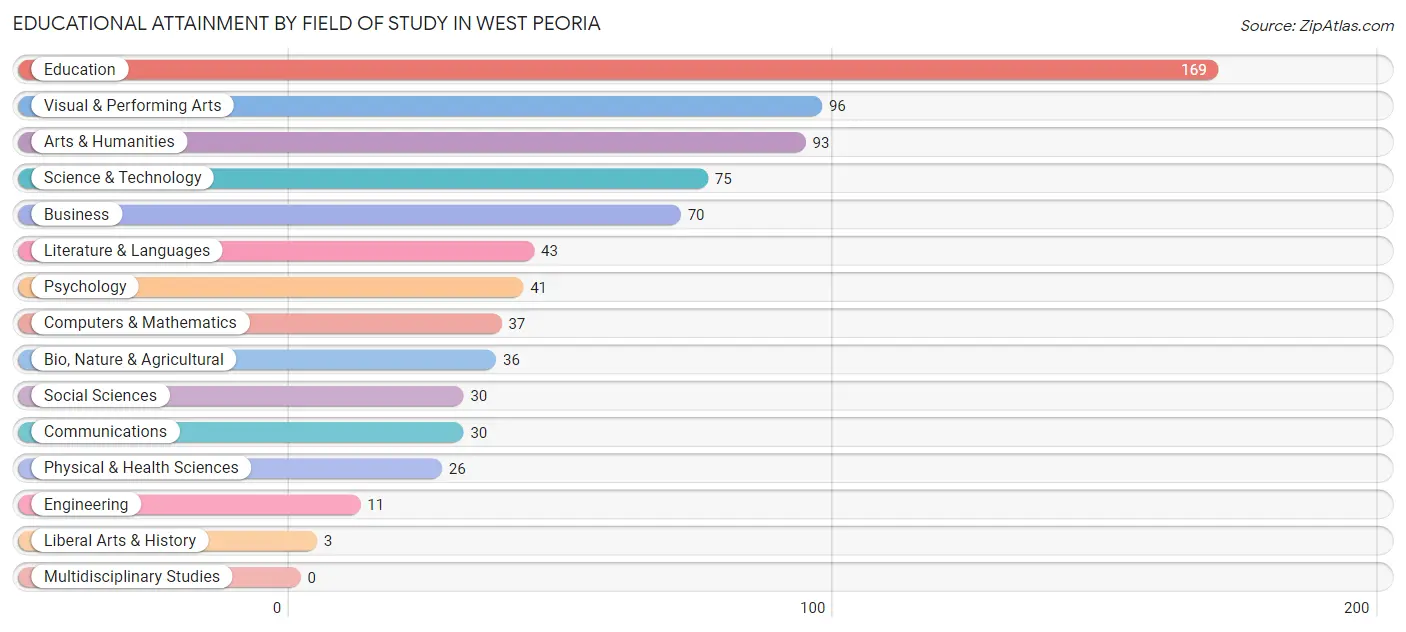
| Field of Study | # Graduates | % Graduates |
| Computers & Mathematics | 37 | 4.9% |
| Bio, Nature & Agricultural | 36 | 4.7% |
| Physical & Health Sciences | 26 | 3.4% |
| Psychology | 41 | 5.4% |
| Social Sciences | 30 | 4.0% |
| Engineering | 11 | 1.5% |
| Multidisciplinary Studies | 0 | 0.0% |
| Science & Technology | 75 | 9.9% |
| Business | 70 | 9.2% |
| Education | 169 | 22.2% |
| Literature & Languages | 43 | 5.7% |
| Liberal Arts & History | 3 | 0.4% |
| Visual & Performing Arts | 96 | 12.6% |
| Communications | 30 | 4.0% |
| Arts & Humanities | 93 | 12.2% |
| Total | 760 | 100.0% |
Transportation & Commute in West Peoria
Vehicle Availability by Sex in West Peoria
The most prevalent vehicle ownership categories in West Peoria are males with 3 vehicles (280, accounting for 32.5%) and females with 3 vehicles (178, making up 26.4%).
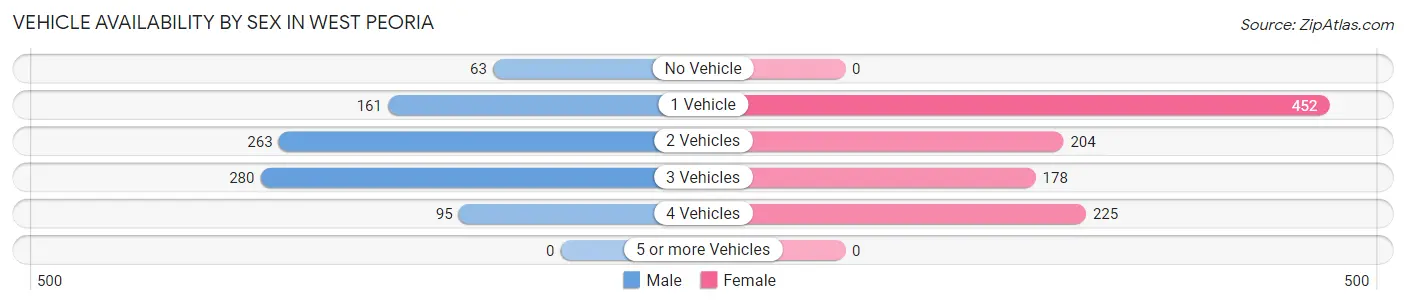
| Vehicles Available | Male | Female |
| No Vehicle | 63 (7.3%) | 0 (0.0%) |
| 1 Vehicle | 161 (18.7%) | 452 (42.7%) |
| 2 Vehicles | 263 (30.5%) | 204 (19.3%) |
| 3 Vehicles | 280 (32.5%) | 178 (16.8%) |
| 4 Vehicles | 95 (11.0%) | 225 (21.2%) |
| 5 or more Vehicles | 0 (0.0%) | 0 (0.0%) |
| Total | 862 (100.0%) | 1,059 (100.0%) |
Commute Time in West Peoria
The most frequently occuring commute durations in West Peoria are 15 to 19 minutes (696 commuters, 37.2%), 10 to 14 minutes (445 commuters, 23.8%), and 5 to 9 minutes (297 commuters, 15.9%).
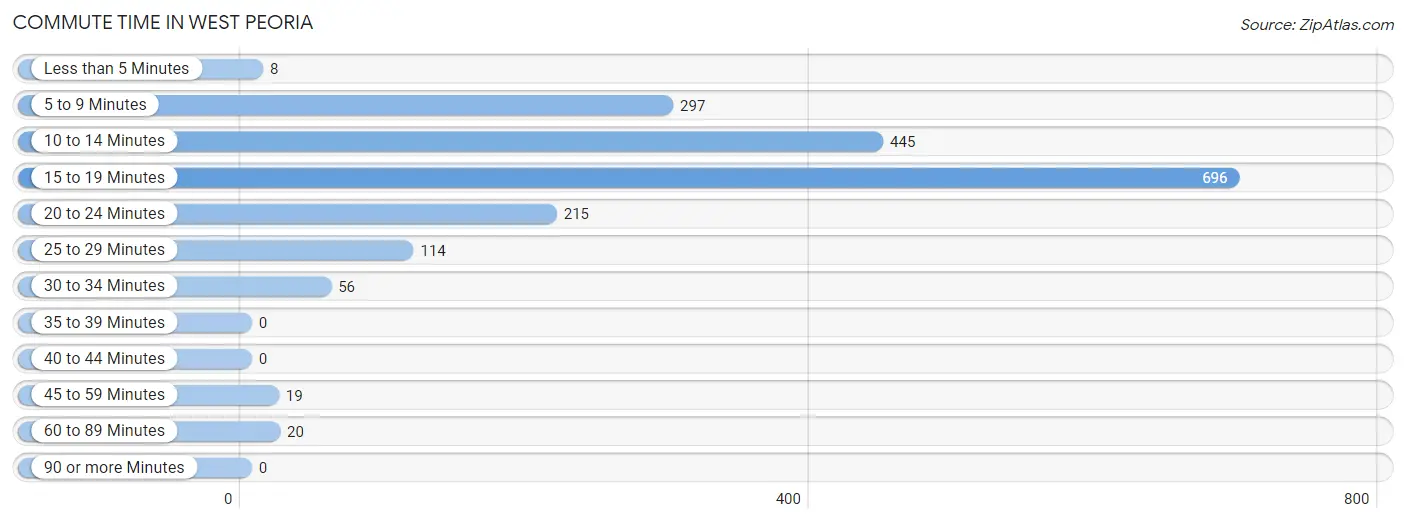
| Commute Time | # Commuters | % Commuters |
| Less than 5 Minutes | 8 | 0.4% |
| 5 to 9 Minutes | 297 | 15.9% |
| 10 to 14 Minutes | 445 | 23.8% |
| 15 to 19 Minutes | 696 | 37.2% |
| 20 to 24 Minutes | 215 | 11.5% |
| 25 to 29 Minutes | 114 | 6.1% |
| 30 to 34 Minutes | 56 | 3.0% |
| 35 to 39 Minutes | 0 | 0.0% |
| 40 to 44 Minutes | 0 | 0.0% |
| 45 to 59 Minutes | 19 | 1.0% |
| 60 to 89 Minutes | 20 | 1.1% |
| 90 or more Minutes | 0 | 0.0% |
Commute Time by Sex in West Peoria
The most common commute times in West Peoria are 15 to 19 minutes (298 commuters, 34.9%) for males and 15 to 19 minutes (398 commuters, 39.1%) for females.
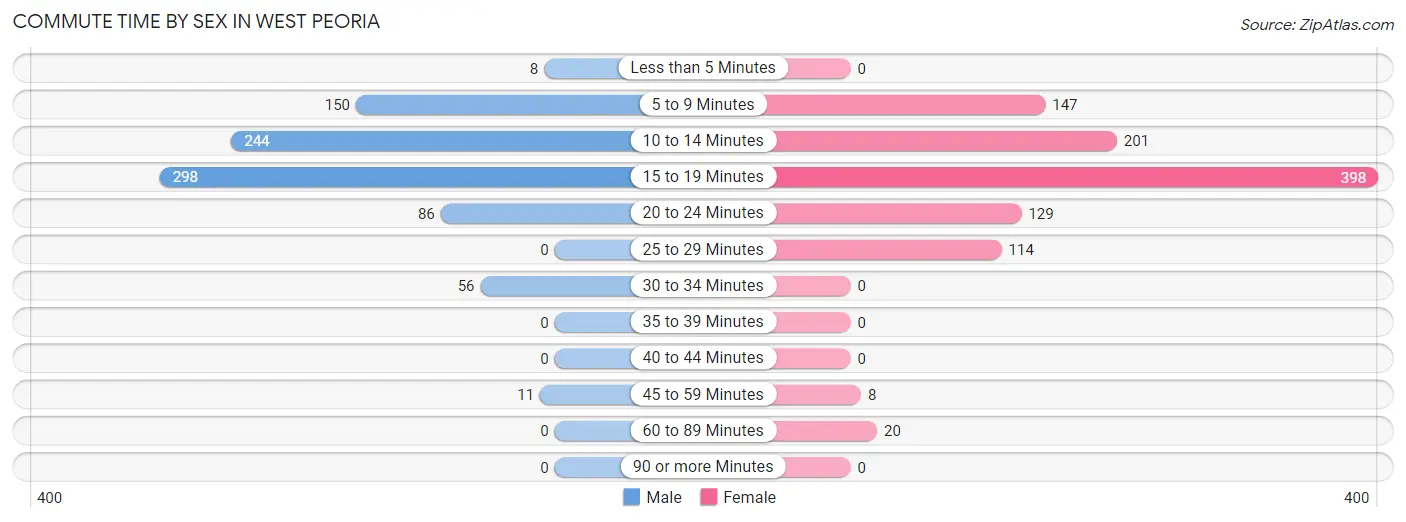
| Commute Time | Male | Female |
| Less than 5 Minutes | 8 (0.9%) | 0 (0.0%) |
| 5 to 9 Minutes | 150 (17.6%) | 147 (14.4%) |
| 10 to 14 Minutes | 244 (28.6%) | 201 (19.8%) |
| 15 to 19 Minutes | 298 (34.9%) | 398 (39.1%) |
| 20 to 24 Minutes | 86 (10.1%) | 129 (12.7%) |
| 25 to 29 Minutes | 0 (0.0%) | 114 (11.2%) |
| 30 to 34 Minutes | 56 (6.6%) | 0 (0.0%) |
| 35 to 39 Minutes | 0 (0.0%) | 0 (0.0%) |
| 40 to 44 Minutes | 0 (0.0%) | 0 (0.0%) |
| 45 to 59 Minutes | 11 (1.3%) | 8 (0.8%) |
| 60 to 89 Minutes | 0 (0.0%) | 20 (2.0%) |
| 90 or more Minutes | 0 (0.0%) | 0 (0.0%) |
Time of Departure to Work by Sex in West Peoria
The most frequent times of departure to work in West Peoria are 8:00 AM to 8:29 AM (130, 15.2%) for males and 8:00 AM to 8:29 AM (208, 20.4%) for females.
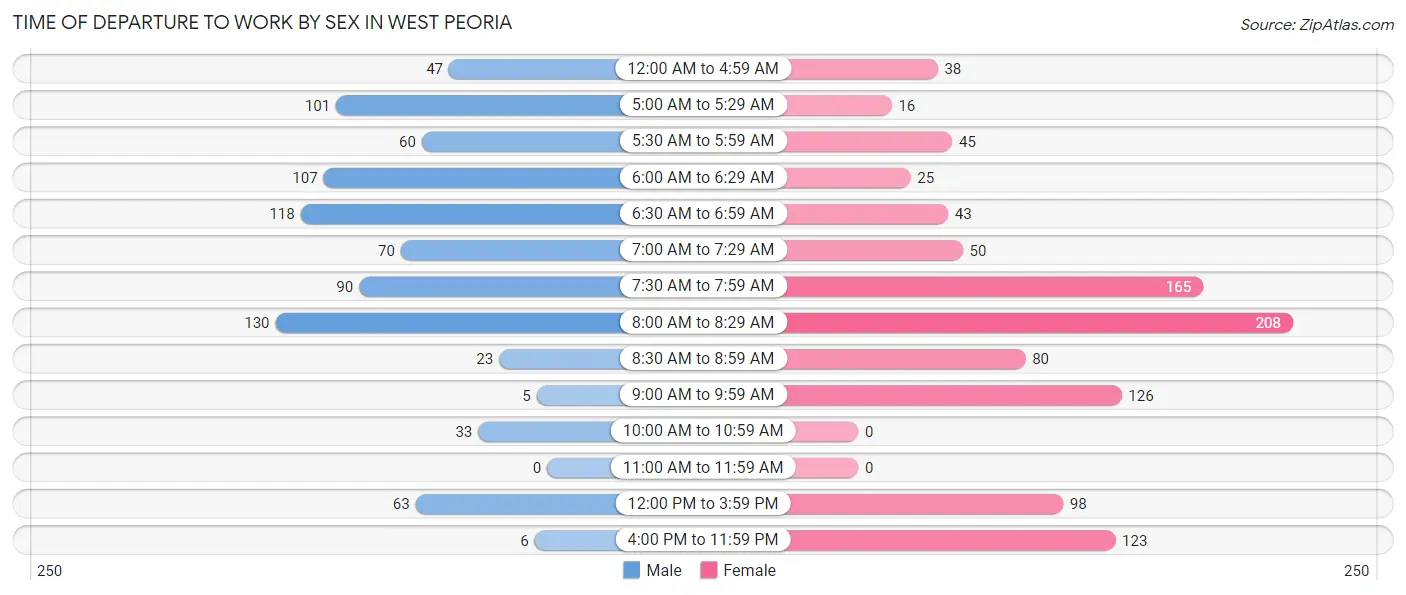
| Time of Departure | Male | Female |
| 12:00 AM to 4:59 AM | 47 (5.5%) | 38 (3.7%) |
| 5:00 AM to 5:29 AM | 101 (11.8%) | 16 (1.6%) |
| 5:30 AM to 5:59 AM | 60 (7.0%) | 45 (4.4%) |
| 6:00 AM to 6:29 AM | 107 (12.5%) | 25 (2.5%) |
| 6:30 AM to 6:59 AM | 118 (13.8%) | 43 (4.2%) |
| 7:00 AM to 7:29 AM | 70 (8.2%) | 50 (4.9%) |
| 7:30 AM to 7:59 AM | 90 (10.5%) | 165 (16.2%) |
| 8:00 AM to 8:29 AM | 130 (15.2%) | 208 (20.4%) |
| 8:30 AM to 8:59 AM | 23 (2.7%) | 80 (7.9%) |
| 9:00 AM to 9:59 AM | 5 (0.6%) | 126 (12.4%) |
| 10:00 AM to 10:59 AM | 33 (3.9%) | 0 (0.0%) |
| 11:00 AM to 11:59 AM | 0 (0.0%) | 0 (0.0%) |
| 12:00 PM to 3:59 PM | 63 (7.4%) | 98 (9.6%) |
| 4:00 PM to 11:59 PM | 6 (0.7%) | 123 (12.1%) |
| Total | 853 (100.0%) | 1,017 (100.0%) |
Housing Occupancy in West Peoria
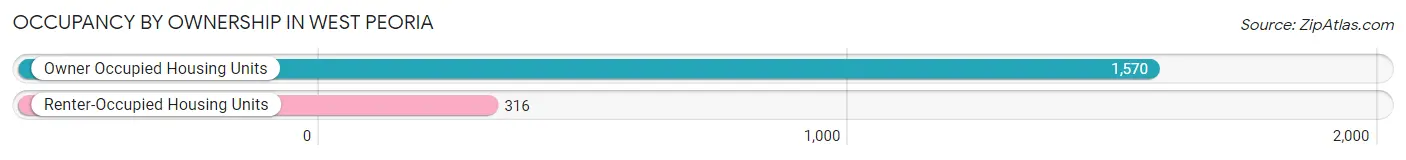
Occupancy by Ownership in West Peoria
Of the total 1,886 dwellings in West Peoria, owner-occupied units account for 1,570 (83.2%), while renter-occupied units make up 316 (16.8%).
| Occupancy | # Housing Units | % Housing Units |
| Owner Occupied Housing Units | 1,570 | 83.2% |
| Renter-Occupied Housing Units | 316 | 16.8% |
| Total Occupied Housing Units | 1,886 | 100.0% |
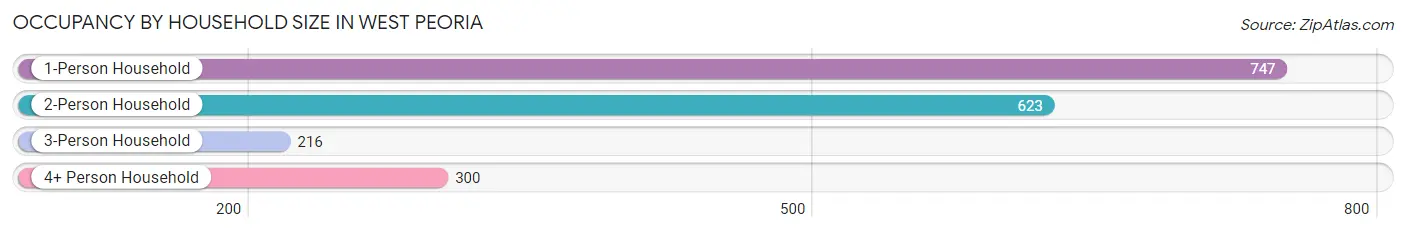
Occupancy by Household Size in West Peoria
| Household Size | # Housing Units | % Housing Units |
| 1-Person Household | 747 | 39.6% |
| 2-Person Household | 623 | 33.0% |
| 3-Person Household | 216 | 11.5% |
| 4+ Person Household | 300 | 15.9% |
| Total Housing Units | 1,886 | 100.0% |
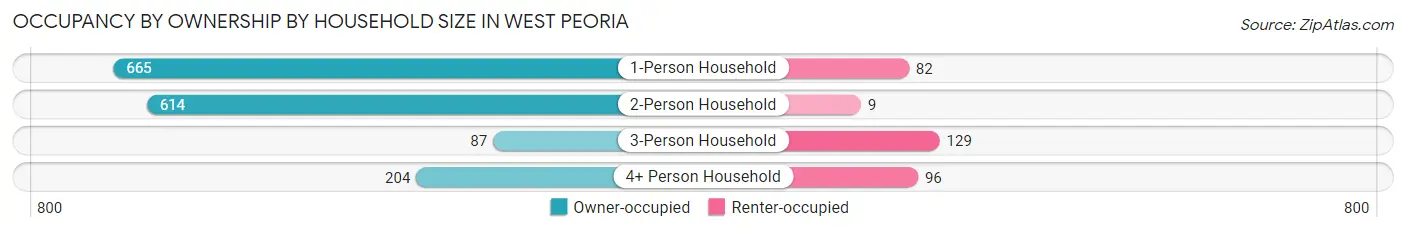
Occupancy by Ownership by Household Size in West Peoria
| Household Size | Owner-occupied | Renter-occupied |
| 1-Person Household | 665 (89.0%) | 82 (11.0%) |
| 2-Person Household | 614 (98.6%) | 9 (1.4%) |
| 3-Person Household | 87 (40.3%) | 129 (59.7%) |
| 4+ Person Household | 204 (68.0%) | 96 (32.0%) |
| Total Housing Units | 1,570 (83.2%) | 316 (16.8%) |
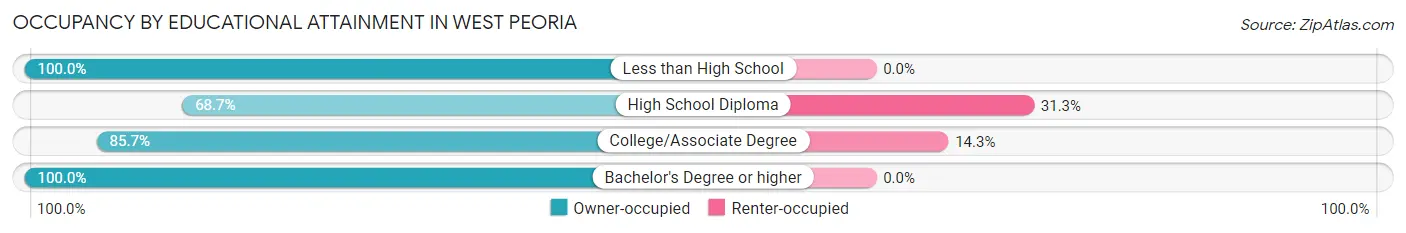
Occupancy by Educational Attainment in West Peoria
| Household Size | Owner-occupied | Renter-occupied |
| Less than High School | 90 (100.0%) | 0 (0.0%) |
| High School Diploma | 464 (68.7%) | 211 (31.3%) |
| College/Associate Degree | 630 (85.7%) | 105 (14.3%) |
| Bachelor's Degree or higher | 386 (100.0%) | 0 (0.0%) |
Occupancy by Age of Householder in West Peoria
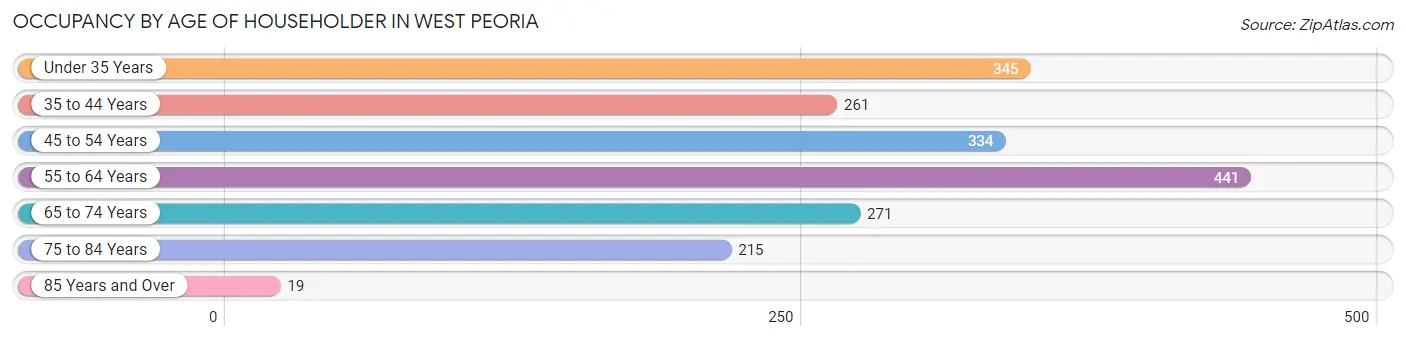
| Age Bracket | # Households | % Households |
| Under 35 Years | 345 | 18.3% |
| 35 to 44 Years | 261 | 13.8% |
| 45 to 54 Years | 334 | 17.7% |
| 55 to 64 Years | 441 | 23.4% |
| 65 to 74 Years | 271 | 14.4% |
| 75 to 84 Years | 215 | 11.4% |
| 85 Years and Over | 19 | 1.0% |
| Total | 1,886 | 100.0% |
Housing Finances in West Peoria
Median Income by Occupancy in West Peoria
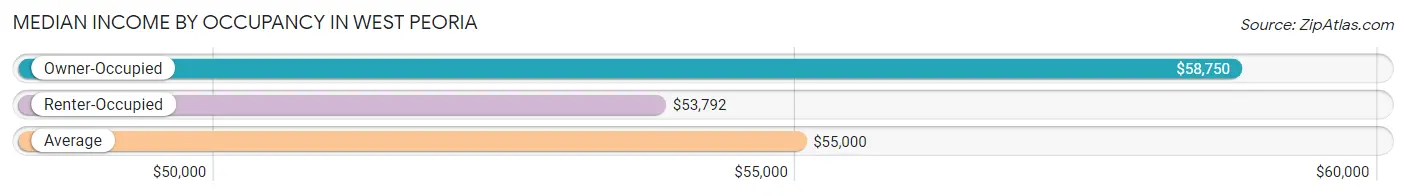
| Occupancy Type | # Households | Median Income |
| Owner-Occupied | 1,570 (83.2%) | $58,750 |
| Renter-Occupied | 316 (16.8%) | $53,792 |
| Average | 1,886 (100.0%) | $55,000 |
Occupancy by Householder Income Bracket in West Peoria
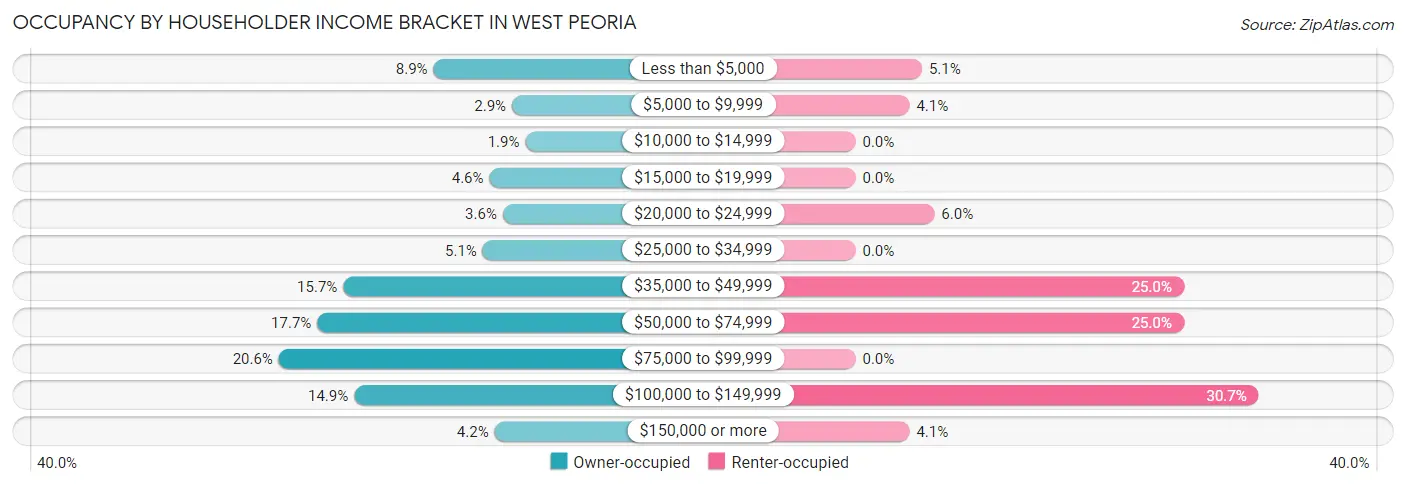
| Income Bracket | Owner-occupied | Renter-occupied |
| Less than $5,000 | 139 (8.8%) | 16 (5.1%) |
| $5,000 to $9,999 | 45 (2.9%) | 13 (4.1%) |
| $10,000 to $14,999 | 29 (1.8%) | 0 (0.0%) |
| $15,000 to $19,999 | 72 (4.6%) | 0 (0.0%) |
| $20,000 to $24,999 | 56 (3.6%) | 19 (6.0%) |
| $25,000 to $34,999 | 80 (5.1%) | 0 (0.0%) |
| $35,000 to $49,999 | 247 (15.7%) | 79 (25.0%) |
| $50,000 to $74,999 | 278 (17.7%) | 79 (25.0%) |
| $75,000 to $99,999 | 324 (20.6%) | 0 (0.0%) |
| $100,000 to $149,999 | 234 (14.9%) | 97 (30.7%) |
| $150,000 or more | 66 (4.2%) | 13 (4.1%) |
| Total | 1,570 (100.0%) | 316 (100.0%) |
Monthly Housing Cost Tiers in West Peoria
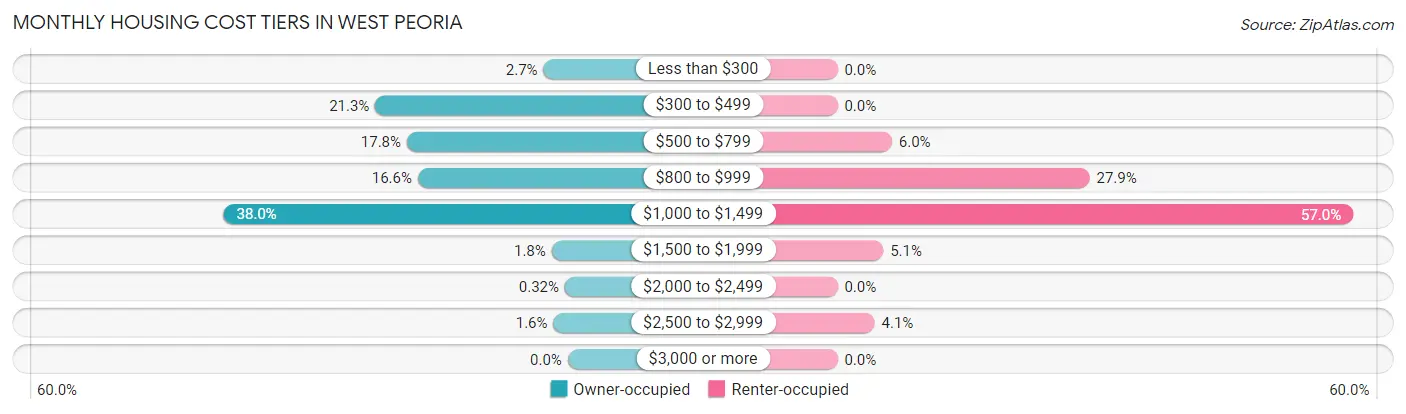
| Monthly Cost | Owner-occupied | Renter-occupied |
| Less than $300 | 42 (2.7%) | 0 (0.0%) |
| $300 to $499 | 334 (21.3%) | 0 (0.0%) |
| $500 to $799 | 279 (17.8%) | 19 (6.0%) |
| $800 to $999 | 260 (16.6%) | 88 (27.9%) |
| $1,000 to $1,499 | 597 (38.0%) | 180 (57.0%) |
| $1,500 to $1,999 | 28 (1.8%) | 16 (5.1%) |
| $2,000 to $2,499 | 5 (0.3%) | 0 (0.0%) |
| $2,500 to $2,999 | 25 (1.6%) | 13 (4.1%) |
| $3,000 or more | 0 (0.0%) | 0 (0.0%) |
| Total | 1,570 (100.0%) | 316 (100.0%) |
Physical Housing Characteristics in West Peoria
Housing Structures in West Peoria
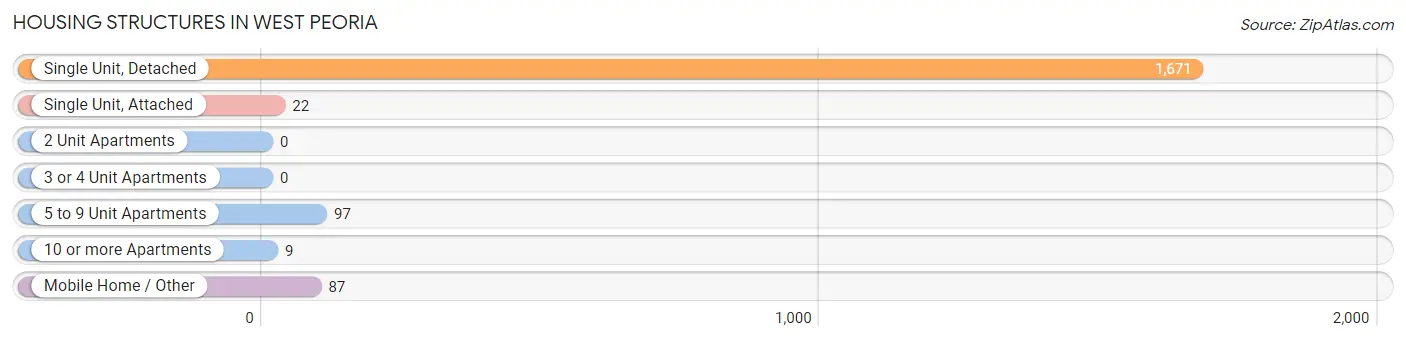
| Structure Type | # Housing Units | % Housing Units |
| Single Unit, Detached | 1,671 | 88.6% |
| Single Unit, Attached | 22 | 1.2% |
| 2 Unit Apartments | 0 | 0.0% |
| 3 or 4 Unit Apartments | 0 | 0.0% |
| 5 to 9 Unit Apartments | 97 | 5.1% |
| 10 or more Apartments | 9 | 0.5% |
| Mobile Home / Other | 87 | 4.6% |
| Total | 1,886 | 100.0% |
Housing Structures by Occupancy in West Peoria
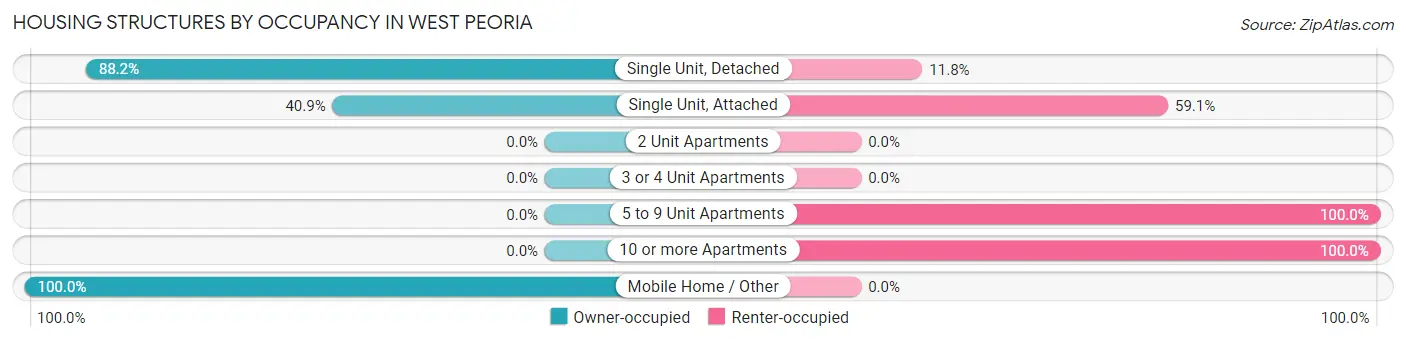
| Structure Type | Owner-occupied | Renter-occupied |
| Single Unit, Detached | 1,474 (88.2%) | 197 (11.8%) |
| Single Unit, Attached | 9 (40.9%) | 13 (59.1%) |
| 2 Unit Apartments | 0 (0.0%) | 0 (0.0%) |
| 3 or 4 Unit Apartments | 0 (0.0%) | 0 (0.0%) |
| 5 to 9 Unit Apartments | 0 (0.0%) | 97 (100.0%) |
| 10 or more Apartments | 0 (0.0%) | 9 (100.0%) |
| Mobile Home / Other | 87 (100.0%) | 0 (0.0%) |
| Total | 1,570 (83.2%) | 316 (16.8%) |
Housing Structures by Number of Rooms in West Peoria
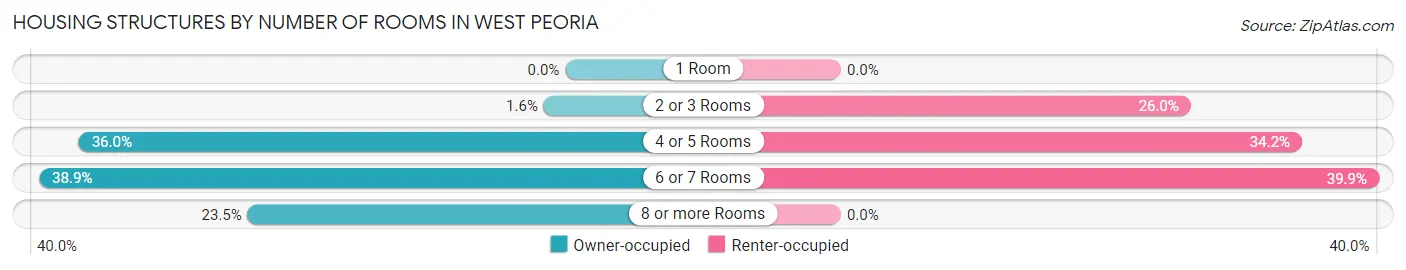
| Number of Rooms | Owner-occupied | Renter-occupied |
| 1 Room | 0 (0.0%) | 0 (0.0%) |
| 2 or 3 Rooms | 25 (1.6%) | 82 (26.0%) |
| 4 or 5 Rooms | 565 (36.0%) | 108 (34.2%) |
| 6 or 7 Rooms | 611 (38.9%) | 126 (39.9%) |
| 8 or more Rooms | 369 (23.5%) | 0 (0.0%) |
| Total | 1,570 (100.0%) | 316 (100.0%) |
Housing Structure by Heating Type in West Peoria
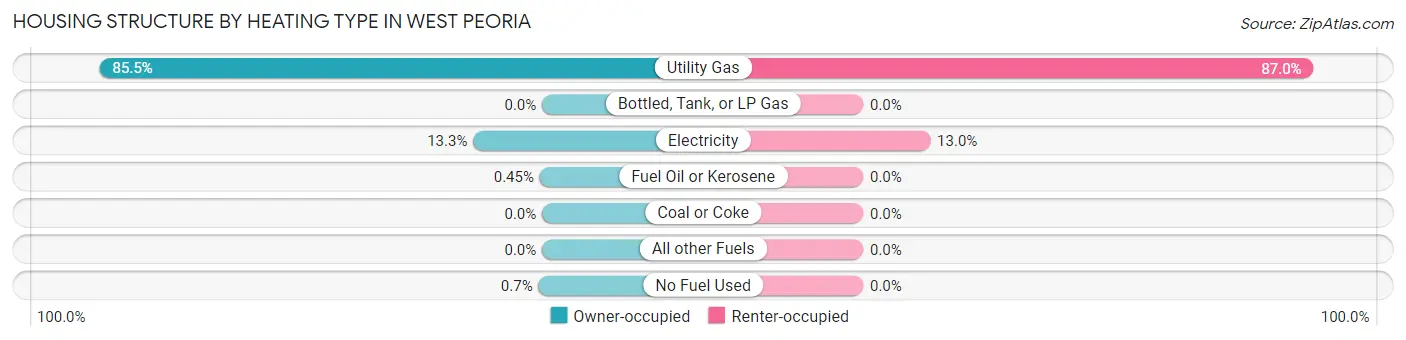
| Heating Type | Owner-occupied | Renter-occupied |
| Utility Gas | 1,343 (85.5%) | 275 (87.0%) |
| Bottled, Tank, or LP Gas | 0 (0.0%) | 0 (0.0%) |
| Electricity | 209 (13.3%) | 41 (13.0%) |
| Fuel Oil or Kerosene | 7 (0.4%) | 0 (0.0%) |
| Coal or Coke | 0 (0.0%) | 0 (0.0%) |
| All other Fuels | 0 (0.0%) | 0 (0.0%) |
| No Fuel Used | 11 (0.7%) | 0 (0.0%) |
| Total | 1,570 (100.0%) | 316 (100.0%) |
Household Vehicle Usage in West Peoria
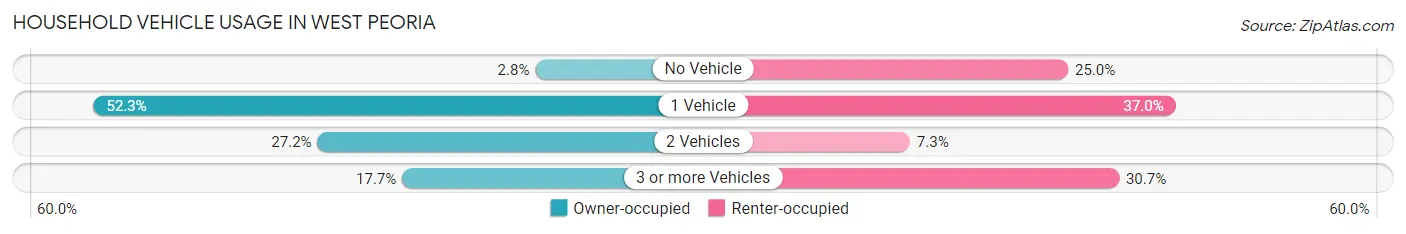
| Vehicles per Household | Owner-occupied | Renter-occupied |
| No Vehicle | 44 (2.8%) | 79 (25.0%) |
| 1 Vehicle | 821 (52.3%) | 117 (37.0%) |
| 2 Vehicles | 427 (27.2%) | 23 (7.3%) |
| 3 or more Vehicles | 278 (17.7%) | 97 (30.7%) |
| Total | 1,570 (100.0%) | 316 (100.0%) |
Real Estate & Mortgages in West Peoria
Real Estate and Mortgage Overview in West Peoria
| Characteristic | Without Mortgage | With Mortgage |
| Housing Units | 598 | 972 |
| Median Property Value | $92,300 | $93,400 |
| Median Household Income | $38,694 | $66 |
| Monthly Housing Costs | $446 | $0 |
| Real Estate Taxes | $1,695 | $0 |
Property Value by Mortgage Status in West Peoria
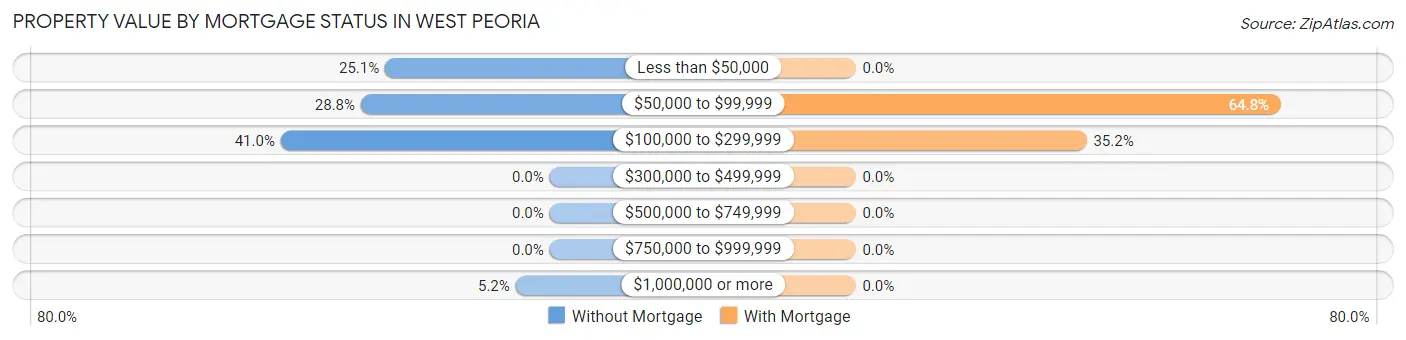
| Property Value | Without Mortgage | With Mortgage |
| Less than $50,000 | 150 (25.1%) | 0 (0.0%) |
| $50,000 to $99,999 | 172 (28.8%) | 630 (64.8%) |
| $100,000 to $299,999 | 245 (41.0%) | 342 (35.2%) |
| $300,000 to $499,999 | 0 (0.0%) | 0 (0.0%) |
| $500,000 to $749,999 | 0 (0.0%) | 0 (0.0%) |
| $750,000 to $999,999 | 0 (0.0%) | 0 (0.0%) |
| $1,000,000 or more | 31 (5.2%) | 0 (0.0%) |
| Total | 598 (100.0%) | 972 (100.0%) |
Household Income by Mortgage Status in West Peoria
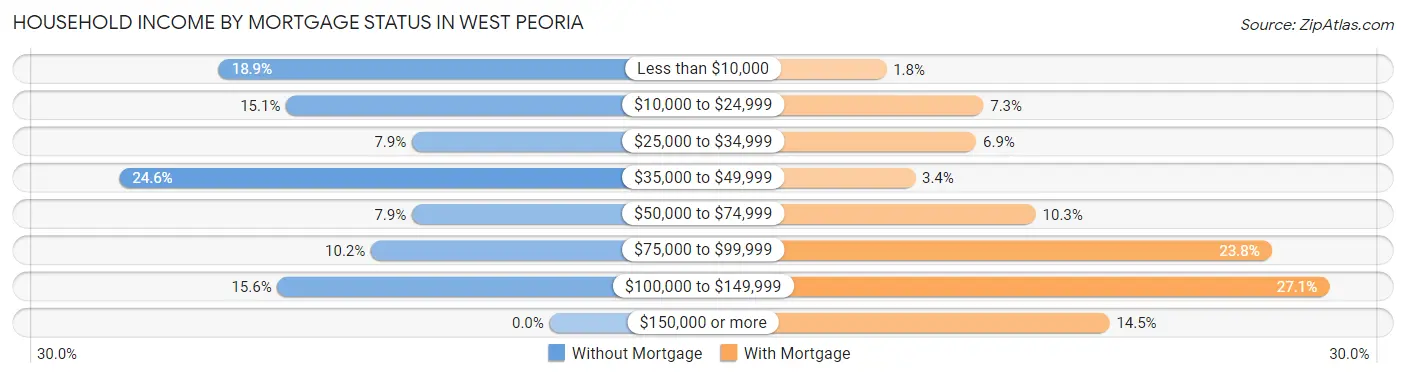
| Household Income | Without Mortgage | With Mortgage |
| Less than $10,000 | 113 (18.9%) | 17 (1.8%) |
| $10,000 to $24,999 | 90 (15.0%) | 71 (7.3%) |
| $25,000 to $34,999 | 47 (7.9%) | 67 (6.9%) |
| $35,000 to $49,999 | 147 (24.6%) | 33 (3.4%) |
| $50,000 to $74,999 | 47 (7.9%) | 100 (10.3%) |
| $75,000 to $99,999 | 61 (10.2%) | 231 (23.8%) |
| $100,000 to $149,999 | 93 (15.5%) | 263 (27.1%) |
| $150,000 or more | 0 (0.0%) | 141 (14.5%) |
| Total | 598 (100.0%) | 972 (100.0%) |
Property Value to Household Income Ratio in West Peoria
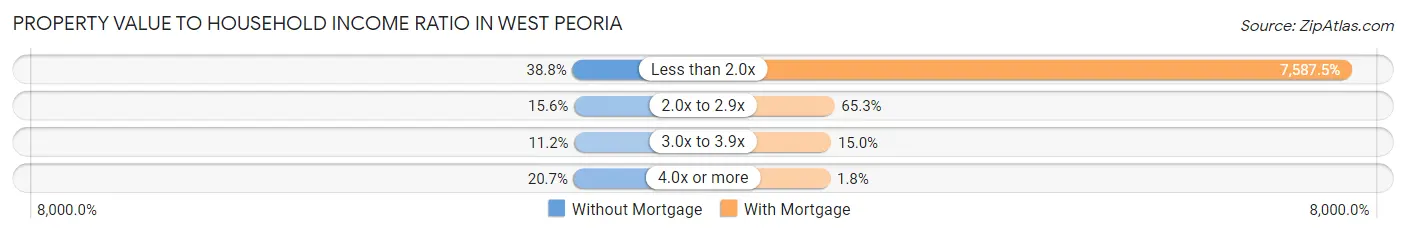
| Value-to-Income Ratio | Without Mortgage | With Mortgage |
| Less than 2.0x | 232 (38.8%) | 73,750 (7,587.4%) |
| 2.0x to 2.9x | 93 (15.5%) | 635 (65.3%) |
| 3.0x to 3.9x | 67 (11.2%) | 146 (15.0%) |
| 4.0x or more | 124 (20.7%) | 17 (1.8%) |
| Total | 598 (100.0%) | 972 (100.0%) |
Real Estate Taxes by Mortgage Status in West Peoria
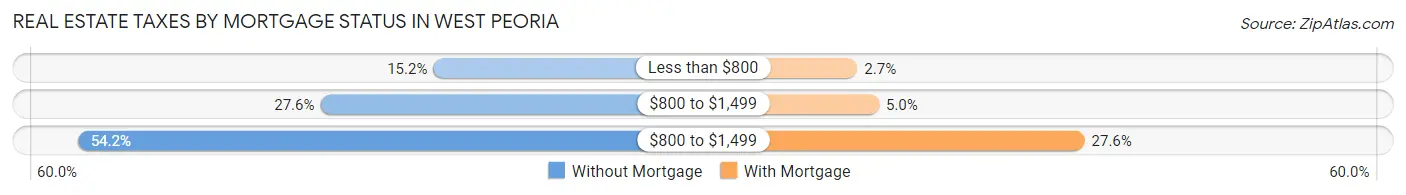
| Property Taxes | Without Mortgage | With Mortgage |
| Less than $800 | 91 (15.2%) | 26 (2.7%) |
| $800 to $1,499 | 165 (27.6%) | 49 (5.0%) |
| $800 to $1,499 | 324 (54.2%) | 268 (27.6%) |
| Total | 598 (100.0%) | 972 (100.0%) |
Health & Disability in West Peoria
Health Insurance Coverage by Age in West Peoria
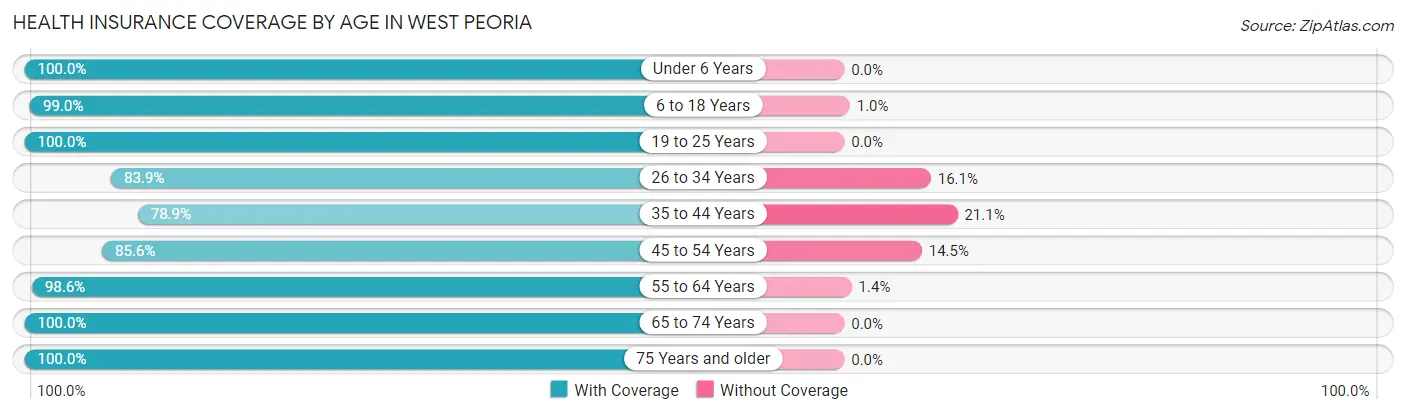
| Age Bracket | With Coverage | Without Coverage |
| Under 6 Years | 288 (100.0%) | 0 (0.0%) |
| 6 to 18 Years | 581 (99.0%) | 6 (1.0%) |
| 19 to 25 Years | 230 (100.0%) | 0 (0.0%) |
| 26 to 34 Years | 468 (83.9%) | 90 (16.1%) |
| 35 to 44 Years | 284 (78.9%) | 76 (21.1%) |
| 45 to 54 Years | 361 (85.6%) | 61 (14.4%) |
| 55 to 64 Years | 722 (98.6%) | 10 (1.4%) |
| 65 to 74 Years | 451 (100.0%) | 0 (0.0%) |
| 75 Years and older | 335 (100.0%) | 0 (0.0%) |
| Total | 3,720 (93.9%) | 243 (6.1%) |
Health Insurance Coverage by Citizenship Status in West Peoria
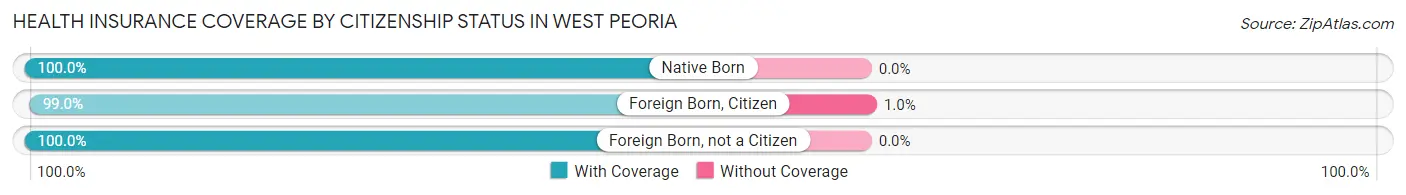
| Citizenship Status | With Coverage | Without Coverage |
| Native Born | 288 (100.0%) | 0 (0.0%) |
| Foreign Born, Citizen | 581 (99.0%) | 6 (1.0%) |
| Foreign Born, not a Citizen | 230 (100.0%) | 0 (0.0%) |
Health Insurance Coverage by Household Income in West Peoria
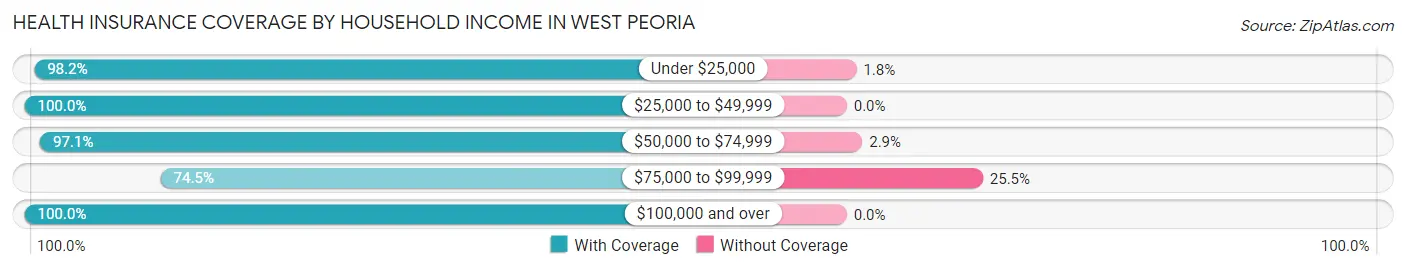
| Household Income | With Coverage | Without Coverage |
| Under $25,000 | 541 (98.2%) | 10 (1.8%) |
| $25,000 to $49,999 | 588 (100.0%) | 0 (0.0%) |
| $50,000 to $74,999 | 837 (97.1%) | 25 (2.9%) |
| $75,000 to $99,999 | 608 (74.5%) | 208 (25.5%) |
| $100,000 and over | 1,142 (100.0%) | 0 (0.0%) |
Public vs Private Health Insurance Coverage by Age in West Peoria
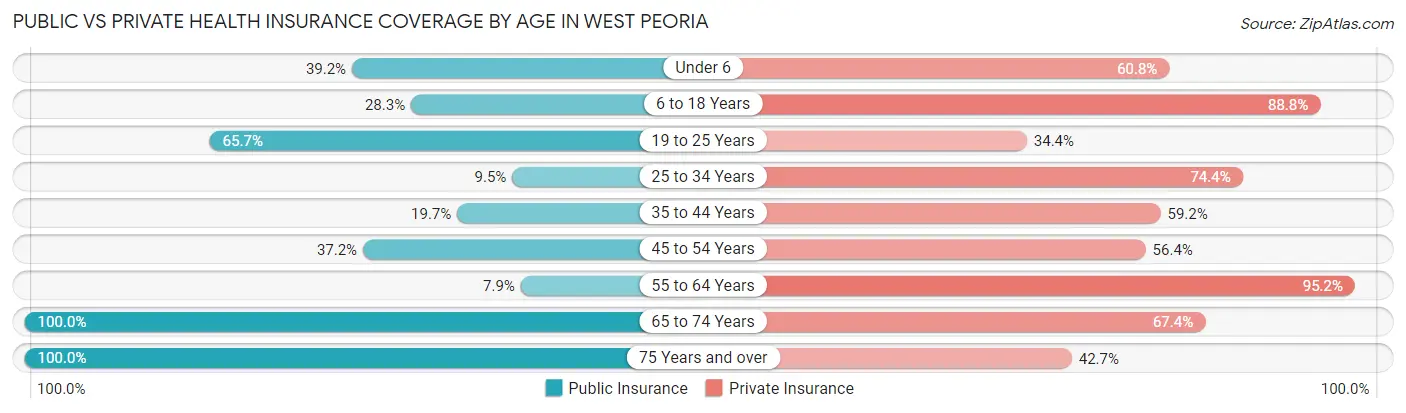
| Age Bracket | Public Insurance | Private Insurance |
| Under 6 | 113 (39.2%) | 175 (60.8%) |
| 6 to 18 Years | 166 (28.3%) | 521 (88.8%) |
| 19 to 25 Years | 151 (65.6%) | 79 (34.4%) |
| 25 to 34 Years | 53 (9.5%) | 415 (74.4%) |
| 35 to 44 Years | 71 (19.7%) | 213 (59.2%) |
| 45 to 54 Years | 157 (37.2%) | 238 (56.4%) |
| 55 to 64 Years | 58 (7.9%) | 697 (95.2%) |
| 65 to 74 Years | 451 (100.0%) | 304 (67.4%) |
| 75 Years and over | 335 (100.0%) | 143 (42.7%) |
| Total | 1,555 (39.2%) | 2,785 (70.3%) |
Disability Status by Sex by Age in West Peoria
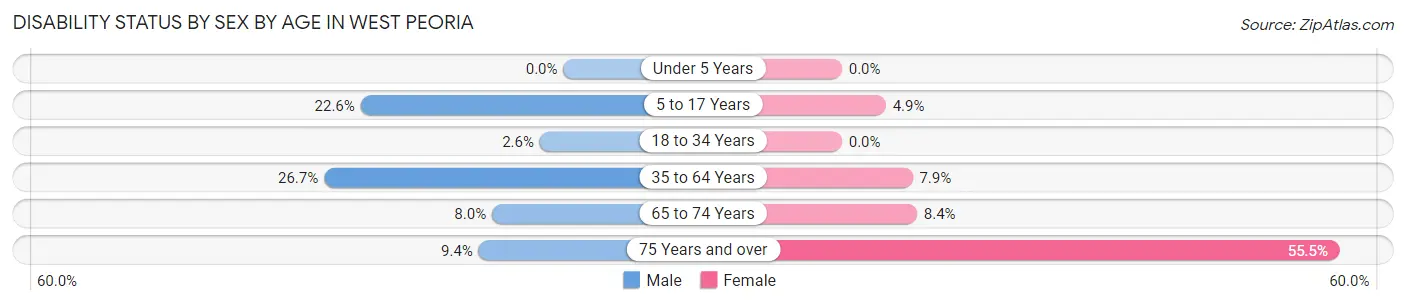
| Age Bracket | Male | Female |
| Under 5 Years | 0 (0.0%) | 0 (0.0%) |
| 5 to 17 Years | 77 (22.6%) | 15 (4.9%) |
| 18 to 34 Years | 15 (2.6%) | 0 (0.0%) |
| 35 to 64 Years | 190 (26.7%) | 63 (7.9%) |
| 65 to 74 Years | 14 (8.0%) | 23 (8.4%) |
| 75 Years and over | 10 (9.4%) | 127 (55.5%) |
Disability Class by Sex by Age in West Peoria
Disability Class: Hearing Difficulty
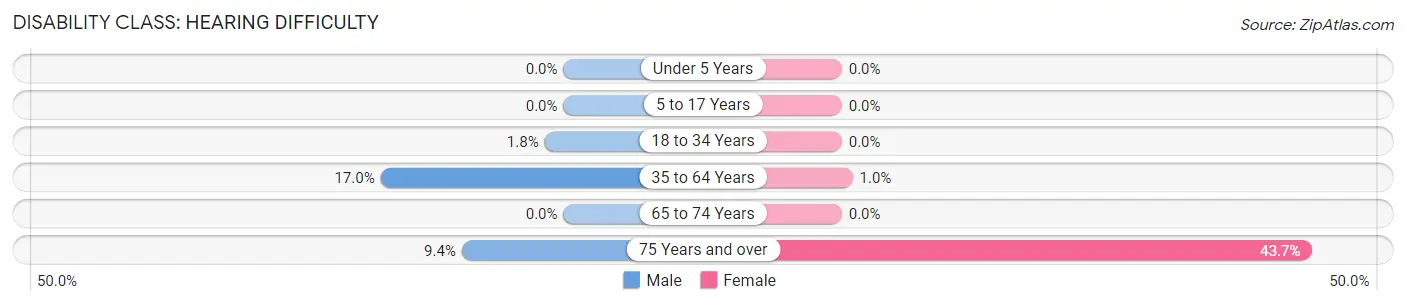
| Age Bracket | Male | Female |
| Under 5 Years | 0 (0.0%) | 0 (0.0%) |
| 5 to 17 Years | 0 (0.0%) | 0 (0.0%) |
| 18 to 34 Years | 10 (1.8%) | 0 (0.0%) |
| 35 to 64 Years | 121 (17.0%) | 8 (1.0%) |
| 65 to 74 Years | 0 (0.0%) | 0 (0.0%) |
| 75 Years and over | 10 (9.4%) | 100 (43.7%) |
Disability Class: Vision Difficulty
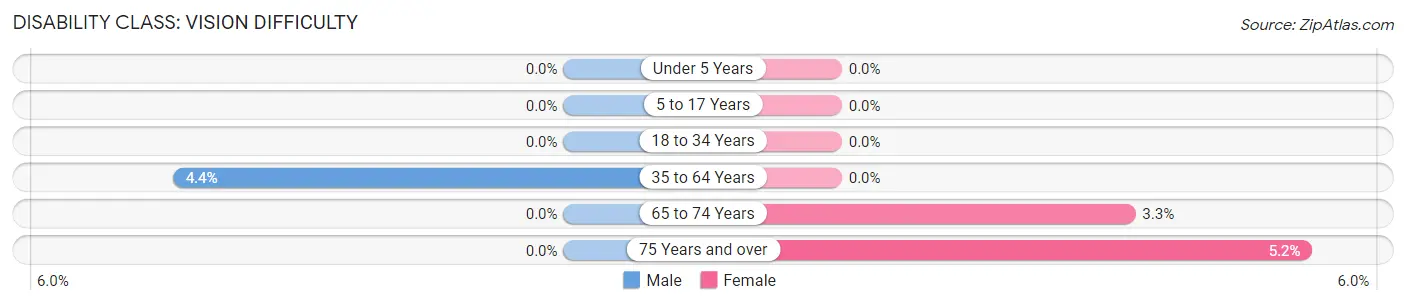
| Age Bracket | Male | Female |
| Under 5 Years | 0 (0.0%) | 0 (0.0%) |
| 5 to 17 Years | 0 (0.0%) | 0 (0.0%) |
| 18 to 34 Years | 0 (0.0%) | 0 (0.0%) |
| 35 to 64 Years | 31 (4.3%) | 0 (0.0%) |
| 65 to 74 Years | 0 (0.0%) | 9 (3.3%) |
| 75 Years and over | 0 (0.0%) | 12 (5.2%) |
Disability Class: Cognitive Difficulty
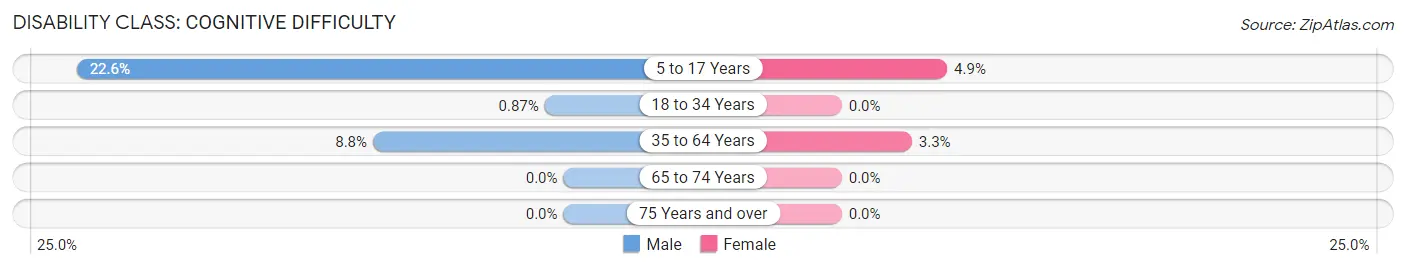
| Age Bracket | Male | Female |
| 5 to 17 Years | 77 (22.6%) | 15 (4.9%) |
| 18 to 34 Years | 5 (0.9%) | 0 (0.0%) |
| 35 to 64 Years | 63 (8.8%) | 26 (3.3%) |
| 65 to 74 Years | 0 (0.0%) | 0 (0.0%) |
| 75 Years and over | 0 (0.0%) | 0 (0.0%) |
Disability Class: Ambulatory Difficulty
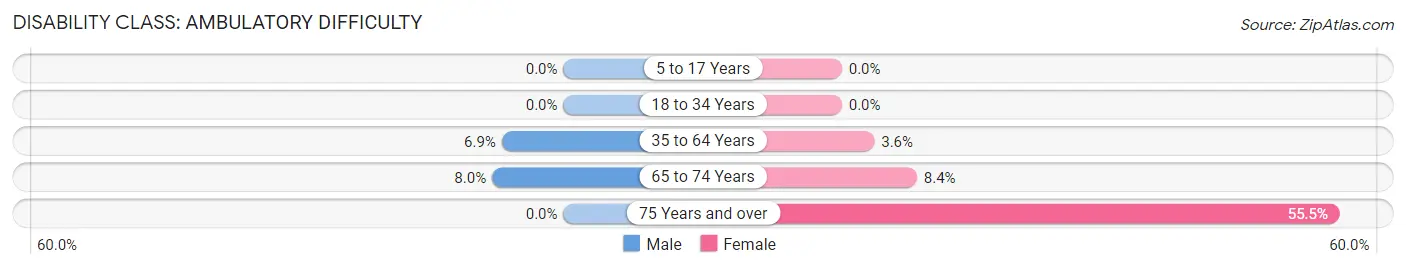
| Age Bracket | Male | Female |
| 5 to 17 Years | 0 (0.0%) | 0 (0.0%) |
| 18 to 34 Years | 0 (0.0%) | 0 (0.0%) |
| 35 to 64 Years | 49 (6.9%) | 29 (3.6%) |
| 65 to 74 Years | 14 (8.0%) | 23 (8.4%) |
| 75 Years and over | 0 (0.0%) | 127 (55.5%) |
Disability Class: Self-Care Difficulty
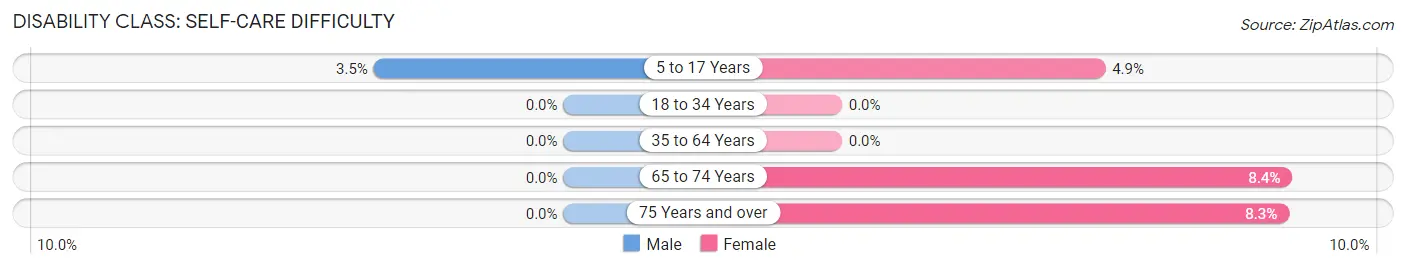
| Age Bracket | Male | Female |
| 5 to 17 Years | 12 (3.5%) | 15 (4.9%) |
| 18 to 34 Years | 0 (0.0%) | 0 (0.0%) |
| 35 to 64 Years | 0 (0.0%) | 0 (0.0%) |
| 65 to 74 Years | 0 (0.0%) | 23 (8.4%) |
| 75 Years and over | 0 (0.0%) | 19 (8.3%) |
Technology Access in West Peoria
Computing Device Access in West Peoria
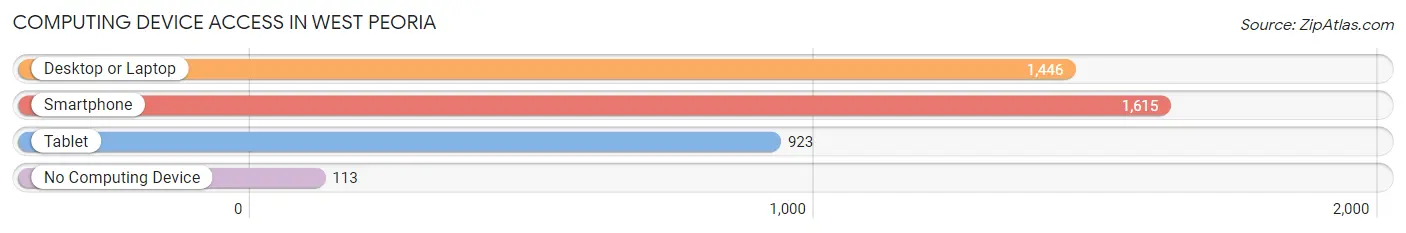
| Device Type | # Households | % Households |
| Desktop or Laptop | 1,446 | 76.7% |
| Smartphone | 1,615 | 85.6% |
| Tablet | 923 | 48.9% |
| No Computing Device | 113 | 6.0% |
| Total | 1,886 | 100.0% |
Internet Access in West Peoria
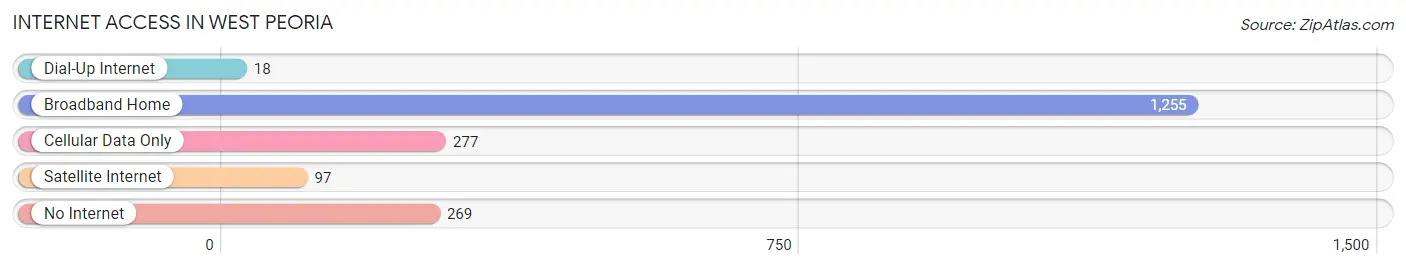
| Internet Type | # Households | % Households |
| Dial-Up Internet | 18 | 0.9% |
| Broadband Home | 1,255 | 66.5% |
| Cellular Data Only | 277 | 14.7% |
| Satellite Internet | 97 | 5.1% |
| No Internet | 269 | 14.3% |
| Total | 1,886 | 100.0% |
West Peoria Summary
History
West Peoria is a city located in Peoria County, Illinois, United States. It is part of the Peoria, Illinois Metropolitan Statistical Area. The population was 4,837 at the 2010 census.
West Peoria was first settled in 1835 by a group of settlers from New York. The settlement was originally known as "New York Settlement" and was located on the west side of the Illinois River. The settlement was later renamed West Peoria in 1845.
The city was officially incorporated in 1891. The city was originally a farming community, but in the early 20th century, it began to develop into a manufacturing center. The city was home to several factories, including the West Peoria Foundry, which produced cast iron products.
The city was also home to the West Peoria State Bank, which was founded in 1891 and was the first bank in the city. The bank was later acquired by the First National Bank of Peoria in 1929.
Geography
West Peoria is located at 40°41'17" North, 89°37'45" West (40.6879, -89.6292). According to the 2010 census, the city has a total area of 2.2 square miles (5.7 km2), all land.
West Peoria is located on the west side of the Illinois River, across from the city of Peoria. The city is bordered by the towns of Peoria Heights to the north, Bartonville to the east, and Kickapoo to the south.
Economy
West Peoria is a small city with a population of just over 4,800 people. The city is home to several small businesses, including restaurants, retail stores, and professional services.
The city is also home to several manufacturing companies, including Caterpillar, Inc., which has a large manufacturing facility in the city. The city is also home to several other manufacturing companies, including West Peoria Foundry, which produces cast iron products.
Demographics
As of the 2010 census, there were 4,837 people, 1,945 households, and 1,269 families residing in the city. The population density was 2,179.2 people per square mile (841.2/km2). There were 2,093 housing units at an average density of 937.2 per square mile (362.3/km2). The racial makeup of the city was 92.2% White, 2.3% African American, 0.3% Native American, 0.7% Asian, 0.1% Pacific Islander, 2.7% from other races, and 1.9% from two or more races. Hispanic or Latino of any race were 5.7% of the population.
There were 1,945 households, out of which 28.3% had children under the age of 18 living with them, 46.2% were married couples living together, 13.2% had a female householder with no husband present, and 35.7% were non-families. 30.2% of all households were made up of individuals, and 12.2% had someone living alone who was 65 years of age or older. The average household size was 2.45 and the average family size was 3.04.
In the city, the population was spread out, with 24.2% under the age of 18, 8.3% from 18 to 24, 28.2% from 25 to 44, 22.7% from 45 to 64, and 16.6% who were 65 years of age or older. The median age was 38 years. For every 100 females, there were 92.2 males. For every 100 females age 18 and over, there were 88.3 males.
The median income for a household in the city was $37,917, and the median income for a family was $45,938. Males had a median income of $35,938 versus $25,917 for females. The per capita income for the city was $19,945. About 8.2% of families and 10.2% of the population were below the poverty line, including 14.2% of those under age 18 and 6.2% of those age 65 or over.
Common Questions
What is Per Capita Income in West Peoria?
Per Capita income in West Peoria is $34,034.
What is the Median Family Income in West Peoria?
Median Family Income in West Peoria is $74,850.
What is the Median Household income in West Peoria?
Median Household Income in West Peoria is $55,000.
What is Income or Wage Gap in West Peoria?
Income or Wage Gap in West Peoria is 19.1%.
Women in West Peoria earn 80.9 cents for every dollar earned by a man.
What is Family Income Deficit in West Peoria?
Family Income Deficit in West Peoria is $15,909.
Families that are below poverty line in West Peoria earn $15,909 less on average than the poverty threshold level.
What is Inequality or Gini Index in West Peoria?
Inequality or Gini Index in West Peoria is 0.44.
What is the Total Population of West Peoria?
Total Population of West Peoria is 4,248.
What is the Total Male Population of West Peoria?
Total Male Population of West Peoria is 2,131.
What is the Total Female Population of West Peoria?
Total Female Population of West Peoria is 2,117.
What is the Ratio of Males per 100 Females in West Peoria?
There are 100.66 Males per 100 Females in West Peoria.
What is the Ratio of Females per 100 Males in West Peoria?
There are 99.34 Females per 100 Males in West Peoria.
What is the Median Population Age in West Peoria?
Median Population Age in West Peoria is 46.2 Years.
What is the Average Family Size in West Peoria
Average Family Size in West Peoria is 2.7 People.
What is the Average Household Size in West Peoria
Average Household Size in West Peoria is 2.1 People.
How Large is the Labor Force in West Peoria?
There are 2,074 People in the Labor Forcein in West Peoria.
What is the Percentage of People in the Labor Force in West Peoria?
58.6% of People are in the Labor Force in West Peoria.
What is the Unemployment Rate in West Peoria?
Unemployment Rate in West Peoria is 5.3%.