West Frankfort, IL Map & Demographics
West Frankfort Map
West Frankfort Overview
$23,300
PER CAPITA INCOME
$48,065
AVG FAMILY INCOME
$41,974
AVG HOUSEHOLD INCOME
43.6%
WAGE / INCOME GAP [ % ]
56.4¢/ $1
WAGE / INCOME GAP [ $ ]
0.45
INEQUALITY / GINI INDEX
7,168
TOTAL POPULATION
3,652
MALE POPULATION
3,516
FEMALE POPULATION
103.87
MALES / 100 FEMALES
96.28
FEMALES / 100 MALES
40.3
MEDIAN AGE
3.1
AVG FAMILY SIZE
2.4
AVG HOUSEHOLD SIZE
2,995
LABOR FORCE [ PEOPLE ]
53.2%
PERCENT IN LABOR FORCE
12.8%
UNEMPLOYMENT RATE
West Frankfort Zip Codes
West Frankfort Area Codes
Income in West Frankfort
Income Overview in West Frankfort
Per Capita Income in West Frankfort is $23,300, while median incomes of families and households are $48,065 and $41,974 respectively.
| Characteristic | Number | Measure |
| Per Capita Income | 7,168 | $23,300 |
| Median Family Income | 1,722 | $48,065 |
| Mean Family Income | 1,722 | $60,467 |
| Median Household Income | 2,994 | $41,974 |
| Mean Household Income | 2,994 | $54,268 |
| Income Deficit | 1,722 | $0 |
| Wage / Income Gap (%) | 7,168 | 43.58% |
| Wage / Income Gap ($) | 7,168 | 56.42¢ per $1 |
| Gini / Inequality Index | 7,168 | 0.45 |
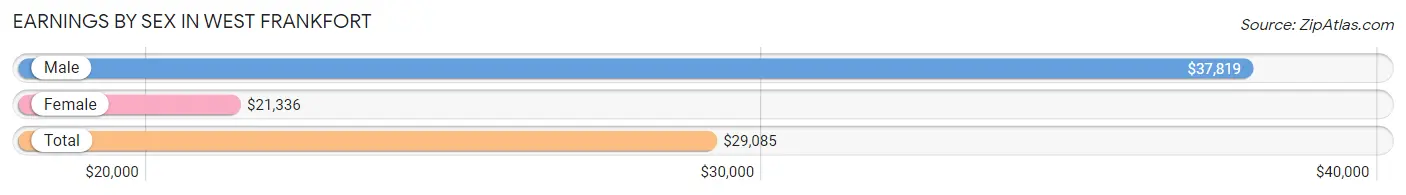
Earnings by Sex in West Frankfort
Average Earnings in West Frankfort are $29,085, $37,819 for men and $21,336 for women, a difference of 43.6%.
| Sex | Number | Average Earnings |
| Male | 1,741 (56.2%) | $37,819 |
| Female | 1,354 (43.8%) | $21,336 |
| Total | 3,095 (100.0%) | $29,085 |
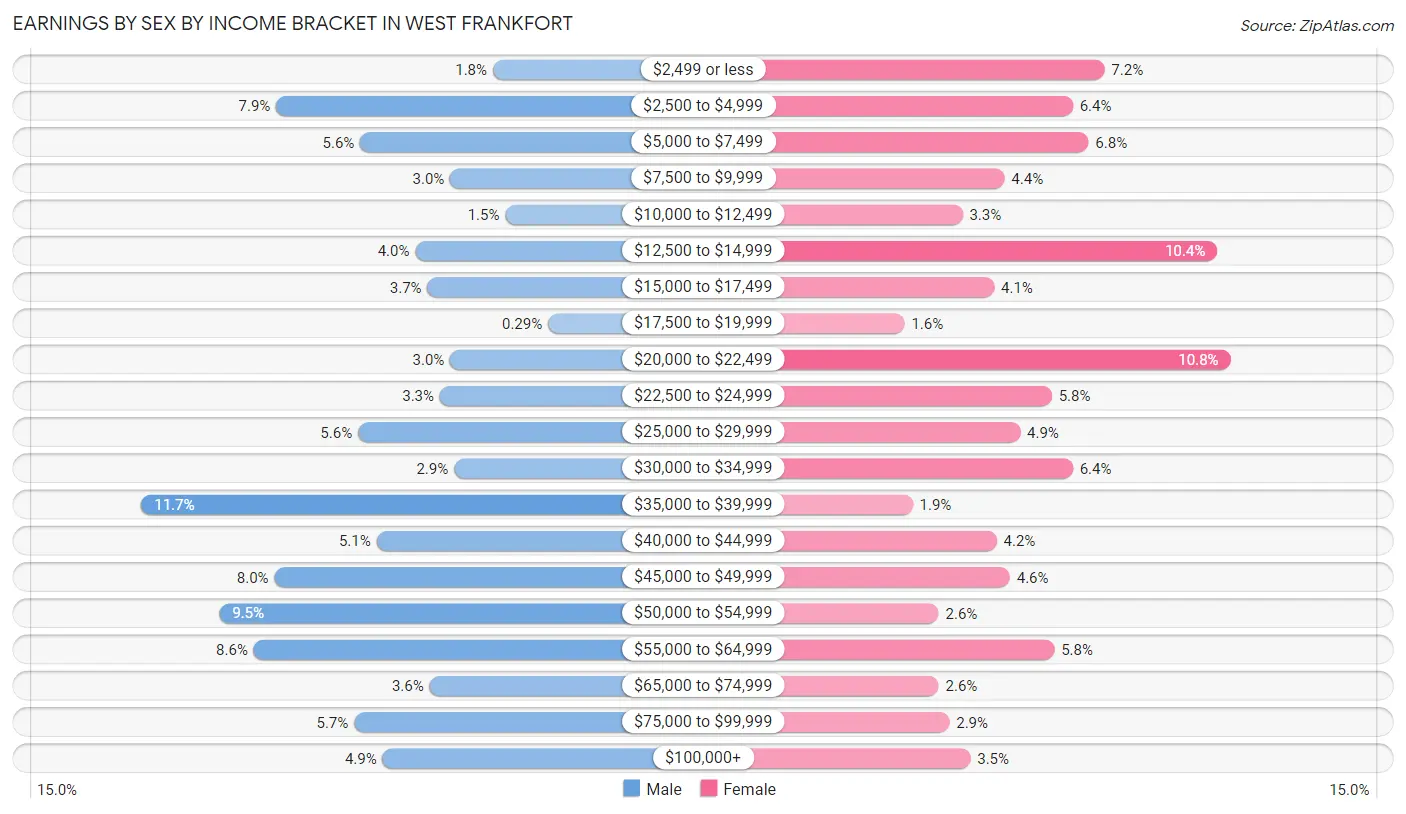
Earnings by Sex by Income Bracket in West Frankfort
The most common earnings brackets in West Frankfort are $35,000 to $39,999 for men (204 | 11.7%) and $20,000 to $22,499 for women (146 | 10.8%).
| Income | Male | Female |
| $2,499 or less | 32 (1.8%) | 98 (7.2%) |
| $2,500 to $4,999 | 138 (7.9%) | 86 (6.4%) |
| $5,000 to $7,499 | 97 (5.6%) | 92 (6.8%) |
| $7,500 to $9,999 | 53 (3.0%) | 60 (4.4%) |
| $10,000 to $12,499 | 26 (1.5%) | 44 (3.3%) |
| $12,500 to $14,999 | 70 (4.0%) | 141 (10.4%) |
| $15,000 to $17,499 | 64 (3.7%) | 56 (4.1%) |
| $17,500 to $19,999 | 5 (0.3%) | 22 (1.6%) |
| $20,000 to $22,499 | 53 (3.0%) | 146 (10.8%) |
| $22,500 to $24,999 | 58 (3.3%) | 78 (5.8%) |
| $25,000 to $29,999 | 98 (5.6%) | 66 (4.9%) |
| $30,000 to $34,999 | 51 (2.9%) | 86 (6.4%) |
| $35,000 to $39,999 | 204 (11.7%) | 25 (1.8%) |
| $40,000 to $44,999 | 89 (5.1%) | 57 (4.2%) |
| $45,000 to $49,999 | 139 (8.0%) | 62 (4.6%) |
| $50,000 to $54,999 | 166 (9.5%) | 35 (2.6%) |
| $55,000 to $64,999 | 149 (8.6%) | 79 (5.8%) |
| $65,000 to $74,999 | 63 (3.6%) | 35 (2.6%) |
| $75,000 to $99,999 | 100 (5.7%) | 39 (2.9%) |
| $100,000+ | 86 (4.9%) | 47 (3.5%) |
| Total | 1,741 (100.0%) | 1,354 (100.0%) |
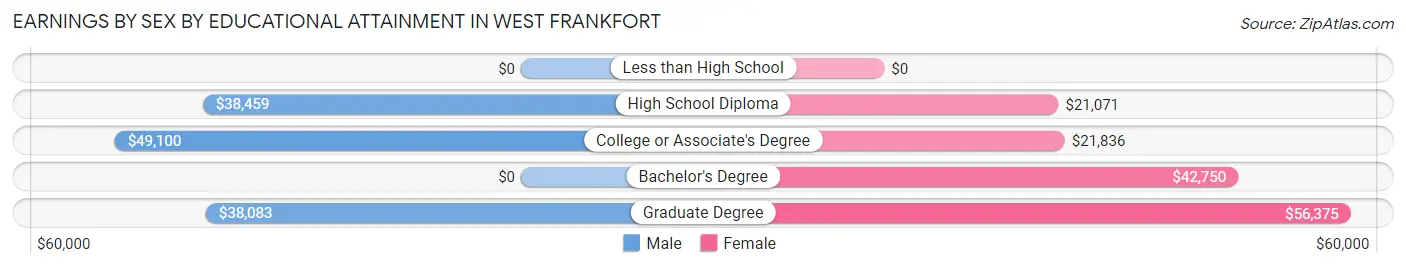
Earnings by Sex by Educational Attainment in West Frankfort
Average earnings in West Frankfort are $40,948 for men and $22,286 for women, a difference of 45.6%. Men with an educational attainment of college or associate's degree enjoy the highest average annual earnings of $49,100, while those with graduate degree education earn the least with $38,083. Women with an educational attainment of graduate degree earn the most with the average annual earnings of $56,375, while those with high school diploma education have the smallest earnings of $21,071.
| Educational Attainment | Male Income | Female Income |
| Less than High School | - | - |
| High School Diploma | $38,459 | $21,071 |
| College or Associate's Degree | $49,100 | $21,836 |
| Bachelor's Degree | - | - |
| Graduate Degree | $38,083 | $56,375 |
| Total | $40,948 | $22,286 |
Family Income in West Frankfort
Family Income Brackets in West Frankfort
According to the West Frankfort family income data, there are 300 families falling into the $50,000 to $74,999 income range, which is the most common income bracket and makes up 17.4% of all families. Conversely, the $200,000+ income bracket is the least frequent group with only 14 families (0.8%) belonging to this category.
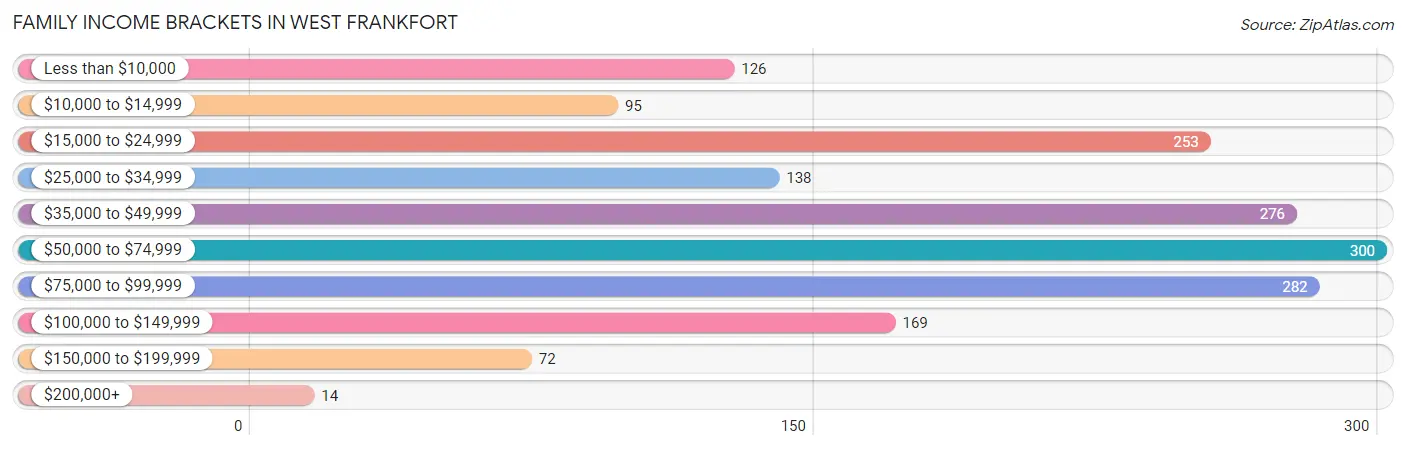
| Income Bracket | # Families | % Families |
| Less than $10,000 | 126 | 7.3% |
| $10,000 to $14,999 | 95 | 5.5% |
| $15,000 to $24,999 | 253 | 14.7% |
| $25,000 to $34,999 | 138 | 8.0% |
| $35,000 to $49,999 | 276 | 16.0% |
| $50,000 to $74,999 | 300 | 17.4% |
| $75,000 to $99,999 | 282 | 16.4% |
| $100,000 to $149,999 | 169 | 9.8% |
| $150,000 to $199,999 | 72 | 4.2% |
| $200,000+ | 14 | 0.8% |
Family Income by Famaliy Size in West Frankfort
4-person families (362 | 21.0%) account for the highest median family income in West Frankfort with $66,875 per family, while 2-person families (741 | 43.0%) have the highest median income of $24,094 per family member.
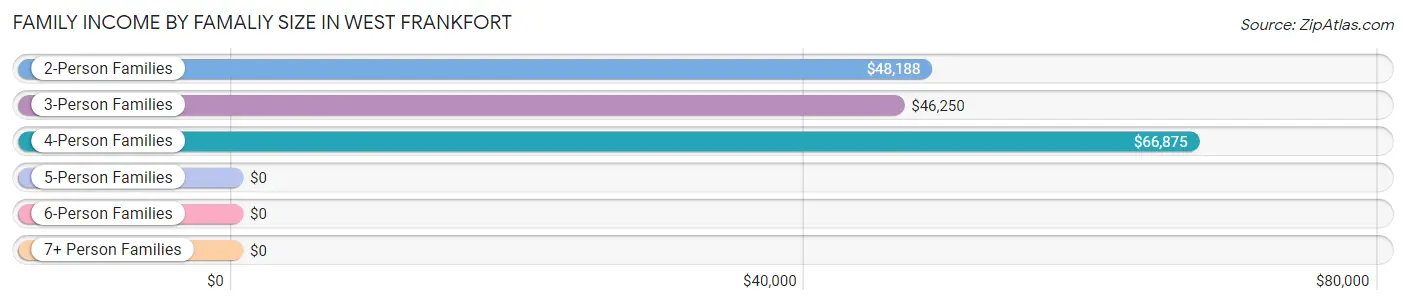
| Income Bracket | # Families | Median Income |
| 2-Person Families | 741 (43.0%) | $48,188 |
| 3-Person Families | 440 (25.6%) | $46,250 |
| 4-Person Families | 362 (21.0%) | $66,875 |
| 5-Person Families | 147 (8.5%) | $0 |
| 6-Person Families | 32 (1.9%) | $0 |
| 7+ Person Families | 0 (0.0%) | $0 |
| Total | 1,722 (100.0%) | $48,065 |
Family Income by Number of Earners in West Frankfort
The median family income in West Frankfort is $48,065, with families comprising 3+ earners (75) having the highest median family income of $113,482, while families with no earners (343) have the lowest median family income of $34,234, accounting for 4.4% and 19.9% of families, respectively.
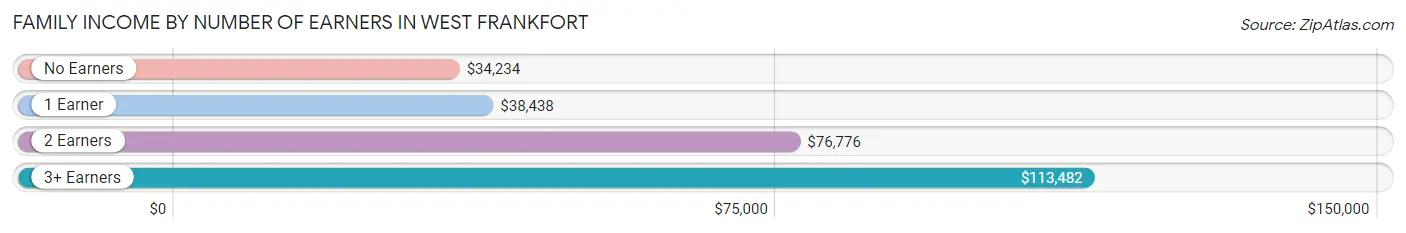
| Number of Earners | # Families | Median Income |
| No Earners | 343 (19.9%) | $34,234 |
| 1 Earner | 800 (46.5%) | $38,438 |
| 2 Earners | 504 (29.3%) | $76,776 |
| 3+ Earners | 75 (4.4%) | $113,482 |
| Total | 1,722 (100.0%) | $48,065 |
Household Income in West Frankfort
Household Income Brackets in West Frankfort
With 539 households falling in the category, the $50,000 to $74,999 income range is the most frequent in West Frankfort, accounting for 18.0% of all households. In contrast, only 36 households (1.2%) fall into the $200,000+ income bracket, making it the least populous group.
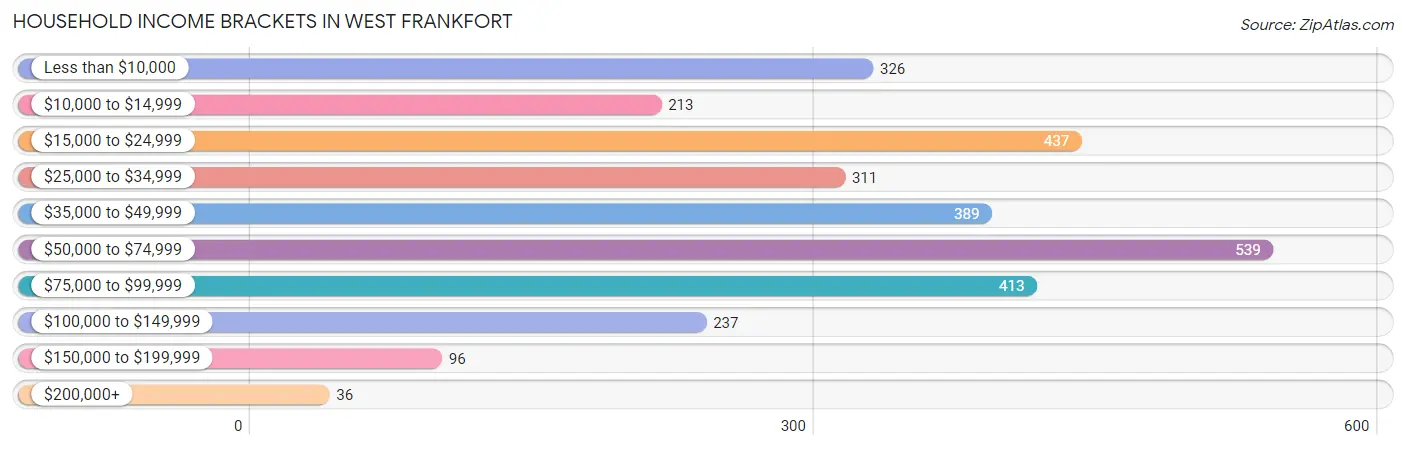
| Income Bracket | # Households | % Households |
| Less than $10,000 | 326 | 10.9% |
| $10,000 to $14,999 | 213 | 7.1% |
| $15,000 to $24,999 | 437 | 14.6% |
| $25,000 to $34,999 | 311 | 10.4% |
| $35,000 to $49,999 | 389 | 13.0% |
| $50,000 to $74,999 | 539 | 18.0% |
| $75,000 to $99,999 | 413 | 13.8% |
| $100,000 to $149,999 | 237 | 7.9% |
| $150,000 to $199,999 | 96 | 3.2% |
| $200,000+ | 36 | 1.2% |
Household Income by Householder Age in West Frankfort
The median household income in West Frankfort is $41,974, with the highest median household income of $53,659 found in the 45 to 64 years age bracket for the primary householder. A total of 888 households (29.7%) fall into this category. Meanwhile, the 15 to 24 years age bracket for the primary householder has the lowest median household income of $0, with 135 households (4.5%) in this group.
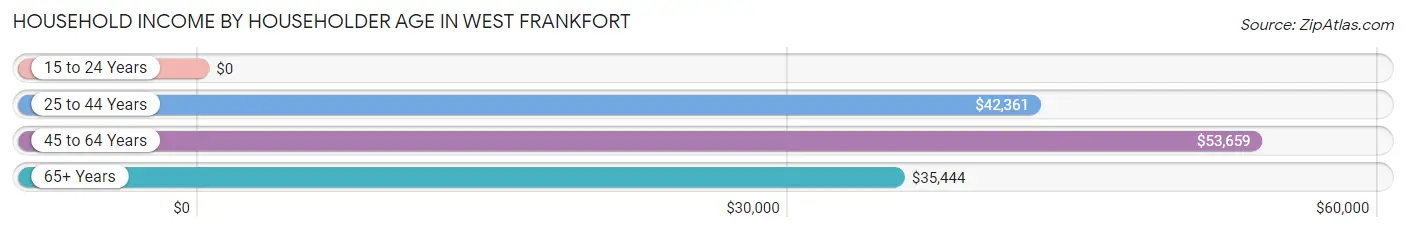
| Income Bracket | # Households | Median Income |
| 15 to 24 Years | 135 (4.5%) | $0 |
| 25 to 44 Years | 929 (31.0%) | $42,361 |
| 45 to 64 Years | 888 (29.7%) | $53,659 |
| 65+ Years | 1,042 (34.8%) | $35,444 |
| Total | 2,994 (100.0%) | $41,974 |
Poverty in West Frankfort
Income Below Poverty by Sex and Age in West Frankfort
With 24.1% poverty level for males and 35.1% for females among the residents of West Frankfort, 15 year old males and 16 and 17 year old females are the most vulnerable to poverty, with 75 males (61.5%) and 136 females (84.0%) in their respective age groups living below the poverty level.
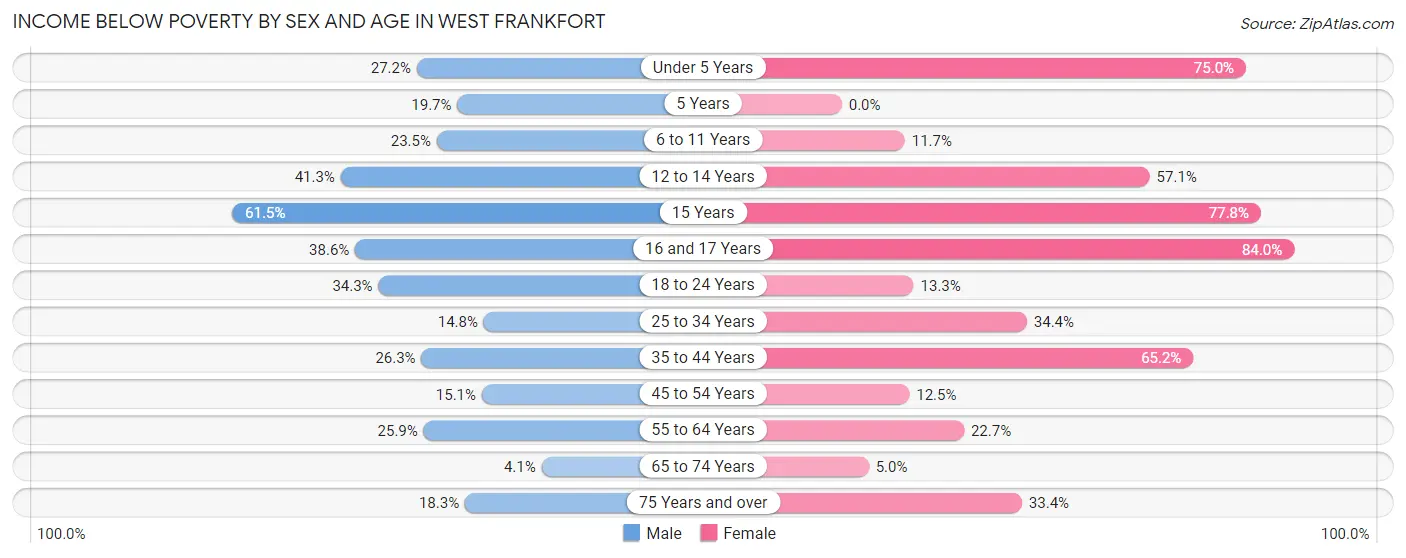
| Age Bracket | Male | Female |
| Under 5 Years | 37 (27.2%) | 138 (75.0%) |
| 5 Years | 12 (19.7%) | 0 (0.0%) |
| 6 to 11 Years | 70 (23.5%) | 22 (11.7%) |
| 12 to 14 Years | 81 (41.3%) | 124 (57.1%) |
| 15 Years | 75 (61.5%) | 56 (77.8%) |
| 16 and 17 Years | 34 (38.6%) | 136 (84.0%) |
| 18 to 24 Years | 127 (34.3%) | 24 (13.3%) |
| 25 to 34 Years | 67 (14.8%) | 135 (34.4%) |
| 35 to 44 Years | 113 (26.3%) | 285 (65.2%) |
| 45 to 54 Years | 51 (15.1%) | 54 (12.5%) |
| 55 to 64 Years | 138 (25.9%) | 100 (22.7%) |
| 65 to 74 Years | 13 (4.1%) | 18 (5.0%) |
| 75 Years and over | 42 (18.3%) | 117 (33.4%) |
| Total | 860 (24.1%) | 1,209 (35.1%) |
Income Above Poverty by Sex and Age in West Frankfort
According to the poverty statistics in West Frankfort, males aged 65 to 74 years and females aged 5 years are the age groups that are most secure financially, with 96.0% of males and 100.0% of females in these age groups living above the poverty line.
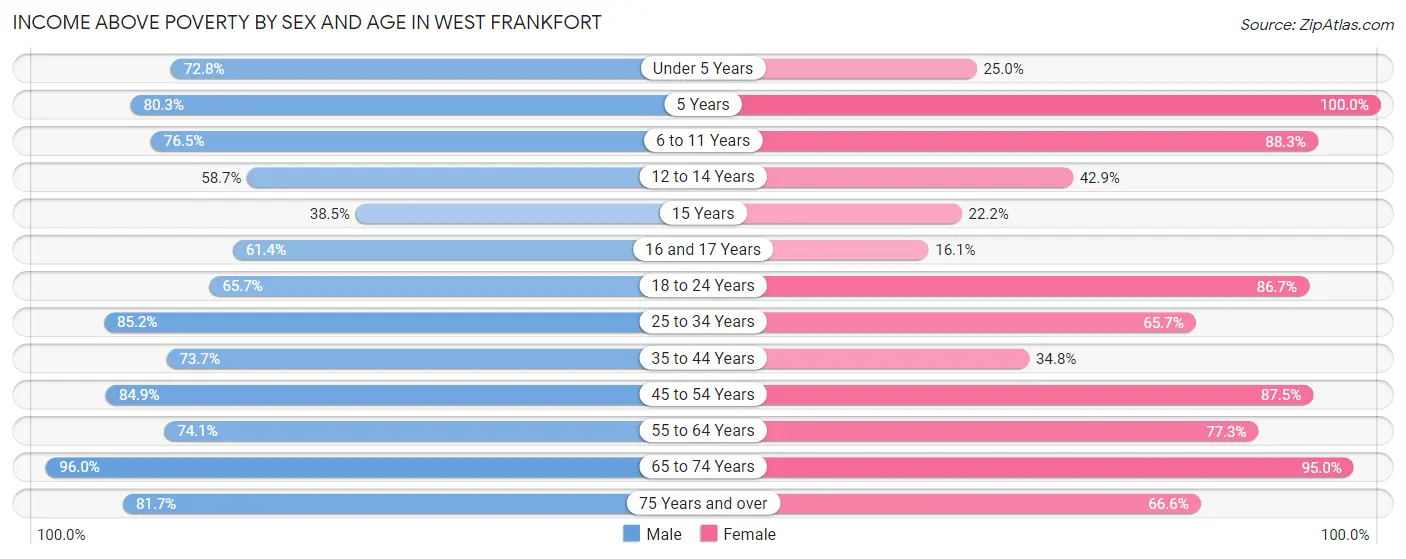
| Age Bracket | Male | Female |
| Under 5 Years | 99 (72.8%) | 46 (25.0%) |
| 5 Years | 49 (80.3%) | 28 (100.0%) |
| 6 to 11 Years | 228 (76.5%) | 166 (88.3%) |
| 12 to 14 Years | 115 (58.7%) | 93 (42.9%) |
| 15 Years | 47 (38.5%) | 16 (22.2%) |
| 16 and 17 Years | 54 (61.4%) | 26 (16.1%) |
| 18 to 24 Years | 243 (65.7%) | 156 (86.7%) |
| 25 to 34 Years | 387 (85.2%) | 258 (65.6%) |
| 35 to 44 Years | 316 (73.7%) | 152 (34.8%) |
| 45 to 54 Years | 286 (84.9%) | 377 (87.5%) |
| 55 to 64 Years | 394 (74.1%) | 341 (77.3%) |
| 65 to 74 Years | 308 (96.0%) | 343 (95.0%) |
| 75 Years and over | 188 (81.7%) | 233 (66.6%) |
| Total | 2,714 (75.9%) | 2,235 (64.9%) |
Income Below Poverty Among Married-Couple Families in West Frankfort
The poverty statistics for married-couple families in West Frankfort show that 26.6% or 300 of the total 1,129 families live below the poverty line. Families with 3 or 4 children have the highest poverty rate of 64.4%, comprising of 76 families. On the other hand, families with no children have the lowest poverty rate of 9.1%, which includes 53 families.
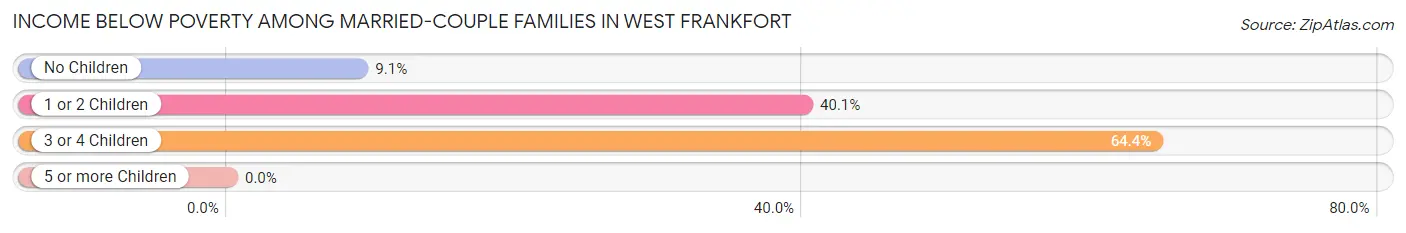
| Children | Above Poverty | Below Poverty |
| No Children | 531 (90.9%) | 53 (9.1%) |
| 1 or 2 Children | 256 (60.0%) | 171 (40.1%) |
| 3 or 4 Children | 42 (35.6%) | 76 (64.4%) |
| 5 or more Children | 0 (0.0%) | 0 (0.0%) |
| Total | 829 (73.4%) | 300 (26.6%) |
Income Below Poverty Among Single-Parent Households in West Frankfort
According to the poverty data in West Frankfort, 7.2% or 8 single-father households and 29.0% or 140 single-mother households are living below the poverty line. Among single-father households, those with 1 or 2 children have the highest poverty rate, with 8 households (10.1%) experiencing poverty. Likewise, among single-mother households, those with 3 or 4 children have the highest poverty rate, with 35 households (79.5%) falling below the poverty line.
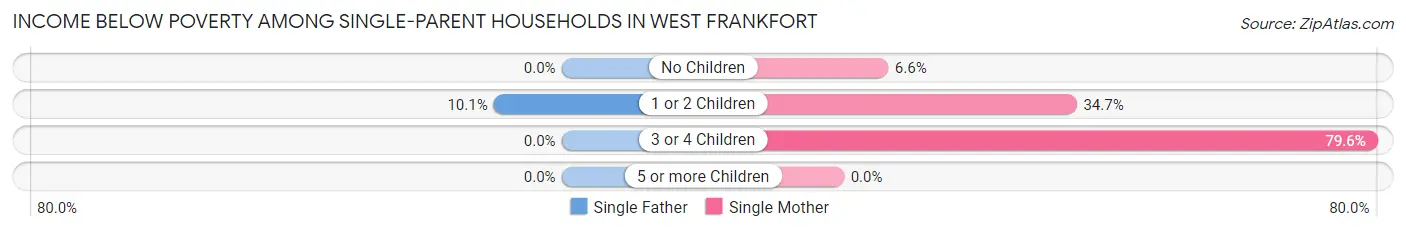
| Children | Single Father | Single Mother |
| No Children | 0 (0.0%) | 11 (6.6%) |
| 1 or 2 Children | 8 (10.1%) | 94 (34.7%) |
| 3 or 4 Children | 0 (0.0%) | 35 (79.5%) |
| 5 or more Children | 0 (0.0%) | 0 (0.0%) |
| Total | 8 (7.2%) | 140 (29.0%) |
Income Below Poverty Among Married-Couple vs Single-Parent Households in West Frankfort
The poverty data for West Frankfort shows that 300 of the married-couple family households (26.6%) and 148 of the single-parent households (25.0%) are living below the poverty level. Within the married-couple family households, those with 3 or 4 children have the highest poverty rate, with 76 households (64.4%) falling below the poverty line. Among the single-parent households, those with 3 or 4 children have the highest poverty rate, with 35 household (79.5%) living below poverty.
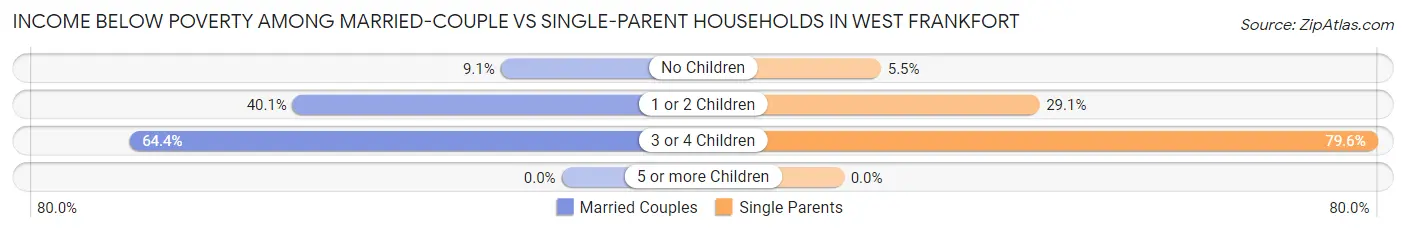
| Children | Married-Couple Families | Single-Parent Households |
| No Children | 53 (9.1%) | 11 (5.5%) |
| 1 or 2 Children | 171 (40.1%) | 102 (29.1%) |
| 3 or 4 Children | 76 (64.4%) | 35 (79.5%) |
| 5 or more Children | 0 (0.0%) | 0 (0.0%) |
| Total | 300 (26.6%) | 148 (25.0%) |
Race in West Frankfort
The most populous races in West Frankfort are White / Caucasian (6,930 | 96.7%), Two or more Races (213 | 3.0%), and Hispanic or Latino (49 | 0.7%).
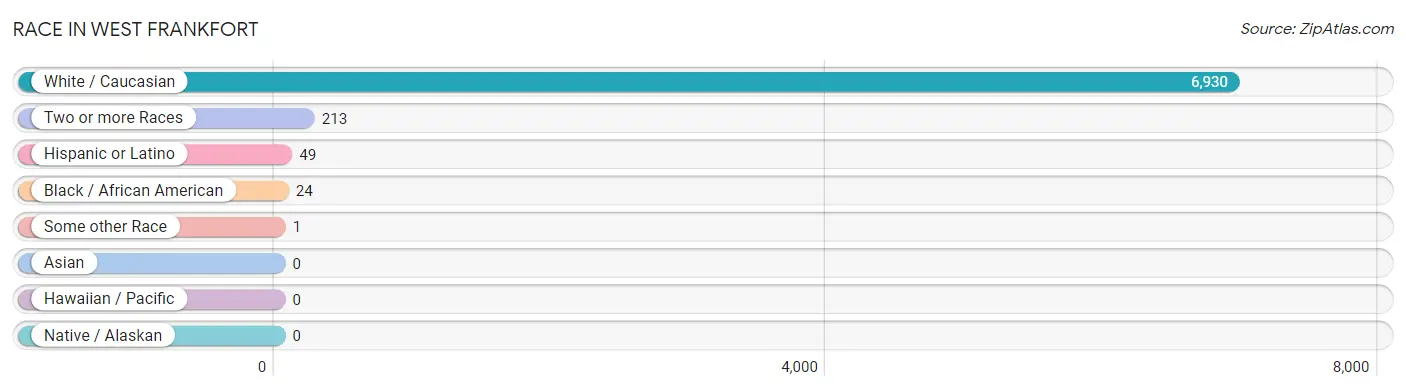
| Race | # Population | % Population |
| Asian | 0 | 0.0% |
| Black / African American | 24 | 0.3% |
| Hawaiian / Pacific | 0 | 0.0% |
| Hispanic or Latino | 49 | 0.7% |
| Native / Alaskan | 0 | 0.0% |
| White / Caucasian | 6,930 | 96.7% |
| Two or more Races | 213 | 3.0% |
| Some other Race | 1 | 0.0% |
| Total | 7,168 | 100.0% |
Ancestry in West Frankfort
The most populous ancestries reported in West Frankfort are Irish (1,045 | 14.6%), American (1,018 | 14.2%), German (975 | 13.6%), English (805 | 11.2%), and Italian (423 | 5.9%), together accounting for 59.5% of all West Frankfort residents.
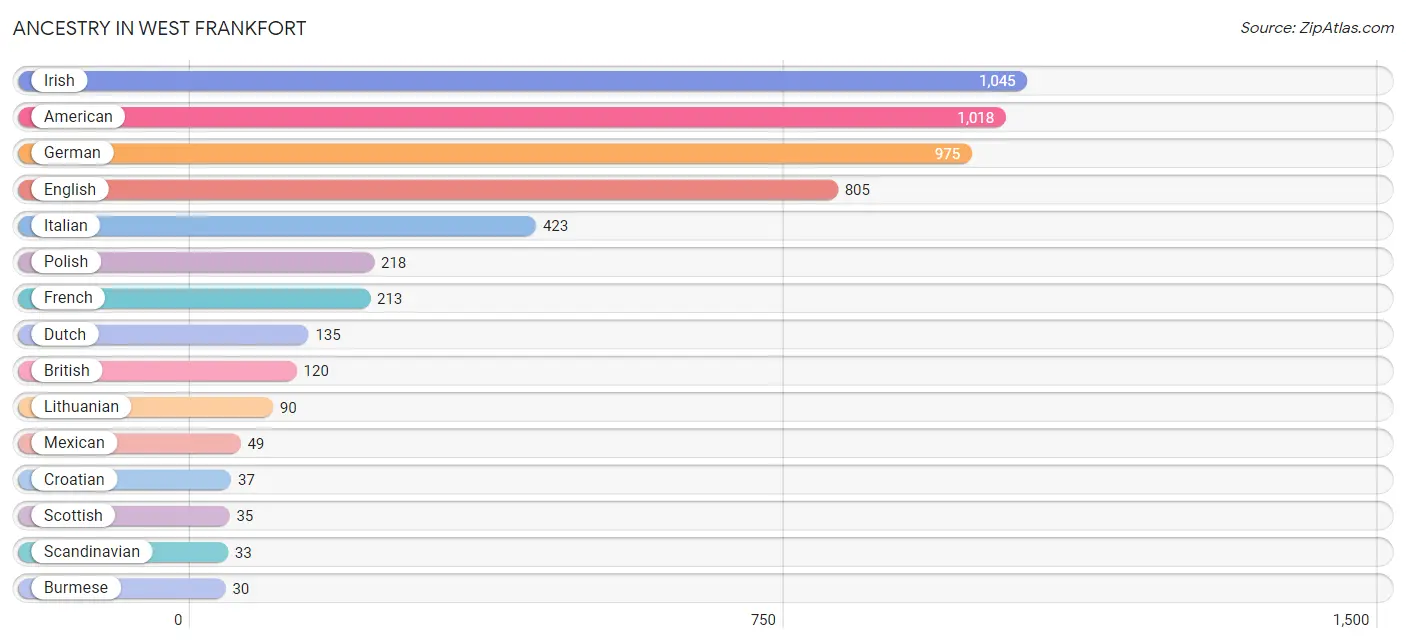
| Ancestry | # Population | % Population |
| American | 1,018 | 14.2% |
| Apache | 8 | 0.1% |
| Blackfeet | 1 | 0.0% |
| British | 120 | 1.7% |
| Burmese | 30 | 0.4% |
| Cherokee | 26 | 0.4% |
| Cheyenne | 6 | 0.1% |
| Croatian | 37 | 0.5% |
| Dutch | 135 | 1.9% |
| English | 805 | 11.2% |
| European | 27 | 0.4% |
| French | 213 | 3.0% |
| French Canadian | 8 | 0.1% |
| German | 975 | 13.6% |
| Hungarian | 13 | 0.2% |
| Irish | 1,045 | 14.6% |
| Italian | 423 | 5.9% |
| Lithuanian | 90 | 1.3% |
| Mexican | 49 | 0.7% |
| Norwegian | 8 | 0.1% |
| Polish | 218 | 3.0% |
| Portuguese | 7 | 0.1% |
| Scandinavian | 33 | 0.5% |
| Scotch-Irish | 25 | 0.4% |
| Scottish | 35 | 0.5% |
| Slovak | 5 | 0.1% |
| Swiss | 10 | 0.1% |
| Welsh | 24 | 0.3% |
| Yugoslavian | 10 | 0.1% | View All 29 Rows |
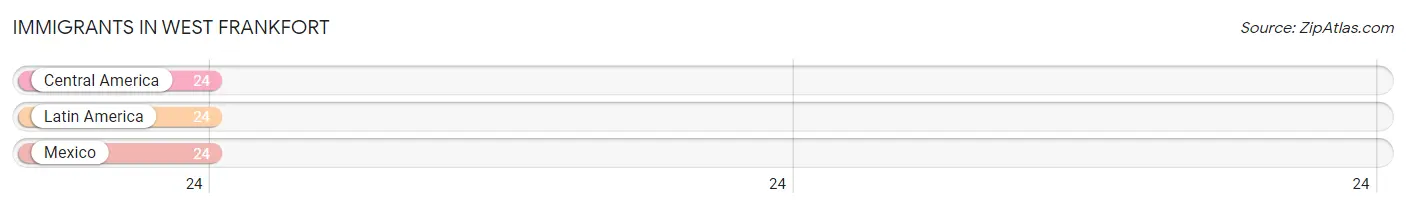
Immigrants in West Frankfort
The most numerous immigrant groups reported in West Frankfort came from Central America (24 | 0.3%), Latin America (24 | 0.3%), and Mexico (24 | 0.3%), together accounting for 1.0% of all West Frankfort residents.
| Immigration Origin | # Population | % Population |
| Central America | 24 | 0.3% |
| Latin America | 24 | 0.3% |
| Mexico | 24 | 0.3% | View All 3 Rows |
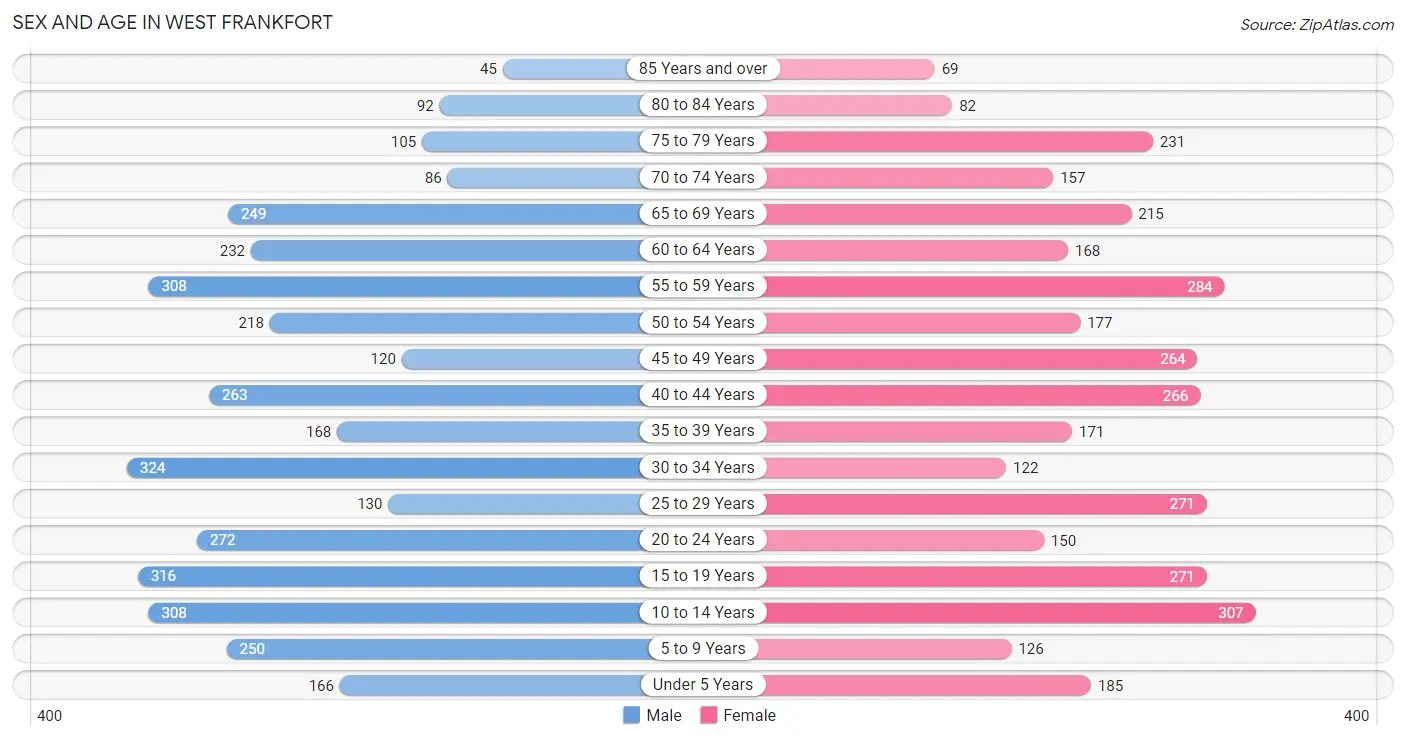
Sex and Age in West Frankfort
Sex and Age in West Frankfort
The most populous age groups in West Frankfort are 30 to 34 Years (324 | 8.9%) for men and 10 to 14 Years (307 | 8.7%) for women.
| Age Bracket | Male | Female |
| Under 5 Years | 166 (4.5%) | 185 (5.3%) |
| 5 to 9 Years | 250 (6.9%) | 126 (3.6%) |
| 10 to 14 Years | 308 (8.4%) | 307 (8.7%) |
| 15 to 19 Years | 316 (8.6%) | 271 (7.7%) |
| 20 to 24 Years | 272 (7.4%) | 150 (4.3%) |
| 25 to 29 Years | 130 (3.6%) | 271 (7.7%) |
| 30 to 34 Years | 324 (8.9%) | 122 (3.5%) |
| 35 to 39 Years | 168 (4.6%) | 171 (4.9%) |
| 40 to 44 Years | 263 (7.2%) | 266 (7.6%) |
| 45 to 49 Years | 120 (3.3%) | 264 (7.5%) |
| 50 to 54 Years | 218 (6.0%) | 177 (5.0%) |
| 55 to 59 Years | 308 (8.4%) | 284 (8.1%) |
| 60 to 64 Years | 232 (6.4%) | 168 (4.8%) |
| 65 to 69 Years | 249 (6.8%) | 215 (6.1%) |
| 70 to 74 Years | 86 (2.4%) | 157 (4.5%) |
| 75 to 79 Years | 105 (2.9%) | 231 (6.6%) |
| 80 to 84 Years | 92 (2.5%) | 82 (2.3%) |
| 85 Years and over | 45 (1.2%) | 69 (2.0%) |
| Total | 3,652 (100.0%) | 3,516 (100.0%) |
Families and Households in West Frankfort
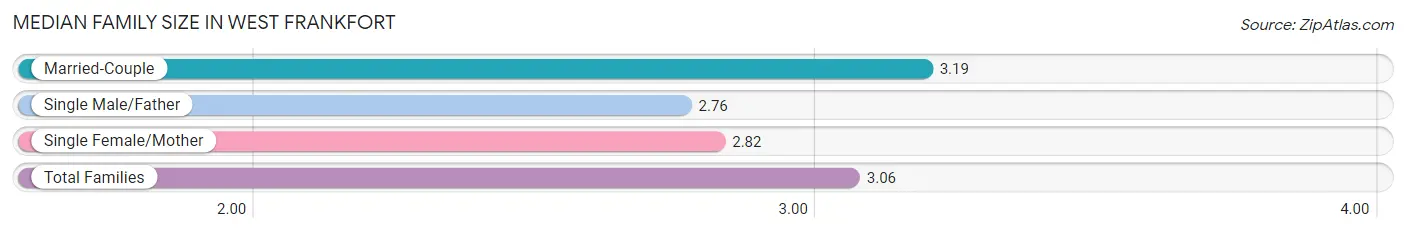
Median Family Size in West Frankfort
The median family size in West Frankfort is 3.06 persons per family, with married-couple families (1,129 | 65.6%) accounting for the largest median family size of 3.19 persons per family. On the other hand, single male/father families (111 | 6.5%) represent the smallest median family size with 2.76 persons per family.
| Family Type | # Families | Family Size |
| Married-Couple | 1,129 (65.6%) | 3.19 |
| Single Male/Father | 111 (6.5%) | 2.76 |
| Single Female/Mother | 482 (28.0%) | 2.82 |
| Total Families | 1,722 (100.0%) | 3.06 |
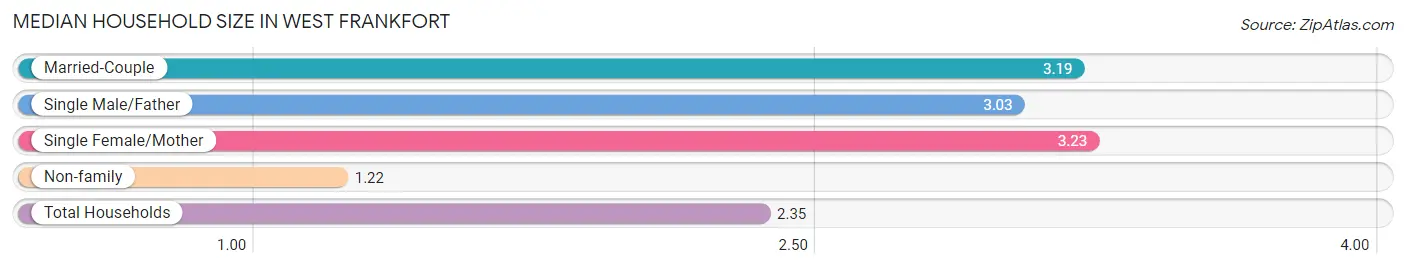
Median Household Size in West Frankfort
The median household size in West Frankfort is 2.35 persons per household, with single female/mother households (482 | 16.1%) accounting for the largest median household size of 3.23 persons per household. non-family households (1,272 | 42.5%) represent the smallest median household size with 1.22 persons per household.
| Household Type | # Households | Household Size |
| Married-Couple | 1,129 (37.7%) | 3.19 |
| Single Male/Father | 111 (3.7%) | 3.03 |
| Single Female/Mother | 482 (16.1%) | 3.23 |
| Non-family | 1,272 (42.5%) | 1.22 |
| Total Households | 2,994 (100.0%) | 2.35 |
Household Size by Marriage Status in West Frankfort
Out of a total of 2,994 households in West Frankfort, 1,722 (57.5%) are family households, while 1,272 (42.5%) are nonfamily households. The most numerous type of family households are 2-person households, comprising 678, and the most common type of nonfamily households are 1-person households, comprising 1,163.
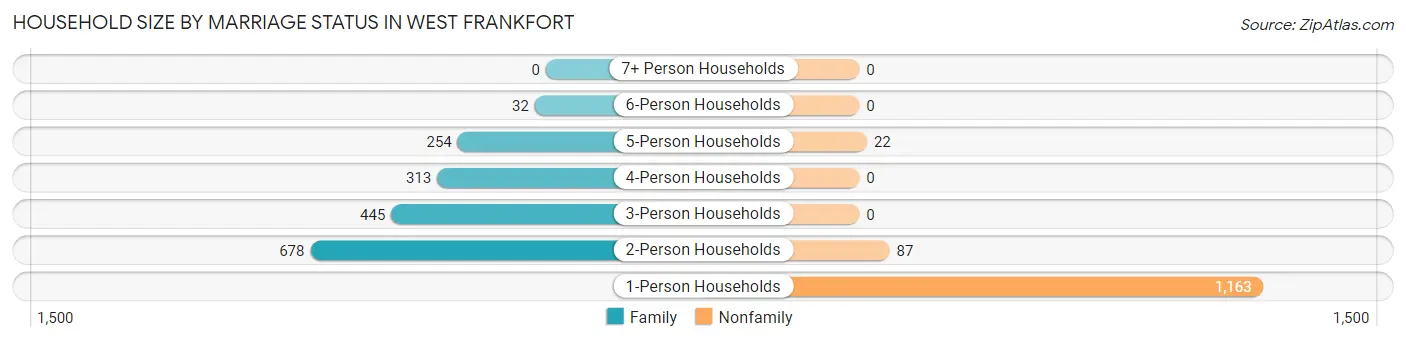
| Household Size | Family Households | Nonfamily Households |
| 1-Person Households | - | 1,163 (38.8%) |
| 2-Person Households | 678 (22.7%) | 87 (2.9%) |
| 3-Person Households | 445 (14.9%) | 0 (0.0%) |
| 4-Person Households | 313 (10.4%) | 0 (0.0%) |
| 5-Person Households | 254 (8.5%) | 22 (0.7%) |
| 6-Person Households | 32 (1.1%) | 0 (0.0%) |
| 7+ Person Households | 0 (0.0%) | 0 (0.0%) |
| Total | 1,722 (57.5%) | 1,272 (42.5%) |
Female Fertility in West Frankfort
Fertility by Age in West Frankfort
Average fertility rate in West Frankfort is 74.0 births per 1,000 women. Women in the age bracket of 20 to 34 years have the highest fertility rate with 182.0 births per 1,000 women. Women in the age bracket of 20 to 34 years acount for 86.1% of all women with births.
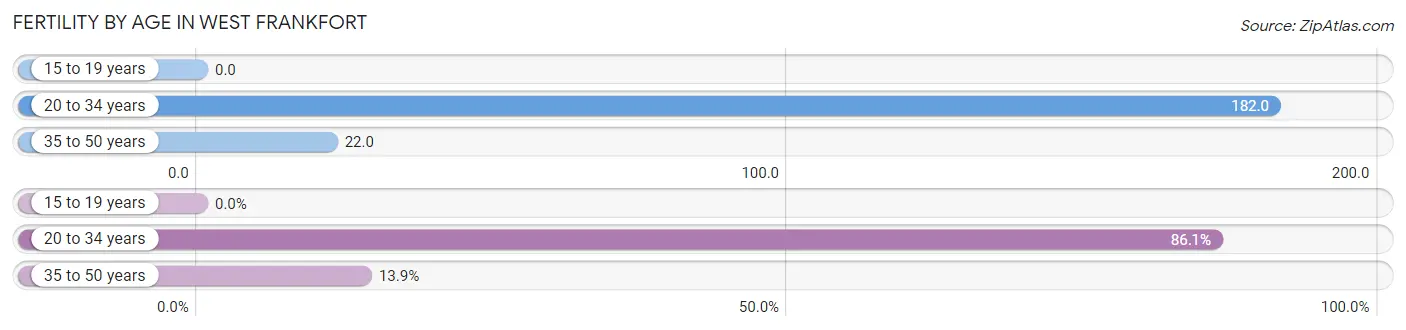
| Age Bracket | Women with Births | Births / 1,000 Women |
| 15 to 19 years | 0 (0.0%) | 0.0 |
| 20 to 34 years | 99 (86.1%) | 182.0 |
| 35 to 50 years | 16 (13.9%) | 22.0 |
| Total | 115 (100.0%) | 74.0 |
Fertility by Age by Marriage Status in West Frankfort
27.0% of women with births (115) in West Frankfort are married. The highest percentage of unmarried women with births falls into 35 to 50 years age bracket with 100.0% of them unmarried at the time of birth, while the lowest percentage of unmarried women with births belong to 20 to 34 years age bracket with 68.7% of them unmarried.
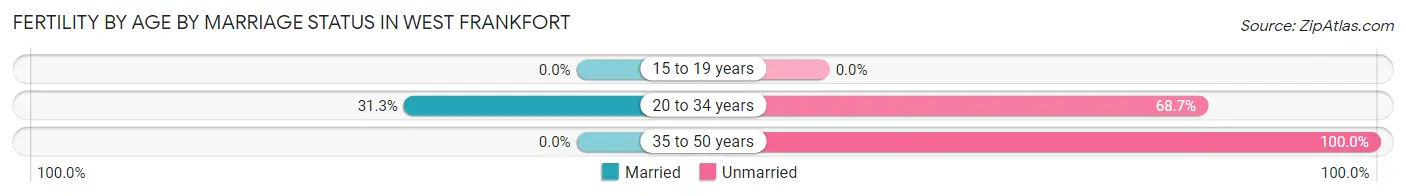
| Age Bracket | Married | Unmarried |
| 15 to 19 years | 0 (0.0%) | 0 (0.0%) |
| 20 to 34 years | 31 (31.3%) | 68 (68.7%) |
| 35 to 50 years | 0 (0.0%) | 16 (100.0%) |
| Total | 31 (27.0%) | 84 (73.0%) |
Fertility by Education in West Frankfort
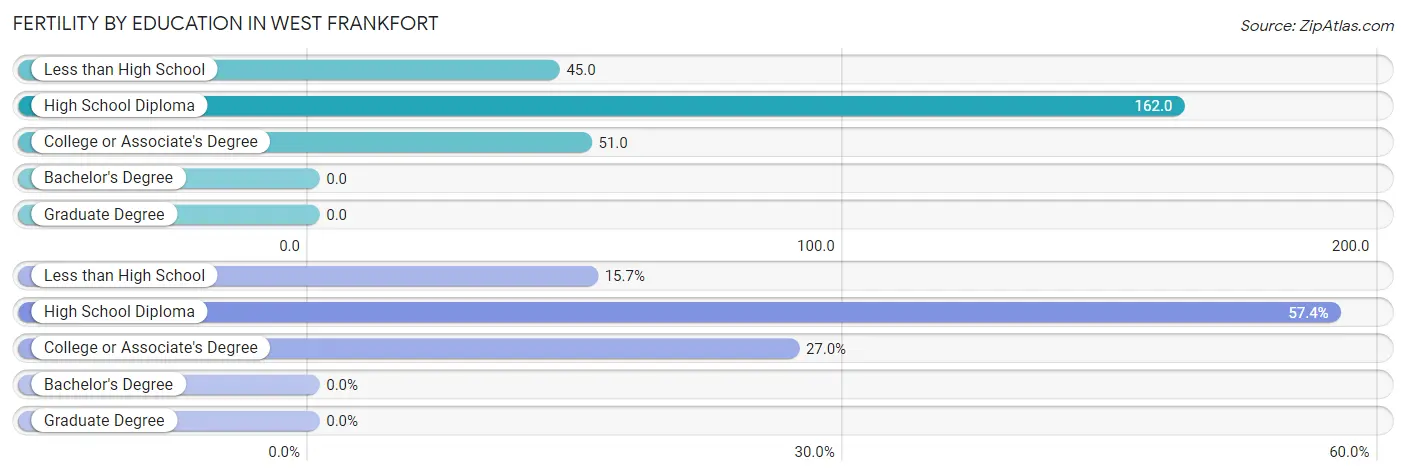
| Educational Attainment | Women with Births | Births / 1,000 Women |
| Less than High School | 18 (15.7%) | 45.0 |
| High School Diploma | 66 (57.4%) | 162.0 |
| College or Associate's Degree | 31 (27.0%) | 51.0 |
| Bachelor's Degree | 0 (0.0%) | 0.0 |
| Graduate Degree | 0 (0.0%) | 0.0 |
| Total | 115 (100.0%) | 74.0 |
Fertility by Education by Marriage Status in West Frankfort
73.0% of women with births in West Frankfort are unmarried. Women with the educational attainment of college or associate's degree are most likely to be married with 100.0% of them married at childbirth, while women with the educational attainment of less than high school are least likely to be married with 100.0% of them unmarried at childbirth.
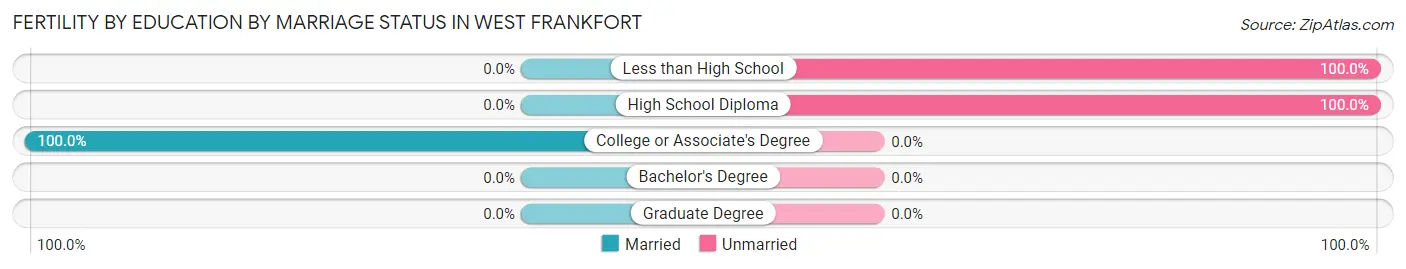
| Educational Attainment | Married | Unmarried |
| Less than High School | 0 (0.0%) | 18 (100.0%) |
| High School Diploma | 0 (0.0%) | 66 (100.0%) |
| College or Associate's Degree | 31 (100.0%) | 0 (0.0%) |
| Bachelor's Degree | 0 (0.0%) | 0 (0.0%) |
| Graduate Degree | 0 (0.0%) | 0 (0.0%) |
| Total | 31 (27.0%) | 84 (73.0%) |
Employment Characteristics in West Frankfort
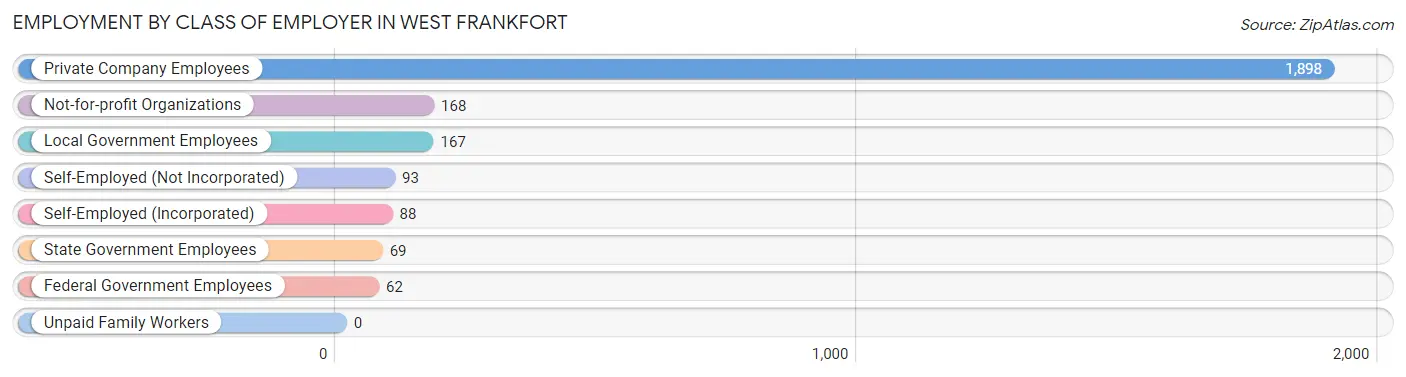
Employment by Class of Employer in West Frankfort
Among the 2,545 employed individuals in West Frankfort, private company employees (1,898 | 74.6%), not-for-profit organizations (168 | 6.6%), and local government employees (167 | 6.6%) make up the most common classes of employment.
| Employer Class | # Employees | % Employees |
| Private Company Employees | 1,898 | 74.6% |
| Self-Employed (Incorporated) | 88 | 3.5% |
| Self-Employed (Not Incorporated) | 93 | 3.6% |
| Not-for-profit Organizations | 168 | 6.6% |
| Local Government Employees | 167 | 6.6% |
| State Government Employees | 69 | 2.7% |
| Federal Government Employees | 62 | 2.4% |
| Unpaid Family Workers | 0 | 0.0% |
| Total | 2,545 | 100.0% |
Employment Status by Age in West Frankfort
According to the labor force statistics for West Frankfort, out of the total population over 16 years of age (5,630), 53.2% or 2,995 individuals are in the labor force, with 12.8% or 383 of them unemployed. The age group with the highest labor force participation rate is 30 to 34 years, with 85.4% or 381 individuals in the labor force. Within the labor force, the 16 to 19 years age range has the highest percentage of unemployed individuals, with 30.0% or 54 of them being unemployed.
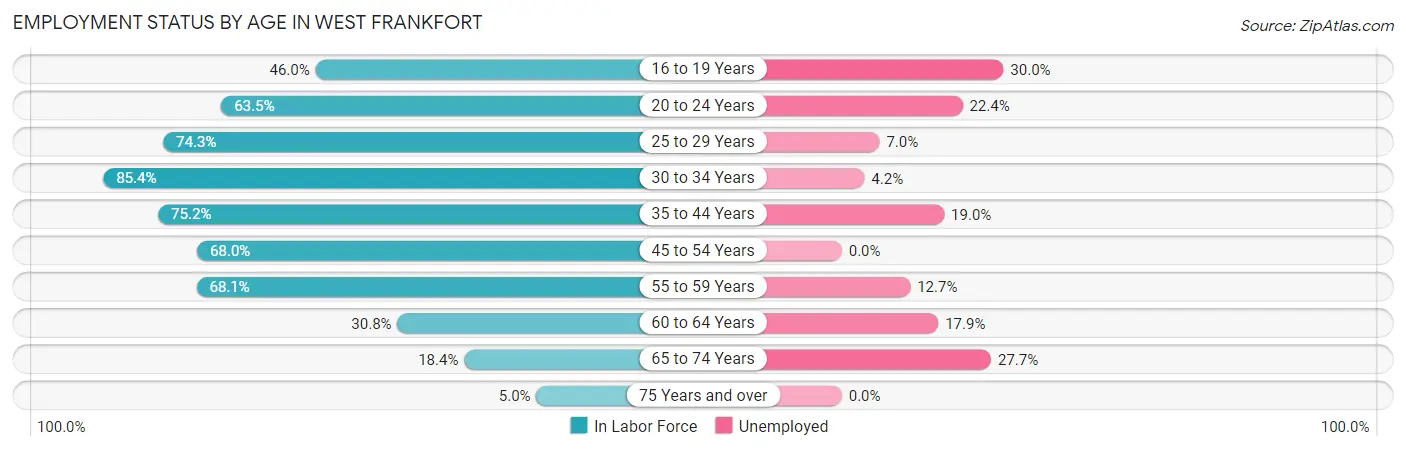
| Age Bracket | In Labor Force | Unemployed |
| 16 to 19 Years | 180 (46.0%) | 54 (30.0%) |
| 20 to 24 Years | 268 (63.5%) | 60 (22.4%) |
| 25 to 29 Years | 298 (74.3%) | 21 (7.0%) |
| 30 to 34 Years | 381 (85.4%) | 16 (4.2%) |
| 35 to 44 Years | 653 (75.2%) | 124 (19.0%) |
| 45 to 54 Years | 530 (68.0%) | 0 (0.0%) |
| 55 to 59 Years | 403 (68.1%) | 51 (12.7%) |
| 60 to 64 Years | 123 (30.8%) | 22 (17.9%) |
| 65 to 74 Years | 130 (18.4%) | 36 (27.7%) |
| 75 Years and over | 31 (5.0%) | 0 (0.0%) |
| Total | 2,995 (53.2%) | 383 (12.8%) |
Employment Status by Educational Attainment in West Frankfort
According to labor force statistics for West Frankfort, 68.5% of individuals (2,388) out of the total population between 25 and 64 years of age (3,486) are in the labor force, with 9.8% or 234 of them being unemployed. The group with the highest labor force participation rate are those with the educational attainment of bachelor's degree or higher, with 86.4% or 355 individuals in the labor force. Within the labor force, individuals with less than high school education have the highest percentage of unemployment, with 39.9% or 79 of them being unemployed.
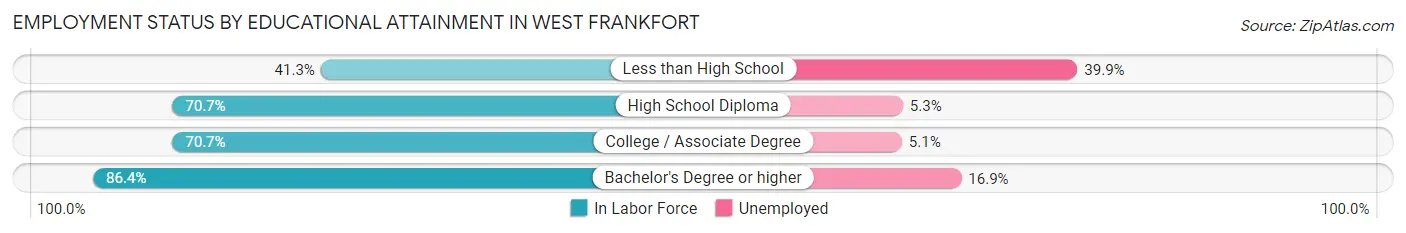
| Educational Attainment | In Labor Force | Unemployed |
| Less than High School | 198 (41.3%) | 191 (39.9%) |
| High School Diploma | 885 (70.7%) | 66 (5.3%) |
| College / Associate Degree | 950 (70.7%) | 69 (5.1%) |
| Bachelor's Degree or higher | 355 (86.4%) | 69 (16.9%) |
| Total | 2,388 (68.5%) | 342 (9.8%) |
Employment Occupations by Sex in West Frankfort
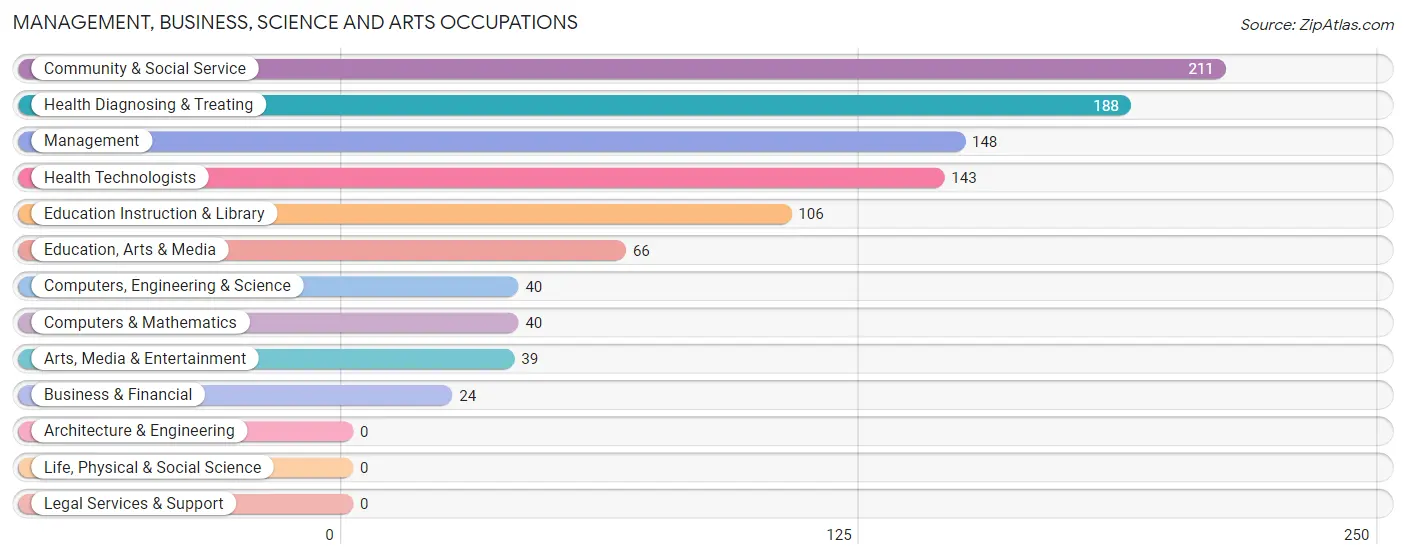
Management, Business, Science and Arts Occupations
The most common Management, Business, Science and Arts occupations in West Frankfort are Community & Social Service (211 | 8.1%), Health Diagnosing & Treating (188 | 7.2%), Management (148 | 5.7%), Health Technologists (143 | 5.5%), and Education Instruction & Library (106 | 4.1%).
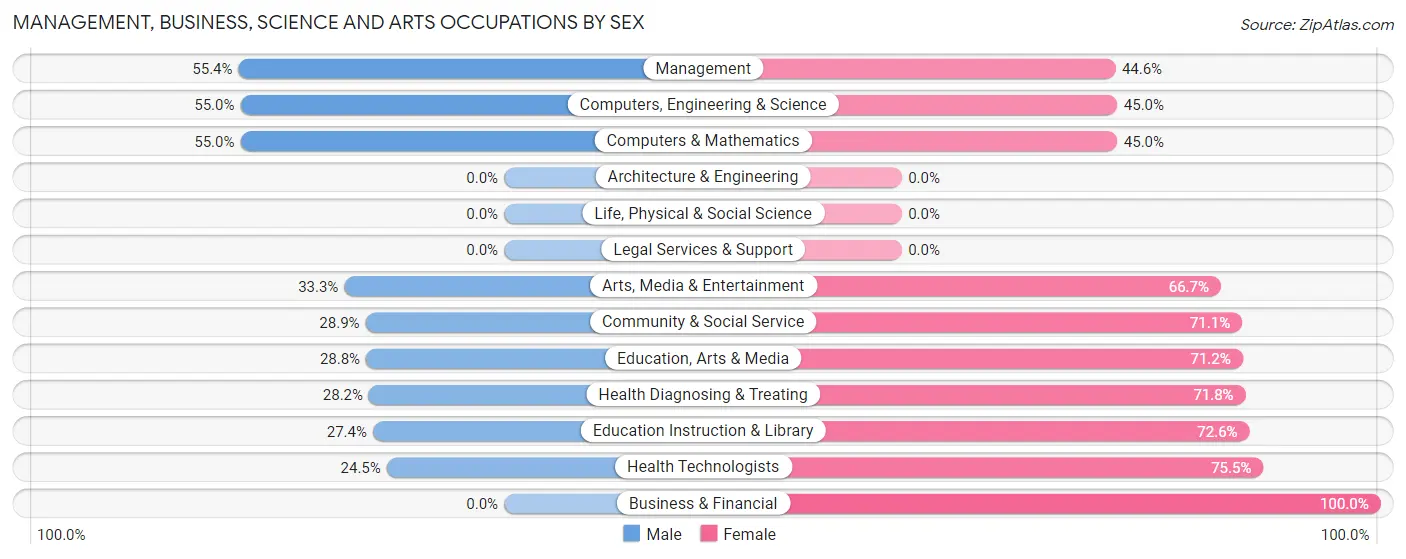
Management, Business, Science and Arts Occupations by Sex
Within the Management, Business, Science and Arts occupations in West Frankfort, the most male-oriented occupations are Management (55.4%), Computers, Engineering & Science (55.0%), and Computers & Mathematics (55.0%), while the most female-oriented occupations are Business & Financial (100.0%), Health Technologists (75.5%), and Education Instruction & Library (72.6%).
| Occupation | Male | Female |
| Management | 82 (55.4%) | 66 (44.6%) |
| Business & Financial | 0 (0.0%) | 24 (100.0%) |
| Computers, Engineering & Science | 22 (55.0%) | 18 (45.0%) |
| Computers & Mathematics | 22 (55.0%) | 18 (45.0%) |
| Architecture & Engineering | 0 (0.0%) | 0 (0.0%) |
| Life, Physical & Social Science | 0 (0.0%) | 0 (0.0%) |
| Community & Social Service | 61 (28.9%) | 150 (71.1%) |
| Education, Arts & Media | 19 (28.8%) | 47 (71.2%) |
| Legal Services & Support | 0 (0.0%) | 0 (0.0%) |
| Education Instruction & Library | 29 (27.4%) | 77 (72.6%) |
| Arts, Media & Entertainment | 13 (33.3%) | 26 (66.7%) |
| Health Diagnosing & Treating | 53 (28.2%) | 135 (71.8%) |
| Health Technologists | 35 (24.5%) | 108 (75.5%) |
| Total (Category) | 218 (35.7%) | 393 (64.3%) |
| Total (Overall) | 1,406 (53.8%) | 1,207 (46.2%) |
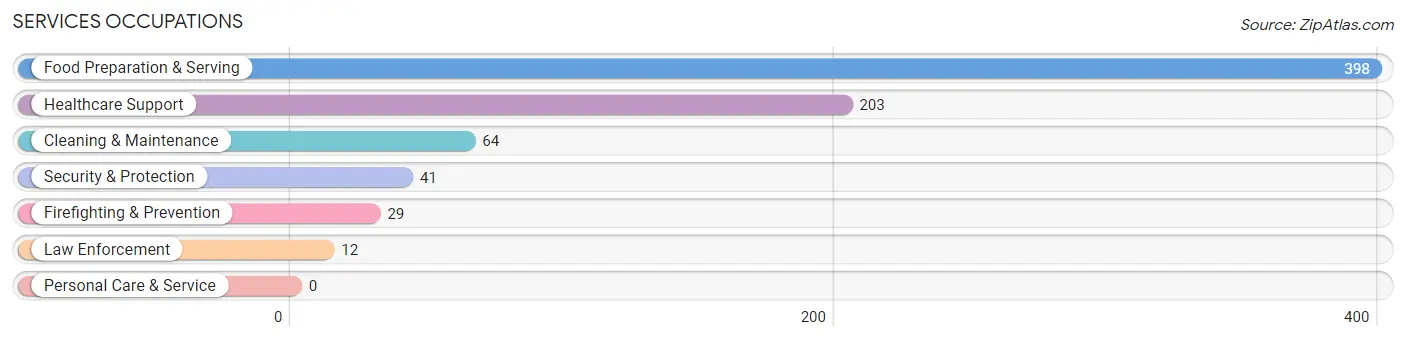
Services Occupations
The most common Services occupations in West Frankfort are Food Preparation & Serving (398 | 15.2%), Healthcare Support (203 | 7.8%), Cleaning & Maintenance (64 | 2.5%), Security & Protection (41 | 1.6%), and Firefighting & Prevention (29 | 1.1%).
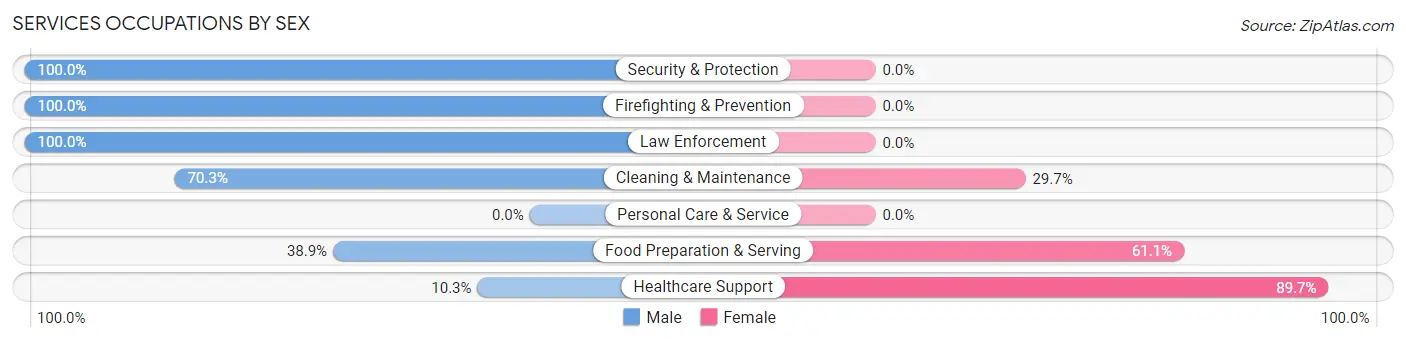
Services Occupations by Sex
Within the Services occupations in West Frankfort, the most male-oriented occupations are Security & Protection (100.0%), Firefighting & Prevention (100.0%), and Law Enforcement (100.0%), while the most female-oriented occupations are Healthcare Support (89.7%), Food Preparation & Serving (61.1%), and Cleaning & Maintenance (29.7%).
| Occupation | Male | Female |
| Healthcare Support | 21 (10.3%) | 182 (89.7%) |
| Security & Protection | 41 (100.0%) | 0 (0.0%) |
| Firefighting & Prevention | 29 (100.0%) | 0 (0.0%) |
| Law Enforcement | 12 (100.0%) | 0 (0.0%) |
| Food Preparation & Serving | 155 (38.9%) | 243 (61.1%) |
| Cleaning & Maintenance | 45 (70.3%) | 19 (29.7%) |
| Personal Care & Service | 0 (0.0%) | 0 (0.0%) |
| Total (Category) | 262 (37.1%) | 444 (62.9%) |
| Total (Overall) | 1,406 (53.8%) | 1,207 (46.2%) |
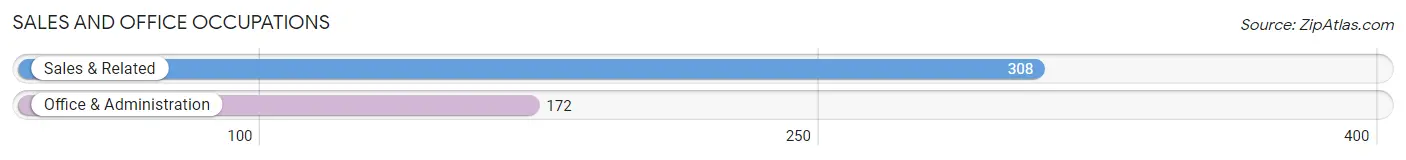
Sales and Office Occupations
The most common Sales and Office occupations in West Frankfort are Sales & Related (308 | 11.8%), and Office & Administration (172 | 6.6%).
Sales and Office Occupations by Sex
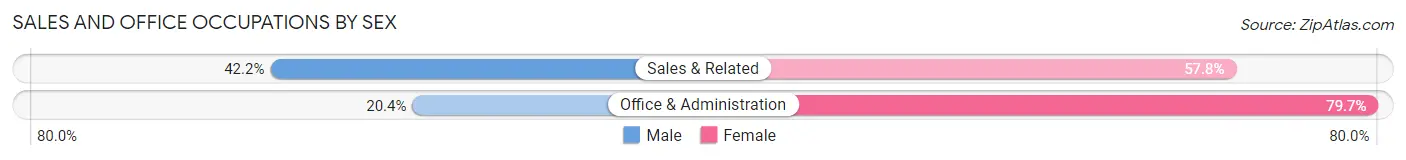
| Occupation | Male | Female |
| Sales & Related | 130 (42.2%) | 178 (57.8%) |
| Office & Administration | 35 (20.3%) | 137 (79.6%) |
| Total (Category) | 165 (34.4%) | 315 (65.6%) |
| Total (Overall) | 1,406 (53.8%) | 1,207 (46.2%) |
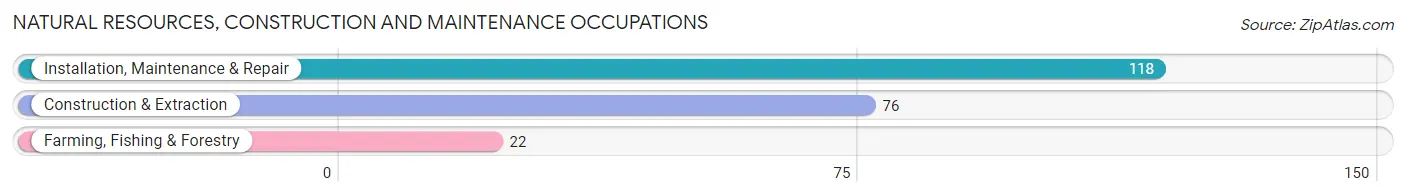
Natural Resources, Construction and Maintenance Occupations
The most common Natural Resources, Construction and Maintenance occupations in West Frankfort are Installation, Maintenance & Repair (118 | 4.5%), Construction & Extraction (76 | 2.9%), and Farming, Fishing & Forestry (22 | 0.8%).
Natural Resources, Construction and Maintenance Occupations by Sex
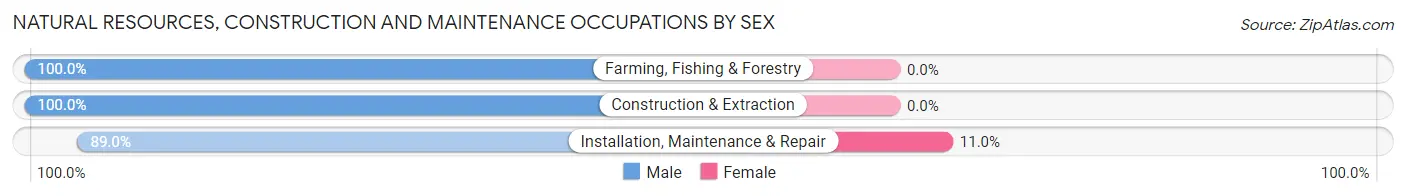
| Occupation | Male | Female |
| Farming, Fishing & Forestry | 22 (100.0%) | 0 (0.0%) |
| Construction & Extraction | 76 (100.0%) | 0 (0.0%) |
| Installation, Maintenance & Repair | 105 (89.0%) | 13 (11.0%) |
| Total (Category) | 203 (94.0%) | 13 (6.0%) |
| Total (Overall) | 1,406 (53.8%) | 1,207 (46.2%) |
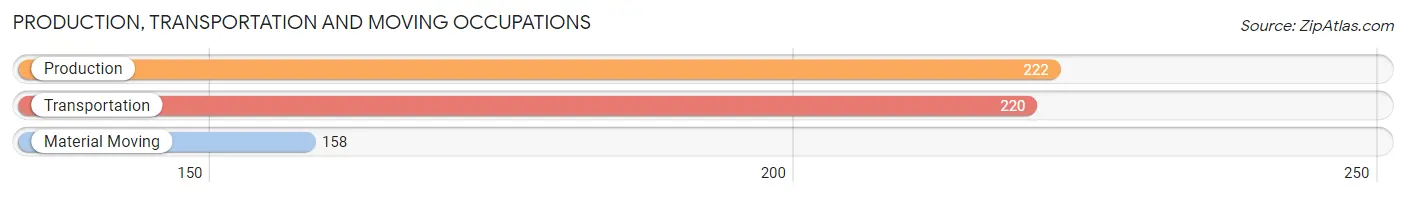
Production, Transportation and Moving Occupations
The most common Production, Transportation and Moving occupations in West Frankfort are Production (222 | 8.5%), Transportation (220 | 8.4%), and Material Moving (158 | 6.0%).
Production, Transportation and Moving Occupations by Sex
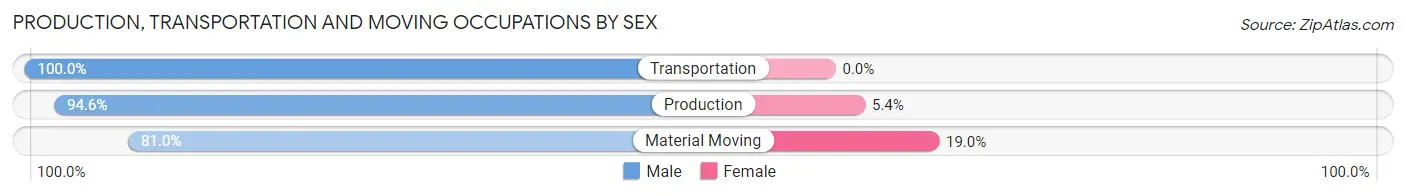
| Occupation | Male | Female |
| Production | 210 (94.6%) | 12 (5.4%) |
| Transportation | 220 (100.0%) | 0 (0.0%) |
| Material Moving | 128 (81.0%) | 30 (19.0%) |
| Total (Category) | 558 (93.0%) | 42 (7.0%) |
| Total (Overall) | 1,406 (53.8%) | 1,207 (46.2%) |
Employment Industries by Sex in West Frankfort
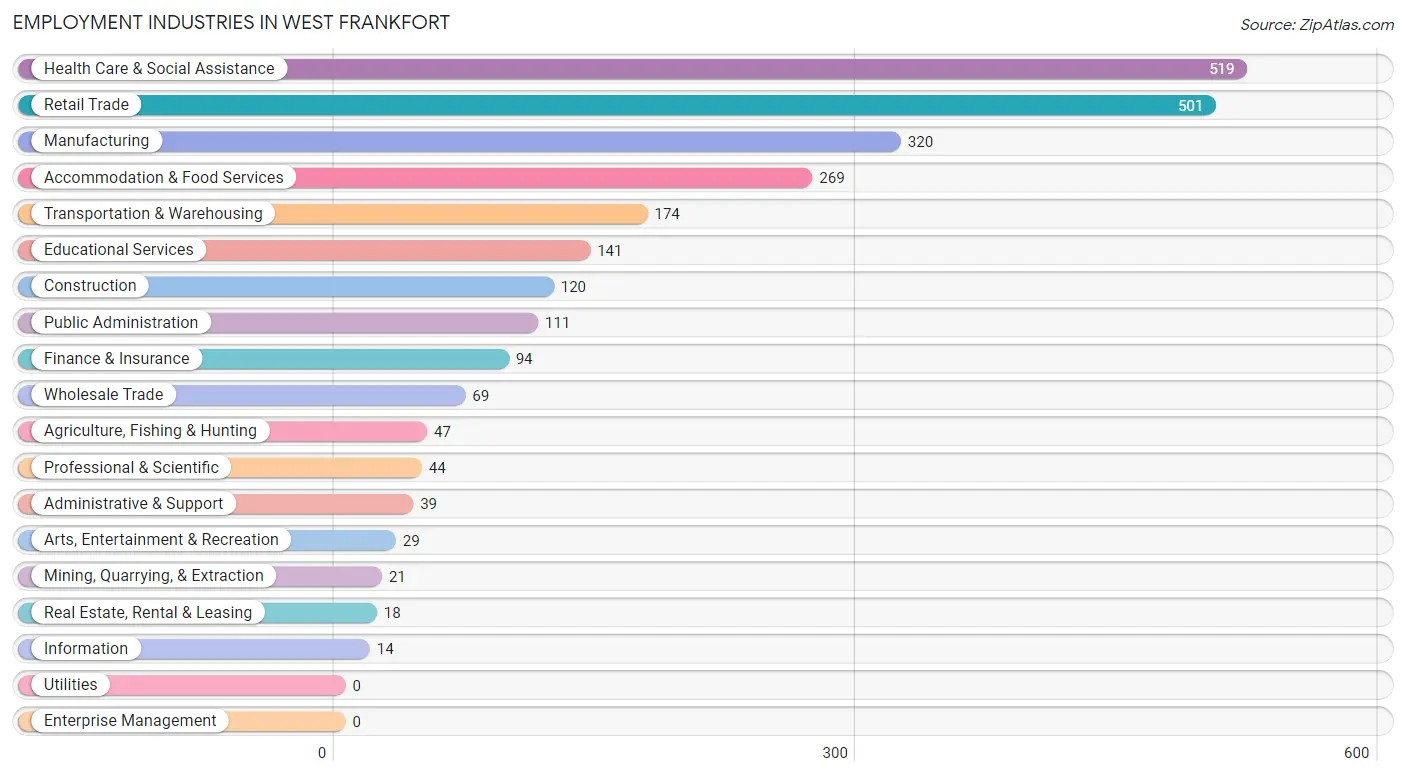
Employment Industries in West Frankfort
The major employment industries in West Frankfort include Health Care & Social Assistance (519 | 19.9%), Retail Trade (501 | 19.2%), Manufacturing (320 | 12.2%), Accommodation & Food Services (269 | 10.3%), and Transportation & Warehousing (174 | 6.7%).
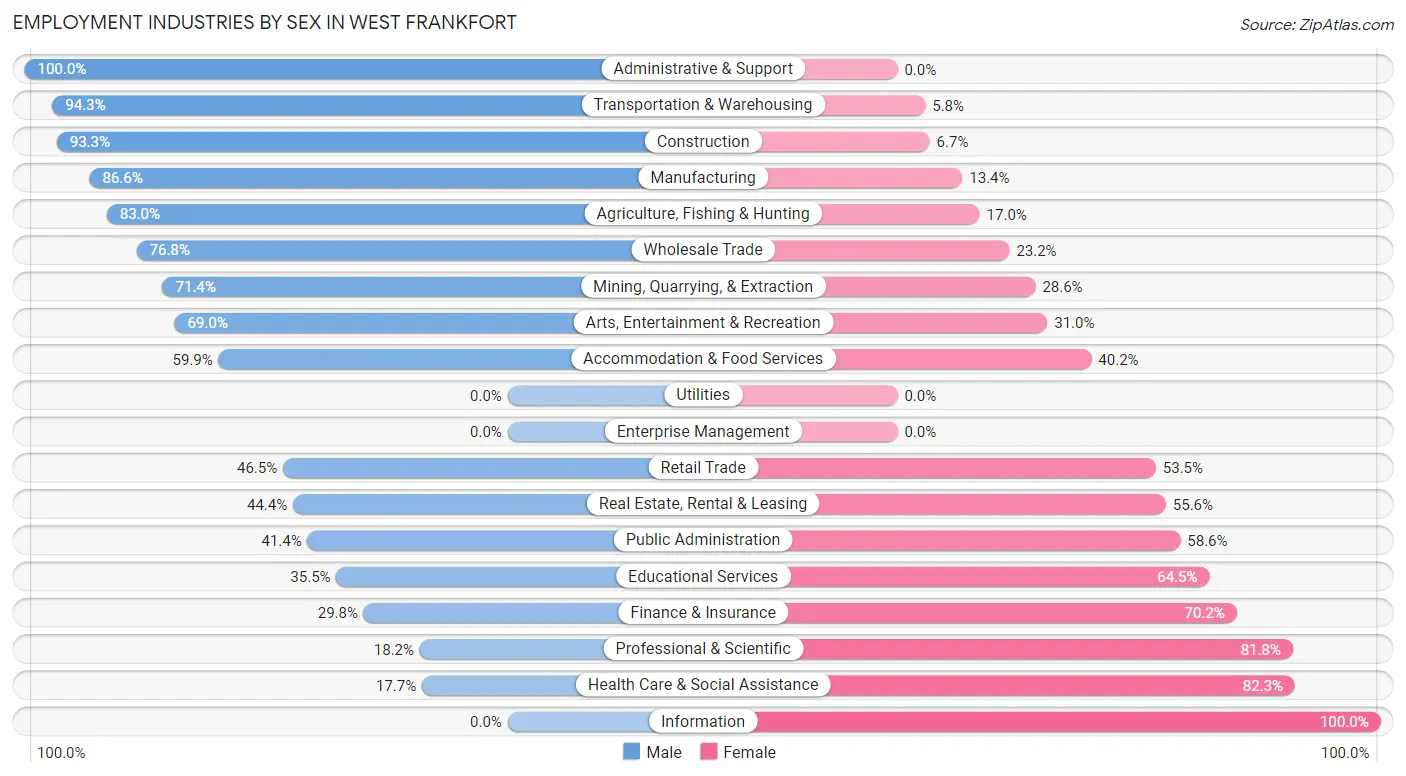
Employment Industries by Sex in West Frankfort
The West Frankfort industries that see more men than women are Administrative & Support (100.0%), Transportation & Warehousing (94.3%), and Construction (93.3%), whereas the industries that tend to have a higher number of women are Information (100.0%), Health Care & Social Assistance (82.3%), and Professional & Scientific (81.8%).
| Industry | Male | Female |
| Agriculture, Fishing & Hunting | 39 (83.0%) | 8 (17.0%) |
| Mining, Quarrying, & Extraction | 15 (71.4%) | 6 (28.6%) |
| Construction | 112 (93.3%) | 8 (6.7%) |
| Manufacturing | 277 (86.6%) | 43 (13.4%) |
| Wholesale Trade | 53 (76.8%) | 16 (23.2%) |
| Retail Trade | 233 (46.5%) | 268 (53.5%) |
| Transportation & Warehousing | 164 (94.3%) | 10 (5.8%) |
| Utilities | 0 (0.0%) | 0 (0.0%) |
| Information | 0 (0.0%) | 14 (100.0%) |
| Finance & Insurance | 28 (29.8%) | 66 (70.2%) |
| Real Estate, Rental & Leasing | 8 (44.4%) | 10 (55.6%) |
| Professional & Scientific | 8 (18.2%) | 36 (81.8%) |
| Enterprise Management | 0 (0.0%) | 0 (0.0%) |
| Administrative & Support | 39 (100.0%) | 0 (0.0%) |
| Educational Services | 50 (35.5%) | 91 (64.5%) |
| Health Care & Social Assistance | 92 (17.7%) | 427 (82.3%) |
| Arts, Entertainment & Recreation | 20 (69.0%) | 9 (31.0%) |
| Accommodation & Food Services | 161 (59.9%) | 108 (40.2%) |
| Public Administration | 46 (41.4%) | 65 (58.6%) |
| Total | 1,406 (53.8%) | 1,207 (46.2%) |
Education in West Frankfort
School Enrollment in West Frankfort
The most common levels of schooling among the 1,751 students in West Frankfort are middle school (484 | 27.6%), high school (478 | 27.3%), and elementary school (359 | 20.5%).
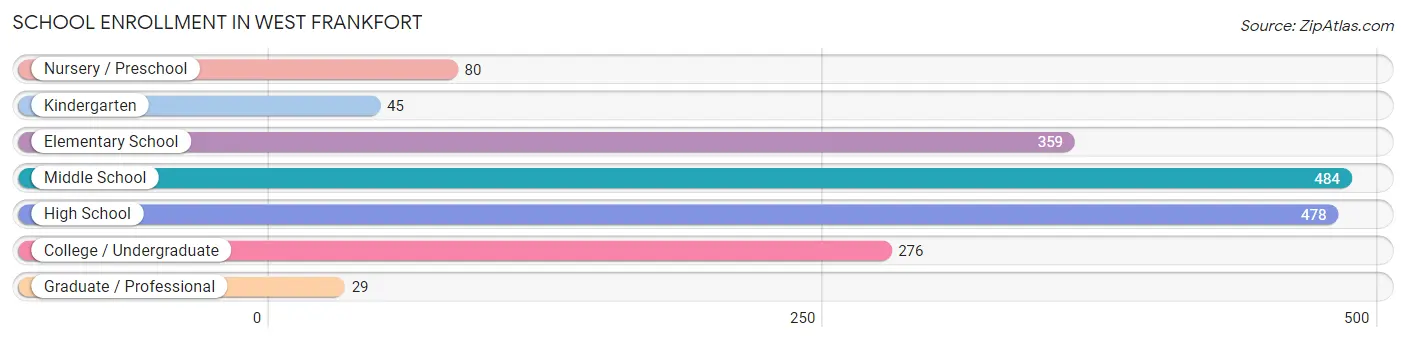
| School Level | # Students | % Students |
| Nursery / Preschool | 80 | 4.6% |
| Kindergarten | 45 | 2.6% |
| Elementary School | 359 | 20.5% |
| Middle School | 484 | 27.6% |
| High School | 478 | 27.3% |
| College / Undergraduate | 276 | 15.8% |
| Graduate / Professional | 29 | 1.7% |
| Total | 1,751 | 100.0% |
School Enrollment by Age by Funding Source in West Frankfort
Out of a total of 1,751 students who are enrolled in schools in West Frankfort, 263 (15.0%) attend a private institution, while the remaining 1,488 (85.0%) are enrolled in public schools. The age group of 18 to 19 year olds has the highest likelihood of being enrolled in private schools, with 18 (38.3% in the age bracket) enrolled. Conversely, the age group of 3 to 4 year olds has the lowest likelihood of being enrolled in a private school, with 36 (100.0% in the age bracket) attending a public institution.
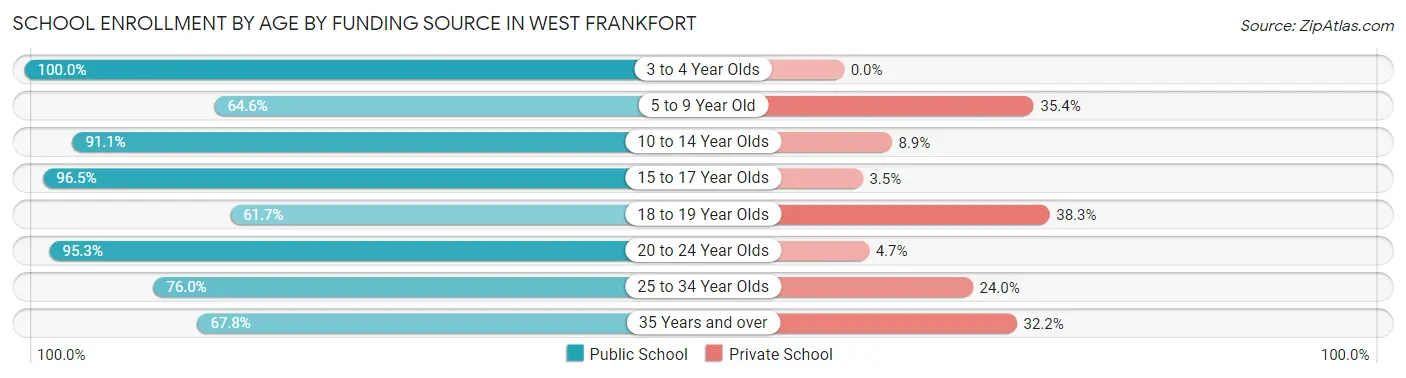
| Age Bracket | Public School | Private School |
| 3 to 4 Year Olds | 36 (100.0%) | 0 (0.0%) |
| 5 to 9 Year Old | 243 (64.6%) | 133 (35.4%) |
| 10 to 14 Year Olds | 541 (91.1%) | 53 (8.9%) |
| 15 to 17 Year Olds | 358 (96.5%) | 13 (3.5%) |
| 18 to 19 Year Olds | 29 (61.7%) | 18 (38.3%) |
| 20 to 24 Year Olds | 184 (95.3%) | 9 (4.7%) |
| 25 to 34 Year Olds | 57 (76.0%) | 18 (24.0%) |
| 35 Years and over | 40 (67.8%) | 19 (32.2%) |
| Total | 1,488 (85.0%) | 263 (15.0%) |
Educational Attainment by Field of Study in West Frankfort
Science & technology (121 | 22.2%), education (94 | 17.2%), business (90 | 16.5%), arts & humanities (79 | 14.5%), and computers & mathematics (37 | 6.8%) are the most common fields of study among 545 individuals in West Frankfort who have obtained a bachelor's degree or higher.
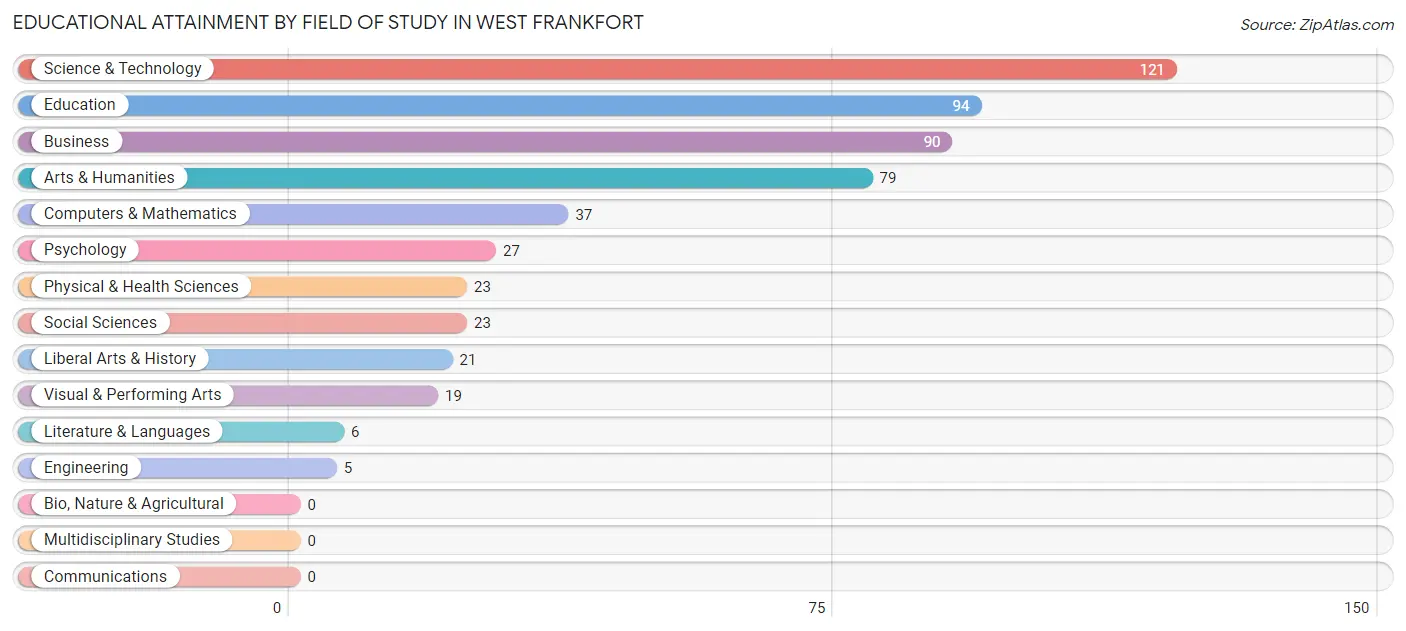
| Field of Study | # Graduates | % Graduates |
| Computers & Mathematics | 37 | 6.8% |
| Bio, Nature & Agricultural | 0 | 0.0% |
| Physical & Health Sciences | 23 | 4.2% |
| Psychology | 27 | 5.0% |
| Social Sciences | 23 | 4.2% |
| Engineering | 5 | 0.9% |
| Multidisciplinary Studies | 0 | 0.0% |
| Science & Technology | 121 | 22.2% |
| Business | 90 | 16.5% |
| Education | 94 | 17.2% |
| Literature & Languages | 6 | 1.1% |
| Liberal Arts & History | 21 | 3.8% |
| Visual & Performing Arts | 19 | 3.5% |
| Communications | 0 | 0.0% |
| Arts & Humanities | 79 | 14.5% |
| Total | 545 | 100.0% |
Transportation & Commute in West Frankfort
Vehicle Availability by Sex in West Frankfort
The most prevalent vehicle ownership categories in West Frankfort are males with 1 vehicle (521, accounting for 37.6%) and females with 1 vehicle (381, making up 45.0%).
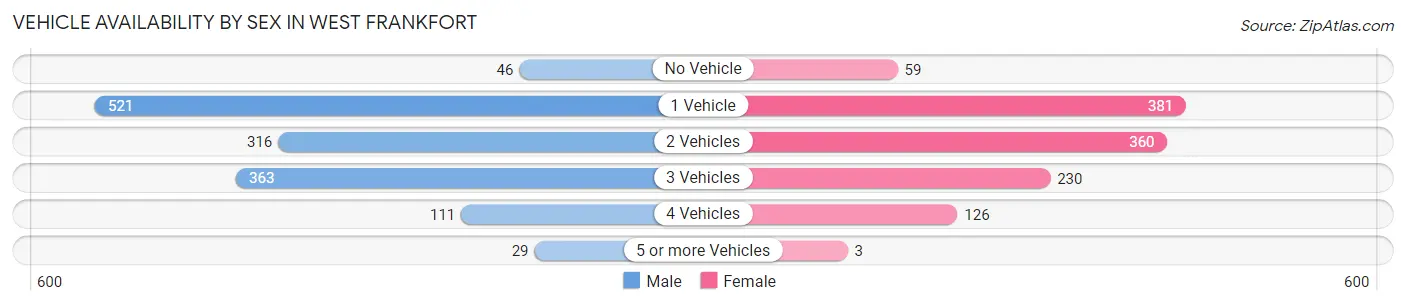
| Vehicles Available | Male | Female |
| No Vehicle | 46 (3.3%) | 59 (5.1%) |
| 1 Vehicle | 521 (37.6%) | 381 (32.9%) |
| 2 Vehicles | 316 (22.8%) | 360 (31.1%) |
| 3 Vehicles | 363 (26.2%) | 230 (19.8%) |
| 4 Vehicles | 111 (8.0%) | 126 (10.9%) |
| 5 or more Vehicles | 29 (2.1%) | 3 (0.3%) |
| Total | 1,386 (100.0%) | 1,159 (100.0%) |
Commute Time in West Frankfort
The most frequently occuring commute durations in West Frankfort are 20 to 24 minutes (377 commuters, 15.5%), 10 to 14 minutes (344 commuters, 14.1%), and 15 to 19 minutes (331 commuters, 13.6%).
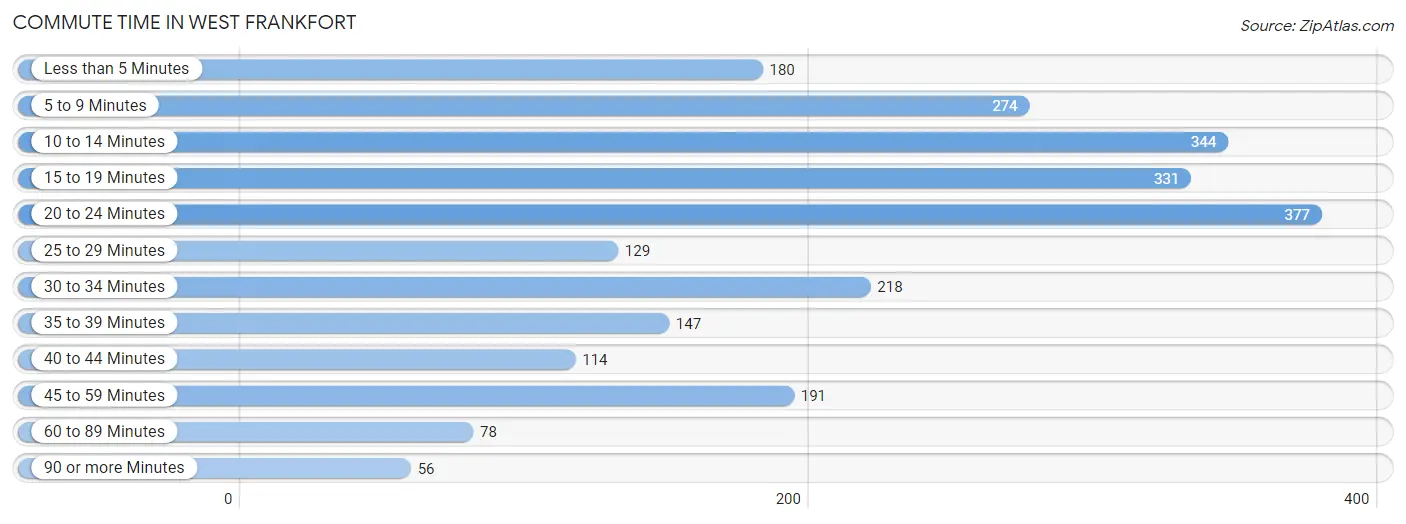
| Commute Time | # Commuters | % Commuters |
| Less than 5 Minutes | 180 | 7.4% |
| 5 to 9 Minutes | 274 | 11.2% |
| 10 to 14 Minutes | 344 | 14.1% |
| 15 to 19 Minutes | 331 | 13.6% |
| 20 to 24 Minutes | 377 | 15.5% |
| 25 to 29 Minutes | 129 | 5.3% |
| 30 to 34 Minutes | 218 | 8.9% |
| 35 to 39 Minutes | 147 | 6.0% |
| 40 to 44 Minutes | 114 | 4.7% |
| 45 to 59 Minutes | 191 | 7.8% |
| 60 to 89 Minutes | 78 | 3.2% |
| 90 or more Minutes | 56 | 2.3% |
Commute Time by Sex in West Frankfort
The most common commute times in West Frankfort are 15 to 19 minutes (215 commuters, 16.1%) for males and 20 to 24 minutes (203 commuters, 18.4%) for females.
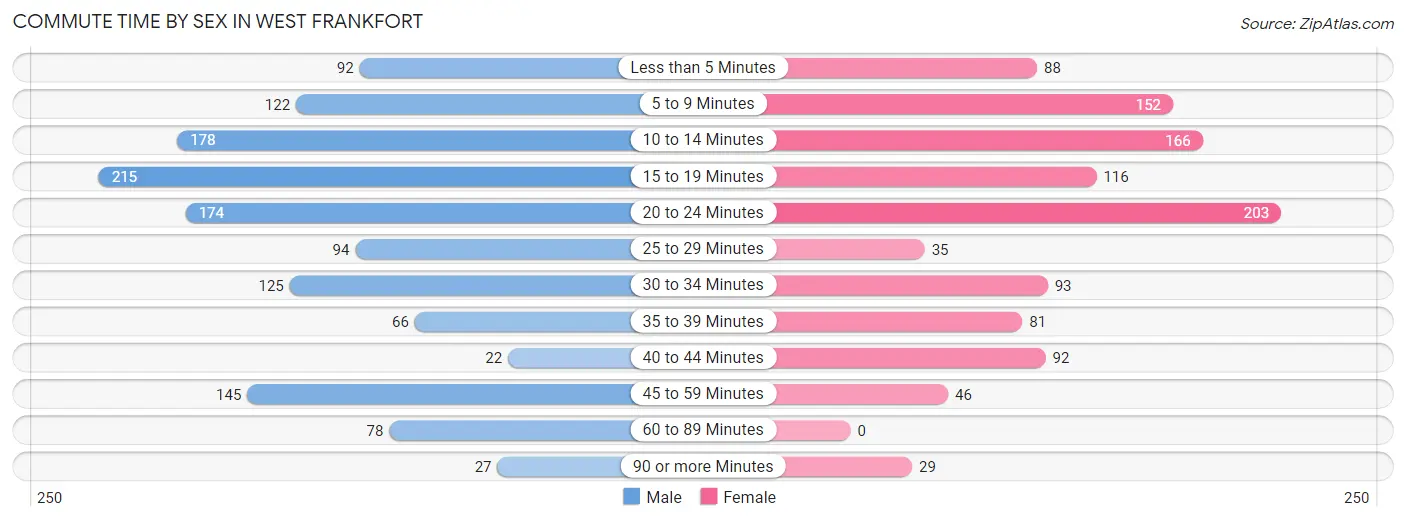
| Commute Time | Male | Female |
| Less than 5 Minutes | 92 (6.9%) | 88 (8.0%) |
| 5 to 9 Minutes | 122 (9.1%) | 152 (13.8%) |
| 10 to 14 Minutes | 178 (13.3%) | 166 (15.1%) |
| 15 to 19 Minutes | 215 (16.1%) | 116 (10.5%) |
| 20 to 24 Minutes | 174 (13.0%) | 203 (18.4%) |
| 25 to 29 Minutes | 94 (7.0%) | 35 (3.2%) |
| 30 to 34 Minutes | 125 (9.3%) | 93 (8.5%) |
| 35 to 39 Minutes | 66 (4.9%) | 81 (7.4%) |
| 40 to 44 Minutes | 22 (1.6%) | 92 (8.4%) |
| 45 to 59 Minutes | 145 (10.8%) | 46 (4.2%) |
| 60 to 89 Minutes | 78 (5.8%) | 0 (0.0%) |
| 90 or more Minutes | 27 (2.0%) | 29 (2.6%) |
Time of Departure to Work by Sex in West Frankfort
The most frequent times of departure to work in West Frankfort are 12:00 PM to 3:59 PM (209, 15.6%) for males and 7:30 AM to 7:59 AM (254, 23.1%) for females.
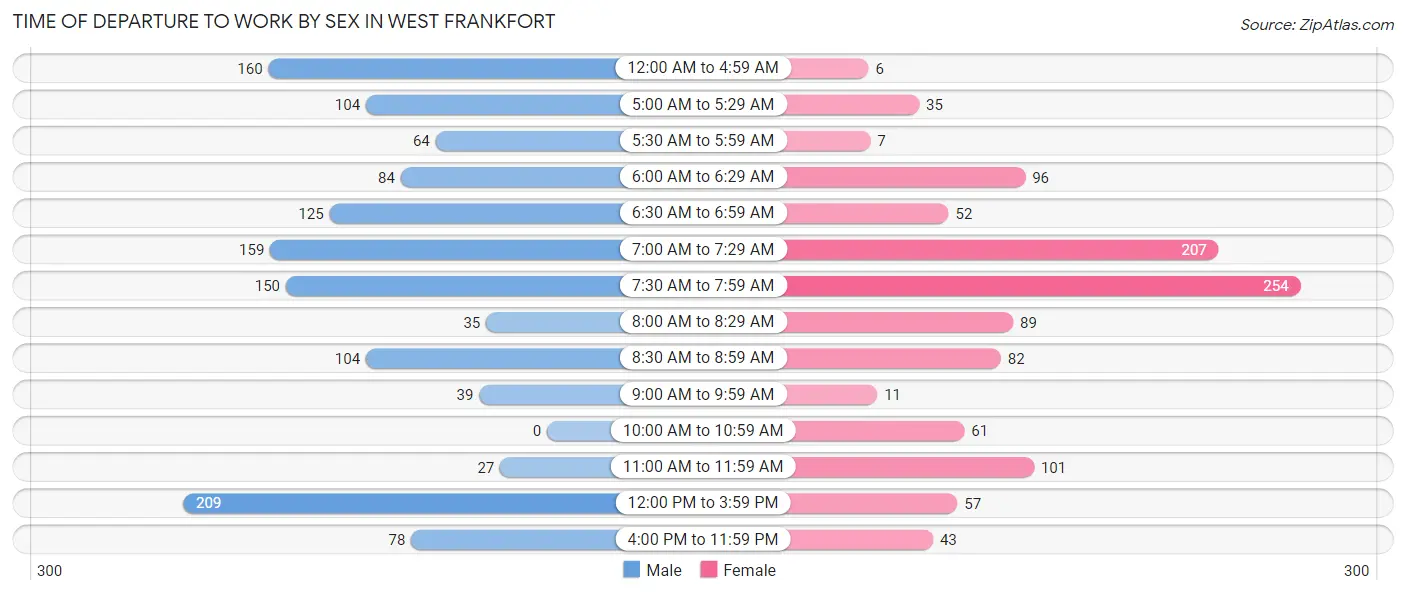
| Time of Departure | Male | Female |
| 12:00 AM to 4:59 AM | 160 (12.0%) | 6 (0.5%) |
| 5:00 AM to 5:29 AM | 104 (7.8%) | 35 (3.2%) |
| 5:30 AM to 5:59 AM | 64 (4.8%) | 7 (0.6%) |
| 6:00 AM to 6:29 AM | 84 (6.3%) | 96 (8.7%) |
| 6:30 AM to 6:59 AM | 125 (9.3%) | 52 (4.7%) |
| 7:00 AM to 7:29 AM | 159 (11.9%) | 207 (18.8%) |
| 7:30 AM to 7:59 AM | 150 (11.2%) | 254 (23.1%) |
| 8:00 AM to 8:29 AM | 35 (2.6%) | 89 (8.1%) |
| 8:30 AM to 8:59 AM | 104 (7.8%) | 82 (7.4%) |
| 9:00 AM to 9:59 AM | 39 (2.9%) | 11 (1.0%) |
| 10:00 AM to 10:59 AM | 0 (0.0%) | 61 (5.5%) |
| 11:00 AM to 11:59 AM | 27 (2.0%) | 101 (9.2%) |
| 12:00 PM to 3:59 PM | 209 (15.6%) | 57 (5.2%) |
| 4:00 PM to 11:59 PM | 78 (5.8%) | 43 (3.9%) |
| Total | 1,338 (100.0%) | 1,101 (100.0%) |
Housing Occupancy in West Frankfort
Occupancy by Ownership in West Frankfort
Of the total 2,994 dwellings in West Frankfort, owner-occupied units account for 1,916 (64.0%), while renter-occupied units make up 1,078 (36.0%).
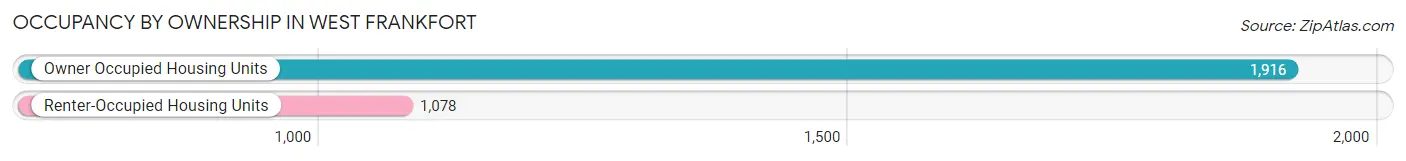
| Occupancy | # Housing Units | % Housing Units |
| Owner Occupied Housing Units | 1,916 | 64.0% |
| Renter-Occupied Housing Units | 1,078 | 36.0% |
| Total Occupied Housing Units | 2,994 | 100.0% |
Occupancy by Household Size in West Frankfort
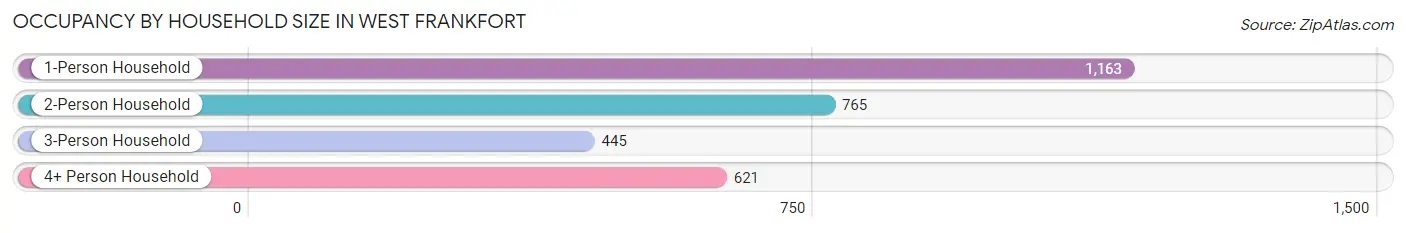
| Household Size | # Housing Units | % Housing Units |
| 1-Person Household | 1,163 | 38.8% |
| 2-Person Household | 765 | 25.6% |
| 3-Person Household | 445 | 14.9% |
| 4+ Person Household | 621 | 20.7% |
| Total Housing Units | 2,994 | 100.0% |
Occupancy by Ownership by Household Size in West Frankfort
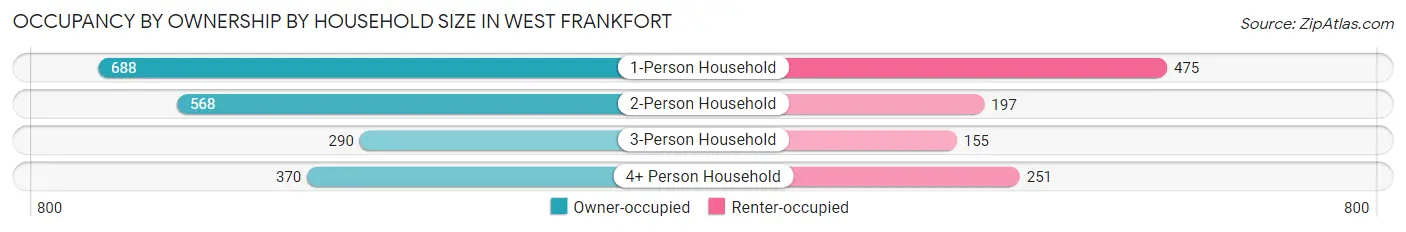
| Household Size | Owner-occupied | Renter-occupied |
| 1-Person Household | 688 (59.2%) | 475 (40.8%) |
| 2-Person Household | 568 (74.3%) | 197 (25.8%) |
| 3-Person Household | 290 (65.2%) | 155 (34.8%) |
| 4+ Person Household | 370 (59.6%) | 251 (40.4%) |
| Total Housing Units | 1,916 (64.0%) | 1,078 (36.0%) |
Occupancy by Educational Attainment in West Frankfort
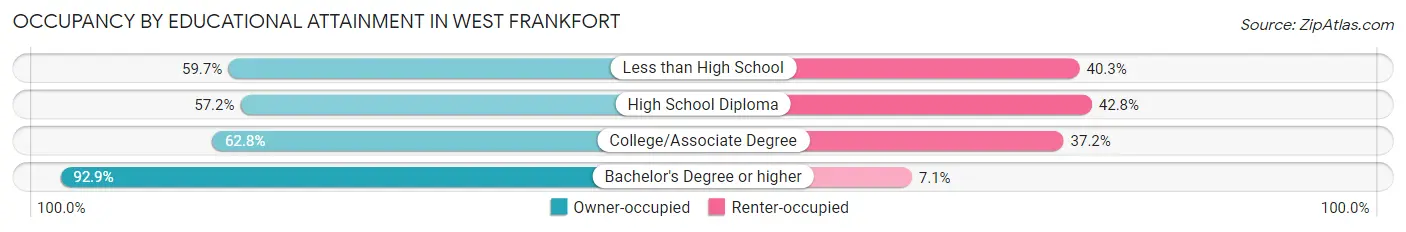
| Household Size | Owner-occupied | Renter-occupied |
| Less than High School | 219 (59.7%) | 148 (40.3%) |
| High School Diploma | 613 (57.2%) | 458 (42.8%) |
| College/Associate Degree | 756 (62.8%) | 447 (37.2%) |
| Bachelor's Degree or higher | 328 (92.9%) | 25 (7.1%) |
Occupancy by Age of Householder in West Frankfort
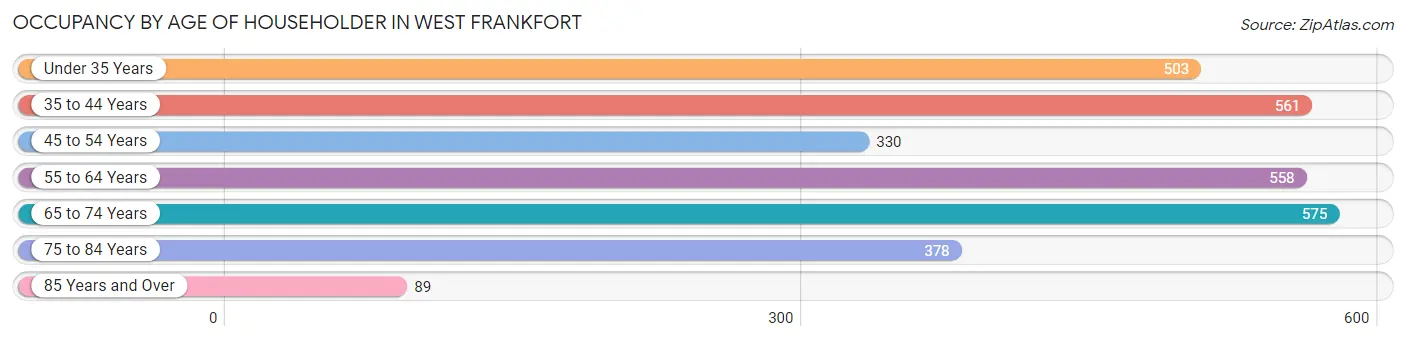
| Age Bracket | # Households | % Households |
| Under 35 Years | 503 | 16.8% |
| 35 to 44 Years | 561 | 18.7% |
| 45 to 54 Years | 330 | 11.0% |
| 55 to 64 Years | 558 | 18.6% |
| 65 to 74 Years | 575 | 19.2% |
| 75 to 84 Years | 378 | 12.6% |
| 85 Years and Over | 89 | 3.0% |
| Total | 2,994 | 100.0% |
Housing Finances in West Frankfort
Median Income by Occupancy in West Frankfort
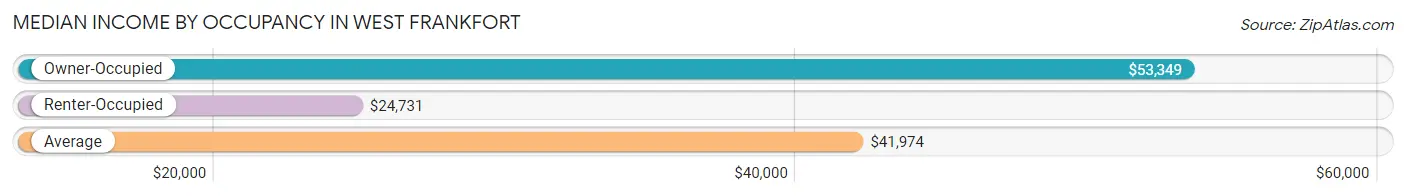
| Occupancy Type | # Households | Median Income |
| Owner-Occupied | 1,916 (64.0%) | $53,349 |
| Renter-Occupied | 1,078 (36.0%) | $24,731 |
| Average | 2,994 (100.0%) | $41,974 |
Occupancy by Householder Income Bracket in West Frankfort
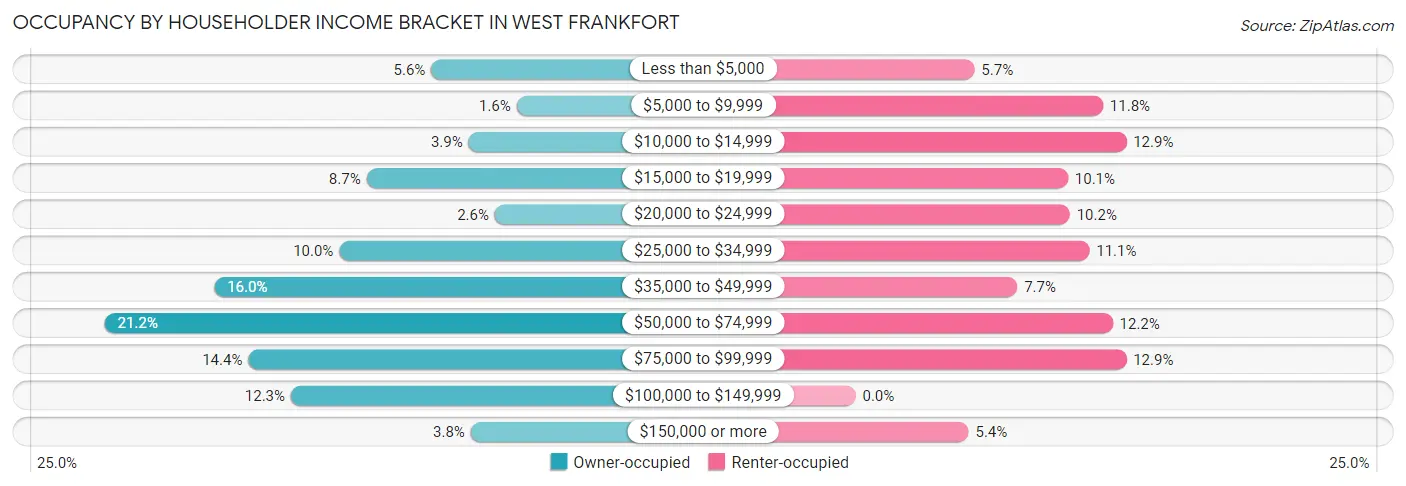
| Income Bracket | Owner-occupied | Renter-occupied |
| Less than $5,000 | 108 (5.6%) | 61 (5.7%) |
| $5,000 to $9,999 | 30 (1.6%) | 127 (11.8%) |
| $10,000 to $14,999 | 74 (3.9%) | 139 (12.9%) |
| $15,000 to $19,999 | 167 (8.7%) | 109 (10.1%) |
| $20,000 to $24,999 | 50 (2.6%) | 110 (10.2%) |
| $25,000 to $34,999 | 192 (10.0%) | 120 (11.1%) |
| $35,000 to $49,999 | 306 (16.0%) | 83 (7.7%) |
| $50,000 to $74,999 | 406 (21.2%) | 132 (12.2%) |
| $75,000 to $99,999 | 275 (14.3%) | 139 (12.9%) |
| $100,000 to $149,999 | 236 (12.3%) | 0 (0.0%) |
| $150,000 or more | 72 (3.8%) | 58 (5.4%) |
| Total | 1,916 (100.0%) | 1,078 (100.0%) |
Monthly Housing Cost Tiers in West Frankfort
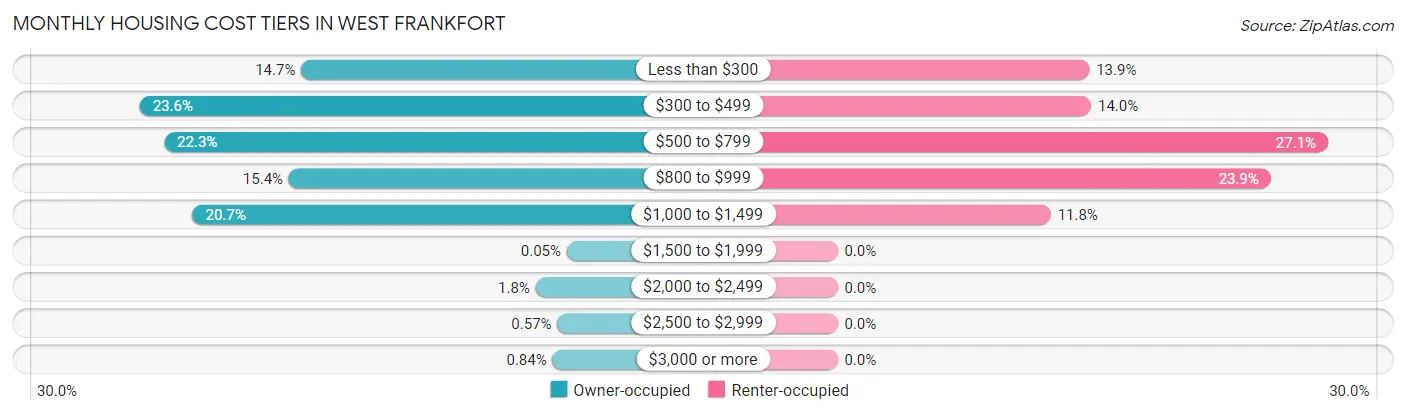
| Monthly Cost | Owner-occupied | Renter-occupied |
| Less than $300 | 282 (14.7%) | 150 (13.9%) |
| $300 to $499 | 453 (23.6%) | 151 (14.0%) |
| $500 to $799 | 427 (22.3%) | 292 (27.1%) |
| $800 to $999 | 295 (15.4%) | 258 (23.9%) |
| $1,000 to $1,499 | 397 (20.7%) | 127 (11.8%) |
| $1,500 to $1,999 | 1 (0.1%) | 0 (0.0%) |
| $2,000 to $2,499 | 34 (1.8%) | 0 (0.0%) |
| $2,500 to $2,999 | 11 (0.6%) | 0 (0.0%) |
| $3,000 or more | 16 (0.8%) | 0 (0.0%) |
| Total | 1,916 (100.0%) | 1,078 (100.0%) |
Physical Housing Characteristics in West Frankfort
Housing Structures in West Frankfort
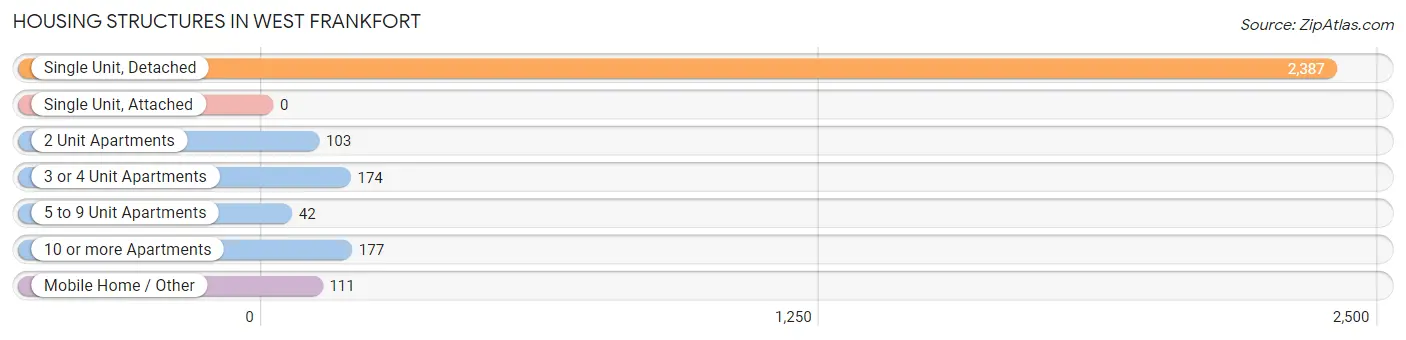
| Structure Type | # Housing Units | % Housing Units |
| Single Unit, Detached | 2,387 | 79.7% |
| Single Unit, Attached | 0 | 0.0% |
| 2 Unit Apartments | 103 | 3.4% |
| 3 or 4 Unit Apartments | 174 | 5.8% |
| 5 to 9 Unit Apartments | 42 | 1.4% |
| 10 or more Apartments | 177 | 5.9% |
| Mobile Home / Other | 111 | 3.7% |
| Total | 2,994 | 100.0% |
Housing Structures by Occupancy in West Frankfort
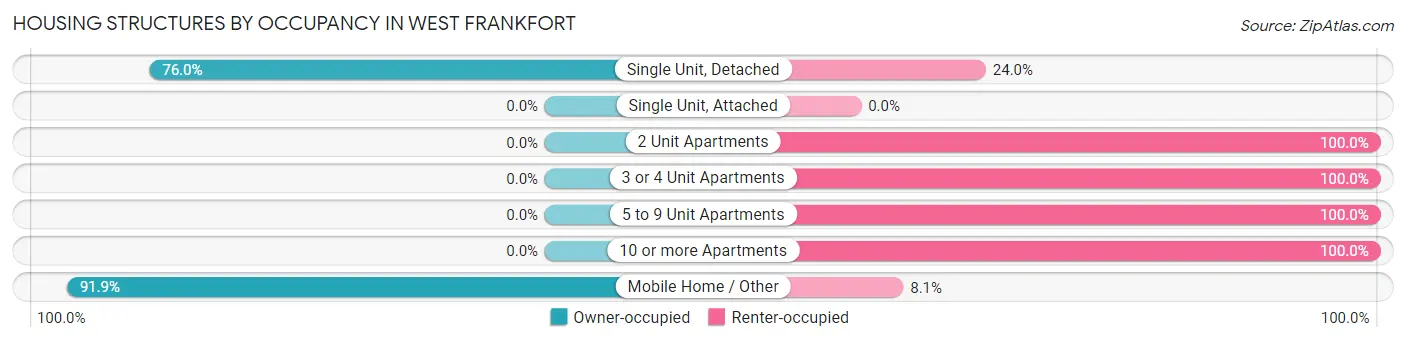
| Structure Type | Owner-occupied | Renter-occupied |
| Single Unit, Detached | 1,814 (76.0%) | 573 (24.0%) |
| Single Unit, Attached | 0 (0.0%) | 0 (0.0%) |
| 2 Unit Apartments | 0 (0.0%) | 103 (100.0%) |
| 3 or 4 Unit Apartments | 0 (0.0%) | 174 (100.0%) |
| 5 to 9 Unit Apartments | 0 (0.0%) | 42 (100.0%) |
| 10 or more Apartments | 0 (0.0%) | 177 (100.0%) |
| Mobile Home / Other | 102 (91.9%) | 9 (8.1%) |
| Total | 1,916 (64.0%) | 1,078 (36.0%) |
Housing Structures by Number of Rooms in West Frankfort
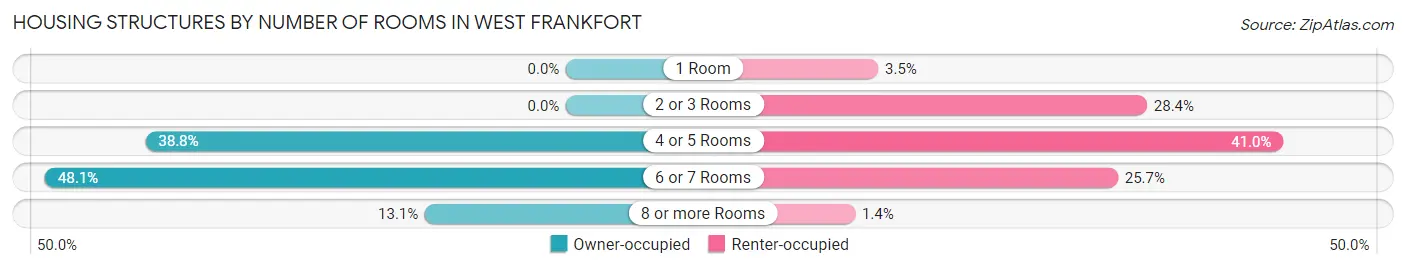
| Number of Rooms | Owner-occupied | Renter-occupied |
| 1 Room | 0 (0.0%) | 38 (3.5%) |
| 2 or 3 Rooms | 0 (0.0%) | 306 (28.4%) |
| 4 or 5 Rooms | 744 (38.8%) | 442 (41.0%) |
| 6 or 7 Rooms | 922 (48.1%) | 277 (25.7%) |
| 8 or more Rooms | 250 (13.1%) | 15 (1.4%) |
| Total | 1,916 (100.0%) | 1,078 (100.0%) |
Housing Structure by Heating Type in West Frankfort
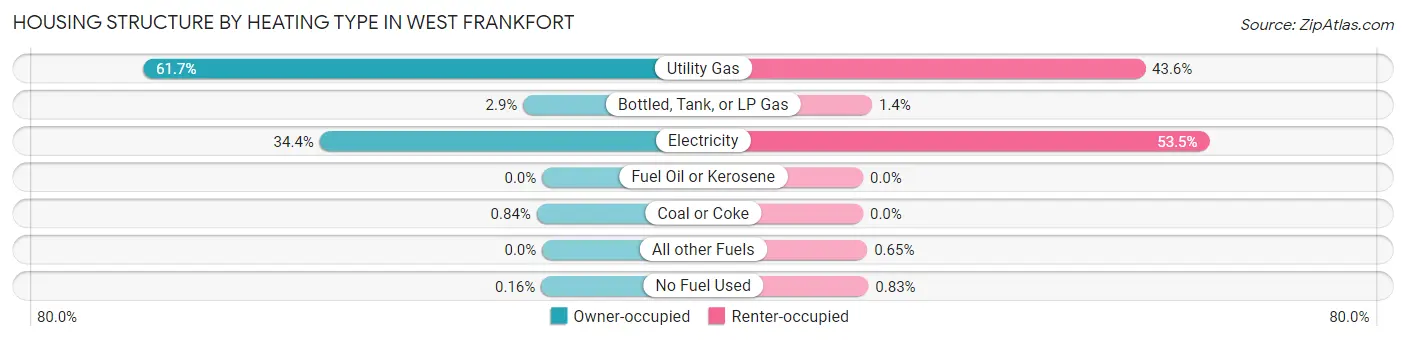
| Heating Type | Owner-occupied | Renter-occupied |
| Utility Gas | 1,182 (61.7%) | 470 (43.6%) |
| Bottled, Tank, or LP Gas | 56 (2.9%) | 15 (1.4%) |
| Electricity | 659 (34.4%) | 577 (53.5%) |
| Fuel Oil or Kerosene | 0 (0.0%) | 0 (0.0%) |
| Coal or Coke | 16 (0.8%) | 0 (0.0%) |
| All other Fuels | 0 (0.0%) | 7 (0.6%) |
| No Fuel Used | 3 (0.2%) | 9 (0.8%) |
| Total | 1,916 (100.0%) | 1,078 (100.0%) |
Household Vehicle Usage in West Frankfort
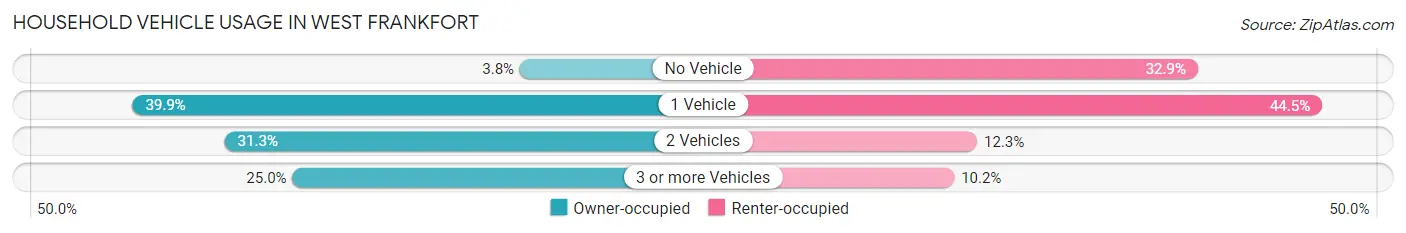
| Vehicles per Household | Owner-occupied | Renter-occupied |
| No Vehicle | 72 (3.8%) | 355 (32.9%) |
| 1 Vehicle | 765 (39.9%) | 480 (44.5%) |
| 2 Vehicles | 600 (31.3%) | 133 (12.3%) |
| 3 or more Vehicles | 479 (25.0%) | 110 (10.2%) |
| Total | 1,916 (100.0%) | 1,078 (100.0%) |
Real Estate & Mortgages in West Frankfort
Real Estate and Mortgage Overview in West Frankfort
| Characteristic | Without Mortgage | With Mortgage |
| Housing Units | 1,069 | 847 |
| Median Property Value | $58,400 | $79,900 |
| Median Household Income | $53,231 | $40 |
| Monthly Housing Costs | $386 | $0 |
| Real Estate Taxes | $1,086 | $55 |
Property Value by Mortgage Status in West Frankfort
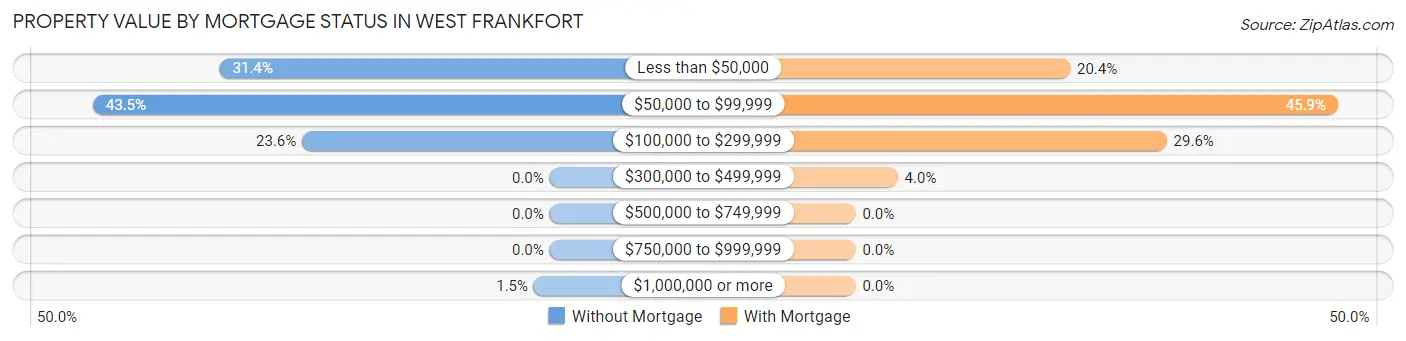
| Property Value | Without Mortgage | With Mortgage |
| Less than $50,000 | 336 (31.4%) | 173 (20.4%) |
| $50,000 to $99,999 | 465 (43.5%) | 389 (45.9%) |
| $100,000 to $299,999 | 252 (23.6%) | 251 (29.6%) |
| $300,000 to $499,999 | 0 (0.0%) | 34 (4.0%) |
| $500,000 to $749,999 | 0 (0.0%) | 0 (0.0%) |
| $750,000 to $999,999 | 0 (0.0%) | 0 (0.0%) |
| $1,000,000 or more | 16 (1.5%) | 0 (0.0%) |
| Total | 1,069 (100.0%) | 847 (100.0%) |
Household Income by Mortgage Status in West Frankfort
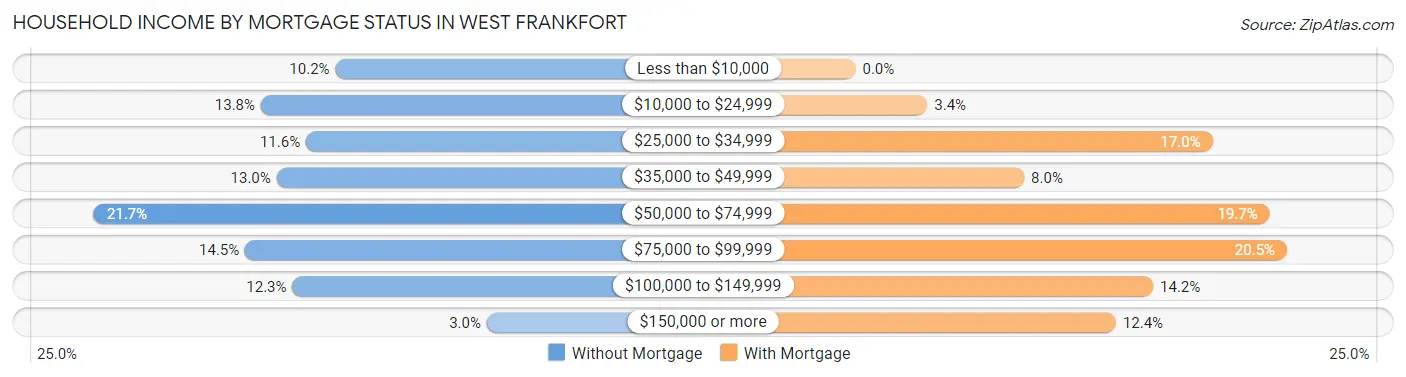
| Household Income | Without Mortgage | With Mortgage |
| Less than $10,000 | 109 (10.2%) | 0 (0.0%) |
| $10,000 to $24,999 | 147 (13.8%) | 29 (3.4%) |
| $25,000 to $34,999 | 124 (11.6%) | 144 (17.0%) |
| $35,000 to $49,999 | 139 (13.0%) | 68 (8.0%) |
| $50,000 to $74,999 | 232 (21.7%) | 167 (19.7%) |
| $75,000 to $99,999 | 155 (14.5%) | 174 (20.5%) |
| $100,000 to $149,999 | 131 (12.2%) | 120 (14.2%) |
| $150,000 or more | 32 (3.0%) | 105 (12.4%) |
| Total | 1,069 (100.0%) | 847 (100.0%) |
Property Value to Household Income Ratio in West Frankfort
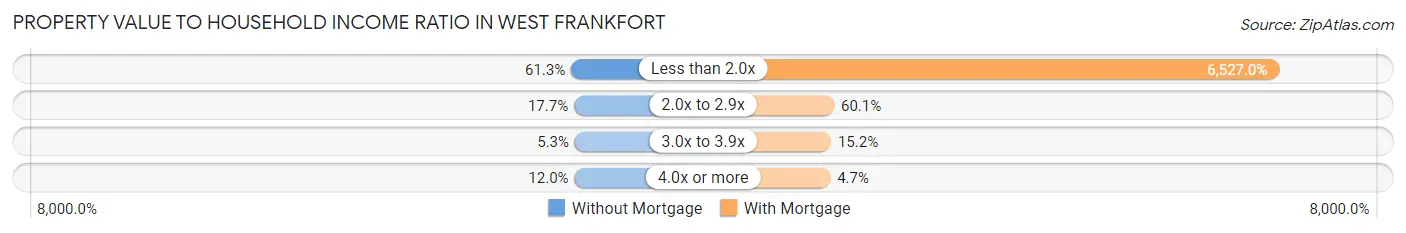
| Value-to-Income Ratio | Without Mortgage | With Mortgage |
| Less than 2.0x | 655 (61.3%) | 55,284 (6,527.0%) |
| 2.0x to 2.9x | 189 (17.7%) | 509 (60.1%) |
| 3.0x to 3.9x | 57 (5.3%) | 129 (15.2%) |
| 4.0x or more | 128 (12.0%) | 40 (4.7%) |
| Total | 1,069 (100.0%) | 847 (100.0%) |
Real Estate Taxes by Mortgage Status in West Frankfort
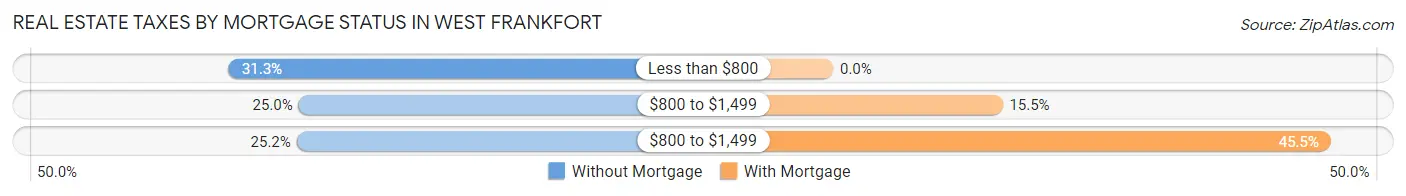
| Property Taxes | Without Mortgage | With Mortgage |
| Less than $800 | 335 (31.3%) | 0 (0.0%) |
| $800 to $1,499 | 267 (25.0%) | 131 (15.5%) |
| $800 to $1,499 | 269 (25.2%) | 385 (45.5%) |
| Total | 1,069 (100.0%) | 847 (100.0%) |
Health & Disability in West Frankfort
Health Insurance Coverage by Age in West Frankfort
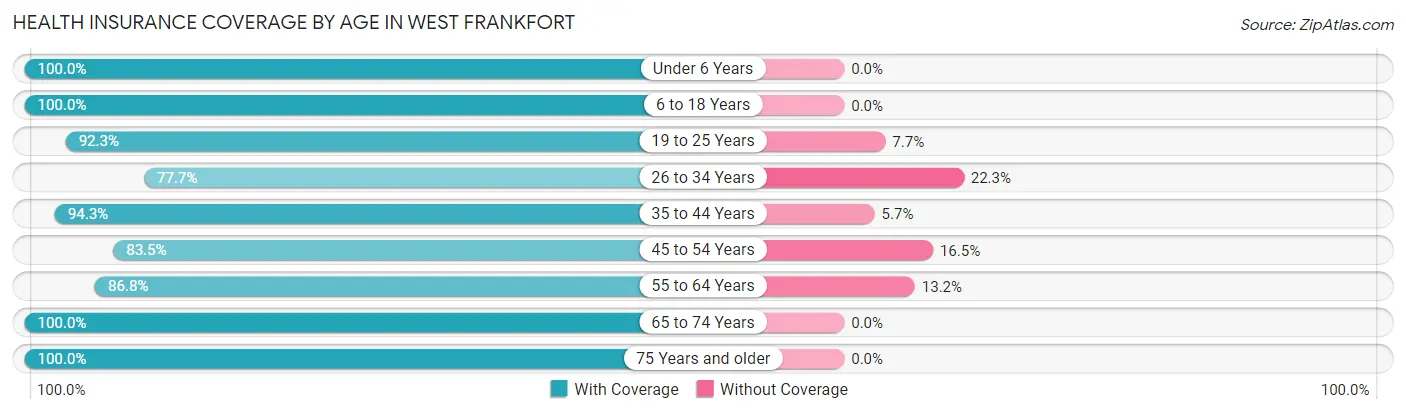
| Age Bracket | With Coverage | Without Coverage |
| Under 6 Years | 439 (100.0%) | 0 (0.0%) |
| 6 to 18 Years | 1,386 (100.0%) | 0 (0.0%) |
| 19 to 25 Years | 554 (92.3%) | 46 (7.7%) |
| 26 to 34 Years | 586 (77.7%) | 168 (22.3%) |
| 35 to 44 Years | 817 (94.3%) | 49 (5.7%) |
| 45 to 54 Years | 641 (83.5%) | 127 (16.5%) |
| 55 to 64 Years | 845 (86.8%) | 128 (13.2%) |
| 65 to 74 Years | 682 (100.0%) | 0 (0.0%) |
| 75 Years and older | 580 (100.0%) | 0 (0.0%) |
| Total | 6,530 (92.6%) | 518 (7.3%) |
Health Insurance Coverage by Citizenship Status in West Frankfort
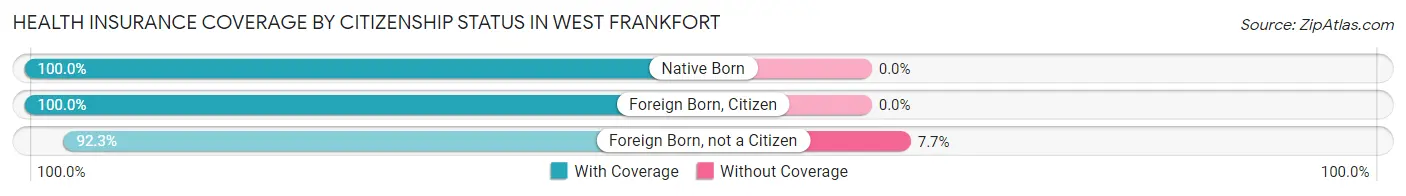
| Citizenship Status | With Coverage | Without Coverage |
| Native Born | 439 (100.0%) | 0 (0.0%) |
| Foreign Born, Citizen | 1,386 (100.0%) | 0 (0.0%) |
| Foreign Born, not a Citizen | 554 (92.3%) | 46 (7.7%) |
Health Insurance Coverage by Household Income in West Frankfort
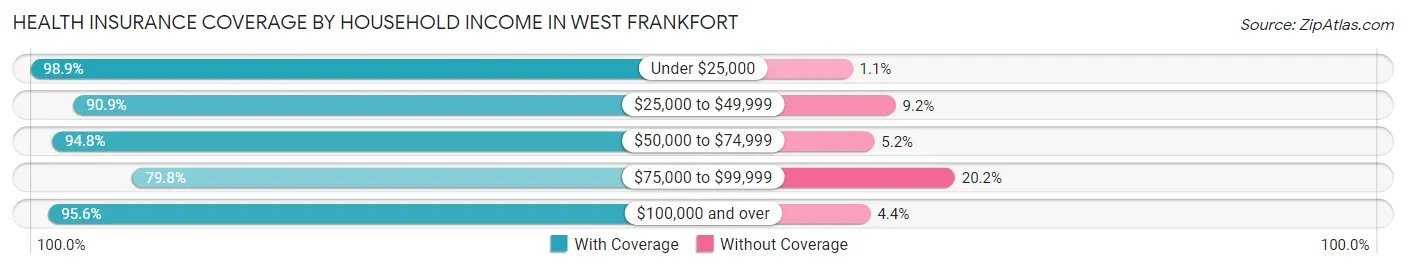
| Household Income | With Coverage | Without Coverage |
| Under $25,000 | 1,908 (98.9%) | 21 (1.1%) |
| $25,000 to $49,999 | 1,350 (90.8%) | 136 (9.1%) |
| $50,000 to $74,999 | 1,342 (94.8%) | 73 (5.2%) |
| $75,000 to $99,999 | 958 (79.8%) | 243 (20.2%) |
| $100,000 and over | 971 (95.6%) | 45 (4.4%) |
Public vs Private Health Insurance Coverage by Age in West Frankfort
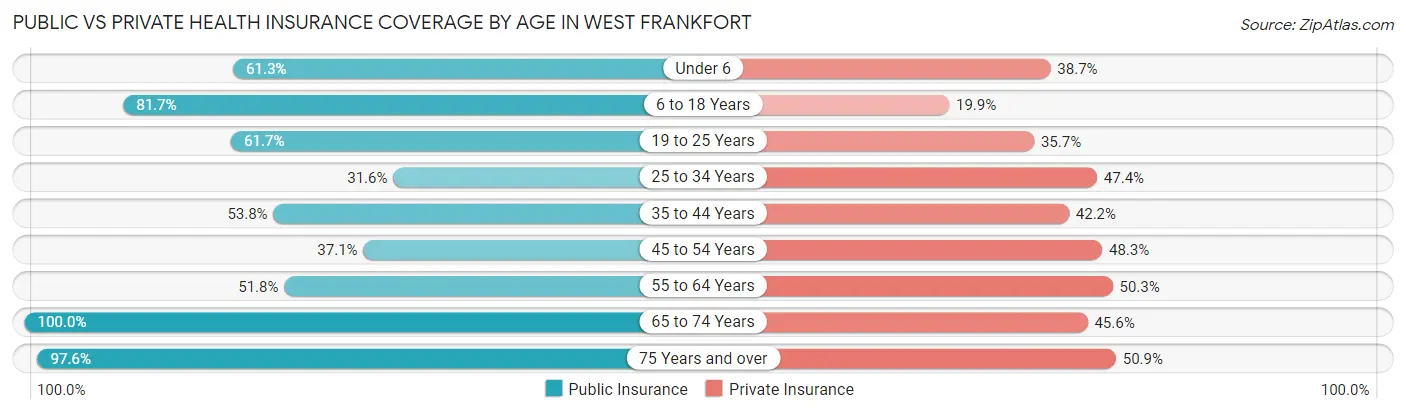
| Age Bracket | Public Insurance | Private Insurance |
| Under 6 | 269 (61.3%) | 170 (38.7%) |
| 6 to 18 Years | 1,132 (81.7%) | 276 (19.9%) |
| 19 to 25 Years | 370 (61.7%) | 214 (35.7%) |
| 25 to 34 Years | 238 (31.6%) | 357 (47.3%) |
| 35 to 44 Years | 466 (53.8%) | 365 (42.1%) |
| 45 to 54 Years | 285 (37.1%) | 371 (48.3%) |
| 55 to 64 Years | 504 (51.8%) | 489 (50.3%) |
| 65 to 74 Years | 682 (100.0%) | 311 (45.6%) |
| 75 Years and over | 566 (97.6%) | 295 (50.9%) |
| Total | 4,512 (64.0%) | 2,848 (40.4%) |
Disability Status by Sex by Age in West Frankfort
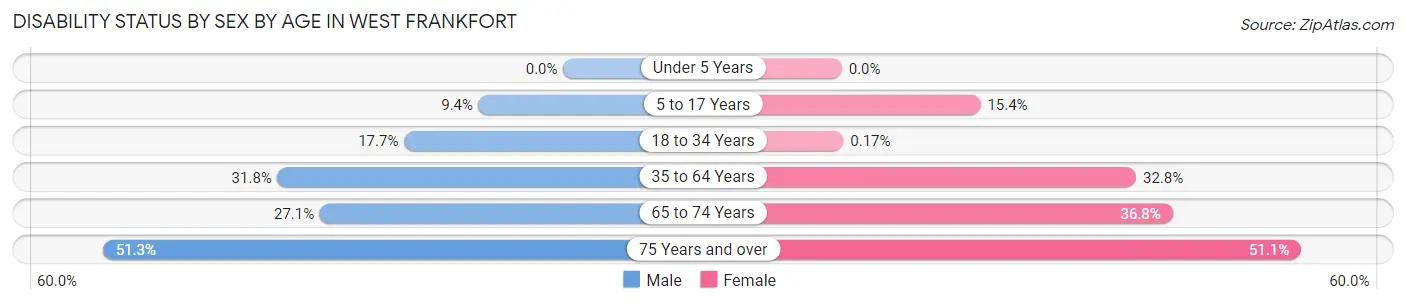
| Age Bracket | Male | Female |
| Under 5 Years | 0 (0.0%) | 0 (0.0%) |
| 5 to 17 Years | 72 (9.4%) | 103 (15.4%) |
| 18 to 34 Years | 146 (17.7%) | 1 (0.2%) |
| 35 to 64 Years | 413 (31.8%) | 429 (32.8%) |
| 65 to 74 Years | 87 (27.1%) | 133 (36.8%) |
| 75 Years and over | 118 (51.3%) | 179 (51.1%) |
Disability Class by Sex by Age in West Frankfort
Disability Class: Hearing Difficulty
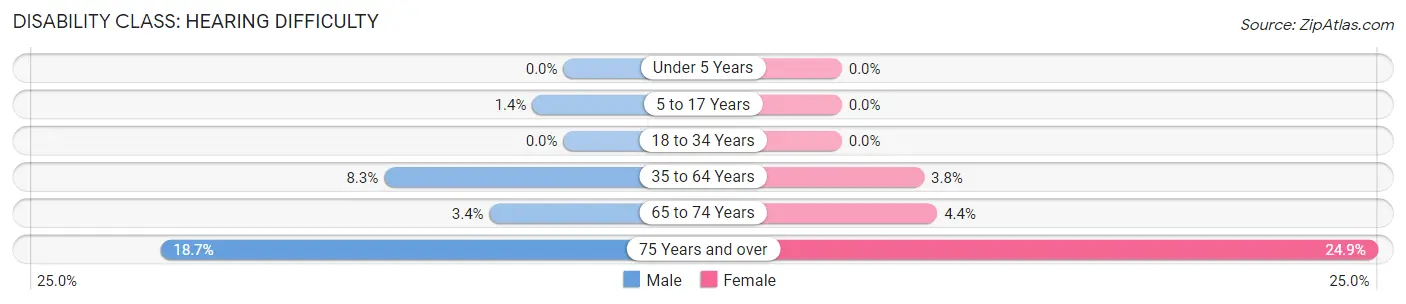
| Age Bracket | Male | Female |
| Under 5 Years | 0 (0.0%) | 0 (0.0%) |
| 5 to 17 Years | 11 (1.4%) | 0 (0.0%) |
| 18 to 34 Years | 0 (0.0%) | 0 (0.0%) |
| 35 to 64 Years | 108 (8.3%) | 50 (3.8%) |
| 65 to 74 Years | 11 (3.4%) | 16 (4.4%) |
| 75 Years and over | 43 (18.7%) | 87 (24.9%) |
Disability Class: Vision Difficulty
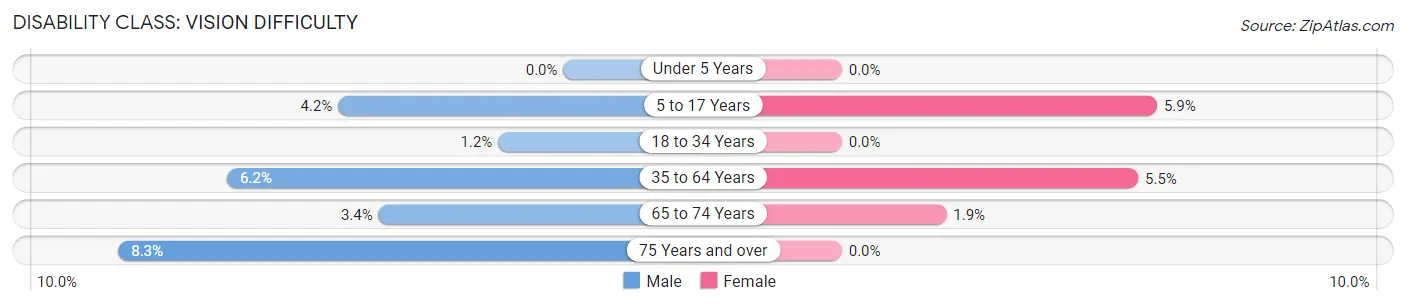
| Age Bracket | Male | Female |
| Under 5 Years | 0 (0.0%) | 0 (0.0%) |
| 5 to 17 Years | 32 (4.2%) | 39 (5.9%) |
| 18 to 34 Years | 10 (1.2%) | 0 (0.0%) |
| 35 to 64 Years | 81 (6.2%) | 72 (5.5%) |
| 65 to 74 Years | 11 (3.4%) | 7 (1.9%) |
| 75 Years and over | 19 (8.3%) | 0 (0.0%) |
Disability Class: Cognitive Difficulty
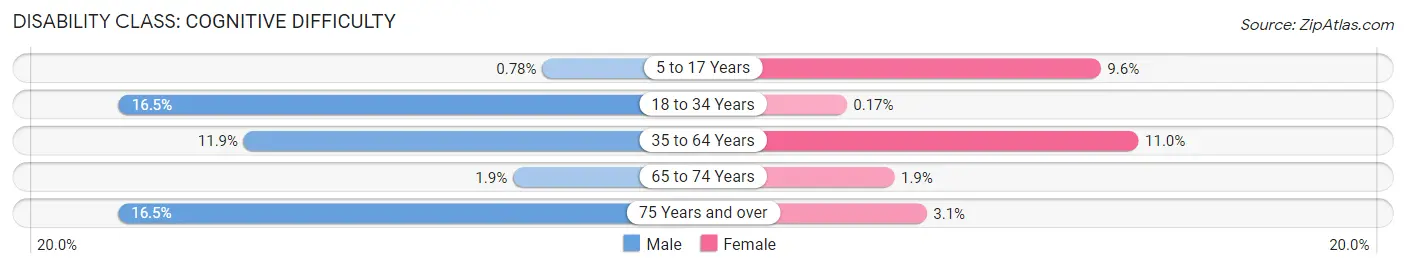
| Age Bracket | Male | Female |
| 5 to 17 Years | 6 (0.8%) | 64 (9.6%) |
| 18 to 34 Years | 136 (16.5%) | 1 (0.2%) |
| 35 to 64 Years | 154 (11.9%) | 144 (11.0%) |
| 65 to 74 Years | 6 (1.9%) | 7 (1.9%) |
| 75 Years and over | 38 (16.5%) | 11 (3.1%) |
Disability Class: Ambulatory Difficulty
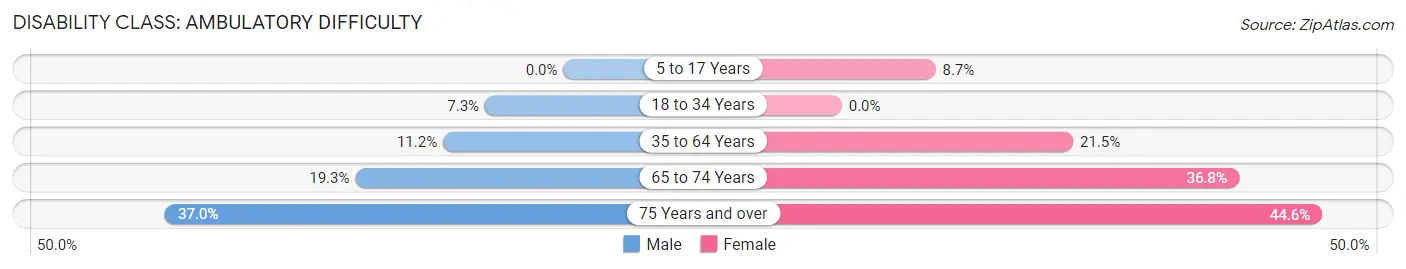
| Age Bracket | Male | Female |
| 5 to 17 Years | 0 (0.0%) | 58 (8.7%) |
| 18 to 34 Years | 60 (7.3%) | 0 (0.0%) |
| 35 to 64 Years | 145 (11.2%) | 281 (21.5%) |
| 65 to 74 Years | 62 (19.3%) | 133 (36.8%) |
| 75 Years and over | 85 (37.0%) | 156 (44.6%) |
Disability Class: Self-Care Difficulty
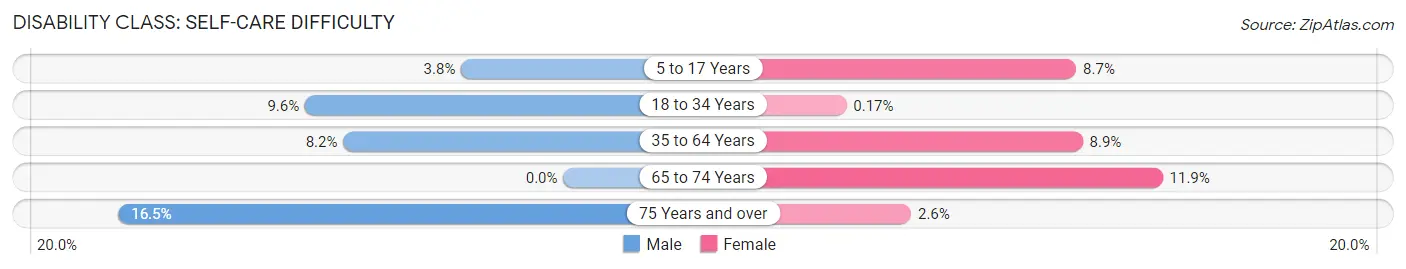
| Age Bracket | Male | Female |
| 5 to 17 Years | 29 (3.8%) | 58 (8.7%) |
| 18 to 34 Years | 79 (9.6%) | 1 (0.2%) |
| 35 to 64 Years | 106 (8.2%) | 117 (8.9%) |
| 65 to 74 Years | 0 (0.0%) | 43 (11.9%) |
| 75 Years and over | 38 (16.5%) | 9 (2.6%) |
Technology Access in West Frankfort
Computing Device Access in West Frankfort
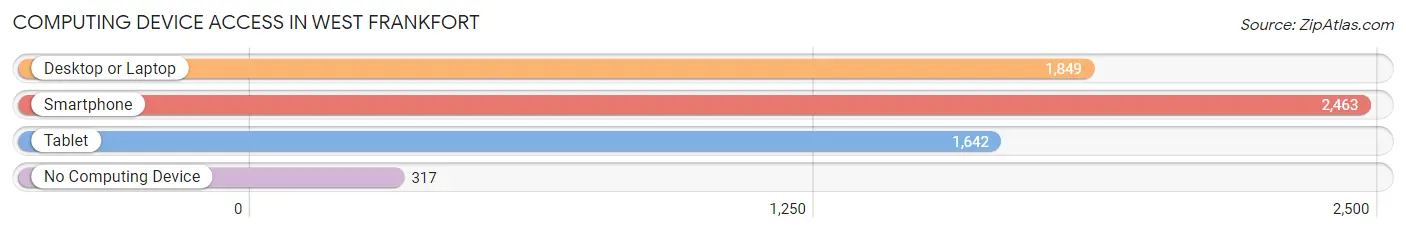
| Device Type | # Households | % Households |
| Desktop or Laptop | 1,849 | 61.8% |
| Smartphone | 2,463 | 82.3% |
| Tablet | 1,642 | 54.8% |
| No Computing Device | 317 | 10.6% |
| Total | 2,994 | 100.0% |
Internet Access in West Frankfort
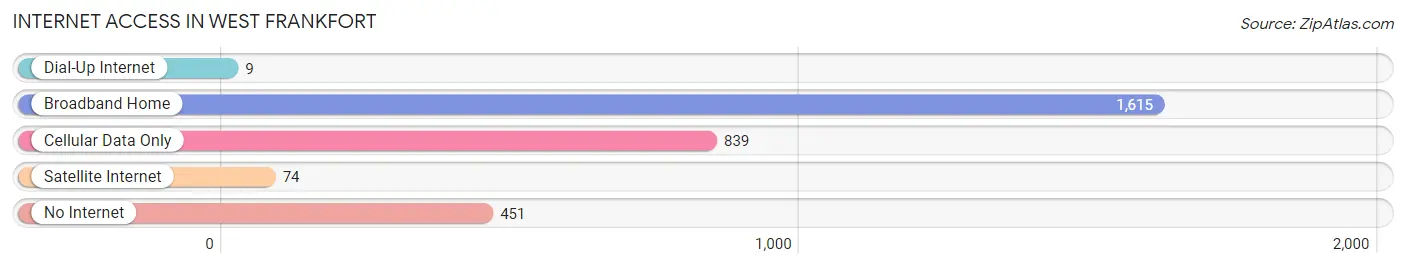
| Internet Type | # Households | % Households |
| Dial-Up Internet | 9 | 0.3% |
| Broadband Home | 1,615 | 53.9% |
| Cellular Data Only | 839 | 28.0% |
| Satellite Internet | 74 | 2.5% |
| No Internet | 451 | 15.1% |
| Total | 2,994 | 100.0% |
West Frankfort Summary
History
West Frankfort, Illinois is a city located in Franklin County, Illinois. It is the county seat of Franklin County and is located in the southern part of the state. The city was founded in 1855 and was originally known as Frankfort Station. The city was named after the nearby town of Frankfort, Kentucky. The city was incorporated in 1872 and was officially named West Frankfort.
The city has a rich history that dates back to the early 1800s. The area was first settled by Native Americans, who were later displaced by European settlers. The first settlers in the area were mostly German and Irish immigrants. The city was originally a farming community, but it soon became a coal mining town. The coal industry was the main source of employment for the city until the 1950s.
The city experienced a period of growth in the late 19th and early 20th centuries. The city was home to several large coal mines, which provided employment for many of the city’s residents. The city also had a thriving business district, which included several banks, stores, and other businesses.
The city experienced a period of decline in the mid-20th century. The coal industry began to decline, and the city’s population began to decrease. The city’s economy shifted to focus on manufacturing and other industries. The city experienced a period of revitalization in the late 20th century, and the population began to increase.
Geography
West Frankfort is located in the southern part of Illinois, in Franklin County. The city is situated on the banks of the Big Muddy River. The city is located in the Shawnee National Forest, which is a large area of protected land. The city is located near the cities of Marion, Carbondale, and Herrin.
The city has a total area of 4.3 square miles, all of which is land. The city has a humid continental climate, with hot summers and cold winters. The average temperature in the summer is around 80 degrees Fahrenheit, and the average temperature in the winter is around 30 degrees Fahrenheit.
Economy
West Frankfort’s economy is largely based on manufacturing and other industries. The city is home to several manufacturing companies, including a steel mill, a paper mill, and a plastics plant. The city is also home to several retail stores, restaurants, and other businesses.
The city is also home to several educational institutions, including a community college and a vocational school. The city is also home to several medical facilities, including a hospital and several clinics.
Demographics
West Frankfort has a population of 8,845 people, according to the 2020 census. The city has a median age of 39.7 years, and the median household income is $41,945. The city is predominantly white, with a population that is 88.3% white, 5.3% African American, 1.3% Asian, and 4.1% other. The city has a poverty rate of 17.3%.
Conclusion
West Frankfort, Illinois is a city located in Franklin County, Illinois. The city was founded in 1855 and was originally known as Frankfort Station. The city has a rich history that dates back to the early 1800s, and it has experienced periods of growth and decline throughout its history. The city’s economy is largely based on manufacturing and other industries, and the city is home to several educational institutions and medical facilities. The city has a population of 8,845 people, according to the 2020 census, and the population is predominantly white.
Common Questions
What is Per Capita Income in West Frankfort?
Per Capita income in West Frankfort is $23,300.
What is the Median Family Income in West Frankfort?
Median Family Income in West Frankfort is $48,065.
What is the Median Household income in West Frankfort?
Median Household Income in West Frankfort is $41,974.
What is Income or Wage Gap in West Frankfort?
Income or Wage Gap in West Frankfort is 43.6%.
Women in West Frankfort earn 56.4 cents for every dollar earned by a man.
What is Inequality or Gini Index in West Frankfort?
Inequality or Gini Index in West Frankfort is 0.45.
What is the Total Population of West Frankfort?
Total Population of West Frankfort is 7,168.
What is the Total Male Population of West Frankfort?
Total Male Population of West Frankfort is 3,652.
What is the Total Female Population of West Frankfort?
Total Female Population of West Frankfort is 3,516.
What is the Ratio of Males per 100 Females in West Frankfort?
There are 103.87 Males per 100 Females in West Frankfort.
What is the Ratio of Females per 100 Males in West Frankfort?
There are 96.28 Females per 100 Males in West Frankfort.
What is the Median Population Age in West Frankfort?
Median Population Age in West Frankfort is 40.3 Years.
What is the Average Family Size in West Frankfort
Average Family Size in West Frankfort is 3.1 People.
What is the Average Household Size in West Frankfort
Average Household Size in West Frankfort is 2.4 People.
How Large is the Labor Force in West Frankfort?
There are 2,995 People in the Labor Forcein in West Frankfort.
What is the Percentage of People in the Labor Force in West Frankfort?
53.2% of People are in the Labor Force in West Frankfort.
What is the Unemployment Rate in West Frankfort?
Unemployment Rate in West Frankfort is 12.8%.