Vienna, IL Map & Demographics
Vienna Map
Vienna Overview
$22,301
PER CAPITA INCOME
$52,031
AVG FAMILY INCOME
$47,000
AVG HOUSEHOLD INCOME
34.9%
WAGE / INCOME GAP [ % ]
65.1¢/ $1
WAGE / INCOME GAP [ $ ]
0.44
INEQUALITY / GINI INDEX
2,319
TOTAL POPULATION
1,348
MALE POPULATION
971
FEMALE POPULATION
138.83
MALES / 100 FEMALES
72.03
FEMALES / 100 MALES
30.3
MEDIAN AGE
4.7
AVG FAMILY SIZE
3.4
AVG HOUSEHOLD SIZE
827
LABOR FORCE [ PEOPLE ]
51.2%
PERCENT IN LABOR FORCE
2.4%
UNEMPLOYMENT RATE
Vienna Zip Codes
Vienna Area Codes
Income in Vienna
Income Overview in Vienna
Per Capita Income in Vienna is $22,301, while median incomes of families and households are $52,031 and $47,000 respectively.
| Characteristic | Number | Measure |
| Per Capita Income | 2,319 | $22,301 |
| Median Family Income | 377 | $52,031 |
| Mean Family Income | 377 | $60,640 |
| Median Household Income | 662 | $47,000 |
| Mean Household Income | 662 | $55,568 |
| Income Deficit | 377 | $0 |
| Wage / Income Gap (%) | 2,319 | 34.89% |
| Wage / Income Gap ($) | 2,319 | 65.11¢ per $1 |
| Gini / Inequality Index | 2,319 | 0.44 |
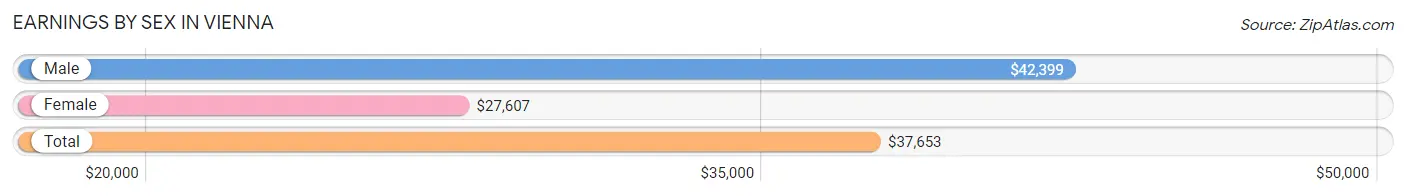
Earnings by Sex in Vienna
Average Earnings in Vienna are $37,653, $42,399 for men and $27,607 for women, a difference of 34.9%.
| Sex | Number | Average Earnings |
| Male | 519 (60.6%) | $42,399 |
| Female | 337 (39.4%) | $27,607 |
| Total | 856 (100.0%) | $37,653 |
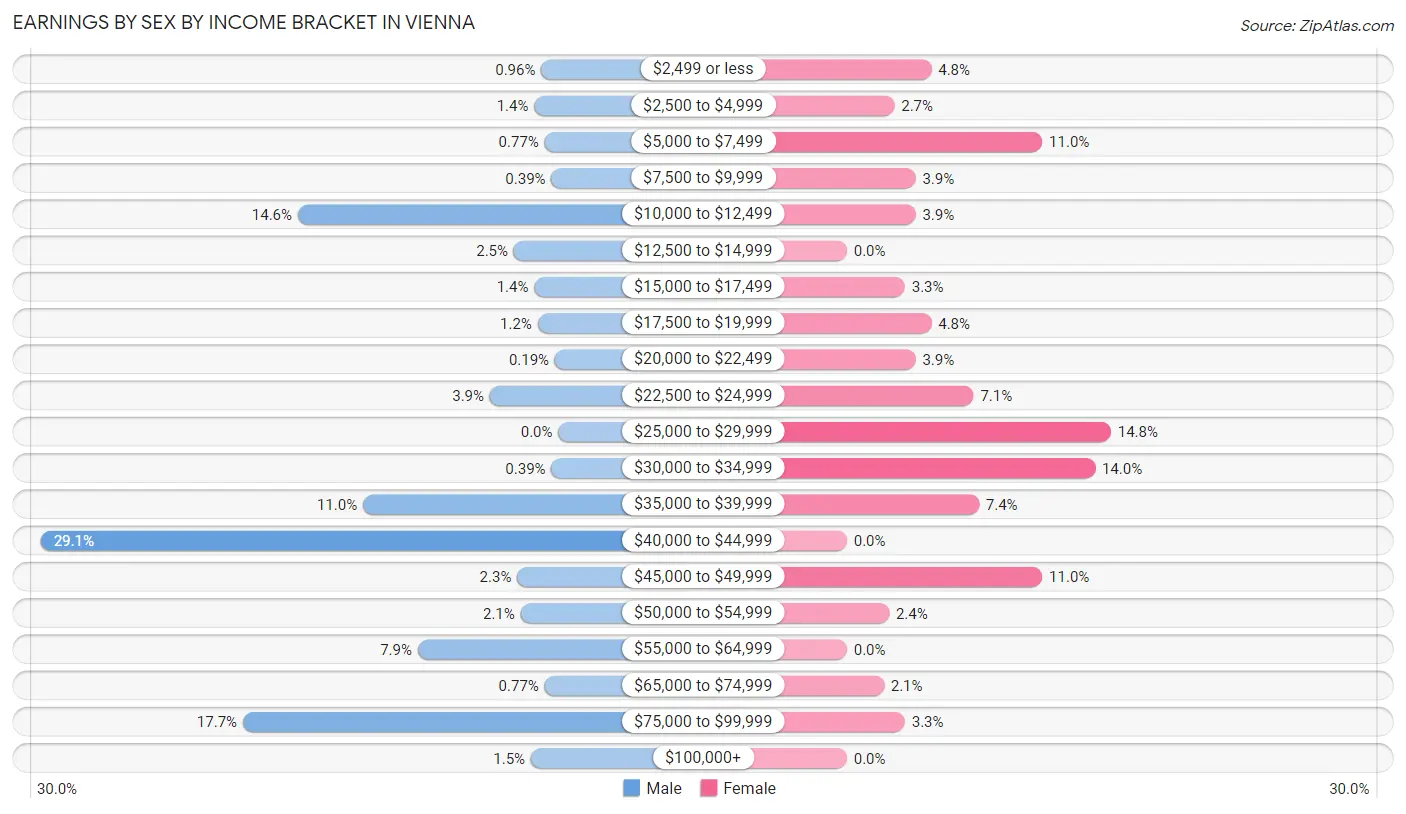
Earnings by Sex by Income Bracket in Vienna
The most common earnings brackets in Vienna are $40,000 to $44,999 for men (151 | 29.1%) and $25,000 to $29,999 for women (50 | 14.8%).
| Income | Male | Female |
| $2,499 or less | 5 (1.0%) | 16 (4.8%) |
| $2,500 to $4,999 | 7 (1.3%) | 9 (2.7%) |
| $5,000 to $7,499 | 4 (0.8%) | 37 (11.0%) |
| $7,500 to $9,999 | 2 (0.4%) | 13 (3.9%) |
| $10,000 to $12,499 | 76 (14.6%) | 13 (3.9%) |
| $12,500 to $14,999 | 13 (2.5%) | 0 (0.0%) |
| $15,000 to $17,499 | 7 (1.3%) | 11 (3.3%) |
| $17,500 to $19,999 | 6 (1.2%) | 16 (4.8%) |
| $20,000 to $22,499 | 1 (0.2%) | 13 (3.9%) |
| $22,500 to $24,999 | 20 (3.8%) | 24 (7.1%) |
| $25,000 to $29,999 | 0 (0.0%) | 50 (14.8%) |
| $30,000 to $34,999 | 2 (0.4%) | 47 (14.0%) |
| $35,000 to $39,999 | 57 (11.0%) | 25 (7.4%) |
| $40,000 to $44,999 | 151 (29.1%) | 0 (0.0%) |
| $45,000 to $49,999 | 12 (2.3%) | 37 (11.0%) |
| $50,000 to $54,999 | 11 (2.1%) | 8 (2.4%) |
| $55,000 to $64,999 | 41 (7.9%) | 0 (0.0%) |
| $65,000 to $74,999 | 4 (0.8%) | 7 (2.1%) |
| $75,000 to $99,999 | 92 (17.7%) | 11 (3.3%) |
| $100,000+ | 8 (1.5%) | 0 (0.0%) |
| Total | 519 (100.0%) | 337 (100.0%) |
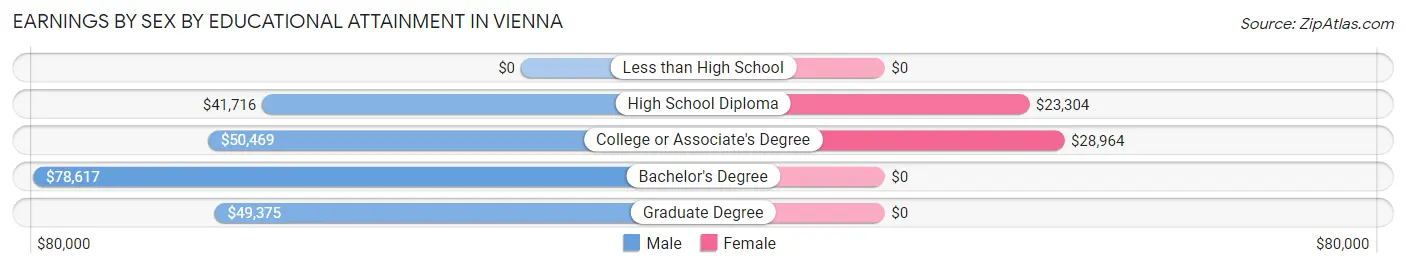
Earnings by Sex by Educational Attainment in Vienna
Average earnings in Vienna are $44,003 for men and $27,536 for women, a difference of 37.4%. Men with an educational attainment of bachelor's degree enjoy the highest average annual earnings of $78,617, while those with high school diploma education earn the least with $41,716. Women with an educational attainment of college or associate's degree earn the most with the average annual earnings of $28,964, while those with high school diploma education have the smallest earnings of $23,304.
| Educational Attainment | Male Income | Female Income |
| Less than High School | - | - |
| High School Diploma | $41,716 | $23,304 |
| College or Associate's Degree | $50,469 | $28,964 |
| Bachelor's Degree | $78,617 | $0 |
| Graduate Degree | $49,375 | $0 |
| Total | $44,003 | $27,536 |
Family Income in Vienna
Family Income Brackets in Vienna
According to the Vienna family income data, there are 124 families falling into the $50,000 to $74,999 income range, which is the most common income bracket and makes up 32.9% of all families. Conversely, the $200,000+ income bracket is the least frequent group with only 2 families (0.5%) belonging to this category.
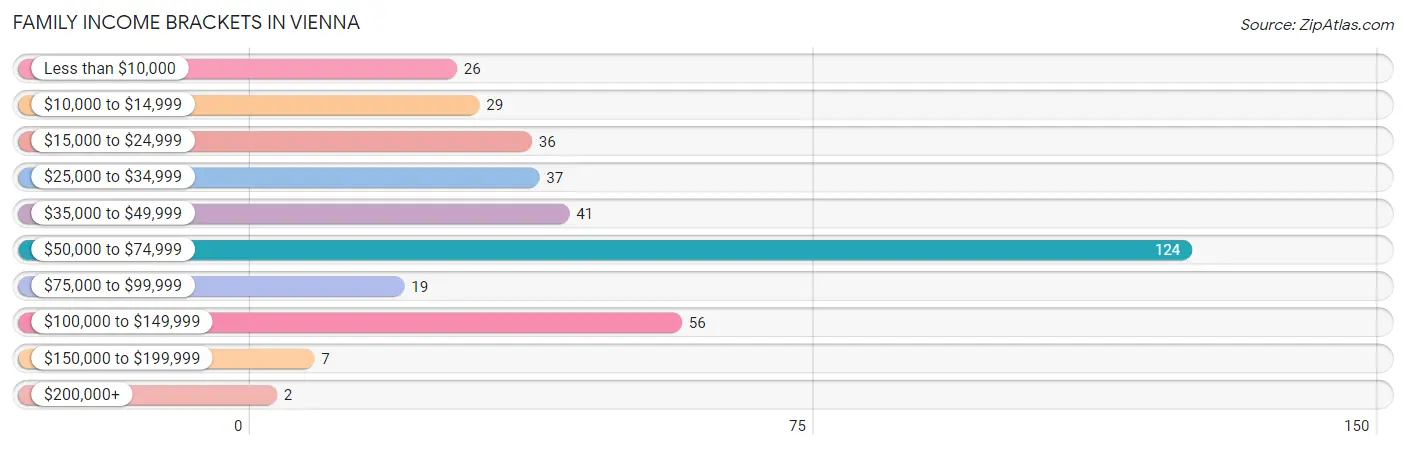
| Income Bracket | # Families | % Families |
| Less than $10,000 | 26 | 6.9% |
| $10,000 to $14,999 | 29 | 7.7% |
| $15,000 to $24,999 | 36 | 9.5% |
| $25,000 to $34,999 | 37 | 9.8% |
| $35,000 to $49,999 | 41 | 10.9% |
| $50,000 to $74,999 | 124 | 32.9% |
| $75,000 to $99,999 | 19 | 5.0% |
| $100,000 to $149,999 | 56 | 14.9% |
| $150,000 to $199,999 | 7 | 1.9% |
| $200,000+ | 2 | 0.5% |
Family Income by Famaliy Size in Vienna
3-person families (63 | 16.7%) account for the highest median family income in Vienna with $72,708 per family, while 3-person families (63 | 16.7%) have the highest median income of $24,236 per family member.
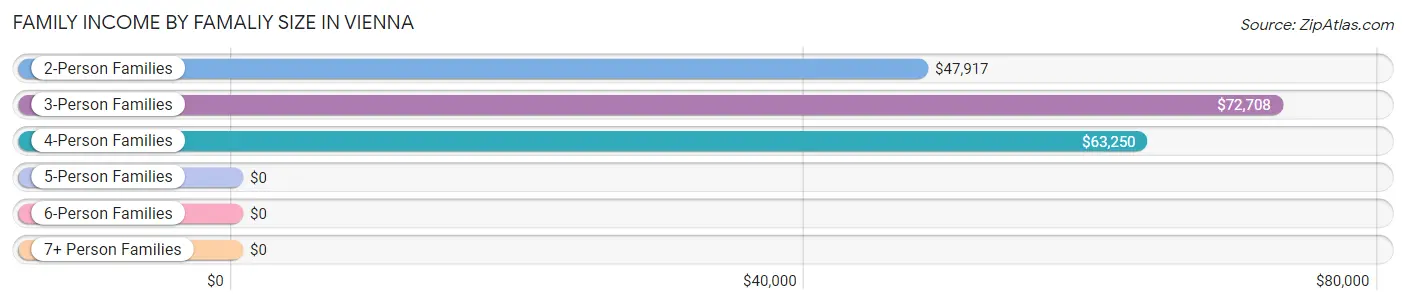
| Income Bracket | # Families | Median Income |
| 2-Person Families | 213 (56.5%) | $47,917 |
| 3-Person Families | 63 (16.7%) | $72,708 |
| 4-Person Families | 47 (12.5%) | $63,250 |
| 5-Person Families | 24 (6.4%) | $0 |
| 6-Person Families | 26 (6.9%) | $0 |
| 7+ Person Families | 4 (1.1%) | $0 |
| Total | 377 (100.0%) | $52,031 |
Family Income by Number of Earners in Vienna
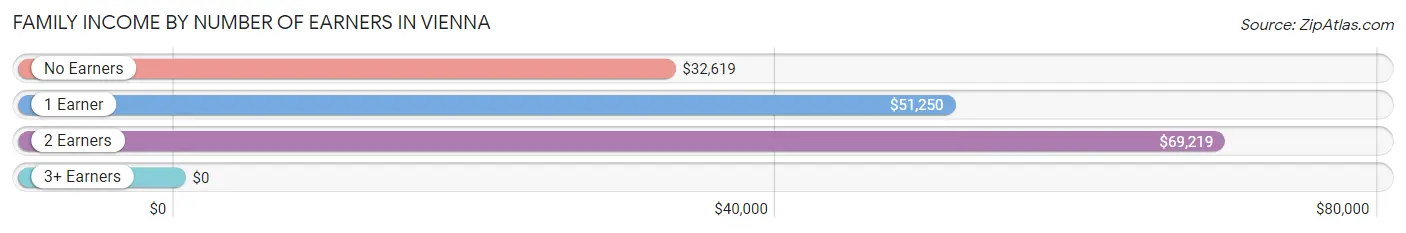
| Number of Earners | # Families | Median Income |
| No Earners | 118 (31.3%) | $32,619 |
| 1 Earner | 158 (41.9%) | $51,250 |
| 2 Earners | 77 (20.4%) | $69,219 |
| 3+ Earners | 24 (6.4%) | $0 |
| Total | 377 (100.0%) | $52,031 |
Household Income in Vienna
Household Income Brackets in Vienna
With 197 households falling in the category, the $50,000 to $74,999 income range is the most frequent in Vienna, accounting for 29.8% of all households. In contrast, only 5 households (0.8%) fall into the $200,000+ income bracket, making it the least populous group.
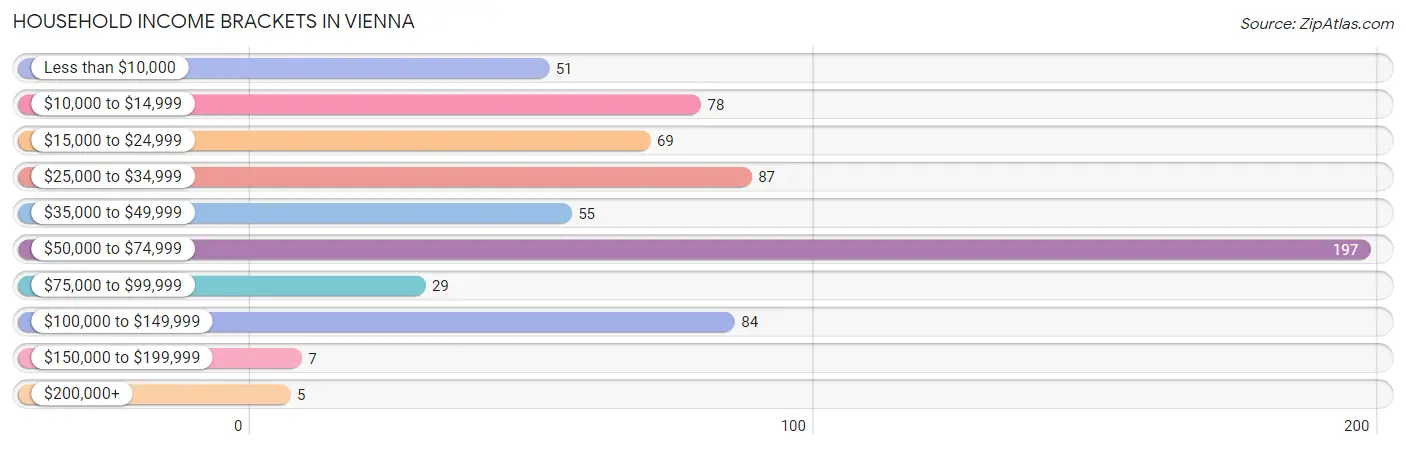
| Income Bracket | # Households | % Households |
| Less than $10,000 | 51 | 7.7% |
| $10,000 to $14,999 | 78 | 11.8% |
| $15,000 to $24,999 | 69 | 10.4% |
| $25,000 to $34,999 | 87 | 13.1% |
| $35,000 to $49,999 | 55 | 8.3% |
| $50,000 to $74,999 | 197 | 29.8% |
| $75,000 to $99,999 | 29 | 4.4% |
| $100,000 to $149,999 | 84 | 12.7% |
| $150,000 to $199,999 | 7 | 1.1% |
| $200,000+ | 5 | 0.8% |
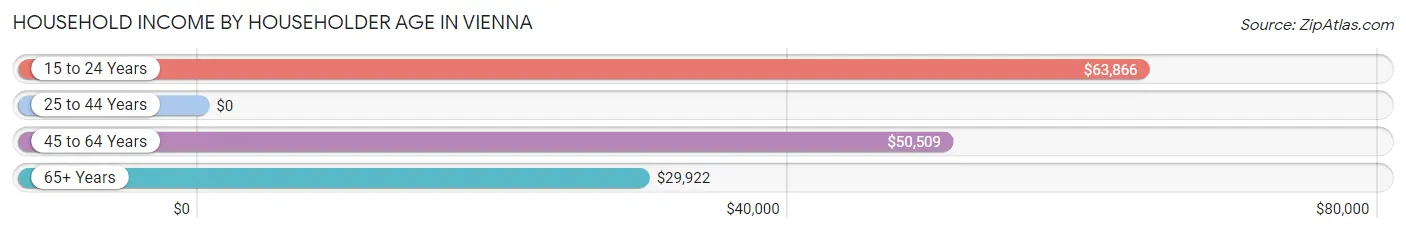
Household Income by Householder Age in Vienna
The median household income in Vienna is $47,000, with the highest median household income of $63,866 found in the 15 to 24 years age bracket for the primary householder. A total of 63 households (9.5%) fall into this category. Meanwhile, the 25 to 44 years age bracket for the primary householder has the lowest median household income of $0, with 137 households (20.7%) in this group.
| Income Bracket | # Households | Median Income |
| 15 to 24 Years | 63 (9.5%) | $63,866 |
| 25 to 44 Years | 137 (20.7%) | $0 |
| 45 to 64 Years | 195 (29.5%) | $50,509 |
| 65+ Years | 267 (40.3%) | $29,922 |
| Total | 662 (100.0%) | $47,000 |
Poverty in Vienna
Income Below Poverty by Sex and Age in Vienna
With 41.7% poverty level for males and 23.4% for females among the residents of Vienna, 6 to 11 year old males and under 5 year old females are the most vulnerable to poverty, with 270 males (96.8%) and 67 females (73.6%) in their respective age groups living below the poverty level.
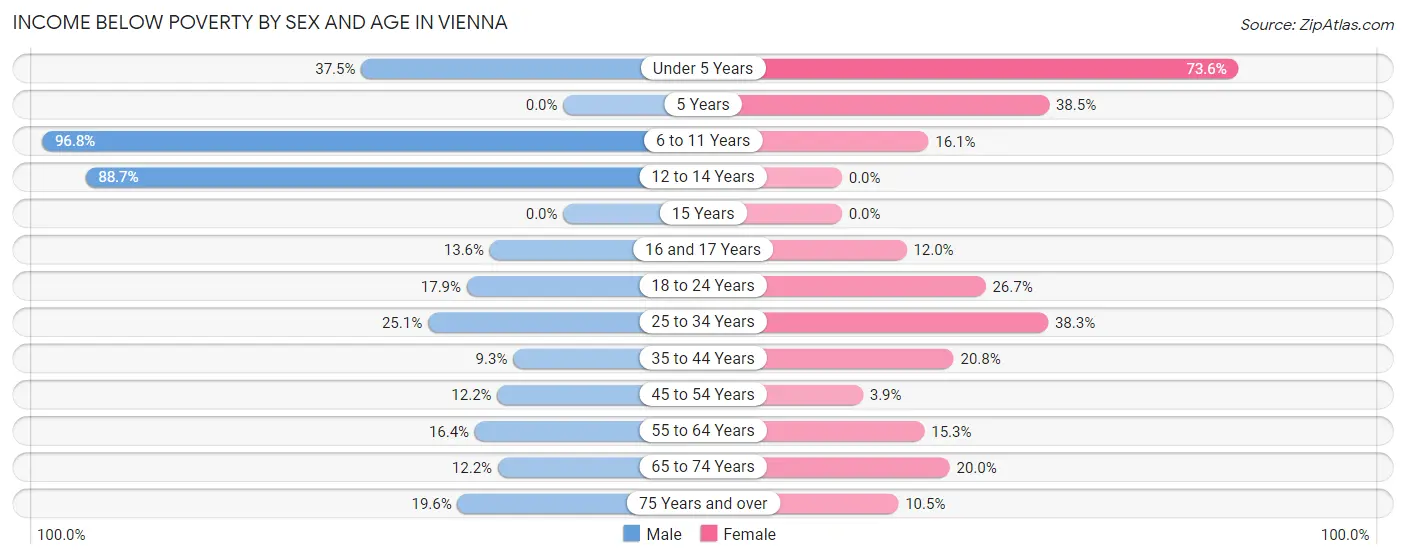
| Age Bracket | Male | Female |
| Under 5 Years | 6 (37.5%) | 67 (73.6%) |
| 5 Years | 0 (0.0%) | 10 (38.5%) |
| 6 to 11 Years | 270 (96.8%) | 9 (16.1%) |
| 12 to 14 Years | 126 (88.7%) | 0 (0.0%) |
| 15 Years | 0 (0.0%) | 0 (0.0%) |
| 16 and 17 Years | 3 (13.6%) | 3 (12.0%) |
| 18 to 24 Years | 24 (17.9%) | 16 (26.7%) |
| 25 to 34 Years | 48 (25.1%) | 31 (38.3%) |
| 35 to 44 Years | 12 (9.3%) | 22 (20.7%) |
| 45 to 54 Years | 12 (12.2%) | 3 (3.9%) |
| 55 to 64 Years | 21 (16.4%) | 15 (15.3%) |
| 65 to 74 Years | 13 (12.1%) | 26 (20.0%) |
| 75 Years and over | 11 (19.6%) | 13 (10.5%) |
| Total | 546 (41.7%) | 215 (23.4%) |
Income Above Poverty by Sex and Age in Vienna
According to the poverty statistics in Vienna, males aged 5 years and females aged 12 to 14 years are the age groups that are most secure financially, with 100.0% of males and 100.0% of females in these age groups living above the poverty line.
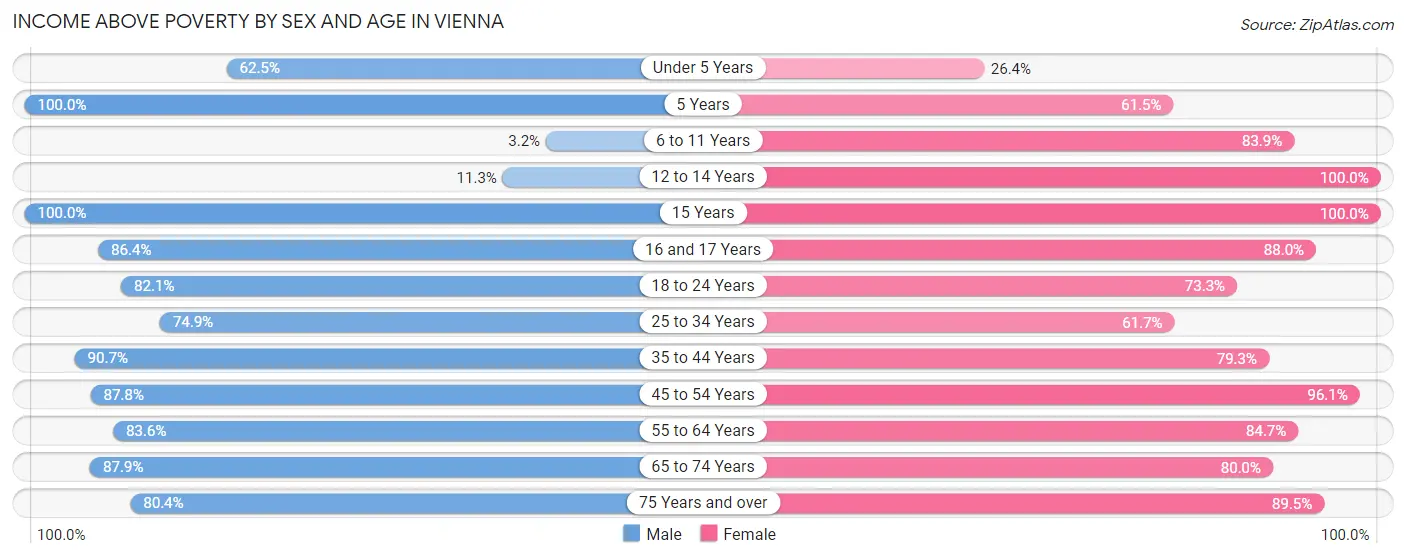
| Age Bracket | Male | Female |
| Under 5 Years | 10 (62.5%) | 24 (26.4%) |
| 5 Years | 3 (100.0%) | 16 (61.5%) |
| 6 to 11 Years | 9 (3.2%) | 47 (83.9%) |
| 12 to 14 Years | 16 (11.3%) | 41 (100.0%) |
| 15 Years | 4 (100.0%) | 2 (100.0%) |
| 16 and 17 Years | 19 (86.4%) | 22 (88.0%) |
| 18 to 24 Years | 110 (82.1%) | 44 (73.3%) |
| 25 to 34 Years | 143 (74.9%) | 50 (61.7%) |
| 35 to 44 Years | 117 (90.7%) | 84 (79.2%) |
| 45 to 54 Years | 86 (87.8%) | 74 (96.1%) |
| 55 to 64 Years | 107 (83.6%) | 83 (84.7%) |
| 65 to 74 Years | 94 (87.8%) | 104 (80.0%) |
| 75 Years and over | 45 (80.4%) | 111 (89.5%) |
| Total | 763 (58.3%) | 702 (76.5%) |
Income Below Poverty Among Married-Couple Families in Vienna
The poverty statistics for married-couple families in Vienna show that 9.0% or 21 of the total 232 families live below the poverty line. Families with 3 or 4 children have the highest poverty rate of 28.0%, comprising of 14 families. On the other hand, families with 1 or 2 children have the lowest poverty rate of 0.0%, which includes 0 families.
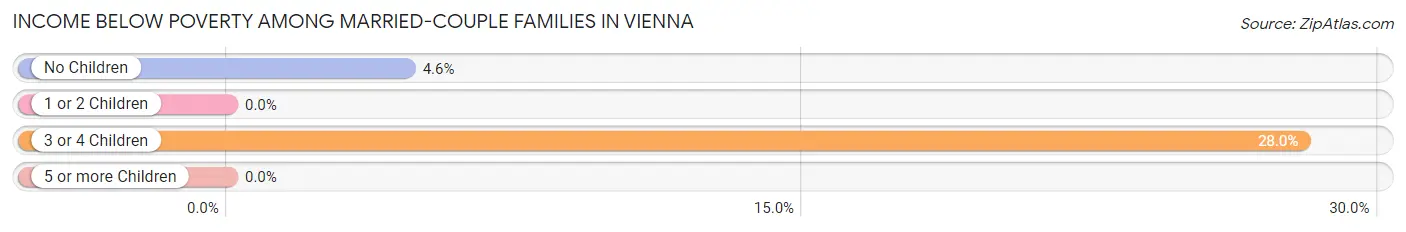
| Children | Above Poverty | Below Poverty |
| No Children | 144 (95.4%) | 7 (4.6%) |
| 1 or 2 Children | 31 (100.0%) | 0 (0.0%) |
| 3 or 4 Children | 36 (72.0%) | 14 (28.0%) |
| 5 or more Children | 0 (0.0%) | 0 (0.0%) |
| Total | 211 (90.9%) | 21 (9.0%) |
Income Below Poverty Among Single-Parent Households in Vienna
According to the poverty data in Vienna, 27.9% or 12 single-father households and 46.1% or 47 single-mother households are living below the poverty line. Among single-father households, those with 3 or 4 children have the highest poverty rate, with 8 households (100.0%) experiencing poverty. Likewise, among single-mother households, those with 3 or 4 children have the highest poverty rate, with 5 households (100.0%) falling below the poverty line.
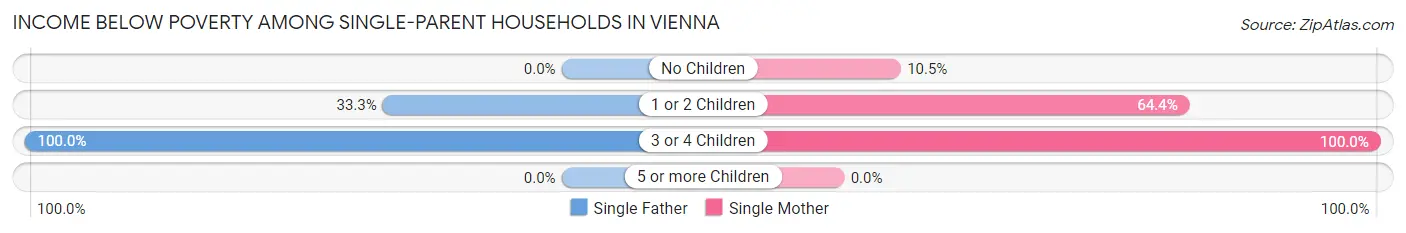
| Children | Single Father | Single Mother |
| No Children | 0 (0.0%) | 4 (10.5%) |
| 1 or 2 Children | 4 (33.3%) | 38 (64.4%) |
| 3 or 4 Children | 8 (100.0%) | 5 (100.0%) |
| 5 or more Children | 0 (0.0%) | 0 (0.0%) |
| Total | 12 (27.9%) | 47 (46.1%) |
Income Below Poverty Among Married-Couple vs Single-Parent Households in Vienna
The poverty data for Vienna shows that 21 of the married-couple family households (9.0%) and 59 of the single-parent households (40.7%) are living below the poverty level. Within the married-couple family households, those with 3 or 4 children have the highest poverty rate, with 14 households (28.0%) falling below the poverty line. Among the single-parent households, those with 3 or 4 children have the highest poverty rate, with 13 household (100.0%) living below poverty.
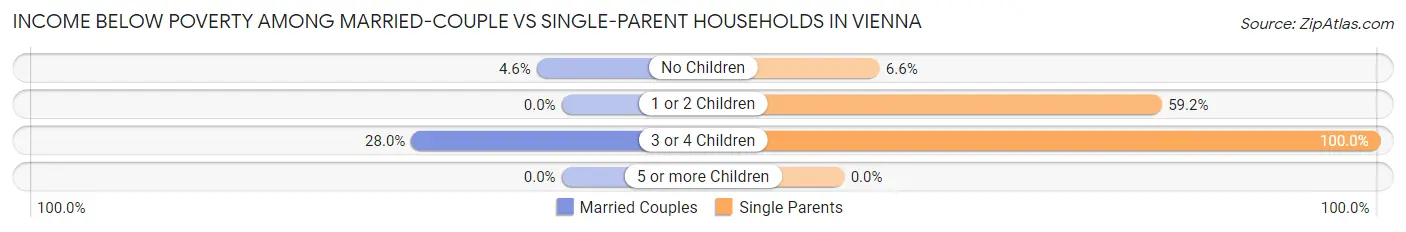
| Children | Married-Couple Families | Single-Parent Households |
| No Children | 7 (4.6%) | 4 (6.6%) |
| 1 or 2 Children | 0 (0.0%) | 42 (59.2%) |
| 3 or 4 Children | 14 (28.0%) | 13 (100.0%) |
| 5 or more Children | 0 (0.0%) | 0 (0.0%) |
| Total | 21 (9.0%) | 59 (40.7%) |
Race in Vienna
The most populous races in Vienna are White / Caucasian (1,707 | 73.6%), Two or more Races (463 | 20.0%), and Black / African American (131 | 5.7%).
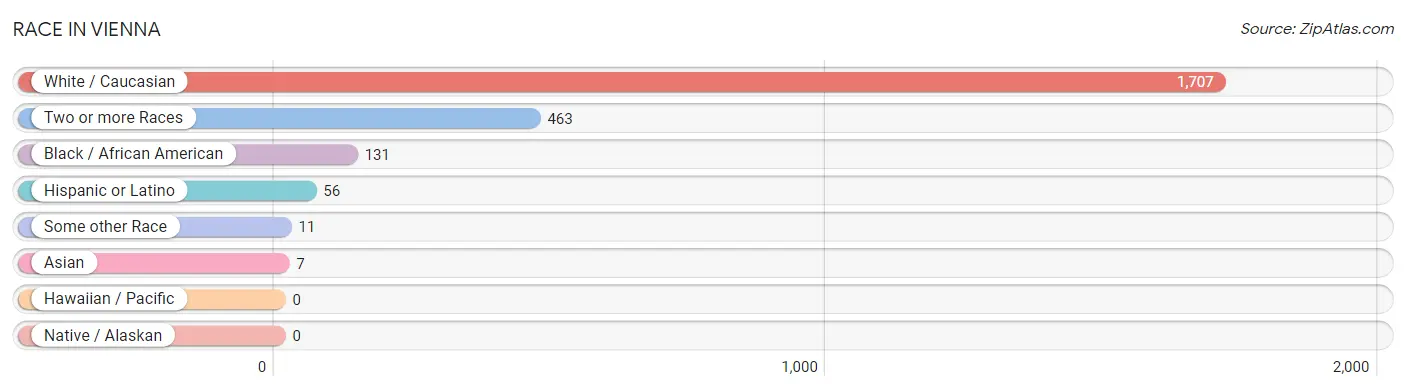
| Race | # Population | % Population |
| Asian | 7 | 0.3% |
| Black / African American | 131 | 5.7% |
| Hawaiian / Pacific | 0 | 0.0% |
| Hispanic or Latino | 56 | 2.4% |
| Native / Alaskan | 0 | 0.0% |
| White / Caucasian | 1,707 | 73.6% |
| Two or more Races | 463 | 20.0% |
| Some other Race | 11 | 0.5% |
| Total | 2,319 | 100.0% |
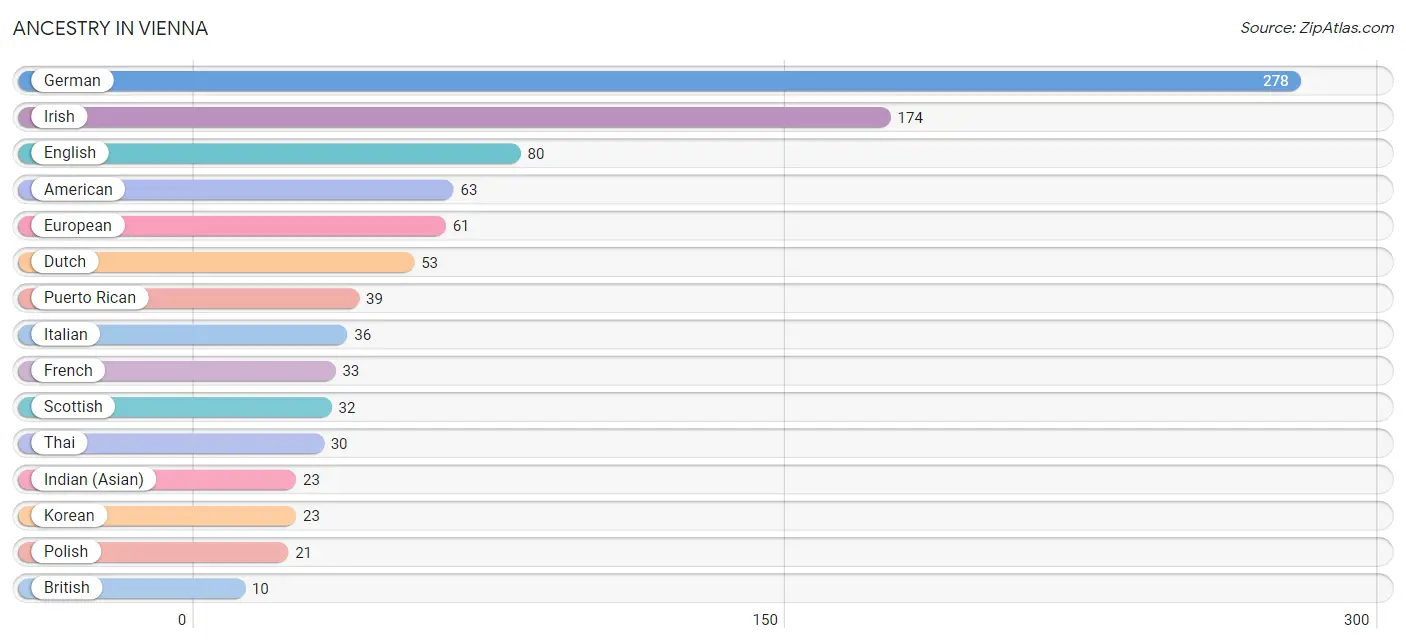
Ancestry in Vienna
The most populous ancestries reported in Vienna are German (278 | 12.0%), Irish (174 | 7.5%), English (80 | 3.5%), American (63 | 2.7%), and European (61 | 2.6%), together accounting for 28.3% of all Vienna residents.
| Ancestry | # Population | % Population |
| American | 63 | 2.7% |
| Arab | 4 | 0.2% |
| British | 10 | 0.4% |
| Cuban | 8 | 0.3% |
| Dutch | 53 | 2.3% |
| English | 80 | 3.5% |
| European | 61 | 2.6% |
| Finnish | 4 | 0.2% |
| French | 33 | 1.4% |
| German | 278 | 12.0% |
| Indian (Asian) | 23 | 1.0% |
| Irish | 174 | 7.5% |
| Italian | 36 | 1.5% |
| Korean | 23 | 1.0% |
| Mexican | 9 | 0.4% |
| Norwegian | 4 | 0.2% |
| Polish | 21 | 0.9% |
| Puerto Rican | 39 | 1.7% |
| Russian | 3 | 0.1% |
| Scotch-Irish | 9 | 0.4% |
| Scottish | 32 | 1.4% |
| Thai | 30 | 1.3% |
| Welsh | 3 | 0.1% | View All 23 Rows |
Immigrants in Vienna
The most numerous immigrant groups reported in Vienna came from Europe (18 | 0.8%), Netherlands (18 | 0.8%), Western Europe (18 | 0.8%), Asia (7 | 0.3%), and India (7 | 0.3%), together accounting for 2.9% of all Vienna residents.
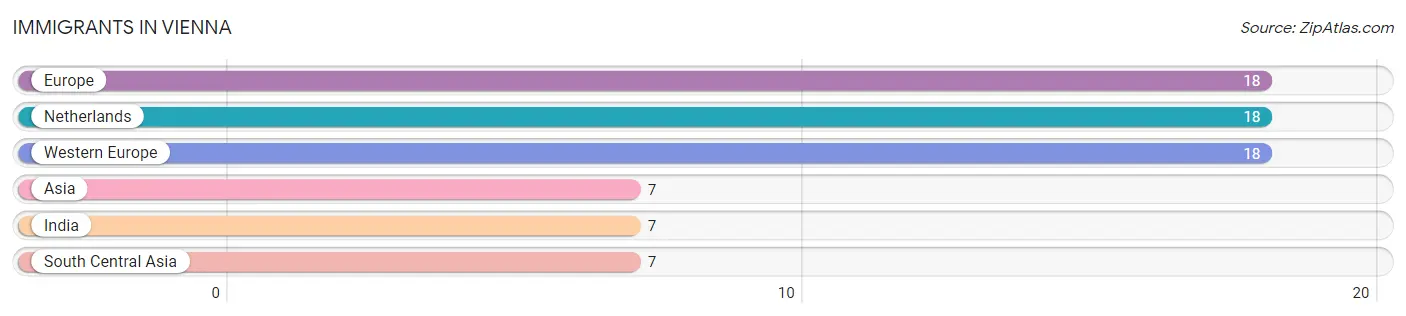
| Immigration Origin | # Population | % Population |
| Asia | 7 | 0.3% |
| Europe | 18 | 0.8% |
| India | 7 | 0.3% |
| Netherlands | 18 | 0.8% |
| South Central Asia | 7 | 0.3% |
| Western Europe | 18 | 0.8% | View All 6 Rows |
Sex and Age in Vienna
Sex and Age in Vienna
The most populous age groups in Vienna are 10 to 14 Years (286 | 21.2%) for men and Under 5 Years (114 | 11.7%) for women.
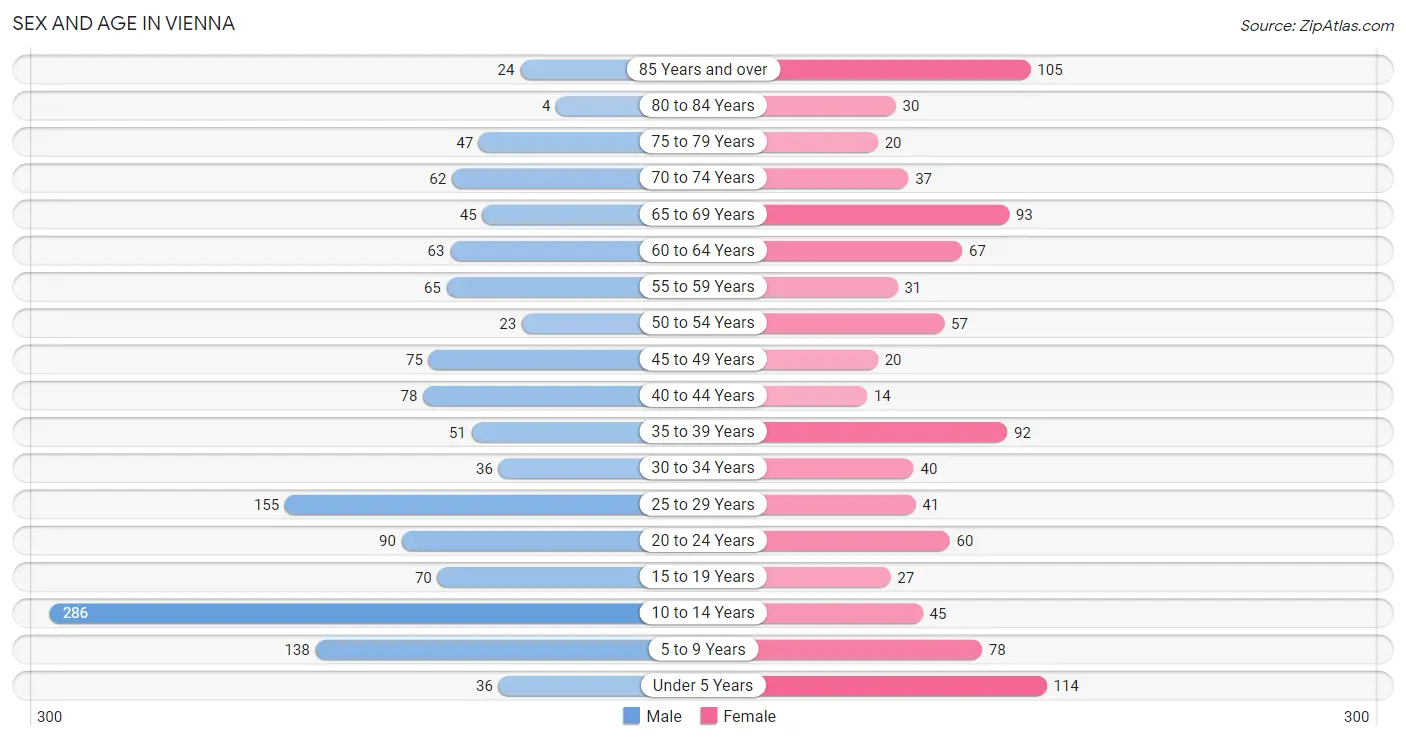
| Age Bracket | Male | Female |
| Under 5 Years | 36 (2.7%) | 114 (11.7%) |
| 5 to 9 Years | 138 (10.2%) | 78 (8.0%) |
| 10 to 14 Years | 286 (21.2%) | 45 (4.6%) |
| 15 to 19 Years | 70 (5.2%) | 27 (2.8%) |
| 20 to 24 Years | 90 (6.7%) | 60 (6.2%) |
| 25 to 29 Years | 155 (11.5%) | 41 (4.2%) |
| 30 to 34 Years | 36 (2.7%) | 40 (4.1%) |
| 35 to 39 Years | 51 (3.8%) | 92 (9.5%) |
| 40 to 44 Years | 78 (5.8%) | 14 (1.4%) |
| 45 to 49 Years | 75 (5.6%) | 20 (2.1%) |
| 50 to 54 Years | 23 (1.7%) | 57 (5.9%) |
| 55 to 59 Years | 65 (4.8%) | 31 (3.2%) |
| 60 to 64 Years | 63 (4.7%) | 67 (6.9%) |
| 65 to 69 Years | 45 (3.3%) | 93 (9.6%) |
| 70 to 74 Years | 62 (4.6%) | 37 (3.8%) |
| 75 to 79 Years | 47 (3.5%) | 20 (2.1%) |
| 80 to 84 Years | 4 (0.3%) | 30 (3.1%) |
| 85 Years and over | 24 (1.8%) | 105 (10.8%) |
| Total | 1,348 (100.0%) | 971 (100.0%) |
Families and Households in Vienna
Median Family Size in Vienna
The median family size in Vienna is 4.65 persons per family, with married-couple families (232 | 61.5%) accounting for the largest median family size of 4.84 persons per family. On the other hand, single male/father families (43 | 11.4%) represent the smallest median family size with 3.81 persons per family.
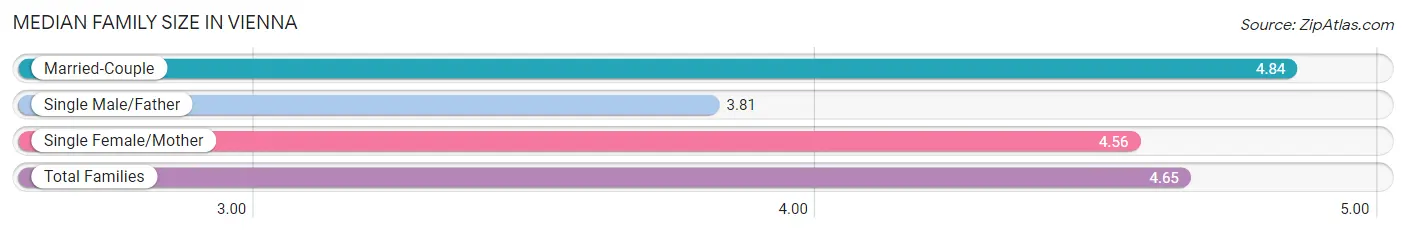
| Family Type | # Families | Family Size |
| Married-Couple | 232 (61.5%) | 4.84 |
| Single Male/Father | 43 (11.4%) | 3.81 |
| Single Female/Mother | 102 (27.1%) | 4.56 |
| Total Families | 377 (100.0%) | 4.65 |
Median Household Size in Vienna
The median household size in Vienna is 3.41 persons per household, with married-couple households (232 | 35.0%) accounting for the largest median household size of 5.18 persons per household. non-family households (285 | 43.0%) represent the smallest median household size with 1.29 persons per household.
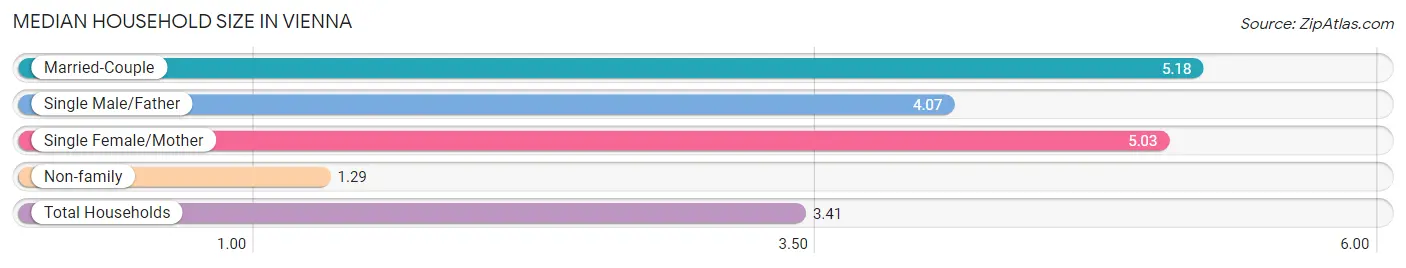
| Household Type | # Households | Household Size |
| Married-Couple | 232 (35.0%) | 5.18 |
| Single Male/Father | 43 (6.5%) | 4.07 |
| Single Female/Mother | 102 (15.4%) | 5.03 |
| Non-family | 285 (43.0%) | 1.29 |
| Total Households | 662 (100.0%) | 3.41 |
Household Size by Marriage Status in Vienna
Out of a total of 662 households in Vienna, 377 (57.0%) are family households, while 285 (43.0%) are nonfamily households. The most numerous type of family households are 2-person households, comprising 209, and the most common type of nonfamily households are 1-person households, comprising 222.
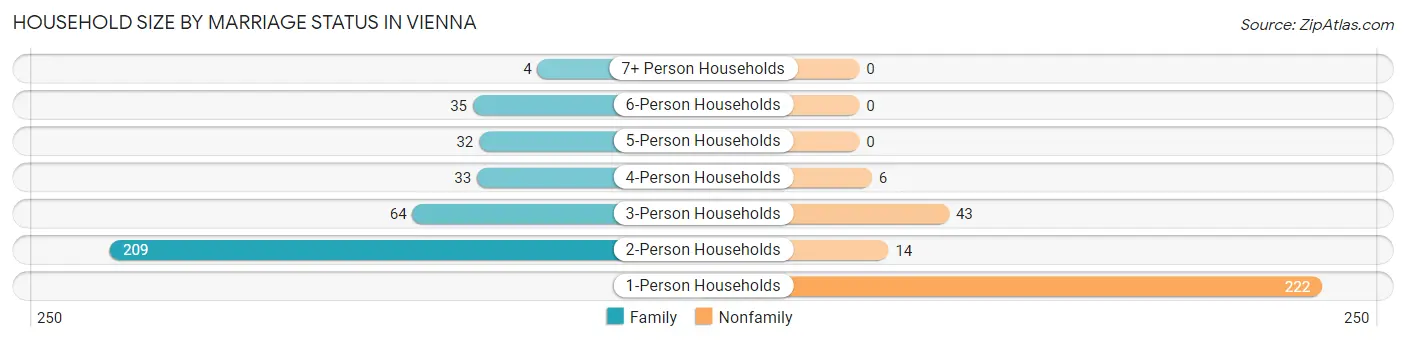
| Household Size | Family Households | Nonfamily Households |
| 1-Person Households | - | 222 (33.5%) |
| 2-Person Households | 209 (31.6%) | 14 (2.1%) |
| 3-Person Households | 64 (9.7%) | 43 (6.5%) |
| 4-Person Households | 33 (5.0%) | 6 (0.9%) |
| 5-Person Households | 32 (4.8%) | 0 (0.0%) |
| 6-Person Households | 35 (5.3%) | 0 (0.0%) |
| 7+ Person Households | 4 (0.6%) | 0 (0.0%) |
| Total | 377 (57.0%) | 285 (43.0%) |
Female Fertility in Vienna
Fertility by Age in Vienna
Average fertility rate in Vienna is 14.0 births per 1,000 women. Women in the age bracket of 35 to 50 years have the highest fertility rate with 16.0 births per 1,000 women. Women in the age bracket of 20 to 34 years acount for 50.0% of all women with births.
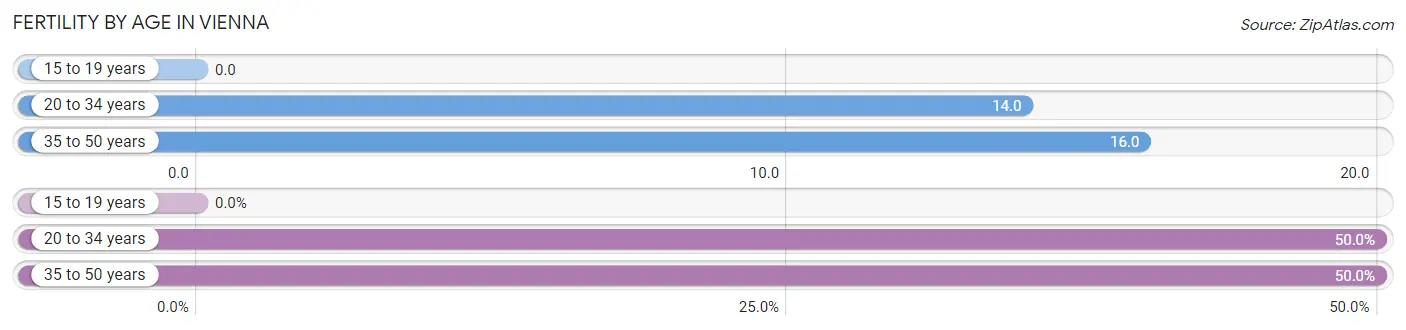
| Age Bracket | Women with Births | Births / 1,000 Women |
| 15 to 19 years | 0 (0.0%) | 0.0 |
| 20 to 34 years | 2 (50.0%) | 14.0 |
| 35 to 50 years | 2 (50.0%) | 16.0 |
| Total | 4 (100.0%) | 14.0 |
Fertility by Age by Marriage Status in Vienna
50.0% of women with births (4) in Vienna are married. The highest percentage of unmarried women with births falls into 35 to 50 years age bracket with 100.0% of them unmarried at the time of birth, while the lowest percentage of unmarried women with births belong to 20 to 34 years age bracket with 0.0% of them unmarried.
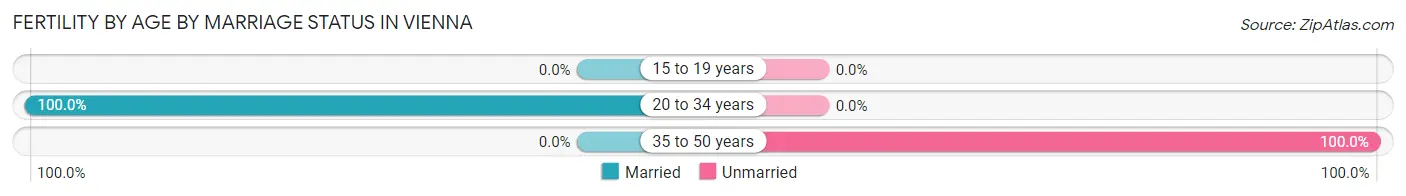
| Age Bracket | Married | Unmarried |
| 15 to 19 years | 0 (0.0%) | 0 (0.0%) |
| 20 to 34 years | 2 (100.0%) | 0 (0.0%) |
| 35 to 50 years | 0 (0.0%) | 2 (100.0%) |
| Total | 2 (50.0%) | 2 (50.0%) |
Fertility by Education in Vienna
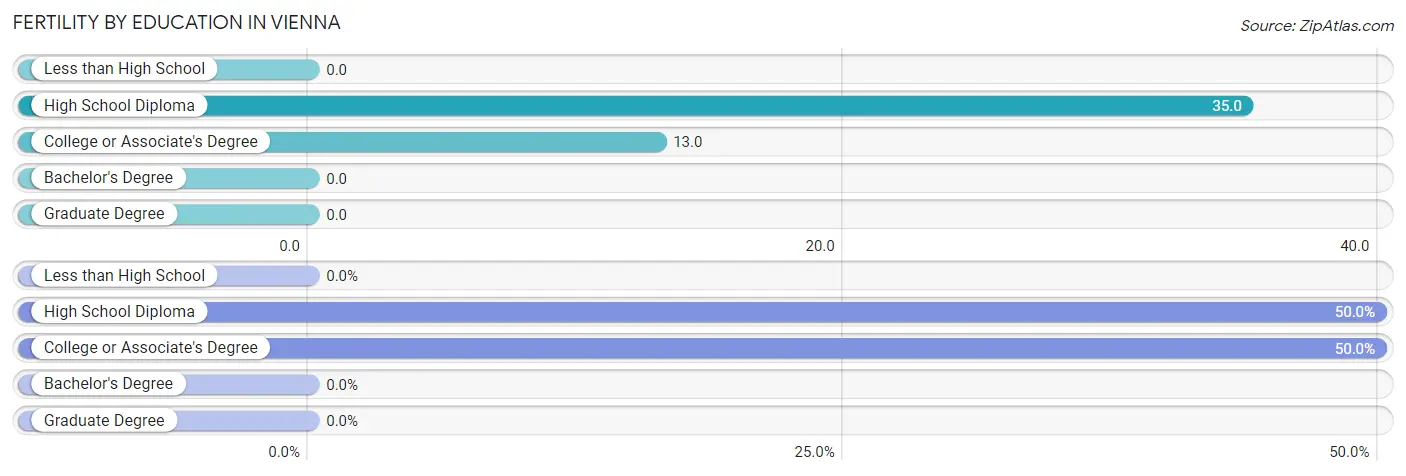
| Educational Attainment | Women with Births | Births / 1,000 Women |
| Less than High School | 0 (0.0%) | 0.0 |
| High School Diploma | 2 (50.0%) | 35.0 |
| College or Associate's Degree | 2 (50.0%) | 13.0 |
| Bachelor's Degree | 0 (0.0%) | 0.0 |
| Graduate Degree | 0 (0.0%) | 0.0 |
| Total | 4 (100.0%) | 14.0 |
Fertility by Education by Marriage Status in Vienna
50.0% of women with births in Vienna are unmarried. Women with the educational attainment of college or associate's degree are most likely to be married with 100.0% of them married at childbirth, while women with the educational attainment of high school diploma are least likely to be married with 100.0% of them unmarried at childbirth.
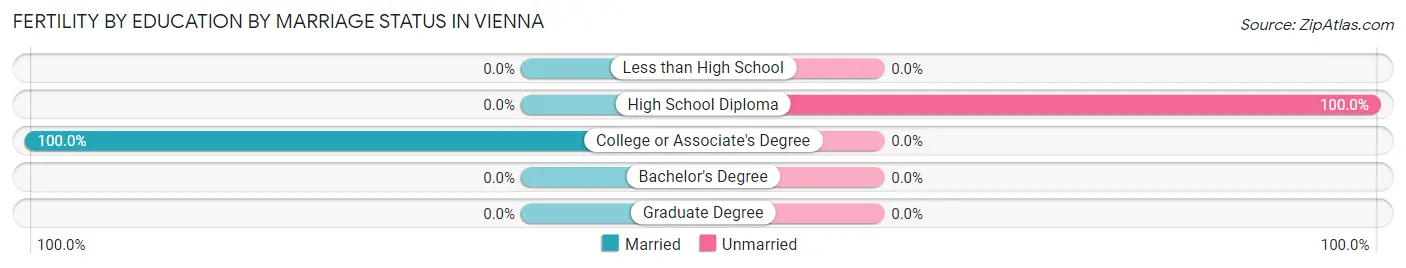
| Educational Attainment | Married | Unmarried |
| Less than High School | 0 (0.0%) | 0 (0.0%) |
| High School Diploma | 0 (0.0%) | 2 (100.0%) |
| College or Associate's Degree | 2 (100.0%) | 0 (0.0%) |
| Bachelor's Degree | 0 (0.0%) | 0 (0.0%) |
| Graduate Degree | 0 (0.0%) | 0 (0.0%) |
| Total | 2 (50.0%) | 2 (50.0%) |
Employment Characteristics in Vienna
Employment by Class of Employer in Vienna
Among the 802 employed individuals in Vienna, private company employees (562 | 70.1%), state government employees (128 | 16.0%), and local government employees (41 | 5.1%) make up the most common classes of employment.
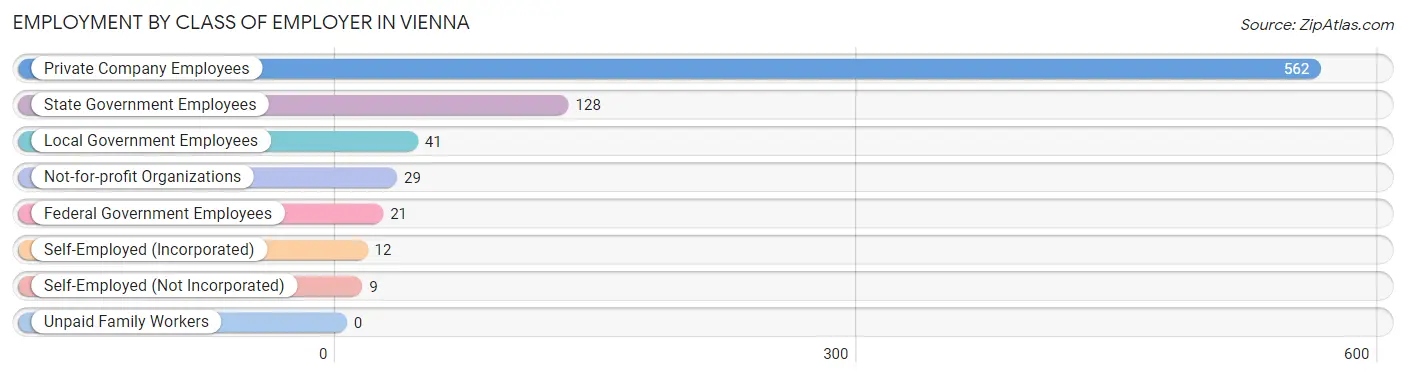
| Employer Class | # Employees | % Employees |
| Private Company Employees | 562 | 70.1% |
| Self-Employed (Incorporated) | 12 | 1.5% |
| Self-Employed (Not Incorporated) | 9 | 1.1% |
| Not-for-profit Organizations | 29 | 3.6% |
| Local Government Employees | 41 | 5.1% |
| State Government Employees | 128 | 16.0% |
| Federal Government Employees | 21 | 2.6% |
| Unpaid Family Workers | 0 | 0.0% |
| Total | 802 | 100.0% |
Employment Status by Age in Vienna
According to the labor force statistics for Vienna, out of the total population over 16 years of age (1,616), 51.2% or 827 individuals are in the labor force, with 2.4% or 20 of them unemployed. The age group with the highest labor force participation rate is 35 to 44 years, with 90.6% or 213 individuals in the labor force. Within the labor force, the 60 to 64 years age range has the highest percentage of unemployed individuals, with 20.8% or 11 of them being unemployed.
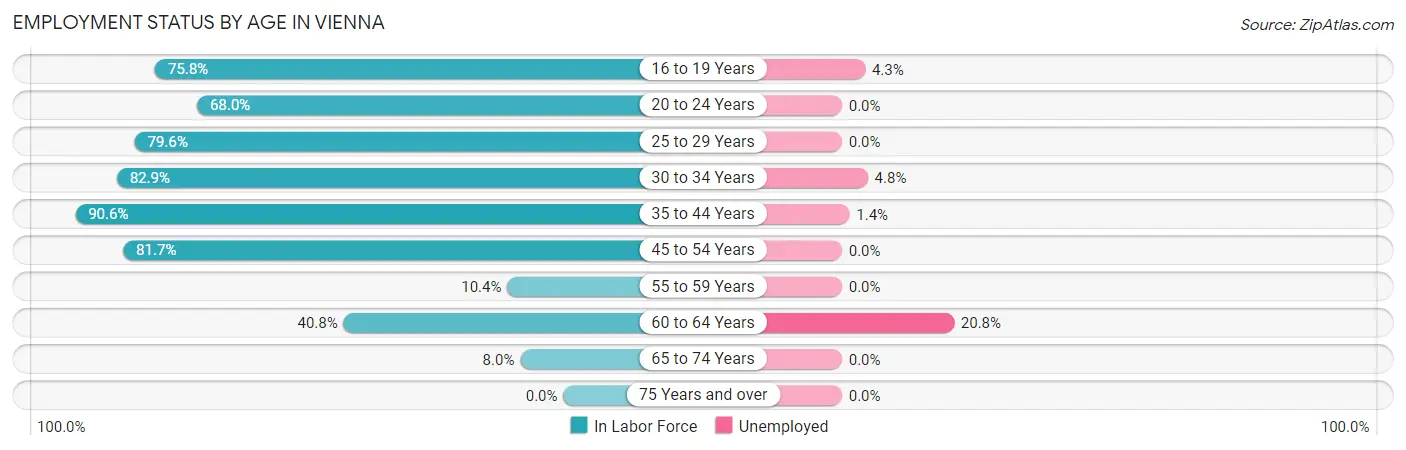
| Age Bracket | In Labor Force | Unemployed |
| 16 to 19 Years | 69 (75.8%) | 3 (4.3%) |
| 20 to 24 Years | 102 (68.0%) | 0 (0.0%) |
| 25 to 29 Years | 156 (79.6%) | 0 (0.0%) |
| 30 to 34 Years | 63 (82.9%) | 3 (4.8%) |
| 35 to 44 Years | 213 (90.6%) | 3 (1.4%) |
| 45 to 54 Years | 143 (81.7%) | 0 (0.0%) |
| 55 to 59 Years | 10 (10.4%) | 0 (0.0%) |
| 60 to 64 Years | 53 (40.8%) | 11 (20.8%) |
| 65 to 74 Years | 19 (8.0%) | 0 (0.0%) |
| 75 Years and over | 0 (0.0%) | 0 (0.0%) |
| Total | 827 (51.2%) | 20 (2.4%) |
Employment Status by Educational Attainment in Vienna
According to labor force statistics for Vienna, 70.3% of individuals (638) out of the total population between 25 and 64 years of age (908) are in the labor force, with 2.7% or 17 of them being unemployed. The group with the highest labor force participation rate are those with the educational attainment of bachelor's degree or higher, with 88.9% or 136 individuals in the labor force. Within the labor force, individuals with less than high school education have the highest percentage of unemployment, with 21.4% or 3 of them being unemployed.
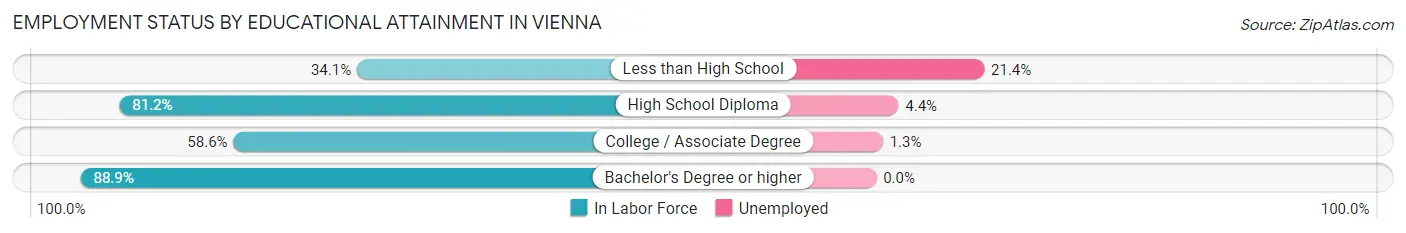
| Educational Attainment | In Labor Force | Unemployed |
| Less than High School | 14 (34.1%) | 9 (21.4%) |
| High School Diploma | 250 (81.2%) | 14 (4.4%) |
| College / Associate Degree | 238 (58.6%) | 5 (1.3%) |
| Bachelor's Degree or higher | 136 (88.9%) | 0 (0.0%) |
| Total | 638 (70.3%) | 25 (2.7%) |
Employment Occupations by Sex in Vienna
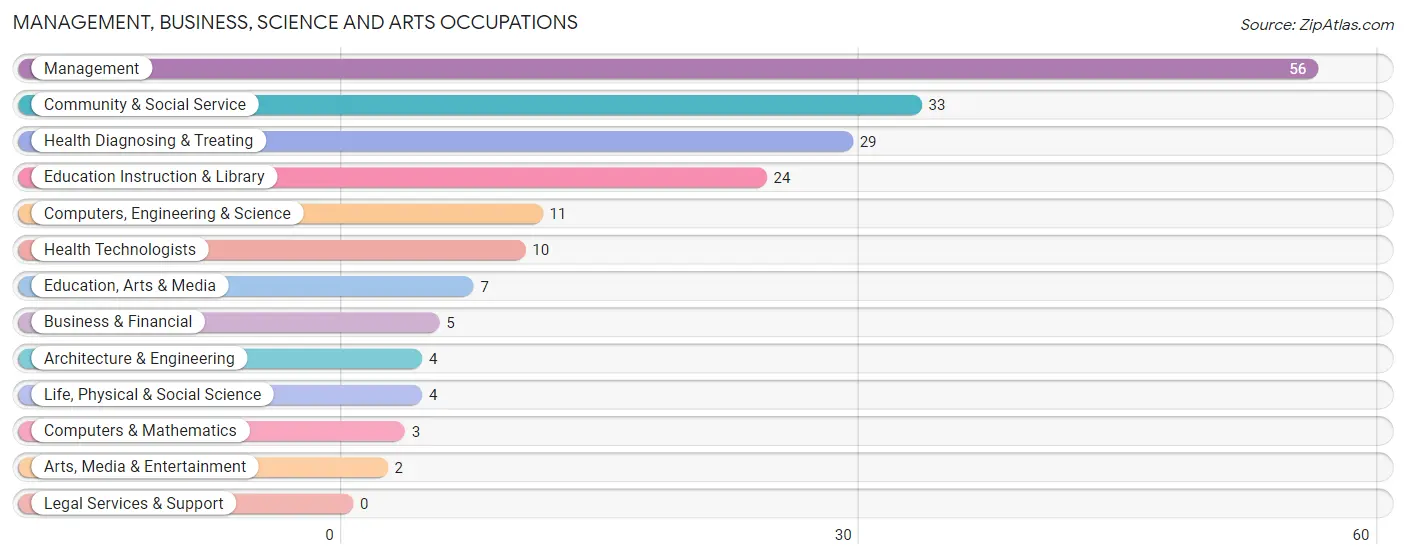
Management, Business, Science and Arts Occupations
The most common Management, Business, Science and Arts occupations in Vienna are Management (56 | 6.9%), Community & Social Service (33 | 4.1%), Health Diagnosing & Treating (29 | 3.6%), Education Instruction & Library (24 | 3.0%), and Computers, Engineering & Science (11 | 1.4%).
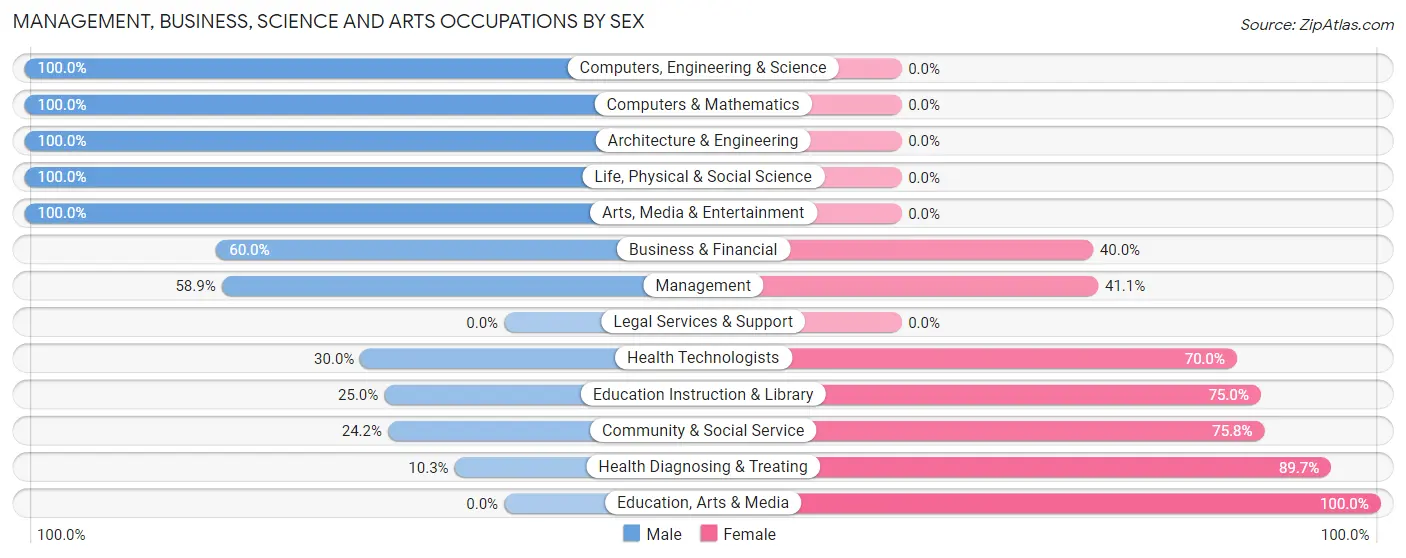
Management, Business, Science and Arts Occupations by Sex
Within the Management, Business, Science and Arts occupations in Vienna, the most male-oriented occupations are Computers, Engineering & Science (100.0%), Computers & Mathematics (100.0%), and Architecture & Engineering (100.0%), while the most female-oriented occupations are Education, Arts & Media (100.0%), Health Diagnosing & Treating (89.7%), and Community & Social Service (75.8%).
| Occupation | Male | Female |
| Management | 33 (58.9%) | 23 (41.1%) |
| Business & Financial | 3 (60.0%) | 2 (40.0%) |
| Computers, Engineering & Science | 11 (100.0%) | 0 (0.0%) |
| Computers & Mathematics | 3 (100.0%) | 0 (0.0%) |
| Architecture & Engineering | 4 (100.0%) | 0 (0.0%) |
| Life, Physical & Social Science | 4 (100.0%) | 0 (0.0%) |
| Community & Social Service | 8 (24.2%) | 25 (75.8%) |
| Education, Arts & Media | 0 (0.0%) | 7 (100.0%) |
| Legal Services & Support | 0 (0.0%) | 0 (0.0%) |
| Education Instruction & Library | 6 (25.0%) | 18 (75.0%) |
| Arts, Media & Entertainment | 2 (100.0%) | 0 (0.0%) |
| Health Diagnosing & Treating | 3 (10.3%) | 26 (89.7%) |
| Health Technologists | 3 (30.0%) | 7 (70.0%) |
| Total (Category) | 58 (43.3%) | 76 (56.7%) |
| Total (Overall) | 496 (61.4%) | 312 (38.6%) |
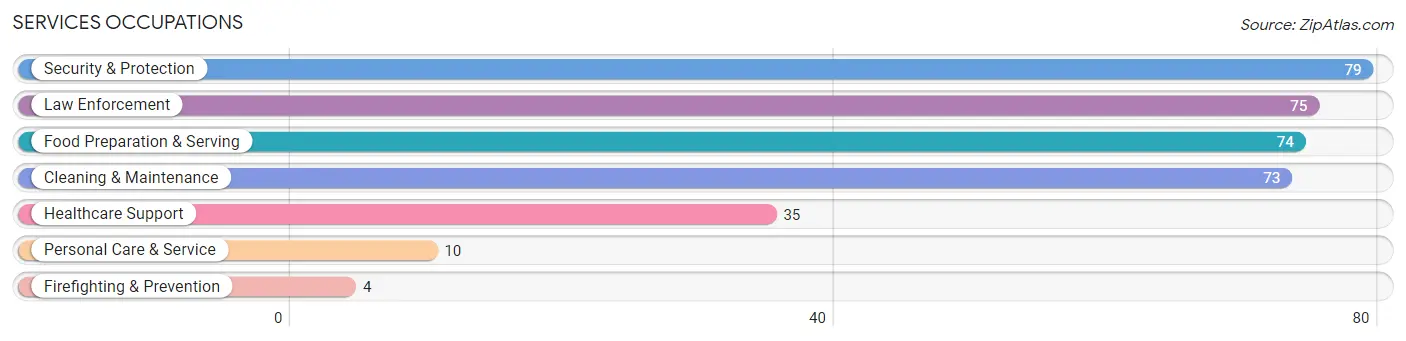
Services Occupations
The most common Services occupations in Vienna are Security & Protection (79 | 9.8%), Law Enforcement (75 | 9.3%), Food Preparation & Serving (74 | 9.2%), Cleaning & Maintenance (73 | 9.0%), and Healthcare Support (35 | 4.3%).
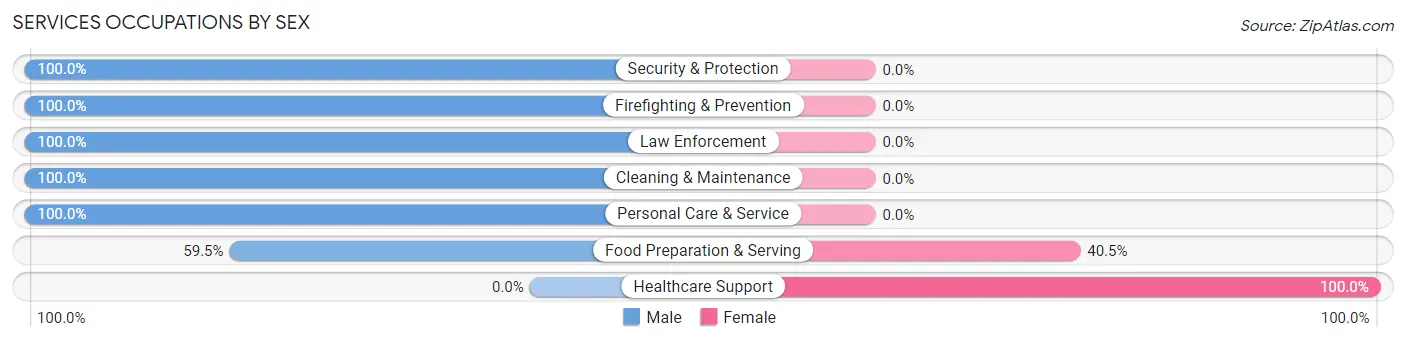
Services Occupations by Sex
Within the Services occupations in Vienna, the most male-oriented occupations are Security & Protection (100.0%), Firefighting & Prevention (100.0%), and Law Enforcement (100.0%), while the most female-oriented occupations are Healthcare Support (100.0%), and Food Preparation & Serving (40.5%).
| Occupation | Male | Female |
| Healthcare Support | 0 (0.0%) | 35 (100.0%) |
| Security & Protection | 79 (100.0%) | 0 (0.0%) |
| Firefighting & Prevention | 4 (100.0%) | 0 (0.0%) |
| Law Enforcement | 75 (100.0%) | 0 (0.0%) |
| Food Preparation & Serving | 44 (59.5%) | 30 (40.5%) |
| Cleaning & Maintenance | 73 (100.0%) | 0 (0.0%) |
| Personal Care & Service | 10 (100.0%) | 0 (0.0%) |
| Total (Category) | 206 (76.0%) | 65 (24.0%) |
| Total (Overall) | 496 (61.4%) | 312 (38.6%) |
Sales and Office Occupations
The most common Sales and Office occupations in Vienna are Office & Administration (139 | 17.2%), and Sales & Related (15 | 1.9%).
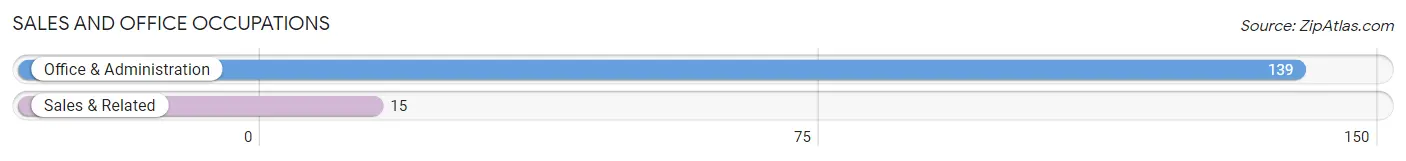
Sales and Office Occupations by Sex
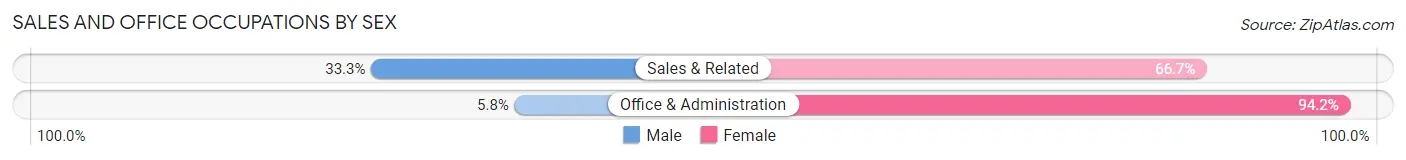
| Occupation | Male | Female |
| Sales & Related | 5 (33.3%) | 10 (66.7%) |
| Office & Administration | 8 (5.8%) | 131 (94.2%) |
| Total (Category) | 13 (8.4%) | 141 (91.6%) |
| Total (Overall) | 496 (61.4%) | 312 (38.6%) |
Natural Resources, Construction and Maintenance Occupations
The most common Natural Resources, Construction and Maintenance occupations in Vienna are Installation, Maintenance & Repair (109 | 13.5%), and Construction & Extraction (18 | 2.2%).
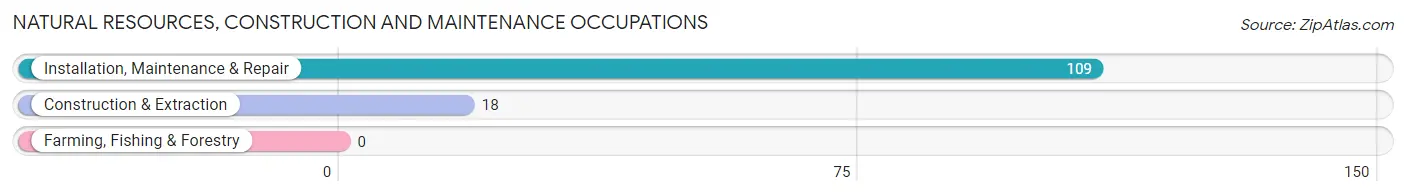
Natural Resources, Construction and Maintenance Occupations by Sex
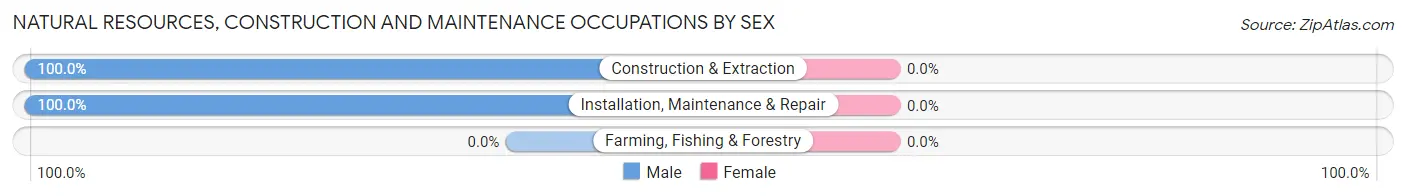
| Occupation | Male | Female |
| Farming, Fishing & Forestry | 0 (0.0%) | 0 (0.0%) |
| Construction & Extraction | 18 (100.0%) | 0 (0.0%) |
| Installation, Maintenance & Repair | 109 (100.0%) | 0 (0.0%) |
| Total (Category) | 127 (100.0%) | 0 (0.0%) |
| Total (Overall) | 496 (61.4%) | 312 (38.6%) |
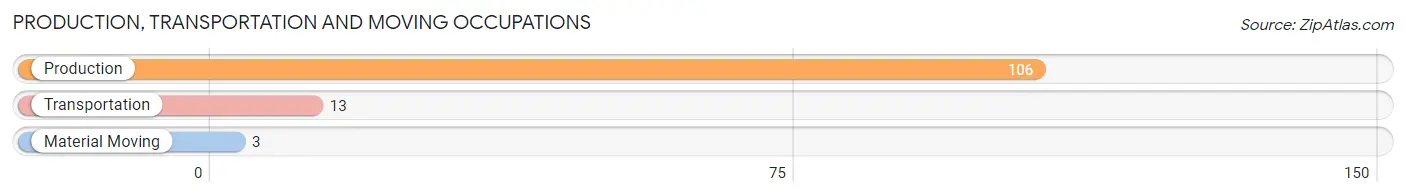
Production, Transportation and Moving Occupations
The most common Production, Transportation and Moving occupations in Vienna are Production (106 | 13.1%), Transportation (13 | 1.6%), and Material Moving (3 | 0.4%).
Production, Transportation and Moving Occupations by Sex
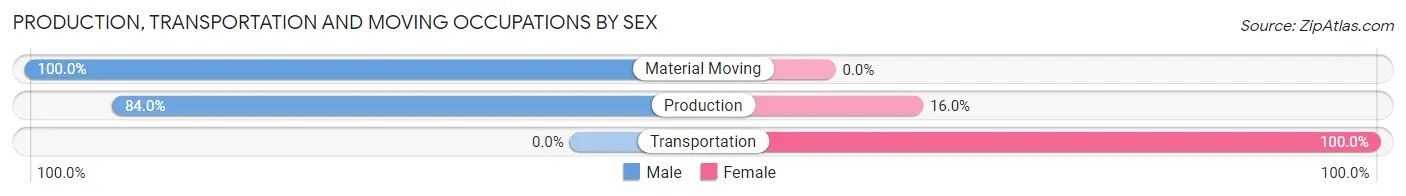
| Occupation | Male | Female |
| Production | 89 (84.0%) | 17 (16.0%) |
| Transportation | 0 (0.0%) | 13 (100.0%) |
| Material Moving | 3 (100.0%) | 0 (0.0%) |
| Total (Category) | 92 (75.4%) | 30 (24.6%) |
| Total (Overall) | 496 (61.4%) | 312 (38.6%) |
Employment Industries by Sex in Vienna
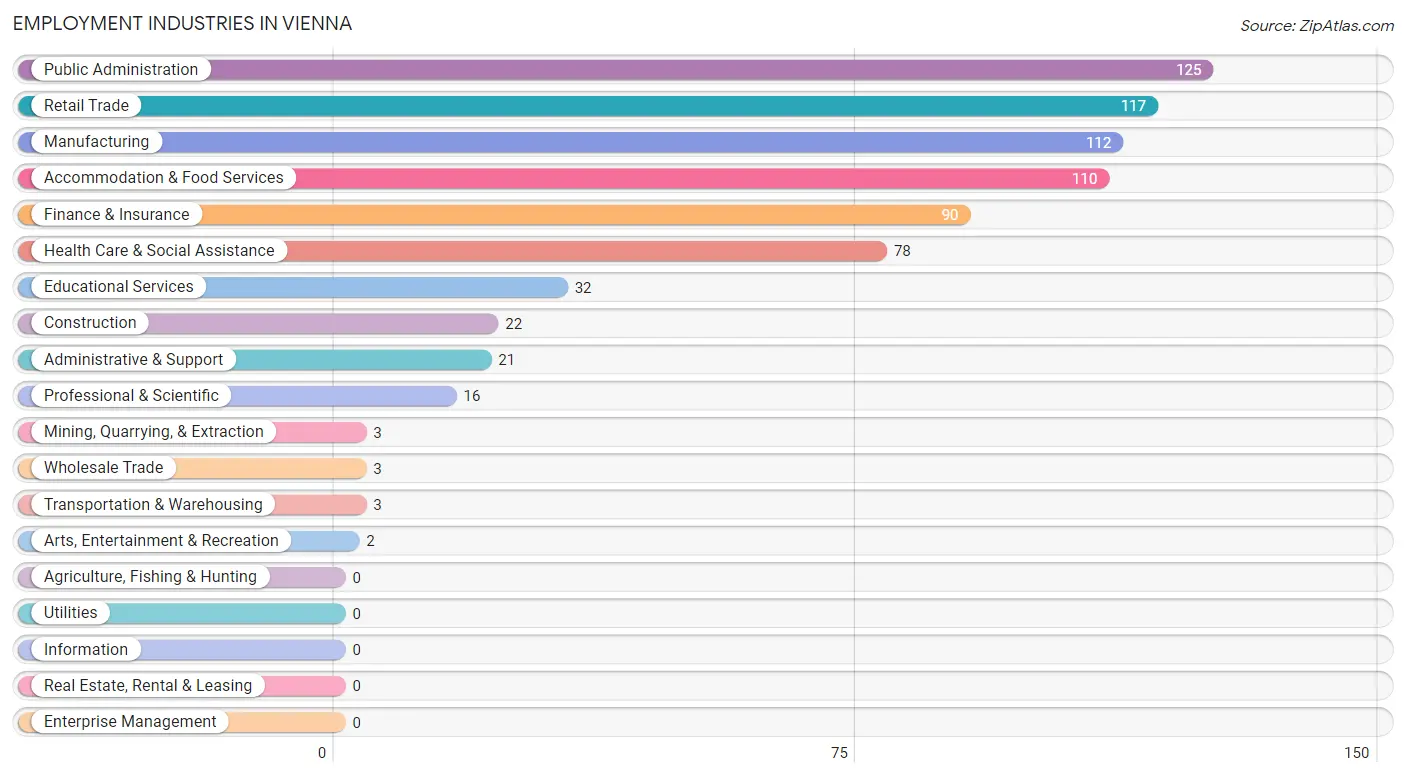
Employment Industries in Vienna
The major employment industries in Vienna include Public Administration (125 | 15.5%), Retail Trade (117 | 14.5%), Manufacturing (112 | 13.9%), Accommodation & Food Services (110 | 13.6%), and Finance & Insurance (90 | 11.1%).
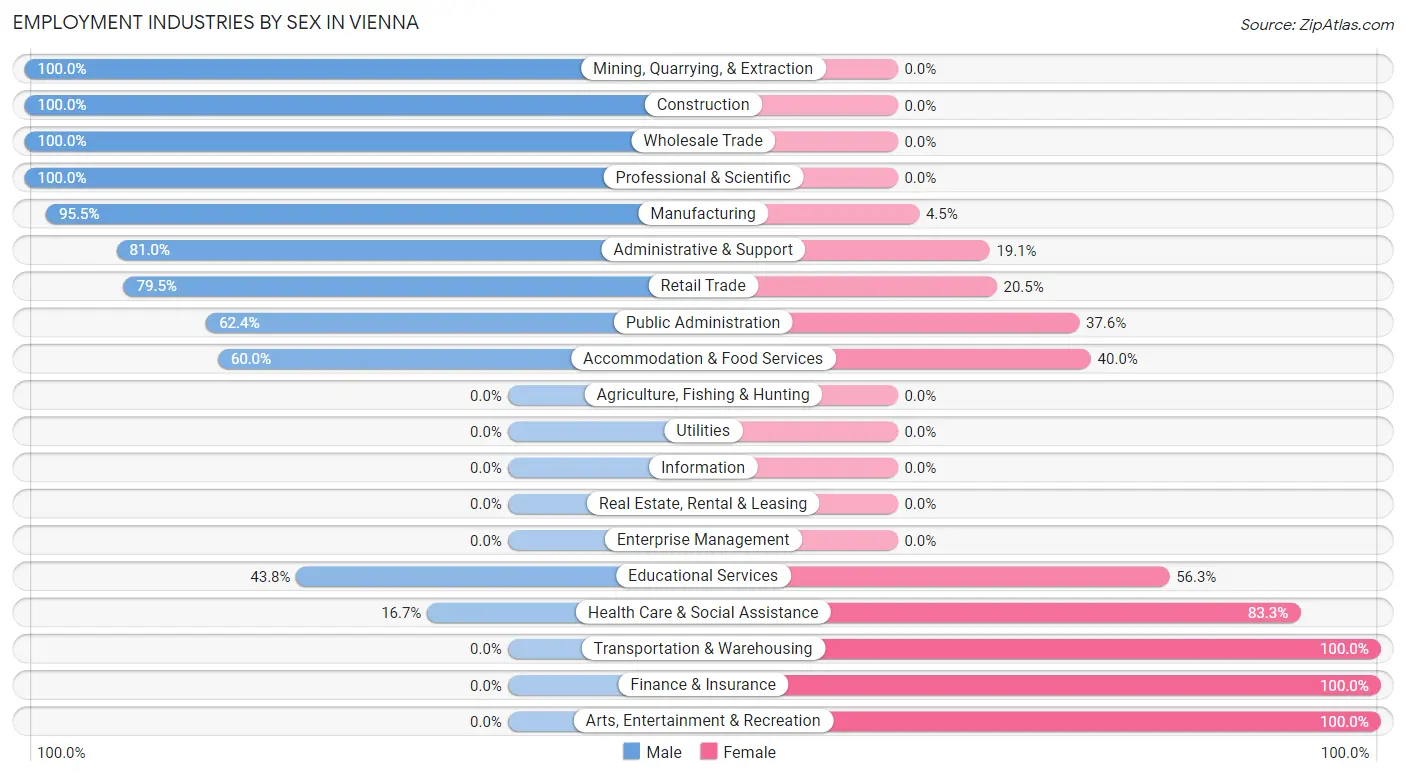
Employment Industries by Sex in Vienna
The Vienna industries that see more men than women are Mining, Quarrying, & Extraction (100.0%), Construction (100.0%), and Wholesale Trade (100.0%), whereas the industries that tend to have a higher number of women are Transportation & Warehousing (100.0%), Finance & Insurance (100.0%), and Arts, Entertainment & Recreation (100.0%).
| Industry | Male | Female |
| Agriculture, Fishing & Hunting | 0 (0.0%) | 0 (0.0%) |
| Mining, Quarrying, & Extraction | 3 (100.0%) | 0 (0.0%) |
| Construction | 22 (100.0%) | 0 (0.0%) |
| Manufacturing | 107 (95.5%) | 5 (4.5%) |
| Wholesale Trade | 3 (100.0%) | 0 (0.0%) |
| Retail Trade | 93 (79.5%) | 24 (20.5%) |
| Transportation & Warehousing | 0 (0.0%) | 3 (100.0%) |
| Utilities | 0 (0.0%) | 0 (0.0%) |
| Information | 0 (0.0%) | 0 (0.0%) |
| Finance & Insurance | 0 (0.0%) | 90 (100.0%) |
| Real Estate, Rental & Leasing | 0 (0.0%) | 0 (0.0%) |
| Professional & Scientific | 16 (100.0%) | 0 (0.0%) |
| Enterprise Management | 0 (0.0%) | 0 (0.0%) |
| Administrative & Support | 17 (80.9%) | 4 (19.1%) |
| Educational Services | 14 (43.8%) | 18 (56.2%) |
| Health Care & Social Assistance | 13 (16.7%) | 65 (83.3%) |
| Arts, Entertainment & Recreation | 0 (0.0%) | 2 (100.0%) |
| Accommodation & Food Services | 66 (60.0%) | 44 (40.0%) |
| Public Administration | 78 (62.4%) | 47 (37.6%) |
| Total | 496 (61.4%) | 312 (38.6%) |
Education in Vienna
School Enrollment in Vienna
The most common levels of schooling among the 706 students in Vienna are elementary school (300 | 42.5%), middle school (169 | 23.9%), and high school (87 | 12.3%).
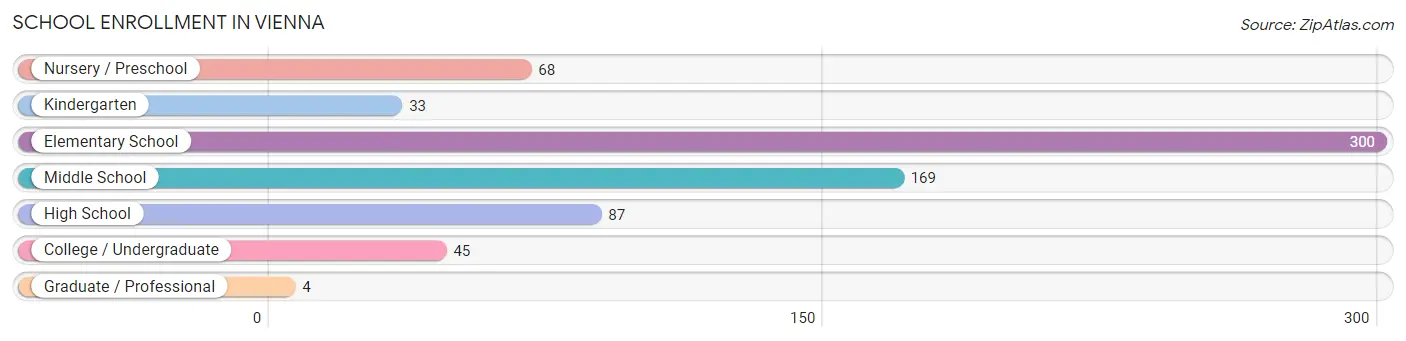
| School Level | # Students | % Students |
| Nursery / Preschool | 68 | 9.6% |
| Kindergarten | 33 | 4.7% |
| Elementary School | 300 | 42.5% |
| Middle School | 169 | 23.9% |
| High School | 87 | 12.3% |
| College / Undergraduate | 45 | 6.4% |
| Graduate / Professional | 4 | 0.6% |
| Total | 706 | 100.0% |
School Enrollment by Age by Funding Source in Vienna
Out of a total of 706 students who are enrolled in schools in Vienna, 4 (0.6%) attend a private institution, while the remaining 702 (99.4%) are enrolled in public schools. The age group of 5 to 9 year old has the highest likelihood of being enrolled in private schools, with 4 (1.9% in the age bracket) enrolled. Conversely, the age group of 3 to 4 year olds has the lowest likelihood of being enrolled in a private school, with 68 (100.0% in the age bracket) attending a public institution.
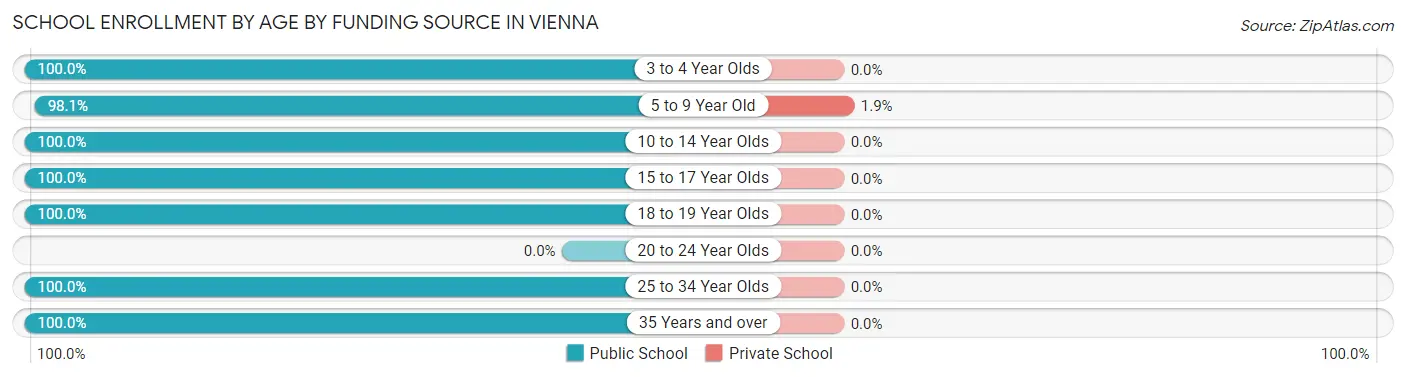
| Age Bracket | Public School | Private School |
| 3 to 4 Year Olds | 68 (100.0%) | 0 (0.0%) |
| 5 to 9 Year Old | 208 (98.1%) | 4 (1.9%) |
| 10 to 14 Year Olds | 331 (100.0%) | 0 (0.0%) |
| 15 to 17 Year Olds | 46 (100.0%) | 0 (0.0%) |
| 18 to 19 Year Olds | 6 (100.0%) | 0 (0.0%) |
| 20 to 24 Year Olds | 0 (0.0%) | 0 (0.0%) |
| 25 to 34 Year Olds | 37 (100.0%) | 0 (0.0%) |
| 35 Years and over | 6 (100.0%) | 0 (0.0%) |
| Total | 702 (99.4%) | 4 (0.6%) |
Educational Attainment by Field of Study in Vienna
Bio, nature & agricultural (95 | 42.6%), education (31 | 13.9%), business (25 | 11.2%), liberal arts & history (15 | 6.7%), and arts & humanities (10 | 4.5%) are the most common fields of study among 223 individuals in Vienna who have obtained a bachelor's degree or higher.
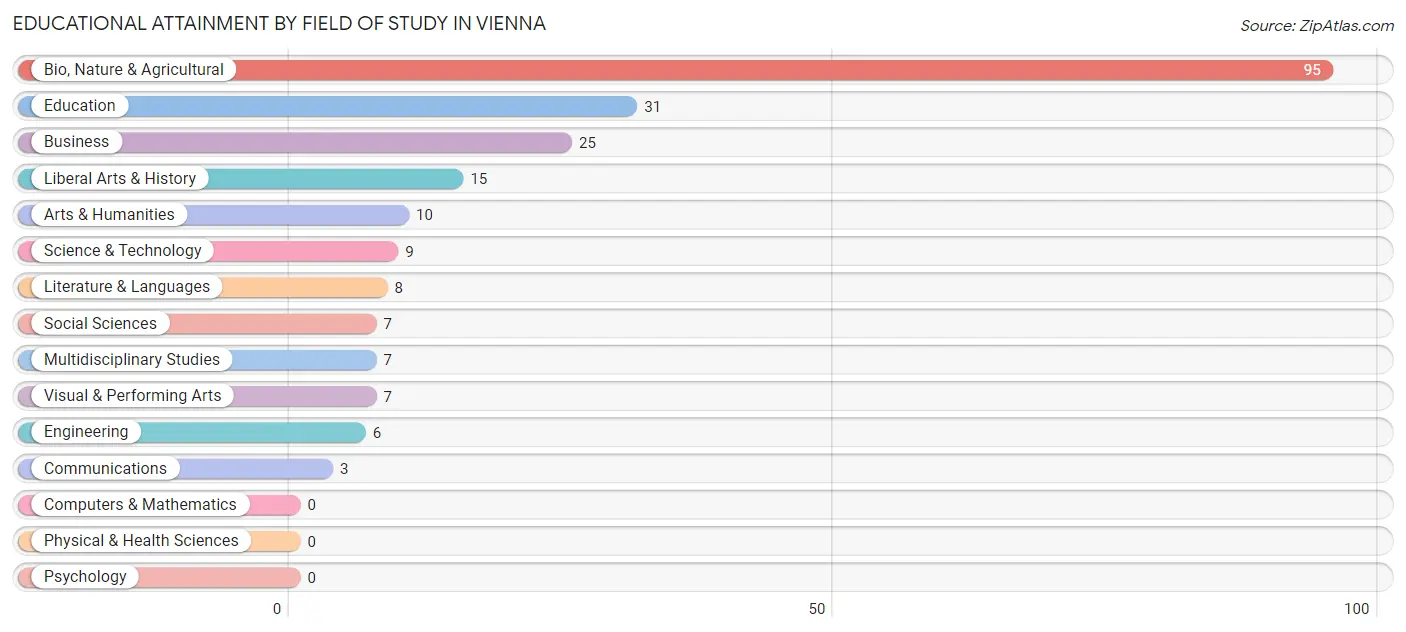
| Field of Study | # Graduates | % Graduates |
| Computers & Mathematics | 0 | 0.0% |
| Bio, Nature & Agricultural | 95 | 42.6% |
| Physical & Health Sciences | 0 | 0.0% |
| Psychology | 0 | 0.0% |
| Social Sciences | 7 | 3.1% |
| Engineering | 6 | 2.7% |
| Multidisciplinary Studies | 7 | 3.1% |
| Science & Technology | 9 | 4.0% |
| Business | 25 | 11.2% |
| Education | 31 | 13.9% |
| Literature & Languages | 8 | 3.6% |
| Liberal Arts & History | 15 | 6.7% |
| Visual & Performing Arts | 7 | 3.1% |
| Communications | 3 | 1.3% |
| Arts & Humanities | 10 | 4.5% |
| Total | 223 | 100.0% |
Transportation & Commute in Vienna
Vehicle Availability by Sex in Vienna
The most prevalent vehicle ownership categories in Vienna are males with 3 vehicles (267, accounting for 54.8%) and females with 3 vehicles (83, making up 86.1%).
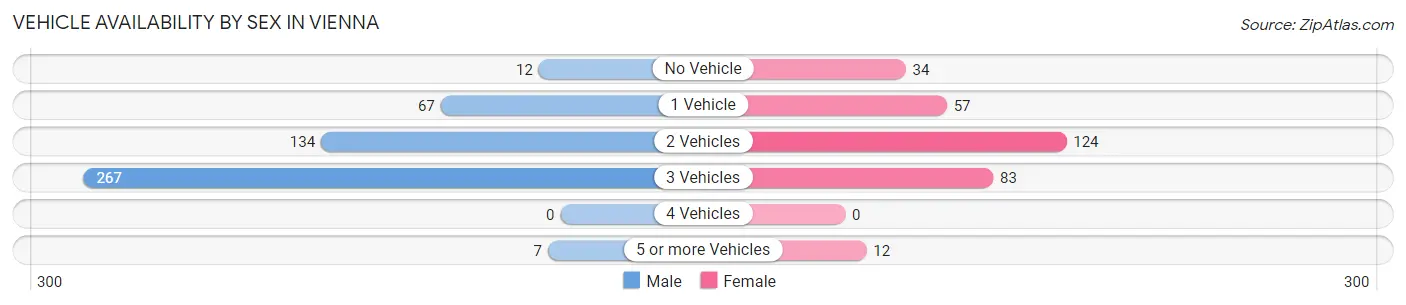
| Vehicles Available | Male | Female |
| No Vehicle | 12 (2.5%) | 34 (11.0%) |
| 1 Vehicle | 67 (13.8%) | 57 (18.4%) |
| 2 Vehicles | 134 (27.5%) | 124 (40.0%) |
| 3 Vehicles | 267 (54.8%) | 83 (26.8%) |
| 4 Vehicles | 0 (0.0%) | 0 (0.0%) |
| 5 or more Vehicles | 7 (1.4%) | 12 (3.9%) |
| Total | 487 (100.0%) | 310 (100.0%) |
Commute Time in Vienna
The most frequently occuring commute durations in Vienna are 30 to 34 minutes (235 commuters, 31.3%), 20 to 24 minutes (101 commuters, 13.5%), and 5 to 9 minutes (83 commuters, 11.1%).
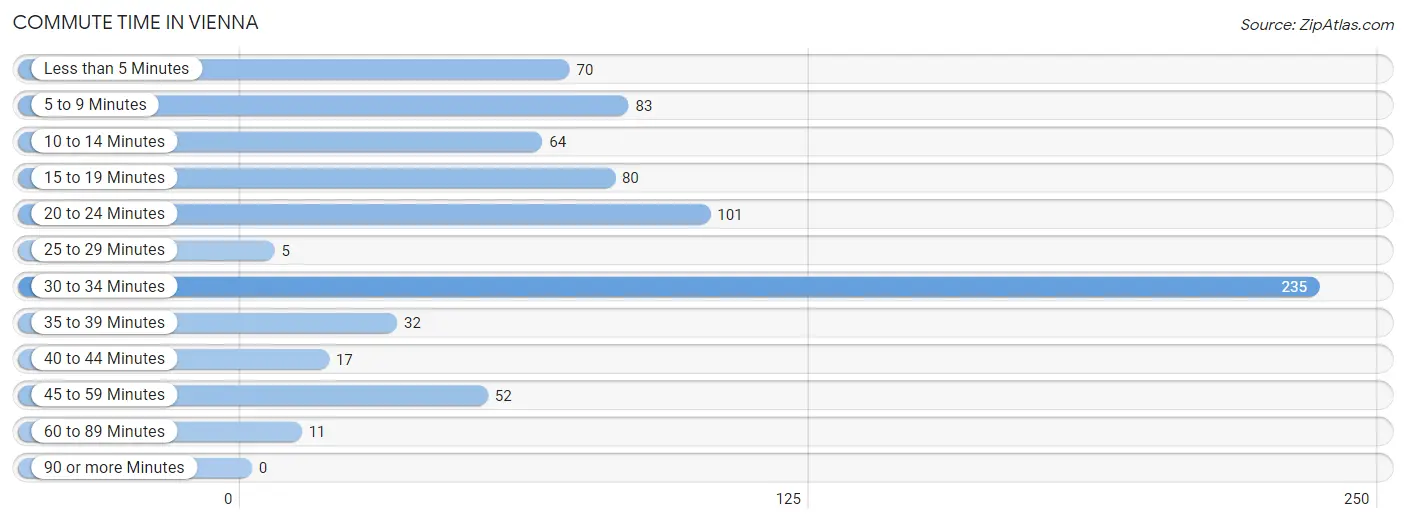
| Commute Time | # Commuters | % Commuters |
| Less than 5 Minutes | 70 | 9.3% |
| 5 to 9 Minutes | 83 | 11.1% |
| 10 to 14 Minutes | 64 | 8.5% |
| 15 to 19 Minutes | 80 | 10.7% |
| 20 to 24 Minutes | 101 | 13.5% |
| 25 to 29 Minutes | 5 | 0.7% |
| 30 to 34 Minutes | 235 | 31.3% |
| 35 to 39 Minutes | 32 | 4.3% |
| 40 to 44 Minutes | 17 | 2.3% |
| 45 to 59 Minutes | 52 | 6.9% |
| 60 to 89 Minutes | 11 | 1.5% |
| 90 or more Minutes | 0 | 0.0% |
Commute Time by Sex in Vienna
The most common commute times in Vienna are 30 to 34 minutes (158 commuters, 35.4%) for males and 30 to 34 minutes (77 commuters, 25.3%) for females.
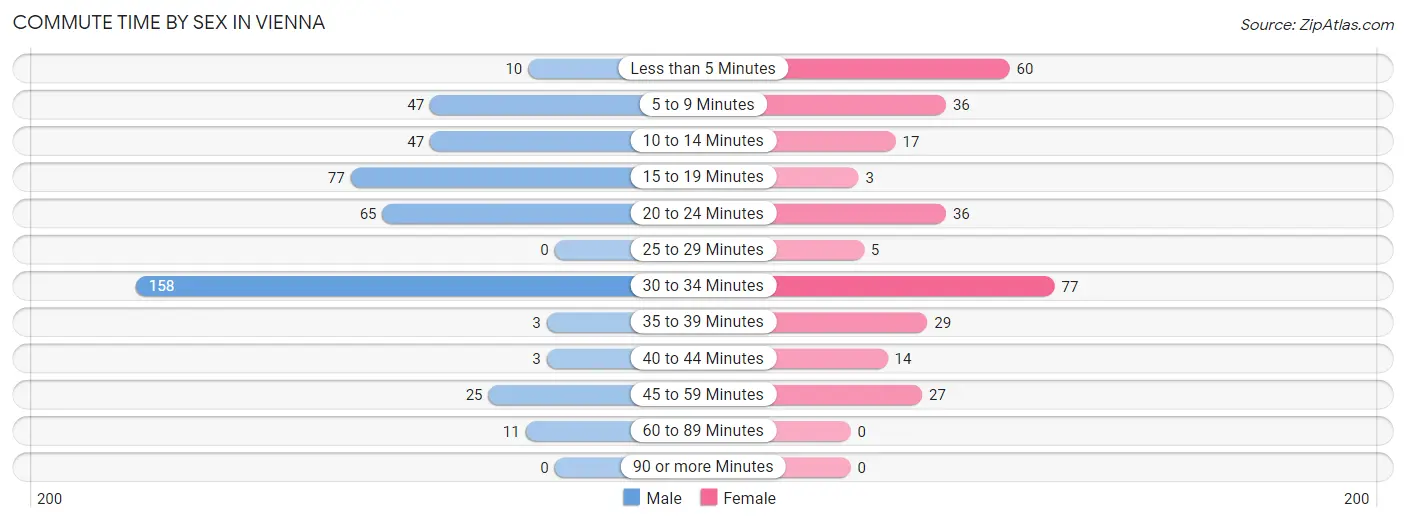
| Commute Time | Male | Female |
| Less than 5 Minutes | 10 (2.2%) | 60 (19.7%) |
| 5 to 9 Minutes | 47 (10.5%) | 36 (11.8%) |
| 10 to 14 Minutes | 47 (10.5%) | 17 (5.6%) |
| 15 to 19 Minutes | 77 (17.3%) | 3 (1.0%) |
| 20 to 24 Minutes | 65 (14.6%) | 36 (11.8%) |
| 25 to 29 Minutes | 0 (0.0%) | 5 (1.6%) |
| 30 to 34 Minutes | 158 (35.4%) | 77 (25.3%) |
| 35 to 39 Minutes | 3 (0.7%) | 29 (9.5%) |
| 40 to 44 Minutes | 3 (0.7%) | 14 (4.6%) |
| 45 to 59 Minutes | 25 (5.6%) | 27 (8.9%) |
| 60 to 89 Minutes | 11 (2.5%) | 0 (0.0%) |
| 90 or more Minutes | 0 (0.0%) | 0 (0.0%) |
Time of Departure to Work by Sex in Vienna
The most frequent times of departure to work in Vienna are 8:00 AM to 8:29 AM (135, 30.3%) for males and 7:30 AM to 7:59 AM (80, 26.3%) for females.
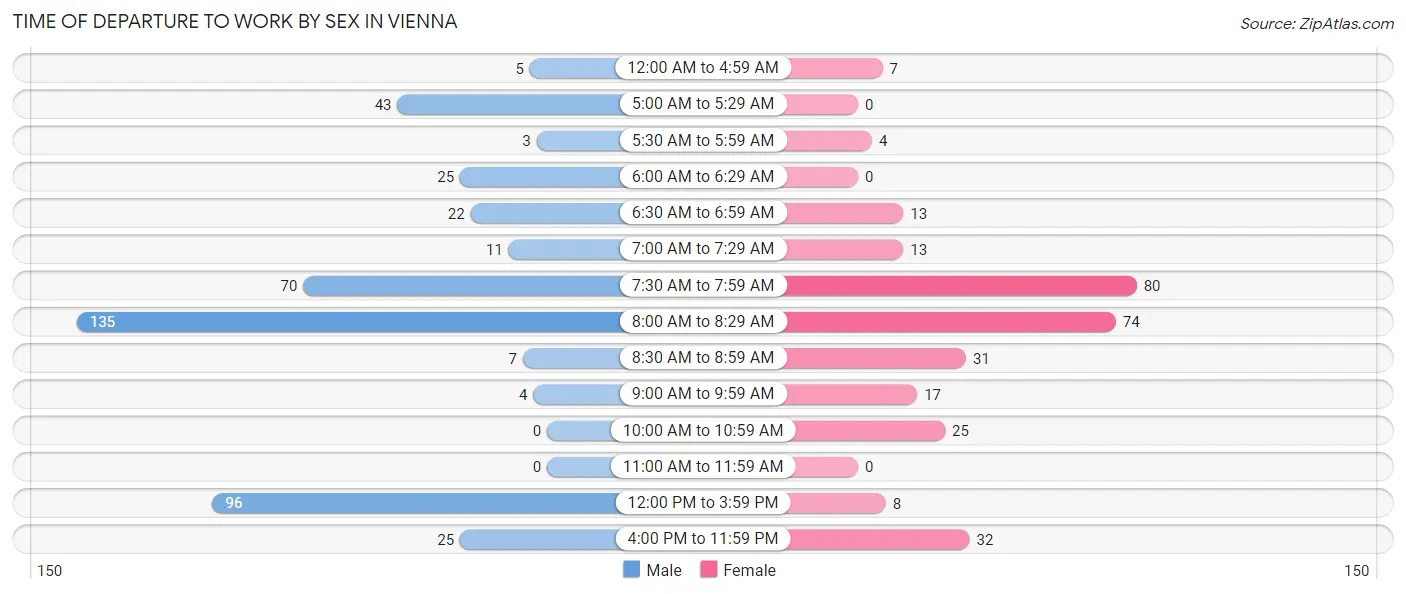
| Time of Departure | Male | Female |
| 12:00 AM to 4:59 AM | 5 (1.1%) | 7 (2.3%) |
| 5:00 AM to 5:29 AM | 43 (9.6%) | 0 (0.0%) |
| 5:30 AM to 5:59 AM | 3 (0.7%) | 4 (1.3%) |
| 6:00 AM to 6:29 AM | 25 (5.6%) | 0 (0.0%) |
| 6:30 AM to 6:59 AM | 22 (4.9%) | 13 (4.3%) |
| 7:00 AM to 7:29 AM | 11 (2.5%) | 13 (4.3%) |
| 7:30 AM to 7:59 AM | 70 (15.7%) | 80 (26.3%) |
| 8:00 AM to 8:29 AM | 135 (30.3%) | 74 (24.3%) |
| 8:30 AM to 8:59 AM | 7 (1.6%) | 31 (10.2%) |
| 9:00 AM to 9:59 AM | 4 (0.9%) | 17 (5.6%) |
| 10:00 AM to 10:59 AM | 0 (0.0%) | 25 (8.2%) |
| 11:00 AM to 11:59 AM | 0 (0.0%) | 0 (0.0%) |
| 12:00 PM to 3:59 PM | 96 (21.5%) | 8 (2.6%) |
| 4:00 PM to 11:59 PM | 25 (5.6%) | 32 (10.5%) |
| Total | 446 (100.0%) | 304 (100.0%) |
Housing Occupancy in Vienna
Occupancy by Ownership in Vienna
Of the total 662 dwellings in Vienna, owner-occupied units account for 404 (61.0%), while renter-occupied units make up 258 (39.0%).
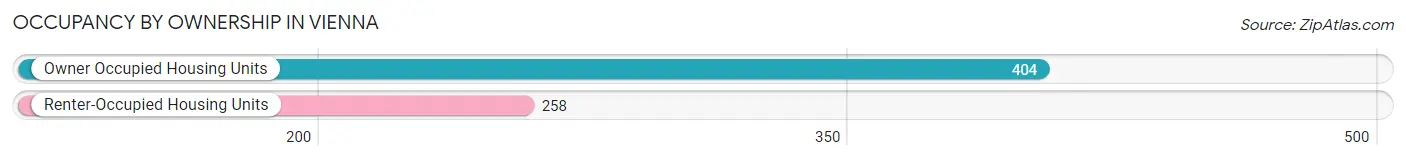
| Occupancy | # Housing Units | % Housing Units |
| Owner Occupied Housing Units | 404 | 61.0% |
| Renter-Occupied Housing Units | 258 | 39.0% |
| Total Occupied Housing Units | 662 | 100.0% |
Occupancy by Household Size in Vienna
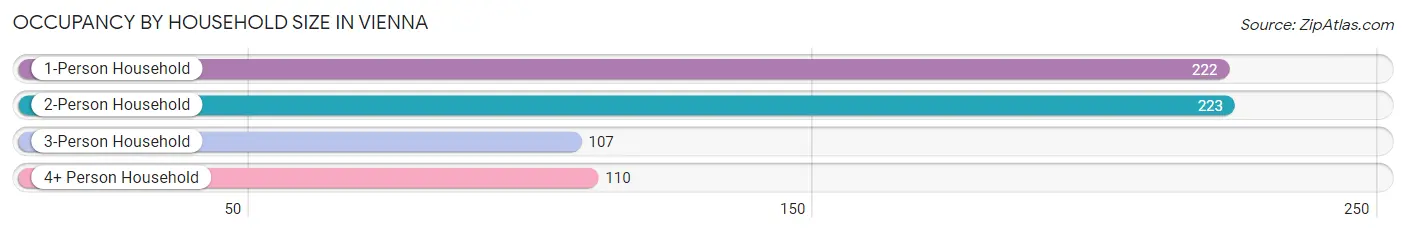
| Household Size | # Housing Units | % Housing Units |
| 1-Person Household | 222 | 33.5% |
| 2-Person Household | 223 | 33.7% |
| 3-Person Household | 107 | 16.2% |
| 4+ Person Household | 110 | 16.6% |
| Total Housing Units | 662 | 100.0% |
Occupancy by Ownership by Household Size in Vienna
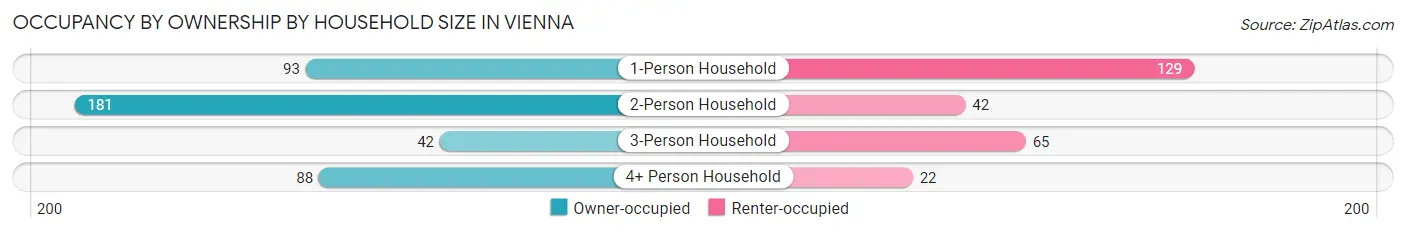
| Household Size | Owner-occupied | Renter-occupied |
| 1-Person Household | 93 (41.9%) | 129 (58.1%) |
| 2-Person Household | 181 (81.2%) | 42 (18.8%) |
| 3-Person Household | 42 (39.3%) | 65 (60.8%) |
| 4+ Person Household | 88 (80.0%) | 22 (20.0%) |
| Total Housing Units | 404 (61.0%) | 258 (39.0%) |
Occupancy by Educational Attainment in Vienna
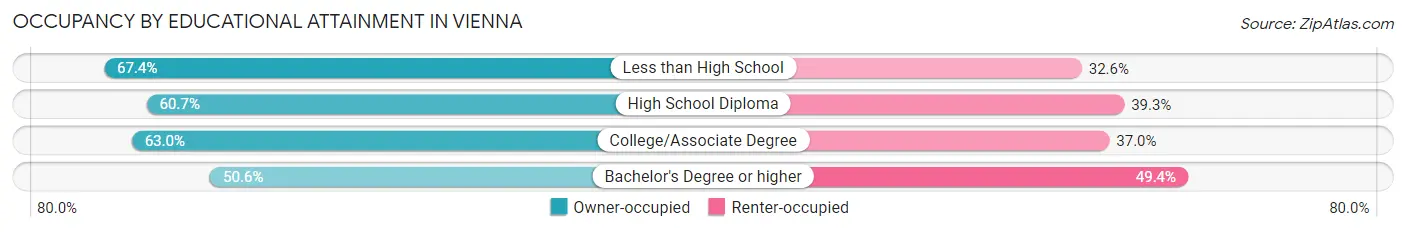
| Household Size | Owner-occupied | Renter-occupied |
| Less than High School | 31 (67.4%) | 15 (32.6%) |
| High School Diploma | 111 (60.7%) | 72 (39.3%) |
| College/Associate Degree | 218 (63.0%) | 128 (37.0%) |
| Bachelor's Degree or higher | 44 (50.6%) | 43 (49.4%) |
Occupancy by Age of Householder in Vienna
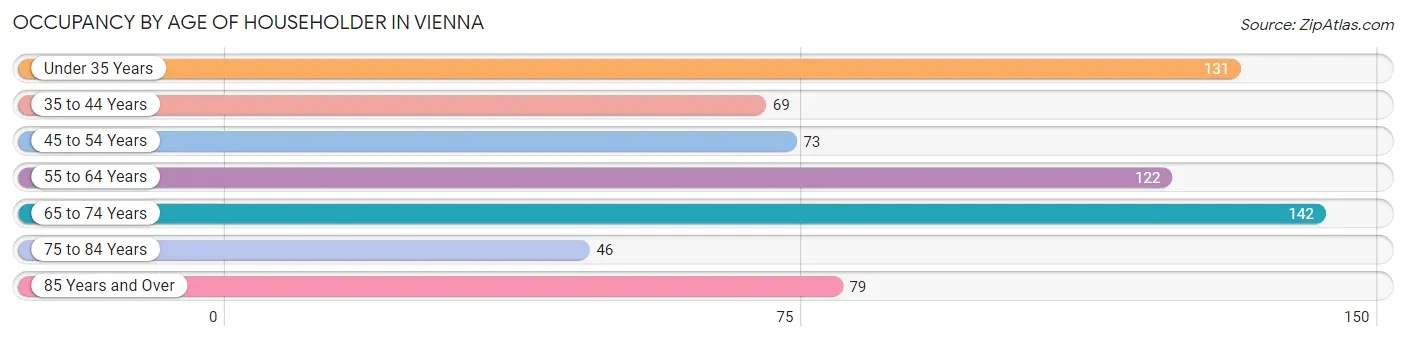
| Age Bracket | # Households | % Households |
| Under 35 Years | 131 | 19.8% |
| 35 to 44 Years | 69 | 10.4% |
| 45 to 54 Years | 73 | 11.0% |
| 55 to 64 Years | 122 | 18.4% |
| 65 to 74 Years | 142 | 21.4% |
| 75 to 84 Years | 46 | 7.0% |
| 85 Years and Over | 79 | 11.9% |
| Total | 662 | 100.0% |
Housing Finances in Vienna
Median Income by Occupancy in Vienna
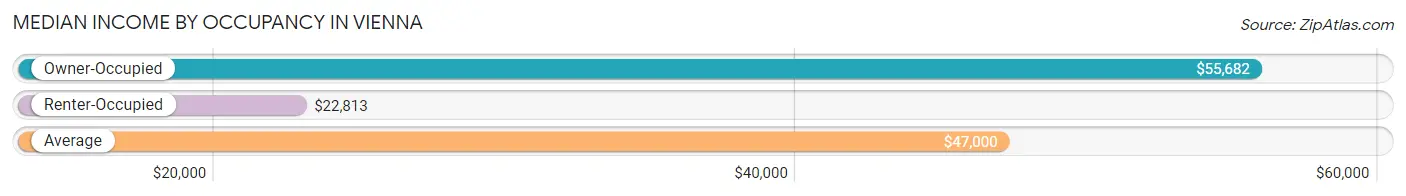
| Occupancy Type | # Households | Median Income |
| Owner-Occupied | 404 (61.0%) | $55,682 |
| Renter-Occupied | 258 (39.0%) | $22,813 |
| Average | 662 (100.0%) | $47,000 |
Occupancy by Householder Income Bracket in Vienna
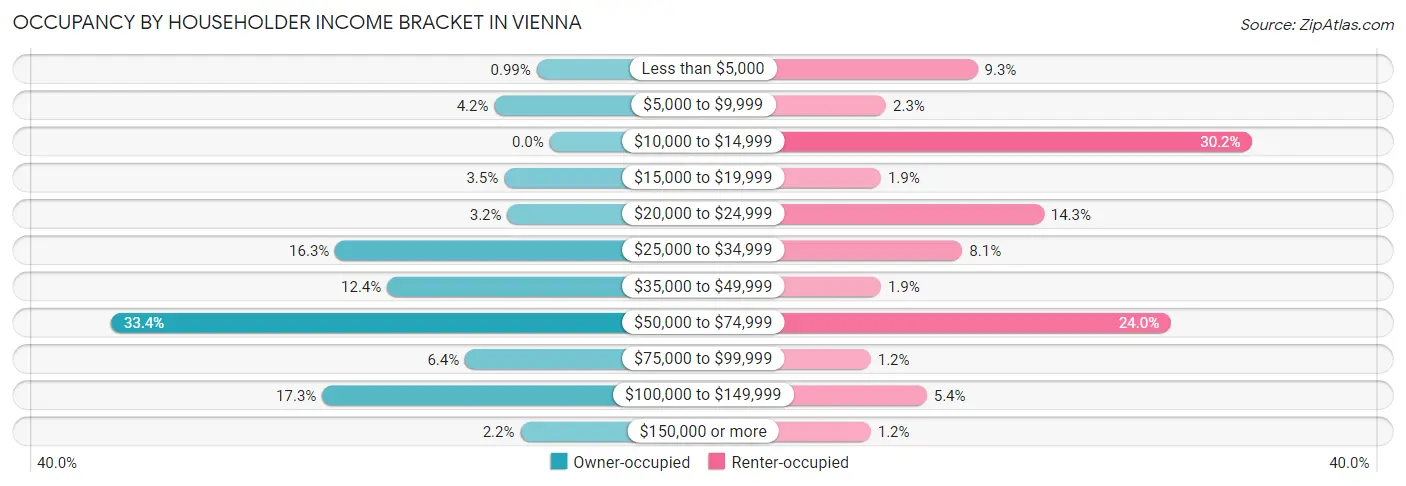
| Income Bracket | Owner-occupied | Renter-occupied |
| Less than $5,000 | 4 (1.0%) | 24 (9.3%) |
| $5,000 to $9,999 | 17 (4.2%) | 6 (2.3%) |
| $10,000 to $14,999 | 0 (0.0%) | 78 (30.2%) |
| $15,000 to $19,999 | 14 (3.5%) | 5 (1.9%) |
| $20,000 to $24,999 | 13 (3.2%) | 37 (14.3%) |
| $25,000 to $34,999 | 66 (16.3%) | 21 (8.1%) |
| $35,000 to $49,999 | 50 (12.4%) | 5 (1.9%) |
| $50,000 to $74,999 | 135 (33.4%) | 62 (24.0%) |
| $75,000 to $99,999 | 26 (6.4%) | 3 (1.2%) |
| $100,000 to $149,999 | 70 (17.3%) | 14 (5.4%) |
| $150,000 or more | 9 (2.2%) | 3 (1.2%) |
| Total | 404 (100.0%) | 258 (100.0%) |
Monthly Housing Cost Tiers in Vienna
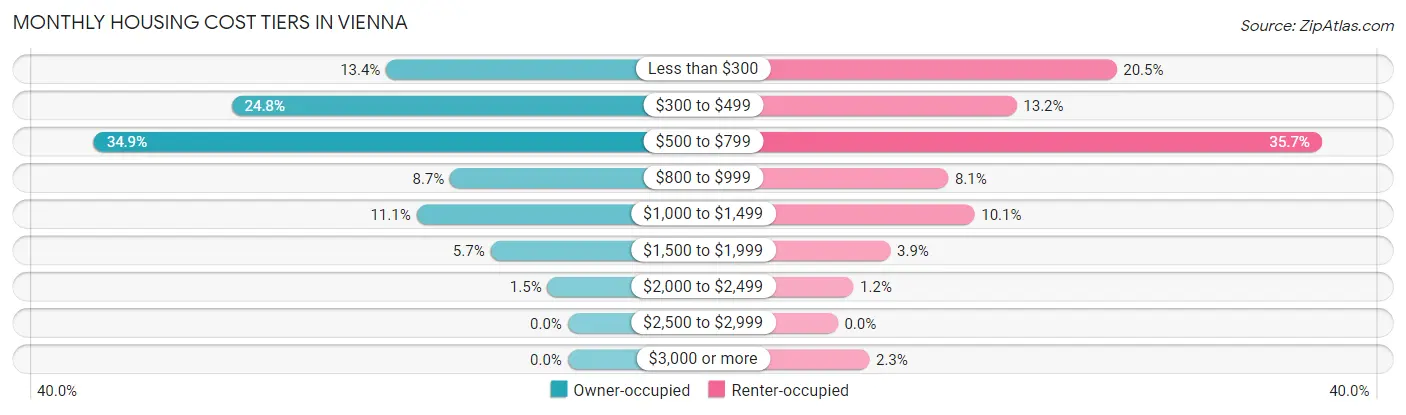
| Monthly Cost | Owner-occupied | Renter-occupied |
| Less than $300 | 54 (13.4%) | 53 (20.5%) |
| $300 to $499 | 100 (24.7%) | 34 (13.2%) |
| $500 to $799 | 141 (34.9%) | 92 (35.7%) |
| $800 to $999 | 35 (8.7%) | 21 (8.1%) |
| $1,000 to $1,499 | 45 (11.1%) | 26 (10.1%) |
| $1,500 to $1,999 | 23 (5.7%) | 10 (3.9%) |
| $2,000 to $2,499 | 6 (1.5%) | 3 (1.2%) |
| $2,500 to $2,999 | 0 (0.0%) | 0 (0.0%) |
| $3,000 or more | 0 (0.0%) | 6 (2.3%) |
| Total | 404 (100.0%) | 258 (100.0%) |
Physical Housing Characteristics in Vienna
Housing Structures in Vienna
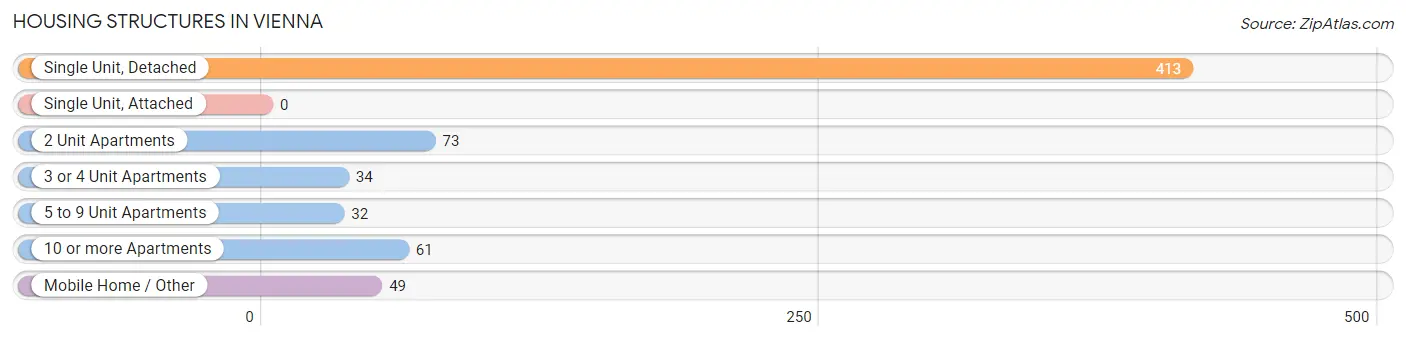
| Structure Type | # Housing Units | % Housing Units |
| Single Unit, Detached | 413 | 62.4% |
| Single Unit, Attached | 0 | 0.0% |
| 2 Unit Apartments | 73 | 11.0% |
| 3 or 4 Unit Apartments | 34 | 5.1% |
| 5 to 9 Unit Apartments | 32 | 4.8% |
| 10 or more Apartments | 61 | 9.2% |
| Mobile Home / Other | 49 | 7.4% |
| Total | 662 | 100.0% |
Housing Structures by Occupancy in Vienna
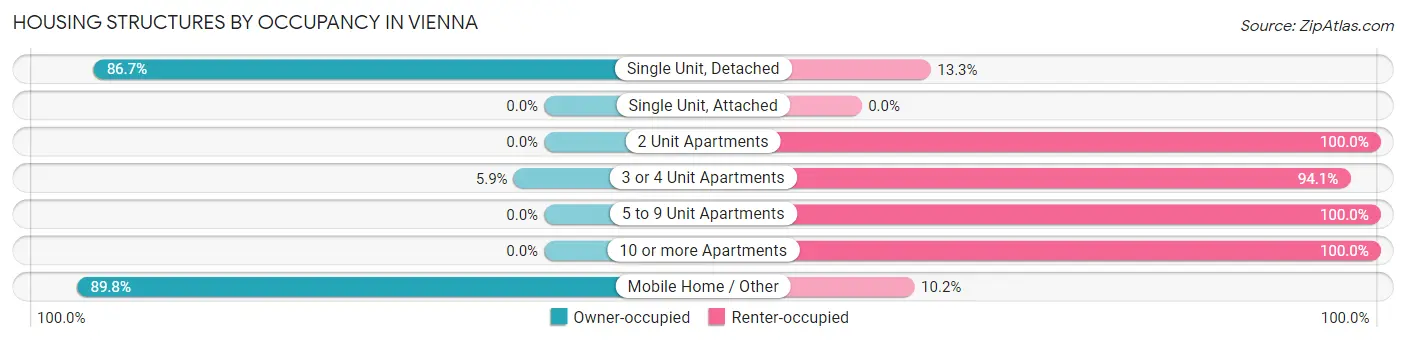
| Structure Type | Owner-occupied | Renter-occupied |
| Single Unit, Detached | 358 (86.7%) | 55 (13.3%) |
| Single Unit, Attached | 0 (0.0%) | 0 (0.0%) |
| 2 Unit Apartments | 0 (0.0%) | 73 (100.0%) |
| 3 or 4 Unit Apartments | 2 (5.9%) | 32 (94.1%) |
| 5 to 9 Unit Apartments | 0 (0.0%) | 32 (100.0%) |
| 10 or more Apartments | 0 (0.0%) | 61 (100.0%) |
| Mobile Home / Other | 44 (89.8%) | 5 (10.2%) |
| Total | 404 (61.0%) | 258 (39.0%) |
Housing Structures by Number of Rooms in Vienna
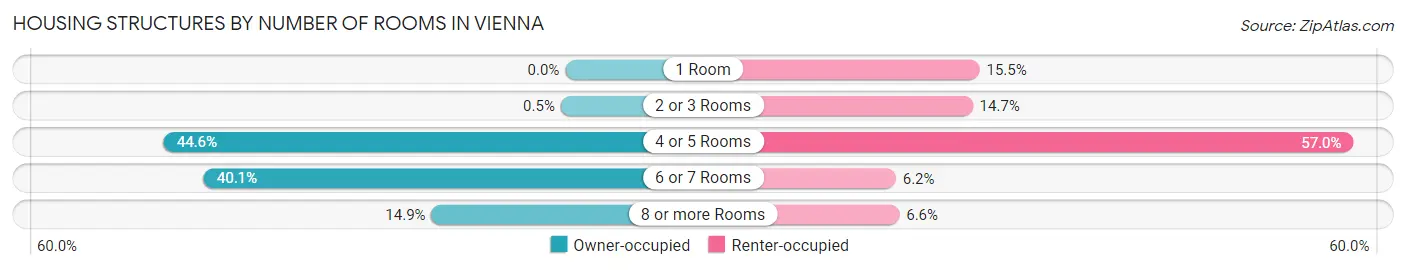
| Number of Rooms | Owner-occupied | Renter-occupied |
| 1 Room | 0 (0.0%) | 40 (15.5%) |
| 2 or 3 Rooms | 2 (0.5%) | 38 (14.7%) |
| 4 or 5 Rooms | 180 (44.6%) | 147 (57.0%) |
| 6 or 7 Rooms | 162 (40.1%) | 16 (6.2%) |
| 8 or more Rooms | 60 (14.8%) | 17 (6.6%) |
| Total | 404 (100.0%) | 258 (100.0%) |
Housing Structure by Heating Type in Vienna
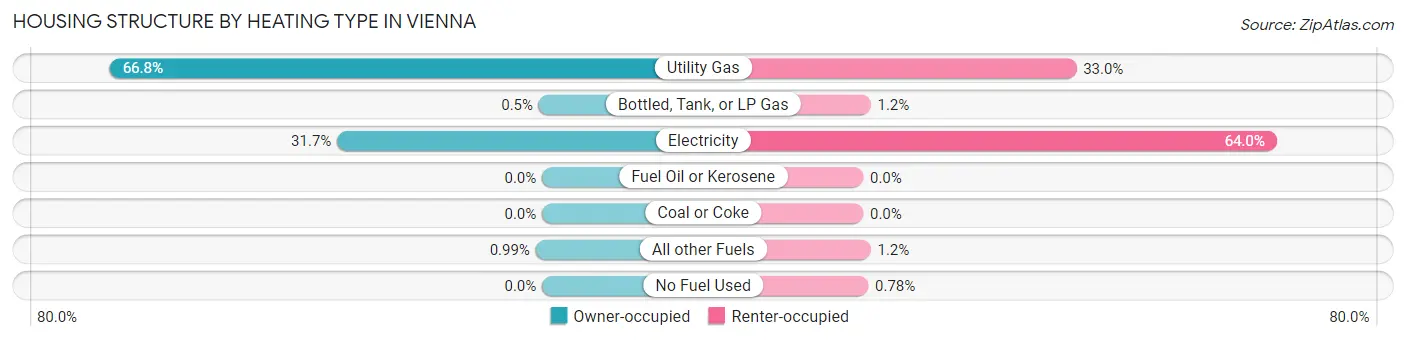
| Heating Type | Owner-occupied | Renter-occupied |
| Utility Gas | 270 (66.8%) | 85 (33.0%) |
| Bottled, Tank, or LP Gas | 2 (0.5%) | 3 (1.2%) |
| Electricity | 128 (31.7%) | 165 (63.9%) |
| Fuel Oil or Kerosene | 0 (0.0%) | 0 (0.0%) |
| Coal or Coke | 0 (0.0%) | 0 (0.0%) |
| All other Fuels | 4 (1.0%) | 3 (1.2%) |
| No Fuel Used | 0 (0.0%) | 2 (0.8%) |
| Total | 404 (100.0%) | 258 (100.0%) |
Household Vehicle Usage in Vienna
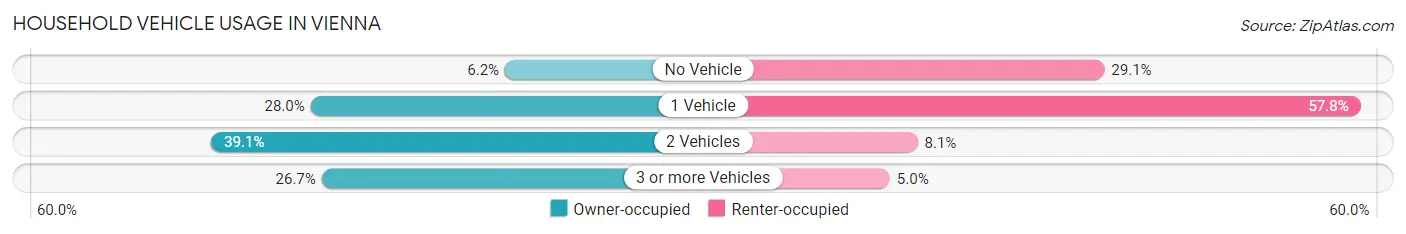
| Vehicles per Household | Owner-occupied | Renter-occupied |
| No Vehicle | 25 (6.2%) | 75 (29.1%) |
| 1 Vehicle | 113 (28.0%) | 149 (57.8%) |
| 2 Vehicles | 158 (39.1%) | 21 (8.1%) |
| 3 or more Vehicles | 108 (26.7%) | 13 (5.0%) |
| Total | 404 (100.0%) | 258 (100.0%) |
Real Estate & Mortgages in Vienna
Real Estate and Mortgage Overview in Vienna
| Characteristic | Without Mortgage | With Mortgage |
| Housing Units | 201 | 203 |
| Median Property Value | $75,200 | $84,700 |
| Median Household Income | $45,179 | $9 |
| Monthly Housing Costs | $402 | $0 |
| Real Estate Taxes | $1,179 | $55 |
Property Value by Mortgage Status in Vienna
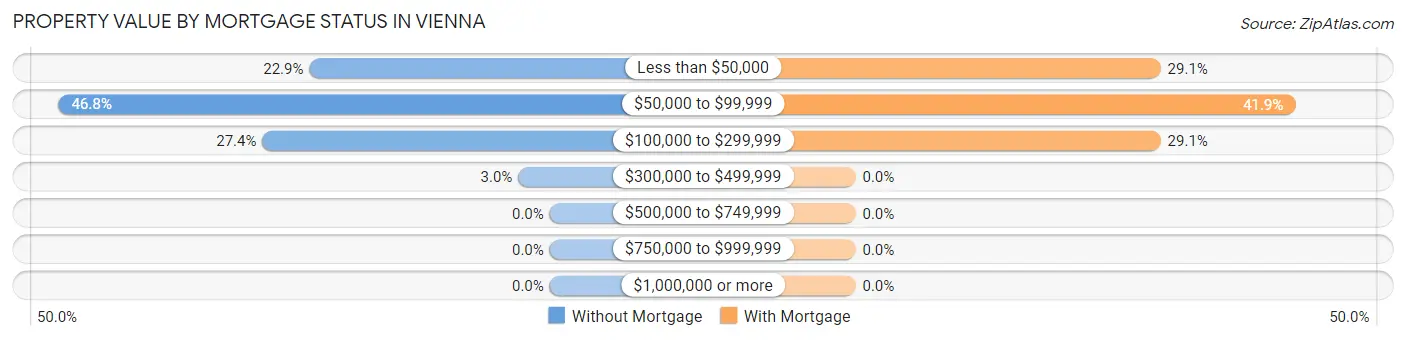
| Property Value | Without Mortgage | With Mortgage |
| Less than $50,000 | 46 (22.9%) | 59 (29.1%) |
| $50,000 to $99,999 | 94 (46.8%) | 85 (41.9%) |
| $100,000 to $299,999 | 55 (27.4%) | 59 (29.1%) |
| $300,000 to $499,999 | 6 (3.0%) | 0 (0.0%) |
| $500,000 to $749,999 | 0 (0.0%) | 0 (0.0%) |
| $750,000 to $999,999 | 0 (0.0%) | 0 (0.0%) |
| $1,000,000 or more | 0 (0.0%) | 0 (0.0%) |
| Total | 201 (100.0%) | 203 (100.0%) |
Household Income by Mortgage Status in Vienna
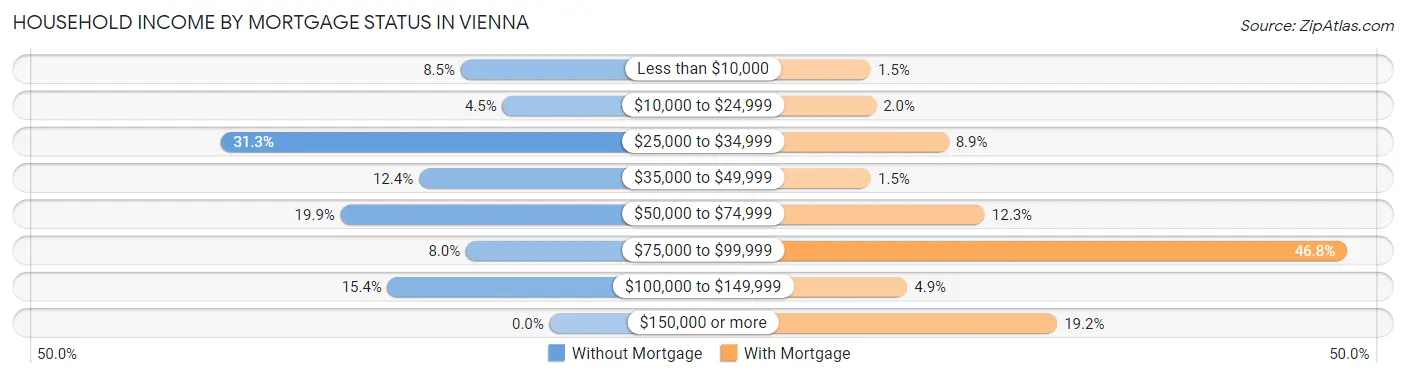
| Household Income | Without Mortgage | With Mortgage |
| Less than $10,000 | 17 (8.5%) | 3 (1.5%) |
| $10,000 to $24,999 | 9 (4.5%) | 4 (2.0%) |
| $25,000 to $34,999 | 63 (31.3%) | 18 (8.9%) |
| $35,000 to $49,999 | 25 (12.4%) | 3 (1.5%) |
| $50,000 to $74,999 | 40 (19.9%) | 25 (12.3%) |
| $75,000 to $99,999 | 16 (8.0%) | 95 (46.8%) |
| $100,000 to $149,999 | 31 (15.4%) | 10 (4.9%) |
| $150,000 or more | 0 (0.0%) | 39 (19.2%) |
| Total | 201 (100.0%) | 203 (100.0%) |
Property Value to Household Income Ratio in Vienna
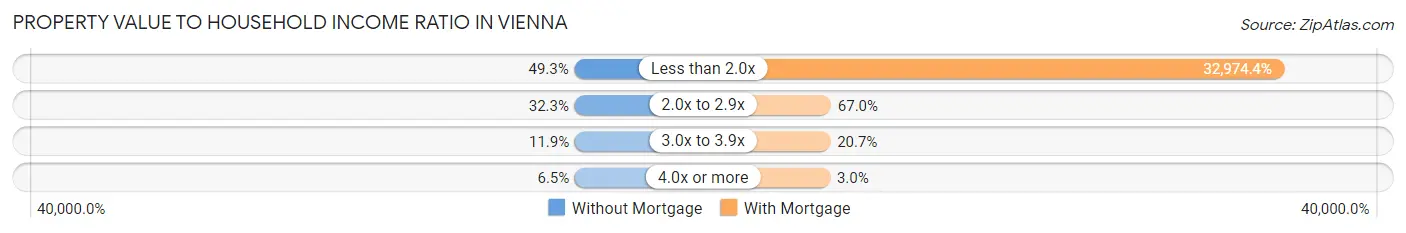
| Value-to-Income Ratio | Without Mortgage | With Mortgage |
| Less than 2.0x | 99 (49.2%) | 66,938 (32,974.4%) |
| 2.0x to 2.9x | 65 (32.3%) | 136 (67.0%) |
| 3.0x to 3.9x | 24 (11.9%) | 42 (20.7%) |
| 4.0x or more | 13 (6.5%) | 6 (3.0%) |
| Total | 201 (100.0%) | 203 (100.0%) |
Real Estate Taxes by Mortgage Status in Vienna
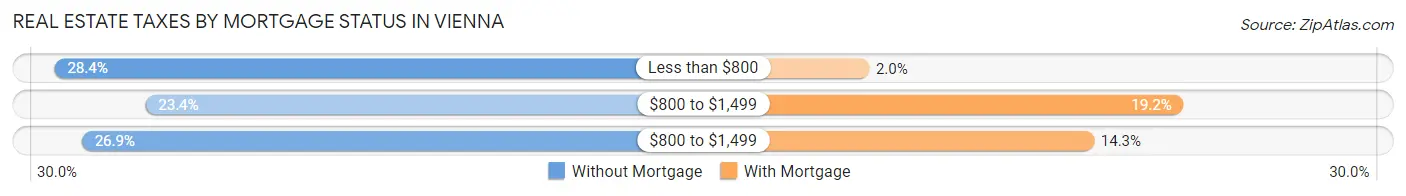
| Property Taxes | Without Mortgage | With Mortgage |
| Less than $800 | 57 (28.4%) | 4 (2.0%) |
| $800 to $1,499 | 47 (23.4%) | 39 (19.2%) |
| $800 to $1,499 | 54 (26.9%) | 29 (14.3%) |
| Total | 201 (100.0%) | 203 (100.0%) |
Health & Disability in Vienna
Health Insurance Coverage by Age in Vienna
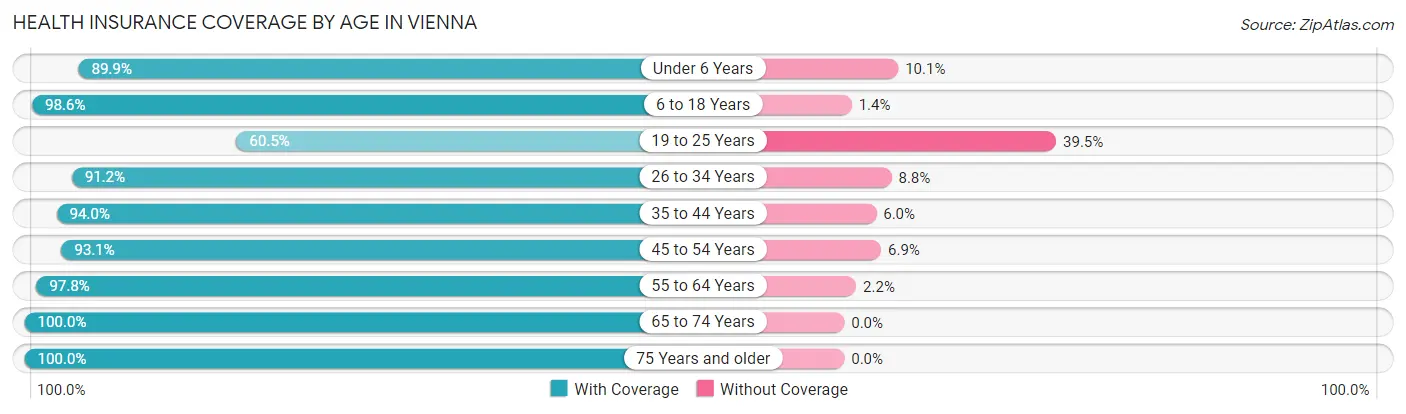
| Age Bracket | With Coverage | Without Coverage |
| Under 6 Years | 161 (89.9%) | 18 (10.1%) |
| 6 to 18 Years | 568 (98.6%) | 8 (1.4%) |
| 19 to 25 Years | 121 (60.5%) | 79 (39.5%) |
| 26 to 34 Years | 238 (91.2%) | 23 (8.8%) |
| 35 to 44 Years | 221 (94.0%) | 14 (6.0%) |
| 45 to 54 Years | 163 (93.1%) | 12 (6.9%) |
| 55 to 64 Years | 221 (97.8%) | 5 (2.2%) |
| 65 to 74 Years | 237 (100.0%) | 0 (0.0%) |
| 75 Years and older | 180 (100.0%) | 0 (0.0%) |
| Total | 2,110 (93.0%) | 159 (7.0%) |
Health Insurance Coverage by Citizenship Status in Vienna
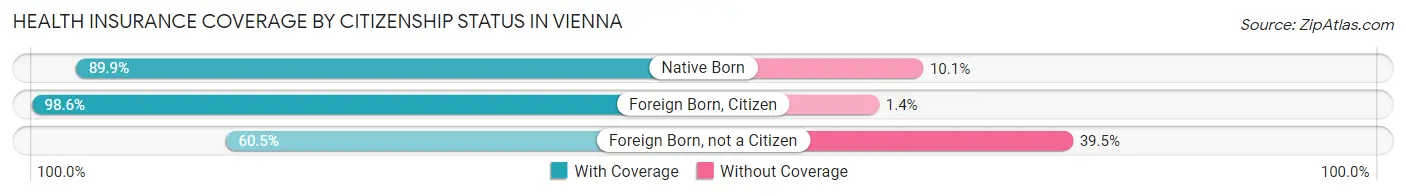
| Citizenship Status | With Coverage | Without Coverage |
| Native Born | 161 (89.9%) | 18 (10.1%) |
| Foreign Born, Citizen | 568 (98.6%) | 8 (1.4%) |
| Foreign Born, not a Citizen | 121 (60.5%) | 79 (39.5%) |
Health Insurance Coverage by Household Income in Vienna
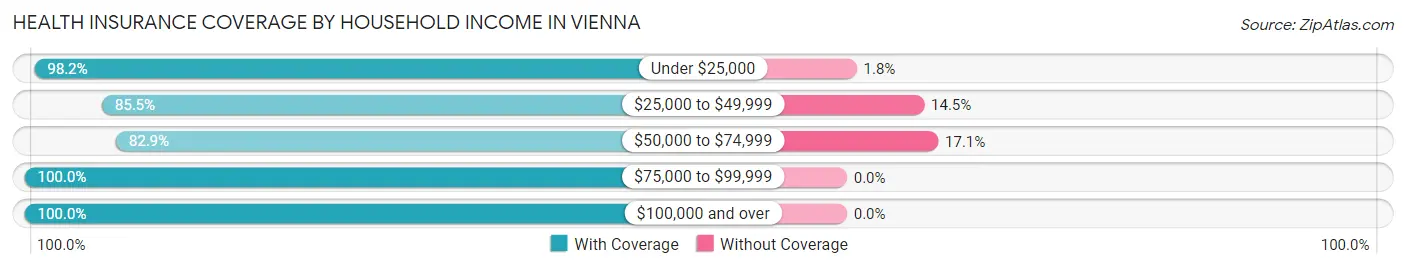
| Household Income | With Coverage | Without Coverage |
| Under $25,000 | 746 (98.2%) | 14 (1.8%) |
| $25,000 to $49,999 | 254 (85.5%) | 43 (14.5%) |
| $50,000 to $74,999 | 494 (82.9%) | 102 (17.1%) |
| $75,000 to $99,999 | 80 (100.0%) | 0 (0.0%) |
| $100,000 and over | 526 (100.0%) | 0 (0.0%) |
Public vs Private Health Insurance Coverage by Age in Vienna
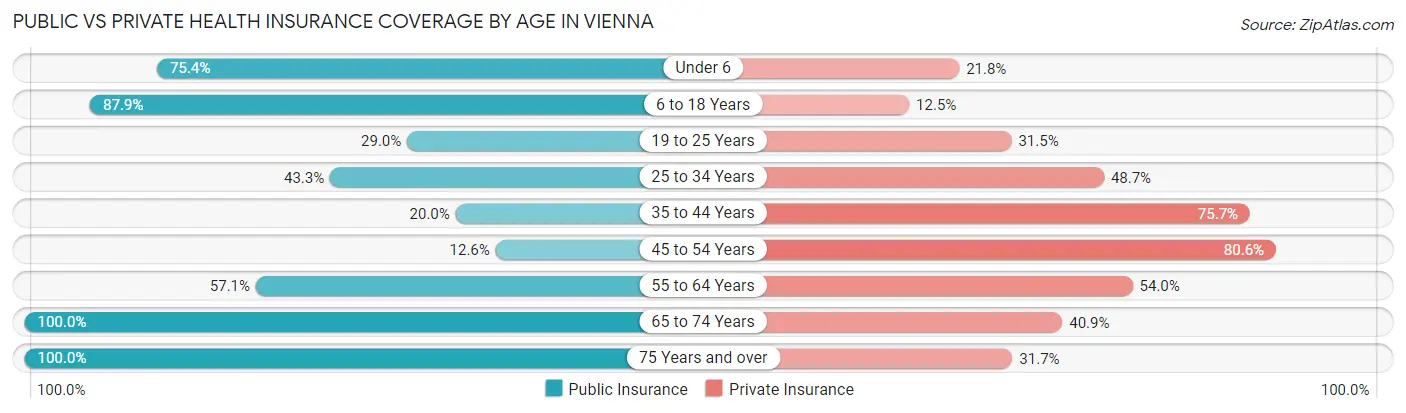
| Age Bracket | Public Insurance | Private Insurance |
| Under 6 | 135 (75.4%) | 39 (21.8%) |
| 6 to 18 Years | 506 (87.8%) | 72 (12.5%) |
| 19 to 25 Years | 58 (29.0%) | 63 (31.5%) |
| 25 to 34 Years | 113 (43.3%) | 127 (48.7%) |
| 35 to 44 Years | 47 (20.0%) | 178 (75.7%) |
| 45 to 54 Years | 22 (12.6%) | 141 (80.6%) |
| 55 to 64 Years | 129 (57.1%) | 122 (54.0%) |
| 65 to 74 Years | 237 (100.0%) | 97 (40.9%) |
| 75 Years and over | 180 (100.0%) | 57 (31.7%) |
| Total | 1,427 (62.9%) | 896 (39.5%) |
Disability Status by Sex by Age in Vienna
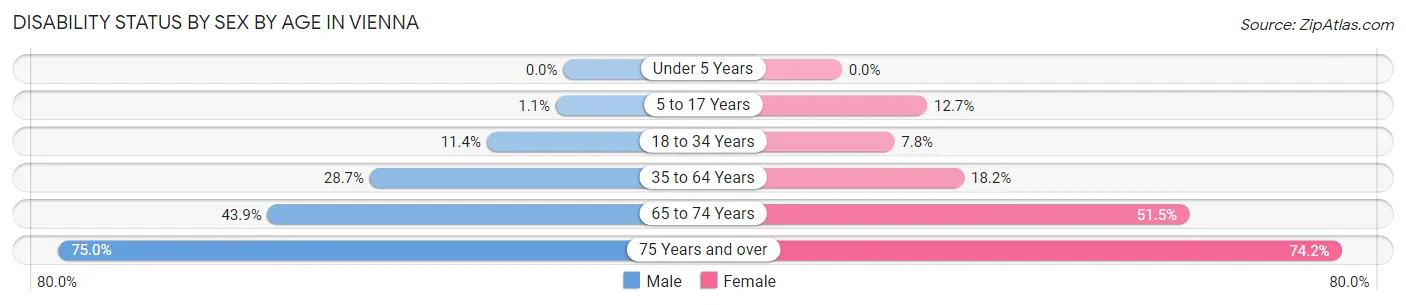
| Age Bracket | Male | Female |
| Under 5 Years | 0 (0.0%) | 0 (0.0%) |
| 5 to 17 Years | 5 (1.1%) | 19 (12.7%) |
| 18 to 34 Years | 37 (11.4%) | 11 (7.8%) |
| 35 to 64 Years | 102 (28.7%) | 51 (18.1%) |
| 65 to 74 Years | 47 (43.9%) | 67 (51.5%) |
| 75 Years and over | 42 (75.0%) | 92 (74.2%) |
Disability Class by Sex by Age in Vienna
Disability Class: Hearing Difficulty
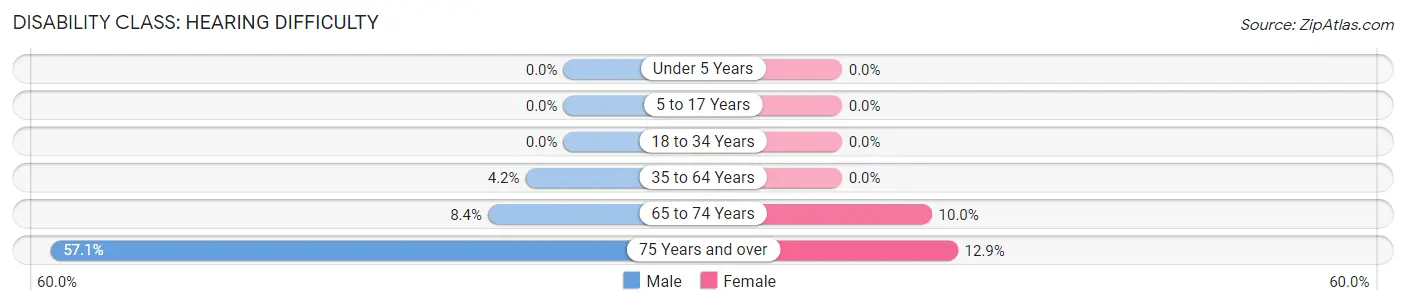
| Age Bracket | Male | Female |
| Under 5 Years | 0 (0.0%) | 0 (0.0%) |
| 5 to 17 Years | 0 (0.0%) | 0 (0.0%) |
| 18 to 34 Years | 0 (0.0%) | 0 (0.0%) |
| 35 to 64 Years | 15 (4.2%) | 0 (0.0%) |
| 65 to 74 Years | 9 (8.4%) | 13 (10.0%) |
| 75 Years and over | 32 (57.1%) | 16 (12.9%) |
Disability Class: Vision Difficulty
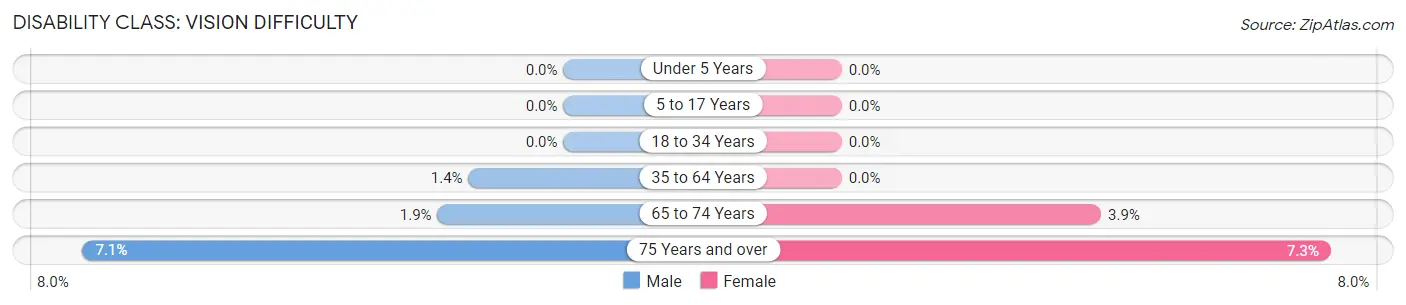
| Age Bracket | Male | Female |
| Under 5 Years | 0 (0.0%) | 0 (0.0%) |
| 5 to 17 Years | 0 (0.0%) | 0 (0.0%) |
| 18 to 34 Years | 0 (0.0%) | 0 (0.0%) |
| 35 to 64 Years | 5 (1.4%) | 0 (0.0%) |
| 65 to 74 Years | 2 (1.9%) | 5 (3.8%) |
| 75 Years and over | 4 (7.1%) | 9 (7.3%) |
Disability Class: Cognitive Difficulty
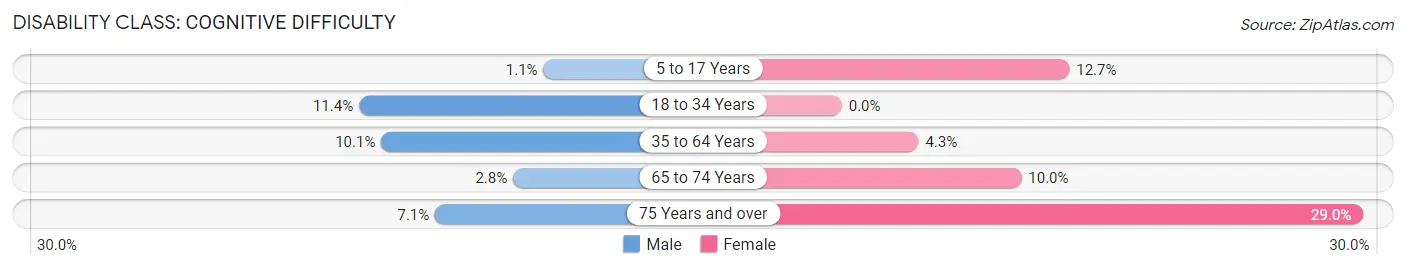
| Age Bracket | Male | Female |
| 5 to 17 Years | 5 (1.1%) | 19 (12.7%) |
| 18 to 34 Years | 37 (11.4%) | 0 (0.0%) |
| 35 to 64 Years | 36 (10.1%) | 12 (4.3%) |
| 65 to 74 Years | 3 (2.8%) | 13 (10.0%) |
| 75 Years and over | 4 (7.1%) | 36 (29.0%) |
Disability Class: Ambulatory Difficulty
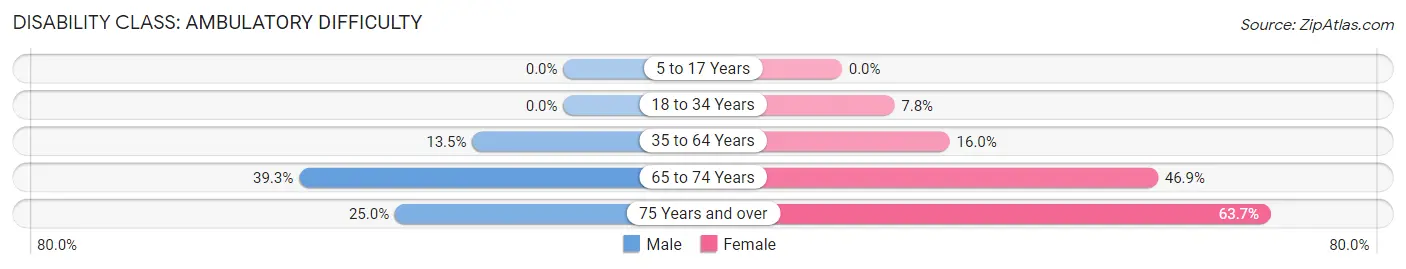
| Age Bracket | Male | Female |
| 5 to 17 Years | 0 (0.0%) | 0 (0.0%) |
| 18 to 34 Years | 0 (0.0%) | 11 (7.8%) |
| 35 to 64 Years | 48 (13.5%) | 45 (16.0%) |
| 65 to 74 Years | 42 (39.3%) | 61 (46.9%) |
| 75 Years and over | 14 (25.0%) | 79 (63.7%) |
Disability Class: Self-Care Difficulty
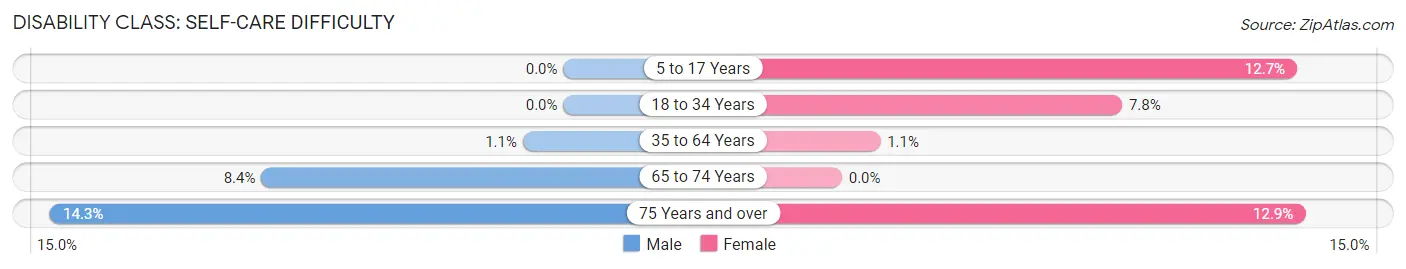
| Age Bracket | Male | Female |
| 5 to 17 Years | 0 (0.0%) | 19 (12.7%) |
| 18 to 34 Years | 0 (0.0%) | 11 (7.8%) |
| 35 to 64 Years | 4 (1.1%) | 3 (1.1%) |
| 65 to 74 Years | 9 (8.4%) | 0 (0.0%) |
| 75 Years and over | 8 (14.3%) | 16 (12.9%) |
Technology Access in Vienna
Computing Device Access in Vienna
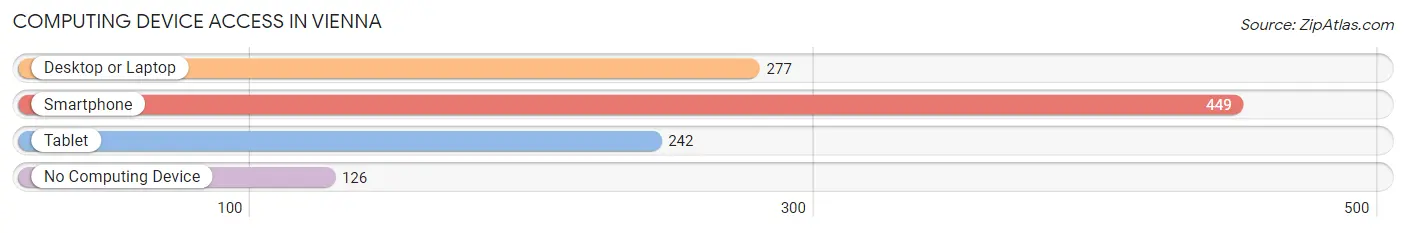
| Device Type | # Households | % Households |
| Desktop or Laptop | 277 | 41.8% |
| Smartphone | 449 | 67.8% |
| Tablet | 242 | 36.6% |
| No Computing Device | 126 | 19.0% |
| Total | 662 | 100.0% |
Internet Access in Vienna
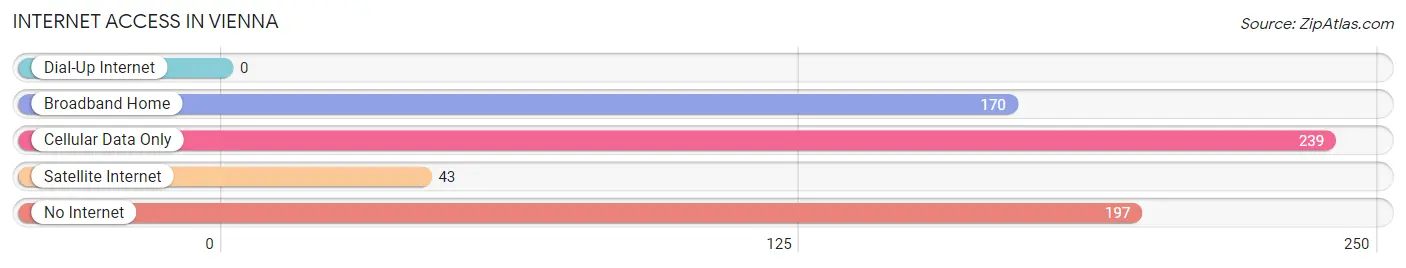
| Internet Type | # Households | % Households |
| Dial-Up Internet | 0 | 0.0% |
| Broadband Home | 170 | 25.7% |
| Cellular Data Only | 239 | 36.1% |
| Satellite Internet | 43 | 6.5% |
| No Internet | 197 | 29.8% |
| Total | 662 | 100.0% |
Vienna Summary
Vienna, Illinois is a small city located in Johnson County, Illinois. It is situated on the banks of the Big Muddy River, and is part of the Carbondale-Marion-Herrin Metropolitan Statistical Area. The city has a population of approximately 2,500 people, and is the county seat of Johnson County.
History
Vienna was founded in 1819 by a group of settlers from Kentucky. The city was named after Vienna, Kentucky, which was the hometown of the settlers. The city was incorporated in 1837, and was the first city in Johnson County.
Vienna was an important stop on the Cairo and Vincennes Railroad, which was built in 1854. The railroad connected Vienna to the larger cities of Cairo and Vincennes, and allowed for the transportation of goods and people.
The city was also an important stop on the Underground Railroad. During the Civil War, Vienna was a major center of Union activity, and was the site of several skirmishes between Union and Confederate forces.
Geography
Vienna is located in the southeastern corner of Johnson County, Illinois. It is situated on the banks of the Big Muddy River, and is part of the Carbondale-Marion-Herrin Metropolitan Statistical Area. The city has a total area of 1.3 square miles, all of which is land.
The city is located in a hilly region, and is surrounded by forests and farmland. The climate is humid continental, with hot summers and cold winters. The average annual temperature is 54 degrees Fahrenheit, and the average annual precipitation is 40 inches.
Economy
Vienna’s economy is largely based on agriculture and manufacturing. The city is home to several large farms, and is a major producer of corn, soybeans, and wheat. The city is also home to several manufacturing companies, including a furniture factory, a plastics factory, and a metal fabrication plant.
The city is also home to several small businesses, including restaurants, retail stores, and service providers. The city is also home to several government offices, including the Johnson County Courthouse and the Johnson County Sheriff’s Office.
Demographics
As of the 2010 census, Vienna had a population of 2,500 people. The racial makeup of the city was 97.2% White, 0.8% African American, 0.4% Native American, 0.4% Asian, and 0.8% from other races. Hispanic or Latino of any race were 1.2% of the population.
The median household income in Vienna was $37,500, and the median family income was $45,000. The per capita income was $18,000. About 11.2% of families and 14.4% of the population were below the poverty line, including 18.2% of those under age 18 and 8.4% of those age 65 or over.
Common Questions
What is Per Capita Income in Vienna?
Per Capita income in Vienna is $22,301.
What is the Median Family Income in Vienna?
Median Family Income in Vienna is $52,031.
What is the Median Household income in Vienna?
Median Household Income in Vienna is $47,000.
What is Income or Wage Gap in Vienna?
Income or Wage Gap in Vienna is 34.9%.
Women in Vienna earn 65.1 cents for every dollar earned by a man.
What is Inequality or Gini Index in Vienna?
Inequality or Gini Index in Vienna is 0.44.
What is the Total Population of Vienna?
Total Population of Vienna is 2,319.
What is the Total Male Population of Vienna?
Total Male Population of Vienna is 1,348.
What is the Total Female Population of Vienna?
Total Female Population of Vienna is 971.
What is the Ratio of Males per 100 Females in Vienna?
There are 138.83 Males per 100 Females in Vienna.
What is the Ratio of Females per 100 Males in Vienna?
There are 72.03 Females per 100 Males in Vienna.
What is the Median Population Age in Vienna?
Median Population Age in Vienna is 30.3 Years.
What is the Average Family Size in Vienna
Average Family Size in Vienna is 4.7 People.
What is the Average Household Size in Vienna
Average Household Size in Vienna is 3.4 People.
How Large is the Labor Force in Vienna?
There are 827 People in the Labor Forcein in Vienna.
What is the Percentage of People in the Labor Force in Vienna?
51.2% of People are in the Labor Force in Vienna.
What is the Unemployment Rate in Vienna?
Unemployment Rate in Vienna is 2.4%.