Vermont, IL Map & Demographics
Vermont Map
Vermont Overview
$24,782
PER CAPITA INCOME
$60,952
AVG FAMILY INCOME
$44,375
AVG HOUSEHOLD INCOME
14.0%
WAGE / INCOME GAP [ % ]
86.0¢/ $1
WAGE / INCOME GAP [ $ ]
0.35
INEQUALITY / GINI INDEX
646
TOTAL POPULATION
358
MALE POPULATION
288
FEMALE POPULATION
124.31
MALES / 100 FEMALES
80.45
FEMALES / 100 MALES
44.9
MEDIAN AGE
2.8
AVG FAMILY SIZE
2.1
AVG HOUSEHOLD SIZE
319
LABOR FORCE [ PEOPLE ]
56.7%
PERCENT IN LABOR FORCE
4.4%
UNEMPLOYMENT RATE
Vermont Zip Codes
Vermont Area Codes
Income in Vermont
Income Overview in Vermont
Per Capita Income in Vermont is $24,782, while median incomes of families and households are $60,952 and $44,375 respectively.
| Characteristic | Number | Measure |
| Per Capita Income | 646 | $24,782 |
| Median Family Income | 180 | $60,952 |
| Mean Family Income | 180 | $67,356 |
| Median Household Income | 306 | $44,375 |
| Mean Household Income | 306 | $52,179 |
| Income Deficit | 180 | $0 |
| Wage / Income Gap (%) | 646 | 13.99% |
| Wage / Income Gap ($) | 646 | 86.01¢ per $1 |
| Gini / Inequality Index | 646 | 0.35 |
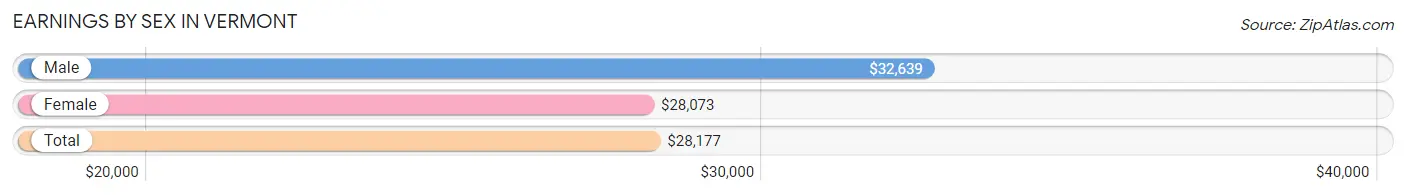
Earnings by Sex in Vermont
Average Earnings in Vermont are $28,177, $32,639 for men and $28,073 for women, a difference of 14.0%.
| Sex | Number | Average Earnings |
| Male | 186 (55.5%) | $32,639 |
| Female | 149 (44.5%) | $28,073 |
| Total | 335 (100.0%) | $28,177 |
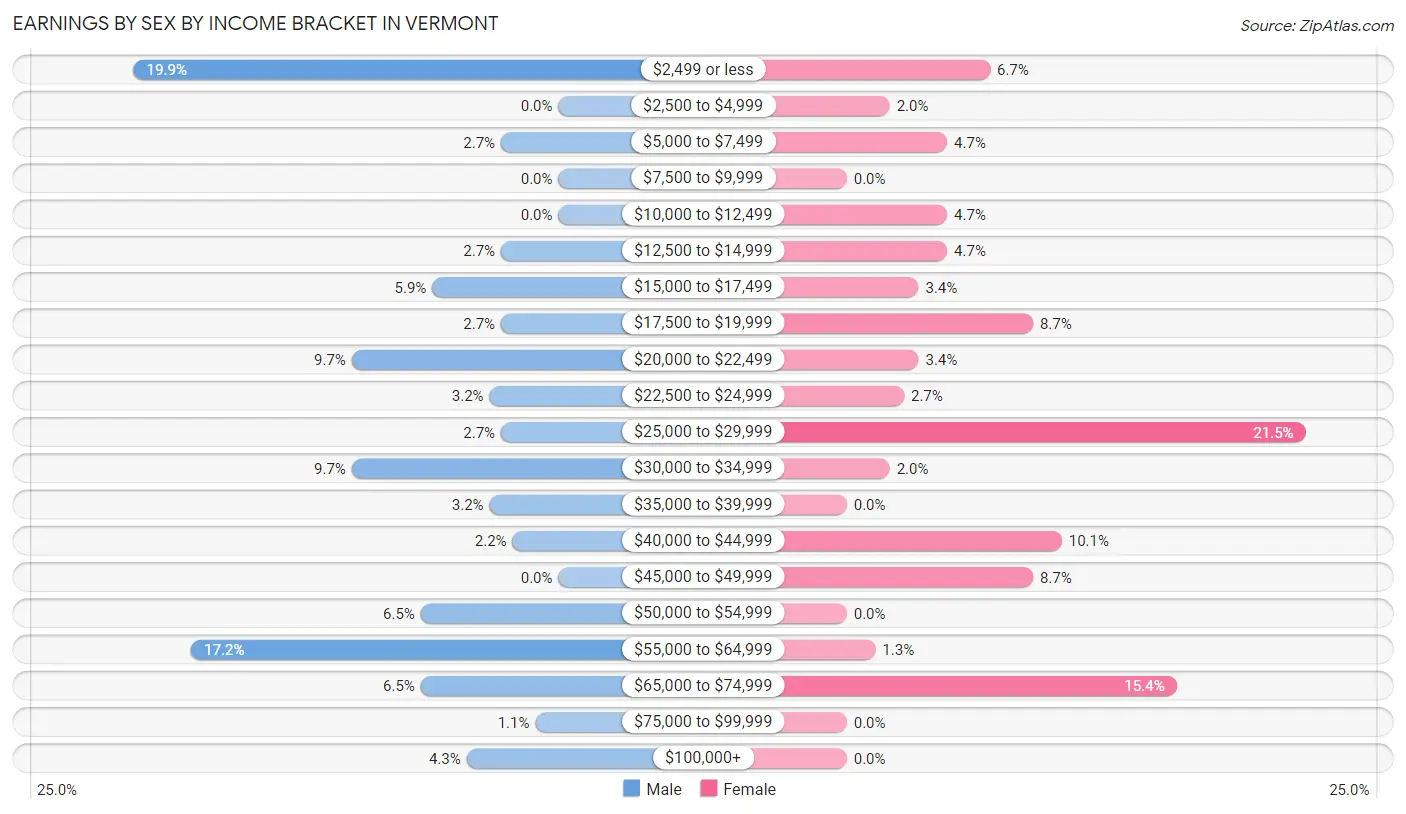
Earnings by Sex by Income Bracket in Vermont
The most common earnings brackets in Vermont are $2,499 or less for men (37 | 19.9%) and $25,000 to $29,999 for women (32 | 21.5%).
| Income | Male | Female |
| $2,499 or less | 37 (19.9%) | 10 (6.7%) |
| $2,500 to $4,999 | 0 (0.0%) | 3 (2.0%) |
| $5,000 to $7,499 | 5 (2.7%) | 7 (4.7%) |
| $7,500 to $9,999 | 0 (0.0%) | 0 (0.0%) |
| $10,000 to $12,499 | 0 (0.0%) | 7 (4.7%) |
| $12,500 to $14,999 | 5 (2.7%) | 7 (4.7%) |
| $15,000 to $17,499 | 11 (5.9%) | 5 (3.4%) |
| $17,500 to $19,999 | 5 (2.7%) | 13 (8.7%) |
| $20,000 to $22,499 | 18 (9.7%) | 5 (3.4%) |
| $22,500 to $24,999 | 6 (3.2%) | 4 (2.7%) |
| $25,000 to $29,999 | 5 (2.7%) | 32 (21.5%) |
| $30,000 to $34,999 | 18 (9.7%) | 3 (2.0%) |
| $35,000 to $39,999 | 6 (3.2%) | 0 (0.0%) |
| $40,000 to $44,999 | 4 (2.1%) | 15 (10.1%) |
| $45,000 to $49,999 | 0 (0.0%) | 13 (8.7%) |
| $50,000 to $54,999 | 12 (6.5%) | 0 (0.0%) |
| $55,000 to $64,999 | 32 (17.2%) | 2 (1.3%) |
| $65,000 to $74,999 | 12 (6.5%) | 23 (15.4%) |
| $75,000 to $99,999 | 2 (1.1%) | 0 (0.0%) |
| $100,000+ | 8 (4.3%) | 0 (0.0%) |
| Total | 186 (100.0%) | 149 (100.0%) |
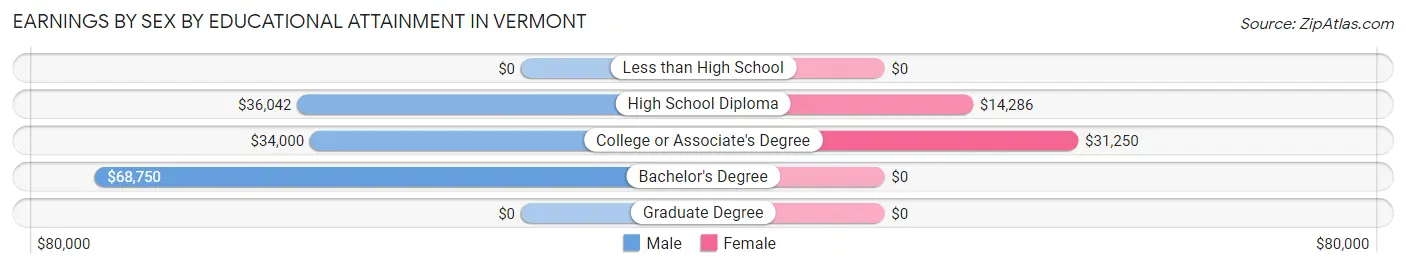
Earnings by Sex by Educational Attainment in Vermont
Average earnings in Vermont are $35,000 for men and $28,385 for women, a difference of 18.9%. Men with an educational attainment of bachelor's degree enjoy the highest average annual earnings of $68,750, while those with college or associate's degree education earn the least with $34,000. Women with an educational attainment of college or associate's degree earn the most with the average annual earnings of $31,250, while those with high school diploma education have the smallest earnings of $14,286.
| Educational Attainment | Male Income | Female Income |
| Less than High School | - | - |
| High School Diploma | $36,042 | $14,286 |
| College or Associate's Degree | $34,000 | $31,250 |
| Bachelor's Degree | $68,750 | $0 |
| Graduate Degree | - | - |
| Total | $35,000 | $28,385 |
Family Income in Vermont
Family Income Brackets in Vermont
According to the Vermont family income data, there are 67 families falling into the $50,000 to $74,999 income range, which is the most common income bracket and makes up 37.2% of all families.
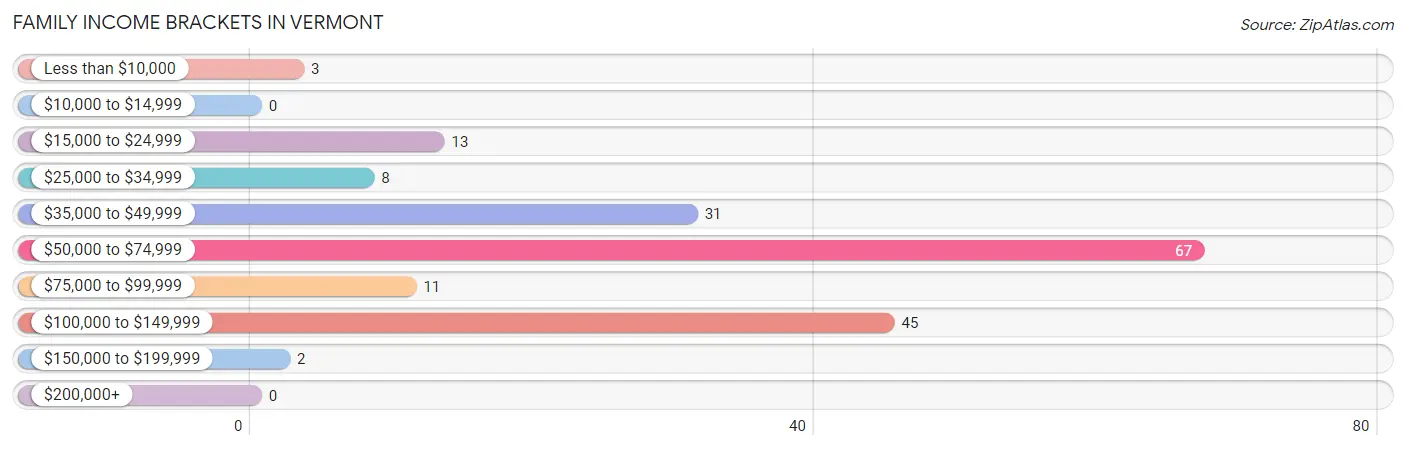
| Income Bracket | # Families | % Families |
| Less than $10,000 | 3 | 1.7% |
| $10,000 to $14,999 | 0 | 0.0% |
| $15,000 to $24,999 | 13 | 7.2% |
| $25,000 to $34,999 | 8 | 4.4% |
| $35,000 to $49,999 | 31 | 17.2% |
| $50,000 to $74,999 | 67 | 37.2% |
| $75,000 to $99,999 | 11 | 6.1% |
| $100,000 to $149,999 | 45 | 25.0% |
| $150,000 to $199,999 | 2 | 1.1% |
| $200,000+ | 0 | 0.0% |
Family Income by Famaliy Size in Vermont
4-person families (32 | 17.8%) account for the highest median family income in Vermont with $74,286 per family, while 2-person families (107 | 59.4%) have the highest median income of $29,125 per family member.
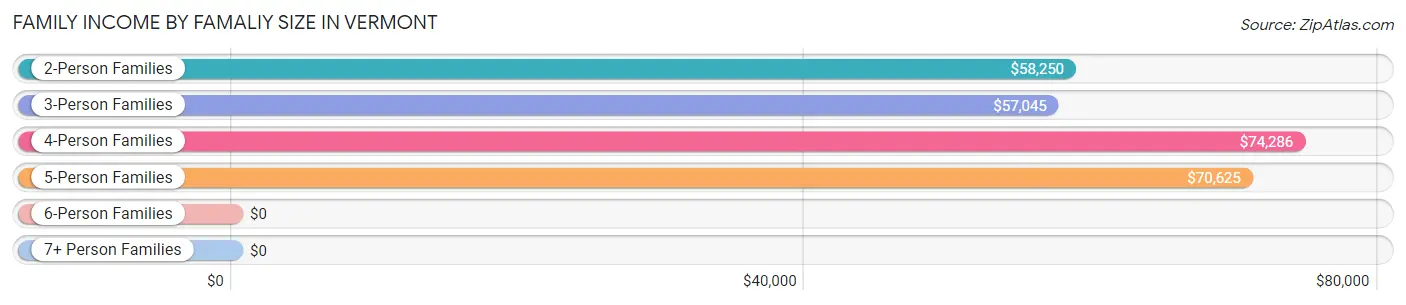
| Income Bracket | # Families | Median Income |
| 2-Person Families | 107 (59.4%) | $58,250 |
| 3-Person Families | 24 (13.3%) | $57,045 |
| 4-Person Families | 32 (17.8%) | $74,286 |
| 5-Person Families | 17 (9.4%) | $70,625 |
| 6-Person Families | 0 (0.0%) | $0 |
| 7+ Person Families | 0 (0.0%) | $0 |
| Total | 180 (100.0%) | $60,952 |
Family Income by Number of Earners in Vermont
The median family income in Vermont is $60,952, with families comprising 2 earners (93) having the highest median family income of $78,750, while families with 1 earner (37) have the lowest median family income of $39,688, accounting for 51.7% and 20.6% of families, respectively.
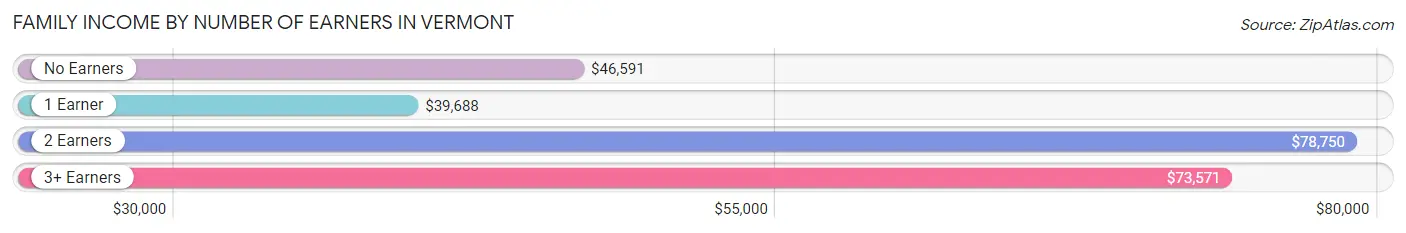
| Number of Earners | # Families | Median Income |
| No Earners | 38 (21.1%) | $46,591 |
| 1 Earner | 37 (20.6%) | $39,688 |
| 2 Earners | 93 (51.7%) | $78,750 |
| 3+ Earners | 12 (6.7%) | $73,571 |
| Total | 180 (100.0%) | $60,952 |
Household Income in Vermont
Household Income Brackets in Vermont
With 77 households falling in the category, the $50,000 to $74,999 income range is the most frequent in Vermont, accounting for 25.2% of all households.
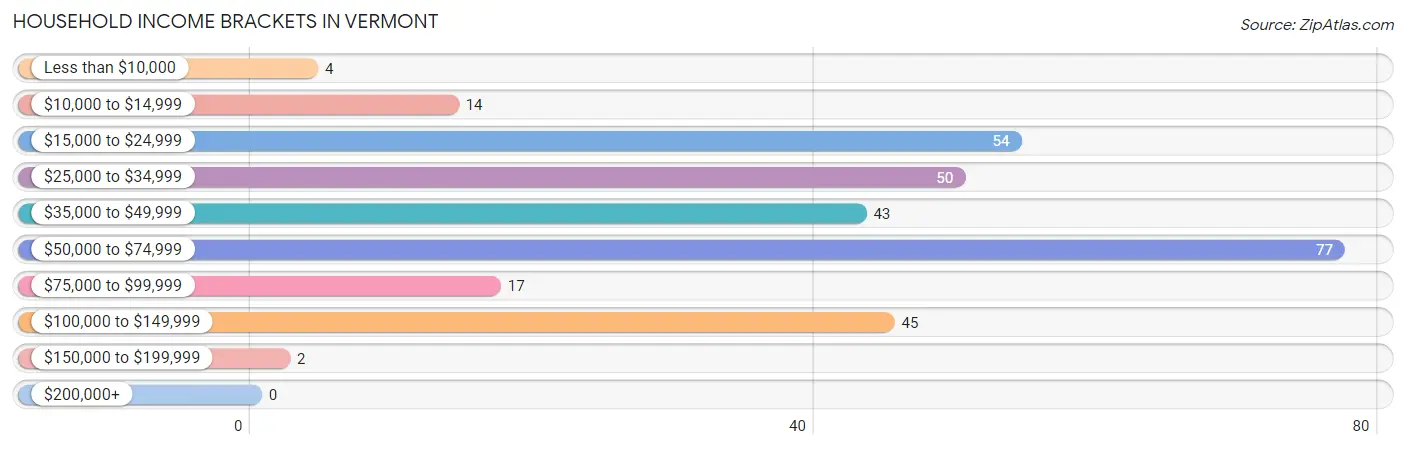
| Income Bracket | # Households | % Households |
| Less than $10,000 | 4 | 1.3% |
| $10,000 to $14,999 | 14 | 4.6% |
| $15,000 to $24,999 | 54 | 17.6% |
| $25,000 to $34,999 | 50 | 16.3% |
| $35,000 to $49,999 | 43 | 14.1% |
| $50,000 to $74,999 | 77 | 25.2% |
| $75,000 to $99,999 | 17 | 5.6% |
| $100,000 to $149,999 | 45 | 14.7% |
| $150,000 to $199,999 | 2 | 0.7% |
| $200,000+ | 0 | 0.0% |
Household Income by Householder Age in Vermont
The median household income in Vermont is $44,375, with the highest median household income of $61,442 found in the 45 to 64 years age bracket for the primary householder. A total of 113 households (36.9%) fall into this category. Meanwhile, the 15 to 24 years age bracket for the primary householder has the lowest median household income of $0, with 7 households (2.3%) in this group.
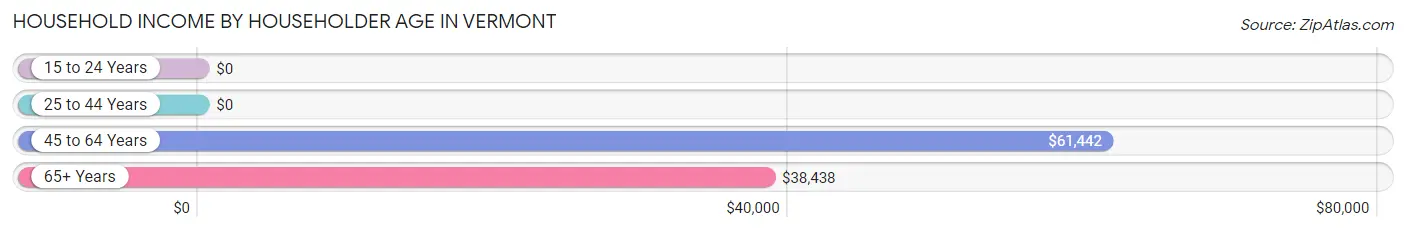
| Income Bracket | # Households | Median Income |
| 15 to 24 Years | 7 (2.3%) | $0 |
| 25 to 44 Years | 87 (28.4%) | $0 |
| 45 to 64 Years | 113 (36.9%) | $61,442 |
| 65+ Years | 99 (32.4%) | $38,438 |
| Total | 306 (100.0%) | $44,375 |
Poverty in Vermont
Income Below Poverty by Sex and Age in Vermont
With 8.7% poverty level for males and 12.5% for females among the residents of Vermont, under 5 year old males and 6 to 11 year old females are the most vulnerable to poverty, with 5 males (23.8%) and 6 females (37.5%) in their respective age groups living below the poverty level.
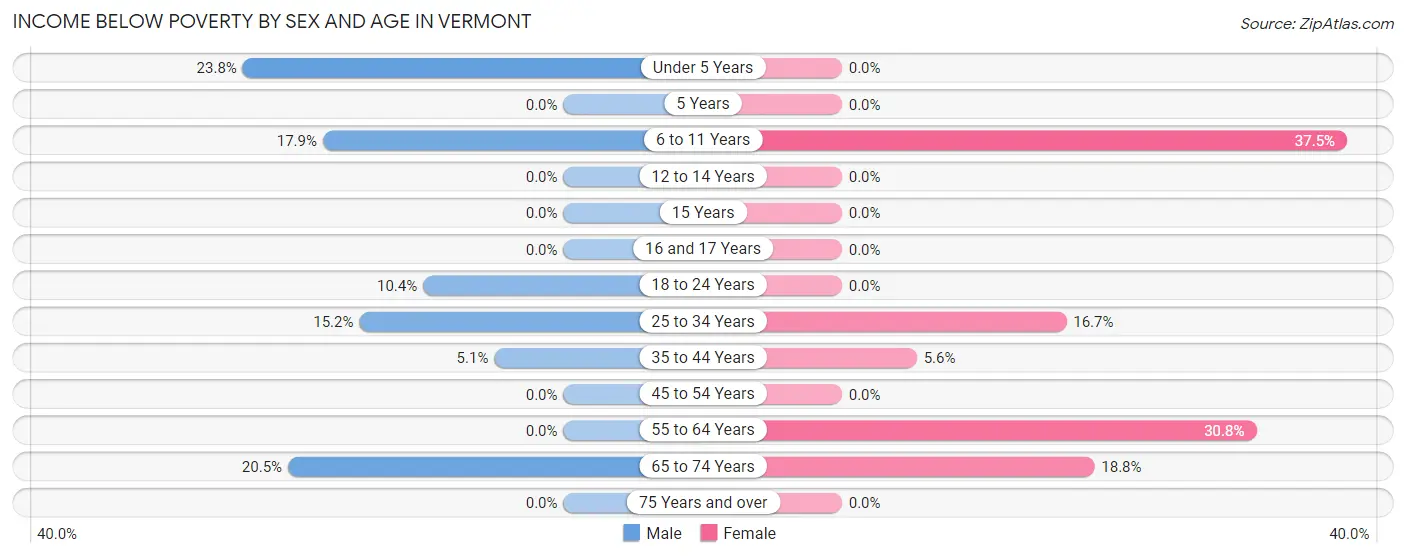
| Age Bracket | Male | Female |
| Under 5 Years | 5 (23.8%) | 0 (0.0%) |
| 5 Years | 0 (0.0%) | 0 (0.0%) |
| 6 to 11 Years | 5 (17.9%) | 6 (37.5%) |
| 12 to 14 Years | 0 (0.0%) | 0 (0.0%) |
| 15 Years | 0 (0.0%) | 0 (0.0%) |
| 16 and 17 Years | 0 (0.0%) | 0 (0.0%) |
| 18 to 24 Years | 5 (10.4%) | 0 (0.0%) |
| 25 to 34 Years | 5 (15.1%) | 6 (16.7%) |
| 35 to 44 Years | 2 (5.1%) | 3 (5.6%) |
| 45 to 54 Years | 0 (0.0%) | 0 (0.0%) |
| 55 to 64 Years | 0 (0.0%) | 12 (30.8%) |
| 65 to 74 Years | 9 (20.4%) | 9 (18.8%) |
| 75 Years and over | 0 (0.0%) | 0 (0.0%) |
| Total | 31 (8.7%) | 36 (12.5%) |
Income Above Poverty by Sex and Age in Vermont
According to the poverty statistics in Vermont, males aged 12 to 14 years and females aged 12 to 14 years are the age groups that are most secure financially, with 100.0% of males and 100.0% of females in these age groups living above the poverty line.
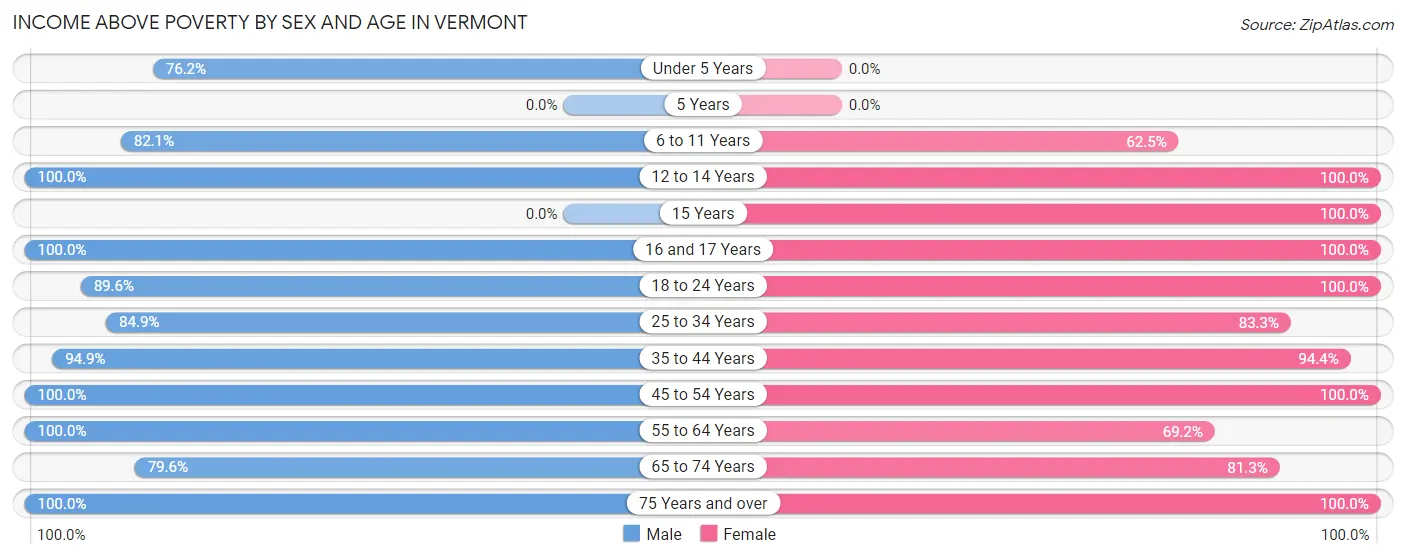
| Age Bracket | Male | Female |
| Under 5 Years | 16 (76.2%) | 0 (0.0%) |
| 5 Years | 0 (0.0%) | 0 (0.0%) |
| 6 to 11 Years | 23 (82.1%) | 10 (62.5%) |
| 12 to 14 Years | 6 (100.0%) | 6 (100.0%) |
| 15 Years | 0 (0.0%) | 6 (100.0%) |
| 16 and 17 Years | 22 (100.0%) | 5 (100.0%) |
| 18 to 24 Years | 43 (89.6%) | 5 (100.0%) |
| 25 to 34 Years | 28 (84.9%) | 30 (83.3%) |
| 35 to 44 Years | 37 (94.9%) | 51 (94.4%) |
| 45 to 54 Years | 37 (100.0%) | 51 (100.0%) |
| 55 to 64 Years | 57 (100.0%) | 27 (69.2%) |
| 65 to 74 Years | 35 (79.5%) | 39 (81.2%) |
| 75 Years and over | 23 (100.0%) | 22 (100.0%) |
| Total | 327 (91.3%) | 252 (87.5%) |
Income Below Poverty Among Married-Couple Families in Vermont
The poverty statistics for married-couple families in Vermont show that 1.9% or 3 of the total 161 families live below the poverty line. Families with 3 or 4 children have the highest poverty rate of 23.1%, comprising of 3 families. On the other hand, families with no children have the lowest poverty rate of 0.0%, which includes 0 families.
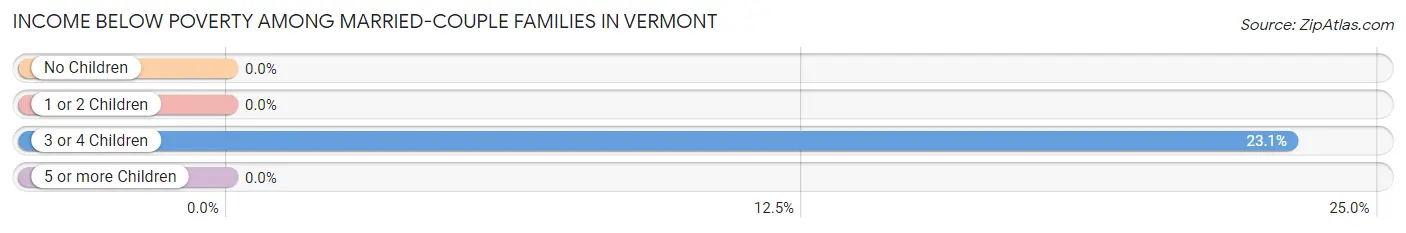
| Children | Above Poverty | Below Poverty |
| No Children | 98 (100.0%) | 0 (0.0%) |
| 1 or 2 Children | 50 (100.0%) | 0 (0.0%) |
| 3 or 4 Children | 10 (76.9%) | 3 (23.1%) |
| 5 or more Children | 0 (0.0%) | 0 (0.0%) |
| Total | 158 (98.1%) | 3 (1.9%) |
Income Below Poverty Among Single-Parent Households in Vermont
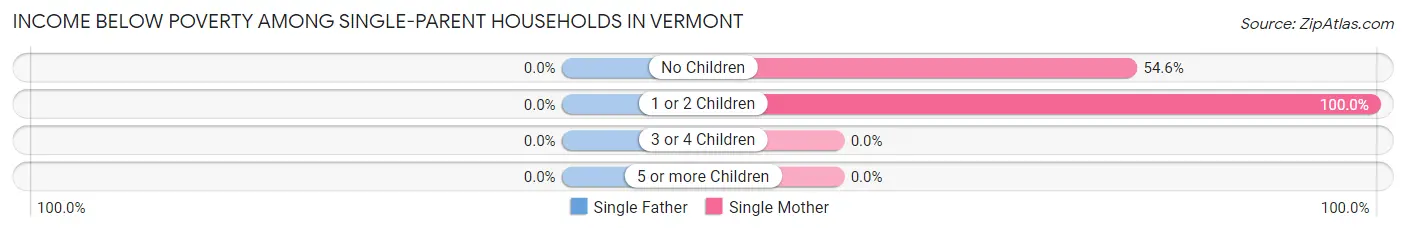
| Children | Single Father | Single Mother |
| No Children | 0 (0.0%) | 6 (54.5%) |
| 1 or 2 Children | 0 (0.0%) | 6 (100.0%) |
| 3 or 4 Children | 0 (0.0%) | 0 (0.0%) |
| 5 or more Children | 0 (0.0%) | 0 (0.0%) |
| Total | 0 (0.0%) | 12 (70.6%) |
Income Below Poverty Among Married-Couple vs Single-Parent Households in Vermont
The poverty data for Vermont shows that 3 of the married-couple family households (1.9%) and 12 of the single-parent households (63.2%) are living below the poverty level. Within the married-couple family households, those with 3 or 4 children have the highest poverty rate, with 3 households (23.1%) falling below the poverty line. Among the single-parent households, those with 1 or 2 children have the highest poverty rate, with 6 household (100.0%) living below poverty.
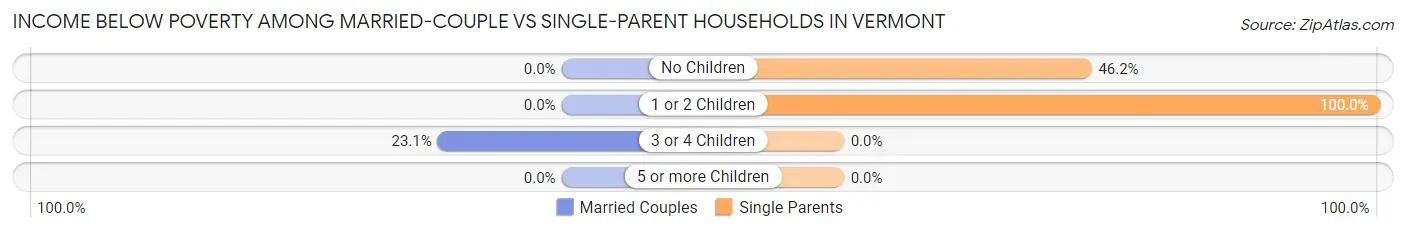
| Children | Married-Couple Families | Single-Parent Households |
| No Children | 0 (0.0%) | 6 (46.2%) |
| 1 or 2 Children | 0 (0.0%) | 6 (100.0%) |
| 3 or 4 Children | 3 (23.1%) | 0 (0.0%) |
| 5 or more Children | 0 (0.0%) | 0 (0.0%) |
| Total | 3 (1.9%) | 12 (63.2%) |
Race in Vermont
The most populous races in Vermont are White / Caucasian (638 | 98.8%), Hispanic or Latino (6 | 0.9%), and Some other Race (3 | 0.5%).
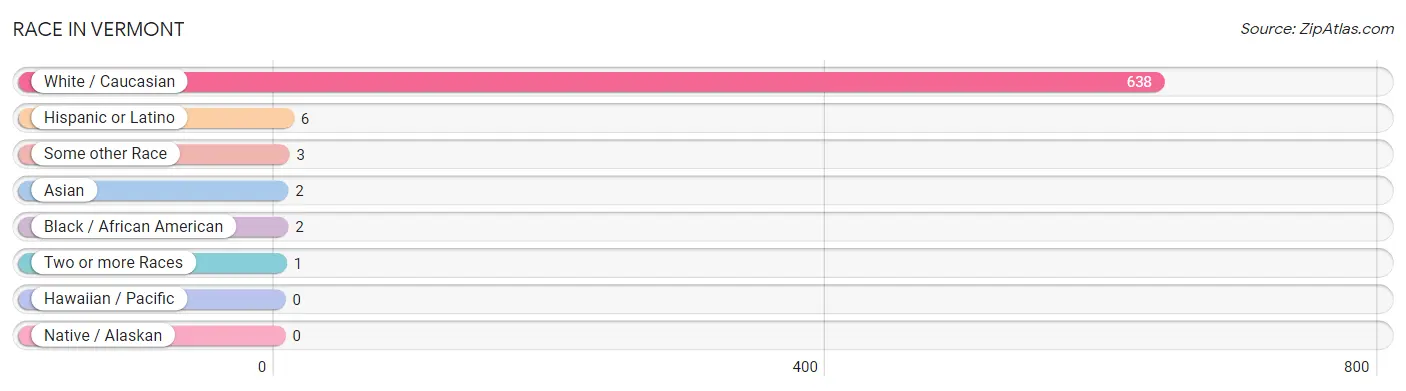
| Race | # Population | % Population |
| Asian | 2 | 0.3% |
| Black / African American | 2 | 0.3% |
| Hawaiian / Pacific | 0 | 0.0% |
| Hispanic or Latino | 6 | 0.9% |
| Native / Alaskan | 0 | 0.0% |
| White / Caucasian | 638 | 98.8% |
| Two or more Races | 1 | 0.2% |
| Some other Race | 3 | 0.5% |
| Total | 646 | 100.0% |
Ancestry in Vermont
The most populous ancestries reported in Vermont are German (202 | 31.3%), English (76 | 11.8%), American (58 | 9.0%), Irish (50 | 7.7%), and Scotch-Irish (42 | 6.5%), together accounting for 66.3% of all Vermont residents.
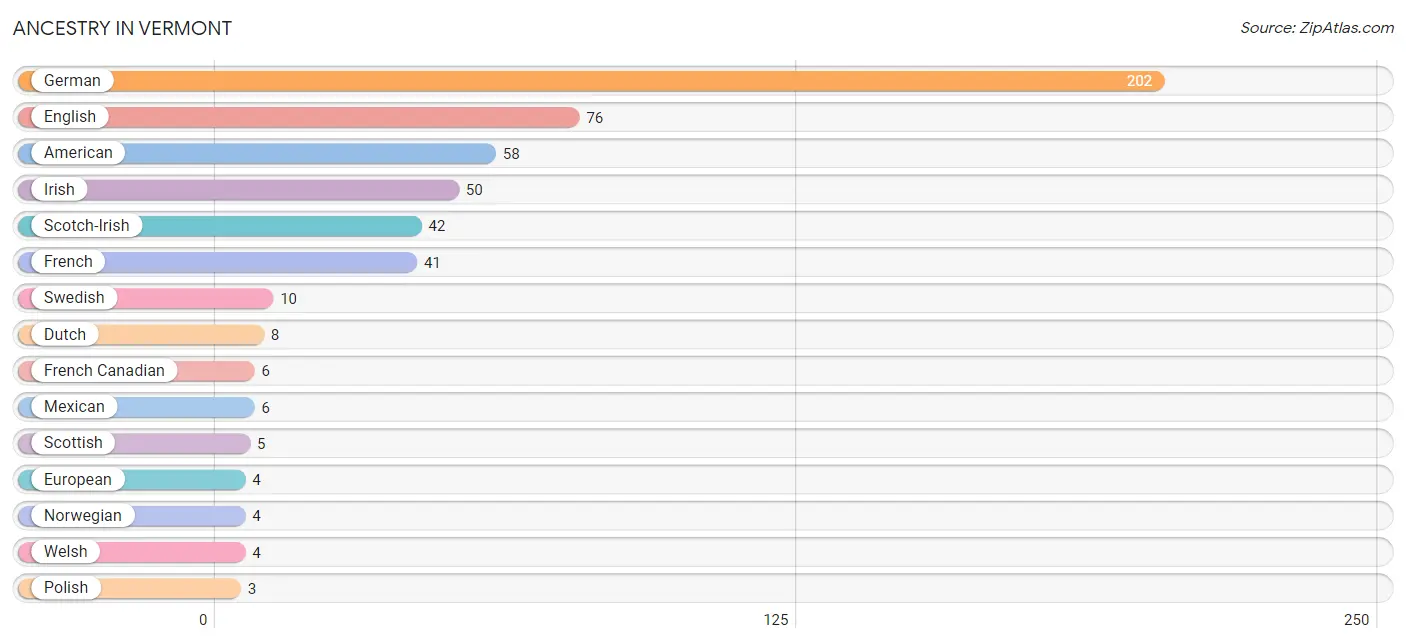
| Ancestry | # Population | % Population |
| American | 58 | 9.0% |
| Dutch | 8 | 1.2% |
| English | 76 | 11.8% |
| European | 4 | 0.6% |
| French | 41 | 6.4% |
| French Canadian | 6 | 0.9% |
| German | 202 | 31.3% |
| Irish | 50 | 7.7% |
| Mexican | 6 | 0.9% |
| Norwegian | 4 | 0.6% |
| Polish | 3 | 0.5% |
| Scotch-Irish | 42 | 6.5% |
| Scottish | 5 | 0.8% |
| Swedish | 10 | 1.5% |
| Swiss | 3 | 0.5% |
| Thai | 2 | 0.3% |
| Welsh | 4 | 0.6% | View All 17 Rows |
Immigrants in Vermont
The most numerous immigrant groups reported in Vermont came from Asia (1 | 0.2%), India (1 | 0.2%), and South Central Asia (1 | 0.2%), together accounting for 0.5% of all Vermont residents.
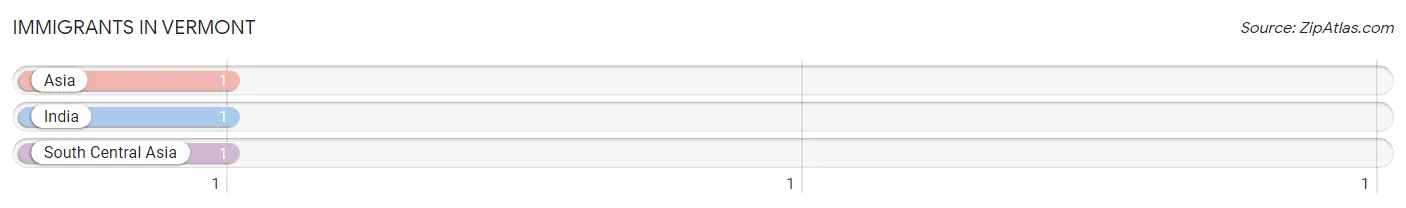
| Immigration Origin | # Population | % Population |
| Asia | 1 | 0.2% |
| India | 1 | 0.2% |
| South Central Asia | 1 | 0.2% | View All 3 Rows |
Sex and Age in Vermont
Sex and Age in Vermont
The most populous age groups in Vermont are 15 to 19 Years (52 | 14.5%) for men and 40 to 44 Years (44 | 15.3%) for women.
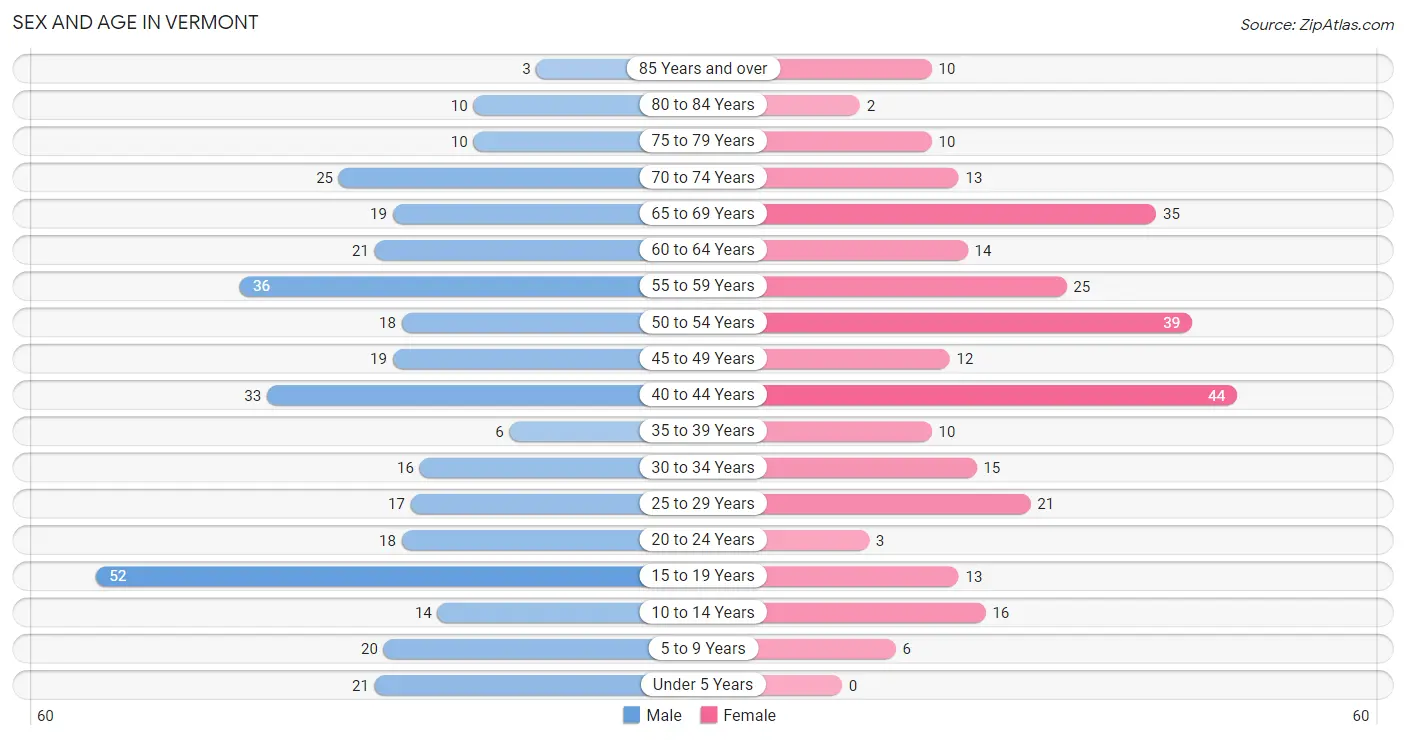
| Age Bracket | Male | Female |
| Under 5 Years | 21 (5.9%) | 0 (0.0%) |
| 5 to 9 Years | 20 (5.6%) | 6 (2.1%) |
| 10 to 14 Years | 14 (3.9%) | 16 (5.6%) |
| 15 to 19 Years | 52 (14.5%) | 13 (4.5%) |
| 20 to 24 Years | 18 (5.0%) | 3 (1.0%) |
| 25 to 29 Years | 17 (4.8%) | 21 (7.3%) |
| 30 to 34 Years | 16 (4.5%) | 15 (5.2%) |
| 35 to 39 Years | 6 (1.7%) | 10 (3.5%) |
| 40 to 44 Years | 33 (9.2%) | 44 (15.3%) |
| 45 to 49 Years | 19 (5.3%) | 12 (4.2%) |
| 50 to 54 Years | 18 (5.0%) | 39 (13.5%) |
| 55 to 59 Years | 36 (10.1%) | 25 (8.7%) |
| 60 to 64 Years | 21 (5.9%) | 14 (4.9%) |
| 65 to 69 Years | 19 (5.3%) | 35 (12.1%) |
| 70 to 74 Years | 25 (7.0%) | 13 (4.5%) |
| 75 to 79 Years | 10 (2.8%) | 10 (3.5%) |
| 80 to 84 Years | 10 (2.8%) | 2 (0.7%) |
| 85 Years and over | 3 (0.8%) | 10 (3.5%) |
| Total | 358 (100.0%) | 288 (100.0%) |
Families and Households in Vermont
Median Family Size in Vermont
The median family size in Vermont is 2.75 persons per family, with married-couple families (161 | 89.4%) accounting for the largest median family size of 2.83 persons per family. On the other hand, single male/father families (2 | 1.1%) represent the smallest median family size with 2.00 persons per family.
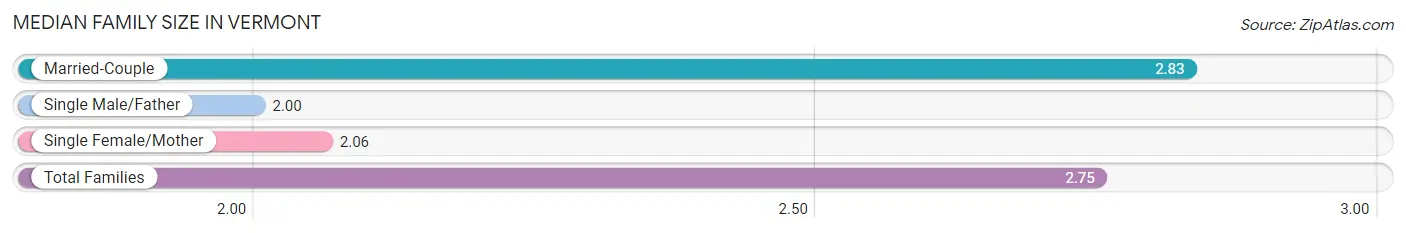
| Family Type | # Families | Family Size |
| Married-Couple | 161 (89.4%) | 2.83 |
| Single Male/Father | 2 (1.1%) | 2.00 |
| Single Female/Mother | 17 (9.4%) | 2.06 |
| Total Families | 180 (100.0%) | 2.75 |
Median Household Size in Vermont
The median household size in Vermont is 2.11 persons per household, with married-couple households (161 | 52.6%) accounting for the largest median household size of 2.83 persons per household. non-family households (126 | 41.2%) represent the smallest median household size with 1.17 persons per household.
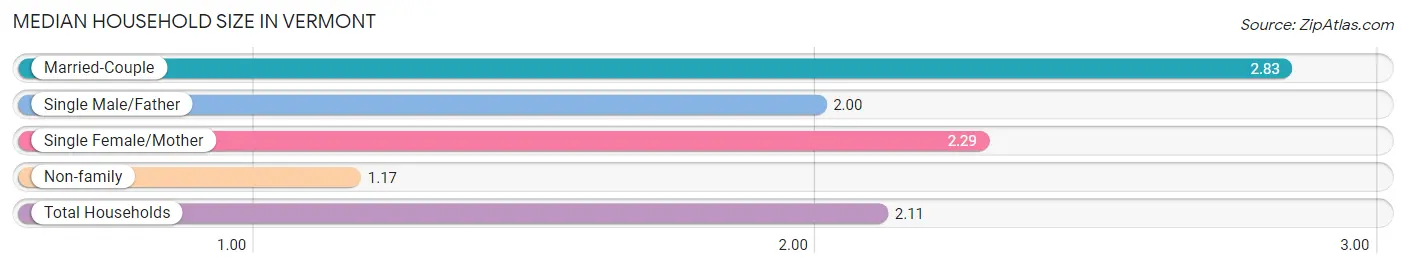
| Household Type | # Households | Household Size |
| Married-Couple | 161 (52.6%) | 2.83 |
| Single Male/Father | 2 (0.6%) | 2.00 |
| Single Female/Mother | 17 (5.6%) | 2.29 |
| Non-family | 126 (41.2%) | 1.17 |
| Total Households | 306 (100.0%) | 2.11 |
Household Size by Marriage Status in Vermont
Out of a total of 306 households in Vermont, 180 (58.8%) are family households, while 126 (41.2%) are nonfamily households. The most numerous type of family households are 2-person households, comprising 107, and the most common type of nonfamily households are 1-person households, comprising 103.
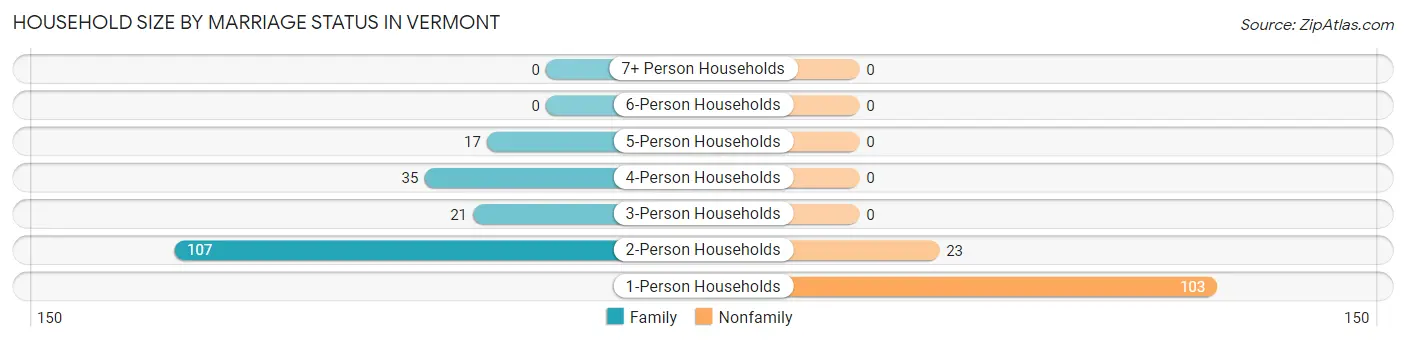
| Household Size | Family Households | Nonfamily Households |
| 1-Person Households | - | 103 (33.7%) |
| 2-Person Households | 107 (35.0%) | 23 (7.5%) |
| 3-Person Households | 21 (6.9%) | 0 (0.0%) |
| 4-Person Households | 35 (11.4%) | 0 (0.0%) |
| 5-Person Households | 17 (5.6%) | 0 (0.0%) |
| 6-Person Households | 0 (0.0%) | 0 (0.0%) |
| 7+ Person Households | 0 (0.0%) | 0 (0.0%) |
| Total | 180 (58.8%) | 126 (41.2%) |
Female Fertility in Vermont
Fertility by Age in Vermont
| Age Bracket | Women with Births | Births / 1,000 Women |
| 15 to 19 years | 0 (0.0%) | 0.0 |
| 20 to 34 years | 0 (0.0%) | 0.0 |
| 35 to 50 years | 0 (0.0%) | 0.0 |
| Total | 0 (0.0%) | 0.0 |
Fertility by Age by Marriage Status in Vermont
| Age Bracket | Married | Unmarried |
| 15 to 19 years | 0 (0.0%) | 0 (0.0%) |
| 20 to 34 years | 0 (0.0%) | 0 (0.0%) |
| 35 to 50 years | 0 (0.0%) | 0 (0.0%) |
| Total | 0 (0.0%) | 0 (0.0%) |
Fertility by Education in Vermont
| Educational Attainment | Women with Births | Births / 1,000 Women |
| Less than High School | 0 (0.0%) | 0.0 |
| High School Diploma | 0 (0.0%) | 0.0 |
| College or Associate's Degree | 0 (0.0%) | 0.0 |
| Bachelor's Degree | 0 (0.0%) | 0.0 |
| Graduate Degree | 0 (0.0%) | 0.0 |
| Total | 0 (0.0%) | 0.0 |
Fertility by Education by Marriage Status in Vermont
| Educational Attainment | Married | Unmarried |
| Less than High School | 0 (0.0%) | 0 (0.0%) |
| High School Diploma | 0 (0.0%) | 0 (0.0%) |
| College or Associate's Degree | 0 (0.0%) | 0 (0.0%) |
| Bachelor's Degree | 0 (0.0%) | 0 (0.0%) |
| Graduate Degree | 0 (0.0%) | 0 (0.0%) |
| Total | 0 (0.0%) | 0 (0.0%) |
Employment Characteristics in Vermont
Employment by Class of Employer in Vermont
Among the 288 employed individuals in Vermont, private company employees (157 | 54.5%), not-for-profit organizations (43 | 14.9%), and self-employed (not incorporated) (37 | 12.9%) make up the most common classes of employment.
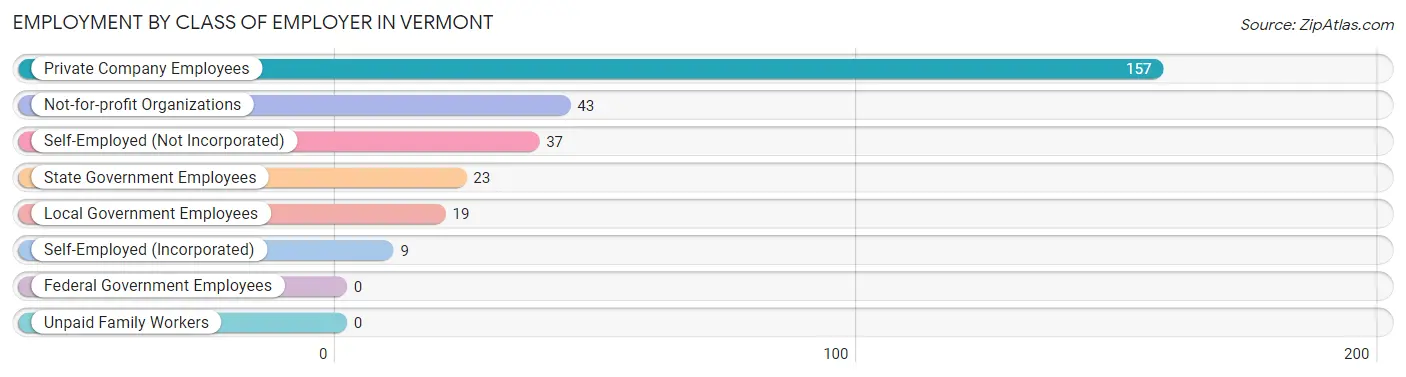
| Employer Class | # Employees | % Employees |
| Private Company Employees | 157 | 54.5% |
| Self-Employed (Incorporated) | 9 | 3.1% |
| Self-Employed (Not Incorporated) | 37 | 12.9% |
| Not-for-profit Organizations | 43 | 14.9% |
| Local Government Employees | 19 | 6.6% |
| State Government Employees | 23 | 8.0% |
| Federal Government Employees | 0 | 0.0% |
| Unpaid Family Workers | 0 | 0.0% |
| Total | 288 | 100.0% |
Employment Status by Age in Vermont
According to the labor force statistics for Vermont, out of the total population over 16 years of age (563), 56.7% or 319 individuals are in the labor force, with 4.4% or 14 of them unemployed. The age group with the highest labor force participation rate is 35 to 44 years, with 95.7% or 89 individuals in the labor force. Within the labor force, the 16 to 19 years age range has the highest percentage of unemployed individuals, with 26.3% or 5 of them being unemployed.
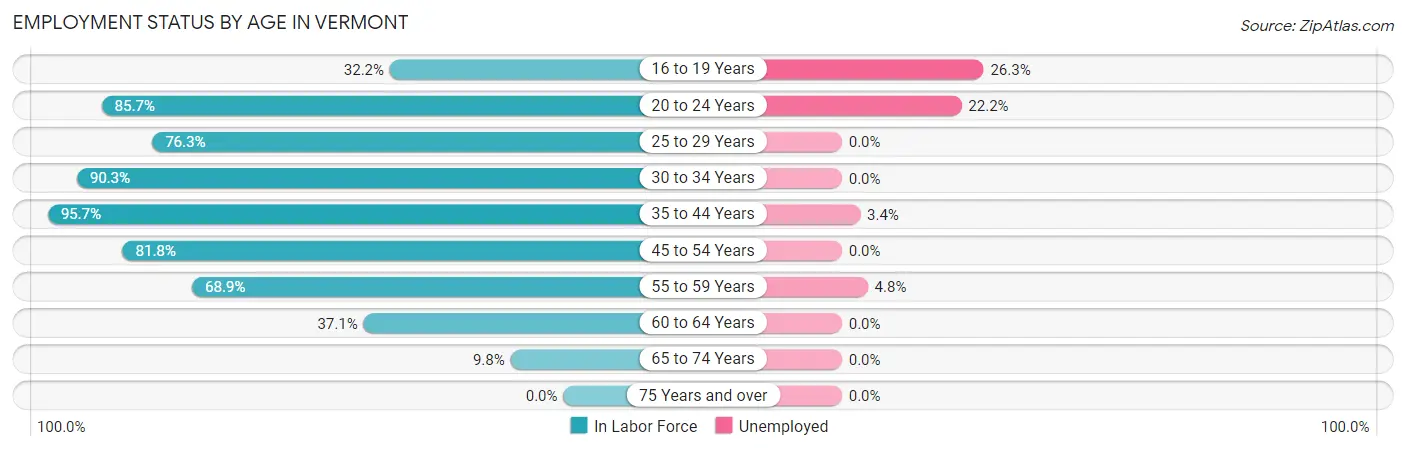
| Age Bracket | In Labor Force | Unemployed |
| 16 to 19 Years | 19 (32.2%) | 5 (26.3%) |
| 20 to 24 Years | 18 (85.7%) | 4 (22.2%) |
| 25 to 29 Years | 29 (76.3%) | 0 (0.0%) |
| 30 to 34 Years | 28 (90.3%) | 0 (0.0%) |
| 35 to 44 Years | 89 (95.7%) | 3 (3.4%) |
| 45 to 54 Years | 72 (81.8%) | 0 (0.0%) |
| 55 to 59 Years | 42 (68.9%) | 2 (4.8%) |
| 60 to 64 Years | 13 (37.1%) | 0 (0.0%) |
| 65 to 74 Years | 9 (9.8%) | 0 (0.0%) |
| 75 Years and over | 0 (0.0%) | 0 (0.0%) |
| Total | 319 (56.7%) | 14 (4.4%) |
Employment Status by Educational Attainment in Vermont
According to labor force statistics for Vermont, 78.9% of individuals (273) out of the total population between 25 and 64 years of age (346) are in the labor force, with 1.8% or 5 of them being unemployed. The group with the highest labor force participation rate are those with the educational attainment of college / associate degree, with 82.7% or 105 individuals in the labor force. Within the labor force, individuals with less than high school education have the highest percentage of unemployment, with 33.3% or 2 of them being unemployed.
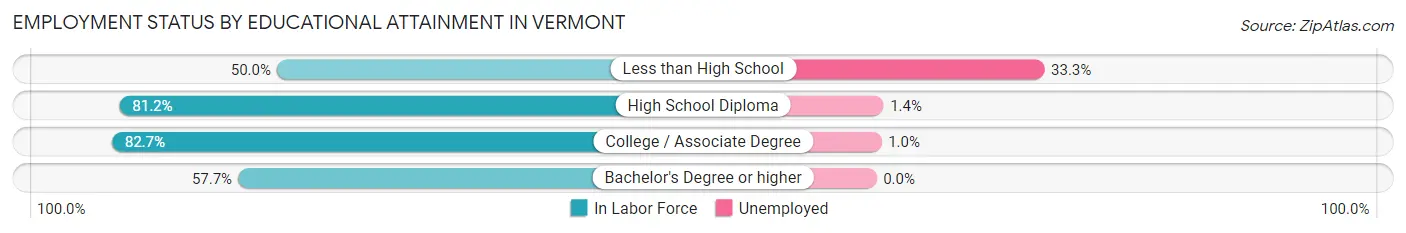
| Educational Attainment | In Labor Force | Unemployed |
| Less than High School | 6 (50.0%) | 4 (33.3%) |
| High School Diploma | 147 (81.2%) | 3 (1.4%) |
| College / Associate Degree | 105 (82.7%) | 1 (1.0%) |
| Bachelor's Degree or higher | 15 (57.7%) | 0 (0.0%) |
| Total | 273 (78.9%) | 6 (1.8%) |
Employment Occupations by Sex in Vermont
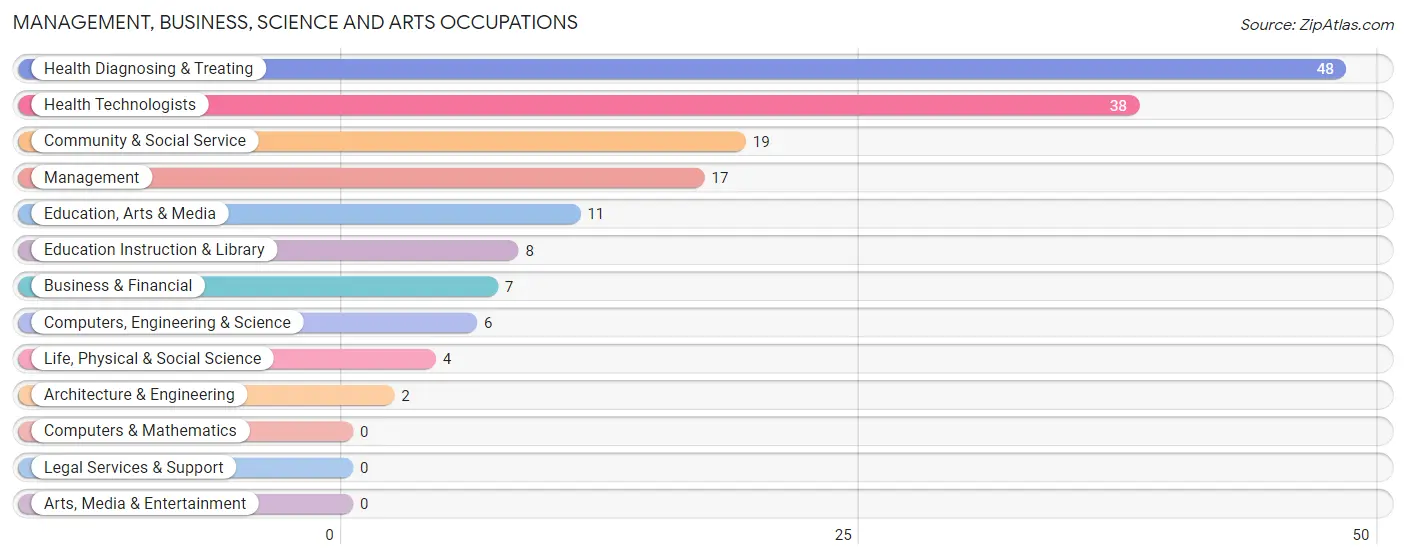
Management, Business, Science and Arts Occupations
The most common Management, Business, Science and Arts occupations in Vermont are Health Diagnosing & Treating (48 | 15.7%), Health Technologists (38 | 12.5%), Community & Social Service (19 | 6.2%), Management (17 | 5.6%), and Education, Arts & Media (11 | 3.6%).
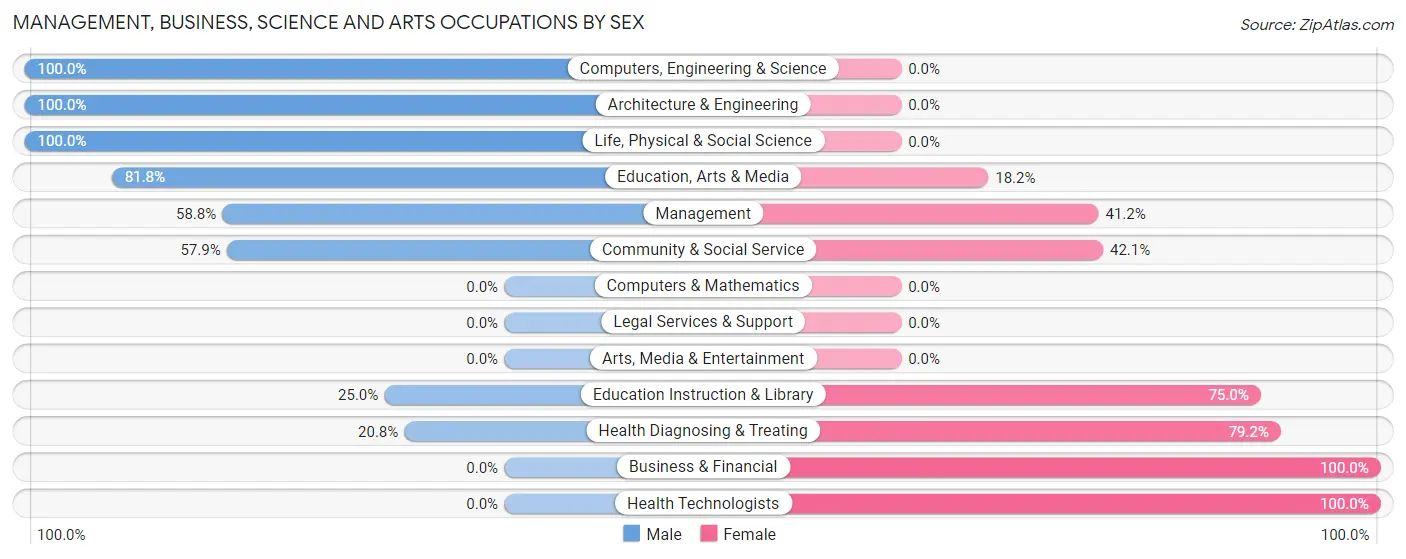
Management, Business, Science and Arts Occupations by Sex
Within the Management, Business, Science and Arts occupations in Vermont, the most male-oriented occupations are Computers, Engineering & Science (100.0%), Architecture & Engineering (100.0%), and Life, Physical & Social Science (100.0%), while the most female-oriented occupations are Business & Financial (100.0%), Health Technologists (100.0%), and Health Diagnosing & Treating (79.2%).
| Occupation | Male | Female |
| Management | 10 (58.8%) | 7 (41.2%) |
| Business & Financial | 0 (0.0%) | 7 (100.0%) |
| Computers, Engineering & Science | 6 (100.0%) | 0 (0.0%) |
| Computers & Mathematics | 0 (0.0%) | 0 (0.0%) |
| Architecture & Engineering | 2 (100.0%) | 0 (0.0%) |
| Life, Physical & Social Science | 4 (100.0%) | 0 (0.0%) |
| Community & Social Service | 11 (57.9%) | 8 (42.1%) |
| Education, Arts & Media | 9 (81.8%) | 2 (18.2%) |
| Legal Services & Support | 0 (0.0%) | 0 (0.0%) |
| Education Instruction & Library | 2 (25.0%) | 6 (75.0%) |
| Arts, Media & Entertainment | 0 (0.0%) | 0 (0.0%) |
| Health Diagnosing & Treating | 10 (20.8%) | 38 (79.2%) |
| Health Technologists | 0 (0.0%) | 38 (100.0%) |
| Total (Category) | 37 (38.1%) | 60 (61.9%) |
| Total (Overall) | 170 (55.7%) | 135 (44.3%) |
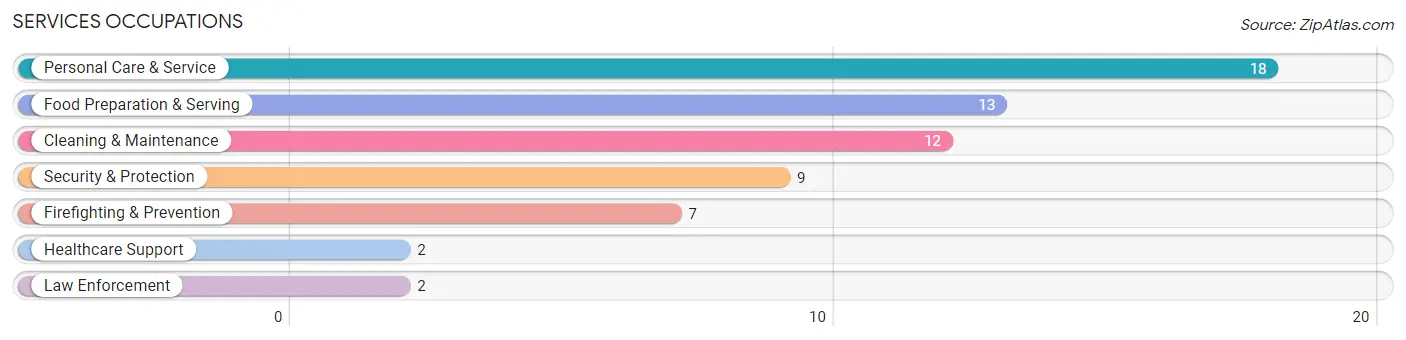
Services Occupations
The most common Services occupations in Vermont are Personal Care & Service (18 | 5.9%), Food Preparation & Serving (13 | 4.3%), Cleaning & Maintenance (12 | 3.9%), Security & Protection (9 | 2.9%), and Firefighting & Prevention (7 | 2.3%).
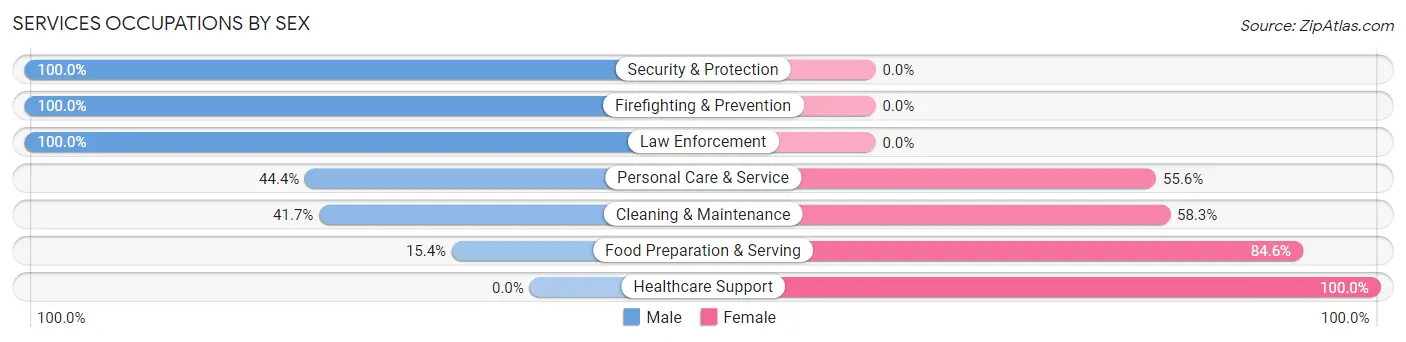
Services Occupations by Sex
Within the Services occupations in Vermont, the most male-oriented occupations are Security & Protection (100.0%), Firefighting & Prevention (100.0%), and Law Enforcement (100.0%), while the most female-oriented occupations are Healthcare Support (100.0%), Food Preparation & Serving (84.6%), and Cleaning & Maintenance (58.3%).
| Occupation | Male | Female |
| Healthcare Support | 0 (0.0%) | 2 (100.0%) |
| Security & Protection | 9 (100.0%) | 0 (0.0%) |
| Firefighting & Prevention | 7 (100.0%) | 0 (0.0%) |
| Law Enforcement | 2 (100.0%) | 0 (0.0%) |
| Food Preparation & Serving | 2 (15.4%) | 11 (84.6%) |
| Cleaning & Maintenance | 5 (41.7%) | 7 (58.3%) |
| Personal Care & Service | 8 (44.4%) | 10 (55.6%) |
| Total (Category) | 24 (44.4%) | 30 (55.6%) |
| Total (Overall) | 170 (55.7%) | 135 (44.3%) |
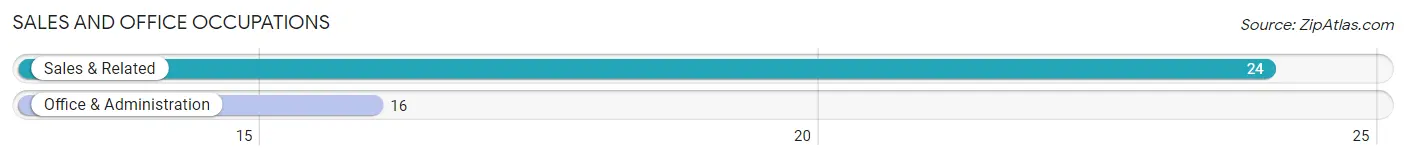
Sales and Office Occupations
The most common Sales and Office occupations in Vermont are Sales & Related (24 | 7.9%), and Office & Administration (16 | 5.2%).
Sales and Office Occupations by Sex
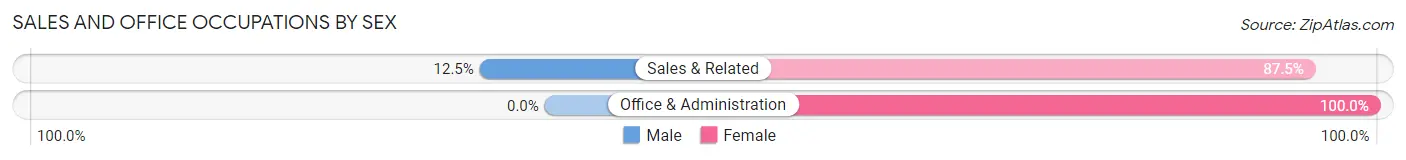
| Occupation | Male | Female |
| Sales & Related | 3 (12.5%) | 21 (87.5%) |
| Office & Administration | 0 (0.0%) | 16 (100.0%) |
| Total (Category) | 3 (7.5%) | 37 (92.5%) |
| Total (Overall) | 170 (55.7%) | 135 (44.3%) |
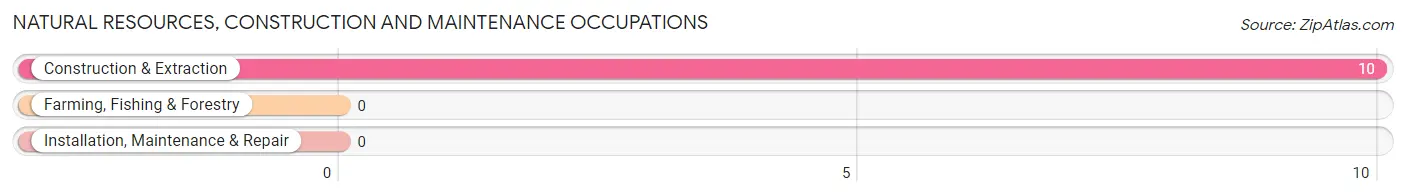
Natural Resources, Construction and Maintenance Occupations
The most common Natural Resources, Construction and Maintenance occupations in Vermont are , and Construction & Extraction (10 | 3.3%).
Natural Resources, Construction and Maintenance Occupations by Sex
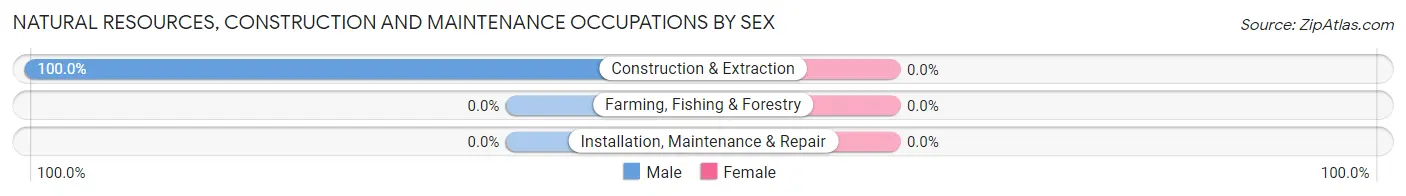
| Occupation | Male | Female |
| Farming, Fishing & Forestry | 0 (0.0%) | 0 (0.0%) |
| Construction & Extraction | 10 (100.0%) | 0 (0.0%) |
| Installation, Maintenance & Repair | 0 (0.0%) | 0 (0.0%) |
| Total (Category) | 10 (100.0%) | 0 (0.0%) |
| Total (Overall) | 170 (55.7%) | 135 (44.3%) |
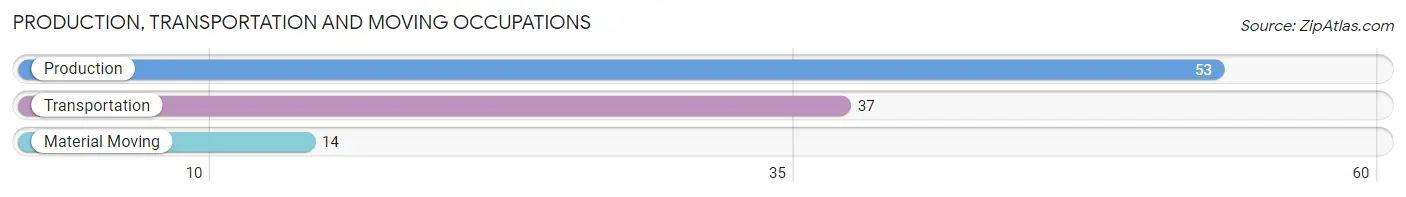
Production, Transportation and Moving Occupations
The most common Production, Transportation and Moving occupations in Vermont are Production (53 | 17.4%), Transportation (37 | 12.1%), and Material Moving (14 | 4.6%).
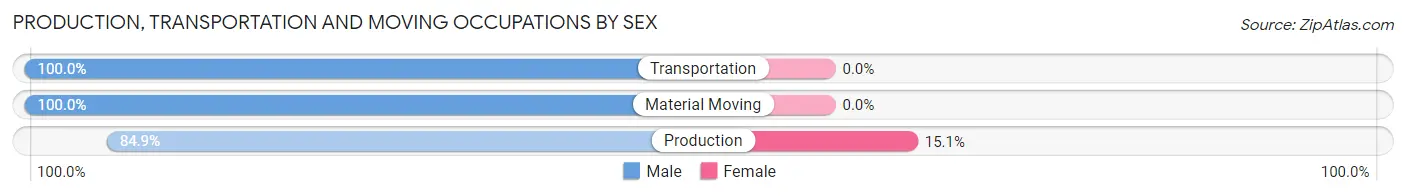
Production, Transportation and Moving Occupations by Sex
| Occupation | Male | Female |
| Production | 45 (84.9%) | 8 (15.1%) |
| Transportation | 37 (100.0%) | 0 (0.0%) |
| Material Moving | 14 (100.0%) | 0 (0.0%) |
| Total (Category) | 96 (92.3%) | 8 (7.7%) |
| Total (Overall) | 170 (55.7%) | 135 (44.3%) |
Employment Industries by Sex in Vermont
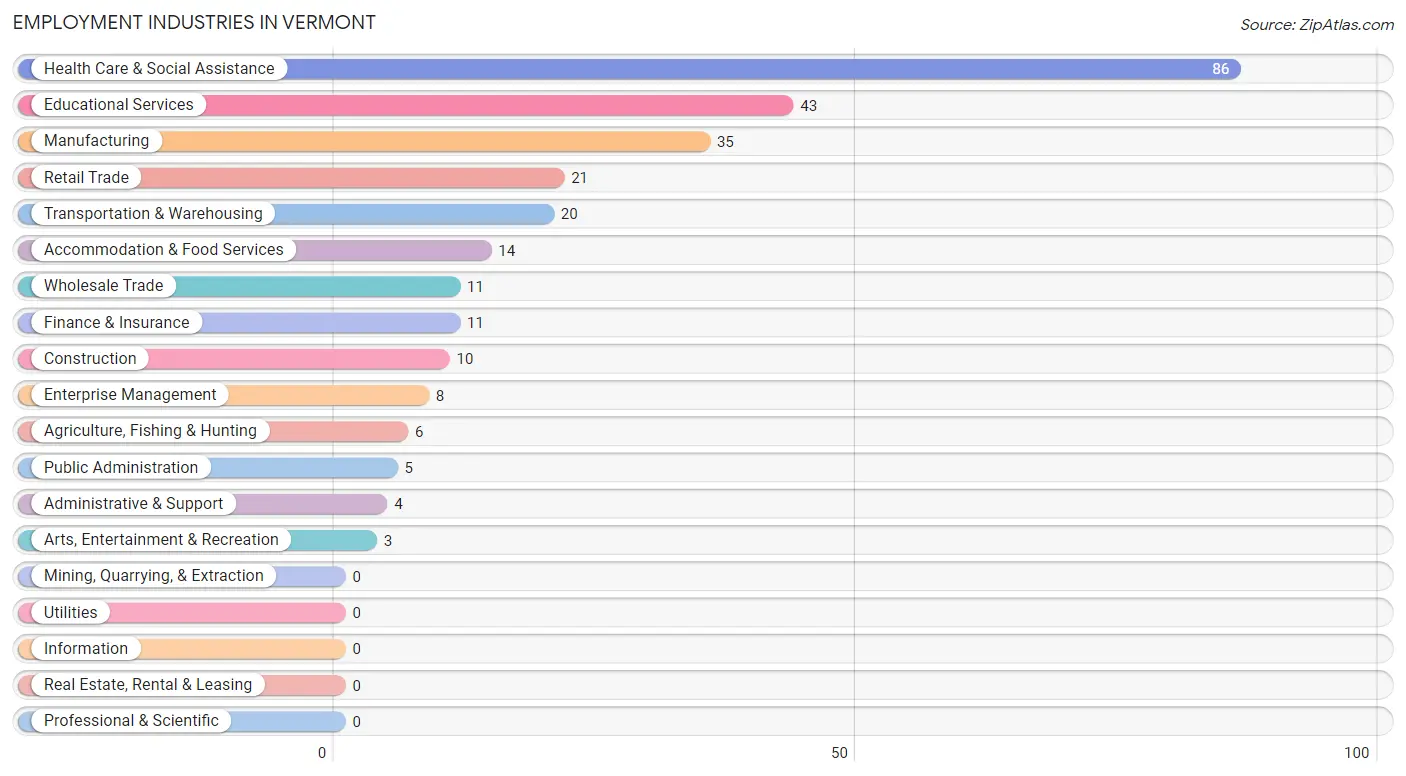
Employment Industries in Vermont
The major employment industries in Vermont include Health Care & Social Assistance (86 | 28.2%), Educational Services (43 | 14.1%), Manufacturing (35 | 11.5%), Retail Trade (21 | 6.9%), and Transportation & Warehousing (20 | 6.6%).
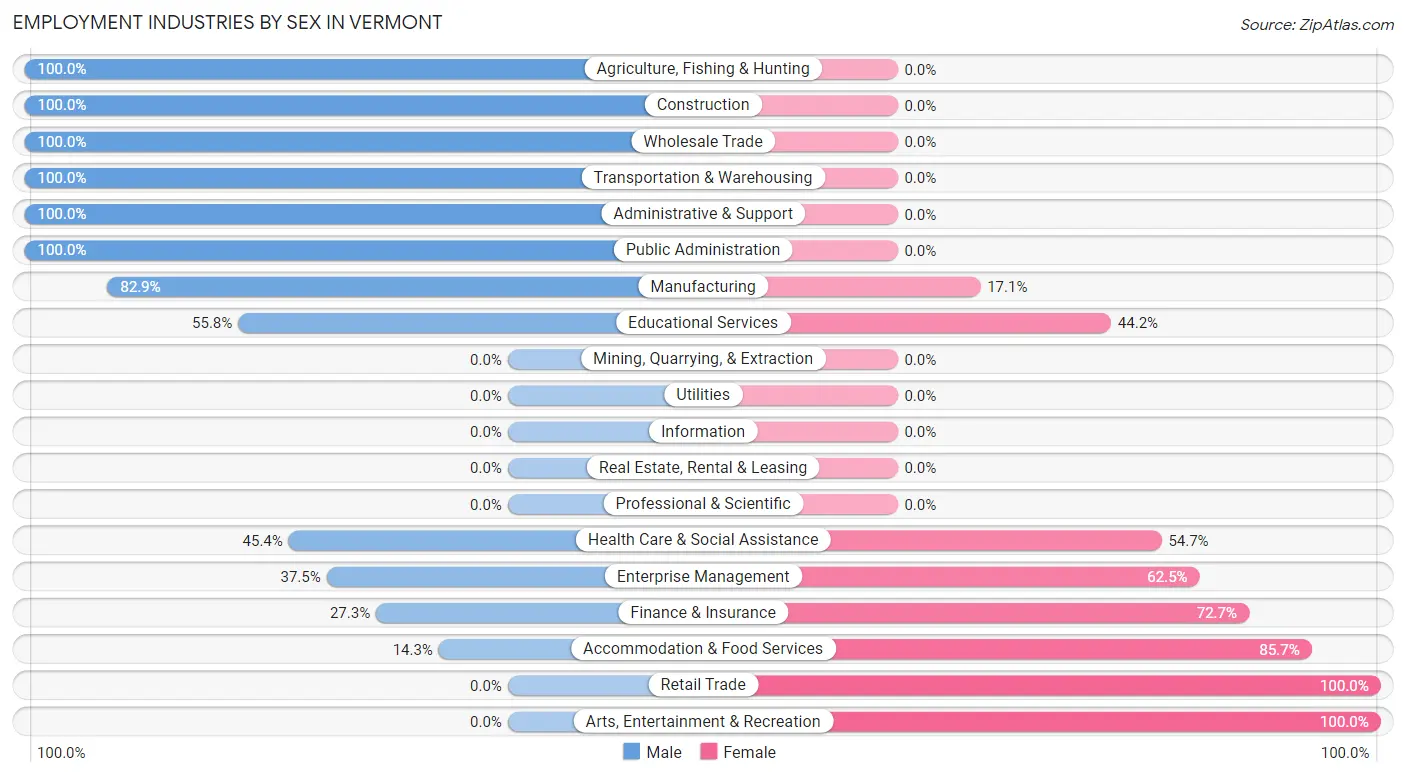
Employment Industries by Sex in Vermont
The Vermont industries that see more men than women are Agriculture, Fishing & Hunting (100.0%), Construction (100.0%), and Wholesale Trade (100.0%), whereas the industries that tend to have a higher number of women are Retail Trade (100.0%), Arts, Entertainment & Recreation (100.0%), and Accommodation & Food Services (85.7%).
| Industry | Male | Female |
| Agriculture, Fishing & Hunting | 6 (100.0%) | 0 (0.0%) |
| Mining, Quarrying, & Extraction | 0 (0.0%) | 0 (0.0%) |
| Construction | 10 (100.0%) | 0 (0.0%) |
| Manufacturing | 29 (82.9%) | 6 (17.1%) |
| Wholesale Trade | 11 (100.0%) | 0 (0.0%) |
| Retail Trade | 0 (0.0%) | 21 (100.0%) |
| Transportation & Warehousing | 20 (100.0%) | 0 (0.0%) |
| Utilities | 0 (0.0%) | 0 (0.0%) |
| Information | 0 (0.0%) | 0 (0.0%) |
| Finance & Insurance | 3 (27.3%) | 8 (72.7%) |
| Real Estate, Rental & Leasing | 0 (0.0%) | 0 (0.0%) |
| Professional & Scientific | 0 (0.0%) | 0 (0.0%) |
| Enterprise Management | 3 (37.5%) | 5 (62.5%) |
| Administrative & Support | 4 (100.0%) | 0 (0.0%) |
| Educational Services | 24 (55.8%) | 19 (44.2%) |
| Health Care & Social Assistance | 39 (45.4%) | 47 (54.6%) |
| Arts, Entertainment & Recreation | 0 (0.0%) | 3 (100.0%) |
| Accommodation & Food Services | 2 (14.3%) | 12 (85.7%) |
| Public Administration | 5 (100.0%) | 0 (0.0%) |
| Total | 170 (55.7%) | 135 (44.3%) |
Education in Vermont
School Enrollment in Vermont
The most common levels of schooling among the 112 students in Vermont are high school (39 | 34.8%), middle school (26 | 23.2%), and elementary school (25 | 22.3%).
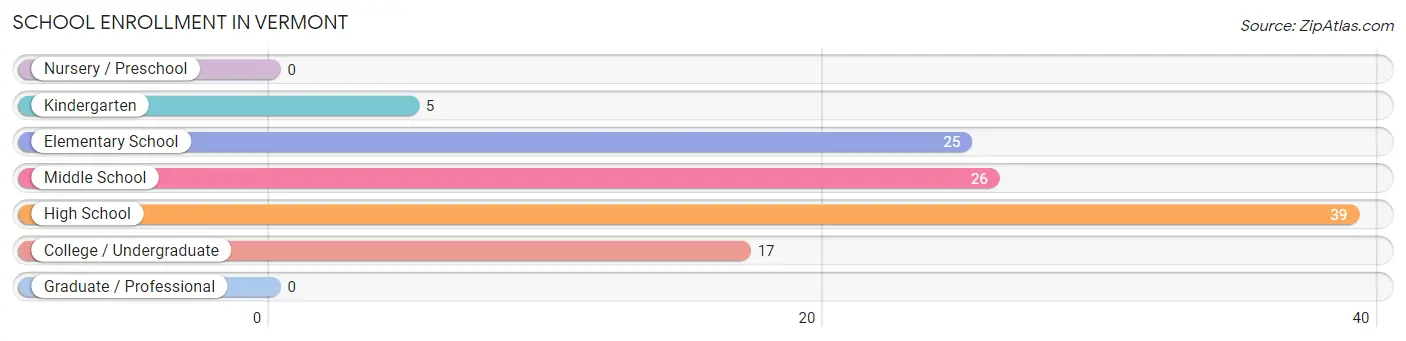
| School Level | # Students | % Students |
| Nursery / Preschool | 0 | 0.0% |
| Kindergarten | 5 | 4.5% |
| Elementary School | 25 | 22.3% |
| Middle School | 26 | 23.2% |
| High School | 39 | 34.8% |
| College / Undergraduate | 17 | 15.2% |
| Graduate / Professional | 0 | 0.0% |
| Total | 112 | 100.0% |
School Enrollment by Age by Funding Source in Vermont
Out of a total of 112 students who are enrolled in schools in Vermont, 16 (14.3%) attend a private institution, while the remaining 96 (85.7%) are enrolled in public schools. The age group of 18 to 19 year olds has the highest likelihood of being enrolled in private schools, with 9 (50.0% in the age bracket) enrolled. Conversely, the age group of 5 to 9 year old has the lowest likelihood of being enrolled in a private school, with 26 (100.0% in the age bracket) attending a public institution.
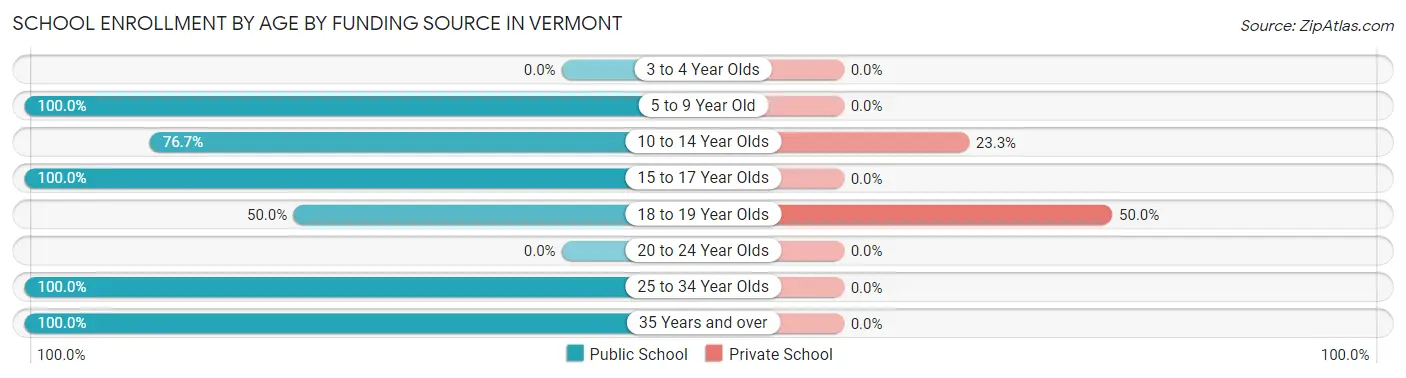
| Age Bracket | Public School | Private School |
| 3 to 4 Year Olds | 0 (0.0%) | 0 (0.0%) |
| 5 to 9 Year Old | 26 (100.0%) | 0 (0.0%) |
| 10 to 14 Year Olds | 23 (76.7%) | 7 (23.3%) |
| 15 to 17 Year Olds | 33 (100.0%) | 0 (0.0%) |
| 18 to 19 Year Olds | 9 (50.0%) | 9 (50.0%) |
| 20 to 24 Year Olds | 0 (0.0%) | 0 (0.0%) |
| 25 to 34 Year Olds | 3 (100.0%) | 0 (0.0%) |
| 35 Years and over | 2 (100.0%) | 0 (0.0%) |
| Total | 96 (85.7%) | 16 (14.3%) |
Educational Attainment by Field of Study in Vermont
Business (9 | 22.5%), education (8 | 20.0%), visual & performing arts (8 | 20.0%), arts & humanities (7 | 17.5%), and social sciences (5 | 12.5%) are the most common fields of study among 40 individuals in Vermont who have obtained a bachelor's degree or higher.
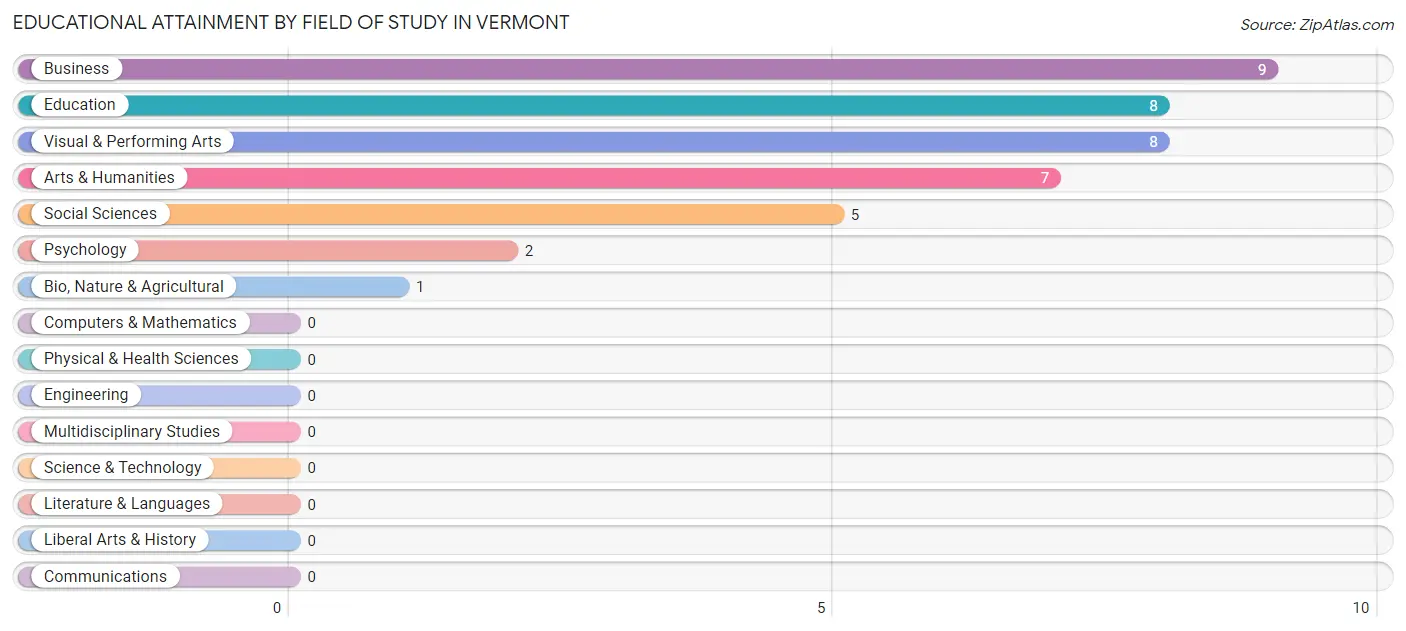
| Field of Study | # Graduates | % Graduates |
| Computers & Mathematics | 0 | 0.0% |
| Bio, Nature & Agricultural | 1 | 2.5% |
| Physical & Health Sciences | 0 | 0.0% |
| Psychology | 2 | 5.0% |
| Social Sciences | 5 | 12.5% |
| Engineering | 0 | 0.0% |
| Multidisciplinary Studies | 0 | 0.0% |
| Science & Technology | 0 | 0.0% |
| Business | 9 | 22.5% |
| Education | 8 | 20.0% |
| Literature & Languages | 0 | 0.0% |
| Liberal Arts & History | 0 | 0.0% |
| Visual & Performing Arts | 8 | 20.0% |
| Communications | 0 | 0.0% |
| Arts & Humanities | 7 | 17.5% |
| Total | 40 | 100.0% |
Transportation & Commute in Vermont
Vehicle Availability by Sex in Vermont
The most prevalent vehicle ownership categories in Vermont are males with 2 vehicles (55, accounting for 34.8%) and females with 2 vehicles (76, making up 42.3%).
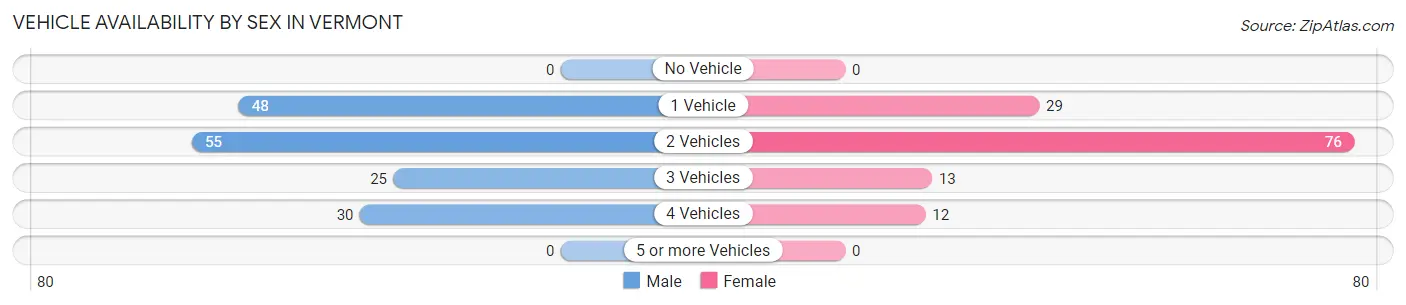
| Vehicles Available | Male | Female |
| No Vehicle | 0 (0.0%) | 0 (0.0%) |
| 1 Vehicle | 48 (30.4%) | 29 (22.3%) |
| 2 Vehicles | 55 (34.8%) | 76 (58.5%) |
| 3 Vehicles | 25 (15.8%) | 13 (10.0%) |
| 4 Vehicles | 30 (19.0%) | 12 (9.2%) |
| 5 or more Vehicles | 0 (0.0%) | 0 (0.0%) |
| Total | 158 (100.0%) | 130 (100.0%) |
Commute Time in Vermont
The most frequently occuring commute durations in Vermont are 5 to 9 minutes (42 commuters, 15.2%), 30 to 34 minutes (41 commuters, 14.8%), and less than 5 minutes (39 commuters, 14.1%).
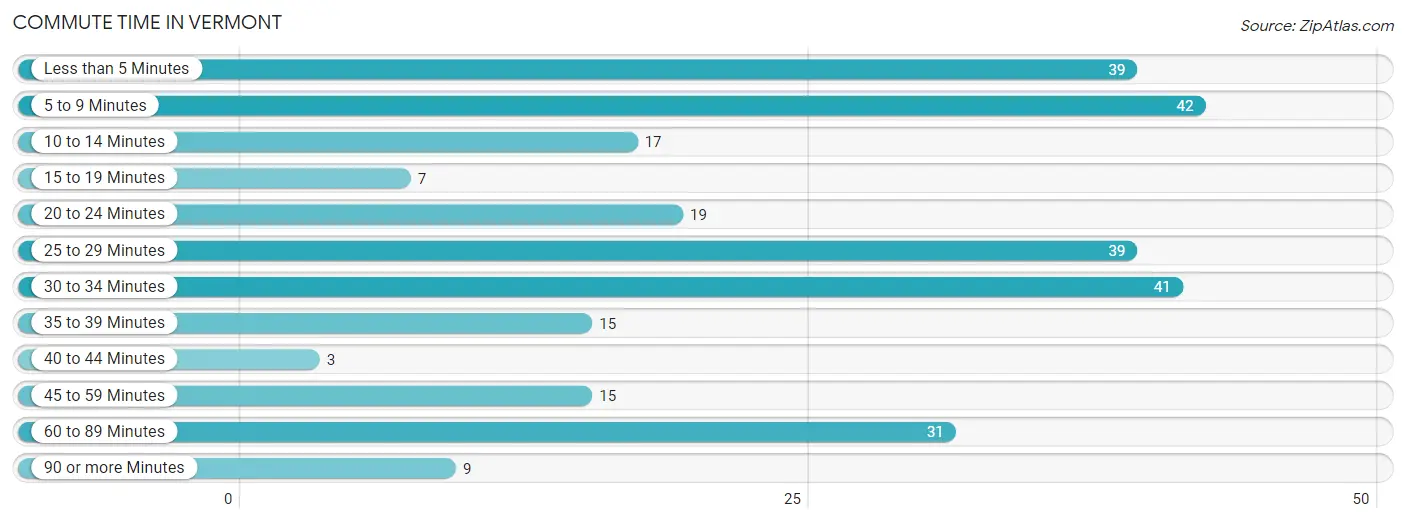
| Commute Time | # Commuters | % Commuters |
| Less than 5 Minutes | 39 | 14.1% |
| 5 to 9 Minutes | 42 | 15.2% |
| 10 to 14 Minutes | 17 | 6.1% |
| 15 to 19 Minutes | 7 | 2.5% |
| 20 to 24 Minutes | 19 | 6.9% |
| 25 to 29 Minutes | 39 | 14.1% |
| 30 to 34 Minutes | 41 | 14.8% |
| 35 to 39 Minutes | 15 | 5.4% |
| 40 to 44 Minutes | 3 | 1.1% |
| 45 to 59 Minutes | 15 | 5.4% |
| 60 to 89 Minutes | 31 | 11.2% |
| 90 or more Minutes | 9 | 3.3% |
Commute Time by Sex in Vermont
The most common commute times in Vermont are 30 to 34 minutes (41 commuters, 27.9%) for males and less than 5 minutes (31 commuters, 23.8%) for females.
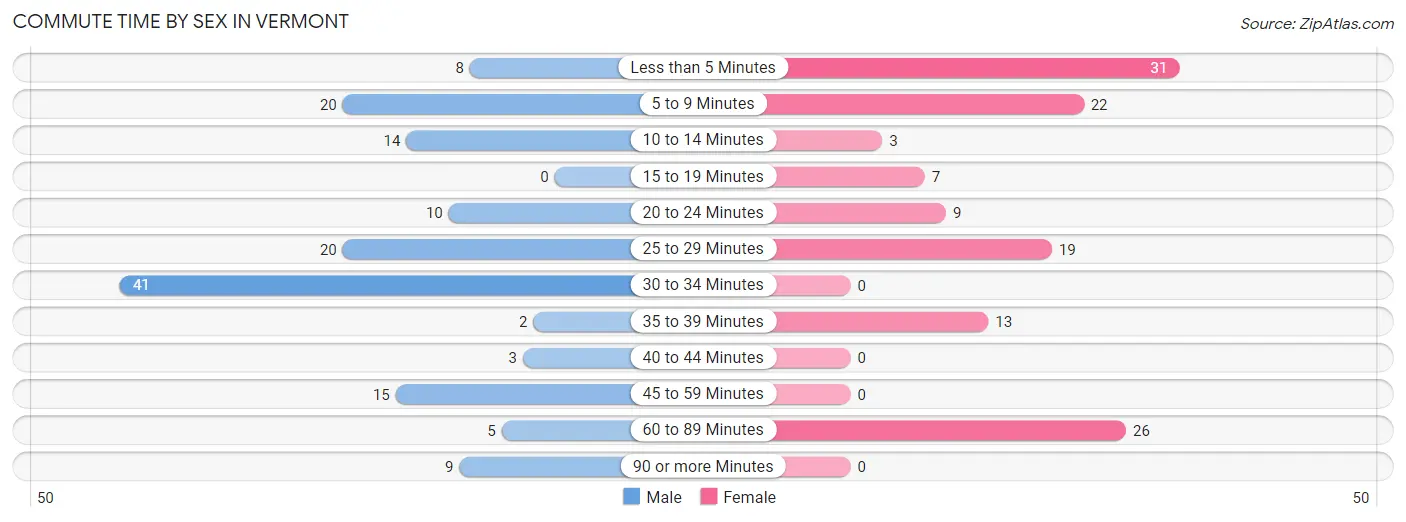
| Commute Time | Male | Female |
| Less than 5 Minutes | 8 (5.4%) | 31 (23.8%) |
| 5 to 9 Minutes | 20 (13.6%) | 22 (16.9%) |
| 10 to 14 Minutes | 14 (9.5%) | 3 (2.3%) |
| 15 to 19 Minutes | 0 (0.0%) | 7 (5.4%) |
| 20 to 24 Minutes | 10 (6.8%) | 9 (6.9%) |
| 25 to 29 Minutes | 20 (13.6%) | 19 (14.6%) |
| 30 to 34 Minutes | 41 (27.9%) | 0 (0.0%) |
| 35 to 39 Minutes | 2 (1.4%) | 13 (10.0%) |
| 40 to 44 Minutes | 3 (2.0%) | 0 (0.0%) |
| 45 to 59 Minutes | 15 (10.2%) | 0 (0.0%) |
| 60 to 89 Minutes | 5 (3.4%) | 26 (20.0%) |
| 90 or more Minutes | 9 (6.1%) | 0 (0.0%) |
Time of Departure to Work by Sex in Vermont
The most frequent times of departure to work in Vermont are 6:00 AM to 6:29 AM (27, 18.4%) for males and 7:00 AM to 7:29 AM (46, 35.4%) for females.
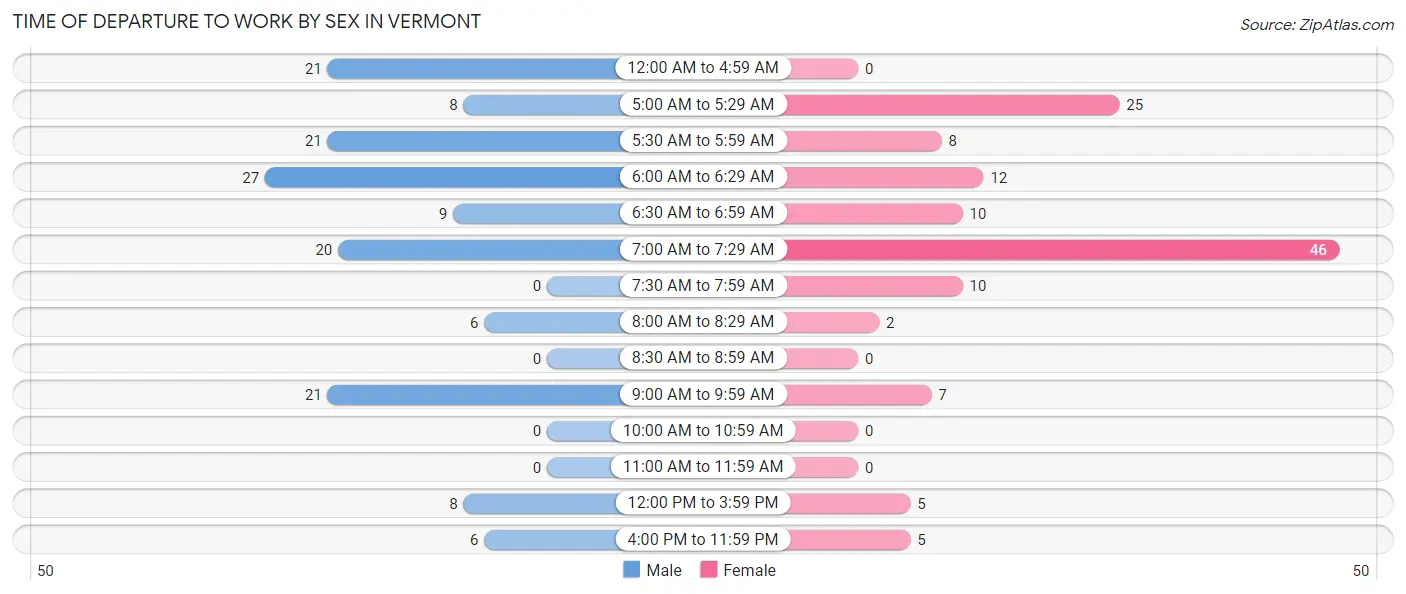
| Time of Departure | Male | Female |
| 12:00 AM to 4:59 AM | 21 (14.3%) | 0 (0.0%) |
| 5:00 AM to 5:29 AM | 8 (5.4%) | 25 (19.2%) |
| 5:30 AM to 5:59 AM | 21 (14.3%) | 8 (6.1%) |
| 6:00 AM to 6:29 AM | 27 (18.4%) | 12 (9.2%) |
| 6:30 AM to 6:59 AM | 9 (6.1%) | 10 (7.7%) |
| 7:00 AM to 7:29 AM | 20 (13.6%) | 46 (35.4%) |
| 7:30 AM to 7:59 AM | 0 (0.0%) | 10 (7.7%) |
| 8:00 AM to 8:29 AM | 6 (4.1%) | 2 (1.5%) |
| 8:30 AM to 8:59 AM | 0 (0.0%) | 0 (0.0%) |
| 9:00 AM to 9:59 AM | 21 (14.3%) | 7 (5.4%) |
| 10:00 AM to 10:59 AM | 0 (0.0%) | 0 (0.0%) |
| 11:00 AM to 11:59 AM | 0 (0.0%) | 0 (0.0%) |
| 12:00 PM to 3:59 PM | 8 (5.4%) | 5 (3.8%) |
| 4:00 PM to 11:59 PM | 6 (4.1%) | 5 (3.8%) |
| Total | 147 (100.0%) | 130 (100.0%) |
Housing Occupancy in Vermont
Occupancy by Ownership in Vermont
Of the total 306 dwellings in Vermont, owner-occupied units account for 259 (84.6%), while renter-occupied units make up 47 (15.4%).
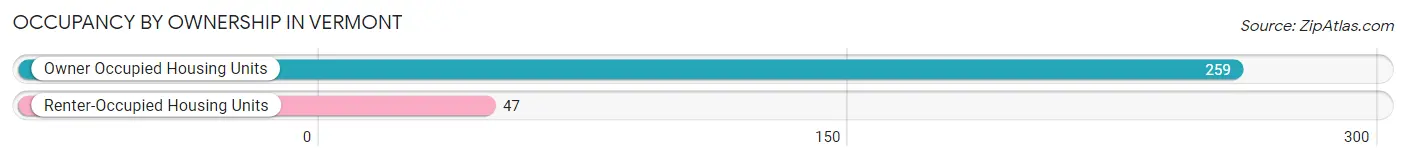
| Occupancy | # Housing Units | % Housing Units |
| Owner Occupied Housing Units | 259 | 84.6% |
| Renter-Occupied Housing Units | 47 | 15.4% |
| Total Occupied Housing Units | 306 | 100.0% |
Occupancy by Household Size in Vermont
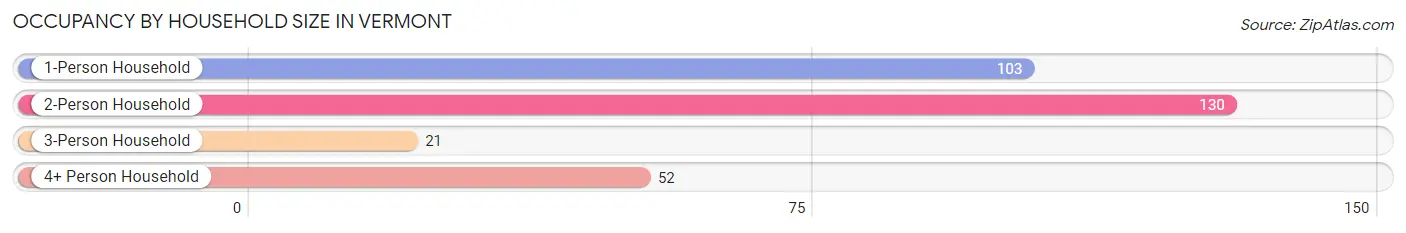
| Household Size | # Housing Units | % Housing Units |
| 1-Person Household | 103 | 33.7% |
| 2-Person Household | 130 | 42.5% |
| 3-Person Household | 21 | 6.9% |
| 4+ Person Household | 52 | 17.0% |
| Total Housing Units | 306 | 100.0% |
Occupancy by Ownership by Household Size in Vermont
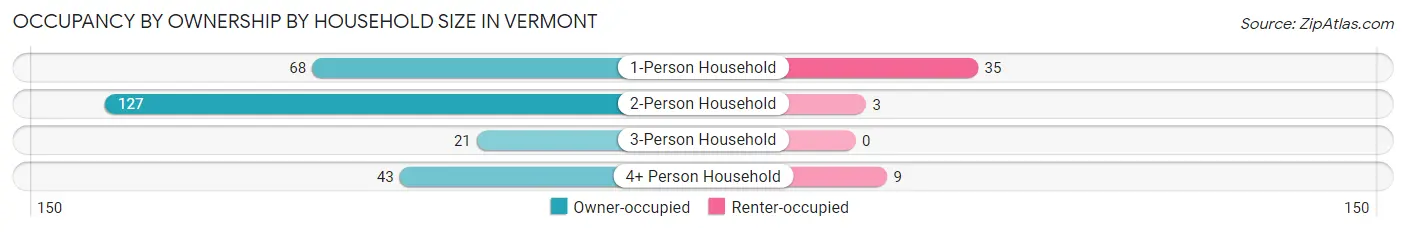
| Household Size | Owner-occupied | Renter-occupied |
| 1-Person Household | 68 (66.0%) | 35 (34.0%) |
| 2-Person Household | 127 (97.7%) | 3 (2.3%) |
| 3-Person Household | 21 (100.0%) | 0 (0.0%) |
| 4+ Person Household | 43 (82.7%) | 9 (17.3%) |
| Total Housing Units | 259 (84.6%) | 47 (15.4%) |
Occupancy by Educational Attainment in Vermont
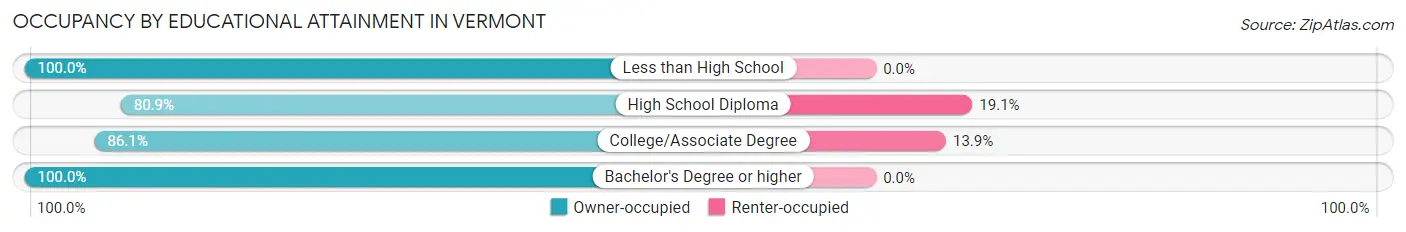
| Household Size | Owner-occupied | Renter-occupied |
| Less than High School | 15 (100.0%) | 0 (0.0%) |
| High School Diploma | 140 (80.9%) | 33 (19.1%) |
| College/Associate Degree | 87 (86.1%) | 14 (13.9%) |
| Bachelor's Degree or higher | 17 (100.0%) | 0 (0.0%) |
Occupancy by Age of Householder in Vermont
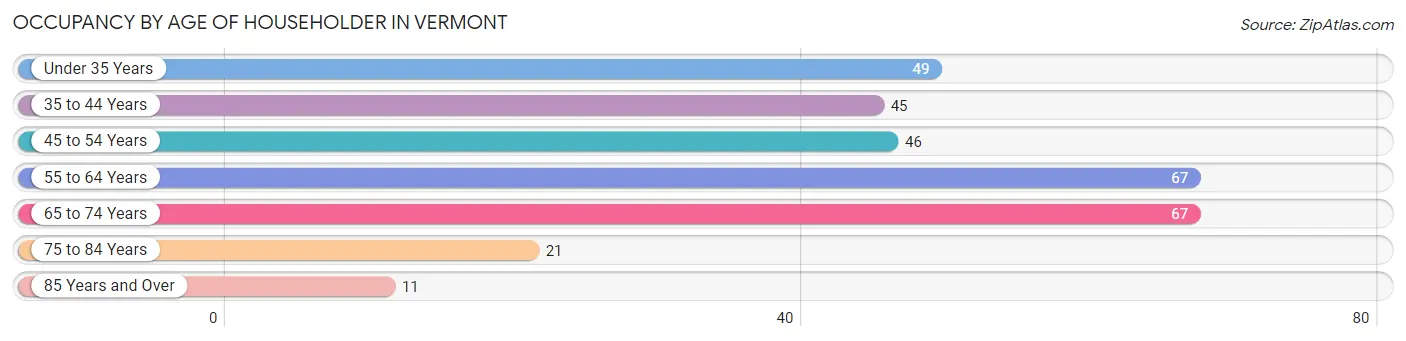
| Age Bracket | # Households | % Households |
| Under 35 Years | 49 | 16.0% |
| 35 to 44 Years | 45 | 14.7% |
| 45 to 54 Years | 46 | 15.0% |
| 55 to 64 Years | 67 | 21.9% |
| 65 to 74 Years | 67 | 21.9% |
| 75 to 84 Years | 21 | 6.9% |
| 85 Years and Over | 11 | 3.6% |
| Total | 306 | 100.0% |
Housing Finances in Vermont
Median Income by Occupancy in Vermont
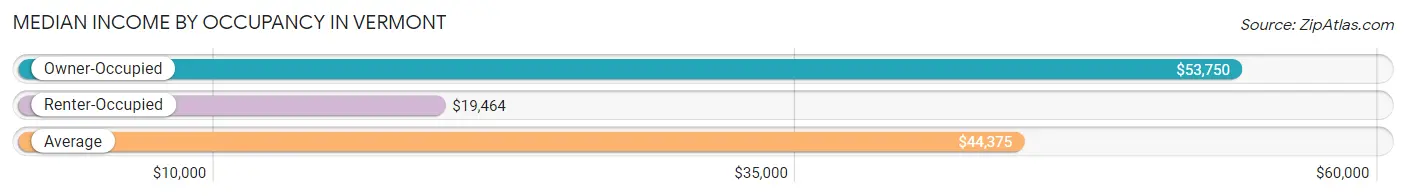
| Occupancy Type | # Households | Median Income |
| Owner-Occupied | 259 (84.6%) | $53,750 |
| Renter-Occupied | 47 (15.4%) | $19,464 |
| Average | 306 (100.0%) | $44,375 |
Occupancy by Householder Income Bracket in Vermont
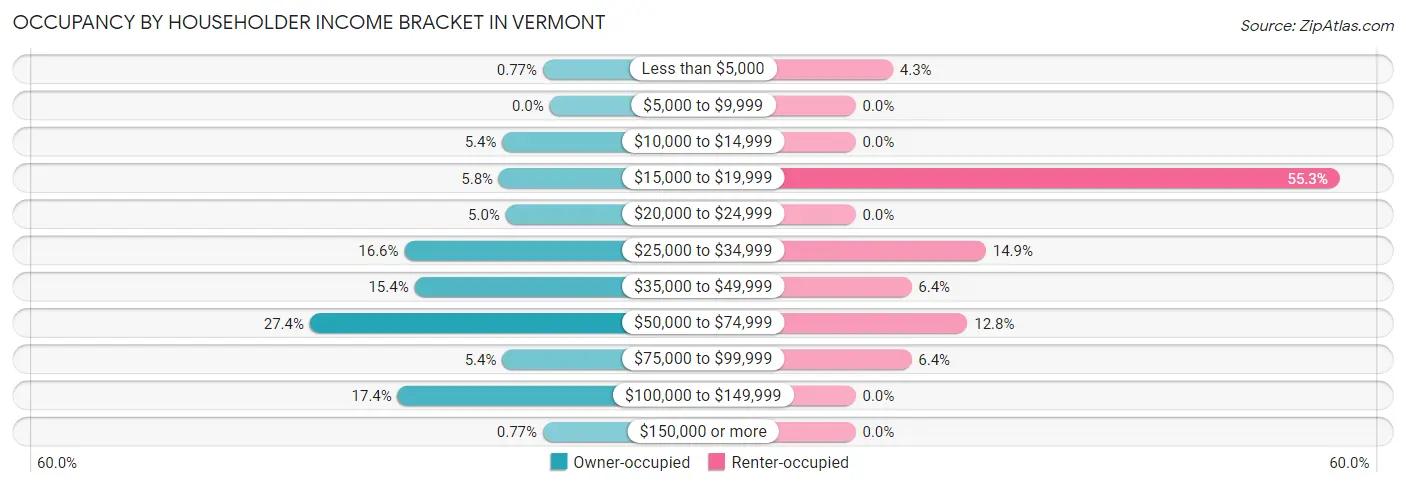
| Income Bracket | Owner-occupied | Renter-occupied |
| Less than $5,000 | 2 (0.8%) | 2 (4.3%) |
| $5,000 to $9,999 | 0 (0.0%) | 0 (0.0%) |
| $10,000 to $14,999 | 14 (5.4%) | 0 (0.0%) |
| $15,000 to $19,999 | 15 (5.8%) | 26 (55.3%) |
| $20,000 to $24,999 | 13 (5.0%) | 0 (0.0%) |
| $25,000 to $34,999 | 43 (16.6%) | 7 (14.9%) |
| $35,000 to $49,999 | 40 (15.4%) | 3 (6.4%) |
| $50,000 to $74,999 | 71 (27.4%) | 6 (12.8%) |
| $75,000 to $99,999 | 14 (5.4%) | 3 (6.4%) |
| $100,000 to $149,999 | 45 (17.4%) | 0 (0.0%) |
| $150,000 or more | 2 (0.8%) | 0 (0.0%) |
| Total | 259 (100.0%) | 47 (100.0%) |
Monthly Housing Cost Tiers in Vermont
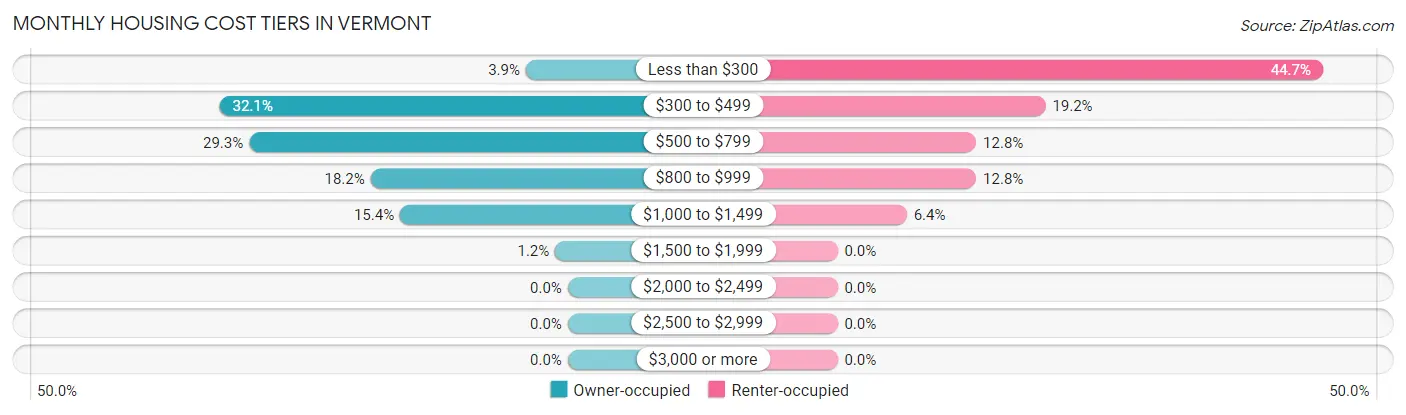
| Monthly Cost | Owner-occupied | Renter-occupied |
| Less than $300 | 10 (3.9%) | 21 (44.7%) |
| $300 to $499 | 83 (32.1%) | 9 (19.2%) |
| $500 to $799 | 76 (29.3%) | 6 (12.8%) |
| $800 to $999 | 47 (18.1%) | 6 (12.8%) |
| $1,000 to $1,499 | 40 (15.4%) | 3 (6.4%) |
| $1,500 to $1,999 | 3 (1.2%) | 0 (0.0%) |
| $2,000 to $2,499 | 0 (0.0%) | 0 (0.0%) |
| $2,500 to $2,999 | 0 (0.0%) | 0 (0.0%) |
| $3,000 or more | 0 (0.0%) | 0 (0.0%) |
| Total | 259 (100.0%) | 47 (100.0%) |
Physical Housing Characteristics in Vermont
Housing Structures in Vermont
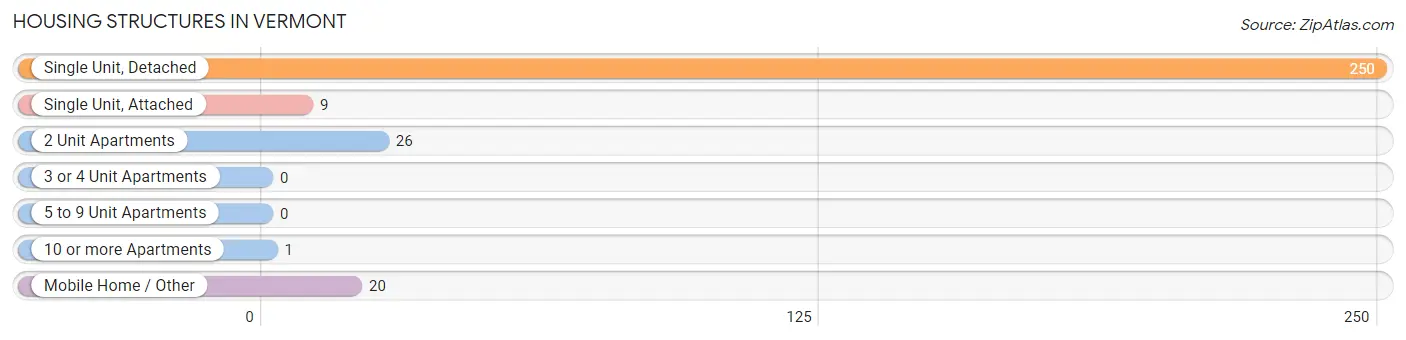
| Structure Type | # Housing Units | % Housing Units |
| Single Unit, Detached | 250 | 81.7% |
| Single Unit, Attached | 9 | 2.9% |
| 2 Unit Apartments | 26 | 8.5% |
| 3 or 4 Unit Apartments | 0 | 0.0% |
| 5 to 9 Unit Apartments | 0 | 0.0% |
| 10 or more Apartments | 1 | 0.3% |
| Mobile Home / Other | 20 | 6.5% |
| Total | 306 | 100.0% |
Housing Structures by Occupancy in Vermont
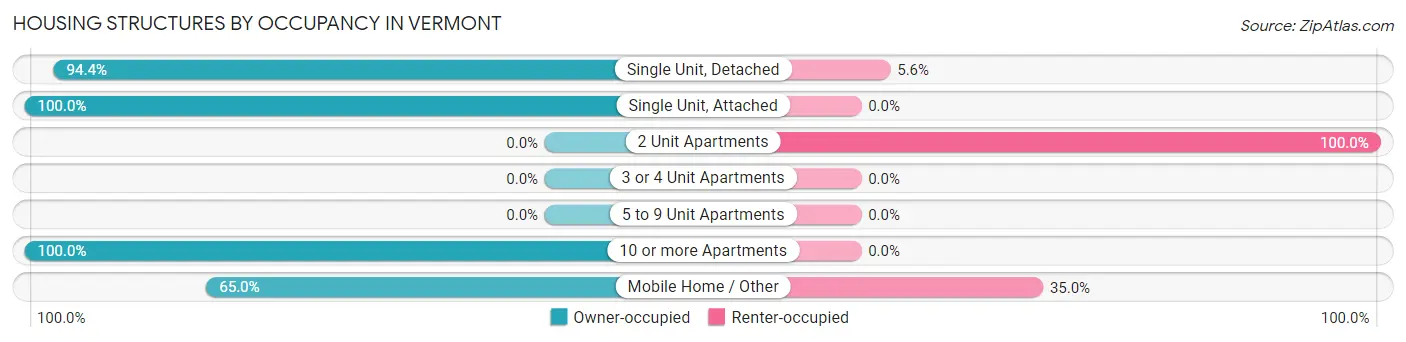
| Structure Type | Owner-occupied | Renter-occupied |
| Single Unit, Detached | 236 (94.4%) | 14 (5.6%) |
| Single Unit, Attached | 9 (100.0%) | 0 (0.0%) |
| 2 Unit Apartments | 0 (0.0%) | 26 (100.0%) |
| 3 or 4 Unit Apartments | 0 (0.0%) | 0 (0.0%) |
| 5 to 9 Unit Apartments | 0 (0.0%) | 0 (0.0%) |
| 10 or more Apartments | 1 (100.0%) | 0 (0.0%) |
| Mobile Home / Other | 13 (65.0%) | 7 (35.0%) |
| Total | 259 (84.6%) | 47 (15.4%) |
Housing Structures by Number of Rooms in Vermont
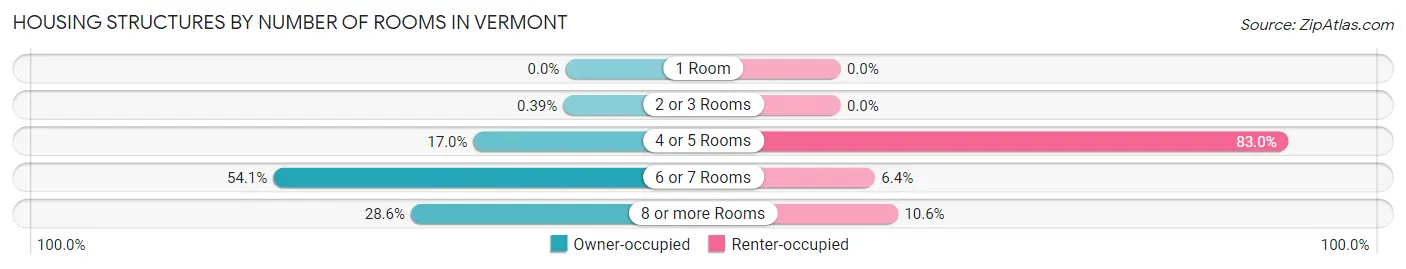
| Number of Rooms | Owner-occupied | Renter-occupied |
| 1 Room | 0 (0.0%) | 0 (0.0%) |
| 2 or 3 Rooms | 1 (0.4%) | 0 (0.0%) |
| 4 or 5 Rooms | 44 (17.0%) | 39 (83.0%) |
| 6 or 7 Rooms | 140 (54.0%) | 3 (6.4%) |
| 8 or more Rooms | 74 (28.6%) | 5 (10.6%) |
| Total | 259 (100.0%) | 47 (100.0%) |
Housing Structure by Heating Type in Vermont
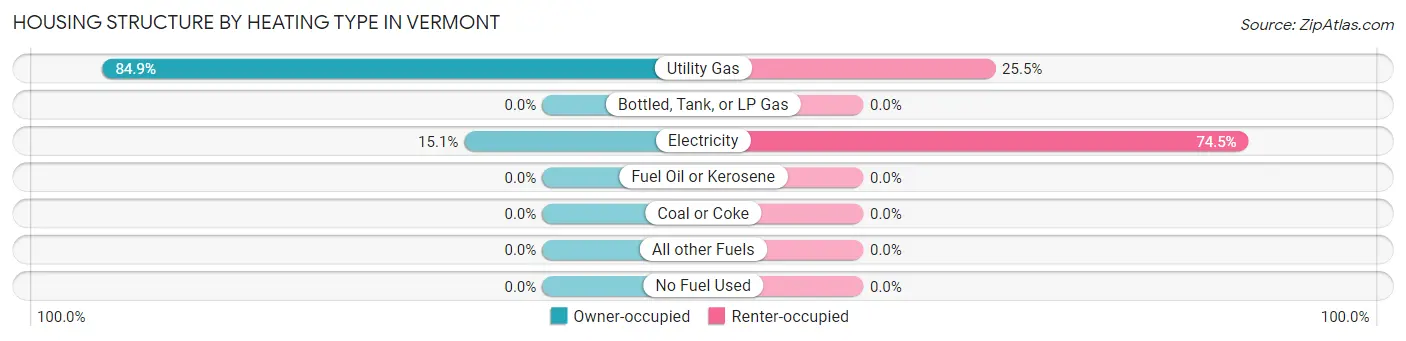
| Heating Type | Owner-occupied | Renter-occupied |
| Utility Gas | 220 (84.9%) | 12 (25.5%) |
| Bottled, Tank, or LP Gas | 0 (0.0%) | 0 (0.0%) |
| Electricity | 39 (15.1%) | 35 (74.5%) |
| Fuel Oil or Kerosene | 0 (0.0%) | 0 (0.0%) |
| Coal or Coke | 0 (0.0%) | 0 (0.0%) |
| All other Fuels | 0 (0.0%) | 0 (0.0%) |
| No Fuel Used | 0 (0.0%) | 0 (0.0%) |
| Total | 259 (100.0%) | 47 (100.0%) |
Household Vehicle Usage in Vermont
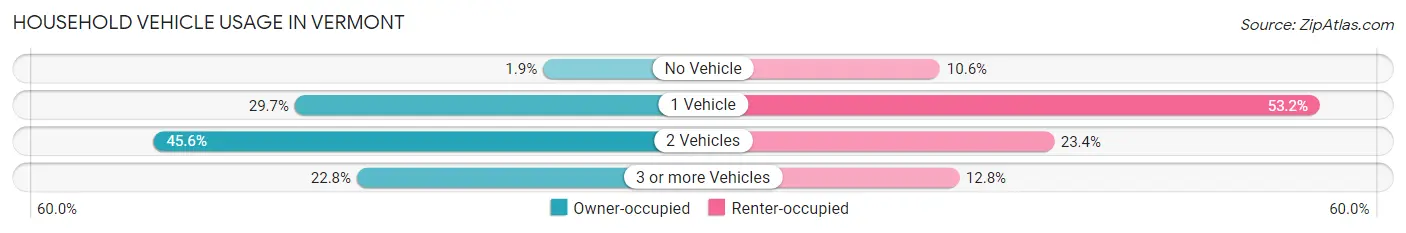
| Vehicles per Household | Owner-occupied | Renter-occupied |
| No Vehicle | 5 (1.9%) | 5 (10.6%) |
| 1 Vehicle | 77 (29.7%) | 25 (53.2%) |
| 2 Vehicles | 118 (45.6%) | 11 (23.4%) |
| 3 or more Vehicles | 59 (22.8%) | 6 (12.8%) |
| Total | 259 (100.0%) | 47 (100.0%) |
Real Estate & Mortgages in Vermont
Real Estate and Mortgage Overview in Vermont
| Characteristic | Without Mortgage | With Mortgage |
| Housing Units | 124 | 135 |
| Median Property Value | $44,900 | $53,600 |
| Median Household Income | $34,643 | $0 |
| Monthly Housing Costs | $384 | $0 |
| Real Estate Taxes | $830 | $2 |
Property Value by Mortgage Status in Vermont
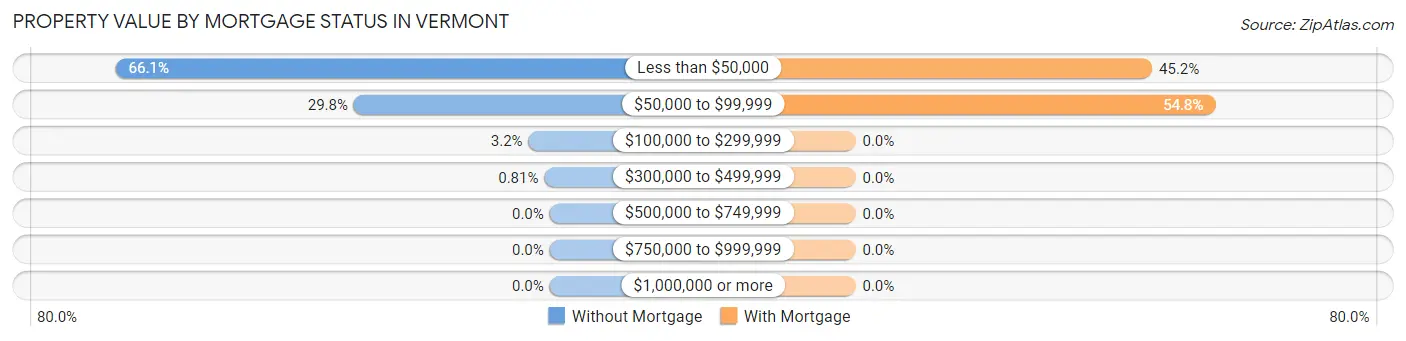
| Property Value | Without Mortgage | With Mortgage |
| Less than $50,000 | 82 (66.1%) | 61 (45.2%) |
| $50,000 to $99,999 | 37 (29.8%) | 74 (54.8%) |
| $100,000 to $299,999 | 4 (3.2%) | 0 (0.0%) |
| $300,000 to $499,999 | 1 (0.8%) | 0 (0.0%) |
| $500,000 to $749,999 | 0 (0.0%) | 0 (0.0%) |
| $750,000 to $999,999 | 0 (0.0%) | 0 (0.0%) |
| $1,000,000 or more | 0 (0.0%) | 0 (0.0%) |
| Total | 124 (100.0%) | 135 (100.0%) |
Household Income by Mortgage Status in Vermont
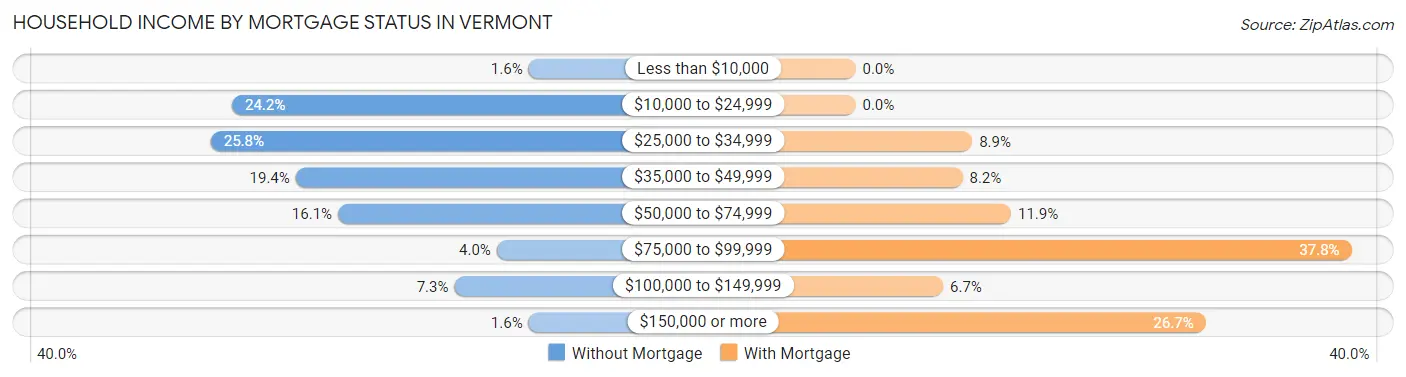
| Household Income | Without Mortgage | With Mortgage |
| Less than $10,000 | 2 (1.6%) | 0 (0.0%) |
| $10,000 to $24,999 | 30 (24.2%) | 0 (0.0%) |
| $25,000 to $34,999 | 32 (25.8%) | 12 (8.9%) |
| $35,000 to $49,999 | 24 (19.4%) | 11 (8.2%) |
| $50,000 to $74,999 | 20 (16.1%) | 16 (11.8%) |
| $75,000 to $99,999 | 5 (4.0%) | 51 (37.8%) |
| $100,000 to $149,999 | 9 (7.3%) | 9 (6.7%) |
| $150,000 or more | 2 (1.6%) | 36 (26.7%) |
| Total | 124 (100.0%) | 135 (100.0%) |
Property Value to Household Income Ratio in Vermont
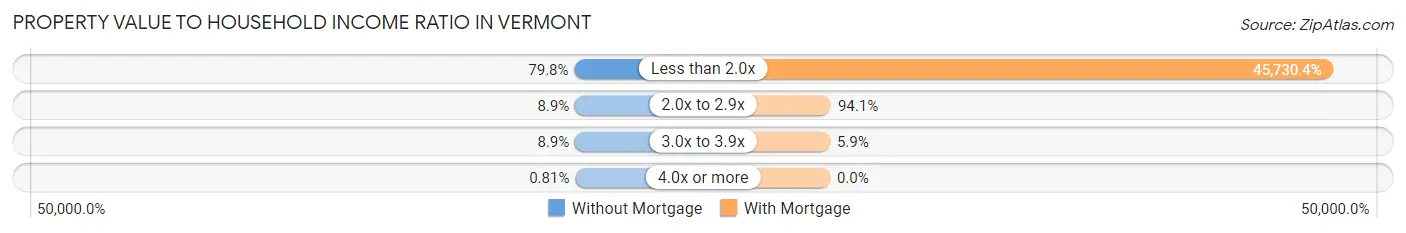
| Value-to-Income Ratio | Without Mortgage | With Mortgage |
| Less than 2.0x | 99 (79.8%) | 61,736 (45,730.4%) |
| 2.0x to 2.9x | 11 (8.9%) | 127 (94.1%) |
| 3.0x to 3.9x | 11 (8.9%) | 8 (5.9%) |
| 4.0x or more | 1 (0.8%) | 0 (0.0%) |
| Total | 124 (100.0%) | 135 (100.0%) |
Real Estate Taxes by Mortgage Status in Vermont
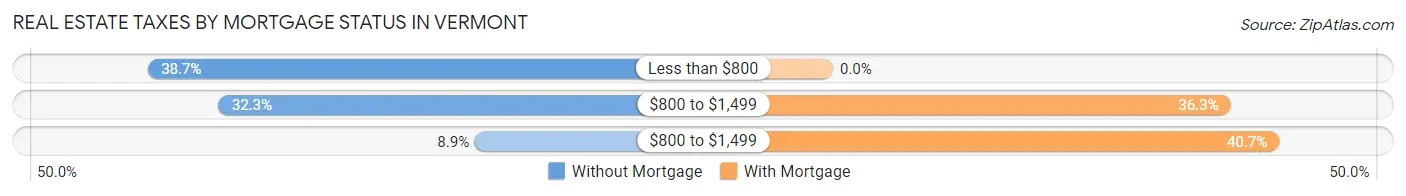
| Property Taxes | Without Mortgage | With Mortgage |
| Less than $800 | 48 (38.7%) | 0 (0.0%) |
| $800 to $1,499 | 40 (32.3%) | 49 (36.3%) |
| $800 to $1,499 | 11 (8.9%) | 55 (40.7%) |
| Total | 124 (100.0%) | 135 (100.0%) |
Health & Disability in Vermont
Health Insurance Coverage by Age in Vermont
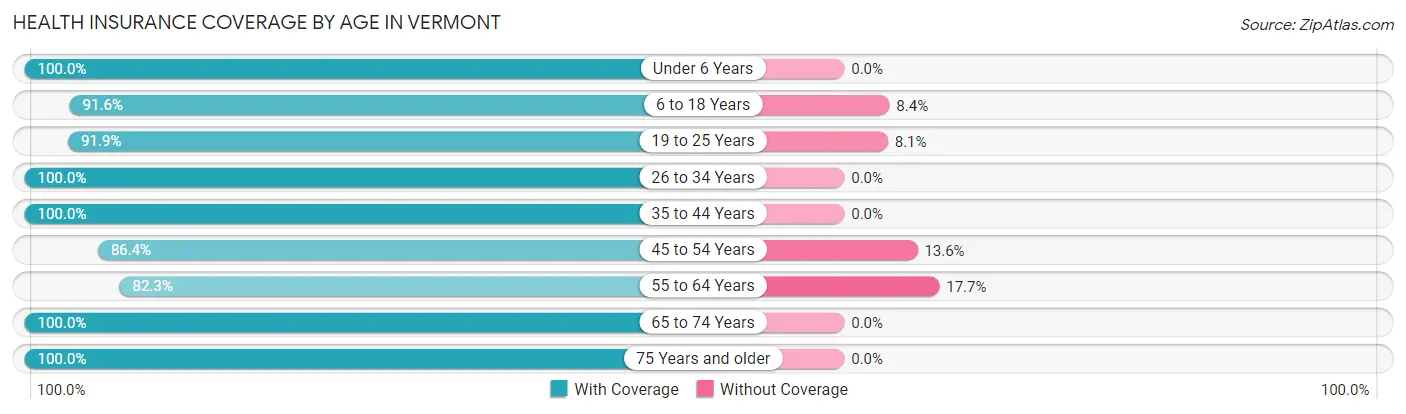
| Age Bracket | With Coverage | Without Coverage |
| Under 6 Years | 21 (100.0%) | 0 (0.0%) |
| 6 to 18 Years | 98 (91.6%) | 9 (8.4%) |
| 19 to 25 Years | 34 (91.9%) | 3 (8.1%) |
| 26 to 34 Years | 67 (100.0%) | 0 (0.0%) |
| 35 to 44 Years | 93 (100.0%) | 0 (0.0%) |
| 45 to 54 Years | 76 (86.4%) | 12 (13.6%) |
| 55 to 64 Years | 79 (82.3%) | 17 (17.7%) |
| 65 to 74 Years | 92 (100.0%) | 0 (0.0%) |
| 75 Years and older | 45 (100.0%) | 0 (0.0%) |
| Total | 605 (93.6%) | 41 (6.4%) |
Health Insurance Coverage by Citizenship Status in Vermont
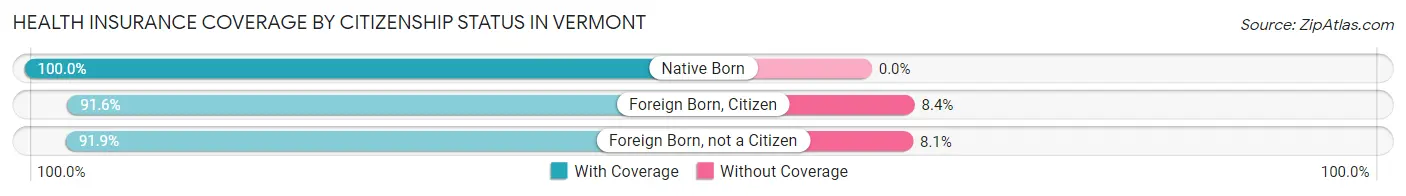
| Citizenship Status | With Coverage | Without Coverage |
| Native Born | 21 (100.0%) | 0 (0.0%) |
| Foreign Born, Citizen | 98 (91.6%) | 9 (8.4%) |
| Foreign Born, not a Citizen | 34 (91.9%) | 3 (8.1%) |
Health Insurance Coverage by Household Income in Vermont
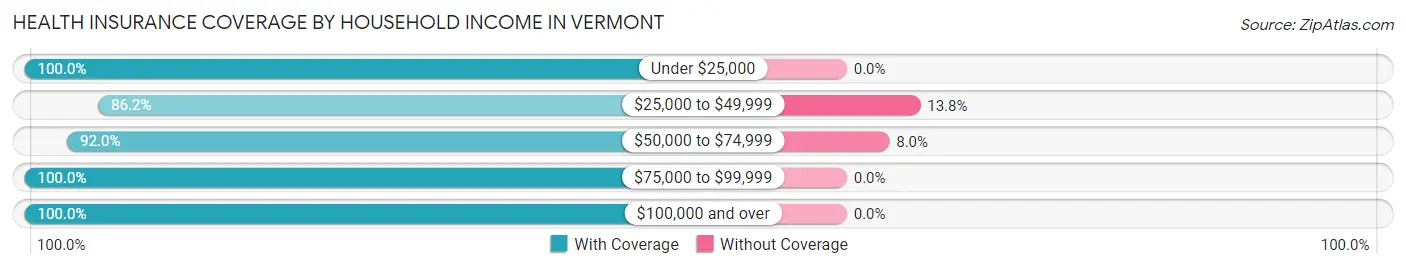
| Household Income | With Coverage | Without Coverage |
| Under $25,000 | 93 (100.0%) | 0 (0.0%) |
| $25,000 to $49,999 | 144 (86.2%) | 23 (13.8%) |
| $50,000 to $74,999 | 208 (92.0%) | 18 (8.0%) |
| $75,000 to $99,999 | 40 (100.0%) | 0 (0.0%) |
| $100,000 and over | 120 (100.0%) | 0 (0.0%) |
Public vs Private Health Insurance Coverage by Age in Vermont
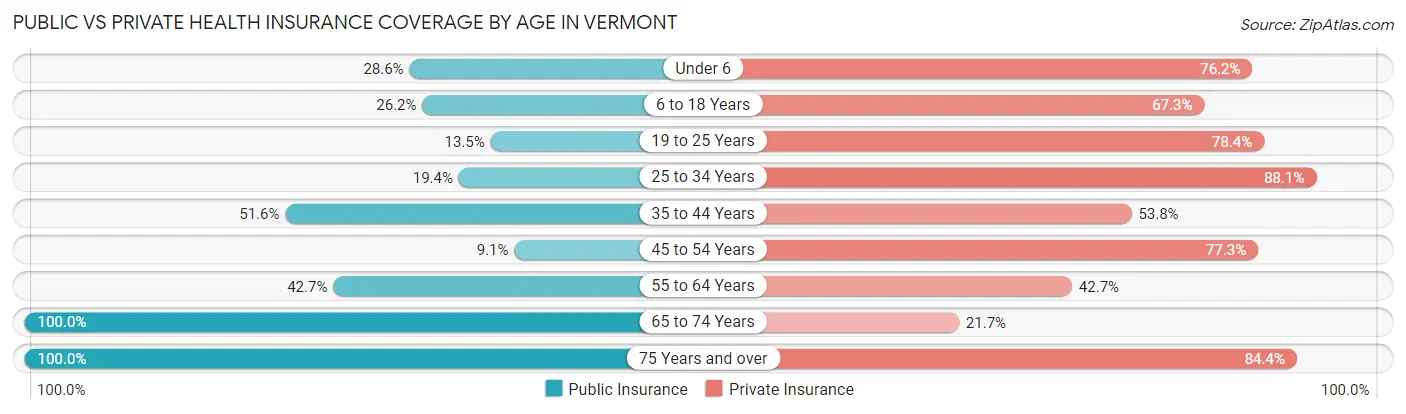
| Age Bracket | Public Insurance | Private Insurance |
| Under 6 | 6 (28.6%) | 16 (76.2%) |
| 6 to 18 Years | 28 (26.2%) | 72 (67.3%) |
| 19 to 25 Years | 5 (13.5%) | 29 (78.4%) |
| 25 to 34 Years | 13 (19.4%) | 59 (88.1%) |
| 35 to 44 Years | 48 (51.6%) | 50 (53.8%) |
| 45 to 54 Years | 8 (9.1%) | 68 (77.3%) |
| 55 to 64 Years | 41 (42.7%) | 41 (42.7%) |
| 65 to 74 Years | 92 (100.0%) | 20 (21.7%) |
| 75 Years and over | 45 (100.0%) | 38 (84.4%) |
| Total | 286 (44.3%) | 393 (60.8%) |
Disability Status by Sex by Age in Vermont
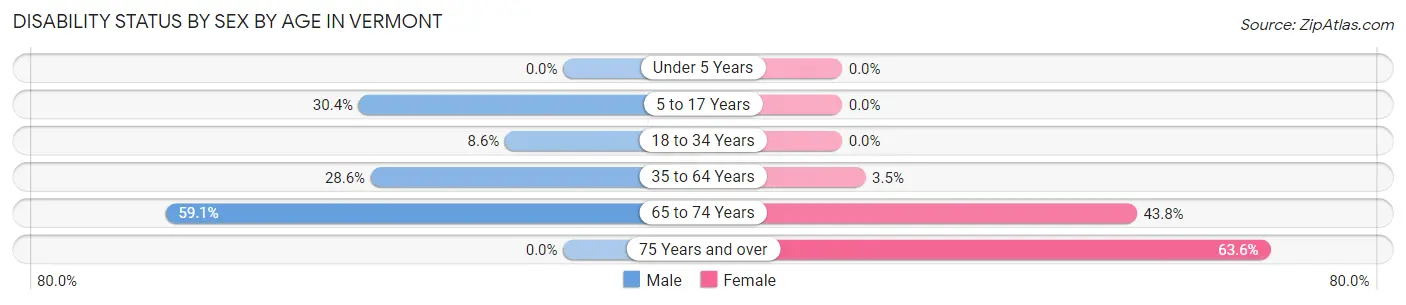
| Age Bracket | Male | Female |
| Under 5 Years | 0 (0.0%) | 0 (0.0%) |
| 5 to 17 Years | 17 (30.4%) | 0 (0.0%) |
| 18 to 34 Years | 7 (8.6%) | 0 (0.0%) |
| 35 to 64 Years | 38 (28.6%) | 5 (3.5%) |
| 65 to 74 Years | 26 (59.1%) | 21 (43.8%) |
| 75 Years and over | 0 (0.0%) | 14 (63.6%) |
Disability Class by Sex by Age in Vermont
Disability Class: Hearing Difficulty
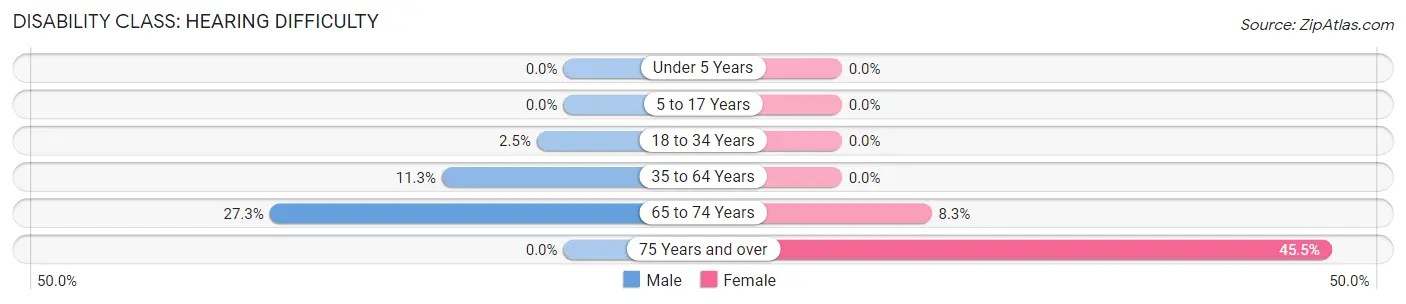
| Age Bracket | Male | Female |
| Under 5 Years | 0 (0.0%) | 0 (0.0%) |
| 5 to 17 Years | 0 (0.0%) | 0 (0.0%) |
| 18 to 34 Years | 2 (2.5%) | 0 (0.0%) |
| 35 to 64 Years | 15 (11.3%) | 0 (0.0%) |
| 65 to 74 Years | 12 (27.3%) | 4 (8.3%) |
| 75 Years and over | 0 (0.0%) | 10 (45.5%) |
Disability Class: Vision Difficulty
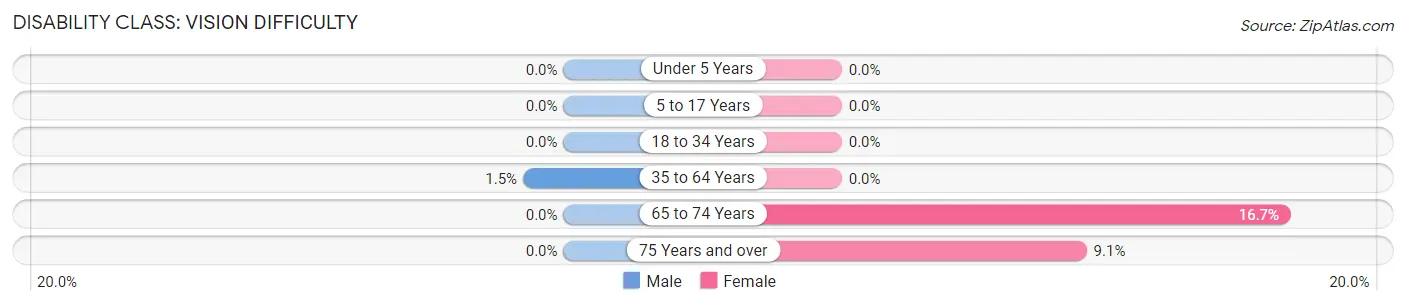
| Age Bracket | Male | Female |
| Under 5 Years | 0 (0.0%) | 0 (0.0%) |
| 5 to 17 Years | 0 (0.0%) | 0 (0.0%) |
| 18 to 34 Years | 0 (0.0%) | 0 (0.0%) |
| 35 to 64 Years | 2 (1.5%) | 0 (0.0%) |
| 65 to 74 Years | 0 (0.0%) | 8 (16.7%) |
| 75 Years and over | 0 (0.0%) | 2 (9.1%) |
Disability Class: Cognitive Difficulty
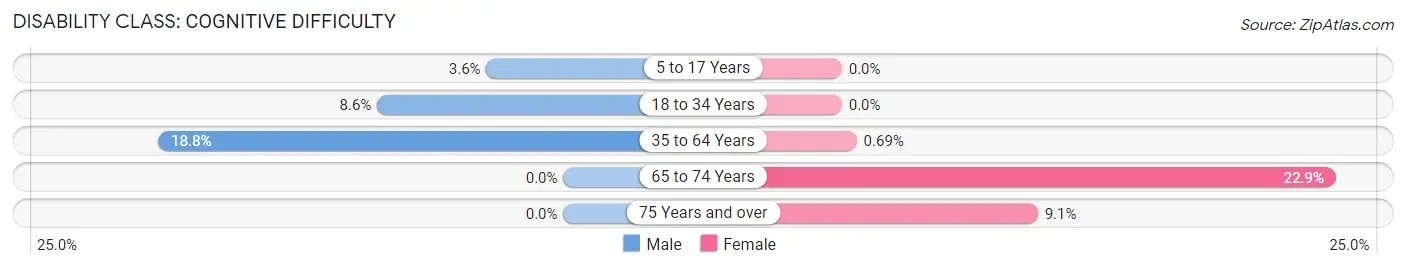
| Age Bracket | Male | Female |
| 5 to 17 Years | 2 (3.6%) | 0 (0.0%) |
| 18 to 34 Years | 7 (8.6%) | 0 (0.0%) |
| 35 to 64 Years | 25 (18.8%) | 1 (0.7%) |
| 65 to 74 Years | 0 (0.0%) | 11 (22.9%) |
| 75 Years and over | 0 (0.0%) | 2 (9.1%) |
Disability Class: Ambulatory Difficulty
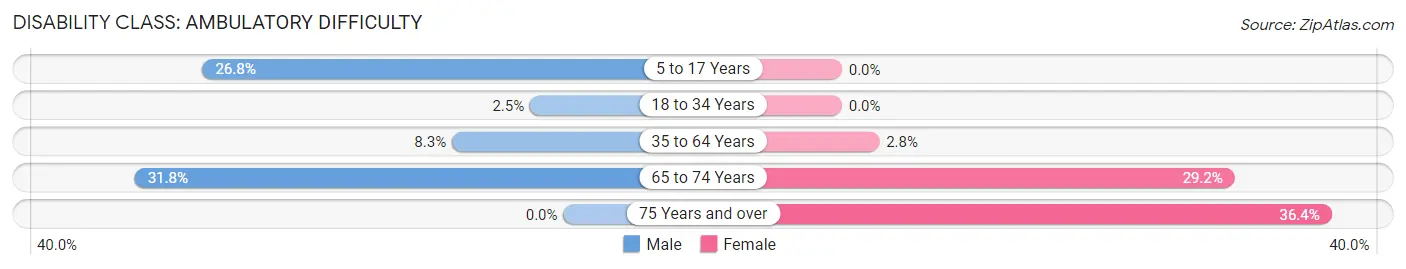
| Age Bracket | Male | Female |
| 5 to 17 Years | 15 (26.8%) | 0 (0.0%) |
| 18 to 34 Years | 2 (2.5%) | 0 (0.0%) |
| 35 to 64 Years | 11 (8.3%) | 4 (2.8%) |
| 65 to 74 Years | 14 (31.8%) | 14 (29.2%) |
| 75 Years and over | 0 (0.0%) | 8 (36.4%) |
Disability Class: Self-Care Difficulty
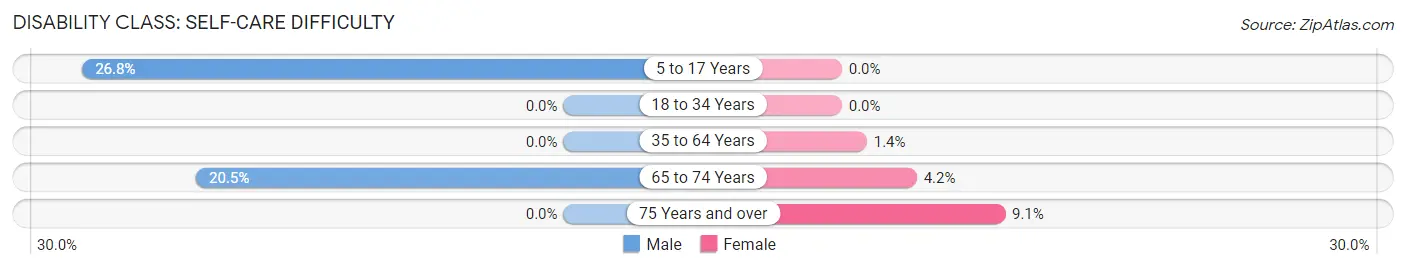
| Age Bracket | Male | Female |
| 5 to 17 Years | 15 (26.8%) | 0 (0.0%) |
| 18 to 34 Years | 0 (0.0%) | 0 (0.0%) |
| 35 to 64 Years | 0 (0.0%) | 2 (1.4%) |
| 65 to 74 Years | 9 (20.4%) | 2 (4.2%) |
| 75 Years and over | 0 (0.0%) | 2 (9.1%) |
Technology Access in Vermont
Computing Device Access in Vermont
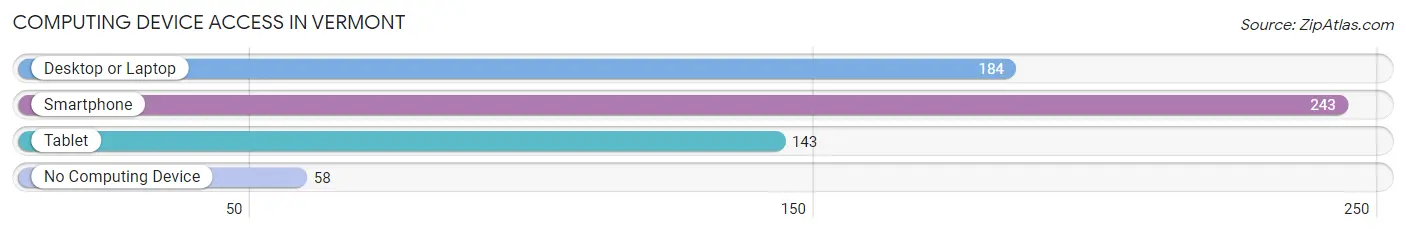
| Device Type | # Households | % Households |
| Desktop or Laptop | 184 | 60.1% |
| Smartphone | 243 | 79.4% |
| Tablet | 143 | 46.7% |
| No Computing Device | 58 | 19.0% |
| Total | 306 | 100.0% |
Internet Access in Vermont
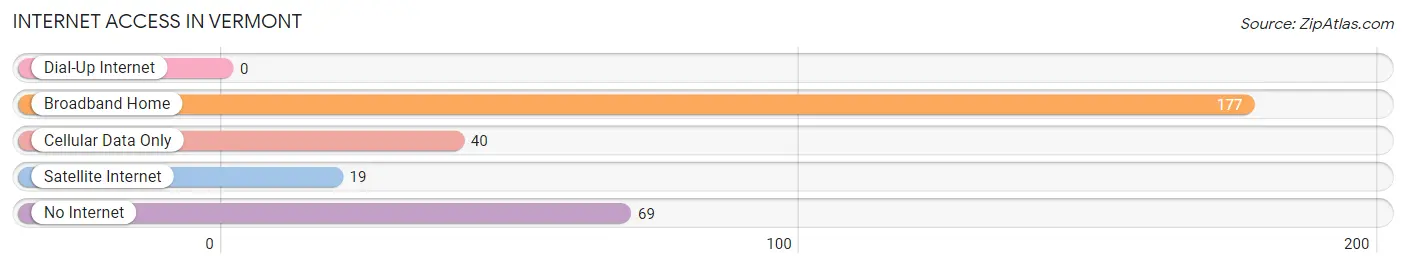
| Internet Type | # Households | % Households |
| Dial-Up Internet | 0 | 0.0% |
| Broadband Home | 177 | 57.8% |
| Cellular Data Only | 40 | 13.1% |
| Satellite Internet | 19 | 6.2% |
| No Internet | 69 | 22.6% |
| Total | 306 | 100.0% |
Vermont Summary
Vermont, Illinois is a small village located in Fulton County, Illinois. It is situated on the banks of the Spoon River and is part of the Spoon River Valley. The village has a population of approximately 1,000 people and is located about 30 miles south of Peoria.
History
Vermont was first settled in 1835 by a group of settlers from Vermont. The village was originally known as “Vermontville” and was incorporated in 1854. The village was named after the state of Vermont, which was the home state of many of the settlers.
The village was an important stop on the Chicago, Burlington and Quincy Railroad, which ran through the village from 1854 to 1971. The railroad was an important factor in the growth of the village, as it allowed for the transportation of goods and people to and from the village.
Geography
Vermont is located in the Spoon River Valley, which is a region of rolling hills and valleys. The village is situated on the banks of the Spoon River, which is a tributary of the Illinois River. The village is located about 30 miles south of Peoria and is surrounded by the towns of Fairview, Ellisville, and London Mills.
The village is located in a rural area and is surrounded by farmland. The village is also home to a number of parks and recreational areas, including the Spoon River State Fish and Wildlife Area, which is a popular spot for fishing and hunting.
Economy
The economy of Vermont is largely based on agriculture. The village is home to a number of farms, which produce a variety of crops, including corn, soybeans, and wheat. The village is also home to a number of small businesses, including a grocery store, a hardware store, and a few restaurants.
Demographics
As of the 2010 census, the population of Vermont was 1,000 people. The racial makeup of the village was 97.2% White, 0.7% African American, 0.2% Native American, 0.2% Asian, 0.2% from other races, and 1.7% from two or more races. The median household income in the village was $41,250, and the median family income was $50,000.
Conclusion
Vermont, Illinois is a small village located in Fulton County, Illinois. It is situated on the banks of the Spoon River and is part of the Spoon River Valley. The village has a population of approximately 1,000 people and is located about 30 miles south of Peoria. The economy of the village is largely based on agriculture, and the village is home to a number of small businesses. The racial makeup of the village is predominantly White, with a small percentage of African American, Native American, and Asian residents.
Common Questions
What is Per Capita Income in Vermont?
Per Capita income in Vermont is $24,782.
What is the Median Family Income in Vermont?
Median Family Income in Vermont is $60,952.
What is the Median Household income in Vermont?
Median Household Income in Vermont is $44,375.
What is Income or Wage Gap in Vermont?
Income or Wage Gap in Vermont is 14.0%.
Women in Vermont earn 86.0 cents for every dollar earned by a man.
What is Inequality or Gini Index in Vermont?
Inequality or Gini Index in Vermont is 0.35.
What is the Total Population of Vermont?
Total Population of Vermont is 646.
What is the Total Male Population of Vermont?
Total Male Population of Vermont is 358.
What is the Total Female Population of Vermont?
Total Female Population of Vermont is 288.
What is the Ratio of Males per 100 Females in Vermont?
There are 124.31 Males per 100 Females in Vermont.
What is the Ratio of Females per 100 Males in Vermont?
There are 80.45 Females per 100 Males in Vermont.
What is the Median Population Age in Vermont?
Median Population Age in Vermont is 44.9 Years.
What is the Average Family Size in Vermont
Average Family Size in Vermont is 2.8 People.
What is the Average Household Size in Vermont
Average Household Size in Vermont is 2.1 People.
How Large is the Labor Force in Vermont?
There are 319 People in the Labor Forcein in Vermont.
What is the Percentage of People in the Labor Force in Vermont?
56.7% of People are in the Labor Force in Vermont.
What is the Unemployment Rate in Vermont?
Unemployment Rate in Vermont is 4.4%.