Vandalia, IL Map & Demographics
Vandalia Map
Vandalia Overview
$22,462
PER CAPITA INCOME
$58,004
AVG FAMILY INCOME
$37,380
AVG HOUSEHOLD INCOME
23.1%
WAGE / INCOME GAP [ % ]
76.9¢/ $1
WAGE / INCOME GAP [ $ ]
$14,381
FAMILY INCOME DEFICIT
0.49
INEQUALITY / GINI INDEX
6,058
TOTAL POPULATION
3,411
MALE POPULATION
2,647
FEMALE POPULATION
128.86
MALES / 100 FEMALES
77.60
FEMALES / 100 MALES
42.1
MEDIAN AGE
3.1
AVG FAMILY SIZE
2.4
AVG HOUSEHOLD SIZE
2,364
LABOR FORCE [ PEOPLE ]
44.8%
PERCENT IN LABOR FORCE
3.1%
UNEMPLOYMENT RATE
Vandalia Zip Codes
Vandalia Area Codes
Income in Vandalia
Income Overview in Vandalia
Per Capita Income in Vandalia is $22,462, while median incomes of families and households are $58,004 and $37,380 respectively.
| Characteristic | Number | Measure |
| Per Capita Income | 6,058 | $22,462 |
| Median Family Income | 1,073 | $58,004 |
| Mean Family Income | 1,073 | $75,325 |
| Median Household Income | 2,059 | $37,380 |
| Mean Household Income | 2,059 | $55,343 |
| Income Deficit | 1,073 | $14,381 |
| Wage / Income Gap (%) | 6,058 | 23.09% |
| Wage / Income Gap ($) | 6,058 | 76.91¢ per $1 |
| Gini / Inequality Index | 6,058 | 0.49 |
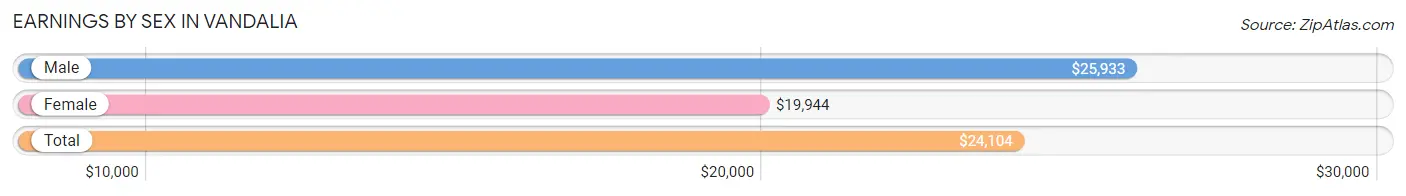
Earnings by Sex in Vandalia
Average Earnings in Vandalia are $24,104, $25,933 for men and $19,944 for women, a difference of 23.1%.
| Sex | Number | Average Earnings |
| Male | 1,591 (57.0%) | $25,933 |
| Female | 1,202 (43.0%) | $19,944 |
| Total | 2,793 (100.0%) | $24,104 |
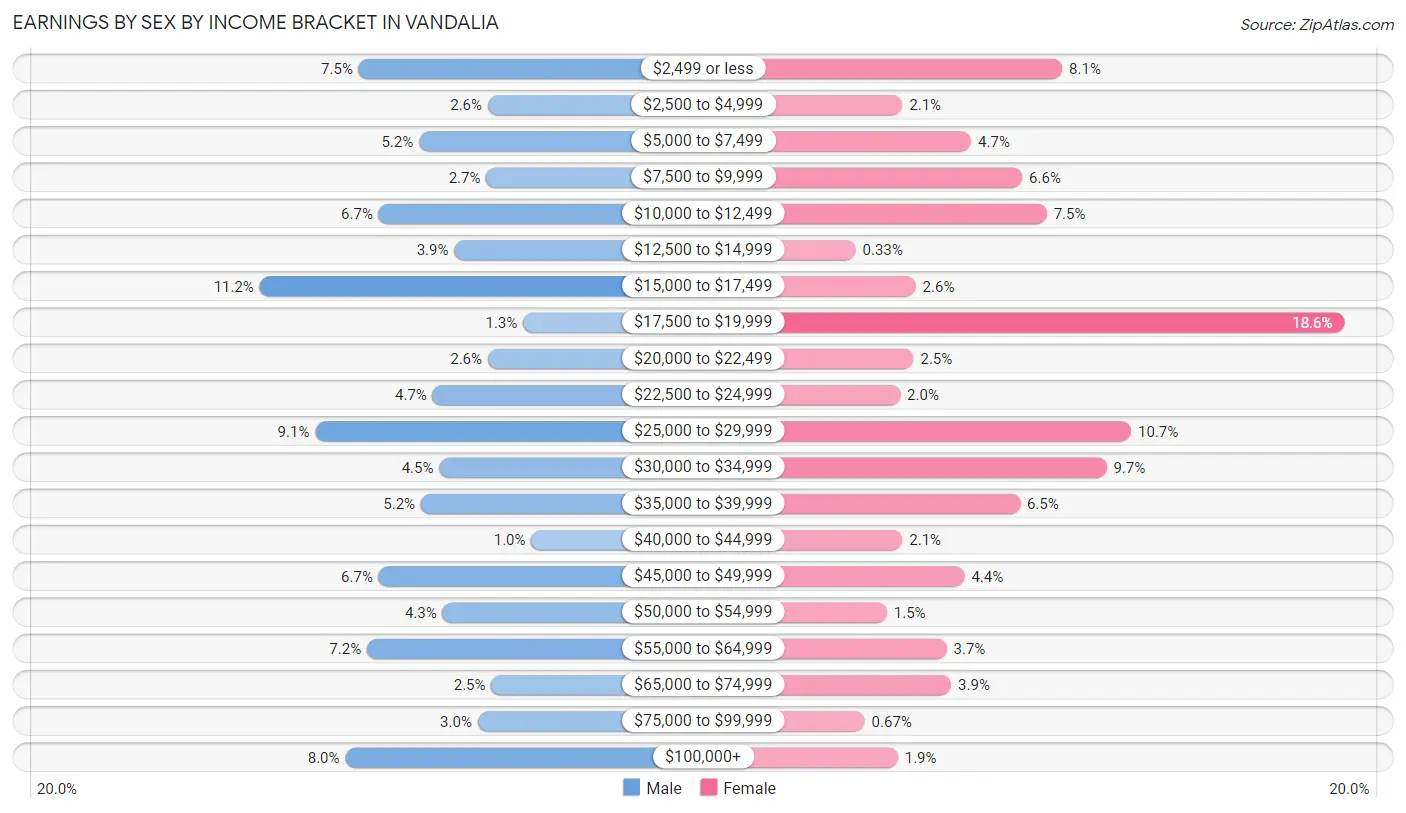
Earnings by Sex by Income Bracket in Vandalia
The most common earnings brackets in Vandalia are $15,000 to $17,499 for men (178 | 11.2%) and $17,500 to $19,999 for women (224 | 18.6%).
| Income | Male | Female |
| $2,499 or less | 119 (7.5%) | 97 (8.1%) |
| $2,500 to $4,999 | 42 (2.6%) | 25 (2.1%) |
| $5,000 to $7,499 | 83 (5.2%) | 56 (4.7%) |
| $7,500 to $9,999 | 43 (2.7%) | 79 (6.6%) |
| $10,000 to $12,499 | 107 (6.7%) | 90 (7.5%) |
| $12,500 to $14,999 | 62 (3.9%) | 4 (0.3%) |
| $15,000 to $17,499 | 178 (11.2%) | 31 (2.6%) |
| $17,500 to $19,999 | 21 (1.3%) | 224 (18.6%) |
| $20,000 to $22,499 | 42 (2.6%) | 30 (2.5%) |
| $22,500 to $24,999 | 75 (4.7%) | 24 (2.0%) |
| $25,000 to $29,999 | 145 (9.1%) | 128 (10.6%) |
| $30,000 to $34,999 | 71 (4.5%) | 117 (9.7%) |
| $35,000 to $39,999 | 82 (5.1%) | 78 (6.5%) |
| $40,000 to $44,999 | 16 (1.0%) | 25 (2.1%) |
| $45,000 to $49,999 | 107 (6.7%) | 53 (4.4%) |
| $50,000 to $54,999 | 69 (4.3%) | 18 (1.5%) |
| $55,000 to $64,999 | 114 (7.2%) | 45 (3.7%) |
| $65,000 to $74,999 | 40 (2.5%) | 47 (3.9%) |
| $75,000 to $99,999 | 48 (3.0%) | 8 (0.7%) |
| $100,000+ | 127 (8.0%) | 23 (1.9%) |
| Total | 1,591 (100.0%) | 1,202 (100.0%) |
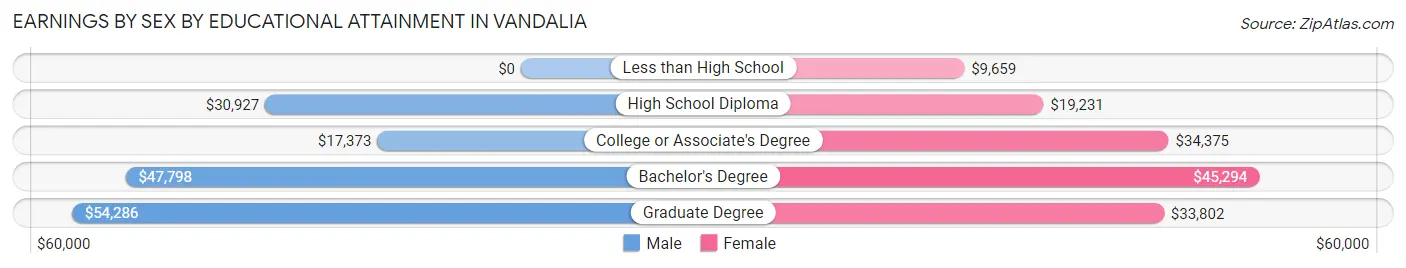
Earnings by Sex by Educational Attainment in Vandalia
Average earnings in Vandalia are $30,282 for men and $28,068 for women, a difference of 7.3%. Men with an educational attainment of graduate degree enjoy the highest average annual earnings of $54,286, while those with college or associate's degree education earn the least with $17,373. Women with an educational attainment of bachelor's degree earn the most with the average annual earnings of $45,294, while those with less than high school education have the smallest earnings of $9,659.
| Educational Attainment | Male Income | Female Income |
| Less than High School | - | - |
| High School Diploma | $30,927 | $19,231 |
| College or Associate's Degree | $17,373 | $34,375 |
| Bachelor's Degree | $47,798 | $45,294 |
| Graduate Degree | $54,286 | $33,802 |
| Total | $30,282 | $28,068 |
Family Income in Vandalia
Family Income Brackets in Vandalia
According to the Vandalia family income data, there are 290 families falling into the $50,000 to $74,999 income range, which is the most common income bracket and makes up 27.0% of all families. Conversely, the $10,000 to $14,999 income bracket is the least frequent group with only 39 families (3.6%) belonging to this category.
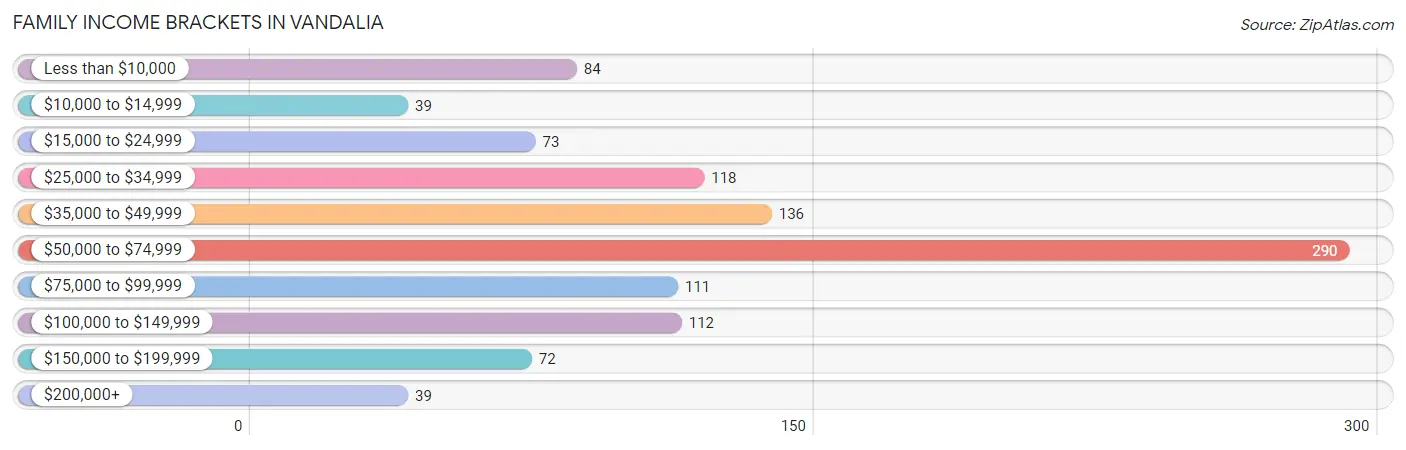
| Income Bracket | # Families | % Families |
| Less than $10,000 | 84 | 7.8% |
| $10,000 to $14,999 | 39 | 3.6% |
| $15,000 to $24,999 | 73 | 6.8% |
| $25,000 to $34,999 | 118 | 11.0% |
| $35,000 to $49,999 | 136 | 12.7% |
| $50,000 to $74,999 | 290 | 27.0% |
| $75,000 to $99,999 | 111 | 10.3% |
| $100,000 to $149,999 | 112 | 10.4% |
| $150,000 to $199,999 | 72 | 6.7% |
| $200,000+ | 39 | 3.6% |
Family Income by Famaliy Size in Vandalia
3-person families (165 | 15.4%) account for the highest median family income in Vandalia with $59,432 per family, while 2-person families (688 | 64.1%) have the highest median income of $28,074 per family member.
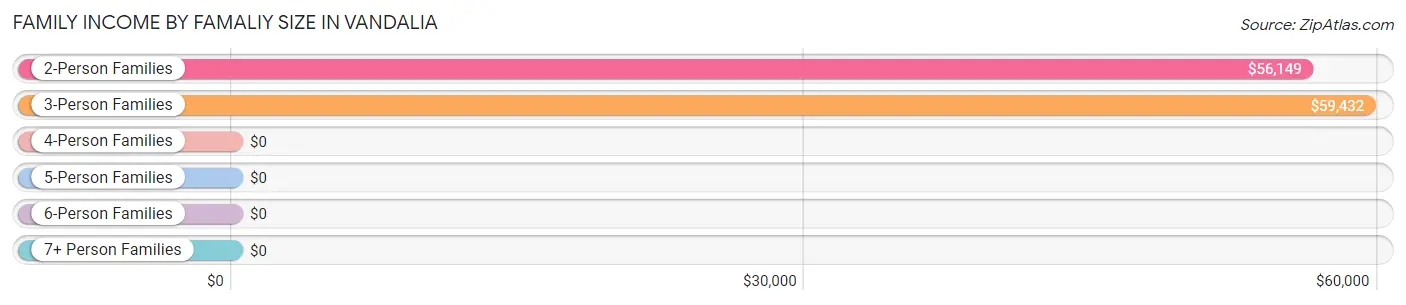
| Income Bracket | # Families | Median Income |
| 2-Person Families | 688 (64.1%) | $56,149 |
| 3-Person Families | 165 (15.4%) | $59,432 |
| 4-Person Families | 123 (11.5%) | $0 |
| 5-Person Families | 83 (7.7%) | $0 |
| 6-Person Families | 7 (0.6%) | $0 |
| 7+ Person Families | 7 (0.6%) | $0 |
| Total | 1,073 (100.0%) | $58,004 |
Family Income by Number of Earners in Vandalia
The median family income in Vandalia is $58,004, with families comprising 3+ earners (79) having the highest median family income of $155,792, while families with no earners (229) have the lowest median family income of $31,066, accounting for 7.4% and 21.3% of families, respectively.
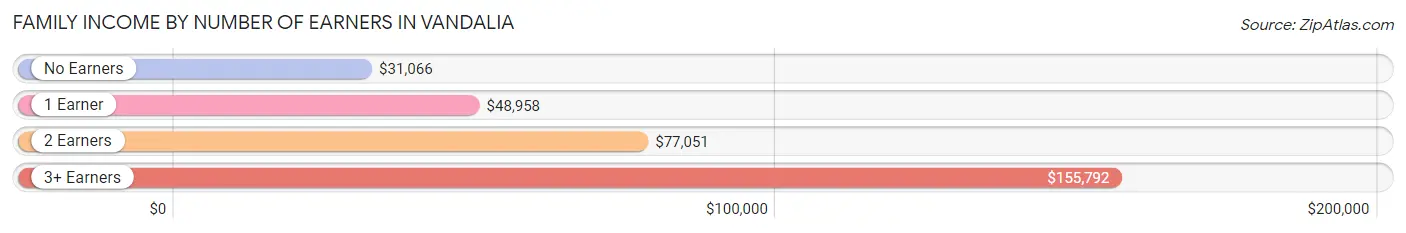
| Number of Earners | # Families | Median Income |
| No Earners | 229 (21.3%) | $31,066 |
| 1 Earner | 423 (39.4%) | $48,958 |
| 2 Earners | 342 (31.9%) | $77,051 |
| 3+ Earners | 79 (7.4%) | $155,792 |
| Total | 1,073 (100.0%) | $58,004 |
Household Income in Vandalia
Household Income Brackets in Vandalia
With 404 households falling in the category, the $50,000 to $74,999 income range is the most frequent in Vandalia, accounting for 19.6% of all households. In contrast, only 39 households (1.9%) fall into the $200,000+ income bracket, making it the least populous group.
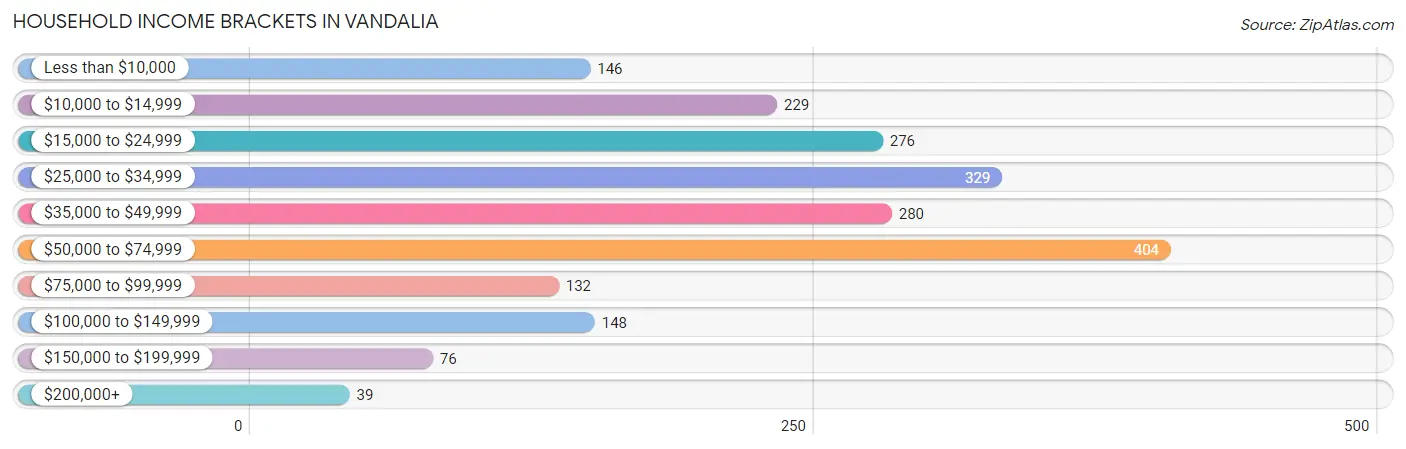
| Income Bracket | # Households | % Households |
| Less than $10,000 | 146 | 7.1% |
| $10,000 to $14,999 | 229 | 11.1% |
| $15,000 to $24,999 | 276 | 13.4% |
| $25,000 to $34,999 | 329 | 16.0% |
| $35,000 to $49,999 | 280 | 13.6% |
| $50,000 to $74,999 | 404 | 19.6% |
| $75,000 to $99,999 | 132 | 6.4% |
| $100,000 to $149,999 | 148 | 7.2% |
| $150,000 to $199,999 | 76 | 3.7% |
| $200,000+ | 39 | 1.9% |
Household Income by Householder Age in Vandalia
The median household income in Vandalia is $37,380, with the highest median household income of $47,207 found in the 25 to 44 years age bracket for the primary householder. A total of 509 households (24.7%) fall into this category. Meanwhile, the 15 to 24 years age bracket for the primary householder has the lowest median household income of $27,254, with 176 households (8.6%) in this group.
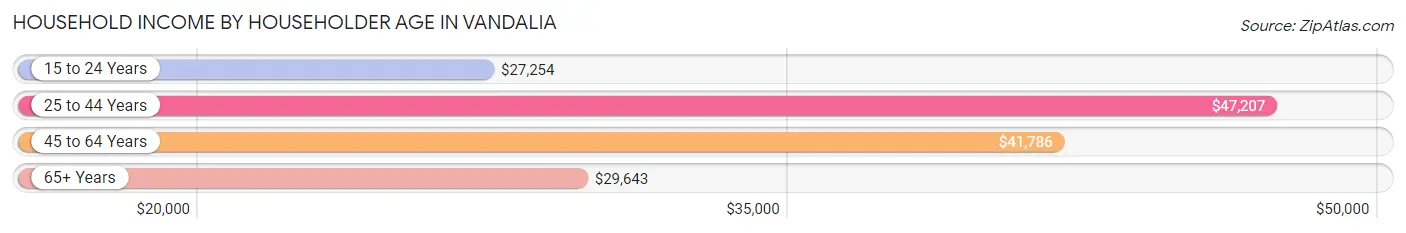
| Income Bracket | # Households | Median Income |
| 15 to 24 Years | 176 (8.6%) | $27,254 |
| 25 to 44 Years | 509 (24.7%) | $47,207 |
| 45 to 64 Years | 698 (33.9%) | $41,786 |
| 65+ Years | 676 (32.8%) | $29,643 |
| Total | 2,059 (100.0%) | $37,380 |
Poverty in Vandalia
Income Below Poverty by Sex and Age in Vandalia
With 17.3% poverty level for males and 23.1% for females among the residents of Vandalia, 5 year old males and 12 to 14 year old females are the most vulnerable to poverty, with 38 males (100.0%) and 32 females (62.7%) in their respective age groups living below the poverty level.
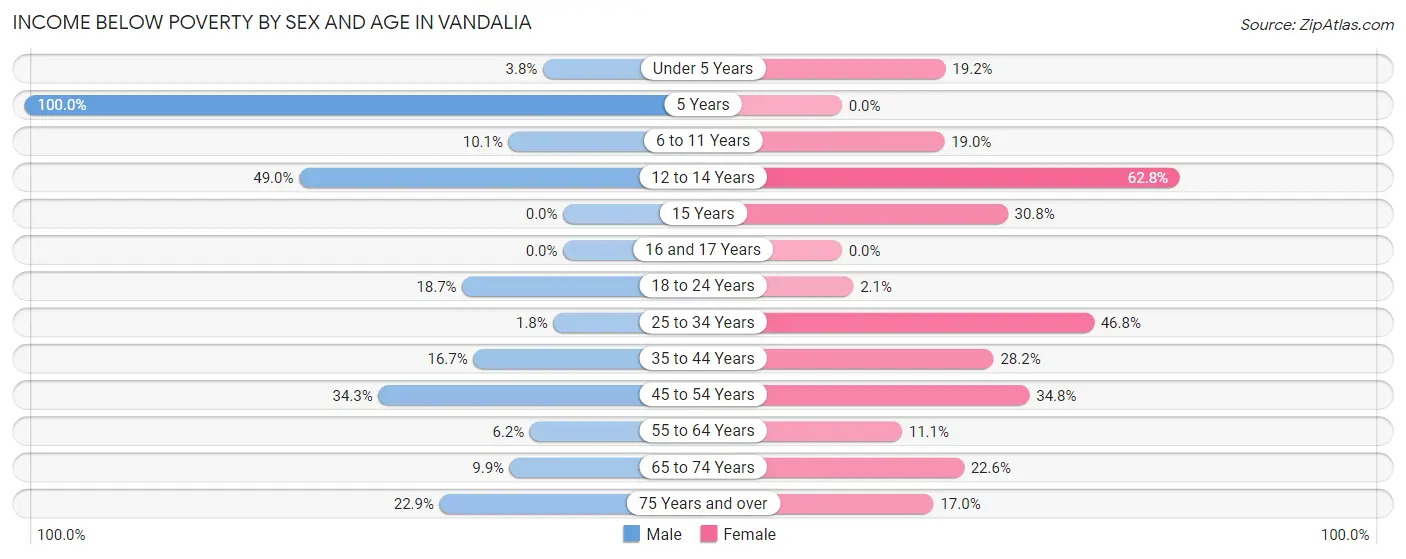
| Age Bracket | Male | Female |
| Under 5 Years | 3 (3.7%) | 20 (19.2%) |
| 5 Years | 38 (100.0%) | 0 (0.0%) |
| 6 to 11 Years | 8 (10.1%) | 27 (19.0%) |
| 12 to 14 Years | 50 (49.0%) | 32 (62.7%) |
| 15 Years | 0 (0.0%) | 4 (30.8%) |
| 16 and 17 Years | 0 (0.0%) | 0 (0.0%) |
| 18 to 24 Years | 62 (18.7%) | 6 (2.1%) |
| 25 to 34 Years | 6 (1.8%) | 137 (46.8%) |
| 35 to 44 Years | 49 (16.7%) | 69 (28.2%) |
| 45 to 54 Years | 119 (34.3%) | 126 (34.8%) |
| 55 to 64 Years | 17 (6.2%) | 41 (11.1%) |
| 65 to 74 Years | 22 (9.9%) | 74 (22.6%) |
| 75 Years and over | 36 (22.9%) | 48 (17.0%) |
| Total | 410 (17.3%) | 584 (23.1%) |
Income Above Poverty by Sex and Age in Vandalia
According to the poverty statistics in Vandalia, males aged 15 years and females aged 16 and 17 years are the age groups that are most secure financially, with 100.0% of males and 100.0% of females in these age groups living above the poverty line.
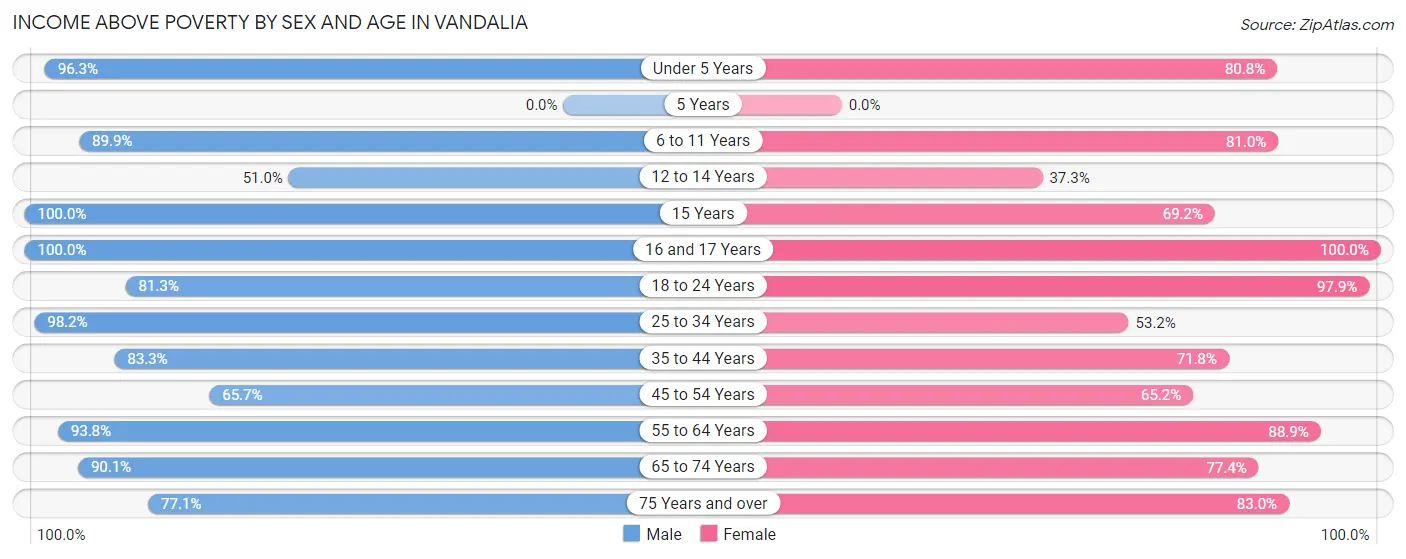
| Age Bracket | Male | Female |
| Under 5 Years | 77 (96.3%) | 84 (80.8%) |
| 5 Years | 0 (0.0%) | 0 (0.0%) |
| 6 to 11 Years | 71 (89.9%) | 115 (81.0%) |
| 12 to 14 Years | 52 (51.0%) | 19 (37.2%) |
| 15 Years | 81 (100.0%) | 9 (69.2%) |
| 16 and 17 Years | 37 (100.0%) | 60 (100.0%) |
| 18 to 24 Years | 269 (81.3%) | 277 (97.9%) |
| 25 to 34 Years | 326 (98.2%) | 156 (53.2%) |
| 35 to 44 Years | 245 (83.3%) | 176 (71.8%) |
| 45 to 54 Years | 228 (65.7%) | 236 (65.2%) |
| 55 to 64 Years | 258 (93.8%) | 327 (88.9%) |
| 65 to 74 Years | 200 (90.1%) | 253 (77.4%) |
| 75 Years and over | 121 (77.1%) | 234 (83.0%) |
| Total | 1,965 (82.7%) | 1,946 (76.9%) |
Income Below Poverty Among Married-Couple Families in Vandalia
The poverty statistics for married-couple families in Vandalia show that 14.8% or 112 of the total 754 families live below the poverty line. Families with 3 or 4 children have the highest poverty rate of 57.6%, comprising of 34 families. On the other hand, families with 5 or more children have the lowest poverty rate of 0.0%, which includes 0 families.
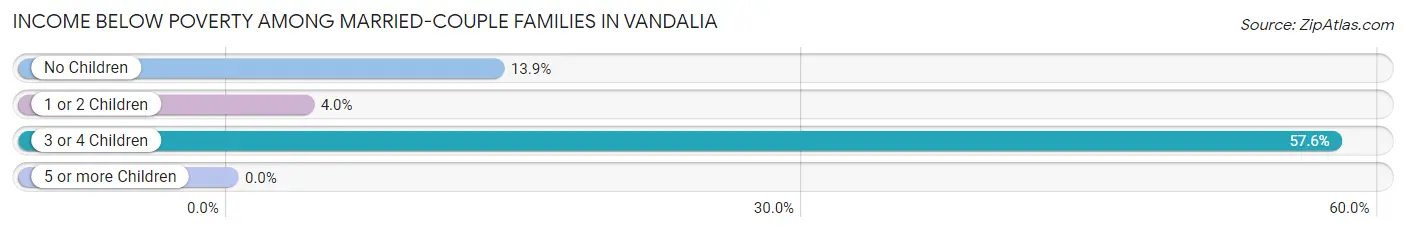
| Children | Above Poverty | Below Poverty |
| No Children | 440 (86.1%) | 71 (13.9%) |
| 1 or 2 Children | 170 (96.1%) | 7 (4.0%) |
| 3 or 4 Children | 25 (42.4%) | 34 (57.6%) |
| 5 or more Children | 7 (100.0%) | 0 (0.0%) |
| Total | 642 (85.2%) | 112 (14.8%) |
Income Below Poverty Among Single-Parent Households in Vandalia
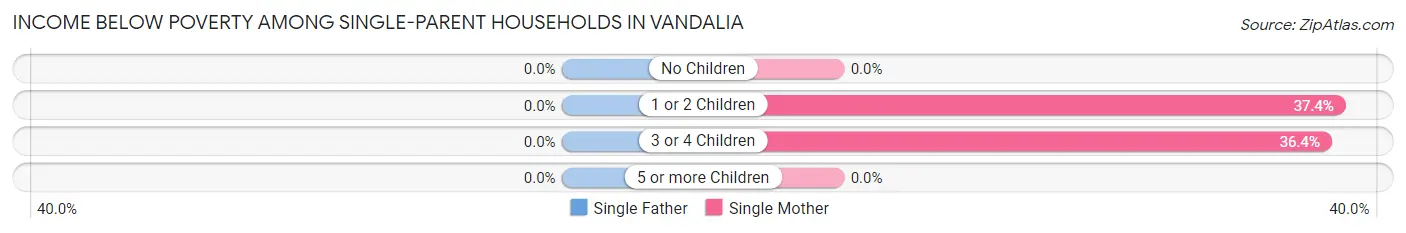
| Children | Single Father | Single Mother |
| No Children | 0 (0.0%) | 0 (0.0%) |
| 1 or 2 Children | 0 (0.0%) | 49 (37.4%) |
| 3 or 4 Children | 0 (0.0%) | 4 (36.4%) |
| 5 or more Children | 0 (0.0%) | 0 (0.0%) |
| Total | 0 (0.0%) | 53 (24.6%) |
Income Below Poverty Among Married-Couple vs Single-Parent Households in Vandalia
The poverty data for Vandalia shows that 112 of the married-couple family households (14.8%) and 53 of the single-parent households (16.6%) are living below the poverty level. Within the married-couple family households, those with 3 or 4 children have the highest poverty rate, with 34 households (57.6%) falling below the poverty line. Among the single-parent households, those with 3 or 4 children have the highest poverty rate, with 4 household (36.4%) living below poverty.
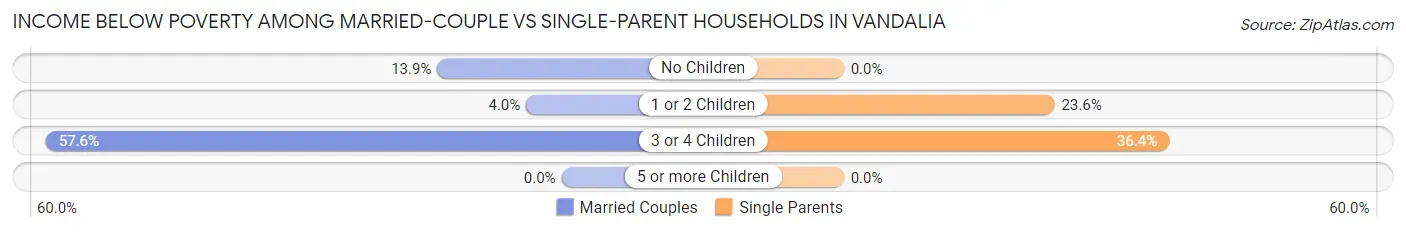
| Children | Married-Couple Families | Single-Parent Households |
| No Children | 71 (13.9%) | 0 (0.0%) |
| 1 or 2 Children | 7 (4.0%) | 49 (23.6%) |
| 3 or 4 Children | 34 (57.6%) | 4 (36.4%) |
| 5 or more Children | 0 (0.0%) | 0 (0.0%) |
| Total | 112 (14.8%) | 53 (16.6%) |
Race in Vandalia
The most populous races in Vandalia are White / Caucasian (4,930 | 81.4%), Black / African American (609 | 10.1%), and Hispanic or Latino (394 | 6.5%).
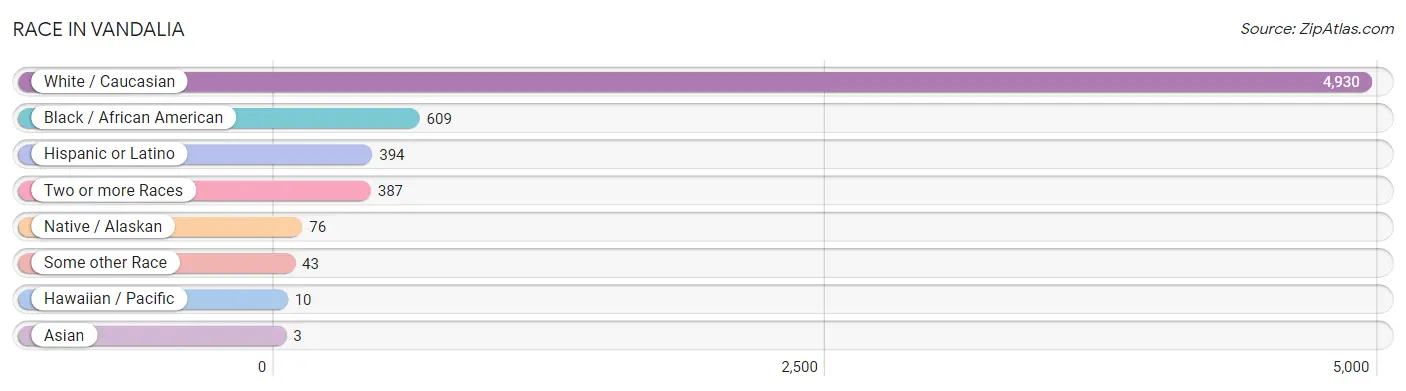
| Race | # Population | % Population |
| Asian | 3 | 0.1% |
| Black / African American | 609 | 10.1% |
| Hawaiian / Pacific | 10 | 0.2% |
| Hispanic or Latino | 394 | 6.5% |
| Native / Alaskan | 76 | 1.3% |
| White / Caucasian | 4,930 | 81.4% |
| Two or more Races | 387 | 6.4% |
| Some other Race | 43 | 0.7% |
| Total | 6,058 | 100.0% |
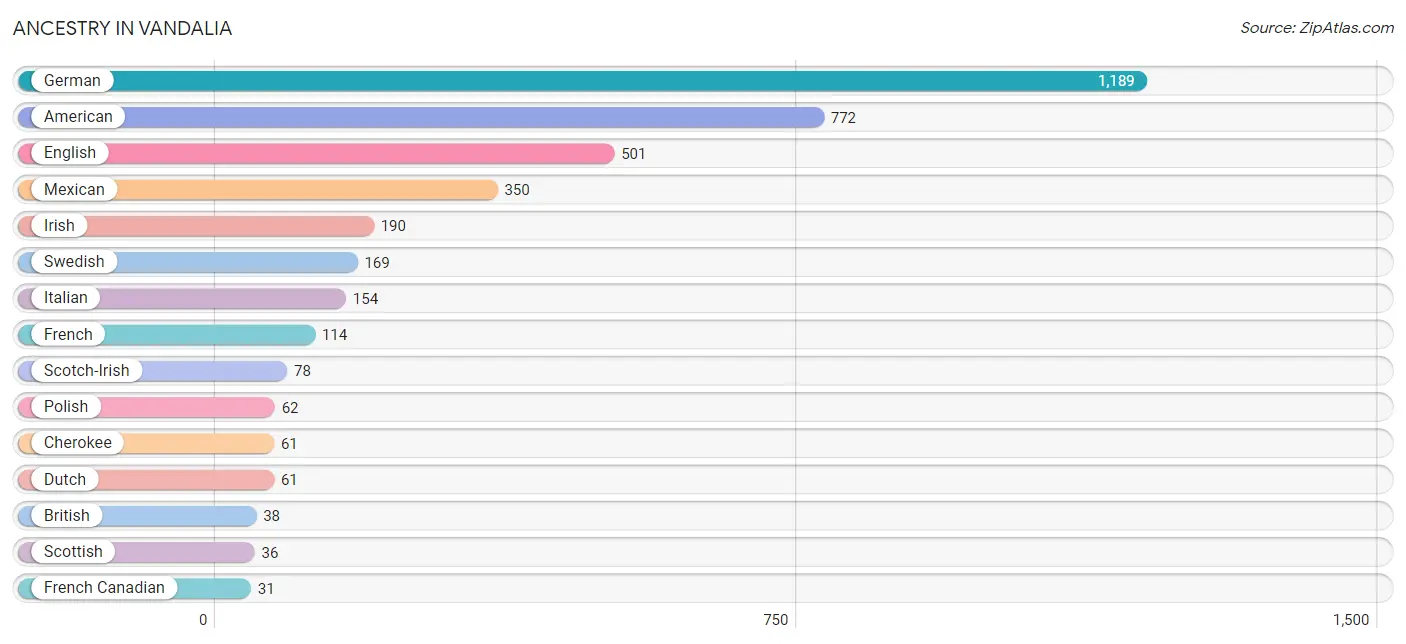
Ancestry in Vandalia
The most populous ancestries reported in Vandalia are German (1,189 | 19.6%), American (772 | 12.7%), English (501 | 8.3%), Mexican (350 | 5.8%), and Irish (190 | 3.1%), together accounting for 49.6% of all Vandalia residents.
| Ancestry | # Population | % Population |
| African | 8 | 0.1% |
| American | 772 | 12.7% |
| British | 38 | 0.6% |
| Burmese | 19 | 0.3% |
| Canadian | 20 | 0.3% |
| Cherokee | 61 | 1.0% |
| Cuban | 8 | 0.1% |
| Czech | 29 | 0.5% |
| Danish | 7 | 0.1% |
| Dutch | 61 | 1.0% |
| English | 501 | 8.3% |
| European | 15 | 0.3% |
| Finnish | 6 | 0.1% |
| French | 114 | 1.9% |
| French Canadian | 31 | 0.5% |
| German | 1,189 | 19.6% |
| Greek | 7 | 0.1% |
| Irish | 190 | 3.1% |
| Italian | 154 | 2.5% |
| Latvian | 16 | 0.3% |
| Lithuanian | 10 | 0.2% |
| Mexican | 350 | 5.8% |
| Norwegian | 20 | 0.3% |
| Pakistani | 3 | 0.1% |
| Polish | 62 | 1.0% |
| Puerto Rican | 15 | 0.3% |
| Russian | 4 | 0.1% |
| Scandinavian | 2 | 0.0% |
| Scotch-Irish | 78 | 1.3% |
| Scottish | 36 | 0.6% |
| Subsaharan African | 8 | 0.1% |
| Swedish | 169 | 2.8% |
| Swiss | 7 | 0.1% |
| Ukrainian | 27 | 0.4% | View All 34 Rows |
Immigrants in Vandalia
The most numerous immigrant groups reported in Vandalia came from Central America (116 | 1.9%), Latin America (116 | 1.9%), Mexico (116 | 1.9%), Europe (61 | 1.0%), and Eastern Europe (43 | 0.7%), together accounting for 7.4% of all Vandalia residents.
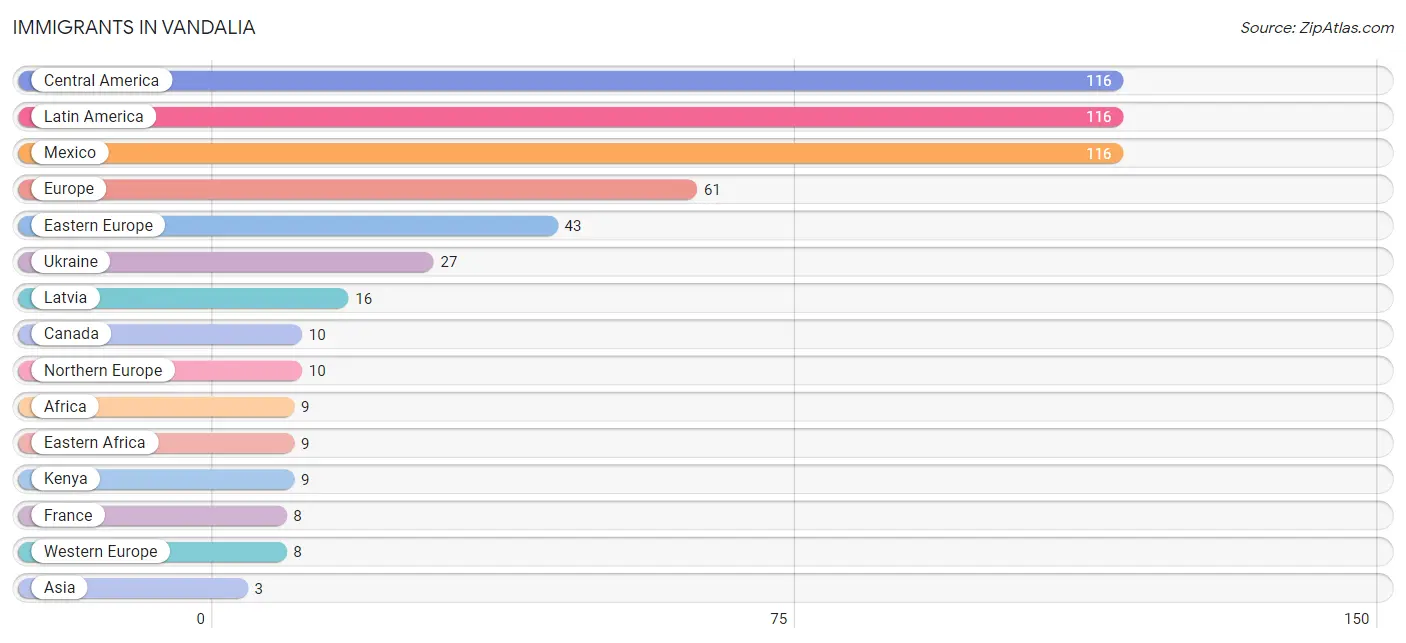
| Immigration Origin | # Population | % Population |
| Africa | 9 | 0.2% |
| Asia | 3 | 0.1% |
| Canada | 10 | 0.2% |
| Central America | 116 | 1.9% |
| Eastern Africa | 9 | 0.2% |
| Eastern Europe | 43 | 0.7% |
| Europe | 61 | 1.0% |
| France | 8 | 0.1% |
| Kenya | 9 | 0.2% |
| Latin America | 116 | 1.9% |
| Latvia | 16 | 0.3% |
| Mexico | 116 | 1.9% |
| Northern Europe | 10 | 0.2% |
| South Eastern Asia | 3 | 0.1% |
| Thailand | 3 | 0.1% |
| Ukraine | 27 | 0.4% |
| Western Europe | 8 | 0.1% | View All 17 Rows |
Sex and Age in Vandalia
Sex and Age in Vandalia
The most populous age groups in Vandalia are 25 to 29 Years (360 | 10.5%) for men and 15 to 19 Years (237 | 8.9%) for women.
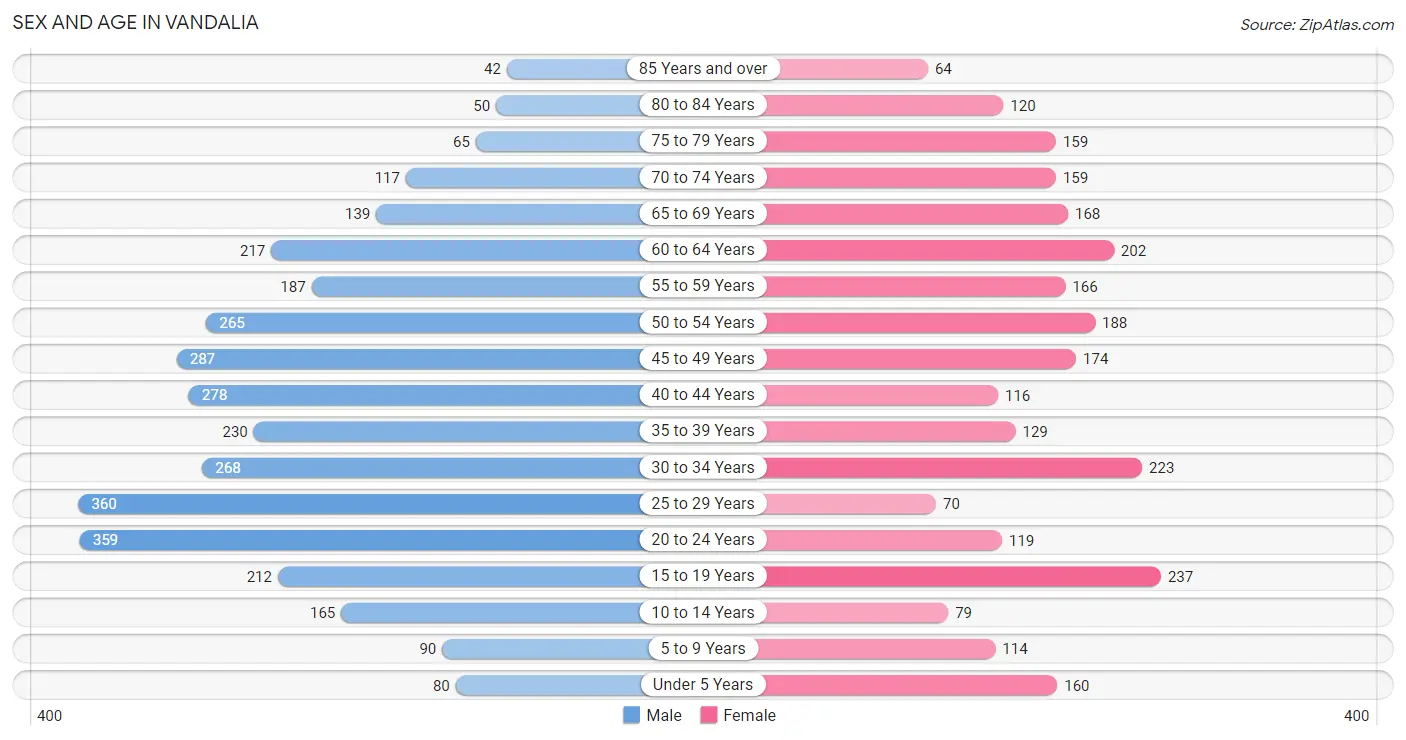
| Age Bracket | Male | Female |
| Under 5 Years | 80 (2.4%) | 160 (6.0%) |
| 5 to 9 Years | 90 (2.6%) | 114 (4.3%) |
| 10 to 14 Years | 165 (4.8%) | 79 (3.0%) |
| 15 to 19 Years | 212 (6.2%) | 237 (8.9%) |
| 20 to 24 Years | 359 (10.5%) | 119 (4.5%) |
| 25 to 29 Years | 360 (10.5%) | 70 (2.6%) |
| 30 to 34 Years | 268 (7.9%) | 223 (8.4%) |
| 35 to 39 Years | 230 (6.7%) | 129 (4.9%) |
| 40 to 44 Years | 278 (8.2%) | 116 (4.4%) |
| 45 to 49 Years | 287 (8.4%) | 174 (6.6%) |
| 50 to 54 Years | 265 (7.8%) | 188 (7.1%) |
| 55 to 59 Years | 187 (5.5%) | 166 (6.3%) |
| 60 to 64 Years | 217 (6.4%) | 202 (7.6%) |
| 65 to 69 Years | 139 (4.1%) | 168 (6.4%) |
| 70 to 74 Years | 117 (3.4%) | 159 (6.0%) |
| 75 to 79 Years | 65 (1.9%) | 159 (6.0%) |
| 80 to 84 Years | 50 (1.5%) | 120 (4.5%) |
| 85 Years and over | 42 (1.2%) | 64 (2.4%) |
| Total | 3,411 (100.0%) | 2,647 (100.0%) |
Families and Households in Vandalia
Median Family Size in Vandalia
The median family size in Vandalia is 3.10 persons per family, with single female/mother families (215 | 20.0%) accounting for the largest median family size of 3.91 persons per family. On the other hand, single male/father families (104 | 9.7%) represent the smallest median family size with 2.68 persons per family.
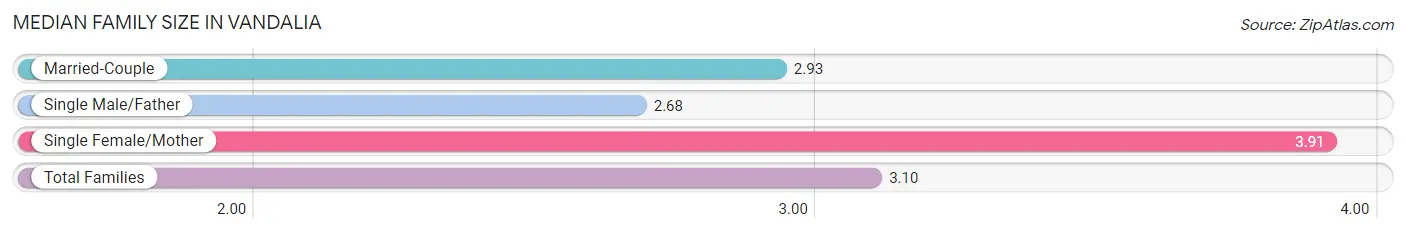
| Family Type | # Families | Family Size |
| Married-Couple | 754 (70.3%) | 2.93 |
| Single Male/Father | 104 (9.7%) | 2.68 |
| Single Female/Mother | 215 (20.0%) | 3.91 |
| Total Families | 1,073 (100.0%) | 3.10 |
Median Household Size in Vandalia
The median household size in Vandalia is 2.40 persons per household, with single female/mother households (215 | 10.4%) accounting for the largest median household size of 3.98 persons per household. non-family households (986 | 47.9%) represent the smallest median household size with 1.49 persons per household.
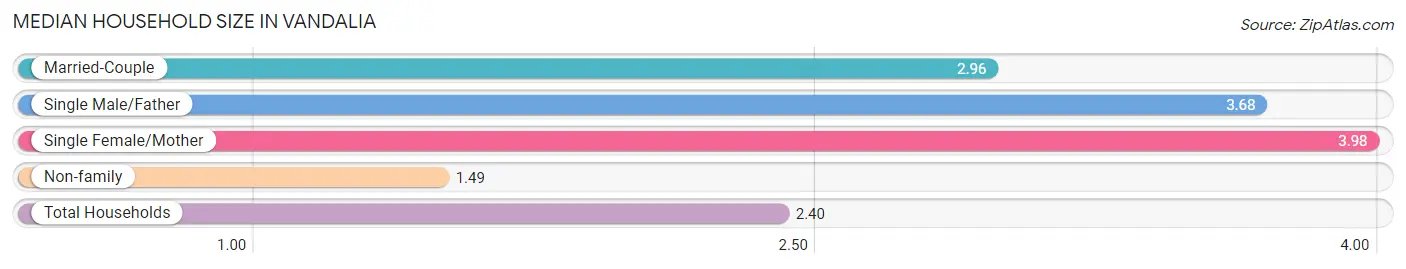
| Household Type | # Households | Household Size |
| Married-Couple | 754 (36.6%) | 2.96 |
| Single Male/Father | 104 (5.1%) | 3.68 |
| Single Female/Mother | 215 (10.4%) | 3.98 |
| Non-family | 986 (47.9%) | 1.49 |
| Total Households | 2,059 (100.0%) | 2.40 |
Household Size by Marriage Status in Vandalia
Out of a total of 2,059 households in Vandalia, 1,073 (52.1%) are family households, while 986 (47.9%) are nonfamily households. The most numerous type of family households are 2-person households, comprising 616, and the most common type of nonfamily households are 1-person households, comprising 821.
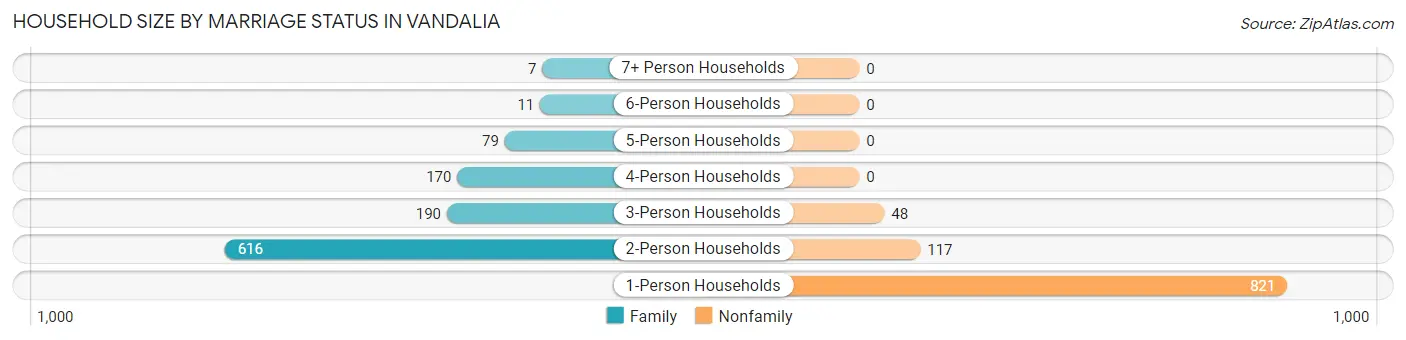
| Household Size | Family Households | Nonfamily Households |
| 1-Person Households | - | 821 (39.9%) |
| 2-Person Households | 616 (29.9%) | 117 (5.7%) |
| 3-Person Households | 190 (9.2%) | 48 (2.3%) |
| 4-Person Households | 170 (8.3%) | 0 (0.0%) |
| 5-Person Households | 79 (3.8%) | 0 (0.0%) |
| 6-Person Households | 11 (0.5%) | 0 (0.0%) |
| 7+ Person Households | 7 (0.3%) | 0 (0.0%) |
| Total | 1,073 (52.1%) | 986 (47.9%) |
Female Fertility in Vandalia
Fertility by Age in Vandalia
Average fertility rate in Vandalia is 108.0 births per 1,000 women. Women in the age bracket of 20 to 34 years have the highest fertility rate with 228.0 births per 1,000 women. Women in the age bracket of 20 to 34 years acount for 79.7% of all women with births.
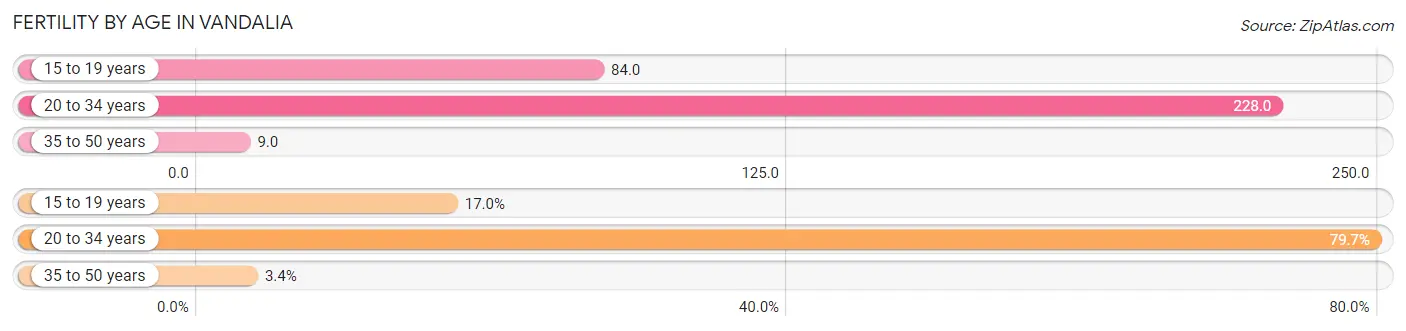
| Age Bracket | Women with Births | Births / 1,000 Women |
| 15 to 19 years | 20 (17.0%) | 84.0 |
| 20 to 34 years | 94 (79.7%) | 228.0 |
| 35 to 50 years | 4 (3.4%) | 9.0 |
| Total | 118 (100.0%) | 108.0 |
Fertility by Age by Marriage Status in Vandalia
22.0% of women with births (118) in Vandalia are married. The highest percentage of unmarried women with births falls into 15 to 19 years age bracket with 100.0% of them unmarried at the time of birth, while the lowest percentage of unmarried women with births belong to 20 to 34 years age bracket with 72.3% of them unmarried.
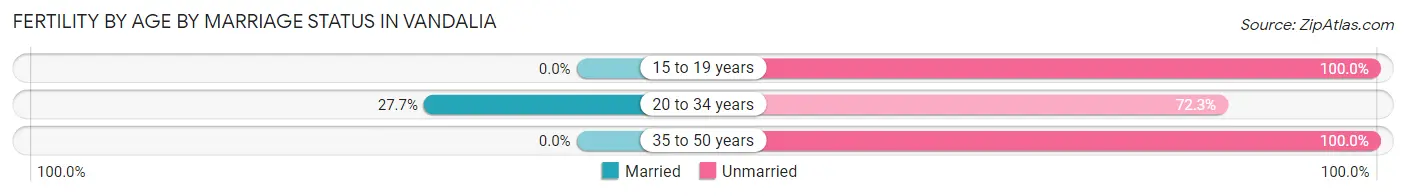
| Age Bracket | Married | Unmarried |
| 15 to 19 years | 0 (0.0%) | 20 (100.0%) |
| 20 to 34 years | 26 (27.7%) | 68 (72.3%) |
| 35 to 50 years | 0 (0.0%) | 4 (100.0%) |
| Total | 26 (22.0%) | 92 (78.0%) |
Fertility by Education in Vandalia
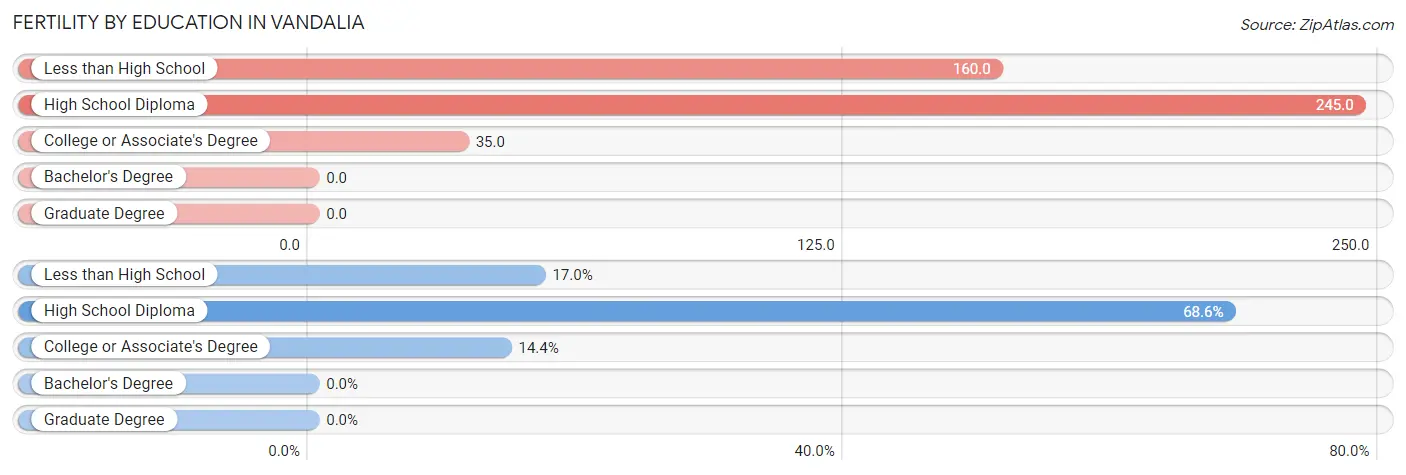
| Educational Attainment | Women with Births | Births / 1,000 Women |
| Less than High School | 20 (17.0%) | 160.0 |
| High School Diploma | 81 (68.6%) | 245.0 |
| College or Associate's Degree | 17 (14.4%) | 35.0 |
| Bachelor's Degree | 0 (0.0%) | 0.0 |
| Graduate Degree | 0 (0.0%) | 0.0 |
| Total | 118 (100.0%) | 108.0 |
Fertility by Education by Marriage Status in Vandalia
78.0% of women with births in Vandalia are unmarried. Women with the educational attainment of college or associate's degree are most likely to be married with 76.5% of them married at childbirth, while women with the educational attainment of less than high school are least likely to be married with 100.0% of them unmarried at childbirth.
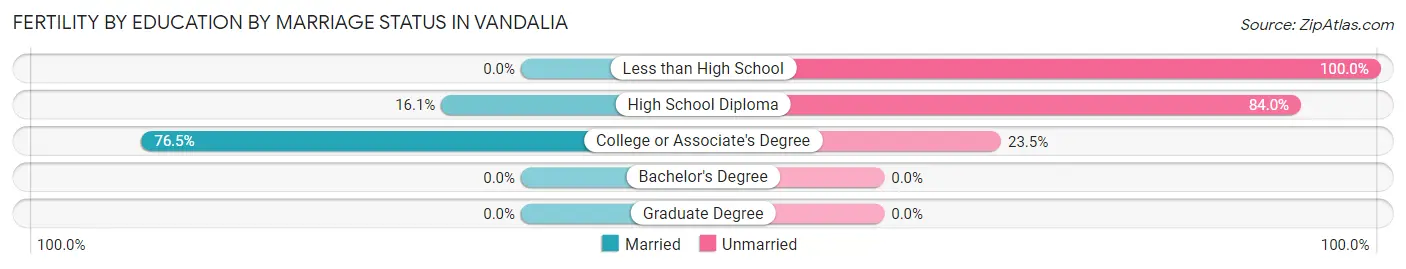
| Educational Attainment | Married | Unmarried |
| Less than High School | 0 (0.0%) | 20 (100.0%) |
| High School Diploma | 13 (16.1%) | 68 (84.0%) |
| College or Associate's Degree | 13 (76.5%) | 4 (23.5%) |
| Bachelor's Degree | 0 (0.0%) | 0 (0.0%) |
| Graduate Degree | 0 (0.0%) | 0 (0.0%) |
| Total | 26 (22.0%) | 92 (78.0%) |
Employment Characteristics in Vandalia
Employment by Class of Employer in Vandalia
Among the 2,260 employed individuals in Vandalia, private company employees (1,630 | 72.1%), self-employed (not incorporated) (252 | 11.2%), and local government employees (138 | 6.1%) make up the most common classes of employment.
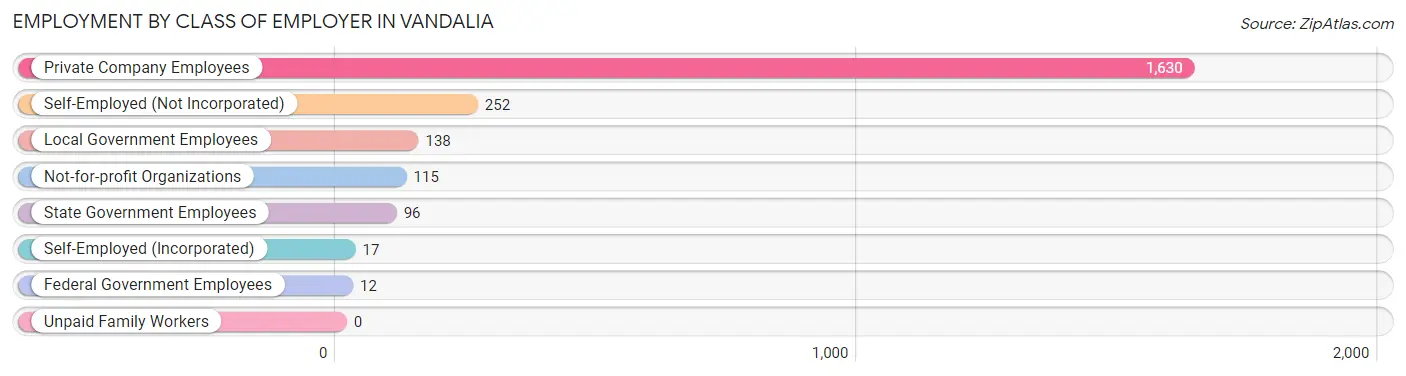
| Employer Class | # Employees | % Employees |
| Private Company Employees | 1,630 | 72.1% |
| Self-Employed (Incorporated) | 17 | 0.7% |
| Self-Employed (Not Incorporated) | 252 | 11.2% |
| Not-for-profit Organizations | 115 | 5.1% |
| Local Government Employees | 138 | 6.1% |
| State Government Employees | 96 | 4.3% |
| Federal Government Employees | 12 | 0.5% |
| Unpaid Family Workers | 0 | 0.0% |
| Total | 2,260 | 100.0% |
Employment Status by Age in Vandalia
According to the labor force statistics for Vandalia, out of the total population over 16 years of age (5,276), 44.8% or 2,364 individuals are in the labor force, with 3.1% or 73 of them unemployed. The age group with the highest labor force participation rate is 20 to 24 years, with 70.9% or 339 individuals in the labor force. Within the labor force, the 20 to 24 years age range has the highest percentage of unemployed individuals, with 15.0% or 51 of them being unemployed.
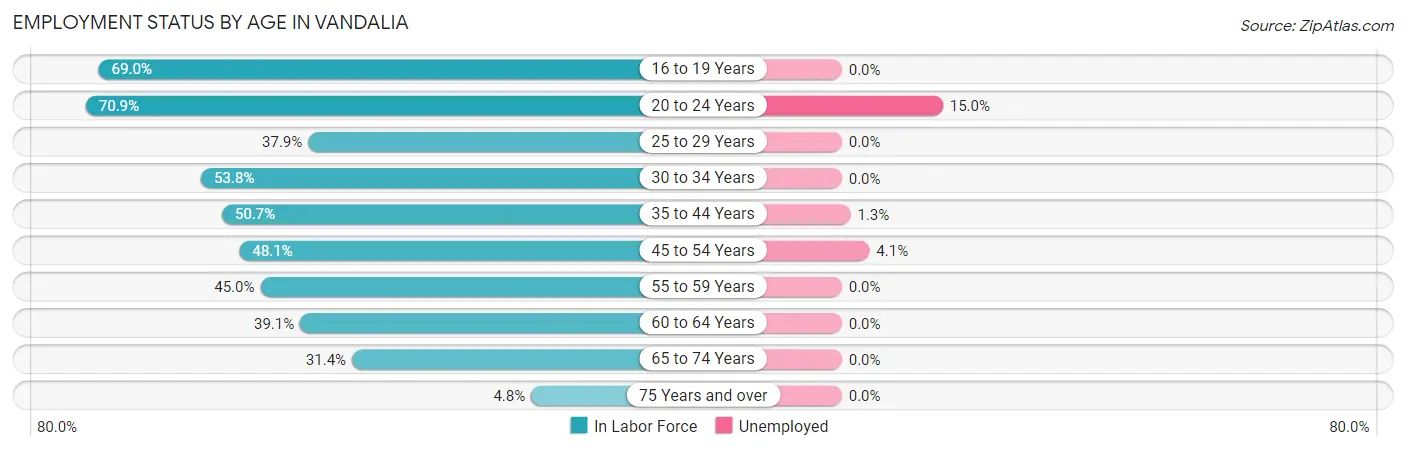
| Age Bracket | In Labor Force | Unemployed |
| 16 to 19 Years | 245 (69.0%) | 0 (0.0%) |
| 20 to 24 Years | 339 (70.9%) | 51 (15.0%) |
| 25 to 29 Years | 163 (37.9%) | 0 (0.0%) |
| 30 to 34 Years | 264 (53.8%) | 0 (0.0%) |
| 35 to 44 Years | 382 (50.7%) | 5 (1.3%) |
| 45 to 54 Years | 440 (48.1%) | 18 (4.1%) |
| 55 to 59 Years | 159 (45.0%) | 0 (0.0%) |
| 60 to 64 Years | 164 (39.1%) | 0 (0.0%) |
| 65 to 74 Years | 183 (31.4%) | 0 (0.0%) |
| 75 Years and over | 24 (4.8%) | 0 (0.0%) |
| Total | 2,364 (44.8%) | 73 (3.1%) |
Employment Status by Educational Attainment in Vandalia
According to labor force statistics for Vandalia, 46.8% of individuals (1,572) out of the total population between 25 and 64 years of age (3,360) are in the labor force, with 1.5% or 24 of them being unemployed. The group with the highest labor force participation rate are those with the educational attainment of bachelor's degree or higher, with 86.0% or 320 individuals in the labor force. Within the labor force, individuals with less than high school education have the highest percentage of unemployment, with 3.9% or 5 of them being unemployed.
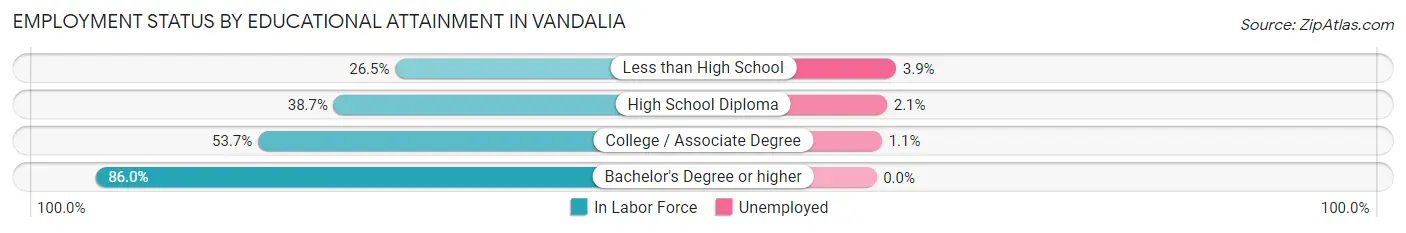
| Educational Attainment | In Labor Force | Unemployed |
| Less than High School | 128 (26.5%) | 19 (3.9%) |
| High School Diploma | 570 (38.7%) | 31 (2.1%) |
| College / Associate Degree | 554 (53.7%) | 11 (1.1%) |
| Bachelor's Degree or higher | 320 (86.0%) | 0 (0.0%) |
| Total | 1,572 (46.8%) | 50 (1.5%) |
Employment Occupations by Sex in Vandalia
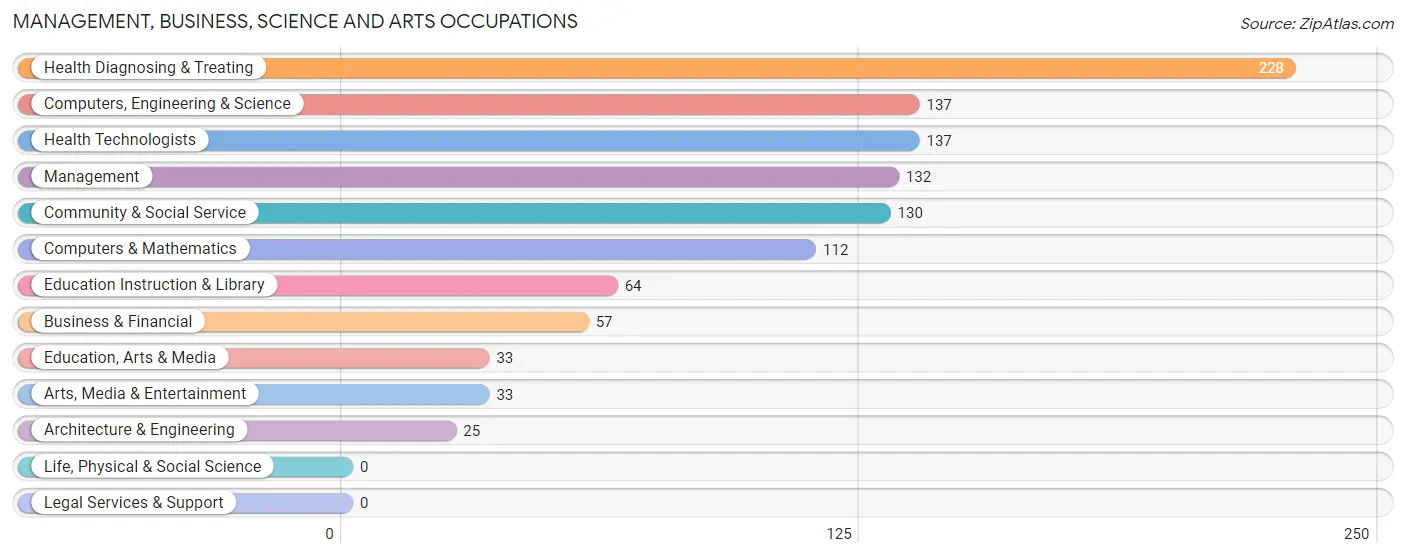
Management, Business, Science and Arts Occupations
The most common Management, Business, Science and Arts occupations in Vandalia are Health Diagnosing & Treating (228 | 10.0%), Computers, Engineering & Science (137 | 6.0%), Health Technologists (137 | 6.0%), Management (132 | 5.8%), and Community & Social Service (130 | 5.7%).
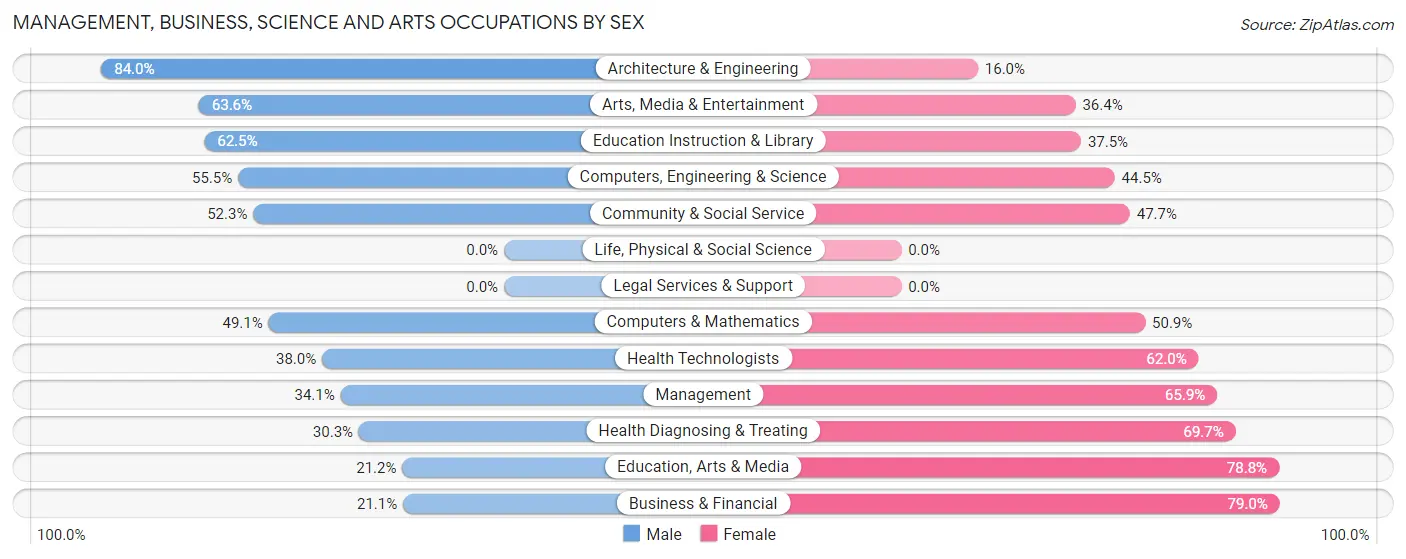
Management, Business, Science and Arts Occupations by Sex
Within the Management, Business, Science and Arts occupations in Vandalia, the most male-oriented occupations are Architecture & Engineering (84.0%), Arts, Media & Entertainment (63.6%), and Education Instruction & Library (62.5%), while the most female-oriented occupations are Business & Financial (78.9%), Education, Arts & Media (78.8%), and Health Diagnosing & Treating (69.7%).
| Occupation | Male | Female |
| Management | 45 (34.1%) | 87 (65.9%) |
| Business & Financial | 12 (21.0%) | 45 (78.9%) |
| Computers, Engineering & Science | 76 (55.5%) | 61 (44.5%) |
| Computers & Mathematics | 55 (49.1%) | 57 (50.9%) |
| Architecture & Engineering | 21 (84.0%) | 4 (16.0%) |
| Life, Physical & Social Science | 0 (0.0%) | 0 (0.0%) |
| Community & Social Service | 68 (52.3%) | 62 (47.7%) |
| Education, Arts & Media | 7 (21.2%) | 26 (78.8%) |
| Legal Services & Support | 0 (0.0%) | 0 (0.0%) |
| Education Instruction & Library | 40 (62.5%) | 24 (37.5%) |
| Arts, Media & Entertainment | 21 (63.6%) | 12 (36.4%) |
| Health Diagnosing & Treating | 69 (30.3%) | 159 (69.7%) |
| Health Technologists | 52 (38.0%) | 85 (62.0%) |
| Total (Category) | 270 (39.5%) | 414 (60.5%) |
| Total (Overall) | 1,220 (53.3%) | 1,069 (46.7%) |
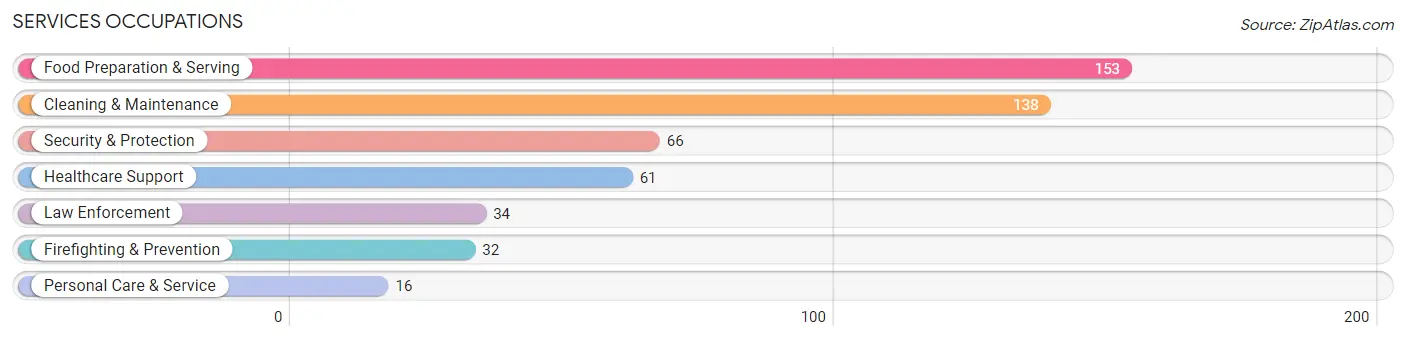
Services Occupations
The most common Services occupations in Vandalia are Food Preparation & Serving (153 | 6.7%), Cleaning & Maintenance (138 | 6.0%), Security & Protection (66 | 2.9%), Healthcare Support (61 | 2.7%), and Law Enforcement (34 | 1.5%).
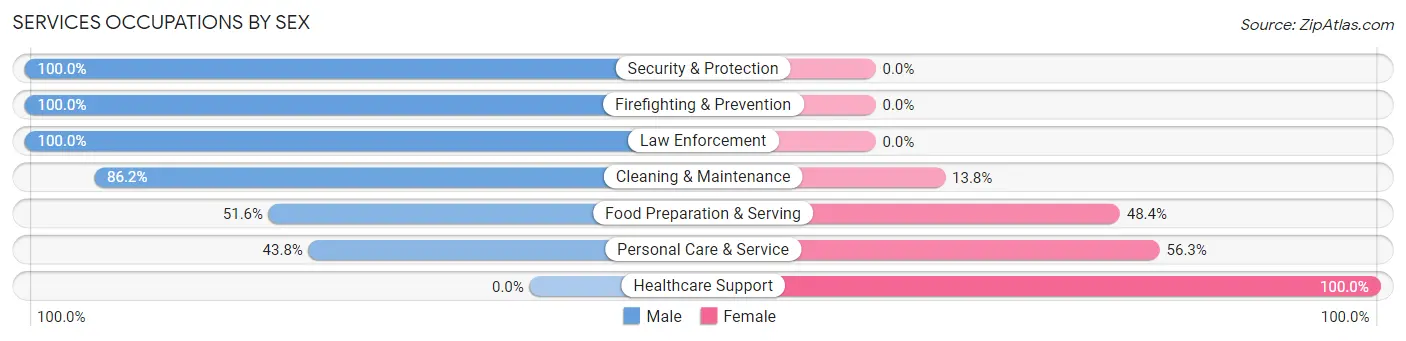
Services Occupations by Sex
Within the Services occupations in Vandalia, the most male-oriented occupations are Security & Protection (100.0%), Firefighting & Prevention (100.0%), and Law Enforcement (100.0%), while the most female-oriented occupations are Healthcare Support (100.0%), Personal Care & Service (56.2%), and Food Preparation & Serving (48.4%).
| Occupation | Male | Female |
| Healthcare Support | 0 (0.0%) | 61 (100.0%) |
| Security & Protection | 66 (100.0%) | 0 (0.0%) |
| Firefighting & Prevention | 32 (100.0%) | 0 (0.0%) |
| Law Enforcement | 34 (100.0%) | 0 (0.0%) |
| Food Preparation & Serving | 79 (51.6%) | 74 (48.4%) |
| Cleaning & Maintenance | 119 (86.2%) | 19 (13.8%) |
| Personal Care & Service | 7 (43.8%) | 9 (56.2%) |
| Total (Category) | 271 (62.4%) | 163 (37.6%) |
| Total (Overall) | 1,220 (53.3%) | 1,069 (46.7%) |
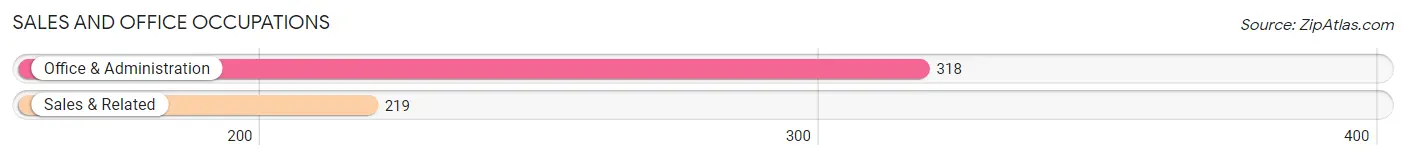
Sales and Office Occupations
The most common Sales and Office occupations in Vandalia are Office & Administration (318 | 13.9%), and Sales & Related (219 | 9.6%).
Sales and Office Occupations by Sex
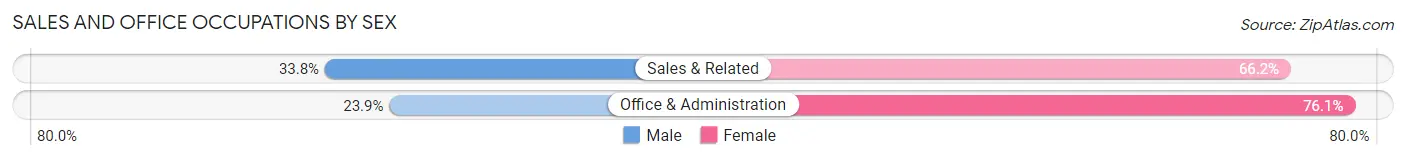
| Occupation | Male | Female |
| Sales & Related | 74 (33.8%) | 145 (66.2%) |
| Office & Administration | 76 (23.9%) | 242 (76.1%) |
| Total (Category) | 150 (27.9%) | 387 (72.1%) |
| Total (Overall) | 1,220 (53.3%) | 1,069 (46.7%) |
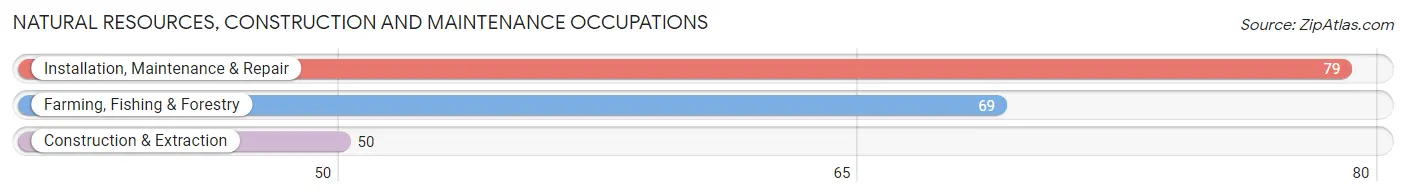
Natural Resources, Construction and Maintenance Occupations
The most common Natural Resources, Construction and Maintenance occupations in Vandalia are Installation, Maintenance & Repair (79 | 3.5%), Farming, Fishing & Forestry (69 | 3.0%), and Construction & Extraction (50 | 2.2%).
Natural Resources, Construction and Maintenance Occupations by Sex
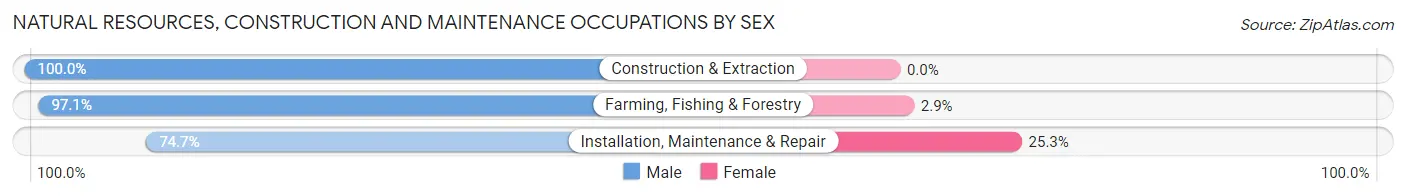
| Occupation | Male | Female |
| Farming, Fishing & Forestry | 67 (97.1%) | 2 (2.9%) |
| Construction & Extraction | 50 (100.0%) | 0 (0.0%) |
| Installation, Maintenance & Repair | 59 (74.7%) | 20 (25.3%) |
| Total (Category) | 176 (88.9%) | 22 (11.1%) |
| Total (Overall) | 1,220 (53.3%) | 1,069 (46.7%) |
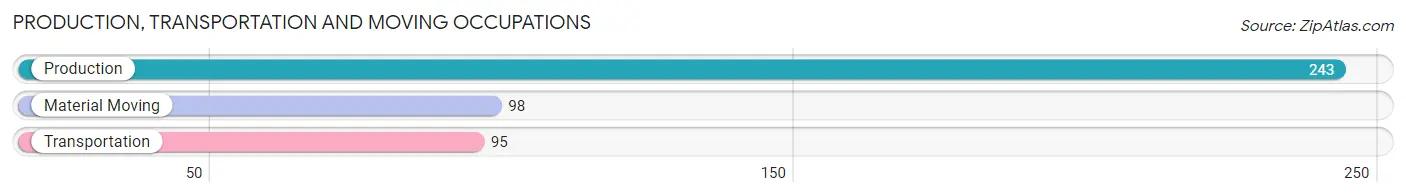
Production, Transportation and Moving Occupations
The most common Production, Transportation and Moving occupations in Vandalia are Production (243 | 10.6%), Material Moving (98 | 4.3%), and Transportation (95 | 4.2%).
Production, Transportation and Moving Occupations by Sex
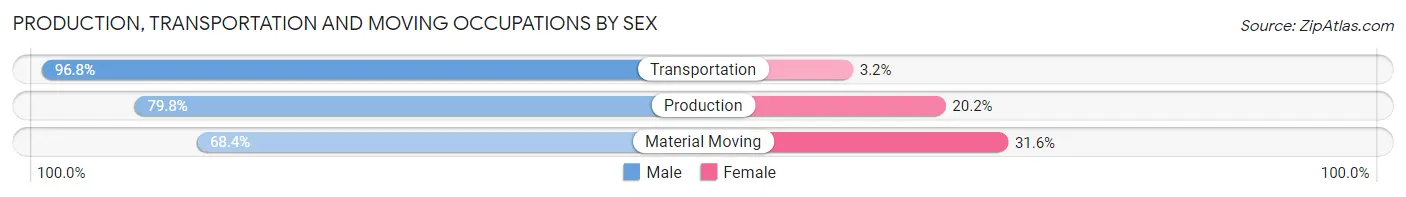
| Occupation | Male | Female |
| Production | 194 (79.8%) | 49 (20.2%) |
| Transportation | 92 (96.8%) | 3 (3.2%) |
| Material Moving | 67 (68.4%) | 31 (31.6%) |
| Total (Category) | 353 (81.0%) | 83 (19.0%) |
| Total (Overall) | 1,220 (53.3%) | 1,069 (46.7%) |
Employment Industries by Sex in Vandalia
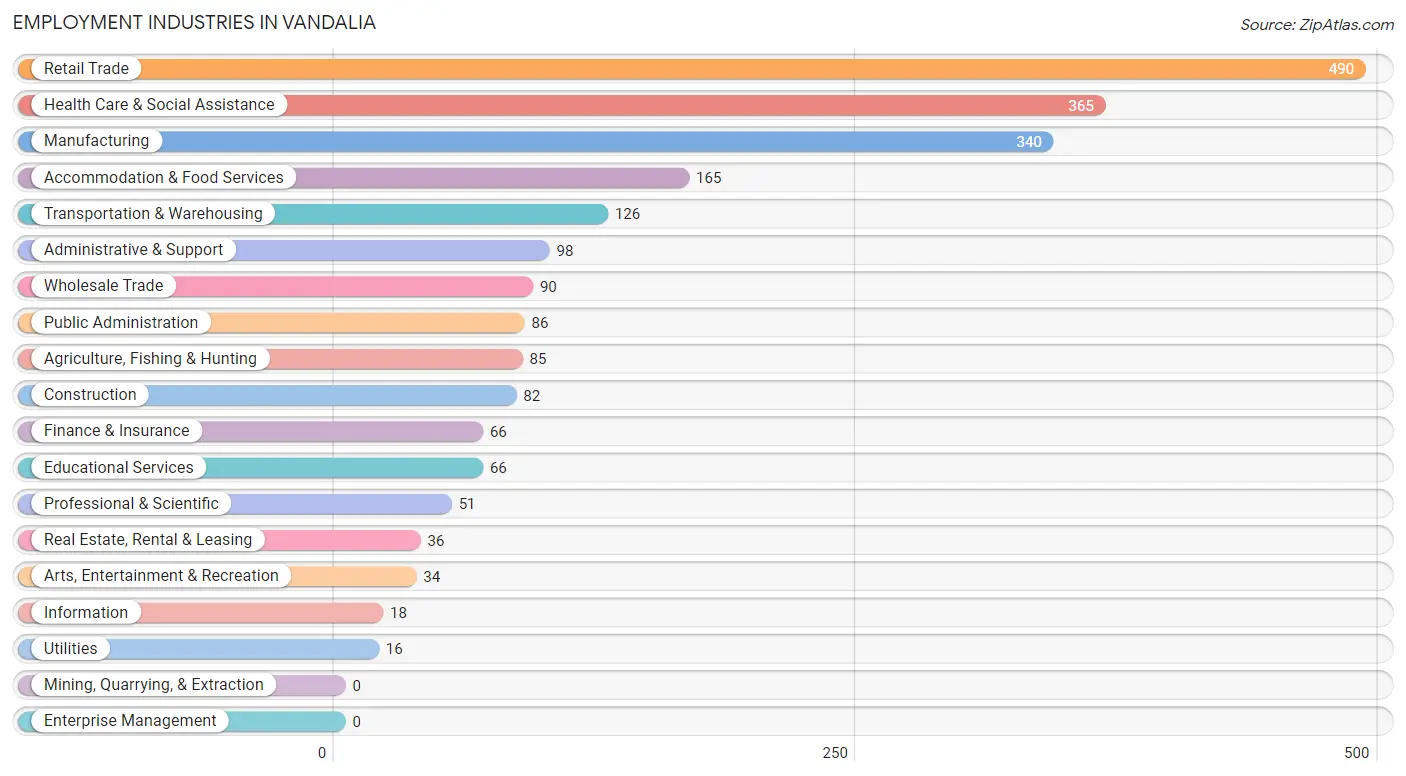
Employment Industries in Vandalia
The major employment industries in Vandalia include Retail Trade (490 | 21.4%), Health Care & Social Assistance (365 | 16.0%), Manufacturing (340 | 14.8%), Accommodation & Food Services (165 | 7.2%), and Transportation & Warehousing (126 | 5.5%).
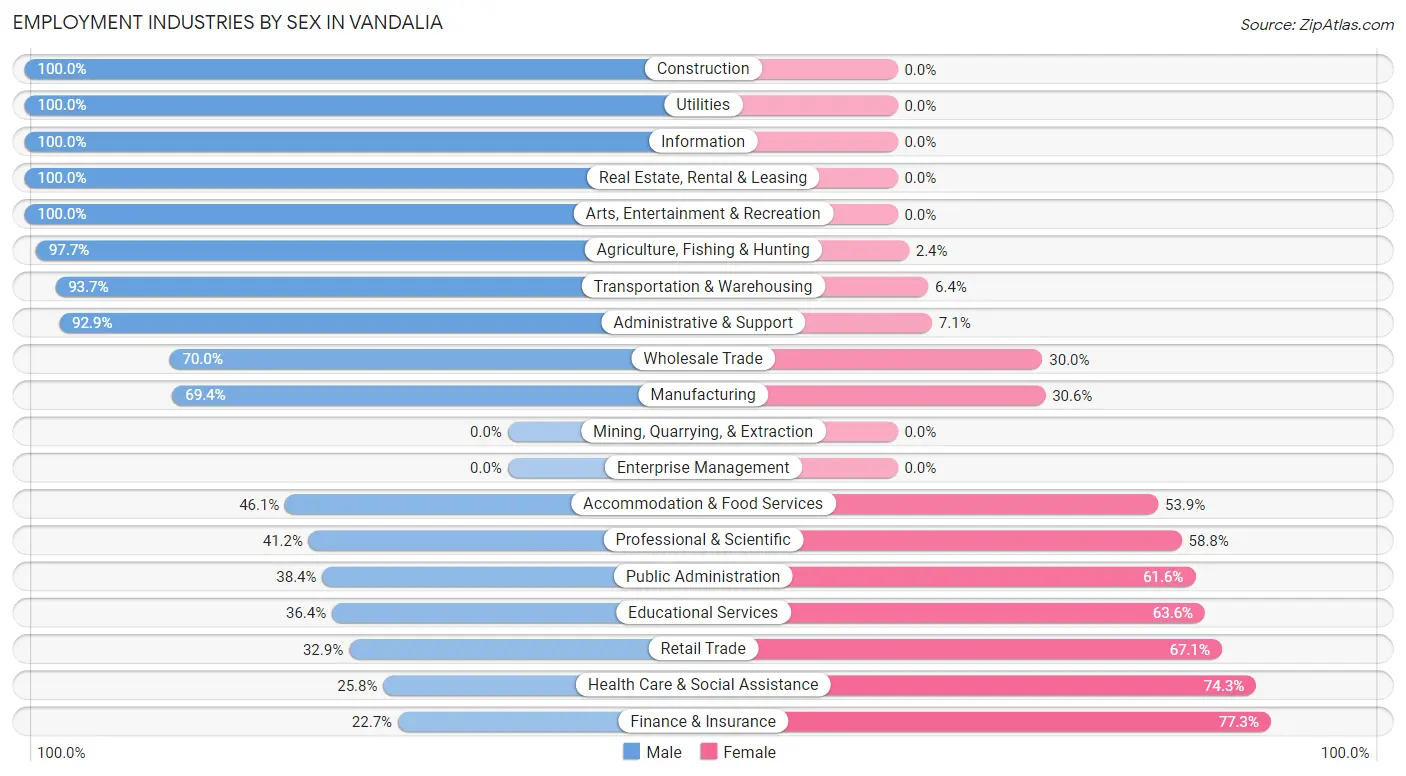
Employment Industries by Sex in Vandalia
The Vandalia industries that see more men than women are Construction (100.0%), Utilities (100.0%), and Information (100.0%), whereas the industries that tend to have a higher number of women are Finance & Insurance (77.3%), Health Care & Social Assistance (74.3%), and Retail Trade (67.1%).
| Industry | Male | Female |
| Agriculture, Fishing & Hunting | 83 (97.7%) | 2 (2.4%) |
| Mining, Quarrying, & Extraction | 0 (0.0%) | 0 (0.0%) |
| Construction | 82 (100.0%) | 0 (0.0%) |
| Manufacturing | 236 (69.4%) | 104 (30.6%) |
| Wholesale Trade | 63 (70.0%) | 27 (30.0%) |
| Retail Trade | 161 (32.9%) | 329 (67.1%) |
| Transportation & Warehousing | 118 (93.6%) | 8 (6.4%) |
| Utilities | 16 (100.0%) | 0 (0.0%) |
| Information | 18 (100.0%) | 0 (0.0%) |
| Finance & Insurance | 15 (22.7%) | 51 (77.3%) |
| Real Estate, Rental & Leasing | 36 (100.0%) | 0 (0.0%) |
| Professional & Scientific | 21 (41.2%) | 30 (58.8%) |
| Enterprise Management | 0 (0.0%) | 0 (0.0%) |
| Administrative & Support | 91 (92.9%) | 7 (7.1%) |
| Educational Services | 24 (36.4%) | 42 (63.6%) |
| Health Care & Social Assistance | 94 (25.8%) | 271 (74.3%) |
| Arts, Entertainment & Recreation | 34 (100.0%) | 0 (0.0%) |
| Accommodation & Food Services | 76 (46.1%) | 89 (53.9%) |
| Public Administration | 33 (38.4%) | 53 (61.6%) |
| Total | 1,220 (53.3%) | 1,069 (46.7%) |
Education in Vandalia
School Enrollment in Vandalia
The most common levels of schooling among the 945 students in Vandalia are high school (284 | 30.0%), middle school (206 | 21.8%), and college / undergraduate (176 | 18.6%).
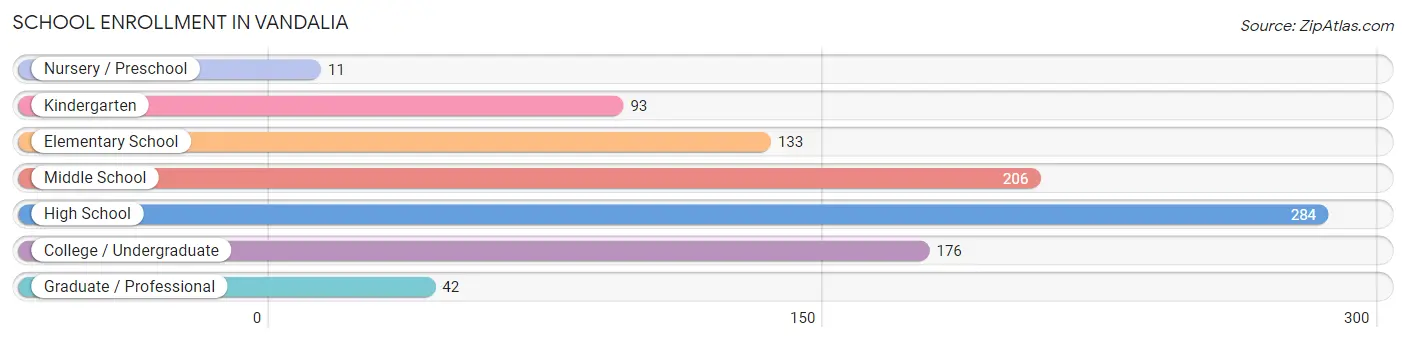
| School Level | # Students | % Students |
| Nursery / Preschool | 11 | 1.2% |
| Kindergarten | 93 | 9.8% |
| Elementary School | 133 | 14.1% |
| Middle School | 206 | 21.8% |
| High School | 284 | 30.0% |
| College / Undergraduate | 176 | 18.6% |
| Graduate / Professional | 42 | 4.4% |
| Total | 945 | 100.0% |
School Enrollment by Age by Funding Source in Vandalia
Out of a total of 945 students who are enrolled in schools in Vandalia, 157 (16.6%) attend a private institution, while the remaining 788 (83.4%) are enrolled in public schools. The age group of 25 to 34 year olds has the highest likelihood of being enrolled in private schools, with 49 (81.7% in the age bracket) enrolled. Conversely, the age group of 10 to 14 year olds has the lowest likelihood of being enrolled in a private school, with 238 (97.5% in the age bracket) attending a public institution.
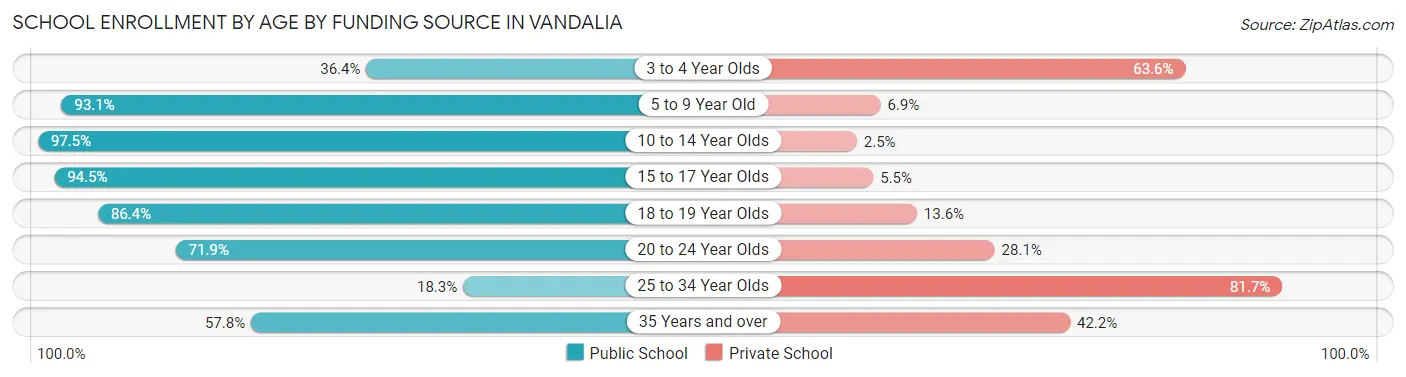
| Age Bracket | Public School | Private School |
| 3 to 4 Year Olds | 4 (36.4%) | 7 (63.6%) |
| 5 to 9 Year Old | 190 (93.1%) | 14 (6.9%) |
| 10 to 14 Year Olds | 238 (97.5%) | 6 (2.5%) |
| 15 to 17 Year Olds | 171 (94.5%) | 10 (5.5%) |
| 18 to 19 Year Olds | 57 (86.4%) | 9 (13.6%) |
| 20 to 24 Year Olds | 69 (71.9%) | 27 (28.1%) |
| 25 to 34 Year Olds | 11 (18.3%) | 49 (81.7%) |
| 35 Years and over | 48 (57.8%) | 35 (42.2%) |
| Total | 788 (83.4%) | 157 (16.6%) |
Educational Attainment by Field of Study in Vandalia
Business (135 | 27.0%), education (86 | 17.2%), liberal arts & history (61 | 12.2%), communications (39 | 7.8%), and arts & humanities (39 | 7.8%) are the most common fields of study among 501 individuals in Vandalia who have obtained a bachelor's degree or higher.
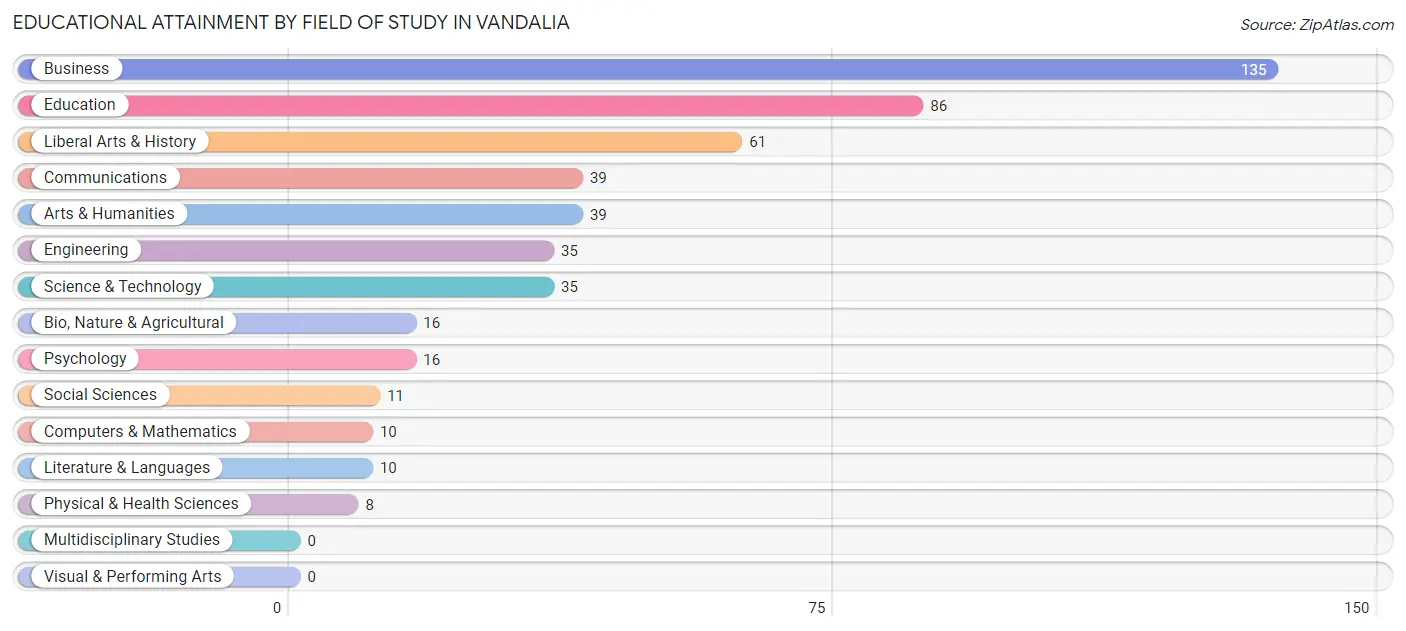
| Field of Study | # Graduates | % Graduates |
| Computers & Mathematics | 10 | 2.0% |
| Bio, Nature & Agricultural | 16 | 3.2% |
| Physical & Health Sciences | 8 | 1.6% |
| Psychology | 16 | 3.2% |
| Social Sciences | 11 | 2.2% |
| Engineering | 35 | 7.0% |
| Multidisciplinary Studies | 0 | 0.0% |
| Science & Technology | 35 | 7.0% |
| Business | 135 | 27.0% |
| Education | 86 | 17.2% |
| Literature & Languages | 10 | 2.0% |
| Liberal Arts & History | 61 | 12.2% |
| Visual & Performing Arts | 0 | 0.0% |
| Communications | 39 | 7.8% |
| Arts & Humanities | 39 | 7.8% |
| Total | 501 | 100.0% |
Transportation & Commute in Vandalia
Vehicle Availability by Sex in Vandalia
The most prevalent vehicle ownership categories in Vandalia are males with 2 vehicles (523, accounting for 44.2%) and females with 2 vehicles (322, making up 49.0%).
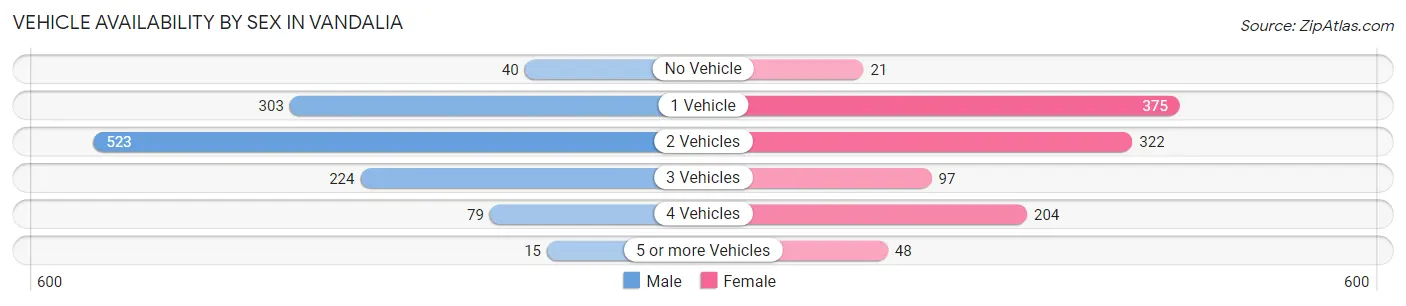
| Vehicles Available | Male | Female |
| No Vehicle | 40 (3.4%) | 21 (2.0%) |
| 1 Vehicle | 303 (25.6%) | 375 (35.1%) |
| 2 Vehicles | 523 (44.2%) | 322 (30.2%) |
| 3 Vehicles | 224 (18.9%) | 97 (9.1%) |
| 4 Vehicles | 79 (6.7%) | 204 (19.1%) |
| 5 or more Vehicles | 15 (1.3%) | 48 (4.5%) |
| Total | 1,184 (100.0%) | 1,067 (100.0%) |
Commute Time in Vandalia
The most frequently occuring commute durations in Vandalia are 5 to 9 minutes (437 commuters, 19.9%), 20 to 24 minutes (322 commuters, 14.7%), and less than 5 minutes (290 commuters, 13.2%).
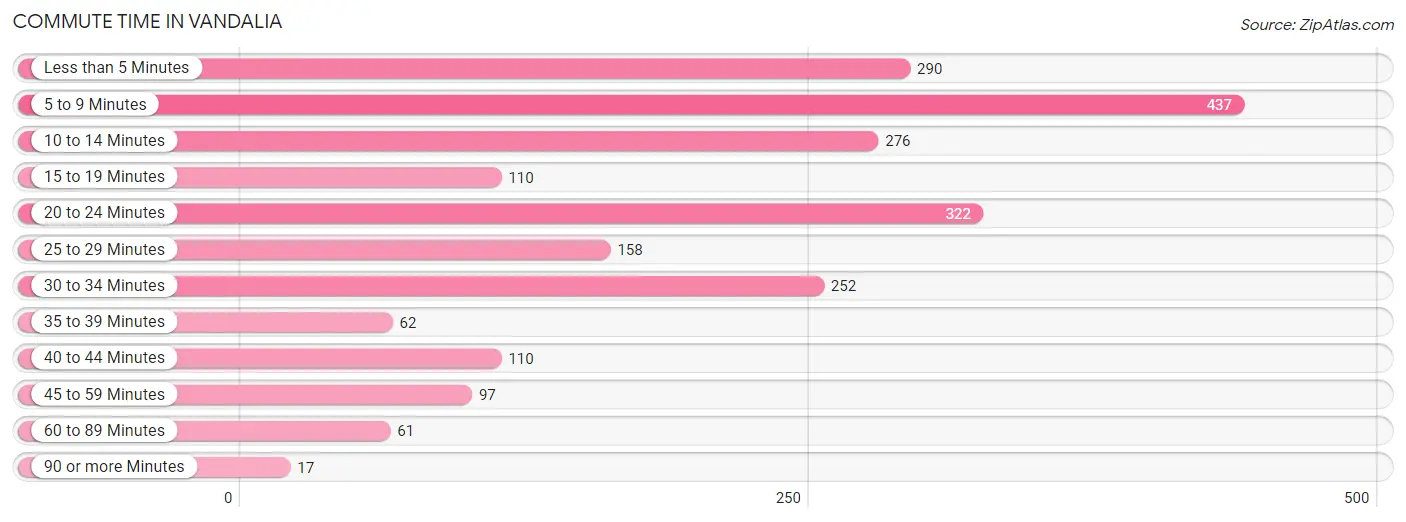
| Commute Time | # Commuters | % Commuters |
| Less than 5 Minutes | 290 | 13.2% |
| 5 to 9 Minutes | 437 | 19.9% |
| 10 to 14 Minutes | 276 | 12.6% |
| 15 to 19 Minutes | 110 | 5.0% |
| 20 to 24 Minutes | 322 | 14.7% |
| 25 to 29 Minutes | 158 | 7.2% |
| 30 to 34 Minutes | 252 | 11.5% |
| 35 to 39 Minutes | 62 | 2.8% |
| 40 to 44 Minutes | 110 | 5.0% |
| 45 to 59 Minutes | 97 | 4.4% |
| 60 to 89 Minutes | 61 | 2.8% |
| 90 or more Minutes | 17 | 0.8% |
Commute Time by Sex in Vandalia
The most common commute times in Vandalia are 5 to 9 minutes (278 commuters, 24.5%) for males and 20 to 24 minutes (218 commuters, 20.6%) for females.
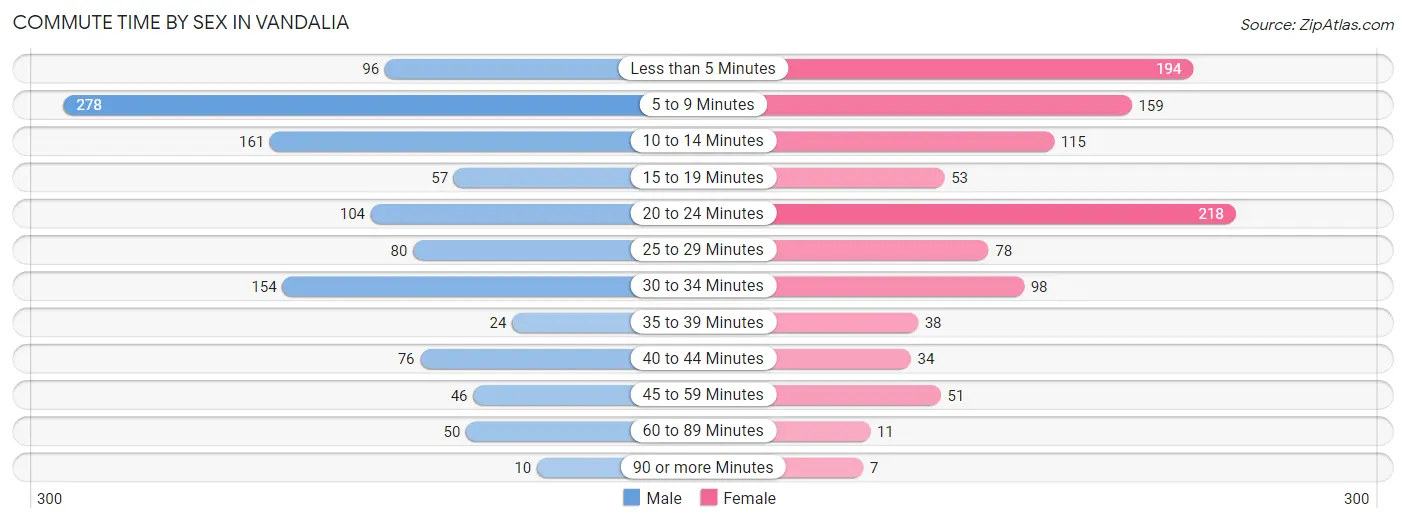
| Commute Time | Male | Female |
| Less than 5 Minutes | 96 (8.5%) | 194 (18.4%) |
| 5 to 9 Minutes | 278 (24.5%) | 159 (15.1%) |
| 10 to 14 Minutes | 161 (14.2%) | 115 (10.9%) |
| 15 to 19 Minutes | 57 (5.0%) | 53 (5.0%) |
| 20 to 24 Minutes | 104 (9.1%) | 218 (20.6%) |
| 25 to 29 Minutes | 80 (7.0%) | 78 (7.4%) |
| 30 to 34 Minutes | 154 (13.6%) | 98 (9.3%) |
| 35 to 39 Minutes | 24 (2.1%) | 38 (3.6%) |
| 40 to 44 Minutes | 76 (6.7%) | 34 (3.2%) |
| 45 to 59 Minutes | 46 (4.1%) | 51 (4.8%) |
| 60 to 89 Minutes | 50 (4.4%) | 11 (1.0%) |
| 90 or more Minutes | 10 (0.9%) | 7 (0.7%) |
Time of Departure to Work by Sex in Vandalia
The most frequent times of departure to work in Vandalia are 7:30 AM to 7:59 AM (235, 20.7%) for males and 7:30 AM to 7:59 AM (248, 23.5%) for females.
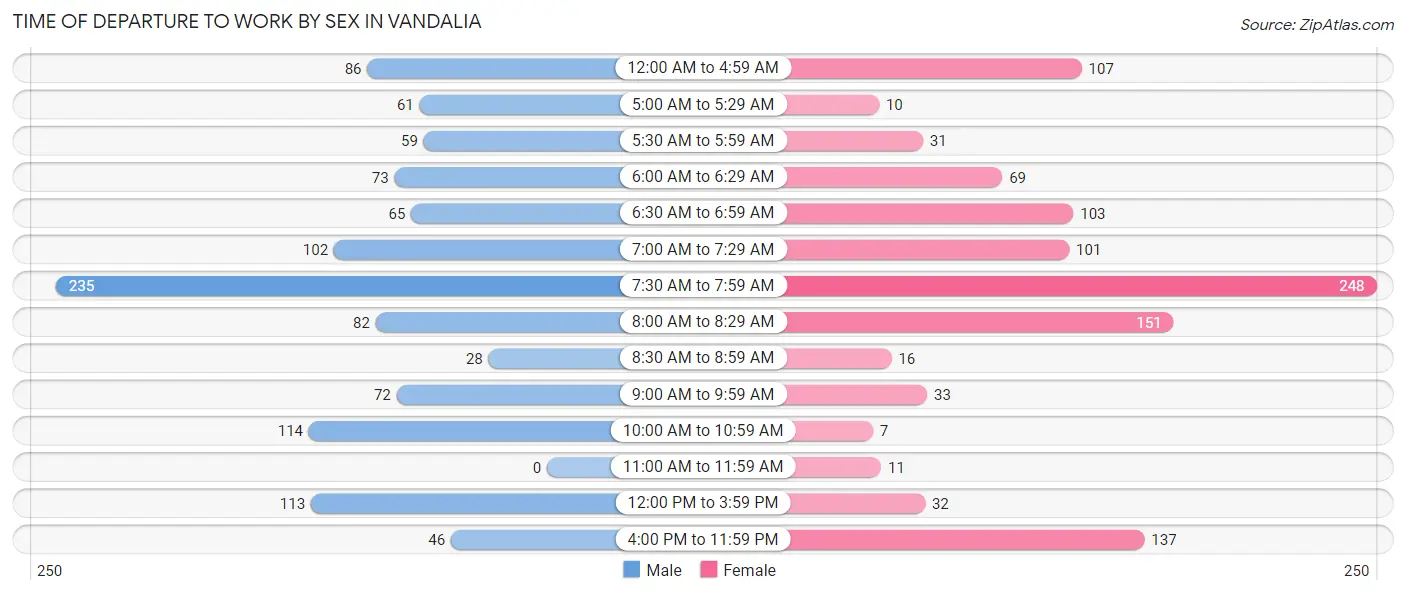
| Time of Departure | Male | Female |
| 12:00 AM to 4:59 AM | 86 (7.6%) | 107 (10.1%) |
| 5:00 AM to 5:29 AM | 61 (5.4%) | 10 (0.9%) |
| 5:30 AM to 5:59 AM | 59 (5.2%) | 31 (2.9%) |
| 6:00 AM to 6:29 AM | 73 (6.4%) | 69 (6.5%) |
| 6:30 AM to 6:59 AM | 65 (5.7%) | 103 (9.8%) |
| 7:00 AM to 7:29 AM | 102 (9.0%) | 101 (9.6%) |
| 7:30 AM to 7:59 AM | 235 (20.7%) | 248 (23.5%) |
| 8:00 AM to 8:29 AM | 82 (7.2%) | 151 (14.3%) |
| 8:30 AM to 8:59 AM | 28 (2.5%) | 16 (1.5%) |
| 9:00 AM to 9:59 AM | 72 (6.3%) | 33 (3.1%) |
| 10:00 AM to 10:59 AM | 114 (10.0%) | 7 (0.7%) |
| 11:00 AM to 11:59 AM | 0 (0.0%) | 11 (1.0%) |
| 12:00 PM to 3:59 PM | 113 (10.0%) | 32 (3.0%) |
| 4:00 PM to 11:59 PM | 46 (4.1%) | 137 (13.0%) |
| Total | 1,136 (100.0%) | 1,056 (100.0%) |
Housing Occupancy in Vandalia
Occupancy by Ownership in Vandalia
Of the total 2,059 dwellings in Vandalia, owner-occupied units account for 1,231 (59.8%), while renter-occupied units make up 828 (40.2%).
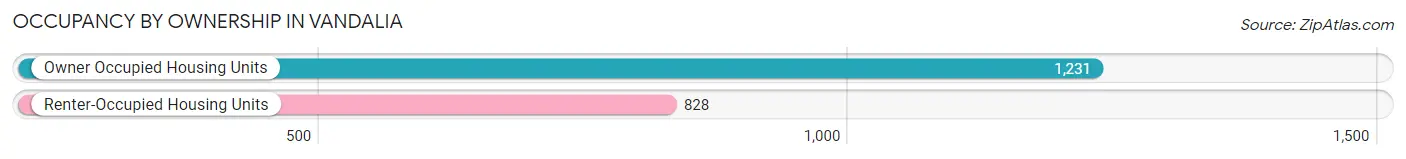
| Occupancy | # Housing Units | % Housing Units |
| Owner Occupied Housing Units | 1,231 | 59.8% |
| Renter-Occupied Housing Units | 828 | 40.2% |
| Total Occupied Housing Units | 2,059 | 100.0% |
Occupancy by Household Size in Vandalia
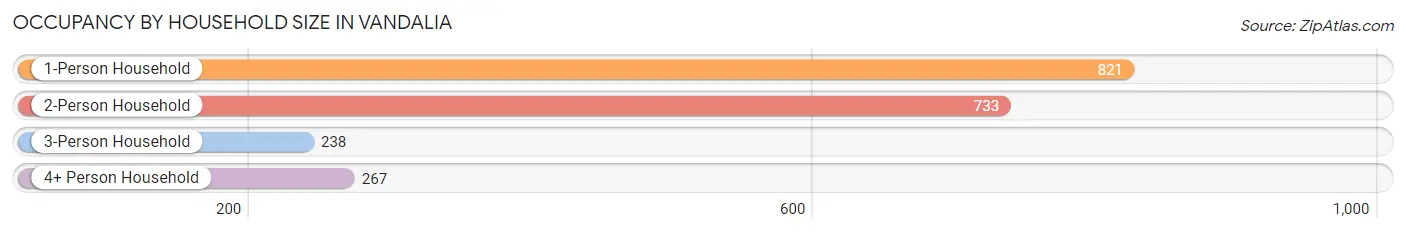
| Household Size | # Housing Units | % Housing Units |
| 1-Person Household | 821 | 39.9% |
| 2-Person Household | 733 | 35.6% |
| 3-Person Household | 238 | 11.6% |
| 4+ Person Household | 267 | 13.0% |
| Total Housing Units | 2,059 | 100.0% |
Occupancy by Ownership by Household Size in Vandalia
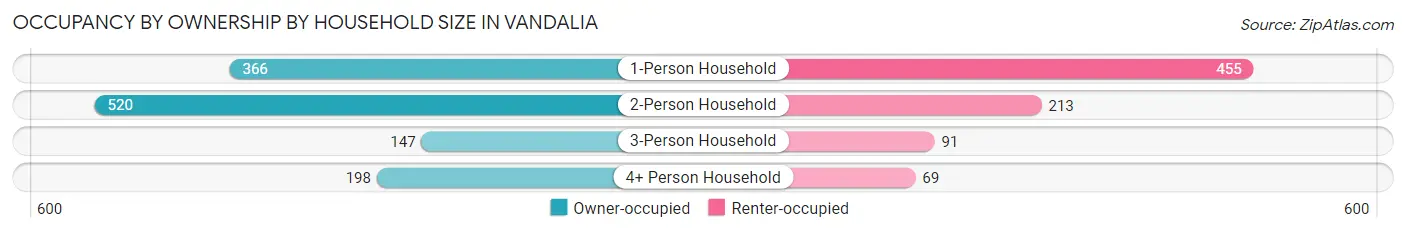
| Household Size | Owner-occupied | Renter-occupied |
| 1-Person Household | 366 (44.6%) | 455 (55.4%) |
| 2-Person Household | 520 (70.9%) | 213 (29.1%) |
| 3-Person Household | 147 (61.8%) | 91 (38.2%) |
| 4+ Person Household | 198 (74.2%) | 69 (25.8%) |
| Total Housing Units | 1,231 (59.8%) | 828 (40.2%) |
Occupancy by Educational Attainment in Vandalia
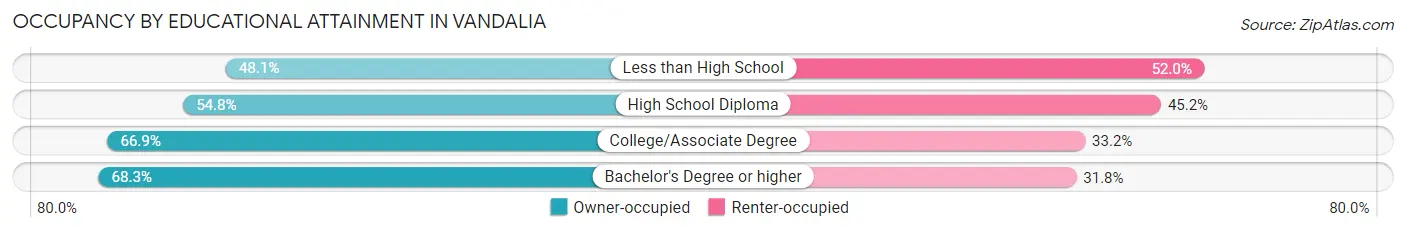
| Household Size | Owner-occupied | Renter-occupied |
| Less than High School | 123 (48.0%) | 133 (51.9%) |
| High School Diploma | 460 (54.8%) | 379 (45.2%) |
| College/Associate Degree | 476 (66.8%) | 236 (33.2%) |
| Bachelor's Degree or higher | 172 (68.2%) | 80 (31.8%) |
Occupancy by Age of Householder in Vandalia
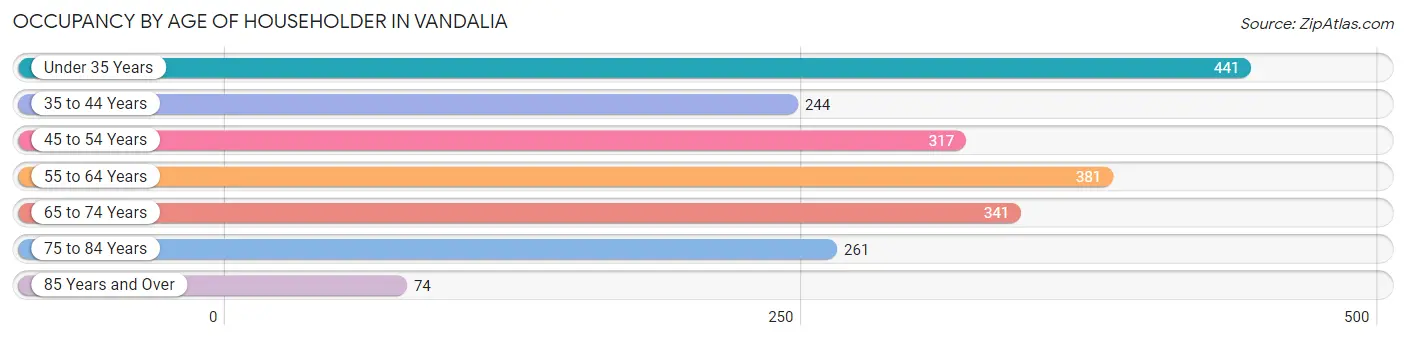
| Age Bracket | # Households | % Households |
| Under 35 Years | 441 | 21.4% |
| 35 to 44 Years | 244 | 11.8% |
| 45 to 54 Years | 317 | 15.4% |
| 55 to 64 Years | 381 | 18.5% |
| 65 to 74 Years | 341 | 16.6% |
| 75 to 84 Years | 261 | 12.7% |
| 85 Years and Over | 74 | 3.6% |
| Total | 2,059 | 100.0% |
Housing Finances in Vandalia
Median Income by Occupancy in Vandalia
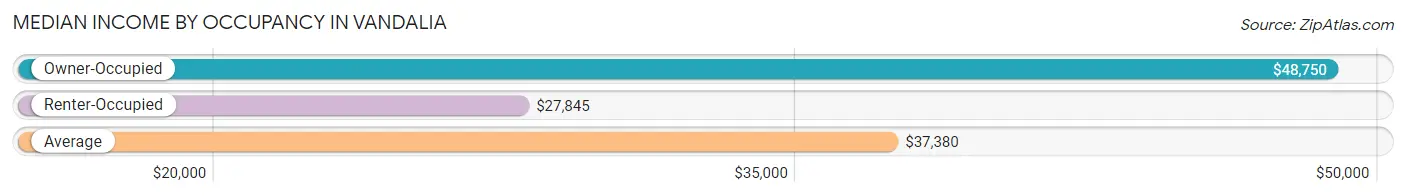
| Occupancy Type | # Households | Median Income |
| Owner-Occupied | 1,231 (59.8%) | $48,750 |
| Renter-Occupied | 828 (40.2%) | $27,845 |
| Average | 2,059 (100.0%) | $37,380 |
Occupancy by Householder Income Bracket in Vandalia
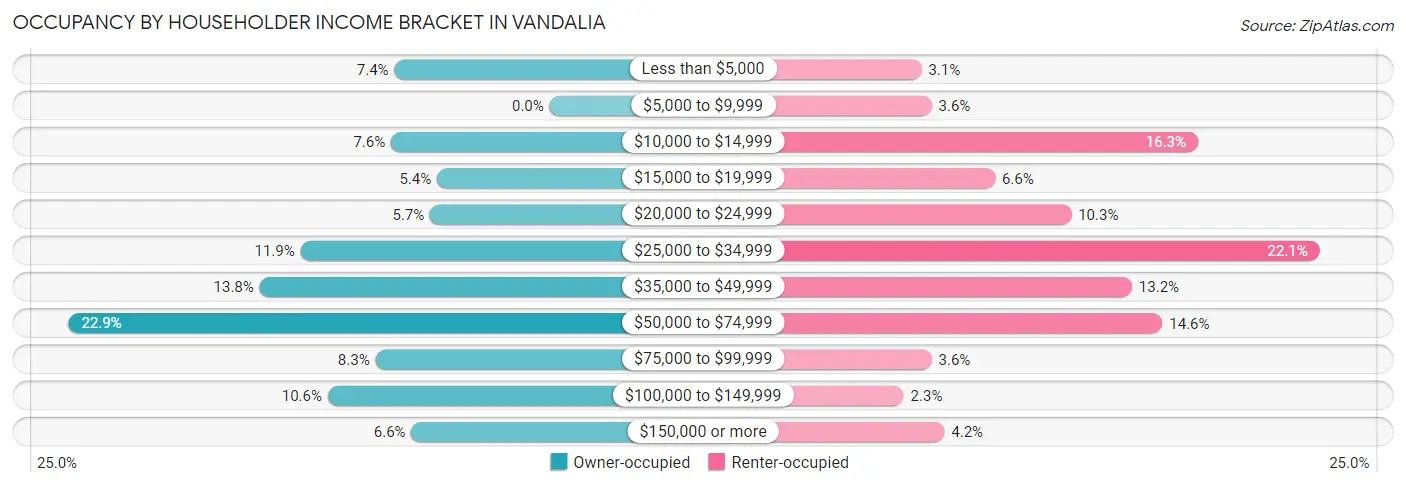
| Income Bracket | Owner-occupied | Renter-occupied |
| Less than $5,000 | 91 (7.4%) | 26 (3.1%) |
| $5,000 to $9,999 | 0 (0.0%) | 30 (3.6%) |
| $10,000 to $14,999 | 93 (7.5%) | 135 (16.3%) |
| $15,000 to $19,999 | 66 (5.4%) | 55 (6.6%) |
| $20,000 to $24,999 | 70 (5.7%) | 85 (10.3%) |
| $25,000 to $34,999 | 146 (11.9%) | 183 (22.1%) |
| $35,000 to $49,999 | 170 (13.8%) | 109 (13.2%) |
| $50,000 to $74,999 | 282 (22.9%) | 121 (14.6%) |
| $75,000 to $99,999 | 102 (8.3%) | 30 (3.6%) |
| $100,000 to $149,999 | 130 (10.6%) | 19 (2.3%) |
| $150,000 or more | 81 (6.6%) | 35 (4.2%) |
| Total | 1,231 (100.0%) | 828 (100.0%) |
Monthly Housing Cost Tiers in Vandalia
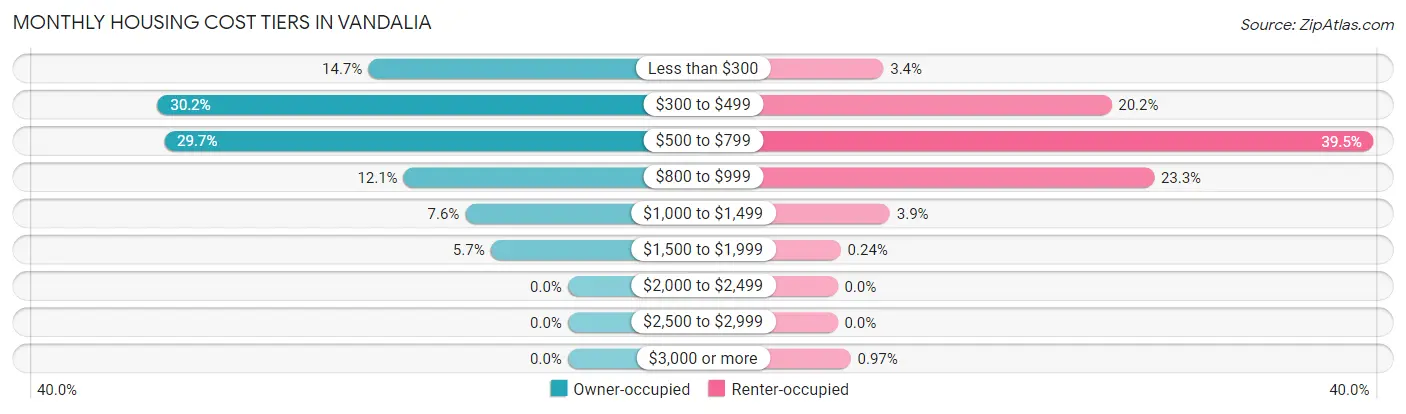
| Monthly Cost | Owner-occupied | Renter-occupied |
| Less than $300 | 181 (14.7%) | 28 (3.4%) |
| $300 to $499 | 372 (30.2%) | 167 (20.2%) |
| $500 to $799 | 366 (29.7%) | 327 (39.5%) |
| $800 to $999 | 149 (12.1%) | 193 (23.3%) |
| $1,000 to $1,499 | 93 (7.5%) | 32 (3.9%) |
| $1,500 to $1,999 | 70 (5.7%) | 2 (0.2%) |
| $2,000 to $2,499 | 0 (0.0%) | 0 (0.0%) |
| $2,500 to $2,999 | 0 (0.0%) | 0 (0.0%) |
| $3,000 or more | 0 (0.0%) | 8 (1.0%) |
| Total | 1,231 (100.0%) | 828 (100.0%) |
Physical Housing Characteristics in Vandalia
Housing Structures in Vandalia
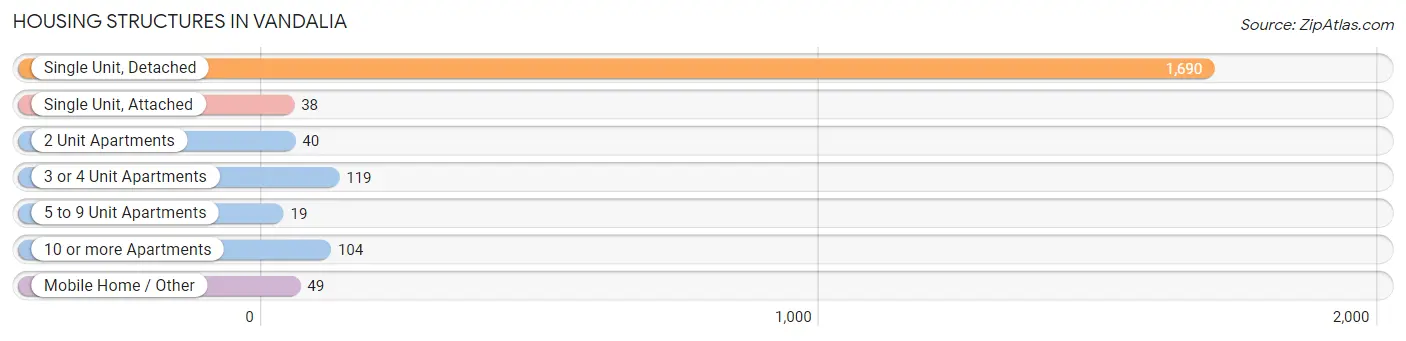
| Structure Type | # Housing Units | % Housing Units |
| Single Unit, Detached | 1,690 | 82.1% |
| Single Unit, Attached | 38 | 1.8% |
| 2 Unit Apartments | 40 | 1.9% |
| 3 or 4 Unit Apartments | 119 | 5.8% |
| 5 to 9 Unit Apartments | 19 | 0.9% |
| 10 or more Apartments | 104 | 5.1% |
| Mobile Home / Other | 49 | 2.4% |
| Total | 2,059 | 100.0% |
Housing Structures by Occupancy in Vandalia
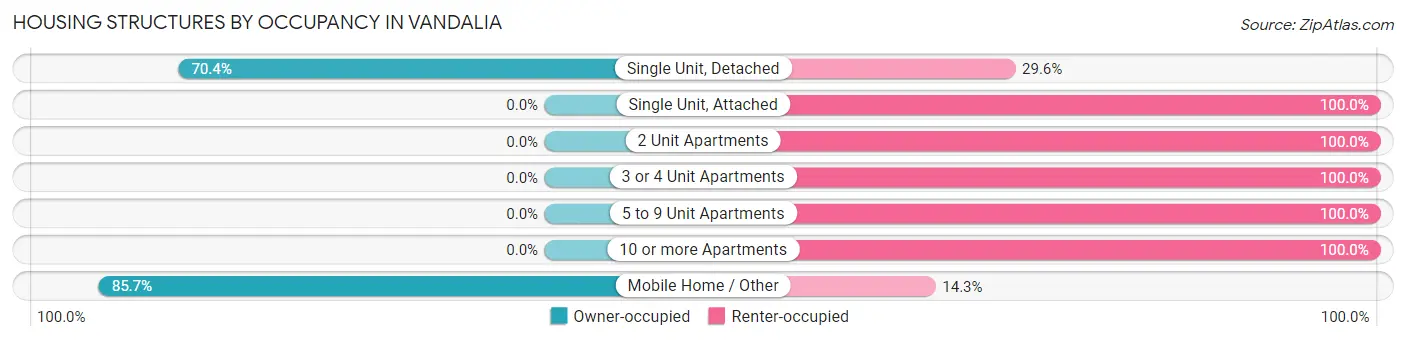
| Structure Type | Owner-occupied | Renter-occupied |
| Single Unit, Detached | 1,189 (70.4%) | 501 (29.6%) |
| Single Unit, Attached | 0 (0.0%) | 38 (100.0%) |
| 2 Unit Apartments | 0 (0.0%) | 40 (100.0%) |
| 3 or 4 Unit Apartments | 0 (0.0%) | 119 (100.0%) |
| 5 to 9 Unit Apartments | 0 (0.0%) | 19 (100.0%) |
| 10 or more Apartments | 0 (0.0%) | 104 (100.0%) |
| Mobile Home / Other | 42 (85.7%) | 7 (14.3%) |
| Total | 1,231 (59.8%) | 828 (40.2%) |
Housing Structures by Number of Rooms in Vandalia
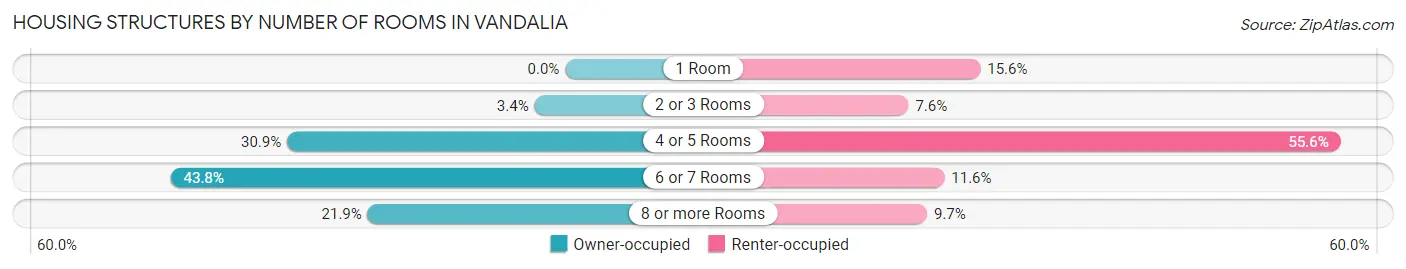
| Number of Rooms | Owner-occupied | Renter-occupied |
| 1 Room | 0 (0.0%) | 129 (15.6%) |
| 2 or 3 Rooms | 42 (3.4%) | 63 (7.6%) |
| 4 or 5 Rooms | 380 (30.9%) | 460 (55.6%) |
| 6 or 7 Rooms | 539 (43.8%) | 96 (11.6%) |
| 8 or more Rooms | 270 (21.9%) | 80 (9.7%) |
| Total | 1,231 (100.0%) | 828 (100.0%) |
Housing Structure by Heating Type in Vandalia
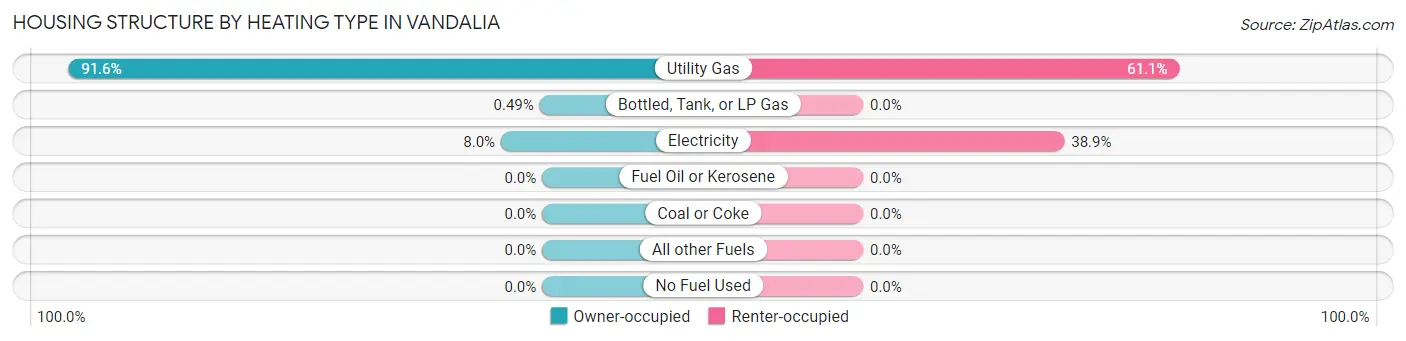
| Heating Type | Owner-occupied | Renter-occupied |
| Utility Gas | 1,127 (91.5%) | 506 (61.1%) |
| Bottled, Tank, or LP Gas | 6 (0.5%) | 0 (0.0%) |
| Electricity | 98 (8.0%) | 322 (38.9%) |
| Fuel Oil or Kerosene | 0 (0.0%) | 0 (0.0%) |
| Coal or Coke | 0 (0.0%) | 0 (0.0%) |
| All other Fuels | 0 (0.0%) | 0 (0.0%) |
| No Fuel Used | 0 (0.0%) | 0 (0.0%) |
| Total | 1,231 (100.0%) | 828 (100.0%) |
Household Vehicle Usage in Vandalia
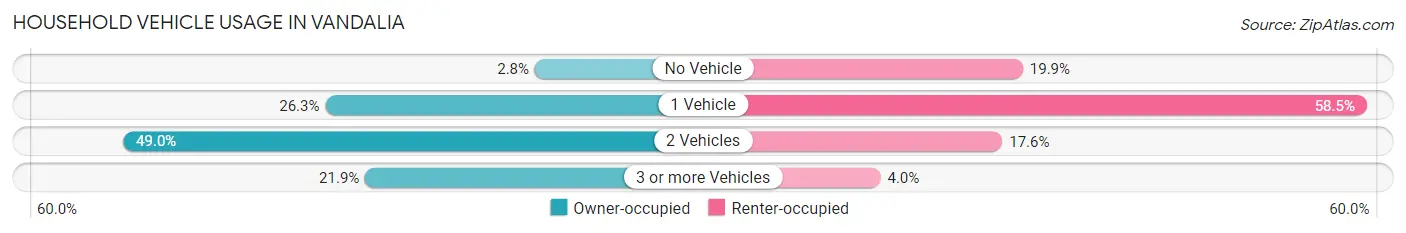
| Vehicles per Household | Owner-occupied | Renter-occupied |
| No Vehicle | 35 (2.8%) | 165 (19.9%) |
| 1 Vehicle | 324 (26.3%) | 484 (58.5%) |
| 2 Vehicles | 603 (49.0%) | 146 (17.6%) |
| 3 or more Vehicles | 269 (21.8%) | 33 (4.0%) |
| Total | 1,231 (100.0%) | 828 (100.0%) |
Real Estate & Mortgages in Vandalia
Real Estate and Mortgage Overview in Vandalia
| Characteristic | Without Mortgage | With Mortgage |
| Housing Units | 703 | 528 |
| Median Property Value | $80,200 | $88,600 |
| Median Household Income | $32,902 | $64 |
| Monthly Housing Costs | $381 | $0 |
| Real Estate Taxes | $1,274 | $15 |
Property Value by Mortgage Status in Vandalia
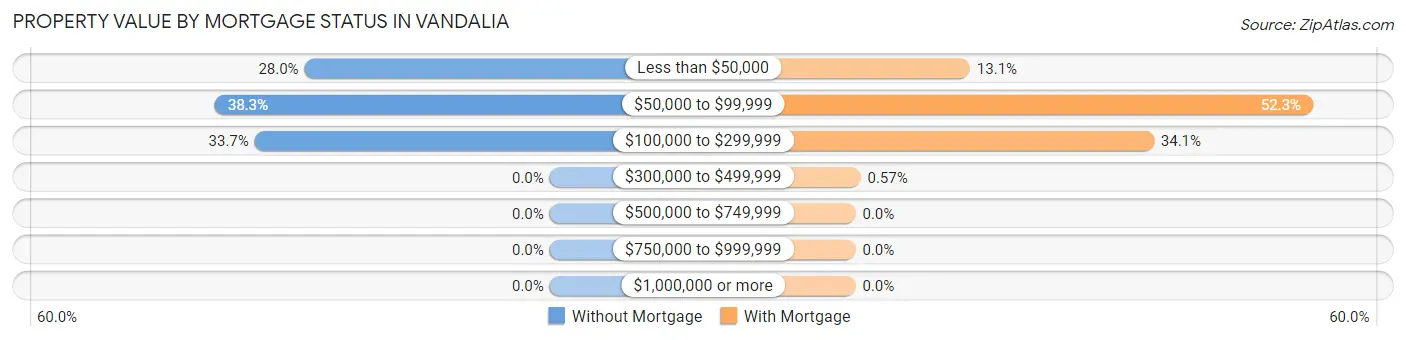
| Property Value | Without Mortgage | With Mortgage |
| Less than $50,000 | 197 (28.0%) | 69 (13.1%) |
| $50,000 to $99,999 | 269 (38.3%) | 276 (52.3%) |
| $100,000 to $299,999 | 237 (33.7%) | 180 (34.1%) |
| $300,000 to $499,999 | 0 (0.0%) | 3 (0.6%) |
| $500,000 to $749,999 | 0 (0.0%) | 0 (0.0%) |
| $750,000 to $999,999 | 0 (0.0%) | 0 (0.0%) |
| $1,000,000 or more | 0 (0.0%) | 0 (0.0%) |
| Total | 703 (100.0%) | 528 (100.0%) |
Household Income by Mortgage Status in Vandalia
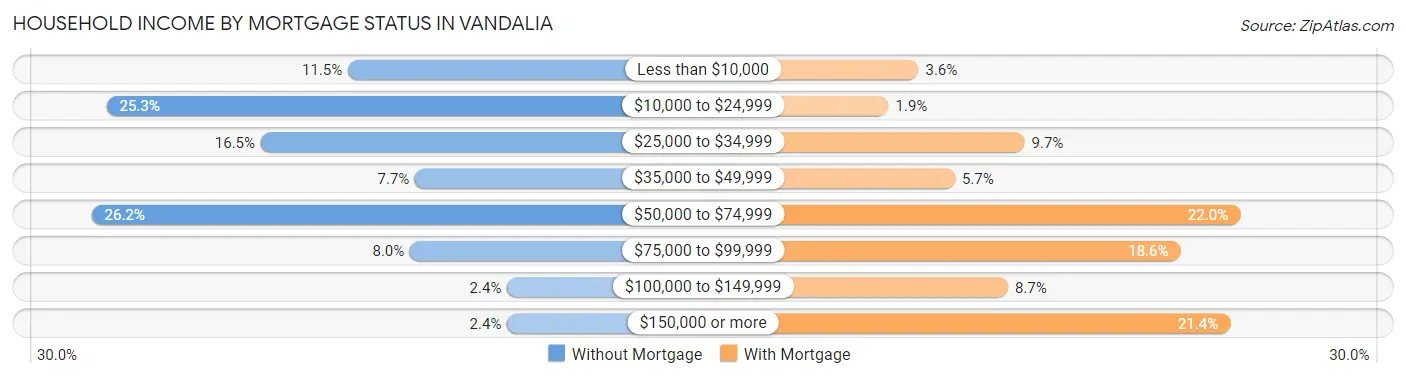
| Household Income | Without Mortgage | With Mortgage |
| Less than $10,000 | 81 (11.5%) | 19 (3.6%) |
| $10,000 to $24,999 | 178 (25.3%) | 10 (1.9%) |
| $25,000 to $34,999 | 116 (16.5%) | 51 (9.7%) |
| $35,000 to $49,999 | 54 (7.7%) | 30 (5.7%) |
| $50,000 to $74,999 | 184 (26.2%) | 116 (22.0%) |
| $75,000 to $99,999 | 56 (8.0%) | 98 (18.6%) |
| $100,000 to $149,999 | 17 (2.4%) | 46 (8.7%) |
| $150,000 or more | 17 (2.4%) | 113 (21.4%) |
| Total | 703 (100.0%) | 528 (100.0%) |
Property Value to Household Income Ratio in Vandalia
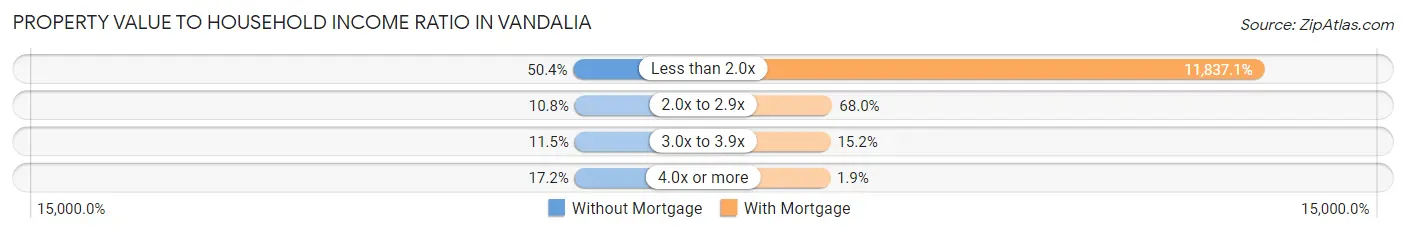
| Value-to-Income Ratio | Without Mortgage | With Mortgage |
| Less than 2.0x | 354 (50.4%) | 62,500 (11,837.1%) |
| 2.0x to 2.9x | 76 (10.8%) | 359 (68.0%) |
| 3.0x to 3.9x | 81 (11.5%) | 80 (15.1%) |
| 4.0x or more | 121 (17.2%) | 10 (1.9%) |
| Total | 703 (100.0%) | 528 (100.0%) |
Real Estate Taxes by Mortgage Status in Vandalia
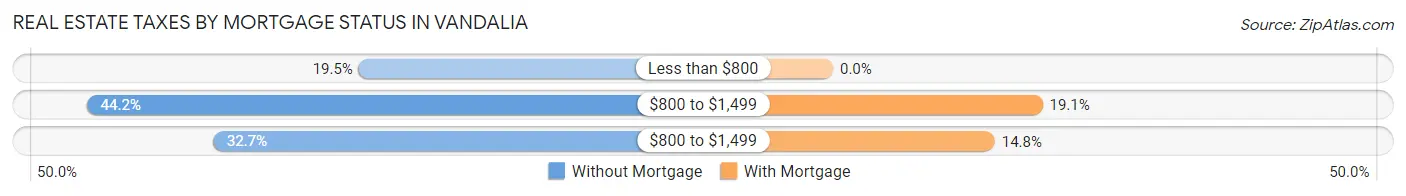
| Property Taxes | Without Mortgage | With Mortgage |
| Less than $800 | 137 (19.5%) | 0 (0.0%) |
| $800 to $1,499 | 311 (44.2%) | 101 (19.1%) |
| $800 to $1,499 | 230 (32.7%) | 78 (14.8%) |
| Total | 703 (100.0%) | 528 (100.0%) |
Health & Disability in Vandalia
Health Insurance Coverage by Age in Vandalia
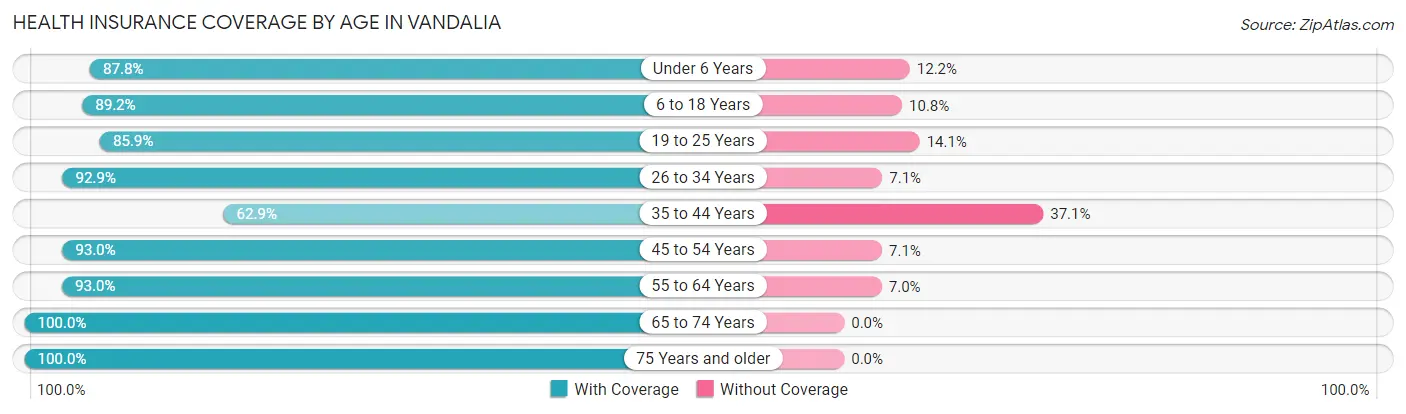
| Age Bracket | With Coverage | Without Coverage |
| Under 6 Years | 244 (87.8%) | 34 (12.2%) |
| 6 to 18 Years | 720 (89.2%) | 87 (10.8%) |
| 19 to 25 Years | 379 (85.9%) | 62 (14.1%) |
| 26 to 34 Years | 550 (92.9%) | 42 (7.1%) |
| 35 to 44 Years | 339 (62.9%) | 200 (37.1%) |
| 45 to 54 Years | 659 (92.9%) | 50 (7.0%) |
| 55 to 64 Years | 598 (93.0%) | 45 (7.0%) |
| 65 to 74 Years | 549 (100.0%) | 0 (0.0%) |
| 75 Years and older | 439 (100.0%) | 0 (0.0%) |
| Total | 4,477 (89.6%) | 520 (10.4%) |
Health Insurance Coverage by Citizenship Status in Vandalia
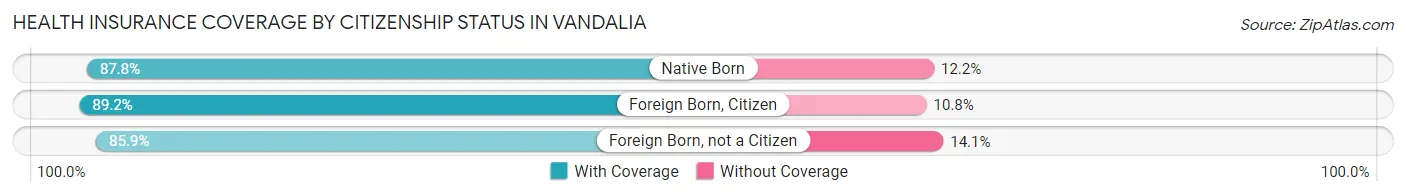
| Citizenship Status | With Coverage | Without Coverage |
| Native Born | 244 (87.8%) | 34 (12.2%) |
| Foreign Born, Citizen | 720 (89.2%) | 87 (10.8%) |
| Foreign Born, not a Citizen | 379 (85.9%) | 62 (14.1%) |
Health Insurance Coverage by Household Income in Vandalia
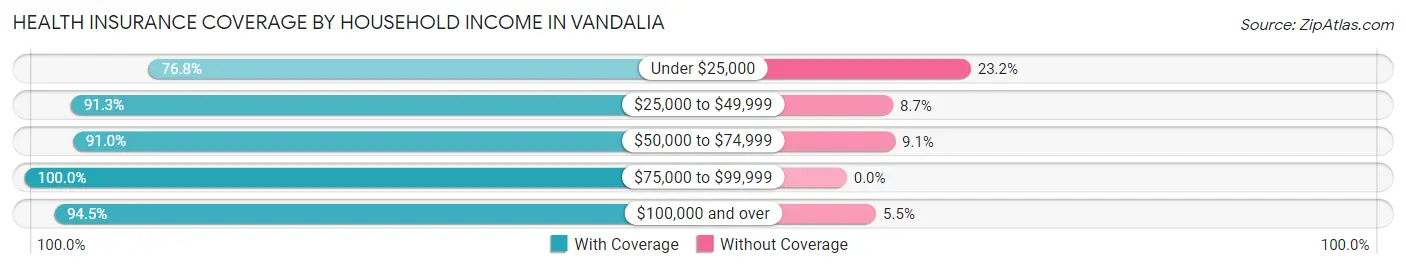
| Household Income | With Coverage | Without Coverage |
| Under $25,000 | 780 (76.8%) | 236 (23.2%) |
| $25,000 to $49,999 | 1,495 (91.3%) | 142 (8.7%) |
| $50,000 to $74,999 | 894 (90.9%) | 89 (9.0%) |
| $75,000 to $99,999 | 340 (100.0%) | 0 (0.0%) |
| $100,000 and over | 910 (94.5%) | 53 (5.5%) |
Public vs Private Health Insurance Coverage by Age in Vandalia
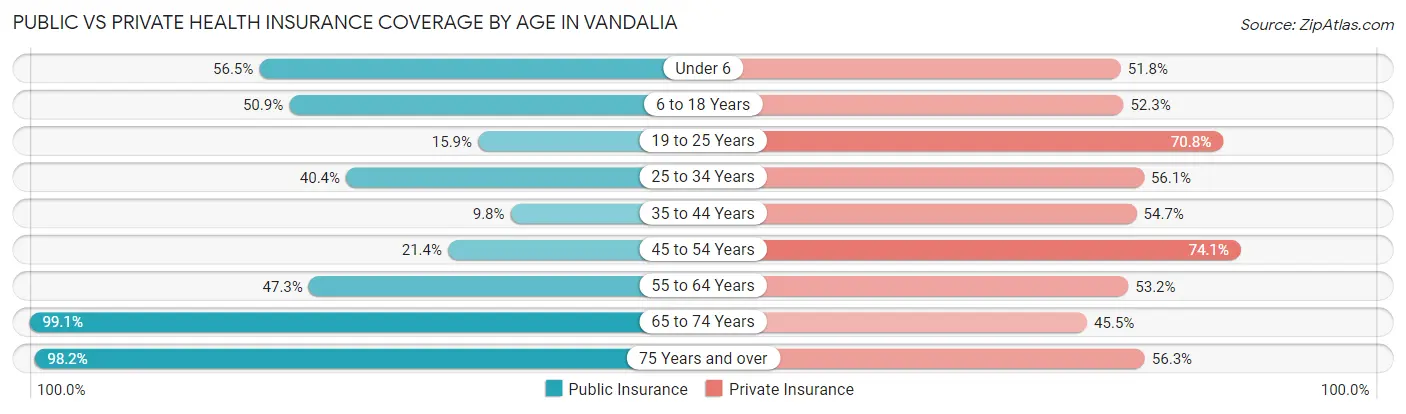
| Age Bracket | Public Insurance | Private Insurance |
| Under 6 | 157 (56.5%) | 144 (51.8%) |
| 6 to 18 Years | 411 (50.9%) | 422 (52.3%) |
| 19 to 25 Years | 70 (15.9%) | 312 (70.8%) |
| 25 to 34 Years | 239 (40.4%) | 332 (56.1%) |
| 35 to 44 Years | 53 (9.8%) | 295 (54.7%) |
| 45 to 54 Years | 152 (21.4%) | 525 (74.1%) |
| 55 to 64 Years | 304 (47.3%) | 342 (53.2%) |
| 65 to 74 Years | 544 (99.1%) | 250 (45.5%) |
| 75 Years and over | 431 (98.2%) | 247 (56.3%) |
| Total | 2,361 (47.2%) | 2,869 (57.4%) |
Disability Status by Sex by Age in Vandalia
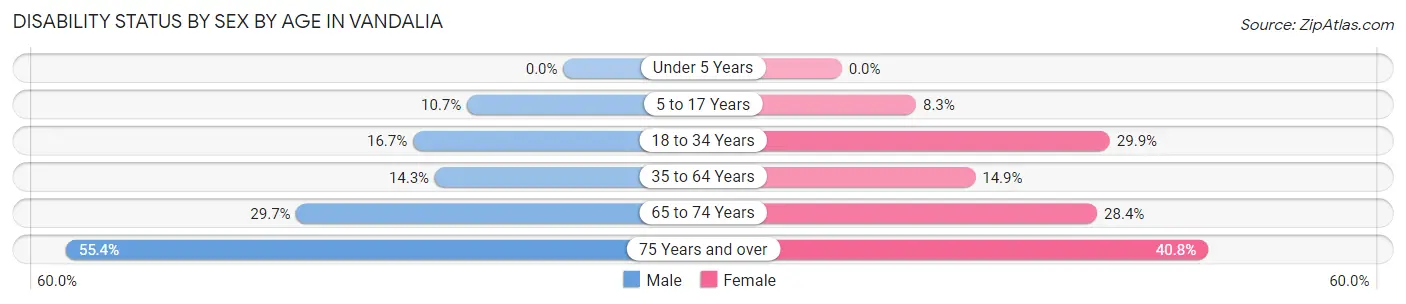
| Age Bracket | Male | Female |
| Under 5 Years | 0 (0.0%) | 0 (0.0%) |
| 5 to 17 Years | 40 (10.7%) | 22 (8.3%) |
| 18 to 34 Years | 111 (16.7%) | 172 (29.9%) |
| 35 to 64 Years | 131 (14.3%) | 145 (14.9%) |
| 65 to 74 Years | 66 (29.7%) | 93 (28.4%) |
| 75 Years and over | 87 (55.4%) | 115 (40.8%) |
Disability Class by Sex by Age in Vandalia
Disability Class: Hearing Difficulty
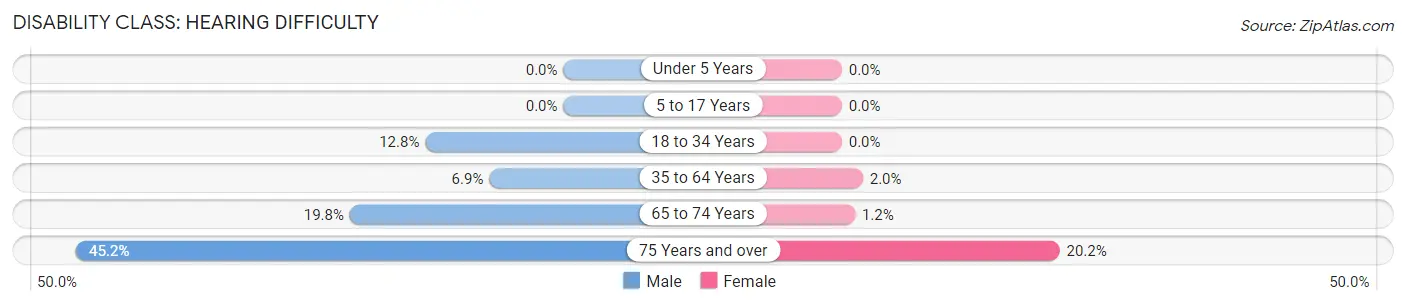
| Age Bracket | Male | Female |
| Under 5 Years | 0 (0.0%) | 0 (0.0%) |
| 5 to 17 Years | 0 (0.0%) | 0 (0.0%) |
| 18 to 34 Years | 85 (12.8%) | 0 (0.0%) |
| 35 to 64 Years | 63 (6.9%) | 19 (1.9%) |
| 65 to 74 Years | 44 (19.8%) | 4 (1.2%) |
| 75 Years and over | 71 (45.2%) | 57 (20.2%) |
Disability Class: Vision Difficulty
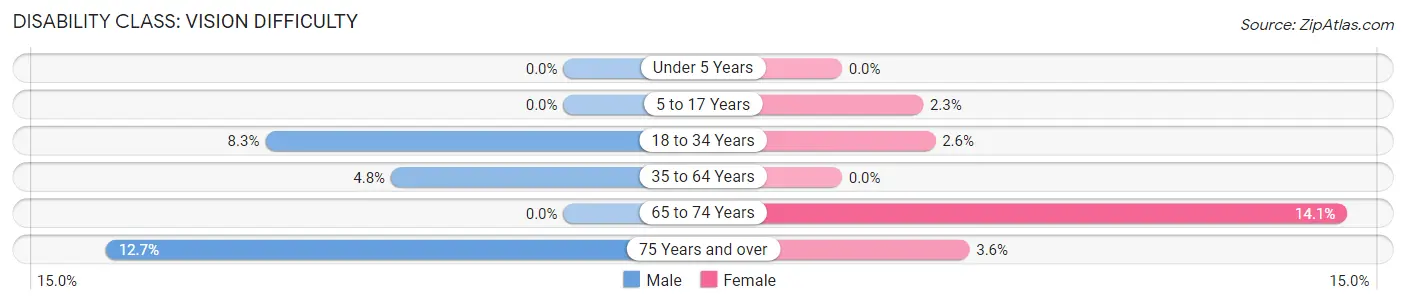
| Age Bracket | Male | Female |
| Under 5 Years | 0 (0.0%) | 0 (0.0%) |
| 5 to 17 Years | 0 (0.0%) | 6 (2.3%) |
| 18 to 34 Years | 55 (8.3%) | 15 (2.6%) |
| 35 to 64 Years | 44 (4.8%) | 0 (0.0%) |
| 65 to 74 Years | 0 (0.0%) | 46 (14.1%) |
| 75 Years and over | 20 (12.7%) | 10 (3.5%) |
Disability Class: Cognitive Difficulty
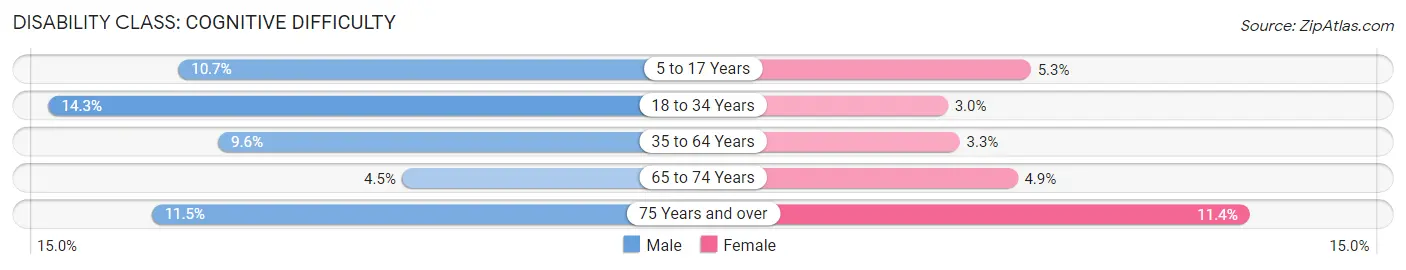
| Age Bracket | Male | Female |
| 5 to 17 Years | 40 (10.7%) | 14 (5.3%) |
| 18 to 34 Years | 95 (14.3%) | 17 (2.9%) |
| 35 to 64 Years | 88 (9.6%) | 32 (3.3%) |
| 65 to 74 Years | 10 (4.5%) | 16 (4.9%) |
| 75 Years and over | 18 (11.5%) | 32 (11.4%) |
Disability Class: Ambulatory Difficulty
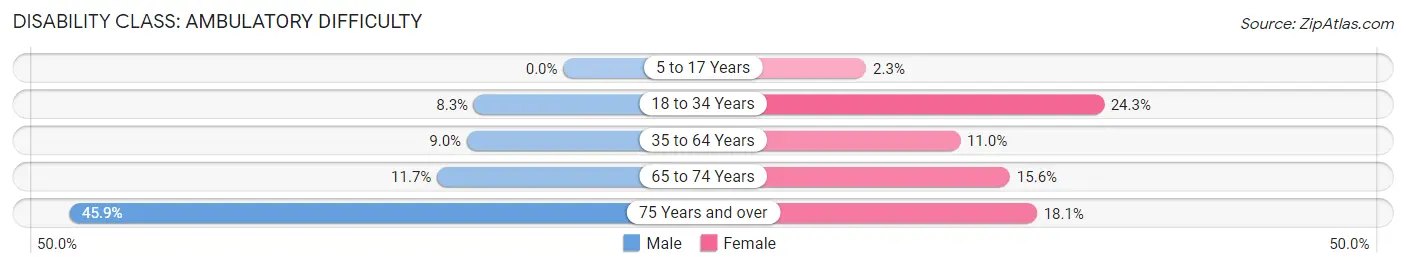
| Age Bracket | Male | Female |
| 5 to 17 Years | 0 (0.0%) | 6 (2.3%) |
| 18 to 34 Years | 55 (8.3%) | 140 (24.3%) |
| 35 to 64 Years | 82 (8.9%) | 107 (11.0%) |
| 65 to 74 Years | 26 (11.7%) | 51 (15.6%) |
| 75 Years and over | 72 (45.9%) | 51 (18.1%) |
Disability Class: Self-Care Difficulty
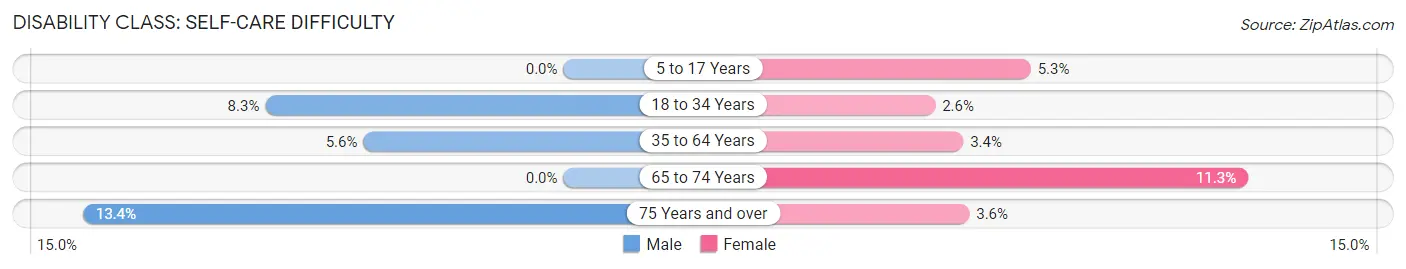
| Age Bracket | Male | Female |
| 5 to 17 Years | 0 (0.0%) | 14 (5.3%) |
| 18 to 34 Years | 55 (8.3%) | 15 (2.6%) |
| 35 to 64 Years | 51 (5.6%) | 33 (3.4%) |
| 65 to 74 Years | 0 (0.0%) | 37 (11.3%) |
| 75 Years and over | 21 (13.4%) | 10 (3.5%) |
Technology Access in Vandalia
Computing Device Access in Vandalia
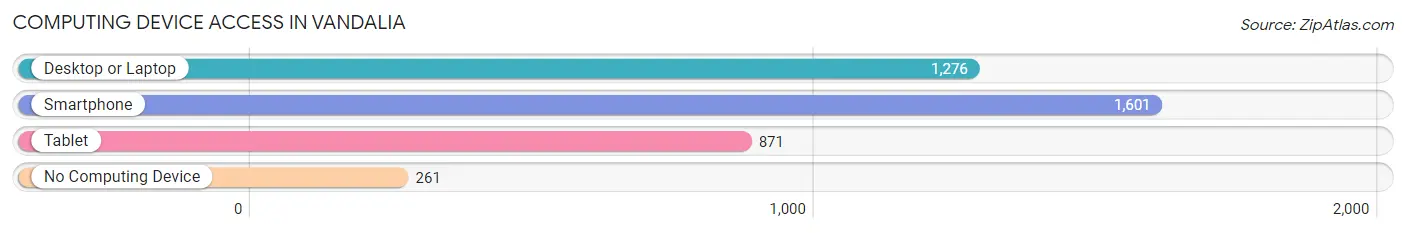
| Device Type | # Households | % Households |
| Desktop or Laptop | 1,276 | 62.0% |
| Smartphone | 1,601 | 77.8% |
| Tablet | 871 | 42.3% |
| No Computing Device | 261 | 12.7% |
| Total | 2,059 | 100.0% |
Internet Access in Vandalia
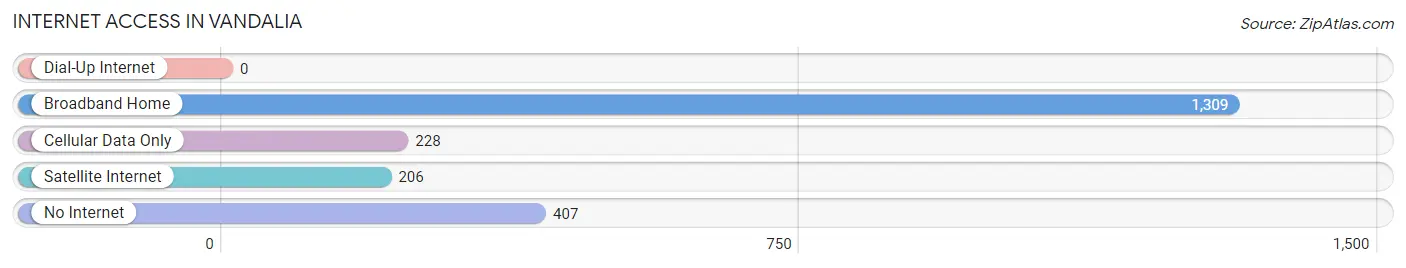
| Internet Type | # Households | % Households |
| Dial-Up Internet | 0 | 0.0% |
| Broadband Home | 1,309 | 63.6% |
| Cellular Data Only | 228 | 11.1% |
| Satellite Internet | 206 | 10.0% |
| No Internet | 407 | 19.8% |
| Total | 2,059 | 100.0% |
Vandalia Summary
Vandalia, Illinois is a small city located in Fayette County, Illinois. It is the county seat of Fayette County and is located about 60 miles east of St. Louis, Missouri. The city has a population of 6,945 people as of the 2010 census.
History
Vandalia was founded in 1819 by settlers from Kentucky and Tennessee. The city was named after the ancient city of Vandalia, which was the capital of the ancient Germanic tribe of the Vandals. The city was incorporated in 1837 and was the first state capital of Illinois from 1819 to 1839. During this time, the city was the site of the first Illinois State Fair in 1853.
In the late 19th century, Vandalia was a major railroad hub, with the Illinois Central Railroad and the Wabash Railroad both having major depots in the city. The city was also home to several manufacturing companies, including the Vandalia Carriage Company, which produced carriages and wagons.
Geography
Vandalia is located in the southeastern part of Fayette County, Illinois. It is situated along the Kaskaskia River, which flows through the city. The city is located about 60 miles east of St. Louis, Missouri and about 90 miles south of Chicago, Illinois.
The city has a total area of 4.2 square miles, all of which is land. The city has a humid continental climate, with hot, humid summers and cold, snowy winters.
Economy
Vandalia's economy is largely based on agriculture and manufacturing. The city is home to several manufacturing companies, including the Vandalia Carriage Company, which produces carriages and wagons. The city is also home to several agricultural businesses, including grain elevators, feed mills, and livestock farms.
The city is also home to several retail businesses, including grocery stores, restaurants, and clothing stores. The city is also home to several medical facilities, including a hospital and several clinics.
Demographics
As of the 2010 census, Vandalia had a population of 6,945 people. The racial makeup of the city was 95.3% White, 0.7% African American, 0.3% Native American, 0.3% Asian, 0.1% Pacific Islander, 1.7% from other races, and 1.4% from two or more races. Hispanic or Latino of any race were 3.2% of the population.
The median household income in Vandalia was $41,945, and the median family income was $50,945. The per capita income for the city was $20,945. About 11.3% of families and 14.2% of the population were below the poverty line, including 19.2% of those under age 18 and 8.2% of those age 65 or over.
Common Questions
What is Per Capita Income in Vandalia?
Per Capita income in Vandalia is $22,462.
What is the Median Family Income in Vandalia?
Median Family Income in Vandalia is $58,004.
What is the Median Household income in Vandalia?
Median Household Income in Vandalia is $37,380.
What is Income or Wage Gap in Vandalia?
Income or Wage Gap in Vandalia is 23.1%.
Women in Vandalia earn 76.9 cents for every dollar earned by a man.
What is Family Income Deficit in Vandalia?
Family Income Deficit in Vandalia is $14,381.
Families that are below poverty line in Vandalia earn $14,381 less on average than the poverty threshold level.
What is Inequality or Gini Index in Vandalia?
Inequality or Gini Index in Vandalia is 0.49.
What is the Total Population of Vandalia?
Total Population of Vandalia is 6,058.
What is the Total Male Population of Vandalia?
Total Male Population of Vandalia is 3,411.
What is the Total Female Population of Vandalia?
Total Female Population of Vandalia is 2,647.
What is the Ratio of Males per 100 Females in Vandalia?
There are 128.86 Males per 100 Females in Vandalia.
What is the Ratio of Females per 100 Males in Vandalia?
There are 77.60 Females per 100 Males in Vandalia.
What is the Median Population Age in Vandalia?
Median Population Age in Vandalia is 42.1 Years.
What is the Average Family Size in Vandalia
Average Family Size in Vandalia is 3.1 People.
What is the Average Household Size in Vandalia
Average Household Size in Vandalia is 2.4 People.
How Large is the Labor Force in Vandalia?
There are 2,364 People in the Labor Forcein in Vandalia.
What is the Percentage of People in the Labor Force in Vandalia?
44.8% of People are in the Labor Force in Vandalia.
What is the Unemployment Rate in Vandalia?
Unemployment Rate in Vandalia is 3.1%.