Valmeyer, IL Map & Demographics
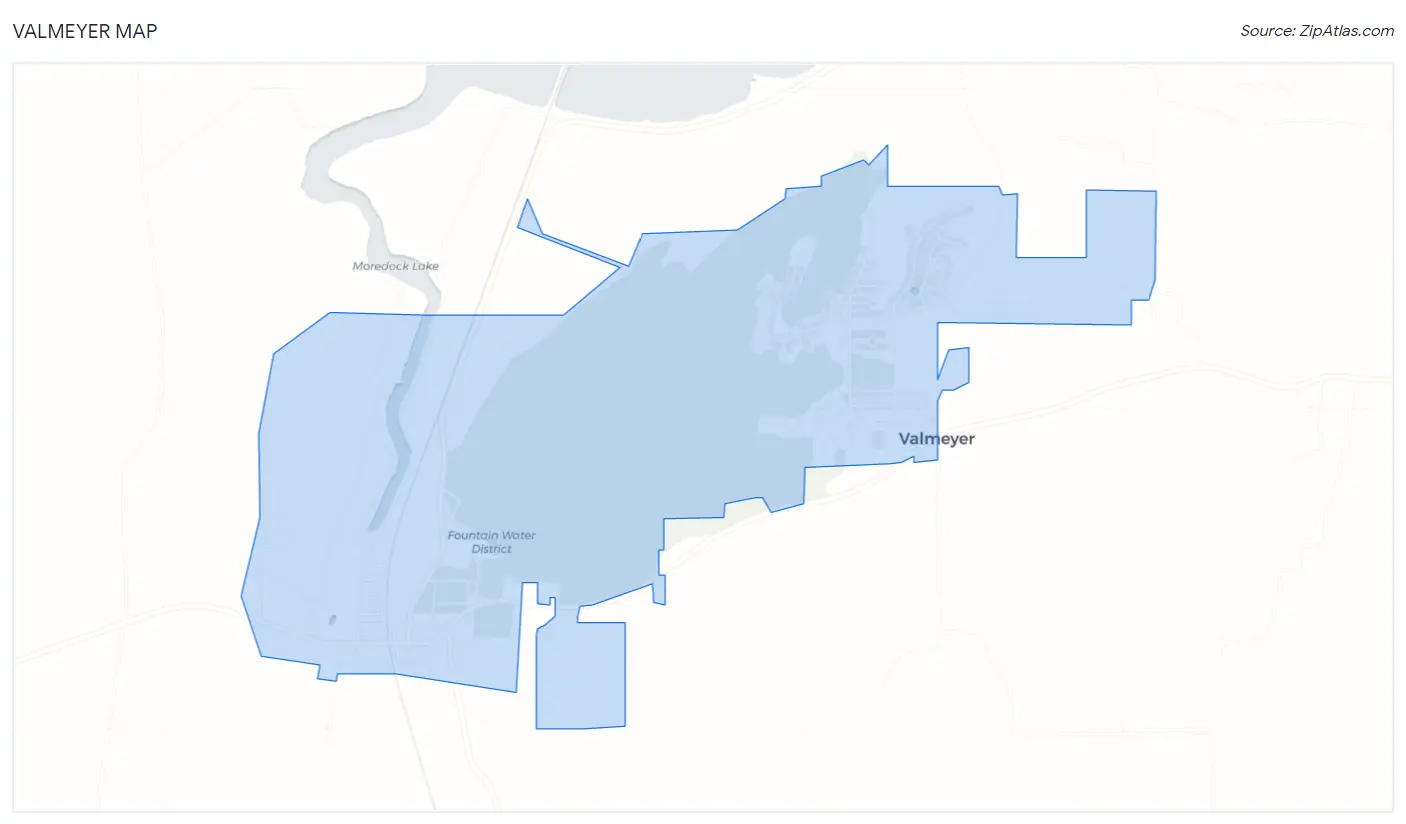
Valmeyer Map
Valmeyer Overview
$39,096
PER CAPITA INCOME
$109,063
AVG FAMILY INCOME
$95,625
AVG HOUSEHOLD INCOME
21.8%
WAGE / INCOME GAP [ % ]
78.2¢/ $1
WAGE / INCOME GAP [ $ ]
0.32
INEQUALITY / GINI INDEX
1,196
TOTAL POPULATION
587
MALE POPULATION
609
FEMALE POPULATION
96.39
MALES / 100 FEMALES
103.75
FEMALES / 100 MALES
43.5
MEDIAN AGE
3.2
AVG FAMILY SIZE
2.7
AVG HOUSEHOLD SIZE
740
LABOR FORCE [ PEOPLE ]
71.6%
PERCENT IN LABOR FORCE
2.3%
UNEMPLOYMENT RATE
Valmeyer Zip Codes
Valmeyer Area Codes
Income in Valmeyer
Income Overview in Valmeyer
Per Capita Income in Valmeyer is $39,096, while median incomes of families and households are $109,063 and $95,625 respectively.
| Characteristic | Number | Measure |
| Per Capita Income | 1,196 | $39,096 |
| Median Family Income | 322 | $109,063 |
| Mean Family Income | 322 | $114,796 |
| Median Household Income | 436 | $95,625 |
| Mean Household Income | 436 | $102,448 |
| Income Deficit | 322 | $0 |
| Wage / Income Gap (%) | 1,196 | 21.81% |
| Wage / Income Gap ($) | 1,196 | 78.19¢ per $1 |
| Gini / Inequality Index | 1,196 | 0.32 |
Earnings by Sex in Valmeyer
Average Earnings in Valmeyer are $42,448, $50,357 for men and $39,375 for women, a difference of 21.8%.
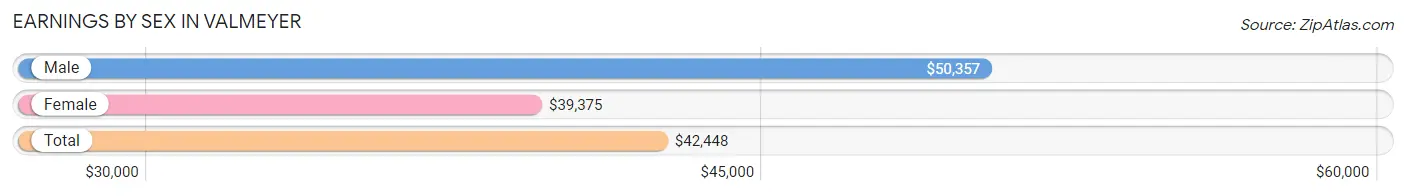
| Sex | Number | Average Earnings |
| Male | 380 (51.2%) | $50,357 |
| Female | 362 (48.8%) | $39,375 |
| Total | 742 (100.0%) | $42,448 |
Earnings by Sex by Income Bracket in Valmeyer
The most common earnings brackets in Valmeyer are $65,000 to $74,999 for men (65 | 17.1%) and $100,000+ for women (47 | 13.0%).
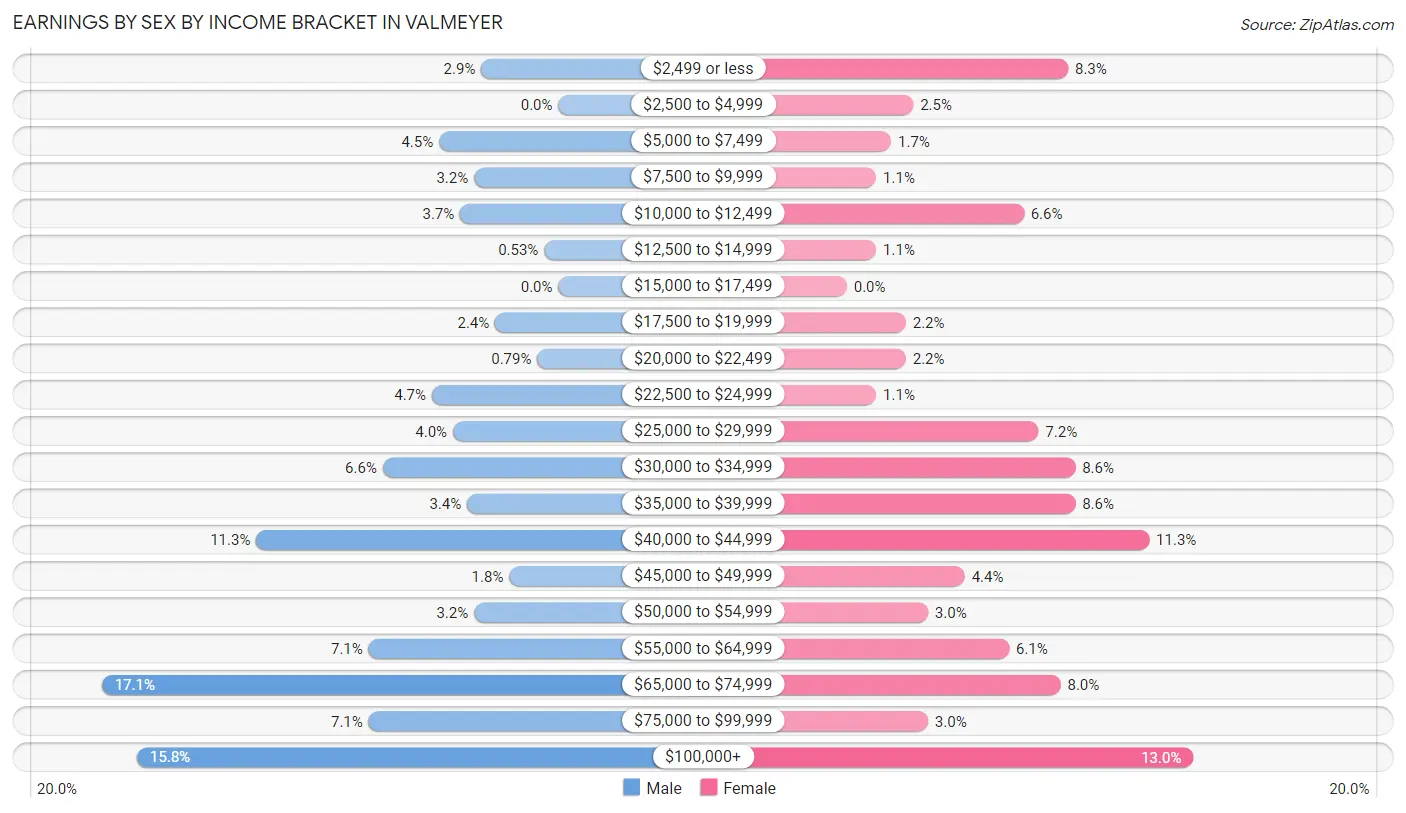
| Income | Male | Female |
| $2,499 or less | 11 (2.9%) | 30 (8.3%) |
| $2,500 to $4,999 | 0 (0.0%) | 9 (2.5%) |
| $5,000 to $7,499 | 17 (4.5%) | 6 (1.7%) |
| $7,500 to $9,999 | 12 (3.2%) | 4 (1.1%) |
| $10,000 to $12,499 | 14 (3.7%) | 24 (6.6%) |
| $12,500 to $14,999 | 2 (0.5%) | 4 (1.1%) |
| $15,000 to $17,499 | 0 (0.0%) | 0 (0.0%) |
| $17,500 to $19,999 | 9 (2.4%) | 8 (2.2%) |
| $20,000 to $22,499 | 3 (0.8%) | 8 (2.2%) |
| $22,500 to $24,999 | 18 (4.7%) | 4 (1.1%) |
| $25,000 to $29,999 | 15 (4.0%) | 26 (7.2%) |
| $30,000 to $34,999 | 25 (6.6%) | 31 (8.6%) |
| $35,000 to $39,999 | 13 (3.4%) | 31 (8.6%) |
| $40,000 to $44,999 | 43 (11.3%) | 41 (11.3%) |
| $45,000 to $49,999 | 7 (1.8%) | 16 (4.4%) |
| $50,000 to $54,999 | 12 (3.2%) | 11 (3.0%) |
| $55,000 to $64,999 | 27 (7.1%) | 22 (6.1%) |
| $65,000 to $74,999 | 65 (17.1%) | 29 (8.0%) |
| $75,000 to $99,999 | 27 (7.1%) | 11 (3.0%) |
| $100,000+ | 60 (15.8%) | 47 (13.0%) |
| Total | 380 (100.0%) | 362 (100.0%) |
Earnings by Sex by Educational Attainment in Valmeyer
Average earnings in Valmeyer are $62,625 for men and $44,028 for women, a difference of 29.7%. Men with an educational attainment of bachelor's degree enjoy the highest average annual earnings of $73,750, while those with graduate degree education earn the least with $23,750. Women with an educational attainment of bachelor's degree earn the most with the average annual earnings of $70,625, while those with high school diploma education have the smallest earnings of $35,000.
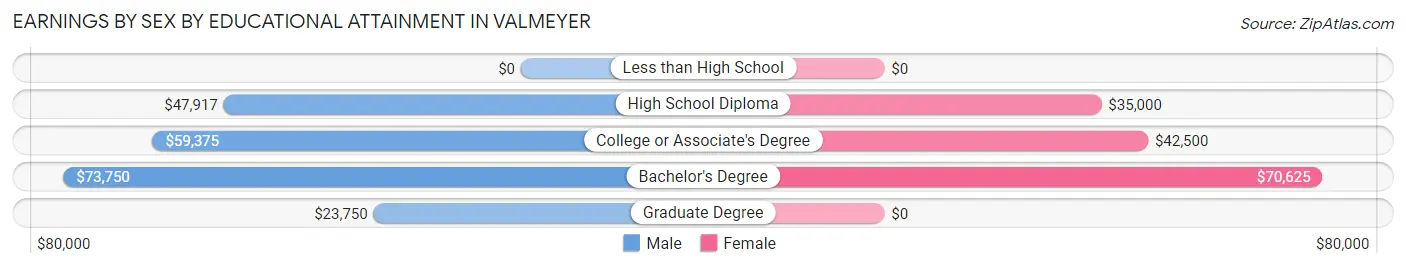
| Educational Attainment | Male Income | Female Income |
| Less than High School | - | - |
| High School Diploma | $47,917 | $35,000 |
| College or Associate's Degree | $59,375 | $42,500 |
| Bachelor's Degree | $73,750 | $70,625 |
| Graduate Degree | $23,750 | $0 |
| Total | $62,625 | $44,028 |
Family Income in Valmeyer
Family Income Brackets in Valmeyer
According to the Valmeyer family income data, there are 92 families falling into the $100,000 to $149,999 income range, which is the most common income bracket and makes up 28.6% of all families. Conversely, the $25,000 to $34,999 income bracket is the least frequent group with only 3 families (0.9%) belonging to this category.
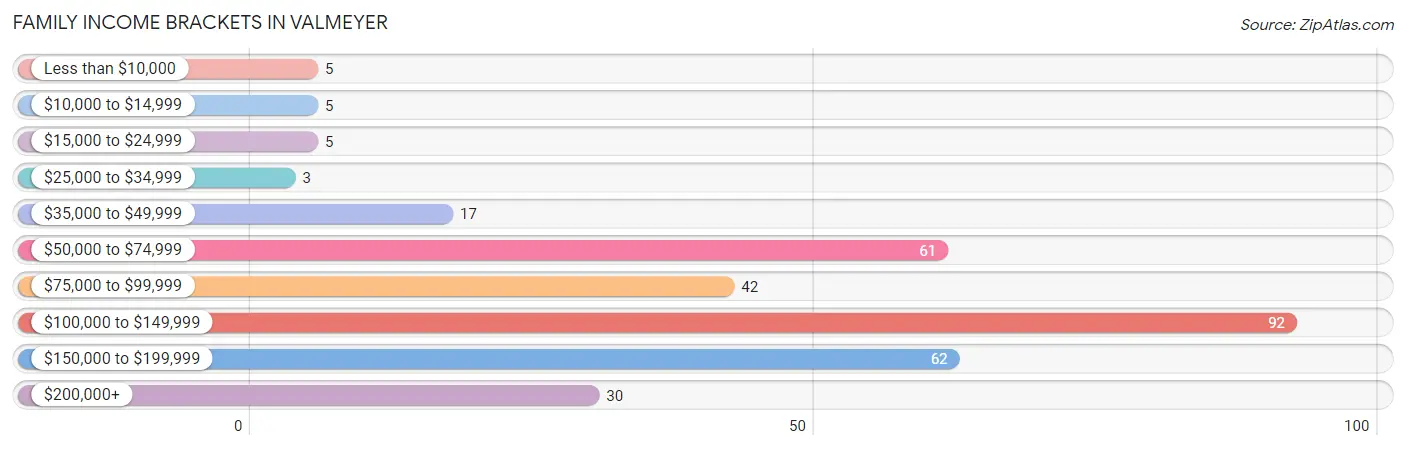
| Income Bracket | # Families | % Families |
| Less than $10,000 | 5 | 1.6% |
| $10,000 to $14,999 | 5 | 1.6% |
| $15,000 to $24,999 | 5 | 1.6% |
| $25,000 to $34,999 | 3 | 0.9% |
| $35,000 to $49,999 | 17 | 5.3% |
| $50,000 to $74,999 | 61 | 18.9% |
| $75,000 to $99,999 | 42 | 13.0% |
| $100,000 to $149,999 | 92 | 28.6% |
| $150,000 to $199,999 | 62 | 19.3% |
| $200,000+ | 30 | 9.3% |
Family Income by Famaliy Size in Valmeyer
5-person families (20 | 6.2%) account for the highest median family income in Valmeyer with $161,250 per family, while 3-person families (82 | 25.5%) have the highest median income of $38,583 per family member.
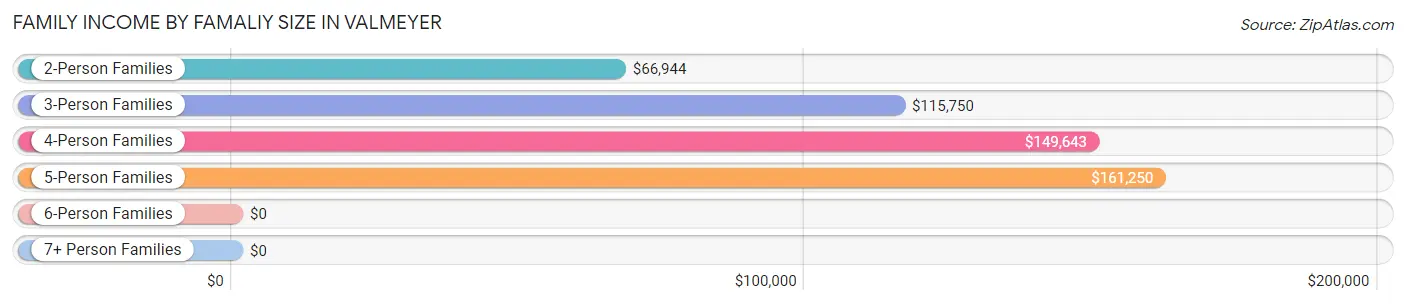
| Income Bracket | # Families | Median Income |
| 2-Person Families | 128 (39.8%) | $66,944 |
| 3-Person Families | 82 (25.5%) | $115,750 |
| 4-Person Families | 92 (28.6%) | $149,643 |
| 5-Person Families | 20 (6.2%) | $161,250 |
| 6-Person Families | 0 (0.0%) | $0 |
| 7+ Person Families | 0 (0.0%) | $0 |
| Total | 322 (100.0%) | $109,063 |
Family Income by Number of Earners in Valmeyer
The median family income in Valmeyer is $109,063, with families comprising 3+ earners (81) having the highest median family income of $178,750, while families with no earners (40) have the lowest median family income of $41,250, accounting for 25.2% and 12.4% of families, respectively.
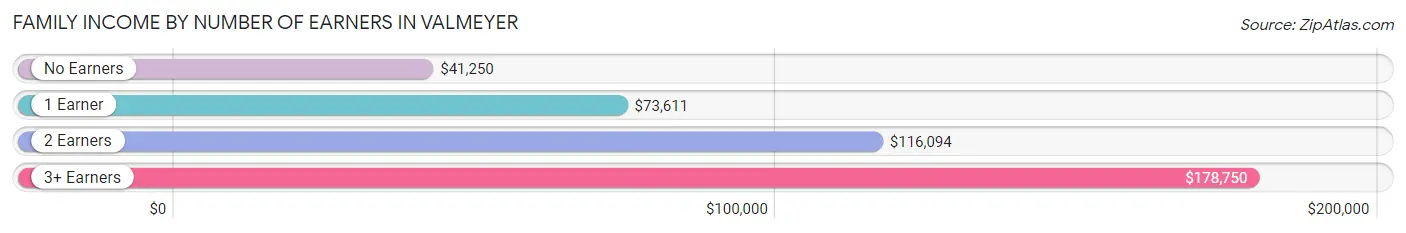
| Number of Earners | # Families | Median Income |
| No Earners | 40 (12.4%) | $41,250 |
| 1 Earner | 78 (24.2%) | $73,611 |
| 2 Earners | 123 (38.2%) | $116,094 |
| 3+ Earners | 81 (25.2%) | $178,750 |
| Total | 322 (100.0%) | $109,063 |
Household Income in Valmeyer
Household Income Brackets in Valmeyer
With 111 households falling in the category, the $100,000 to $149,999 income range is the most frequent in Valmeyer, accounting for 25.5% of all households. In contrast, only 4 households (0.9%) fall into the less than $10,000 income bracket, making it the least populous group.
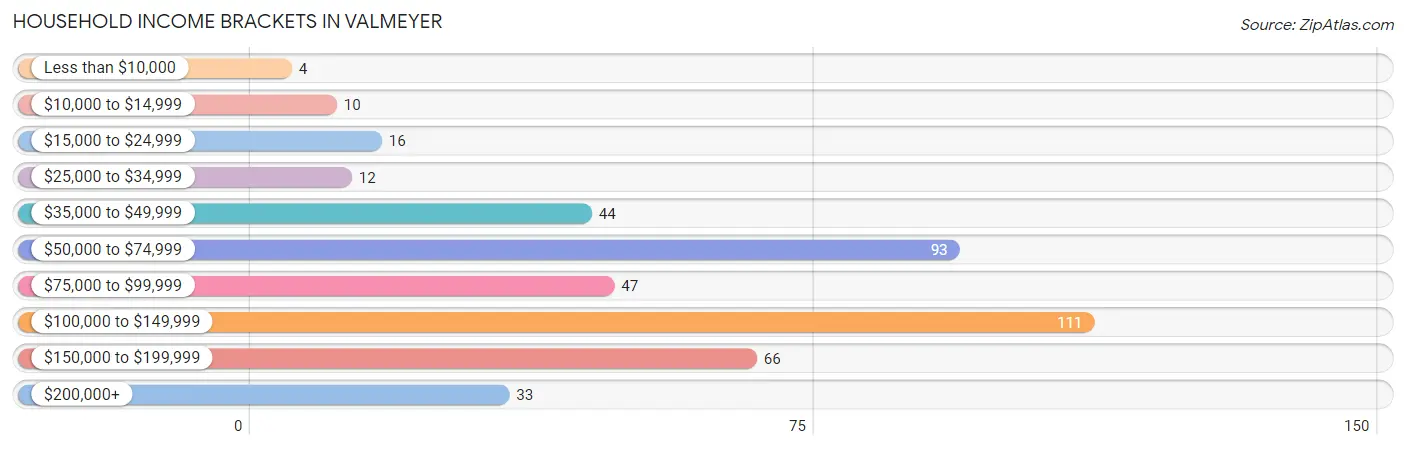
| Income Bracket | # Households | % Households |
| Less than $10,000 | 4 | 0.9% |
| $10,000 to $14,999 | 10 | 2.3% |
| $15,000 to $24,999 | 16 | 3.7% |
| $25,000 to $34,999 | 12 | 2.8% |
| $35,000 to $49,999 | 44 | 10.1% |
| $50,000 to $74,999 | 93 | 21.3% |
| $75,000 to $99,999 | 47 | 10.8% |
| $100,000 to $149,999 | 111 | 25.5% |
| $150,000 to $199,999 | 66 | 15.1% |
| $200,000+ | 33 | 7.6% |
Household Income by Householder Age in Valmeyer
The median household income in Valmeyer is $95,625, with the highest median household income of $124,375 found in the 25 to 44 years age bracket for the primary householder. A total of 138 households (31.7%) fall into this category. Meanwhile, the 65+ years age bracket for the primary householder has the lowest median household income of $55,625, with 130 households (29.8%) in this group.
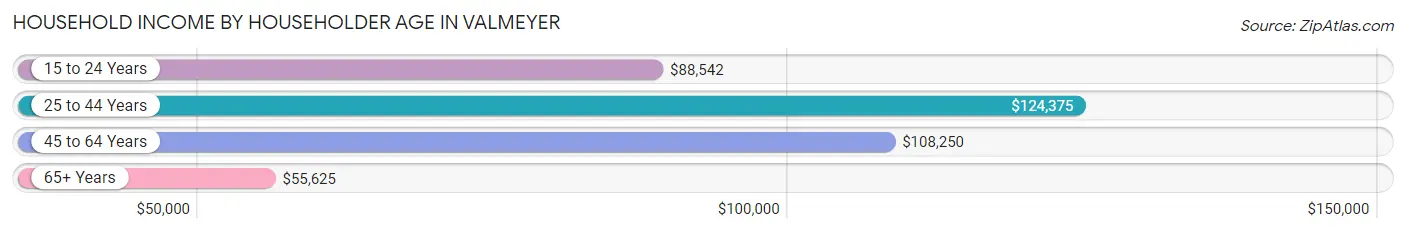
| Income Bracket | # Households | Median Income |
| 15 to 24 Years | 13 (3.0%) | $88,542 |
| 25 to 44 Years | 138 (31.7%) | $124,375 |
| 45 to 64 Years | 155 (35.5%) | $108,250 |
| 65+ Years | 130 (29.8%) | $55,625 |
| Total | 436 (100.0%) | $95,625 |
Poverty in Valmeyer
Income Below Poverty by Sex and Age in Valmeyer
With 2.6% poverty level for males and 3.6% for females among the residents of Valmeyer, under 5 year old males and 12 to 14 year old females are the most vulnerable to poverty, with 4 males (16.0%) and 2 females (22.2%) in their respective age groups living below the poverty level.
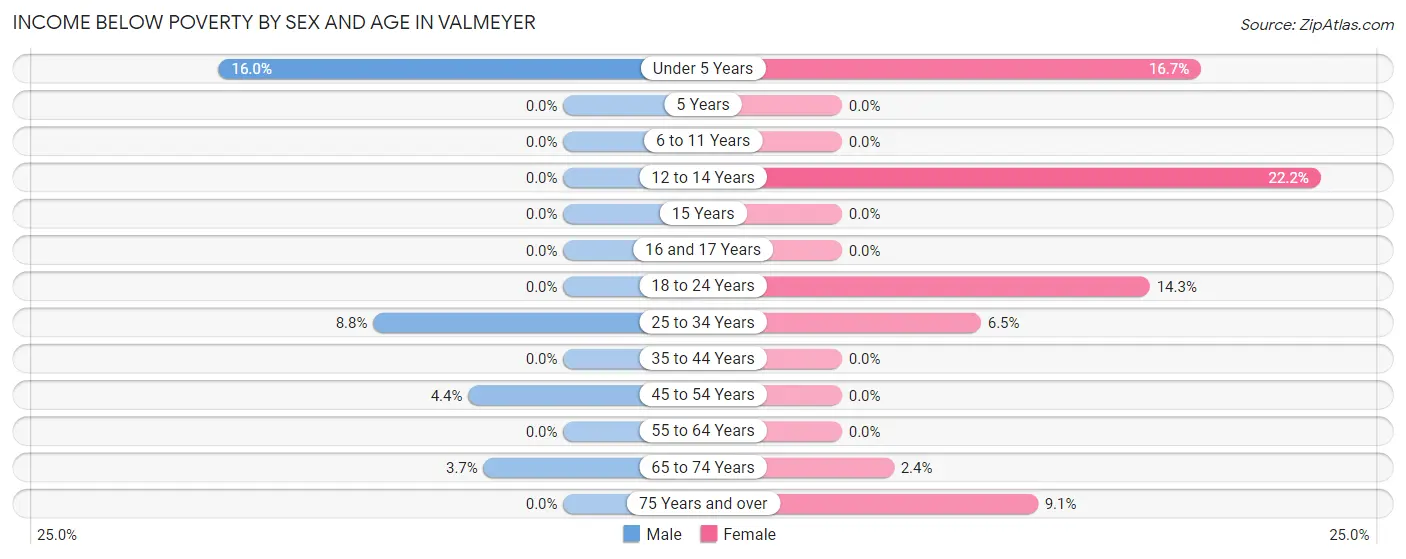
| Age Bracket | Male | Female |
| Under 5 Years | 4 (16.0%) | 2 (16.7%) |
| 5 Years | 0 (0.0%) | 0 (0.0%) |
| 6 to 11 Years | 0 (0.0%) | 0 (0.0%) |
| 12 to 14 Years | 0 (0.0%) | 2 (22.2%) |
| 15 Years | 0 (0.0%) | 0 (0.0%) |
| 16 and 17 Years | 0 (0.0%) | 0 (0.0%) |
| 18 to 24 Years | 0 (0.0%) | 7 (14.3%) |
| 25 to 34 Years | 6 (8.8%) | 4 (6.5%) |
| 35 to 44 Years | 0 (0.0%) | 0 (0.0%) |
| 45 to 54 Years | 3 (4.4%) | 0 (0.0%) |
| 55 to 64 Years | 0 (0.0%) | 0 (0.0%) |
| 65 to 74 Years | 2 (3.7%) | 2 (2.4%) |
| 75 Years and over | 0 (0.0%) | 5 (9.1%) |
| Total | 15 (2.6%) | 22 (3.6%) |
Income Above Poverty by Sex and Age in Valmeyer
According to the poverty statistics in Valmeyer, males aged 6 to 11 years and females aged 5 years are the age groups that are most secure financially, with 100.0% of males and 100.0% of females in these age groups living above the poverty line.
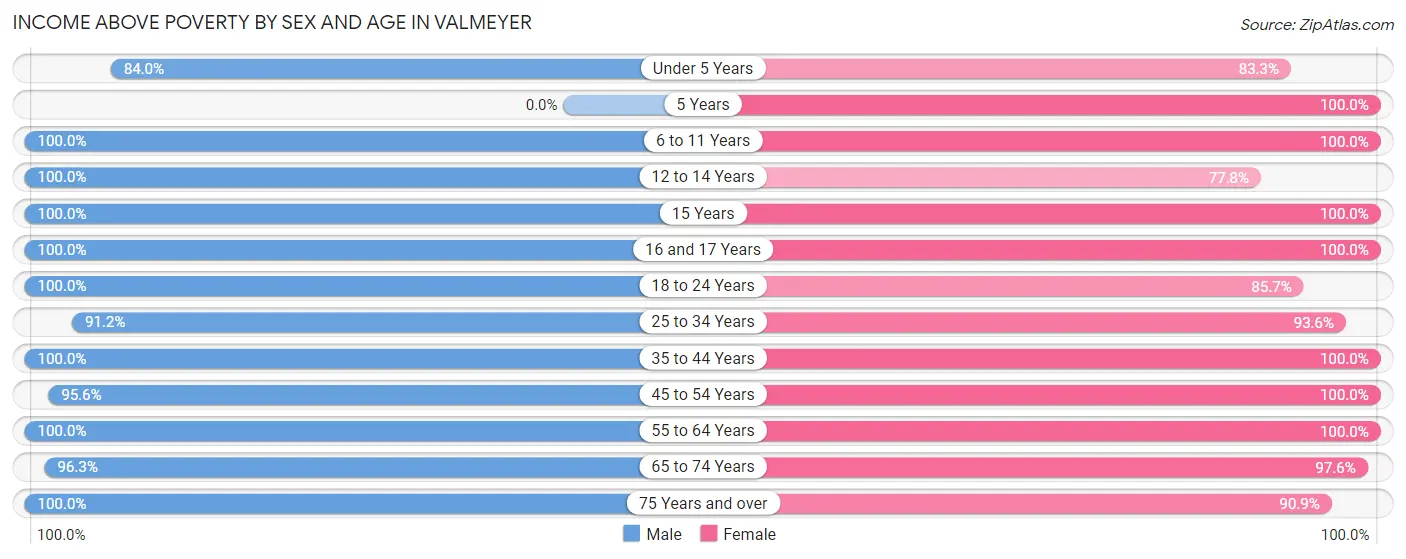
| Age Bracket | Male | Female |
| Under 5 Years | 21 (84.0%) | 10 (83.3%) |
| 5 Years | 0 (0.0%) | 9 (100.0%) |
| 6 to 11 Years | 29 (100.0%) | 26 (100.0%) |
| 12 to 14 Years | 38 (100.0%) | 7 (77.8%) |
| 15 Years | 12 (100.0%) | 3 (100.0%) |
| 16 and 17 Years | 31 (100.0%) | 31 (100.0%) |
| 18 to 24 Years | 53 (100.0%) | 42 (85.7%) |
| 25 to 34 Years | 62 (91.2%) | 58 (93.5%) |
| 35 to 44 Years | 107 (100.0%) | 95 (100.0%) |
| 45 to 54 Years | 65 (95.6%) | 77 (100.0%) |
| 55 to 64 Years | 77 (100.0%) | 98 (100.0%) |
| 65 to 74 Years | 52 (96.3%) | 81 (97.6%) |
| 75 Years and over | 25 (100.0%) | 50 (90.9%) |
| Total | 572 (97.4%) | 587 (96.4%) |
Income Below Poverty Among Married-Couple Families in Valmeyer
The poverty statistics for married-couple families in Valmeyer show that 1.4% or 4 of the total 280 families live below the poverty line. Families with 1 or 2 children have the highest poverty rate of 1.7%, comprising of 2 families. On the other hand, families with 3 or 4 children have the lowest poverty rate of 0.0%, which includes 0 families.
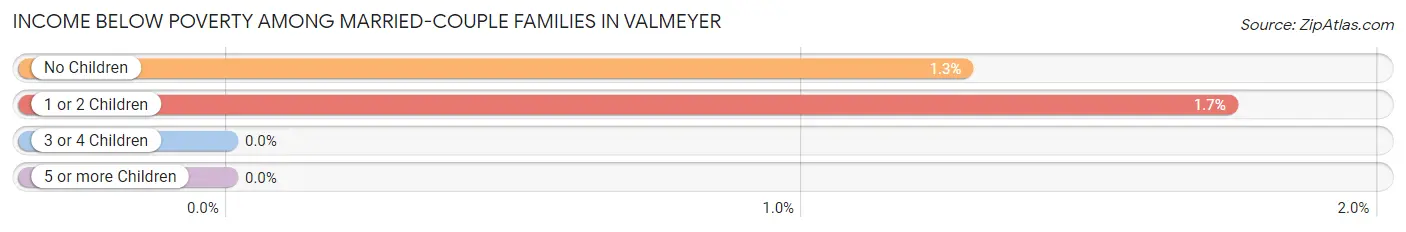
| Children | Above Poverty | Below Poverty |
| No Children | 154 (98.7%) | 2 (1.3%) |
| 1 or 2 Children | 113 (98.3%) | 2 (1.7%) |
| 3 or 4 Children | 9 (100.0%) | 0 (0.0%) |
| 5 or more Children | 0 (0.0%) | 0 (0.0%) |
| Total | 276 (98.6%) | 4 (1.4%) |
Income Below Poverty Among Single-Parent Households in Valmeyer
According to the poverty data in Valmeyer, 27.3% or 3 single-father households and 9.7% or 3 single-mother households are living below the poverty line. Among single-father households, those with 1 or 2 children have the highest poverty rate, with 3 households (50.0%) experiencing poverty. Likewise, among single-mother households, those with 1 or 2 children have the highest poverty rate, with 3 households (25.0%) falling below the poverty line.
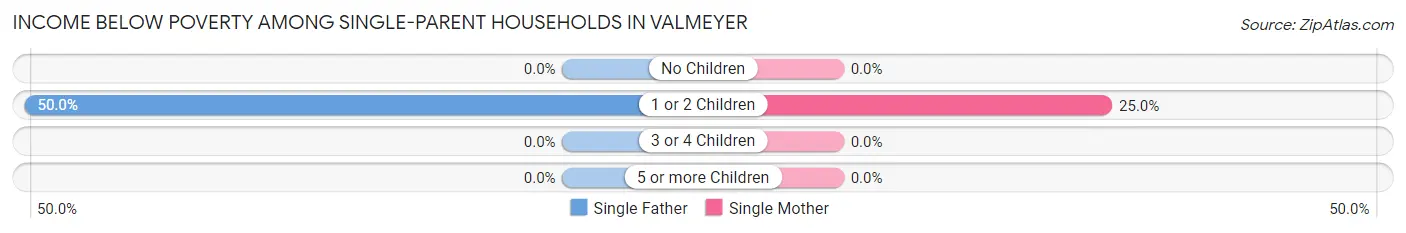
| Children | Single Father | Single Mother |
| No Children | 0 (0.0%) | 0 (0.0%) |
| 1 or 2 Children | 3 (50.0%) | 3 (25.0%) |
| 3 or 4 Children | 0 (0.0%) | 0 (0.0%) |
| 5 or more Children | 0 (0.0%) | 0 (0.0%) |
| Total | 3 (27.3%) | 3 (9.7%) |
Income Below Poverty Among Married-Couple vs Single-Parent Households in Valmeyer
The poverty data for Valmeyer shows that 4 of the married-couple family households (1.4%) and 6 of the single-parent households (14.3%) are living below the poverty level. Within the married-couple family households, those with 1 or 2 children have the highest poverty rate, with 2 households (1.7%) falling below the poverty line. Among the single-parent households, those with 1 or 2 children have the highest poverty rate, with 6 household (33.3%) living below poverty.
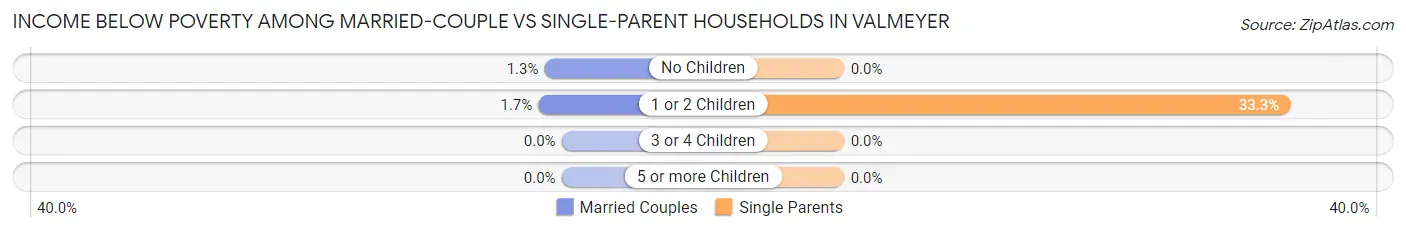
| Children | Married-Couple Families | Single-Parent Households |
| No Children | 2 (1.3%) | 0 (0.0%) |
| 1 or 2 Children | 2 (1.7%) | 6 (33.3%) |
| 3 or 4 Children | 0 (0.0%) | 0 (0.0%) |
| 5 or more Children | 0 (0.0%) | 0 (0.0%) |
| Total | 4 (1.4%) | 6 (14.3%) |
Race in Valmeyer
The most populous races in Valmeyer are White / Caucasian (1,171 | 97.9%), Hispanic or Latino (31 | 2.6%), and Two or more Races (19 | 1.6%).
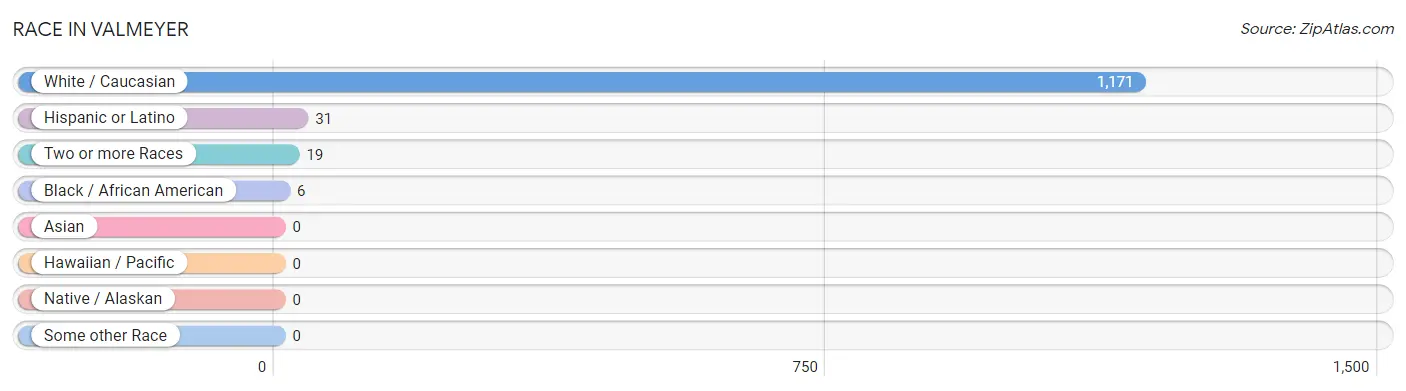
| Race | # Population | % Population |
| Asian | 0 | 0.0% |
| Black / African American | 6 | 0.5% |
| Hawaiian / Pacific | 0 | 0.0% |
| Hispanic or Latino | 31 | 2.6% |
| Native / Alaskan | 0 | 0.0% |
| White / Caucasian | 1,171 | 97.9% |
| Two or more Races | 19 | 1.6% |
| Some other Race | 0 | 0.0% |
| Total | 1,196 | 100.0% |
Ancestry in Valmeyer
The most populous ancestries reported in Valmeyer are German (558 | 46.7%), Irish (170 | 14.2%), English (104 | 8.7%), American (83 | 6.9%), and Italian (57 | 4.8%), together accounting for 81.3% of all Valmeyer residents.
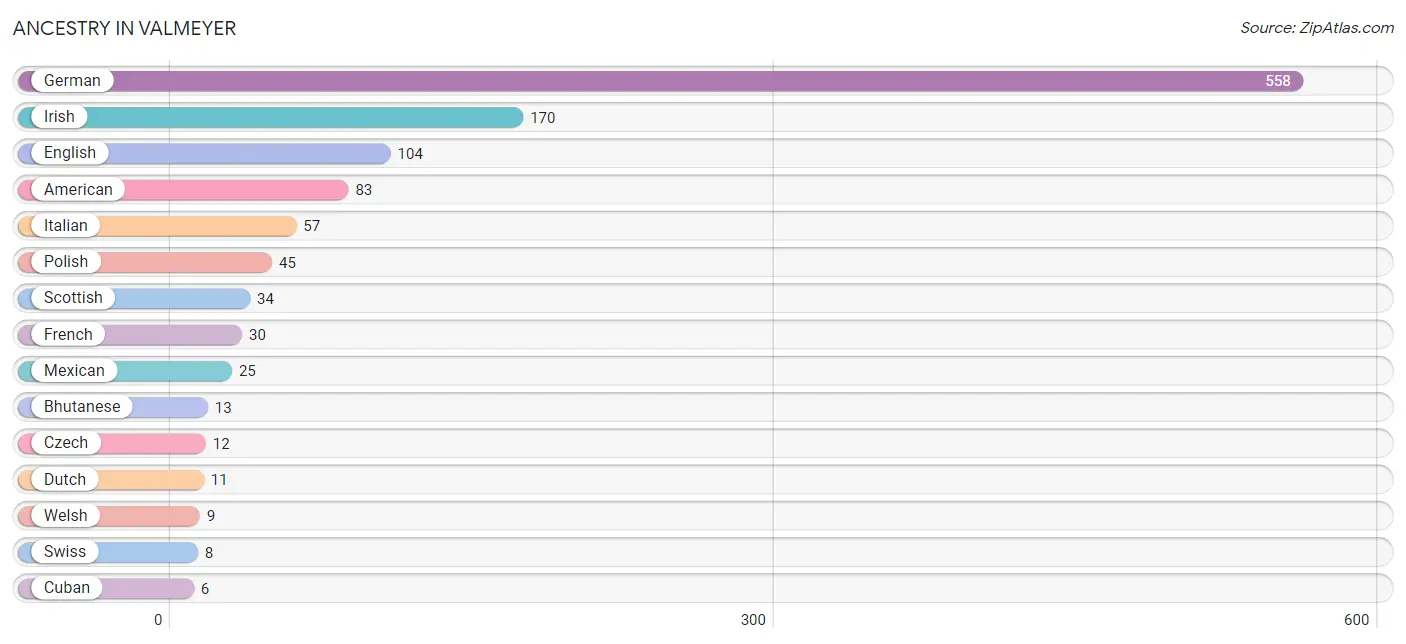
| Ancestry | # Population | % Population |
| American | 83 | 6.9% |
| Bhutanese | 13 | 1.1% |
| Cherokee | 3 | 0.3% |
| Cuban | 6 | 0.5% |
| Czech | 12 | 1.0% |
| Dutch | 11 | 0.9% |
| English | 104 | 8.7% |
| European | 3 | 0.3% |
| French | 30 | 2.5% |
| German | 558 | 46.7% |
| Irish | 170 | 14.2% |
| Italian | 57 | 4.8% |
| Korean | 2 | 0.2% |
| Mexican | 25 | 2.1% |
| Norwegian | 3 | 0.3% |
| Polish | 45 | 3.8% |
| Scotch-Irish | 3 | 0.3% |
| Scottish | 34 | 2.8% |
| Sioux | 1 | 0.1% |
| Swiss | 8 | 0.7% |
| Welsh | 9 | 0.7% | View All 21 Rows |
Immigrants in Valmeyer
The most numerous immigrant groups reported in Valmeyer came from Central America (6 | 0.5%), Latin America (6 | 0.5%), Mexico (6 | 0.5%), Europe (5 | 0.4%), and Western Europe (5 | 0.4%), together accounting for 2.3% of all Valmeyer residents.
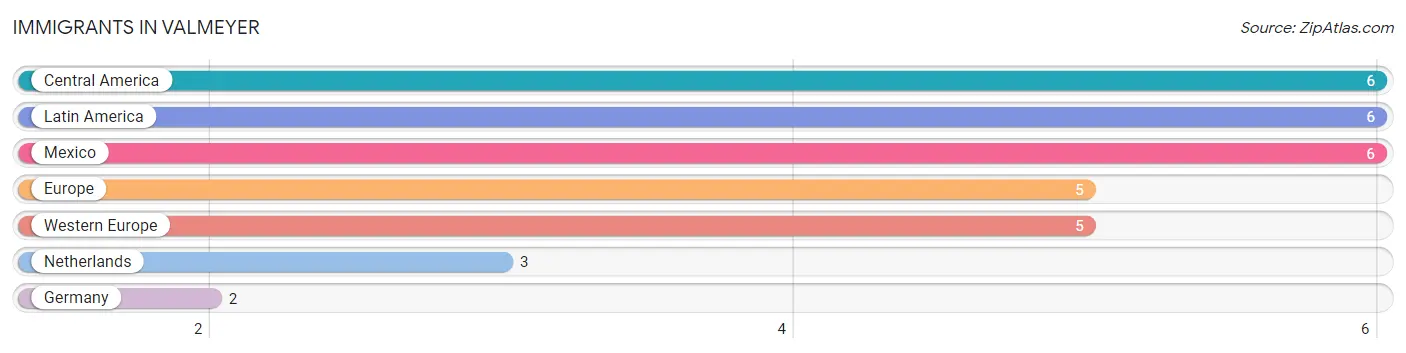
| Immigration Origin | # Population | % Population |
| Central America | 6 | 0.5% |
| Europe | 5 | 0.4% |
| Germany | 2 | 0.2% |
| Latin America | 6 | 0.5% |
| Mexico | 6 | 0.5% |
| Netherlands | 3 | 0.3% |
| Western Europe | 5 | 0.4% | View All 7 Rows |
Sex and Age in Valmeyer
Sex and Age in Valmeyer
The most populous age groups in Valmeyer are 15 to 19 Years (61 | 10.4%) for men and 40 to 44 Years (69 | 11.3%) for women.
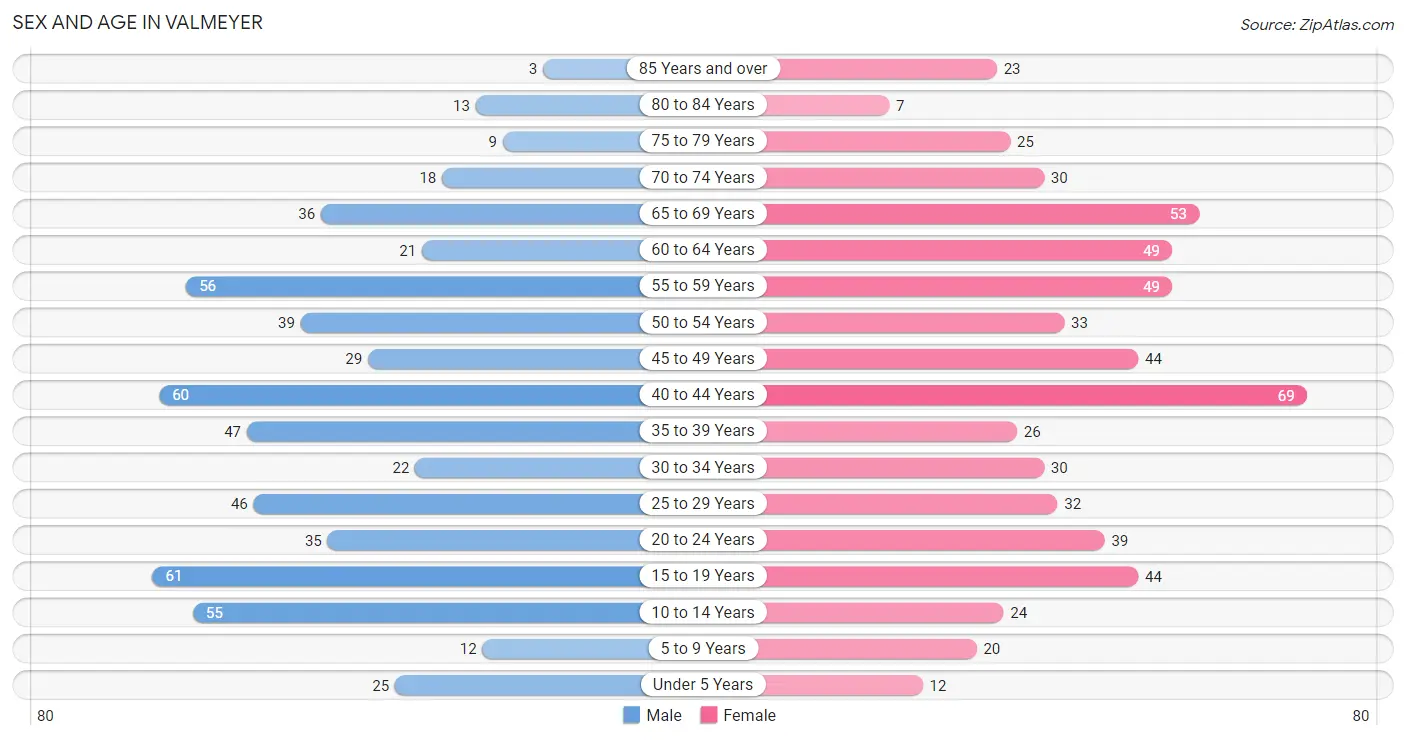
| Age Bracket | Male | Female |
| Under 5 Years | 25 (4.3%) | 12 (2.0%) |
| 5 to 9 Years | 12 (2.0%) | 20 (3.3%) |
| 10 to 14 Years | 55 (9.4%) | 24 (3.9%) |
| 15 to 19 Years | 61 (10.4%) | 44 (7.2%) |
| 20 to 24 Years | 35 (6.0%) | 39 (6.4%) |
| 25 to 29 Years | 46 (7.8%) | 32 (5.2%) |
| 30 to 34 Years | 22 (3.7%) | 30 (4.9%) |
| 35 to 39 Years | 47 (8.0%) | 26 (4.3%) |
| 40 to 44 Years | 60 (10.2%) | 69 (11.3%) |
| 45 to 49 Years | 29 (4.9%) | 44 (7.2%) |
| 50 to 54 Years | 39 (6.6%) | 33 (5.4%) |
| 55 to 59 Years | 56 (9.5%) | 49 (8.1%) |
| 60 to 64 Years | 21 (3.6%) | 49 (8.1%) |
| 65 to 69 Years | 36 (6.1%) | 53 (8.7%) |
| 70 to 74 Years | 18 (3.1%) | 30 (4.9%) |
| 75 to 79 Years | 9 (1.5%) | 25 (4.1%) |
| 80 to 84 Years | 13 (2.2%) | 7 (1.1%) |
| 85 Years and over | 3 (0.5%) | 23 (3.8%) |
| Total | 587 (100.0%) | 609 (100.0%) |
Families and Households in Valmeyer
Median Family Size in Valmeyer
The median family size in Valmeyer is 3.21 persons per family, with single female/mother families (31 | 9.6%) accounting for the largest median family size of 3.55 persons per family. On the other hand, single male/father families (11 | 3.4%) represent the smallest median family size with 2.45 persons per family.
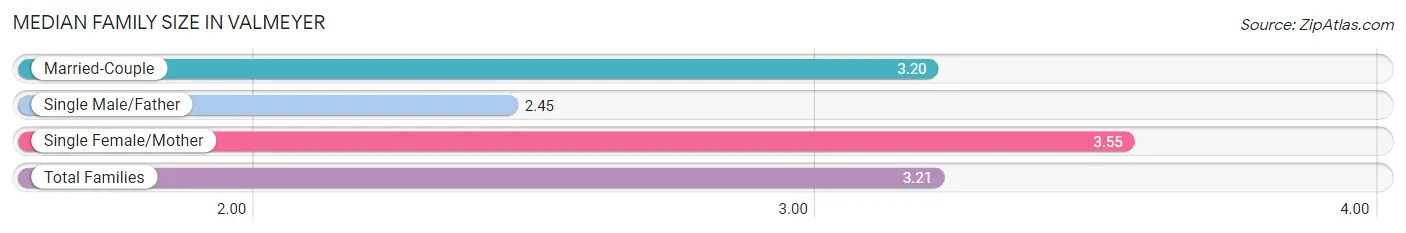
| Family Type | # Families | Family Size |
| Married-Couple | 280 (87.0%) | 3.20 |
| Single Male/Father | 11 (3.4%) | 2.45 |
| Single Female/Mother | 31 (9.6%) | 3.55 |
| Total Families | 322 (100.0%) | 3.21 |
Median Household Size in Valmeyer
The median household size in Valmeyer is 2.74 persons per household, with single female/mother households (31 | 7.1%) accounting for the largest median household size of 3.61 persons per household. non-family households (114 | 26.2%) represent the smallest median household size with 1.25 persons per household.
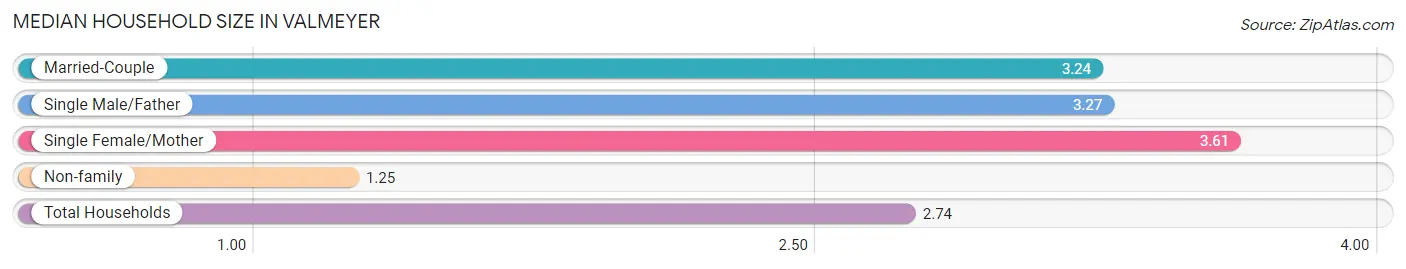
| Household Type | # Households | Household Size |
| Married-Couple | 280 (64.2%) | 3.24 |
| Single Male/Father | 11 (2.5%) | 3.27 |
| Single Female/Mother | 31 (7.1%) | 3.61 |
| Non-family | 114 (26.2%) | 1.25 |
| Total Households | 436 (100.0%) | 2.74 |
Household Size by Marriage Status in Valmeyer
Out of a total of 436 households in Valmeyer, 322 (73.9%) are family households, while 114 (26.2%) are nonfamily households. The most numerous type of family households are 2-person households, comprising 122, and the most common type of nonfamily households are 1-person households, comprising 90.
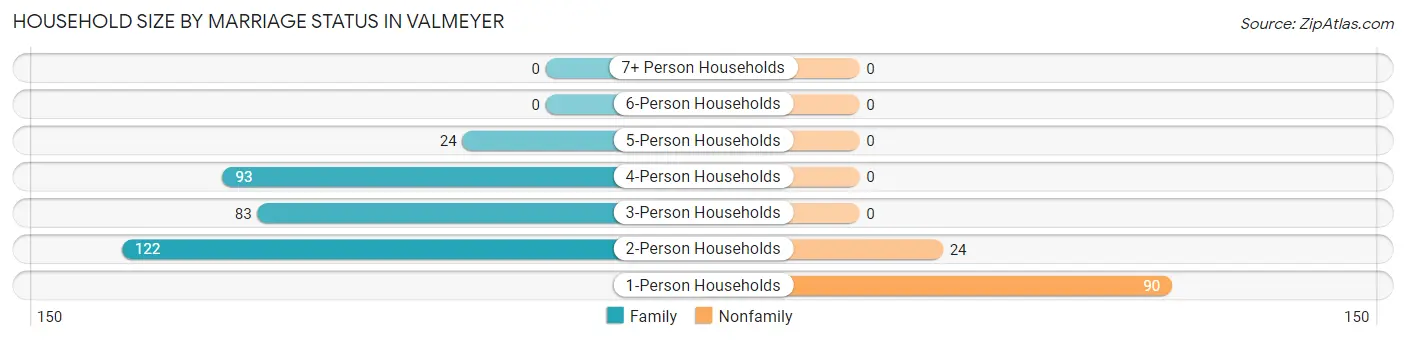
| Household Size | Family Households | Nonfamily Households |
| 1-Person Households | - | 90 (20.6%) |
| 2-Person Households | 122 (28.0%) | 24 (5.5%) |
| 3-Person Households | 83 (19.0%) | 0 (0.0%) |
| 4-Person Households | 93 (21.3%) | 0 (0.0%) |
| 5-Person Households | 24 (5.5%) | 0 (0.0%) |
| 6-Person Households | 0 (0.0%) | 0 (0.0%) |
| 7+ Person Households | 0 (0.0%) | 0 (0.0%) |
| Total | 322 (73.9%) | 114 (26.2%) |
Female Fertility in Valmeyer
Fertility by Age in Valmeyer
Average fertility rate in Valmeyer is 28.0 births per 1,000 women. Women in the age bracket of 20 to 34 years have the highest fertility rate with 79.0 births per 1,000 women. Women in the age bracket of 20 to 34 years acount for 100.0% of all women with births.
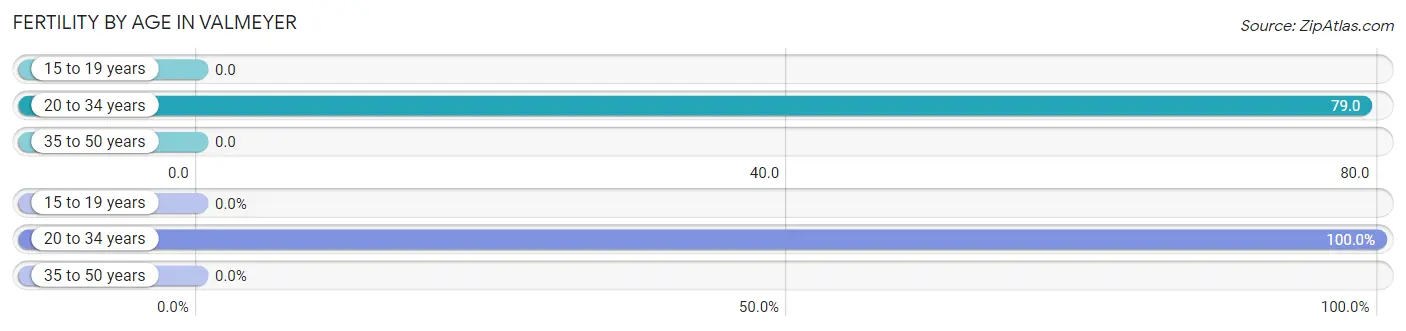
| Age Bracket | Women with Births | Births / 1,000 Women |
| 15 to 19 years | 0 (0.0%) | 0.0 |
| 20 to 34 years | 8 (100.0%) | 79.0 |
| 35 to 50 years | 0 (0.0%) | 0.0 |
| Total | 8 (100.0%) | 28.0 |
Fertility by Age by Marriage Status in Valmeyer
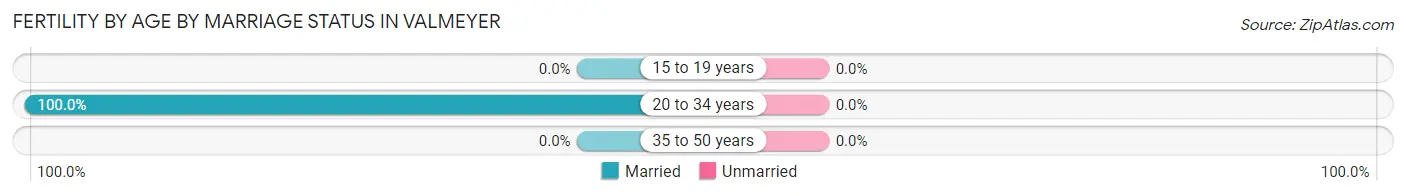
| Age Bracket | Married | Unmarried |
| 15 to 19 years | 0 (0.0%) | 0 (0.0%) |
| 20 to 34 years | 8 (100.0%) | 0 (0.0%) |
| 35 to 50 years | 0 (0.0%) | 0 (0.0%) |
| Total | 8 (100.0%) | 0 (0.0%) |
Fertility by Education in Valmeyer
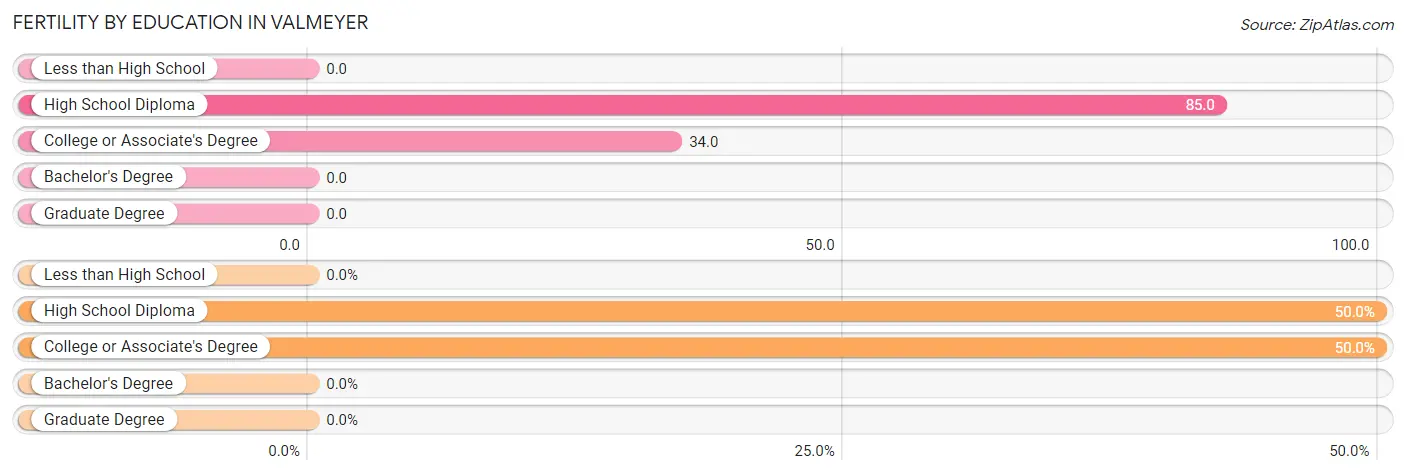
| Educational Attainment | Women with Births | Births / 1,000 Women |
| Less than High School | 0 (0.0%) | 0.0 |
| High School Diploma | 4 (50.0%) | 85.0 |
| College or Associate's Degree | 4 (50.0%) | 34.0 |
| Bachelor's Degree | 0 (0.0%) | 0.0 |
| Graduate Degree | 0 (0.0%) | 0.0 |
| Total | 8 (100.0%) | 28.0 |
Fertility by Education by Marriage Status in Valmeyer
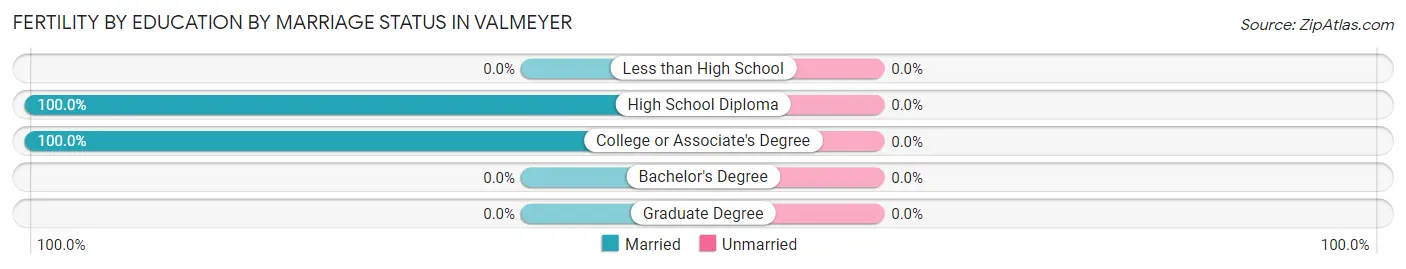
| Educational Attainment | Married | Unmarried |
| Less than High School | 0 (0.0%) | 0 (0.0%) |
| High School Diploma | 4 (100.0%) | 0 (0.0%) |
| College or Associate's Degree | 4 (100.0%) | 0 (0.0%) |
| Bachelor's Degree | 0 (0.0%) | 0 (0.0%) |
| Graduate Degree | 0 (0.0%) | 0 (0.0%) |
| Total | 8 (100.0%) | 0 (0.0%) |
Employment Characteristics in Valmeyer
Employment by Class of Employer in Valmeyer
Among the 713 employed individuals in Valmeyer, private company employees (550 | 77.1%), local government employees (65 | 9.1%), and not-for-profit organizations (42 | 5.9%) make up the most common classes of employment.
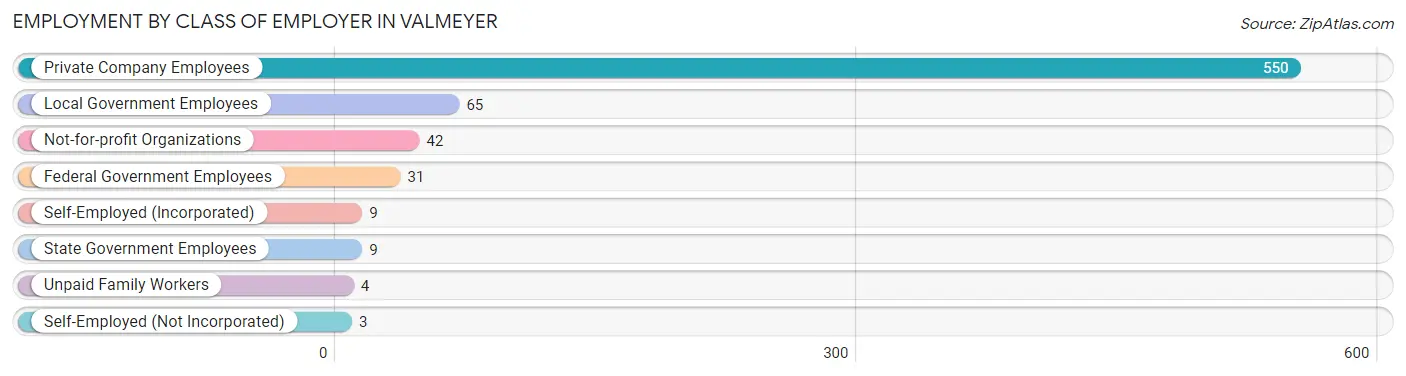
| Employer Class | # Employees | % Employees |
| Private Company Employees | 550 | 77.1% |
| Self-Employed (Incorporated) | 9 | 1.3% |
| Self-Employed (Not Incorporated) | 3 | 0.4% |
| Not-for-profit Organizations | 42 | 5.9% |
| Local Government Employees | 65 | 9.1% |
| State Government Employees | 9 | 1.3% |
| Federal Government Employees | 31 | 4.3% |
| Unpaid Family Workers | 4 | 0.6% |
| Total | 713 | 100.0% |
Employment Status by Age in Valmeyer
According to the labor force statistics for Valmeyer, out of the total population over 16 years of age (1,033), 71.6% or 740 individuals are in the labor force, with 2.3% or 17 of them unemployed. The age group with the highest labor force participation rate is 35 to 44 years, with 98.5% or 199 individuals in the labor force. Within the labor force, the 16 to 19 years age range has the highest percentage of unemployed individuals, with 17.1% or 13 of them being unemployed.
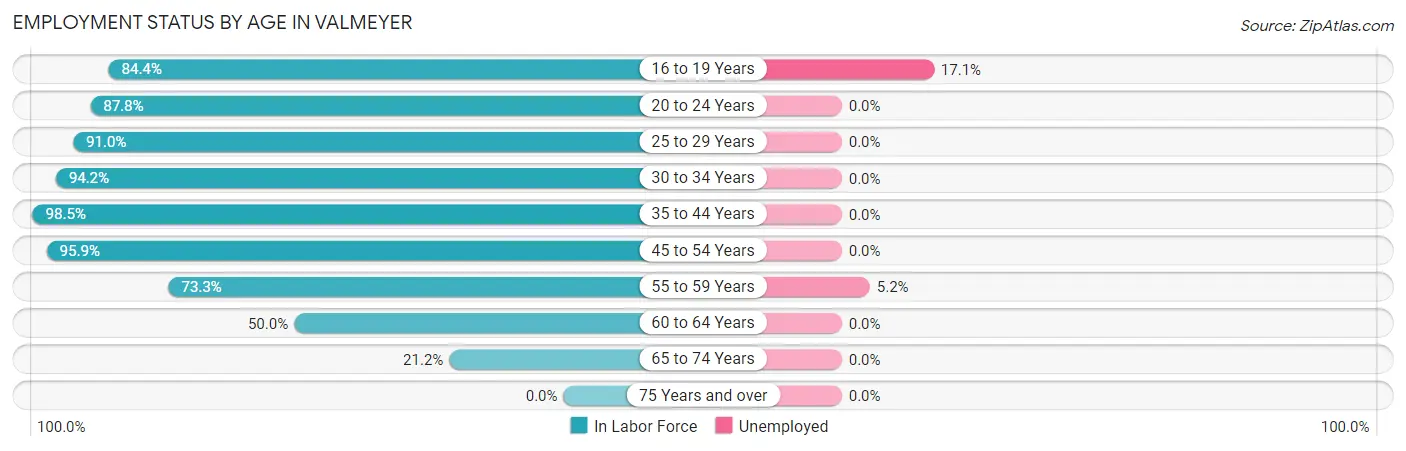
| Age Bracket | In Labor Force | Unemployed |
| 16 to 19 Years | 76 (84.4%) | 13 (17.1%) |
| 20 to 24 Years | 65 (87.8%) | 0 (0.0%) |
| 25 to 29 Years | 71 (91.0%) | 0 (0.0%) |
| 30 to 34 Years | 49 (94.2%) | 0 (0.0%) |
| 35 to 44 Years | 199 (98.5%) | 0 (0.0%) |
| 45 to 54 Years | 139 (95.9%) | 0 (0.0%) |
| 55 to 59 Years | 77 (73.3%) | 4 (5.2%) |
| 60 to 64 Years | 35 (50.0%) | 0 (0.0%) |
| 65 to 74 Years | 29 (21.2%) | 0 (0.0%) |
| 75 Years and over | 0 (0.0%) | 0 (0.0%) |
| Total | 740 (71.6%) | 17 (2.3%) |
Employment Status by Educational Attainment in Valmeyer
According to labor force statistics for Valmeyer, 87.4% of individuals (570) out of the total population between 25 and 64 years of age (652) are in the labor force, with 0.7% or 4 of them being unemployed. The group with the highest labor force participation rate are those with the educational attainment of less than high school, with 100.0% or 11 individuals in the labor force. Within the labor force, individuals with college / associate degree education have the highest percentage of unemployment, with 2.0% or 4 of them being unemployed.
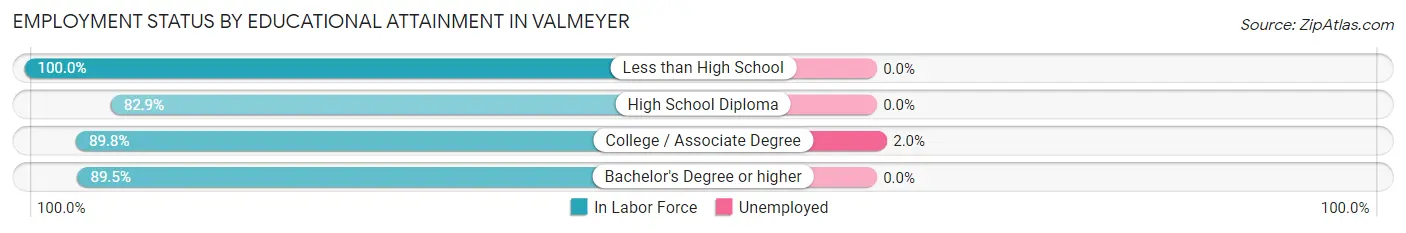
| Educational Attainment | In Labor Force | Unemployed |
| Less than High School | 11 (100.0%) | 0 (0.0%) |
| High School Diploma | 194 (82.9%) | 0 (0.0%) |
| College / Associate Degree | 203 (89.8%) | 5 (2.0%) |
| Bachelor's Degree or higher | 162 (89.5%) | 0 (0.0%) |
| Total | 570 (87.4%) | 5 (0.7%) |
Employment Occupations by Sex in Valmeyer
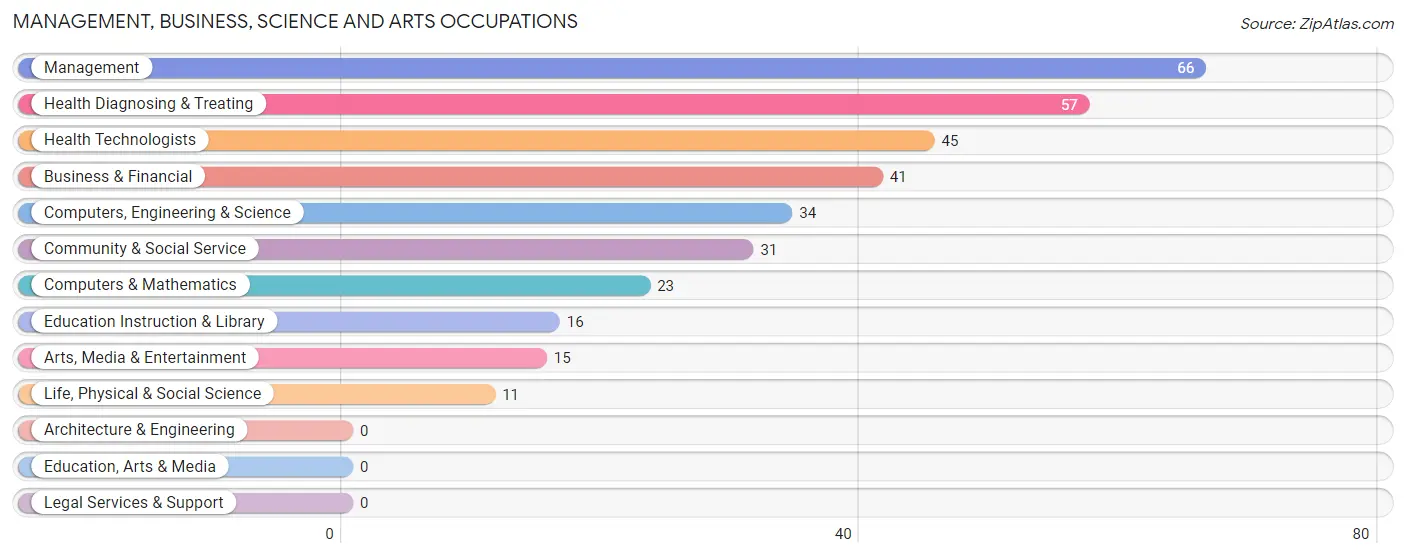
Management, Business, Science and Arts Occupations
The most common Management, Business, Science and Arts occupations in Valmeyer are Management (66 | 9.1%), Health Diagnosing & Treating (57 | 7.9%), Health Technologists (45 | 6.2%), Business & Financial (41 | 5.7%), and Computers, Engineering & Science (34 | 4.7%).
Management, Business, Science and Arts Occupations by Sex
Within the Management, Business, Science and Arts occupations in Valmeyer, the most male-oriented occupations are Computers & Mathematics (73.9%), Business & Financial (73.2%), and Computers, Engineering & Science (64.7%), while the most female-oriented occupations are Education Instruction & Library (81.2%), Community & Social Service (77.4%), and Health Technologists (75.6%).
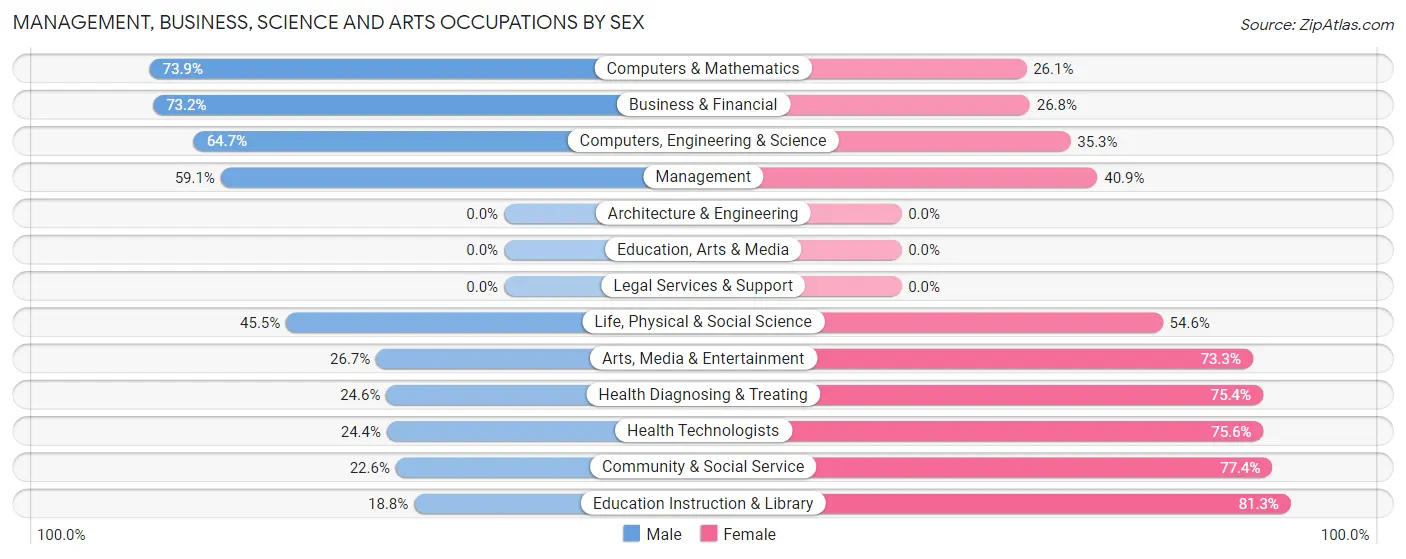
| Occupation | Male | Female |
| Management | 39 (59.1%) | 27 (40.9%) |
| Business & Financial | 30 (73.2%) | 11 (26.8%) |
| Computers, Engineering & Science | 22 (64.7%) | 12 (35.3%) |
| Computers & Mathematics | 17 (73.9%) | 6 (26.1%) |
| Architecture & Engineering | 0 (0.0%) | 0 (0.0%) |
| Life, Physical & Social Science | 5 (45.5%) | 6 (54.5%) |
| Community & Social Service | 7 (22.6%) | 24 (77.4%) |
| Education, Arts & Media | 0 (0.0%) | 0 (0.0%) |
| Legal Services & Support | 0 (0.0%) | 0 (0.0%) |
| Education Instruction & Library | 3 (18.8%) | 13 (81.2%) |
| Arts, Media & Entertainment | 4 (26.7%) | 11 (73.3%) |
| Health Diagnosing & Treating | 14 (24.6%) | 43 (75.4%) |
| Health Technologists | 11 (24.4%) | 34 (75.6%) |
| Total (Category) | 112 (48.9%) | 117 (51.1%) |
| Total (Overall) | 376 (52.0%) | 347 (48.0%) |
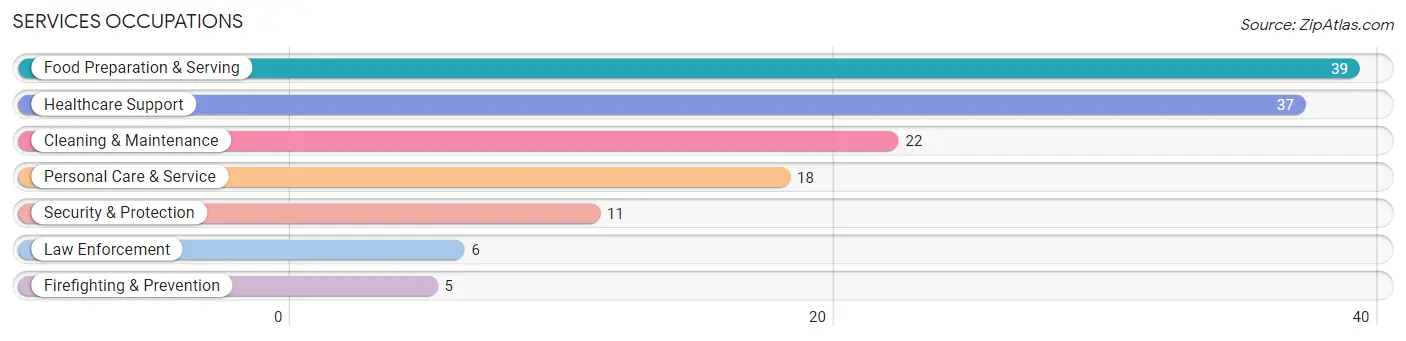
Services Occupations
The most common Services occupations in Valmeyer are Food Preparation & Serving (39 | 5.4%), Healthcare Support (37 | 5.1%), Cleaning & Maintenance (22 | 3.0%), Personal Care & Service (18 | 2.5%), and Security & Protection (11 | 1.5%).
Services Occupations by Sex
Within the Services occupations in Valmeyer, the most male-oriented occupations are Security & Protection (100.0%), Firefighting & Prevention (100.0%), and Law Enforcement (100.0%), while the most female-oriented occupations are Personal Care & Service (100.0%), Healthcare Support (91.9%), and Food Preparation & Serving (64.1%).
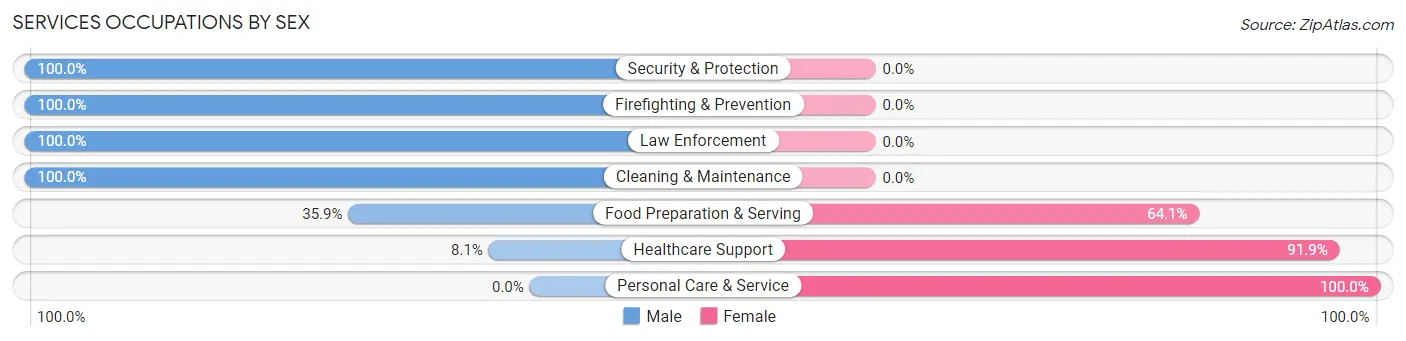
| Occupation | Male | Female |
| Healthcare Support | 3 (8.1%) | 34 (91.9%) |
| Security & Protection | 11 (100.0%) | 0 (0.0%) |
| Firefighting & Prevention | 5 (100.0%) | 0 (0.0%) |
| Law Enforcement | 6 (100.0%) | 0 (0.0%) |
| Food Preparation & Serving | 14 (35.9%) | 25 (64.1%) |
| Cleaning & Maintenance | 22 (100.0%) | 0 (0.0%) |
| Personal Care & Service | 0 (0.0%) | 18 (100.0%) |
| Total (Category) | 50 (39.4%) | 77 (60.6%) |
| Total (Overall) | 376 (52.0%) | 347 (48.0%) |
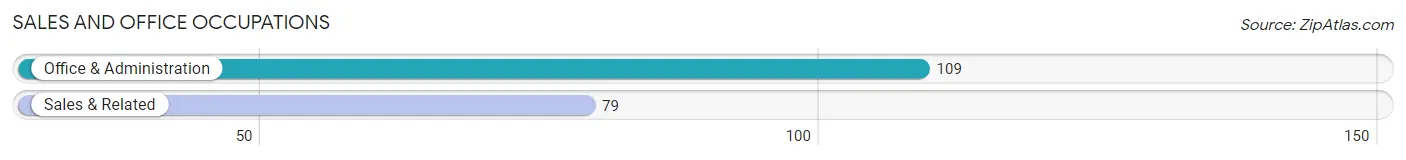
Sales and Office Occupations
The most common Sales and Office occupations in Valmeyer are Office & Administration (109 | 15.1%), and Sales & Related (79 | 10.9%).
Sales and Office Occupations by Sex
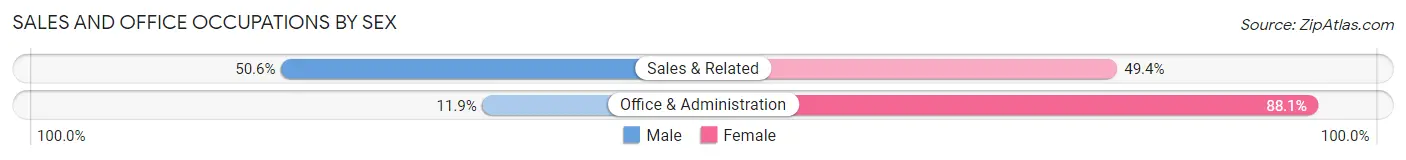
| Occupation | Male | Female |
| Sales & Related | 40 (50.6%) | 39 (49.4%) |
| Office & Administration | 13 (11.9%) | 96 (88.1%) |
| Total (Category) | 53 (28.2%) | 135 (71.8%) |
| Total (Overall) | 376 (52.0%) | 347 (48.0%) |
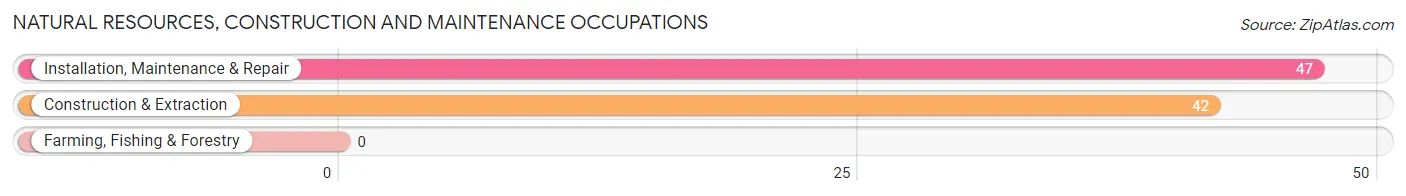
Natural Resources, Construction and Maintenance Occupations
The most common Natural Resources, Construction and Maintenance occupations in Valmeyer are Installation, Maintenance & Repair (47 | 6.5%), and Construction & Extraction (42 | 5.8%).
Natural Resources, Construction and Maintenance Occupations by Sex
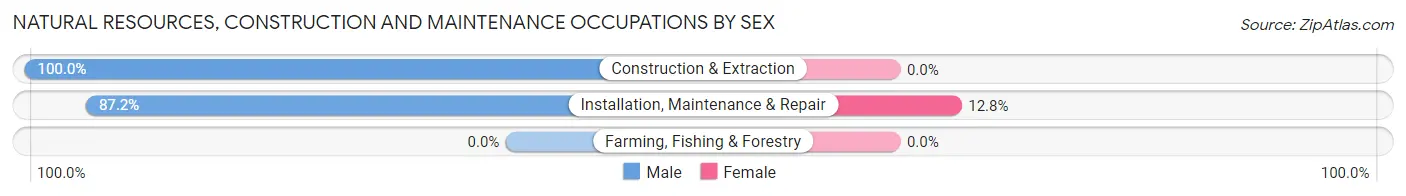
| Occupation | Male | Female |
| Farming, Fishing & Forestry | 0 (0.0%) | 0 (0.0%) |
| Construction & Extraction | 42 (100.0%) | 0 (0.0%) |
| Installation, Maintenance & Repair | 41 (87.2%) | 6 (12.8%) |
| Total (Category) | 83 (93.3%) | 6 (6.7%) |
| Total (Overall) | 376 (52.0%) | 347 (48.0%) |
Production, Transportation and Moving Occupations
The most common Production, Transportation and Moving occupations in Valmeyer are Production (49 | 6.8%), Material Moving (23 | 3.2%), and Transportation (18 | 2.5%).
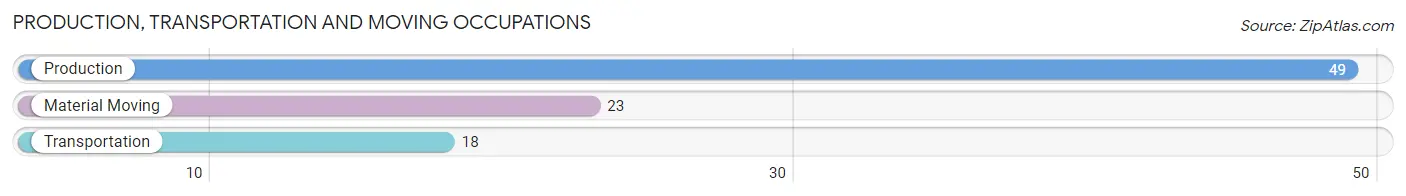
Production, Transportation and Moving Occupations by Sex
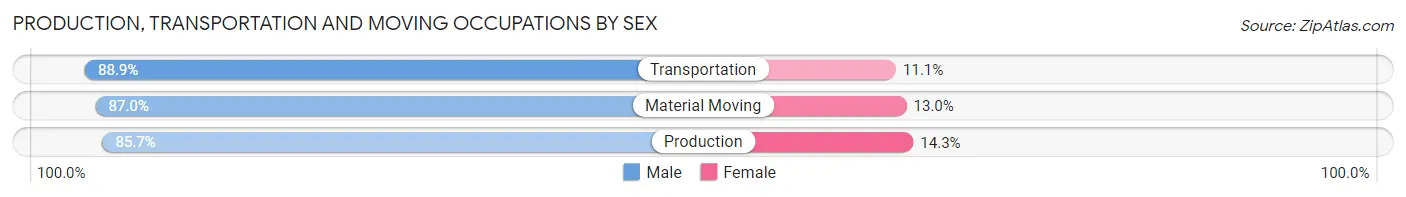
| Occupation | Male | Female |
| Production | 42 (85.7%) | 7 (14.3%) |
| Transportation | 16 (88.9%) | 2 (11.1%) |
| Material Moving | 20 (87.0%) | 3 (13.0%) |
| Total (Category) | 78 (86.7%) | 12 (13.3%) |
| Total (Overall) | 376 (52.0%) | 347 (48.0%) |
Employment Industries by Sex in Valmeyer
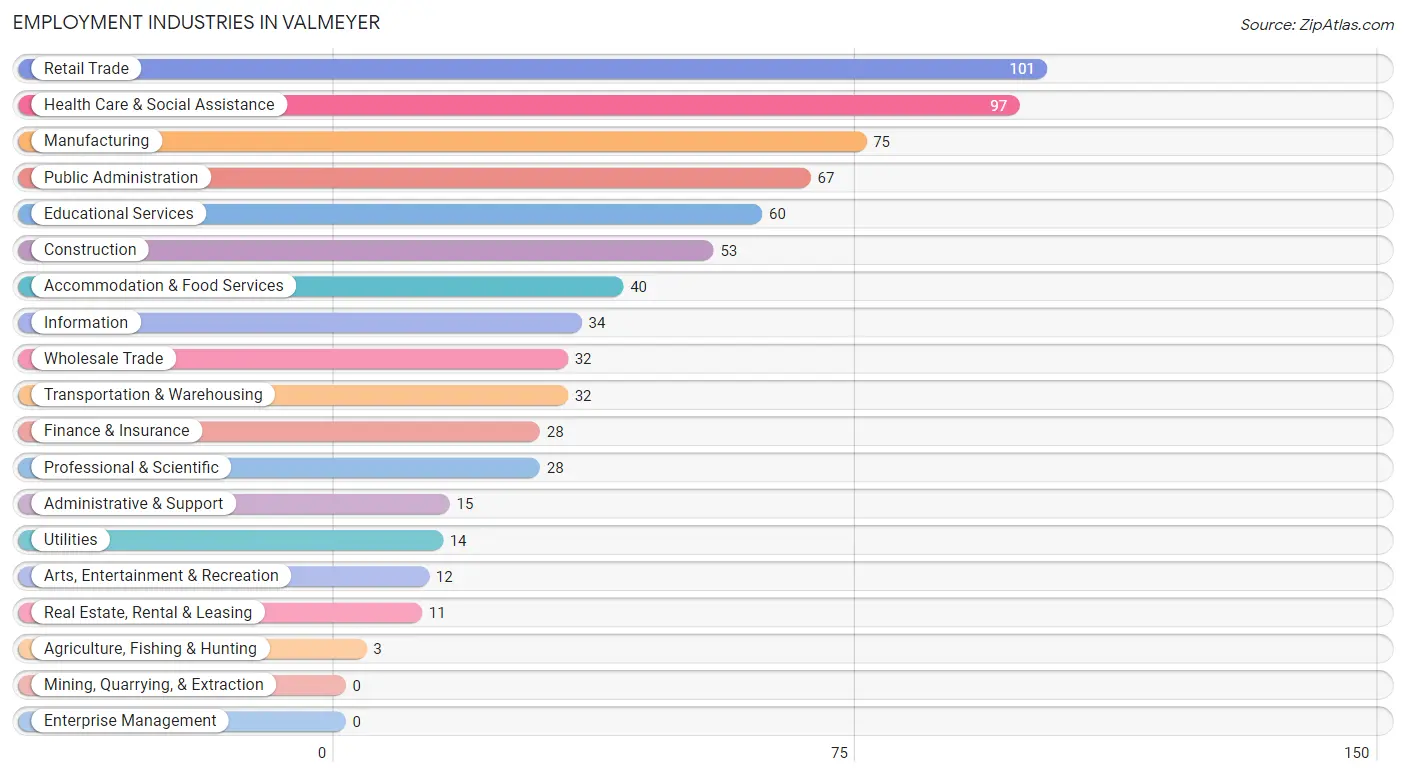
Employment Industries in Valmeyer
The major employment industries in Valmeyer include Retail Trade (101 | 14.0%), Health Care & Social Assistance (97 | 13.4%), Manufacturing (75 | 10.4%), Public Administration (67 | 9.3%), and Educational Services (60 | 8.3%).
Employment Industries by Sex in Valmeyer
The Valmeyer industries that see more men than women are Agriculture, Fishing & Hunting (100.0%), Wholesale Trade (100.0%), and Utilities (100.0%), whereas the industries that tend to have a higher number of women are Health Care & Social Assistance (89.7%), Finance & Insurance (82.1%), and Educational Services (80.0%).
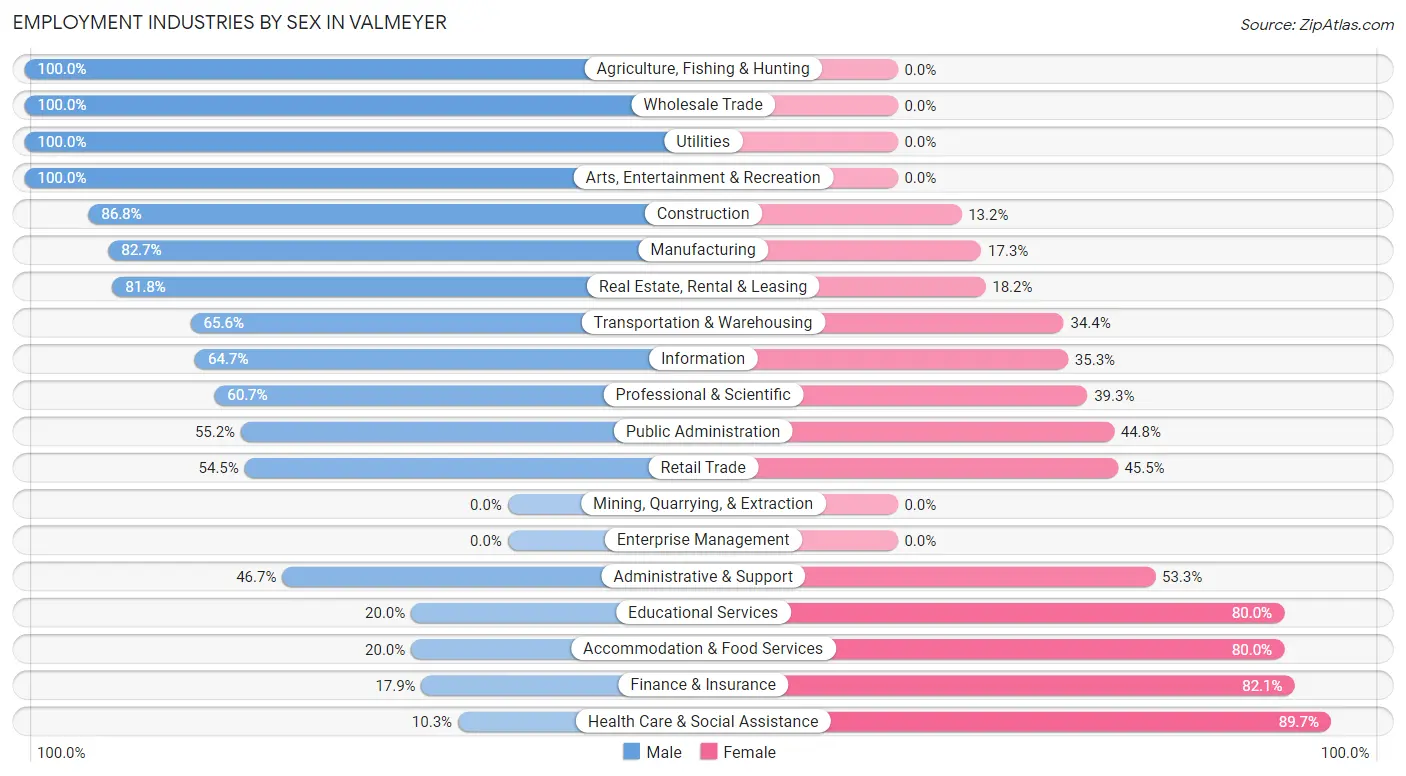
| Industry | Male | Female |
| Agriculture, Fishing & Hunting | 3 (100.0%) | 0 (0.0%) |
| Mining, Quarrying, & Extraction | 0 (0.0%) | 0 (0.0%) |
| Construction | 46 (86.8%) | 7 (13.2%) |
| Manufacturing | 62 (82.7%) | 13 (17.3%) |
| Wholesale Trade | 32 (100.0%) | 0 (0.0%) |
| Retail Trade | 55 (54.5%) | 46 (45.5%) |
| Transportation & Warehousing | 21 (65.6%) | 11 (34.4%) |
| Utilities | 14 (100.0%) | 0 (0.0%) |
| Information | 22 (64.7%) | 12 (35.3%) |
| Finance & Insurance | 5 (17.9%) | 23 (82.1%) |
| Real Estate, Rental & Leasing | 9 (81.8%) | 2 (18.2%) |
| Professional & Scientific | 17 (60.7%) | 11 (39.3%) |
| Enterprise Management | 0 (0.0%) | 0 (0.0%) |
| Administrative & Support | 7 (46.7%) | 8 (53.3%) |
| Educational Services | 12 (20.0%) | 48 (80.0%) |
| Health Care & Social Assistance | 10 (10.3%) | 87 (89.7%) |
| Arts, Entertainment & Recreation | 12 (100.0%) | 0 (0.0%) |
| Accommodation & Food Services | 8 (20.0%) | 32 (80.0%) |
| Public Administration | 37 (55.2%) | 30 (44.8%) |
| Total | 376 (52.0%) | 347 (48.0%) |
Education in Valmeyer
School Enrollment in Valmeyer
The most common levels of schooling among the 242 students in Valmeyer are high school (95 | 39.3%), middle school (57 | 23.5%), and college / undergraduate (35 | 14.5%).
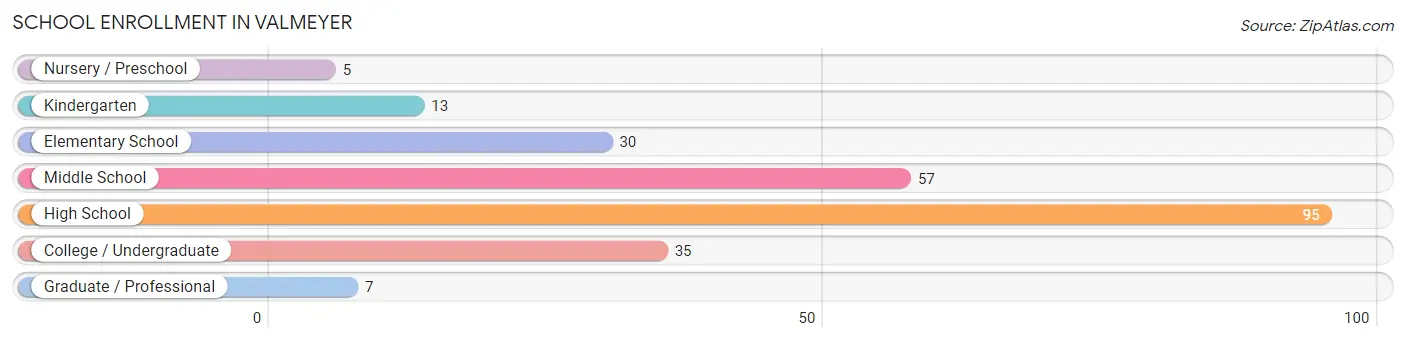
| School Level | # Students | % Students |
| Nursery / Preschool | 5 | 2.1% |
| Kindergarten | 13 | 5.4% |
| Elementary School | 30 | 12.4% |
| Middle School | 57 | 23.5% |
| High School | 95 | 39.3% |
| College / Undergraduate | 35 | 14.5% |
| Graduate / Professional | 7 | 2.9% |
| Total | 242 | 100.0% |
School Enrollment by Age by Funding Source in Valmeyer
Out of a total of 242 students who are enrolled in schools in Valmeyer, 38 (15.7%) attend a private institution, while the remaining 204 (84.3%) are enrolled in public schools. The age group of 3 to 4 year olds has the highest likelihood of being enrolled in private schools, with 5 (100.0% in the age bracket) enrolled. Conversely, the age group of 5 to 9 year old has the lowest likelihood of being enrolled in a private school, with 32 (100.0% in the age bracket) attending a public institution.
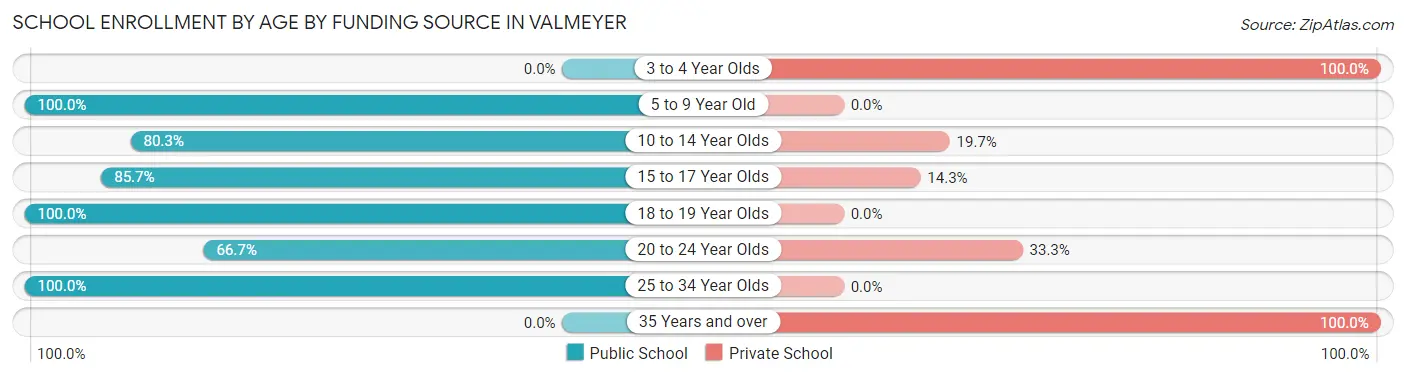
| Age Bracket | Public School | Private School |
| 3 to 4 Year Olds | 0 (0.0%) | 5 (100.0%) |
| 5 to 9 Year Old | 32 (100.0%) | 0 (0.0%) |
| 10 to 14 Year Olds | 61 (80.3%) | 15 (19.7%) |
| 15 to 17 Year Olds | 66 (85.7%) | 11 (14.3%) |
| 18 to 19 Year Olds | 24 (100.0%) | 0 (0.0%) |
| 20 to 24 Year Olds | 8 (66.7%) | 4 (33.3%) |
| 25 to 34 Year Olds | 13 (100.0%) | 0 (0.0%) |
| 35 Years and over | 0 (0.0%) | 3 (100.0%) |
| Total | 204 (84.3%) | 38 (15.7%) |
Educational Attainment by Field of Study in Valmeyer
Business (54 | 25.4%), science & technology (41 | 19.3%), arts & humanities (37 | 17.4%), education (27 | 12.7%), and bio, nature & agricultural (22 | 10.3%) are the most common fields of study among 213 individuals in Valmeyer who have obtained a bachelor's degree or higher.
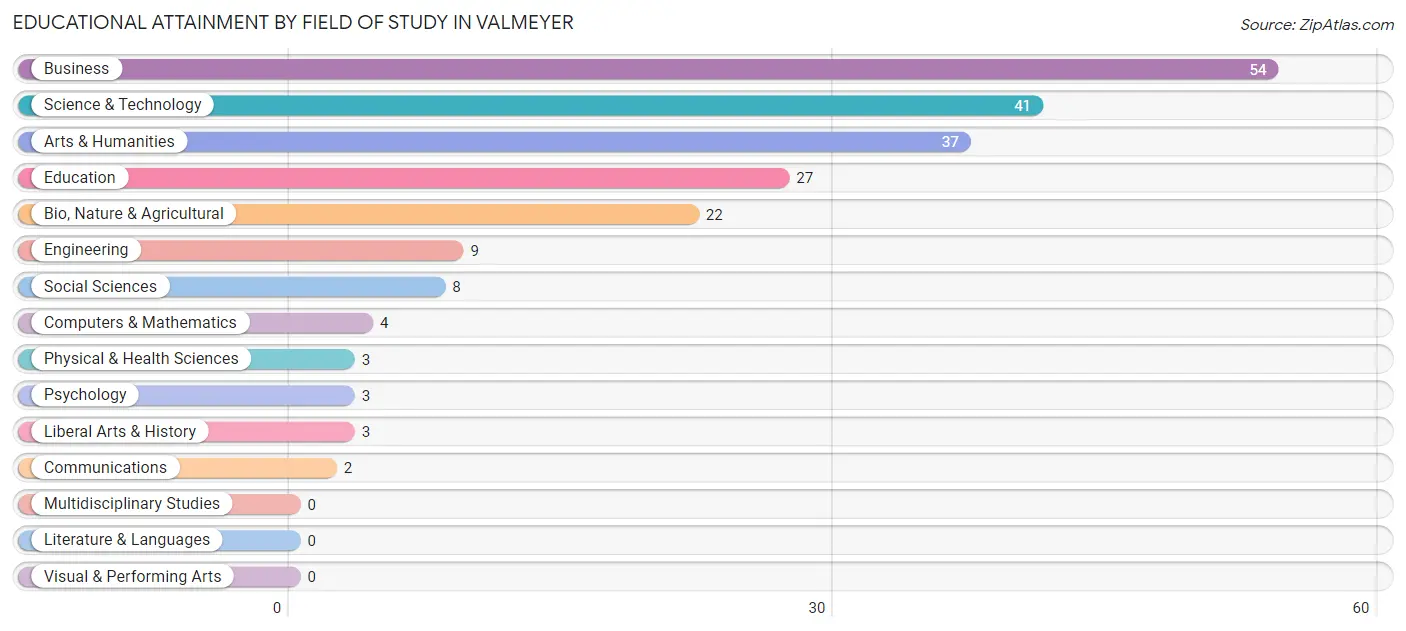
| Field of Study | # Graduates | % Graduates |
| Computers & Mathematics | 4 | 1.9% |
| Bio, Nature & Agricultural | 22 | 10.3% |
| Physical & Health Sciences | 3 | 1.4% |
| Psychology | 3 | 1.4% |
| Social Sciences | 8 | 3.8% |
| Engineering | 9 | 4.2% |
| Multidisciplinary Studies | 0 | 0.0% |
| Science & Technology | 41 | 19.3% |
| Business | 54 | 25.4% |
| Education | 27 | 12.7% |
| Literature & Languages | 0 | 0.0% |
| Liberal Arts & History | 3 | 1.4% |
| Visual & Performing Arts | 0 | 0.0% |
| Communications | 2 | 0.9% |
| Arts & Humanities | 37 | 17.4% |
| Total | 213 | 100.0% |
Transportation & Commute in Valmeyer
Vehicle Availability by Sex in Valmeyer
The most prevalent vehicle ownership categories in Valmeyer are males with 3 vehicles (133, accounting for 35.4%) and females with 3 vehicles (133, making up 39.5%).
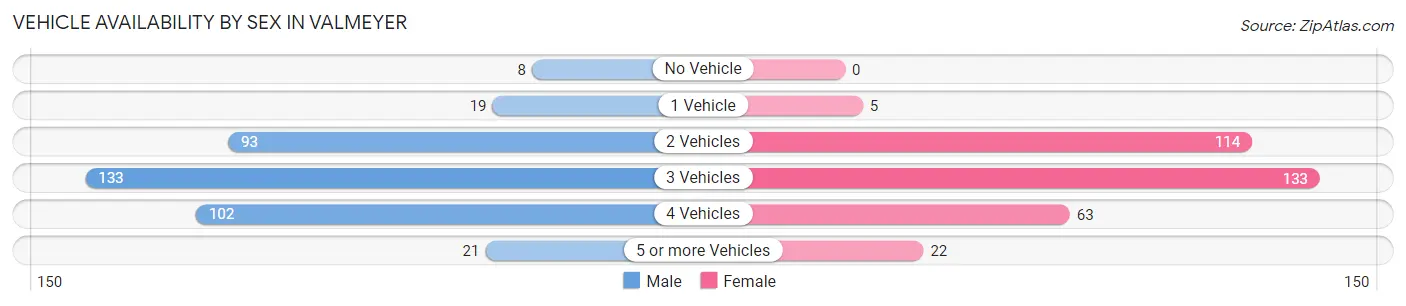
| Vehicles Available | Male | Female |
| No Vehicle | 8 (2.1%) | 0 (0.0%) |
| 1 Vehicle | 19 (5.1%) | 5 (1.5%) |
| 2 Vehicles | 93 (24.7%) | 114 (33.8%) |
| 3 Vehicles | 133 (35.4%) | 133 (39.5%) |
| 4 Vehicles | 102 (27.1%) | 63 (18.7%) |
| 5 or more Vehicles | 21 (5.6%) | 22 (6.5%) |
| Total | 376 (100.0%) | 337 (100.0%) |
Commute Time in Valmeyer
The most frequently occuring commute durations in Valmeyer are 45 to 59 minutes (179 commuters, 27.3%), 15 to 19 minutes (97 commuters, 14.8%), and 5 to 9 minutes (72 commuters, 11.0%).
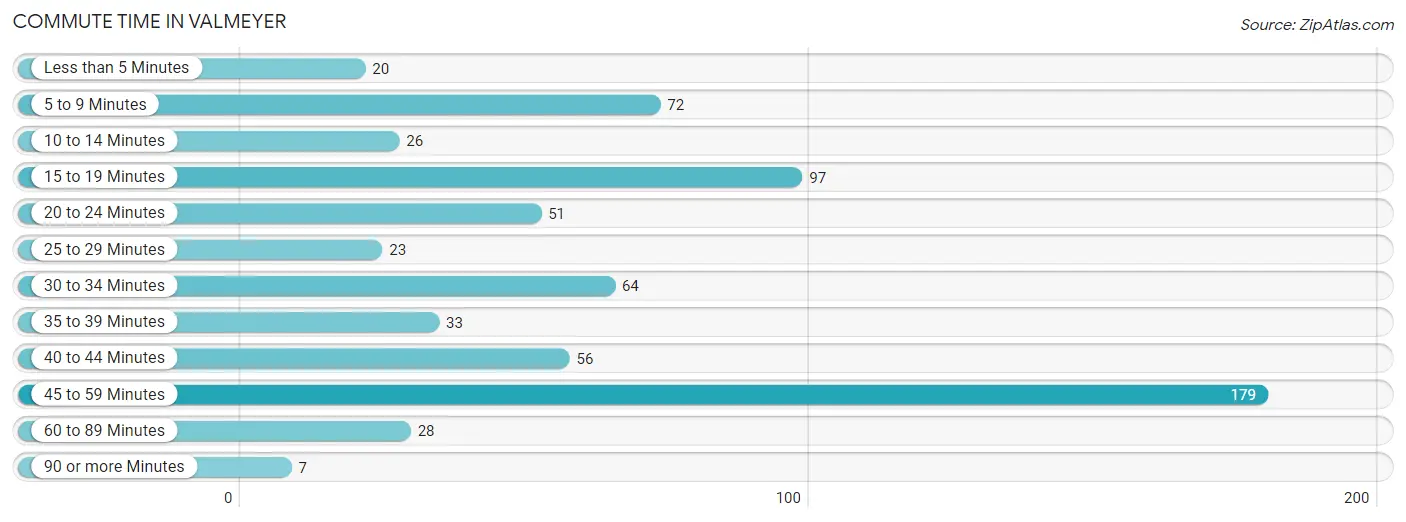
| Commute Time | # Commuters | % Commuters |
| Less than 5 Minutes | 20 | 3.0% |
| 5 to 9 Minutes | 72 | 11.0% |
| 10 to 14 Minutes | 26 | 4.0% |
| 15 to 19 Minutes | 97 | 14.8% |
| 20 to 24 Minutes | 51 | 7.8% |
| 25 to 29 Minutes | 23 | 3.5% |
| 30 to 34 Minutes | 64 | 9.8% |
| 35 to 39 Minutes | 33 | 5.0% |
| 40 to 44 Minutes | 56 | 8.5% |
| 45 to 59 Minutes | 179 | 27.3% |
| 60 to 89 Minutes | 28 | 4.3% |
| 90 or more Minutes | 7 | 1.1% |
Commute Time by Sex in Valmeyer
The most common commute times in Valmeyer are 45 to 59 minutes (109 commuters, 31.8%) for males and 15 to 19 minutes (78 commuters, 24.9%) for females.
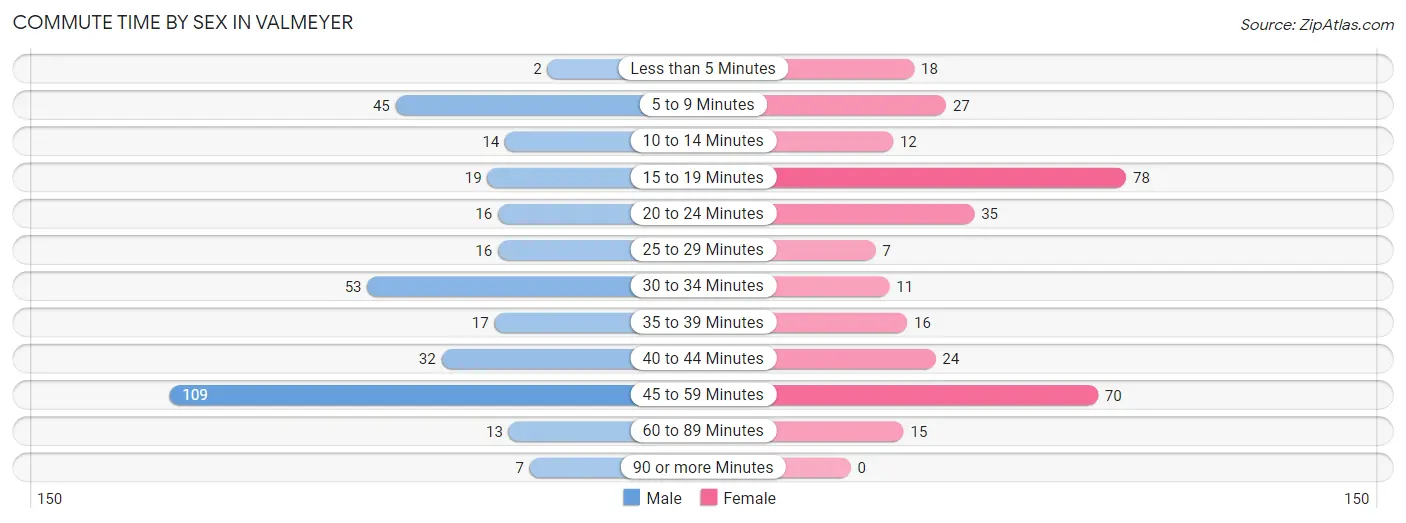
| Commute Time | Male | Female |
| Less than 5 Minutes | 2 (0.6%) | 18 (5.8%) |
| 5 to 9 Minutes | 45 (13.1%) | 27 (8.6%) |
| 10 to 14 Minutes | 14 (4.1%) | 12 (3.8%) |
| 15 to 19 Minutes | 19 (5.5%) | 78 (24.9%) |
| 20 to 24 Minutes | 16 (4.7%) | 35 (11.2%) |
| 25 to 29 Minutes | 16 (4.7%) | 7 (2.2%) |
| 30 to 34 Minutes | 53 (15.4%) | 11 (3.5%) |
| 35 to 39 Minutes | 17 (5.0%) | 16 (5.1%) |
| 40 to 44 Minutes | 32 (9.3%) | 24 (7.7%) |
| 45 to 59 Minutes | 109 (31.8%) | 70 (22.4%) |
| 60 to 89 Minutes | 13 (3.8%) | 15 (4.8%) |
| 90 or more Minutes | 7 (2.0%) | 0 (0.0%) |
Time of Departure to Work by Sex in Valmeyer
The most frequent times of departure to work in Valmeyer are 7:30 AM to 7:59 AM (79, 23.0%) for males and 7:00 AM to 7:29 AM (88, 28.1%) for females.
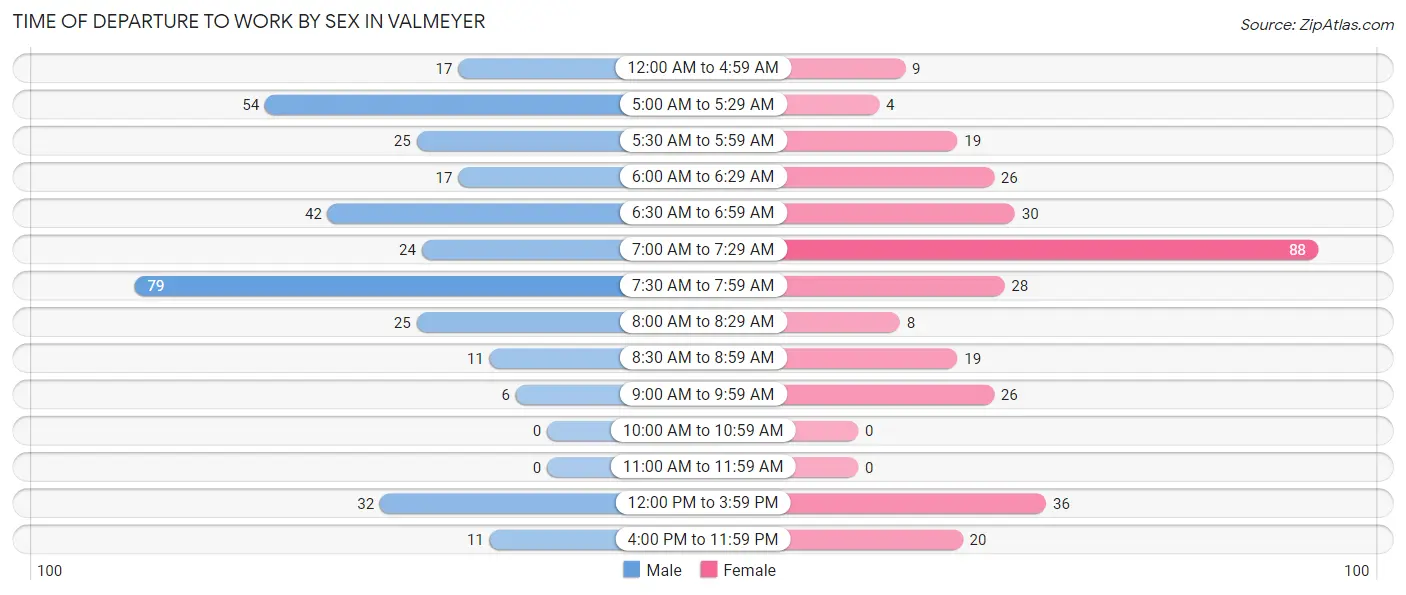
| Time of Departure | Male | Female |
| 12:00 AM to 4:59 AM | 17 (5.0%) | 9 (2.9%) |
| 5:00 AM to 5:29 AM | 54 (15.7%) | 4 (1.3%) |
| 5:30 AM to 5:59 AM | 25 (7.3%) | 19 (6.1%) |
| 6:00 AM to 6:29 AM | 17 (5.0%) | 26 (8.3%) |
| 6:30 AM to 6:59 AM | 42 (12.2%) | 30 (9.6%) |
| 7:00 AM to 7:29 AM | 24 (7.0%) | 88 (28.1%) |
| 7:30 AM to 7:59 AM | 79 (23.0%) | 28 (8.9%) |
| 8:00 AM to 8:29 AM | 25 (7.3%) | 8 (2.6%) |
| 8:30 AM to 8:59 AM | 11 (3.2%) | 19 (6.1%) |
| 9:00 AM to 9:59 AM | 6 (1.8%) | 26 (8.3%) |
| 10:00 AM to 10:59 AM | 0 (0.0%) | 0 (0.0%) |
| 11:00 AM to 11:59 AM | 0 (0.0%) | 0 (0.0%) |
| 12:00 PM to 3:59 PM | 32 (9.3%) | 36 (11.5%) |
| 4:00 PM to 11:59 PM | 11 (3.2%) | 20 (6.4%) |
| Total | 343 (100.0%) | 313 (100.0%) |
Housing Occupancy in Valmeyer
Occupancy by Ownership in Valmeyer
Of the total 436 dwellings in Valmeyer, owner-occupied units account for 340 (78.0%), while renter-occupied units make up 96 (22.0%).
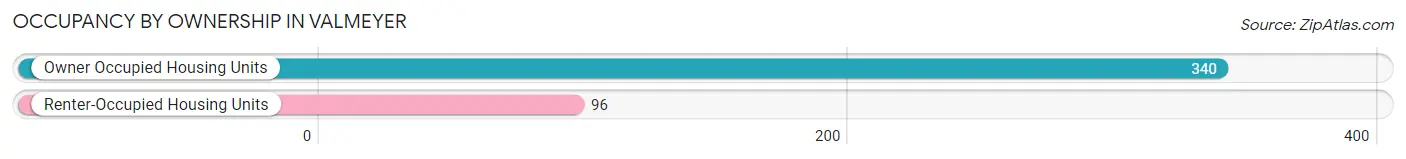
| Occupancy | # Housing Units | % Housing Units |
| Owner Occupied Housing Units | 340 | 78.0% |
| Renter-Occupied Housing Units | 96 | 22.0% |
| Total Occupied Housing Units | 436 | 100.0% |
Occupancy by Household Size in Valmeyer
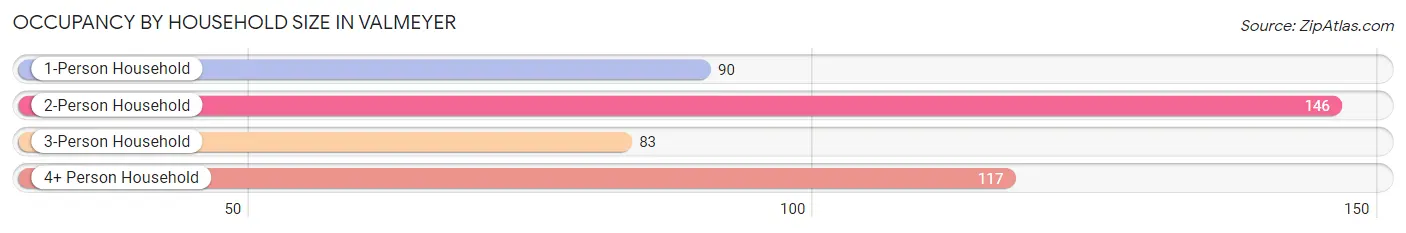
| Household Size | # Housing Units | % Housing Units |
| 1-Person Household | 90 | 20.6% |
| 2-Person Household | 146 | 33.5% |
| 3-Person Household | 83 | 19.0% |
| 4+ Person Household | 117 | 26.8% |
| Total Housing Units | 436 | 100.0% |
Occupancy by Ownership by Household Size in Valmeyer
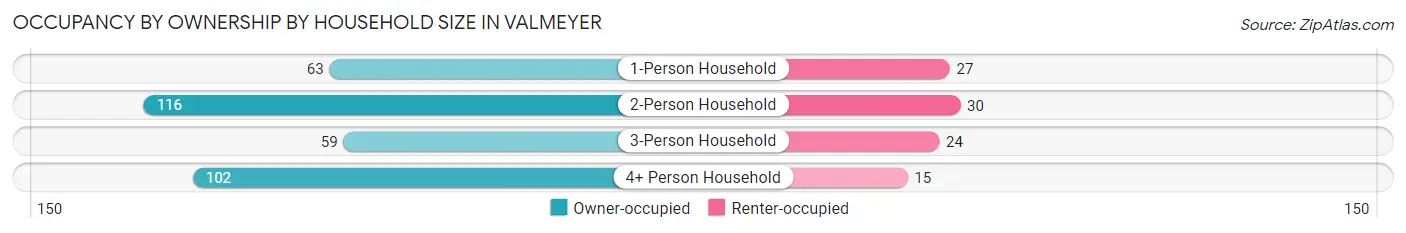
| Household Size | Owner-occupied | Renter-occupied |
| 1-Person Household | 63 (70.0%) | 27 (30.0%) |
| 2-Person Household | 116 (79.4%) | 30 (20.5%) |
| 3-Person Household | 59 (71.1%) | 24 (28.9%) |
| 4+ Person Household | 102 (87.2%) | 15 (12.8%) |
| Total Housing Units | 340 (78.0%) | 96 (22.0%) |
Occupancy by Educational Attainment in Valmeyer
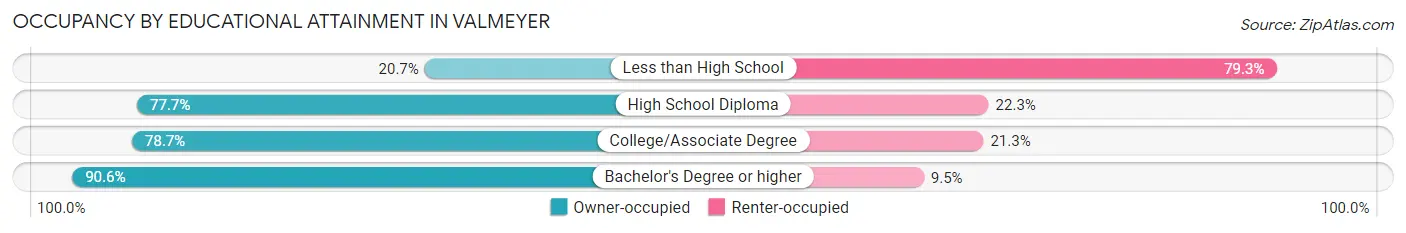
| Household Size | Owner-occupied | Renter-occupied |
| Less than High School | 6 (20.7%) | 23 (79.3%) |
| High School Diploma | 108 (77.7%) | 31 (22.3%) |
| College/Associate Degree | 111 (78.7%) | 30 (21.3%) |
| Bachelor's Degree or higher | 115 (90.5%) | 12 (9.5%) |
Occupancy by Age of Householder in Valmeyer
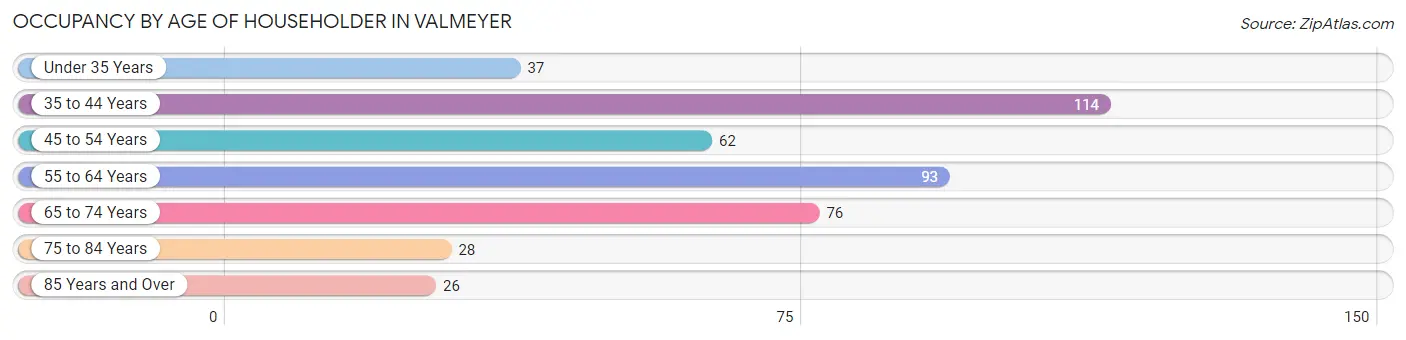
| Age Bracket | # Households | % Households |
| Under 35 Years | 37 | 8.5% |
| 35 to 44 Years | 114 | 26.2% |
| 45 to 54 Years | 62 | 14.2% |
| 55 to 64 Years | 93 | 21.3% |
| 65 to 74 Years | 76 | 17.4% |
| 75 to 84 Years | 28 | 6.4% |
| 85 Years and Over | 26 | 6.0% |
| Total | 436 | 100.0% |
Housing Finances in Valmeyer
Median Income by Occupancy in Valmeyer
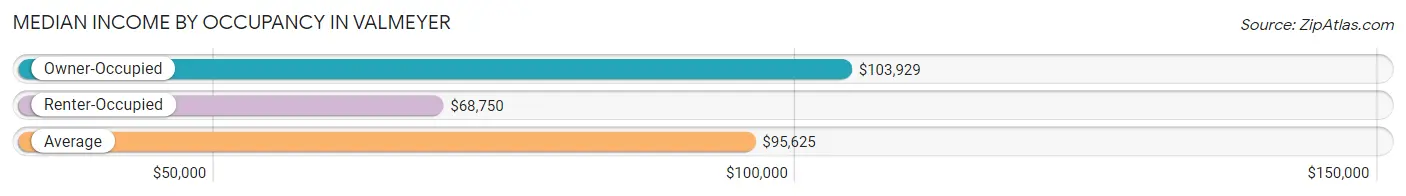
| Occupancy Type | # Households | Median Income |
| Owner-Occupied | 340 (78.0%) | $103,929 |
| Renter-Occupied | 96 (22.0%) | $68,750 |
| Average | 436 (100.0%) | $95,625 |
Occupancy by Householder Income Bracket in Valmeyer
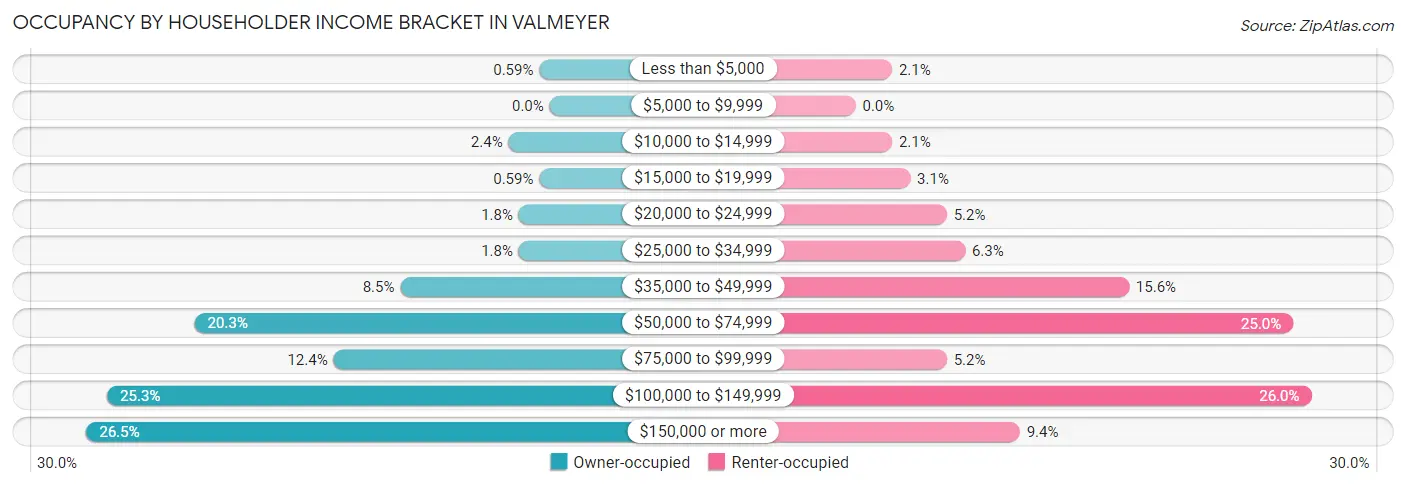
| Income Bracket | Owner-occupied | Renter-occupied |
| Less than $5,000 | 2 (0.6%) | 2 (2.1%) |
| $5,000 to $9,999 | 0 (0.0%) | 0 (0.0%) |
| $10,000 to $14,999 | 8 (2.4%) | 2 (2.1%) |
| $15,000 to $19,999 | 2 (0.6%) | 3 (3.1%) |
| $20,000 to $24,999 | 6 (1.8%) | 5 (5.2%) |
| $25,000 to $34,999 | 6 (1.8%) | 6 (6.2%) |
| $35,000 to $49,999 | 29 (8.5%) | 15 (15.6%) |
| $50,000 to $74,999 | 69 (20.3%) | 24 (25.0%) |
| $75,000 to $99,999 | 42 (12.3%) | 5 (5.2%) |
| $100,000 to $149,999 | 86 (25.3%) | 25 (26.0%) |
| $150,000 or more | 90 (26.5%) | 9 (9.4%) |
| Total | 340 (100.0%) | 96 (100.0%) |
Monthly Housing Cost Tiers in Valmeyer
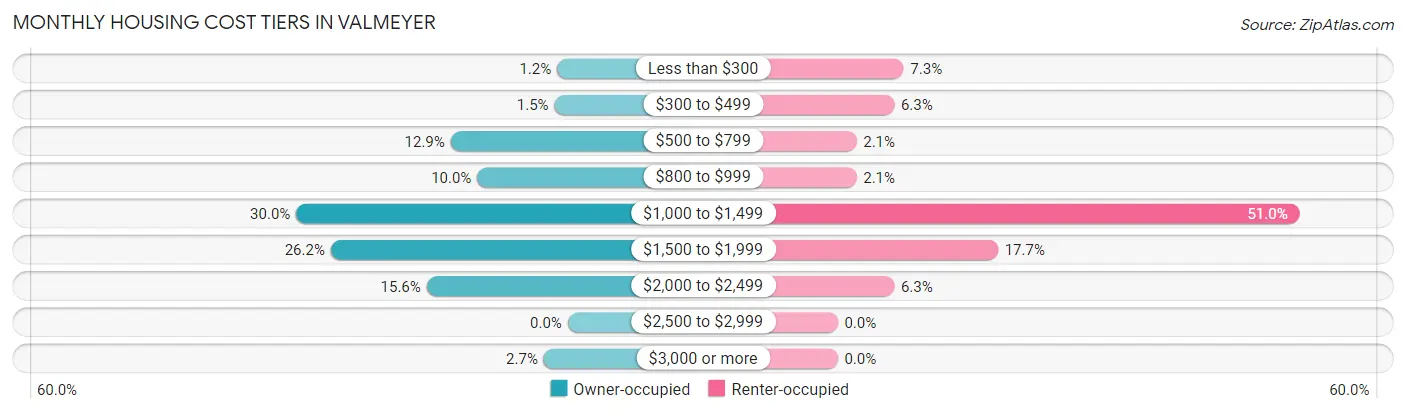
| Monthly Cost | Owner-occupied | Renter-occupied |
| Less than $300 | 4 (1.2%) | 7 (7.3%) |
| $300 to $499 | 5 (1.5%) | 6 (6.2%) |
| $500 to $799 | 44 (12.9%) | 2 (2.1%) |
| $800 to $999 | 34 (10.0%) | 2 (2.1%) |
| $1,000 to $1,499 | 102 (30.0%) | 49 (51.0%) |
| $1,500 to $1,999 | 89 (26.2%) | 17 (17.7%) |
| $2,000 to $2,499 | 53 (15.6%) | 6 (6.2%) |
| $2,500 to $2,999 | 0 (0.0%) | 0 (0.0%) |
| $3,000 or more | 9 (2.6%) | 0 (0.0%) |
| Total | 340 (100.0%) | 96 (100.0%) |
Physical Housing Characteristics in Valmeyer
Housing Structures in Valmeyer
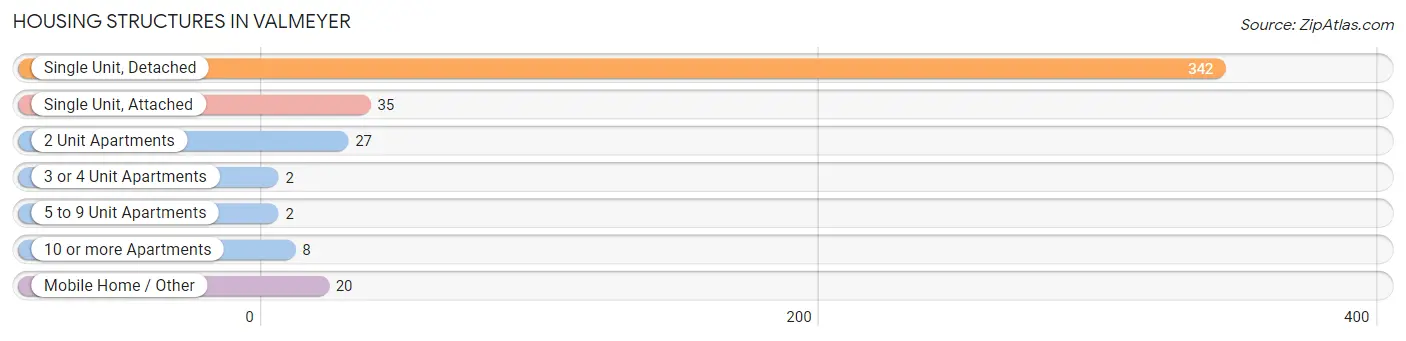
| Structure Type | # Housing Units | % Housing Units |
| Single Unit, Detached | 342 | 78.4% |
| Single Unit, Attached | 35 | 8.0% |
| 2 Unit Apartments | 27 | 6.2% |
| 3 or 4 Unit Apartments | 2 | 0.5% |
| 5 to 9 Unit Apartments | 2 | 0.5% |
| 10 or more Apartments | 8 | 1.8% |
| Mobile Home / Other | 20 | 4.6% |
| Total | 436 | 100.0% |
Housing Structures by Occupancy in Valmeyer
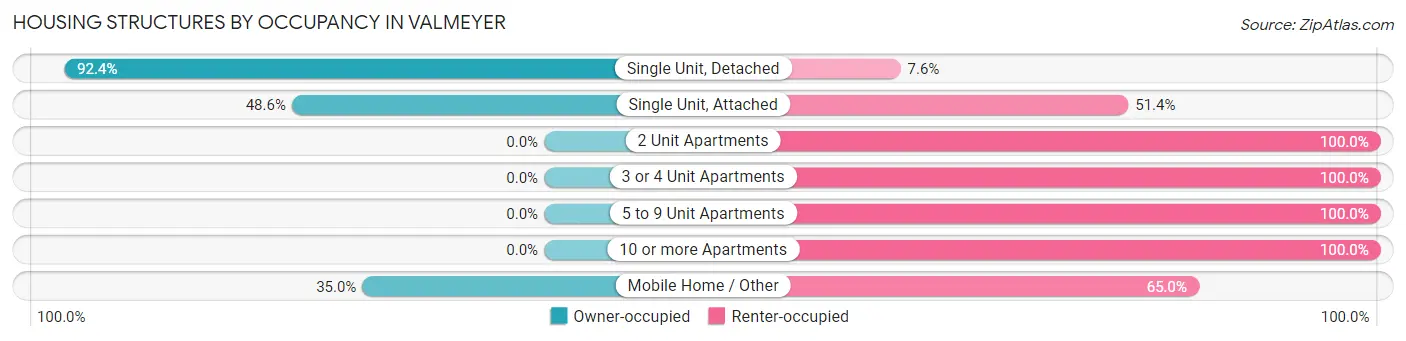
| Structure Type | Owner-occupied | Renter-occupied |
| Single Unit, Detached | 316 (92.4%) | 26 (7.6%) |
| Single Unit, Attached | 17 (48.6%) | 18 (51.4%) |
| 2 Unit Apartments | 0 (0.0%) | 27 (100.0%) |
| 3 or 4 Unit Apartments | 0 (0.0%) | 2 (100.0%) |
| 5 to 9 Unit Apartments | 0 (0.0%) | 2 (100.0%) |
| 10 or more Apartments | 0 (0.0%) | 8 (100.0%) |
| Mobile Home / Other | 7 (35.0%) | 13 (65.0%) |
| Total | 340 (78.0%) | 96 (22.0%) |
Housing Structures by Number of Rooms in Valmeyer
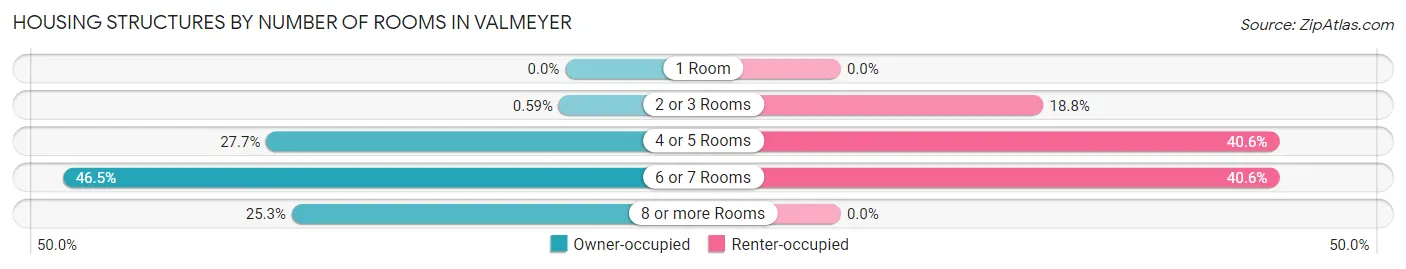
| Number of Rooms | Owner-occupied | Renter-occupied |
| 1 Room | 0 (0.0%) | 0 (0.0%) |
| 2 or 3 Rooms | 2 (0.6%) | 18 (18.8%) |
| 4 or 5 Rooms | 94 (27.7%) | 39 (40.6%) |
| 6 or 7 Rooms | 158 (46.5%) | 39 (40.6%) |
| 8 or more Rooms | 86 (25.3%) | 0 (0.0%) |
| Total | 340 (100.0%) | 96 (100.0%) |
Housing Structure by Heating Type in Valmeyer
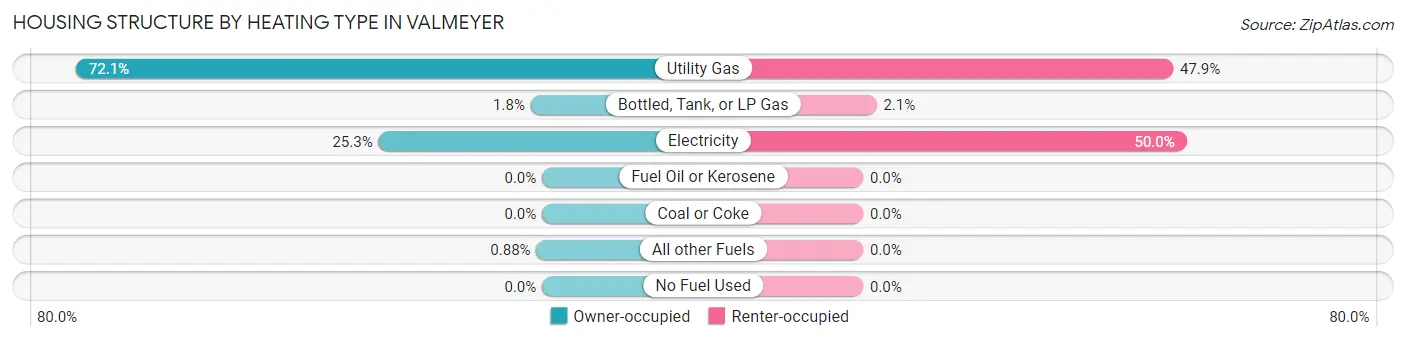
| Heating Type | Owner-occupied | Renter-occupied |
| Utility Gas | 245 (72.1%) | 46 (47.9%) |
| Bottled, Tank, or LP Gas | 6 (1.8%) | 2 (2.1%) |
| Electricity | 86 (25.3%) | 48 (50.0%) |
| Fuel Oil or Kerosene | 0 (0.0%) | 0 (0.0%) |
| Coal or Coke | 0 (0.0%) | 0 (0.0%) |
| All other Fuels | 3 (0.9%) | 0 (0.0%) |
| No Fuel Used | 0 (0.0%) | 0 (0.0%) |
| Total | 340 (100.0%) | 96 (100.0%) |
Household Vehicle Usage in Valmeyer
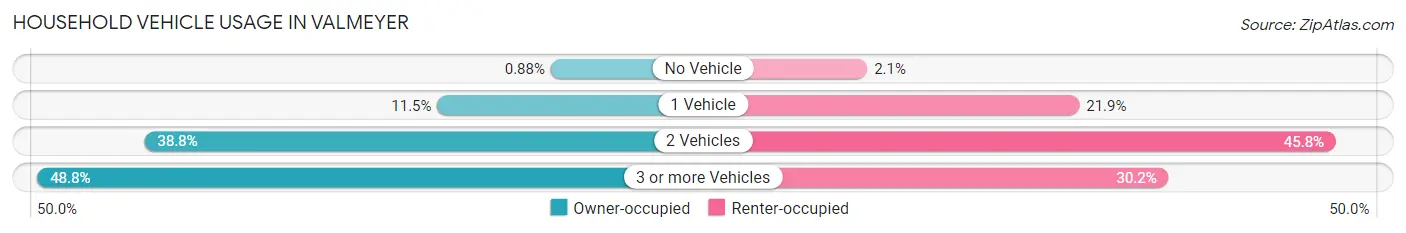
| Vehicles per Household | Owner-occupied | Renter-occupied |
| No Vehicle | 3 (0.9%) | 2 (2.1%) |
| 1 Vehicle | 39 (11.5%) | 21 (21.9%) |
| 2 Vehicles | 132 (38.8%) | 44 (45.8%) |
| 3 or more Vehicles | 166 (48.8%) | 29 (30.2%) |
| Total | 340 (100.0%) | 96 (100.0%) |
Real Estate & Mortgages in Valmeyer
Real Estate and Mortgage Overview in Valmeyer
| Characteristic | Without Mortgage | With Mortgage |
| Housing Units | 65 | 275 |
| Median Property Value | $178,100 | $188,000 |
| Median Household Income | $61,750 | $84 |
| Monthly Housing Costs | $686 | $9 |
| Real Estate Taxes | $3,806 | $3 |
Property Value by Mortgage Status in Valmeyer
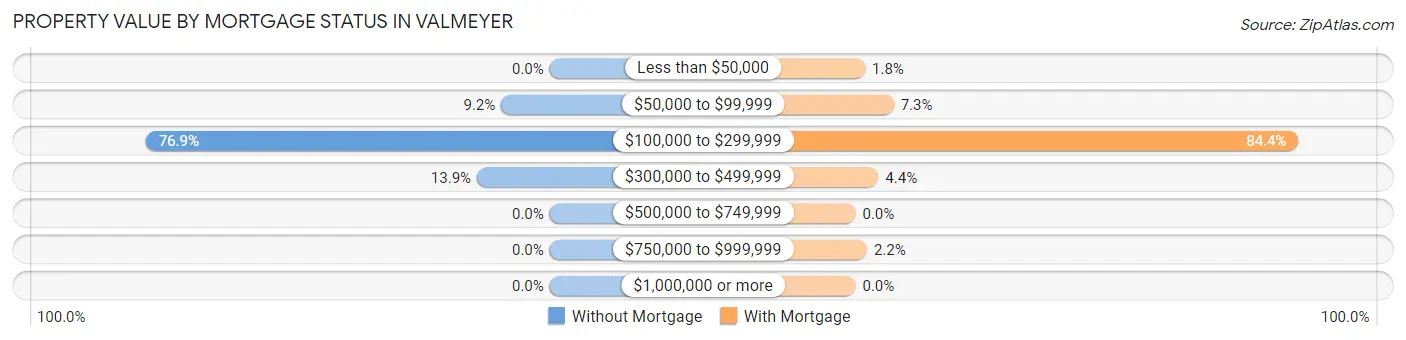
| Property Value | Without Mortgage | With Mortgage |
| Less than $50,000 | 0 (0.0%) | 5 (1.8%) |
| $50,000 to $99,999 | 6 (9.2%) | 20 (7.3%) |
| $100,000 to $299,999 | 50 (76.9%) | 232 (84.4%) |
| $300,000 to $499,999 | 9 (13.9%) | 12 (4.4%) |
| $500,000 to $749,999 | 0 (0.0%) | 0 (0.0%) |
| $750,000 to $999,999 | 0 (0.0%) | 6 (2.2%) |
| $1,000,000 or more | 0 (0.0%) | 0 (0.0%) |
| Total | 65 (100.0%) | 275 (100.0%) |
Household Income by Mortgage Status in Valmeyer
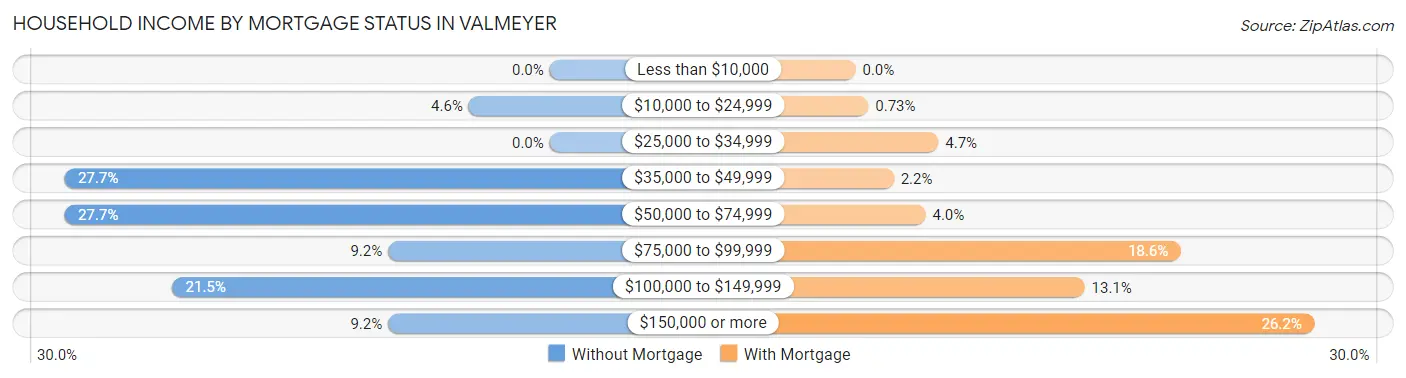
| Household Income | Without Mortgage | With Mortgage |
| Less than $10,000 | 0 (0.0%) | 0 (0.0%) |
| $10,000 to $24,999 | 3 (4.6%) | 2 (0.7%) |
| $25,000 to $34,999 | 0 (0.0%) | 13 (4.7%) |
| $35,000 to $49,999 | 18 (27.7%) | 6 (2.2%) |
| $50,000 to $74,999 | 18 (27.7%) | 11 (4.0%) |
| $75,000 to $99,999 | 6 (9.2%) | 51 (18.5%) |
| $100,000 to $149,999 | 14 (21.5%) | 36 (13.1%) |
| $150,000 or more | 6 (9.2%) | 72 (26.2%) |
| Total | 65 (100.0%) | 275 (100.0%) |
Property Value to Household Income Ratio in Valmeyer
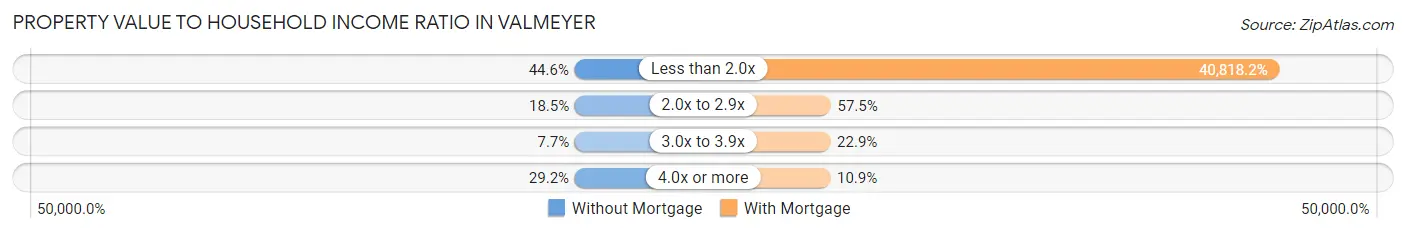
| Value-to-Income Ratio | Without Mortgage | With Mortgage |
| Less than 2.0x | 29 (44.6%) | 112,250 (40,818.2%) |
| 2.0x to 2.9x | 12 (18.5%) | 158 (57.5%) |
| 3.0x to 3.9x | 5 (7.7%) | 63 (22.9%) |
| 4.0x or more | 19 (29.2%) | 30 (10.9%) |
| Total | 65 (100.0%) | 275 (100.0%) |
Real Estate Taxes by Mortgage Status in Valmeyer
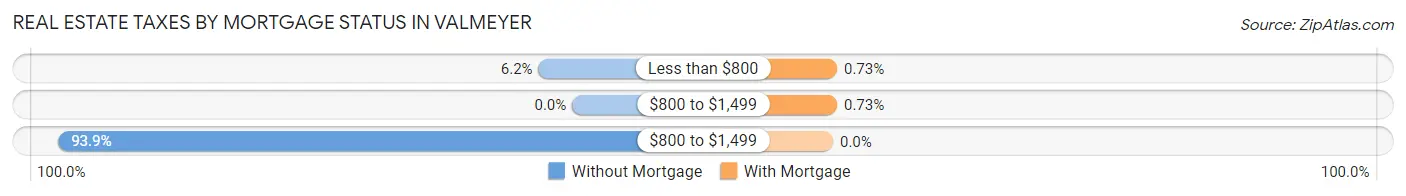
| Property Taxes | Without Mortgage | With Mortgage |
| Less than $800 | 4 (6.1%) | 2 (0.7%) |
| $800 to $1,499 | 0 (0.0%) | 2 (0.7%) |
| $800 to $1,499 | 61 (93.9%) | 0 (0.0%) |
| Total | 65 (100.0%) | 275 (100.0%) |
Health & Disability in Valmeyer
Health Insurance Coverage by Age in Valmeyer
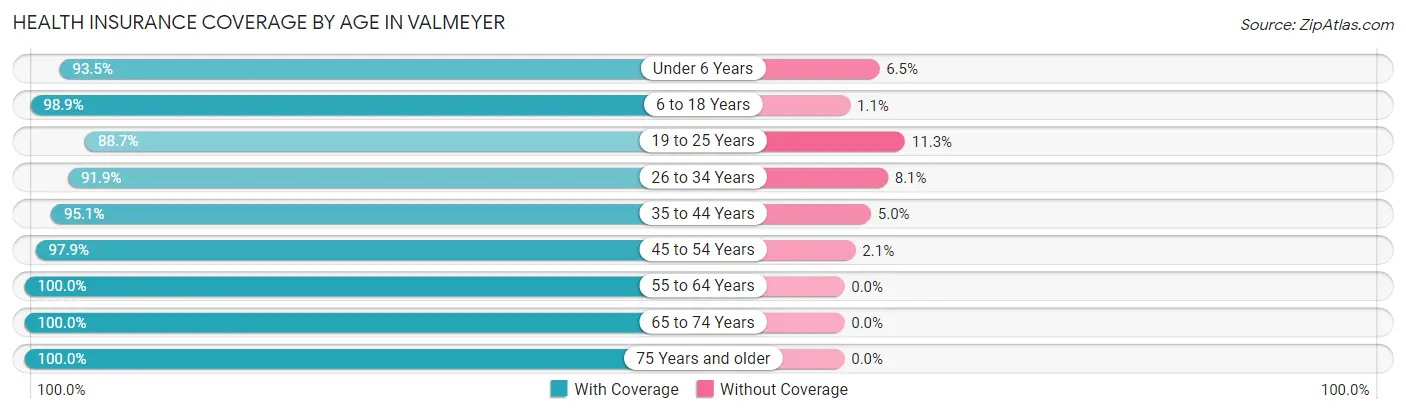
| Age Bracket | With Coverage | Without Coverage |
| Under 6 Years | 43 (93.5%) | 3 (6.5%) |
| 6 to 18 Years | 183 (98.9%) | 2 (1.1%) |
| 19 to 25 Years | 102 (88.7%) | 13 (11.3%) |
| 26 to 34 Years | 102 (91.9%) | 9 (8.1%) |
| 35 to 44 Years | 192 (95.1%) | 10 (5.0%) |
| 45 to 54 Years | 142 (97.9%) | 3 (2.1%) |
| 55 to 64 Years | 175 (100.0%) | 0 (0.0%) |
| 65 to 74 Years | 137 (100.0%) | 0 (0.0%) |
| 75 Years and older | 80 (100.0%) | 0 (0.0%) |
| Total | 1,156 (96.7%) | 40 (3.3%) |
Health Insurance Coverage by Citizenship Status in Valmeyer
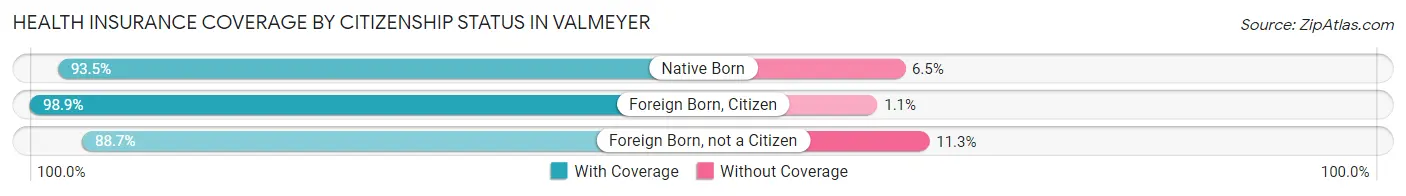
| Citizenship Status | With Coverage | Without Coverage |
| Native Born | 43 (93.5%) | 3 (6.5%) |
| Foreign Born, Citizen | 183 (98.9%) | 2 (1.1%) |
| Foreign Born, not a Citizen | 102 (88.7%) | 13 (11.3%) |
Health Insurance Coverage by Household Income in Valmeyer
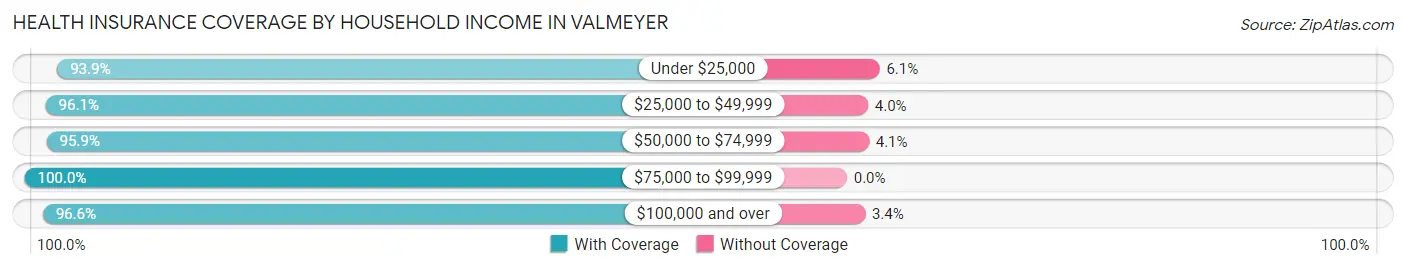
| Household Income | With Coverage | Without Coverage |
| Under $25,000 | 46 (93.9%) | 3 (6.1%) |
| $25,000 to $49,999 | 73 (96.1%) | 3 (4.0%) |
| $50,000 to $74,999 | 233 (95.9%) | 10 (4.1%) |
| $75,000 to $99,999 | 123 (100.0%) | 0 (0.0%) |
| $100,000 and over | 681 (96.6%) | 24 (3.4%) |
Public vs Private Health Insurance Coverage by Age in Valmeyer
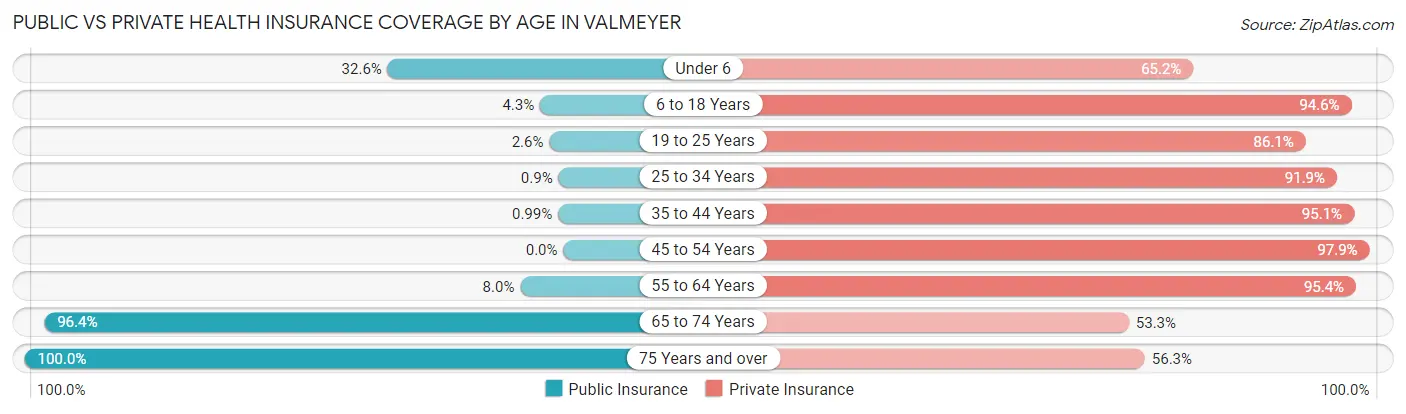
| Age Bracket | Public Insurance | Private Insurance |
| Under 6 | 15 (32.6%) | 30 (65.2%) |
| 6 to 18 Years | 8 (4.3%) | 175 (94.6%) |
| 19 to 25 Years | 3 (2.6%) | 99 (86.1%) |
| 25 to 34 Years | 1 (0.9%) | 102 (91.9%) |
| 35 to 44 Years | 2 (1.0%) | 192 (95.1%) |
| 45 to 54 Years | 0 (0.0%) | 142 (97.9%) |
| 55 to 64 Years | 14 (8.0%) | 167 (95.4%) |
| 65 to 74 Years | 132 (96.4%) | 73 (53.3%) |
| 75 Years and over | 80 (100.0%) | 45 (56.2%) |
| Total | 255 (21.3%) | 1,025 (85.7%) |
Disability Status by Sex by Age in Valmeyer
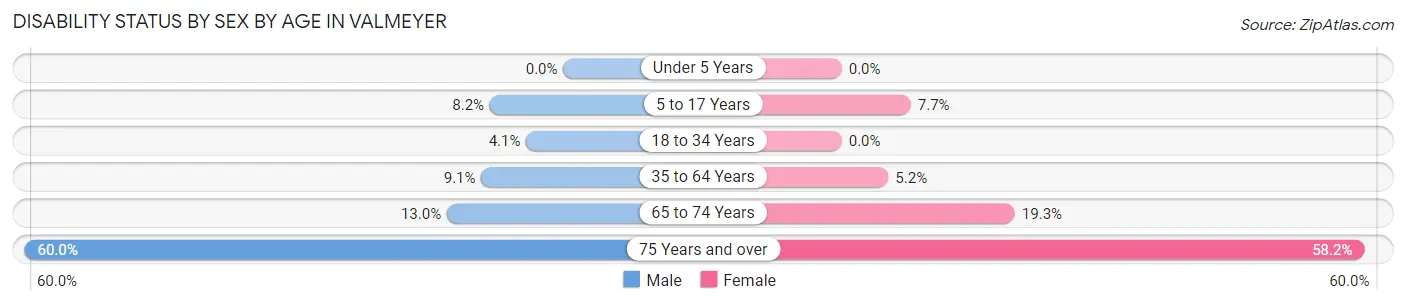
| Age Bracket | Male | Female |
| Under 5 Years | 0 (0.0%) | 0 (0.0%) |
| 5 to 17 Years | 9 (8.2%) | 6 (7.7%) |
| 18 to 34 Years | 5 (4.1%) | 0 (0.0%) |
| 35 to 64 Years | 23 (9.1%) | 14 (5.2%) |
| 65 to 74 Years | 7 (13.0%) | 16 (19.3%) |
| 75 Years and over | 15 (60.0%) | 32 (58.2%) |
Disability Class by Sex by Age in Valmeyer
Disability Class: Hearing Difficulty
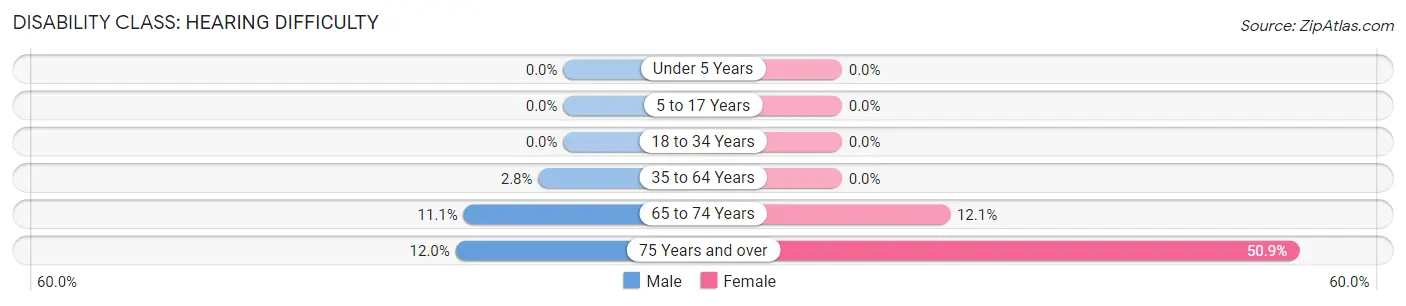
| Age Bracket | Male | Female |
| Under 5 Years | 0 (0.0%) | 0 (0.0%) |
| 5 to 17 Years | 0 (0.0%) | 0 (0.0%) |
| 18 to 34 Years | 0 (0.0%) | 0 (0.0%) |
| 35 to 64 Years | 7 (2.8%) | 0 (0.0%) |
| 65 to 74 Years | 6 (11.1%) | 10 (12.0%) |
| 75 Years and over | 3 (12.0%) | 28 (50.9%) |
Disability Class: Vision Difficulty
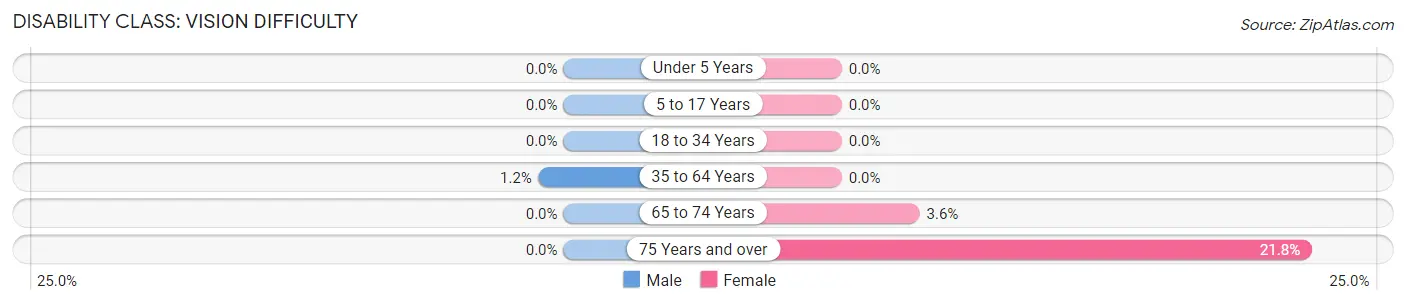
| Age Bracket | Male | Female |
| Under 5 Years | 0 (0.0%) | 0 (0.0%) |
| 5 to 17 Years | 0 (0.0%) | 0 (0.0%) |
| 18 to 34 Years | 0 (0.0%) | 0 (0.0%) |
| 35 to 64 Years | 3 (1.2%) | 0 (0.0%) |
| 65 to 74 Years | 0 (0.0%) | 3 (3.6%) |
| 75 Years and over | 0 (0.0%) | 12 (21.8%) |
Disability Class: Cognitive Difficulty
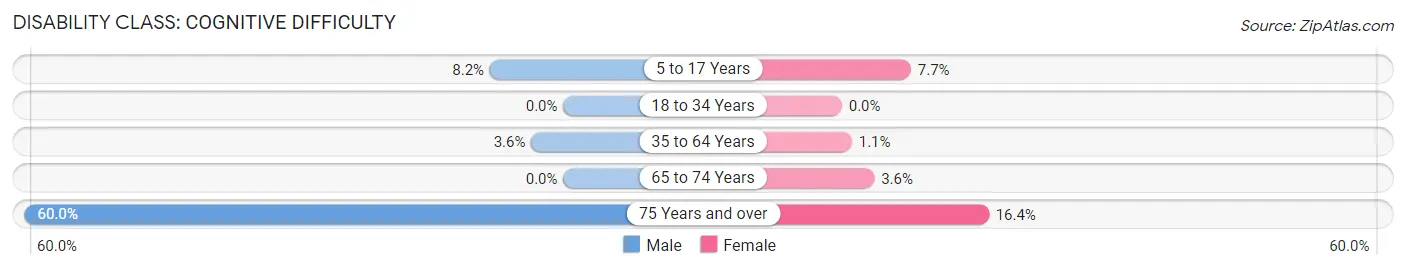
| Age Bracket | Male | Female |
| 5 to 17 Years | 9 (8.2%) | 6 (7.7%) |
| 18 to 34 Years | 0 (0.0%) | 0 (0.0%) |
| 35 to 64 Years | 9 (3.6%) | 3 (1.1%) |
| 65 to 74 Years | 0 (0.0%) | 3 (3.6%) |
| 75 Years and over | 15 (60.0%) | 9 (16.4%) |
Disability Class: Ambulatory Difficulty
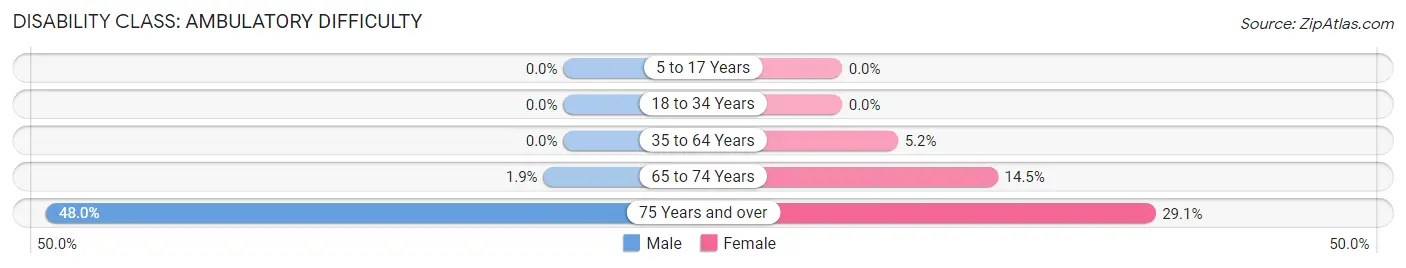
| Age Bracket | Male | Female |
| 5 to 17 Years | 0 (0.0%) | 0 (0.0%) |
| 18 to 34 Years | 0 (0.0%) | 0 (0.0%) |
| 35 to 64 Years | 0 (0.0%) | 14 (5.2%) |
| 65 to 74 Years | 1 (1.8%) | 12 (14.5%) |
| 75 Years and over | 12 (48.0%) | 16 (29.1%) |
Disability Class: Self-Care Difficulty
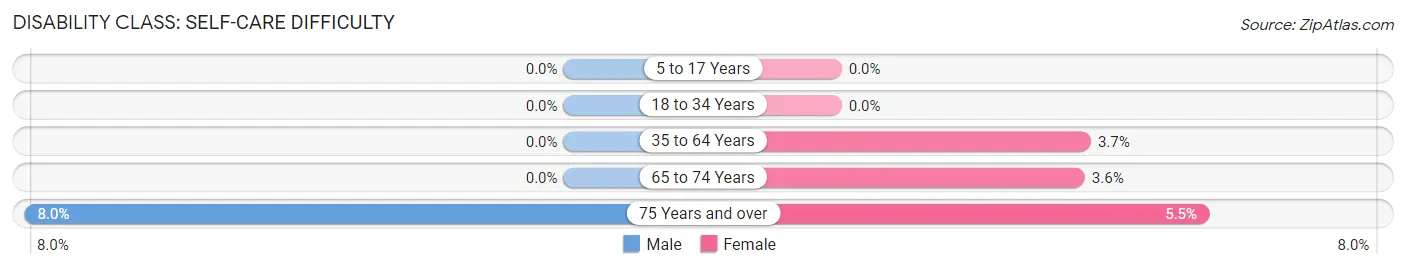
| Age Bracket | Male | Female |
| 5 to 17 Years | 0 (0.0%) | 0 (0.0%) |
| 18 to 34 Years | 0 (0.0%) | 0 (0.0%) |
| 35 to 64 Years | 0 (0.0%) | 10 (3.7%) |
| 65 to 74 Years | 0 (0.0%) | 3 (3.6%) |
| 75 Years and over | 2 (8.0%) | 3 (5.4%) |
Technology Access in Valmeyer
Computing Device Access in Valmeyer
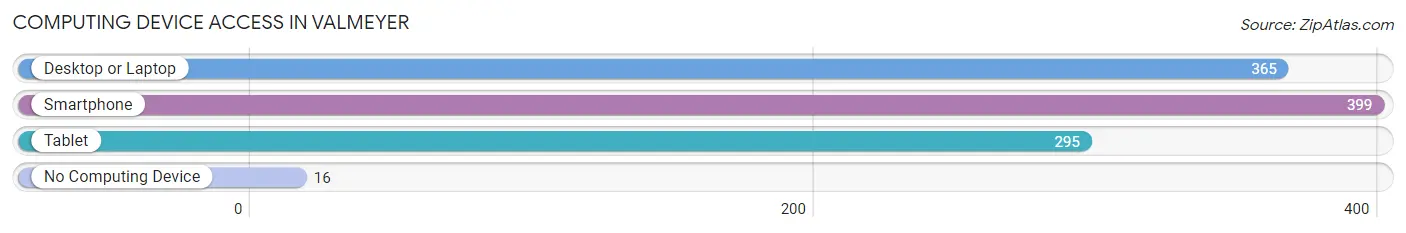
| Device Type | # Households | % Households |
| Desktop or Laptop | 365 | 83.7% |
| Smartphone | 399 | 91.5% |
| Tablet | 295 | 67.7% |
| No Computing Device | 16 | 3.7% |
| Total | 436 | 100.0% |
Internet Access in Valmeyer
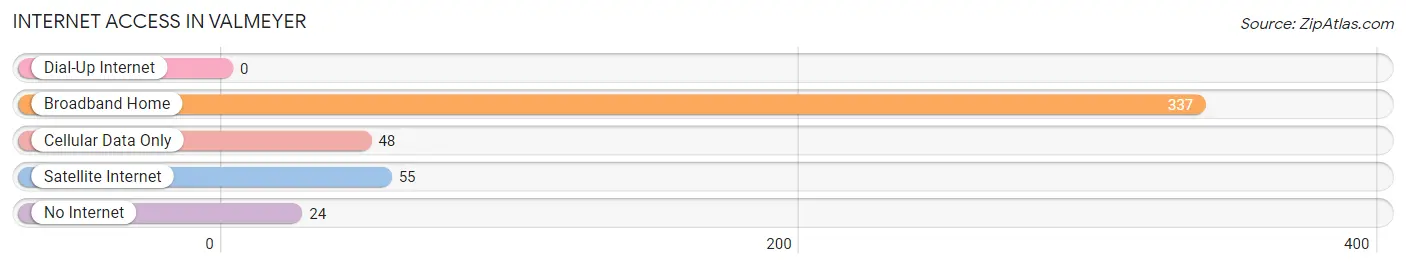
| Internet Type | # Households | % Households |
| Dial-Up Internet | 0 | 0.0% |
| Broadband Home | 337 | 77.3% |
| Cellular Data Only | 48 | 11.0% |
| Satellite Internet | 55 | 12.6% |
| No Internet | 24 | 5.5% |
| Total | 436 | 100.0% |
Valmeyer Summary
History
Valmeyer, Illinois is a small village located in Monroe County, Illinois. It is situated on the banks of the Mississippi River, approximately 25 miles south of St. Louis, Missouri. The village was founded in 1836 by German immigrants who were looking for a place to settle and farm. The village was originally known as “New Valmeyer”, but the name was changed to Valmeyer in 1837.
The village was originally a farming community, but it soon became a popular tourist destination due to its proximity to the Mississippi River. The village was also known for its wineries, which produced some of the finest wines in the region.
In 1993, Valmeyer was devastated by the Great Flood of 1993. The floodwaters of the Mississippi River rose to a record height of 49.58 feet, causing extensive damage to the village. The entire village was evacuated and the residents were forced to relocate to higher ground.
In the aftermath of the flood, the village was rebuilt on higher ground, approximately two miles away from its original location. The new village was named “Valmeyer, Illinois” and the old village was renamed “Old Valmeyer”.
Geography
Valmeyer is located in Monroe County, Illinois. It is situated on the banks of the Mississippi River, approximately 25 miles south of St. Louis, Missouri. The village is located in the American Bottom region of the Mississippi River Valley.
The village is located on a bluff overlooking the Mississippi River. The village is surrounded by rolling hills and wooded areas. The climate in Valmeyer is humid continental, with hot summers and cold winters.
Economy
The economy of Valmeyer is largely based on agriculture and tourism. The village is home to several wineries, which produce some of the finest wines in the region. The village is also home to several small businesses, including restaurants, shops, and other services.
The village is also home to several manufacturing companies, including a plastics factory and a metal fabrication plant. The village is also home to a large trucking company, which transports goods throughout the region.
Demographics
As of the 2010 census, the population of Valmeyer was 2,063. The racial makeup of the village was 97.3% White, 0.7% African American, 0.2% Native American, 0.3% Asian, 0.1% Pacific Islander, 0.7% from other races, and 0.9% from two or more races. Hispanic or Latino of any race were 1.7% of the population.
The median income for a household in Valmeyer was $50,972, and the median income for a family was $60,972. The per capita income for the village was $24,972. About 4.3% of families and 5.3% of the population were below the poverty line, including 6.3% of those under age 18 and 4.3% of those age 65 or over.
Common Questions
What is Per Capita Income in Valmeyer?
Per Capita income in Valmeyer is $39,096.
What is the Median Family Income in Valmeyer?
Median Family Income in Valmeyer is $109,063.
What is the Median Household income in Valmeyer?
Median Household Income in Valmeyer is $95,625.
What is Income or Wage Gap in Valmeyer?
Income or Wage Gap in Valmeyer is 21.8%.
Women in Valmeyer earn 78.2 cents for every dollar earned by a man.
What is Inequality or Gini Index in Valmeyer?
Inequality or Gini Index in Valmeyer is 0.32.
What is the Total Population of Valmeyer?
Total Population of Valmeyer is 1,196.
What is the Total Male Population of Valmeyer?
Total Male Population of Valmeyer is 587.
What is the Total Female Population of Valmeyer?
Total Female Population of Valmeyer is 609.
What is the Ratio of Males per 100 Females in Valmeyer?
There are 96.39 Males per 100 Females in Valmeyer.
What is the Ratio of Females per 100 Males in Valmeyer?
There are 103.75 Females per 100 Males in Valmeyer.
What is the Median Population Age in Valmeyer?
Median Population Age in Valmeyer is 43.5 Years.
What is the Average Family Size in Valmeyer
Average Family Size in Valmeyer is 3.2 People.
What is the Average Household Size in Valmeyer
Average Household Size in Valmeyer is 2.7 People.
How Large is the Labor Force in Valmeyer?
There are 740 People in the Labor Forcein in Valmeyer.
What is the Percentage of People in the Labor Force in Valmeyer?
71.6% of People are in the Labor Force in Valmeyer.
What is the Unemployment Rate in Valmeyer?
Unemployment Rate in Valmeyer is 2.3%.