Zip Codes with the Highest Percentage of Population Employed in Security & Protection in Urbana, IL
RELATED REPORTS & OPTIONS
Security & Protection
Urbana
Compare Zip Codes
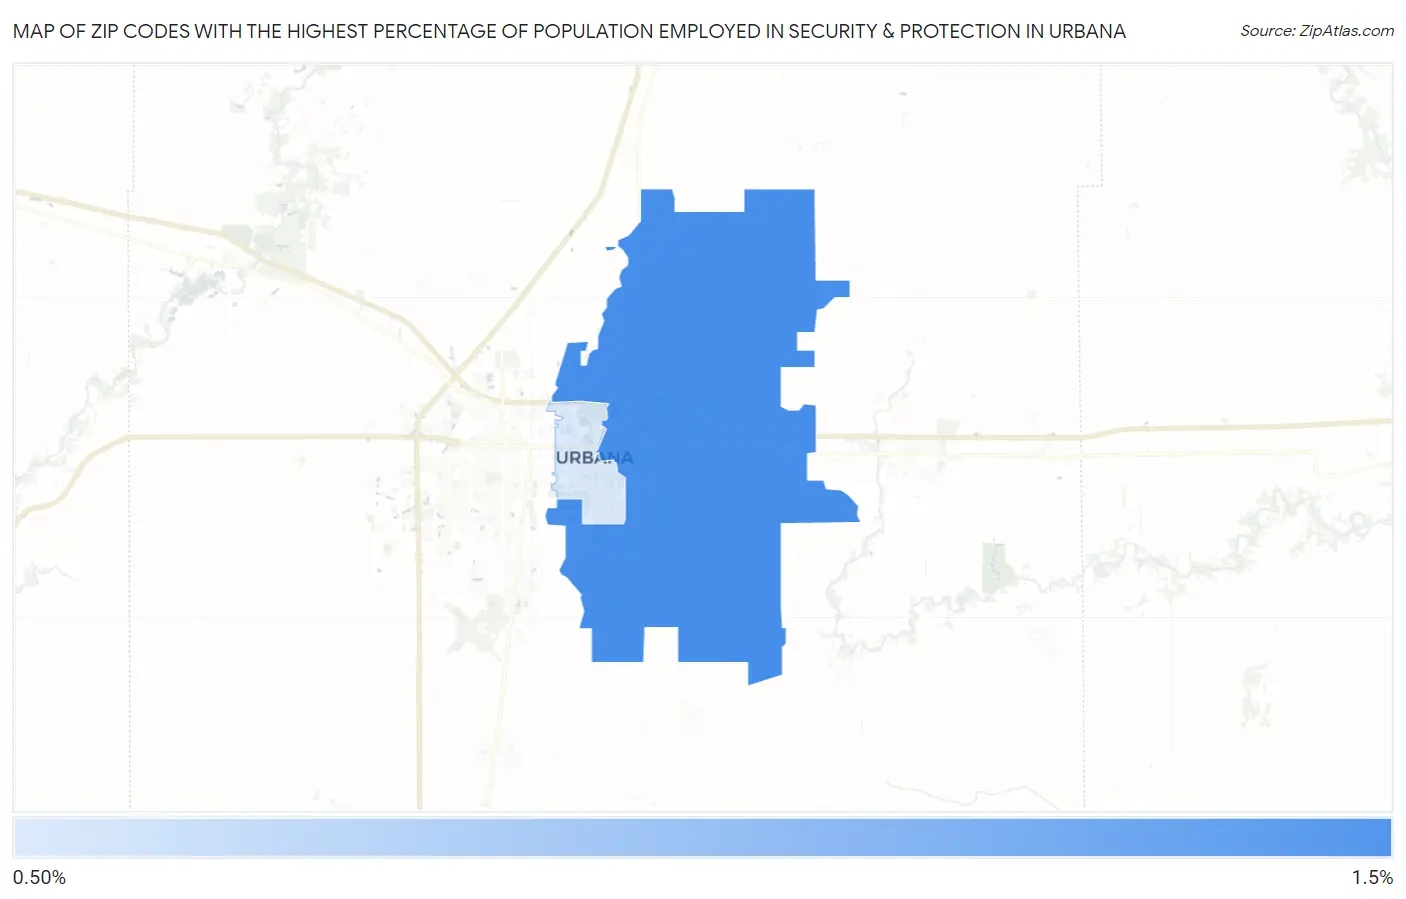
Map of Zip Codes with the Highest Percentage of Population Employed in Security & Protection in Urbana
1.2%
1.3%
Zip Codes with the Highest Percentage of Population Employed in Security & Protection in Urbana, IL
| Zip Code | % Employed | vs State | vs National | |
| 1. | 61802 | 1.3% | 2.2%(-0.931)#793 | 2.1%(-0.888)#18,057 |
| 2. | 61801 | 1.2% | 2.2%(-0.992)#816 | 2.1%(-0.949)#18,506 |
1
Common Questions
What are the Top Zip Codes with the Highest Percentage of Population Employed in Security & Protection in Urbana, IL?
Top Zip Codes with the Highest Percentage of Population Employed in Security & Protection in Urbana, IL are:
What zip code has the Highest Percentage of Population Employed in Security & Protection in Urbana, IL?
61802 has the Highest Percentage of Population Employed in Security & Protection in Urbana, IL with 1.3%.
What is the Percentage of Population Employed in Security & Protection in Urbana, IL?
Percentage of Population Employed in Security & Protection in Urbana is 1.2%.
What is the Percentage of Population Employed in Security & Protection in Illinois?
Percentage of Population Employed in Security & Protection in Illinois is 2.2%.
What is the Percentage of Population Employed in Security & Protection in the United States?
Percentage of Population Employed in Security & Protection in the United States is 2.1%.