Zip Codes with the Highest Percentage of Households With One or more Vehicles in Urbana, IL
RELATED REPORTS & OPTIONS
Households with 1 or more Cars
Urbana
Compare Zip Codes
Map of Zip Codes with the Highest Percentage of Households With One or more Vehicles in Urbana
77.7%
87.6%
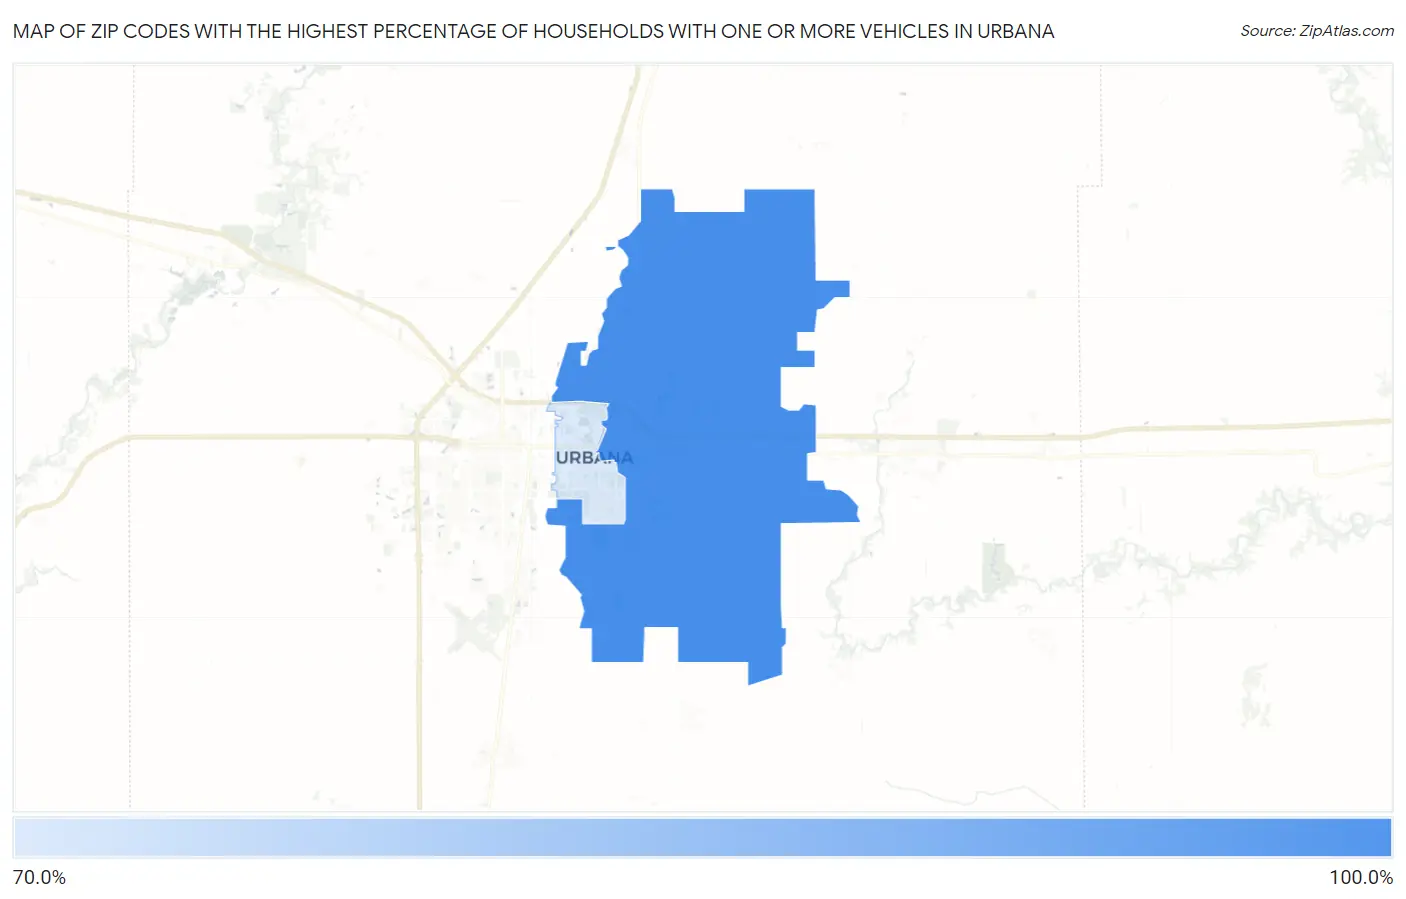
Zip Codes with the Highest Percentage of Households With One or more Vehicles in Urbana, IL
| Zip Code | Housholds With 1+ Cars | vs State | vs National | |
| 1. | 61802 | 87.6% | 89.2%(-1.60)#1,261 | 91.7%(-4.10)#29,429 |
| 2. | 61801 | 77.7% | 89.2%(-11.5)#1,328 | 91.7%(-14.0)#31,541 |
1
Common Questions
What are the Top Zip Codes with the Highest Percentage of Households With One or more Vehicles in Urbana, IL?
Top Zip Codes with the Highest Percentage of Households With One or more Vehicles in Urbana, IL are:
What zip code has the Highest Percentage of Households With One or more Vehicles in Urbana, IL?
61802 has the Highest Percentage of Households With One or more Vehicles in Urbana, IL with 87.6%.
What is the Percentage of Households With One or more Vehicles in Urbana, IL?
Percentage of Households With One or more Vehicles in Urbana is 79.0%.
What is the Percentage of Households With One or more Vehicles in Illinois?
Percentage of Households With One or more Vehicles in Illinois is 89.2%.
What is the Percentage of Households With One or more Vehicles in the United States?
Percentage of Households With One or more Vehicles in the United States is 91.7%.