Summerfield, IL Map & Demographics
Summerfield Map
Summerfield Overview
$33,908
PER CAPITA INCOME
$66,250
AVG FAMILY INCOME
$51,250
AVG HOUSEHOLD INCOME
20.5%
WAGE / INCOME GAP [ % ]
79.5¢/ $1
WAGE / INCOME GAP [ $ ]
0.42
INEQUALITY / GINI INDEX
408
TOTAL POPULATION
203
MALE POPULATION
205
FEMALE POPULATION
99.02
MALES / 100 FEMALES
100.99
FEMALES / 100 MALES
48.8
MEDIAN AGE
2.5
AVG FAMILY SIZE
2.0
AVG HOUSEHOLD SIZE
252
LABOR FORCE [ PEOPLE ]
67.7%
PERCENT IN LABOR FORCE
8.7%
UNEMPLOYMENT RATE
Summerfield Zip Codes
Summerfield Area Codes
Income in Summerfield
Income Overview in Summerfield
Per Capita Income in Summerfield is $33,908, while median incomes of families and households are $66,250 and $51,250 respectively.
| Characteristic | Number | Measure |
| Per Capita Income | 408 | $33,908 |
| Median Family Income | 115 | $66,250 |
| Mean Family Income | 115 | $79,572 |
| Median Household Income | 203 | $51,250 |
| Mean Household Income | 203 | $66,819 |
| Income Deficit | 115 | $0 |
| Wage / Income Gap (%) | 408 | 20.51% |
| Wage / Income Gap ($) | 408 | 79.49¢ per $1 |
| Gini / Inequality Index | 408 | 0.42 |
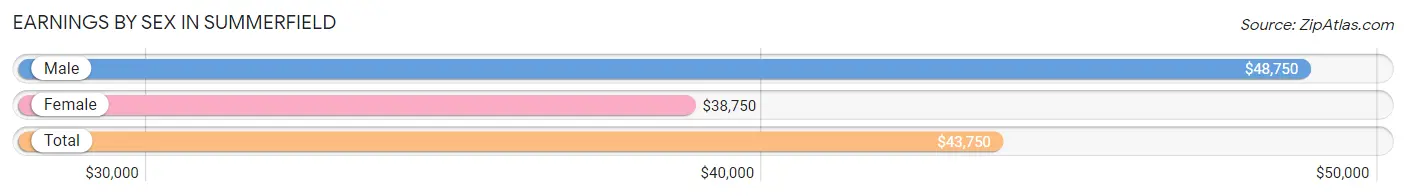
Earnings by Sex in Summerfield
Average Earnings in Summerfield are $43,750, $48,750 for men and $38,750 for women, a difference of 20.5%.
| Sex | Number | Average Earnings |
| Male | 143 (60.1%) | $48,750 |
| Female | 95 (39.9%) | $38,750 |
| Total | 238 (100.0%) | $43,750 |
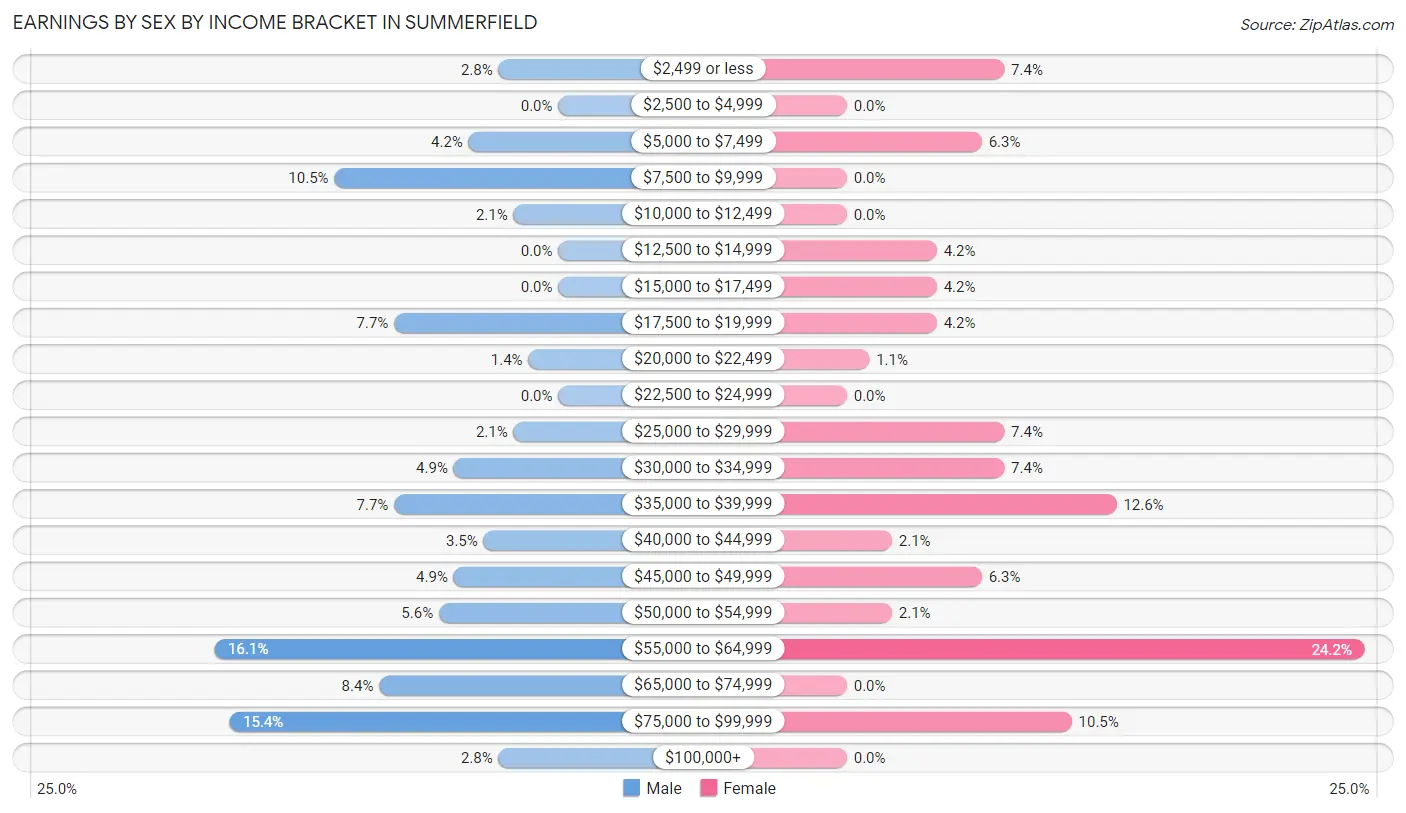
Earnings by Sex by Income Bracket in Summerfield
The most common earnings brackets in Summerfield are $55,000 to $64,999 for men (23 | 16.1%) and $55,000 to $64,999 for women (23 | 24.2%).
| Income | Male | Female |
| $2,499 or less | 4 (2.8%) | 7 (7.4%) |
| $2,500 to $4,999 | 0 (0.0%) | 0 (0.0%) |
| $5,000 to $7,499 | 6 (4.2%) | 6 (6.3%) |
| $7,500 to $9,999 | 15 (10.5%) | 0 (0.0%) |
| $10,000 to $12,499 | 3 (2.1%) | 0 (0.0%) |
| $12,500 to $14,999 | 0 (0.0%) | 4 (4.2%) |
| $15,000 to $17,499 | 0 (0.0%) | 4 (4.2%) |
| $17,500 to $19,999 | 11 (7.7%) | 4 (4.2%) |
| $20,000 to $22,499 | 2 (1.4%) | 1 (1.1%) |
| $22,500 to $24,999 | 0 (0.0%) | 0 (0.0%) |
| $25,000 to $29,999 | 3 (2.1%) | 7 (7.4%) |
| $30,000 to $34,999 | 7 (4.9%) | 7 (7.4%) |
| $35,000 to $39,999 | 11 (7.7%) | 12 (12.6%) |
| $40,000 to $44,999 | 5 (3.5%) | 2 (2.1%) |
| $45,000 to $49,999 | 7 (4.9%) | 6 (6.3%) |
| $50,000 to $54,999 | 8 (5.6%) | 2 (2.1%) |
| $55,000 to $64,999 | 23 (16.1%) | 23 (24.2%) |
| $65,000 to $74,999 | 12 (8.4%) | 0 (0.0%) |
| $75,000 to $99,999 | 22 (15.4%) | 10 (10.5%) |
| $100,000+ | 4 (2.8%) | 0 (0.0%) |
| Total | 143 (100.0%) | 95 (100.0%) |
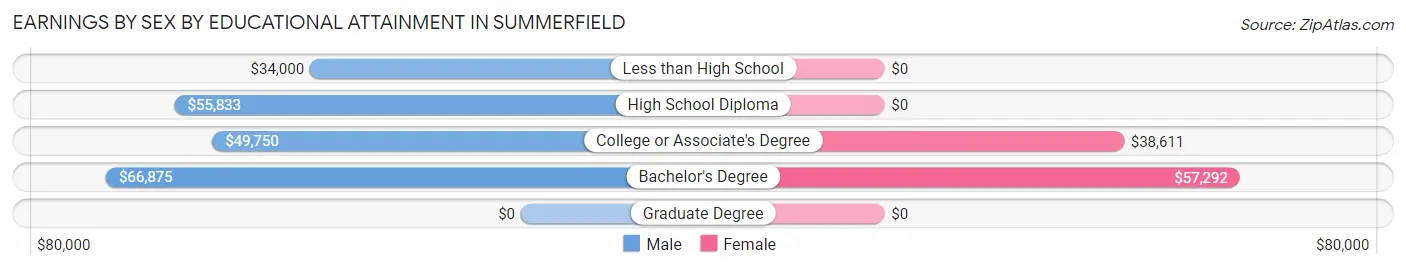
Earnings by Sex by Educational Attainment in Summerfield
Average earnings in Summerfield are $52,031 for men and $43,125 for women, a difference of 17.1%. Men with an educational attainment of bachelor's degree enjoy the highest average annual earnings of $66,875, while those with less than high school education earn the least with $34,000. Women with an educational attainment of bachelor's degree earn the most with the average annual earnings of $57,292, while those with college or associate's degree education have the smallest earnings of $38,611.
| Educational Attainment | Male Income | Female Income |
| Less than High School | $34,000 | $0 |
| High School Diploma | $55,833 | $0 |
| College or Associate's Degree | $49,750 | $38,611 |
| Bachelor's Degree | $66,875 | $57,292 |
| Graduate Degree | - | - |
| Total | $52,031 | $43,125 |
Family Income in Summerfield
Family Income Brackets in Summerfield
According to the Summerfield family income data, there are 24 families falling into the $35,000 to $49,999 income range, which is the most common income bracket and makes up 20.9% of all families. Conversely, the $25,000 to $34,999 income bracket is the least frequent group with only 1 families (0.9%) belonging to this category.
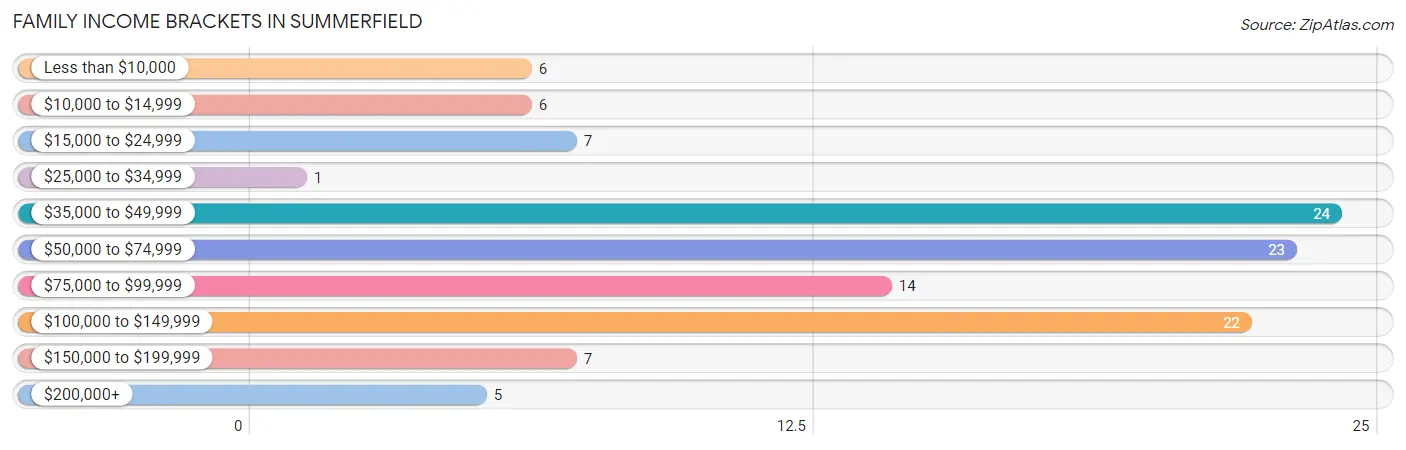
| Income Bracket | # Families | % Families |
| Less than $10,000 | 6 | 5.2% |
| $10,000 to $14,999 | 6 | 5.2% |
| $15,000 to $24,999 | 7 | 6.1% |
| $25,000 to $34,999 | 1 | 0.9% |
| $35,000 to $49,999 | 24 | 20.9% |
| $50,000 to $74,999 | 23 | 20.0% |
| $75,000 to $99,999 | 14 | 12.2% |
| $100,000 to $149,999 | 22 | 19.1% |
| $150,000 to $199,999 | 7 | 6.1% |
| $200,000+ | 5 | 4.3% |
Family Income by Famaliy Size in Summerfield
3-person families (34 | 29.6%) account for the highest median family income in Summerfield with $118,333 per family, while 3-person families (34 | 29.6%) have the highest median income of $39,444 per family member.
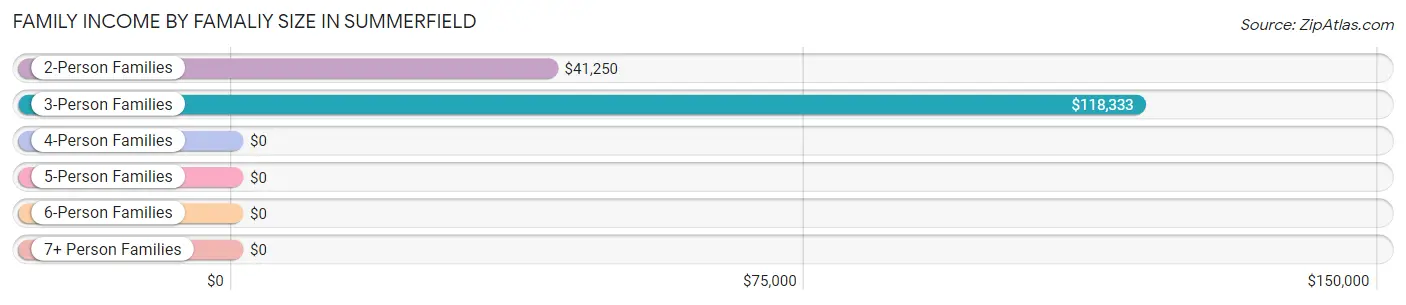
| Income Bracket | # Families | Median Income |
| 2-Person Families | 73 (63.5%) | $41,250 |
| 3-Person Families | 34 (29.6%) | $118,333 |
| 4-Person Families | 7 (6.1%) | $0 |
| 5-Person Families | 0 (0.0%) | $0 |
| 6-Person Families | 0 (0.0%) | $0 |
| 7+ Person Families | 1 (0.9%) | $0 |
| Total | 115 (100.0%) | $66,250 |
Family Income by Number of Earners in Summerfield
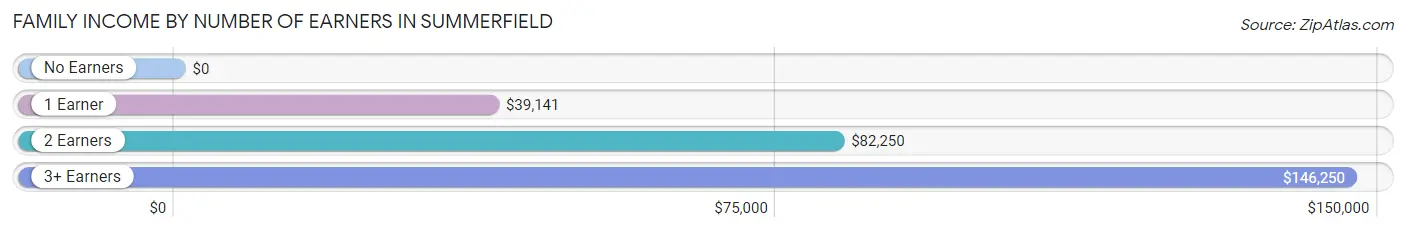
| Number of Earners | # Families | Median Income |
| No Earners | 25 (21.7%) | $0 |
| 1 Earner | 33 (28.7%) | $39,141 |
| 2 Earners | 35 (30.4%) | $82,250 |
| 3+ Earners | 22 (19.1%) | $146,250 |
| Total | 115 (100.0%) | $66,250 |
Household Income in Summerfield
Household Income Brackets in Summerfield
With 41 households falling in the category, the $35,000 to $49,999 income range is the most frequent in Summerfield, accounting for 20.2% of all households. In contrast, only 5 households (2.5%) fall into the $200,000+ income bracket, making it the least populous group.
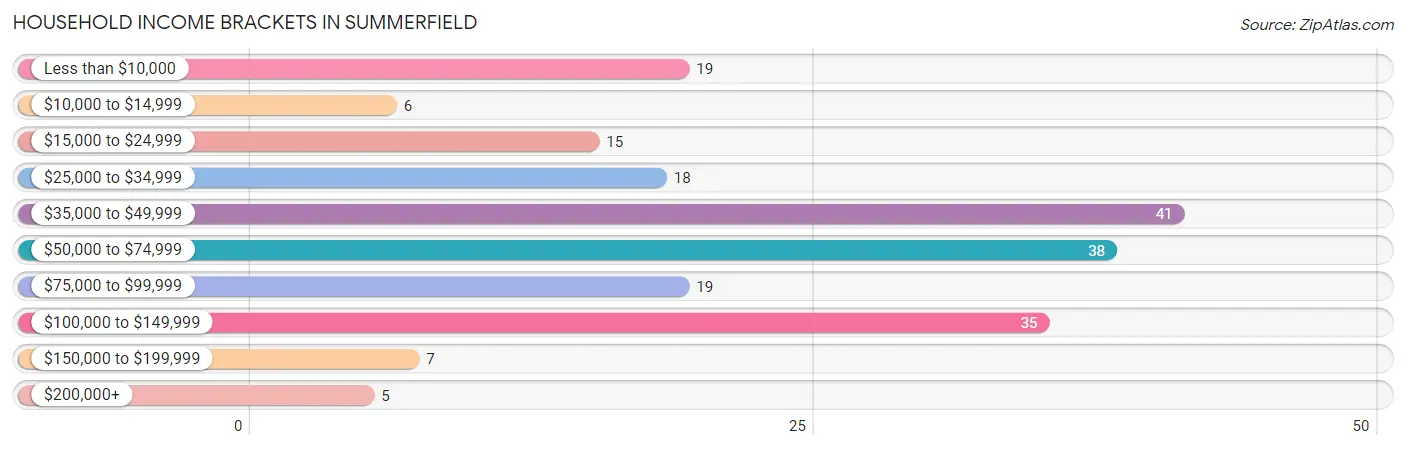
| Income Bracket | # Households | % Households |
| Less than $10,000 | 19 | 9.4% |
| $10,000 to $14,999 | 6 | 3.0% |
| $15,000 to $24,999 | 15 | 7.4% |
| $25,000 to $34,999 | 18 | 8.9% |
| $35,000 to $49,999 | 41 | 20.2% |
| $50,000 to $74,999 | 38 | 18.7% |
| $75,000 to $99,999 | 19 | 9.4% |
| $100,000 to $149,999 | 35 | 17.2% |
| $150,000 to $199,999 | 7 | 3.4% |
| $200,000+ | 5 | 2.5% |
Household Income by Householder Age in Summerfield
The median household income in Summerfield is $51,250, with the highest median household income of $70,833 found in the 45 to 64 years age bracket for the primary householder. A total of 92 households (45.3%) fall into this category. Meanwhile, the 15 to 24 years age bracket for the primary householder has the lowest median household income of $0, with 2 households (1.0%) in this group.
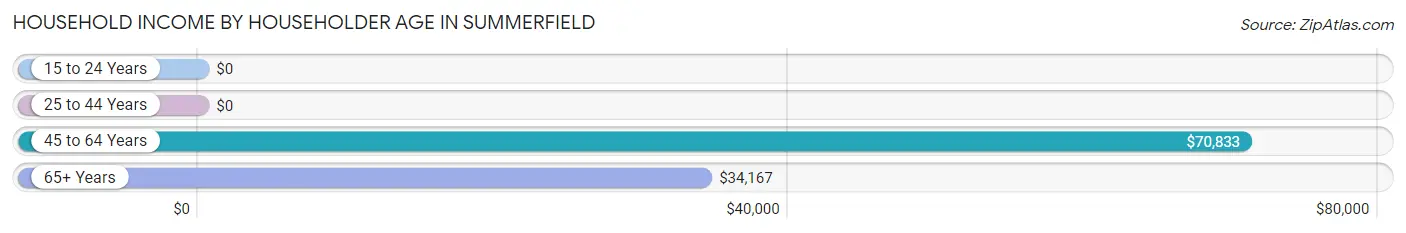
| Income Bracket | # Households | Median Income |
| 15 to 24 Years | 2 (1.0%) | $0 |
| 25 to 44 Years | 65 (32.0%) | $0 |
| 45 to 64 Years | 92 (45.3%) | $70,833 |
| 65+ Years | 44 (21.7%) | $34,167 |
| Total | 203 (100.0%) | $51,250 |
Poverty in Summerfield
Income Below Poverty by Sex and Age in Summerfield
With 14.8% poverty level for males and 15.6% for females among the residents of Summerfield, under 5 year old males and 45 to 54 year old females are the most vulnerable to poverty, with 3 males (100.0%) and 15 females (30.6%) in their respective age groups living below the poverty level.
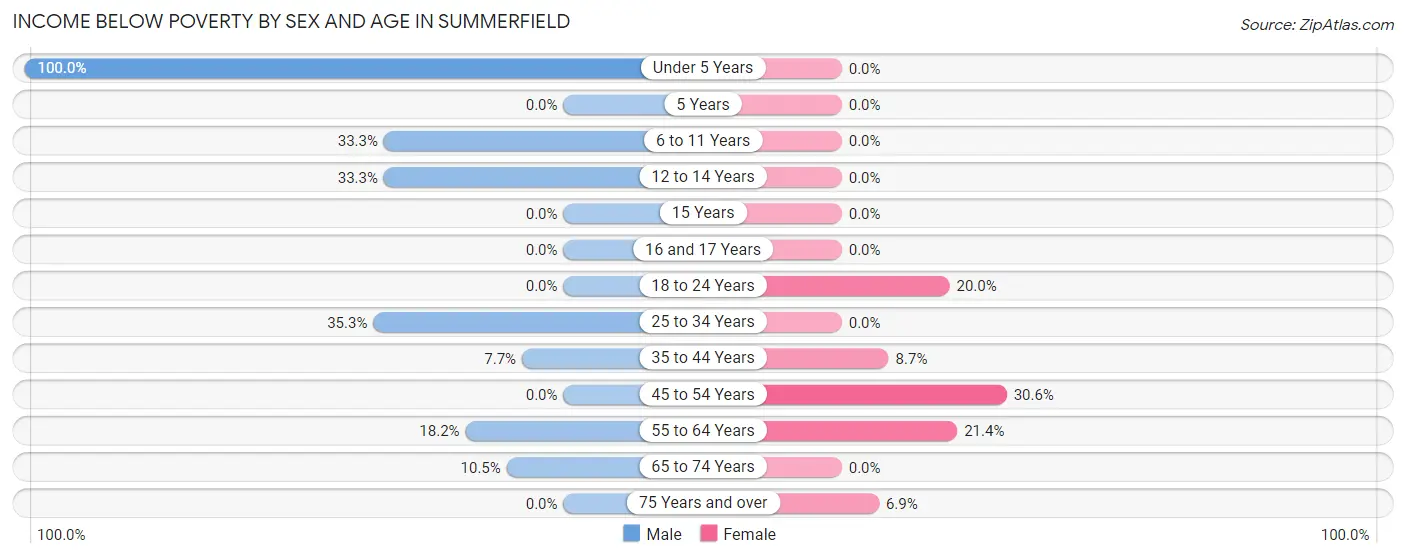
| Age Bracket | Male | Female |
| Under 5 Years | 3 (100.0%) | 0 (0.0%) |
| 5 Years | 0 (0.0%) | 0 (0.0%) |
| 6 to 11 Years | 3 (33.3%) | 0 (0.0%) |
| 12 to 14 Years | 4 (33.3%) | 0 (0.0%) |
| 15 Years | 0 (0.0%) | 0 (0.0%) |
| 16 and 17 Years | 0 (0.0%) | 0 (0.0%) |
| 18 to 24 Years | 0 (0.0%) | 2 (20.0%) |
| 25 to 34 Years | 12 (35.3%) | 0 (0.0%) |
| 35 to 44 Years | 2 (7.7%) | 4 (8.7%) |
| 45 to 54 Years | 0 (0.0%) | 15 (30.6%) |
| 55 to 64 Years | 4 (18.2%) | 9 (21.4%) |
| 65 to 74 Years | 2 (10.5%) | 0 (0.0%) |
| 75 Years and over | 0 (0.0%) | 2 (6.9%) |
| Total | 30 (14.8%) | 32 (15.6%) |
Income Above Poverty by Sex and Age in Summerfield
According to the poverty statistics in Summerfield, males aged 16 and 17 years and females aged under 5 years are the age groups that are most secure financially, with 100.0% of males and 100.0% of females in these age groups living above the poverty line.
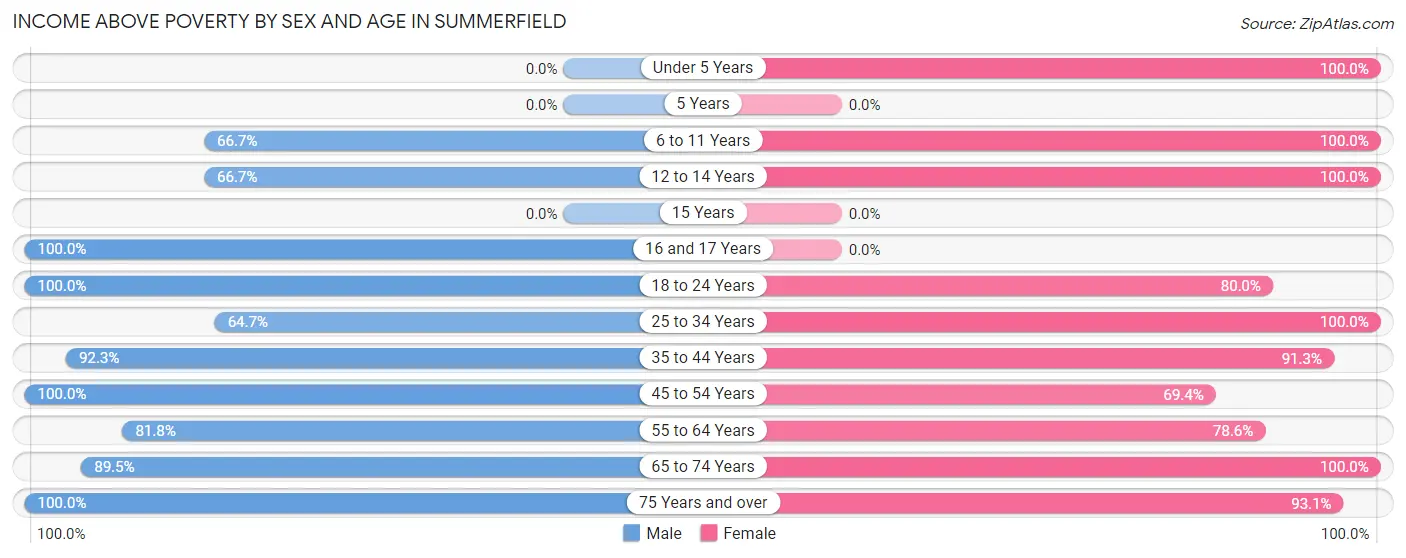
| Age Bracket | Male | Female |
| Under 5 Years | 0 (0.0%) | 4 (100.0%) |
| 5 Years | 0 (0.0%) | 0 (0.0%) |
| 6 to 11 Years | 6 (66.7%) | 6 (100.0%) |
| 12 to 14 Years | 8 (66.7%) | 2 (100.0%) |
| 15 Years | 0 (0.0%) | 0 (0.0%) |
| 16 and 17 Years | 5 (100.0%) | 0 (0.0%) |
| 18 to 24 Years | 14 (100.0%) | 8 (80.0%) |
| 25 to 34 Years | 22 (64.7%) | 7 (100.0%) |
| 35 to 44 Years | 24 (92.3%) | 42 (91.3%) |
| 45 to 54 Years | 47 (100.0%) | 34 (69.4%) |
| 55 to 64 Years | 18 (81.8%) | 33 (78.6%) |
| 65 to 74 Years | 17 (89.5%) | 10 (100.0%) |
| 75 Years and over | 12 (100.0%) | 27 (93.1%) |
| Total | 173 (85.2%) | 173 (84.4%) |
Income Below Poverty Among Married-Couple Families in Summerfield
The poverty statistics for married-couple families in Summerfield show that 6.5% or 6 of the total 92 families live below the poverty line. Families with no children have the highest poverty rate of 7.4%, comprising of 6 families. On the other hand, families with 1 or 2 children have the lowest poverty rate of 0.0%, which includes 0 families.
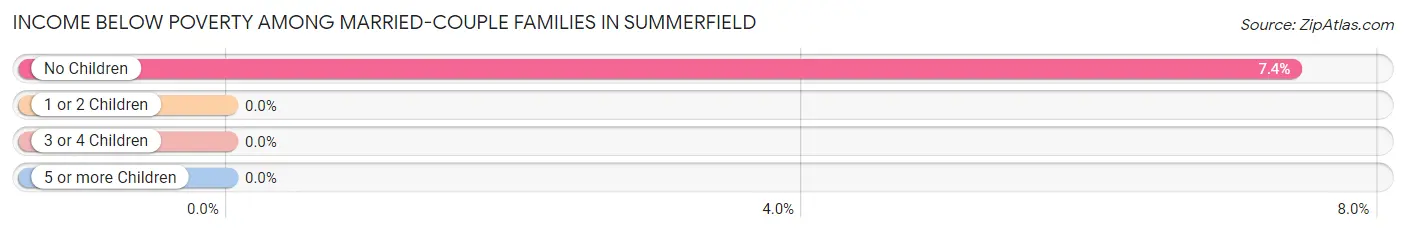
| Children | Above Poverty | Below Poverty |
| No Children | 75 (92.6%) | 6 (7.4%) |
| 1 or 2 Children | 10 (100.0%) | 0 (0.0%) |
| 3 or 4 Children | 0 (0.0%) | 0 (0.0%) |
| 5 or more Children | 1 (100.0%) | 0 (0.0%) |
| Total | 86 (93.5%) | 6 (6.5%) |
Income Below Poverty Among Single-Parent Households in Summerfield
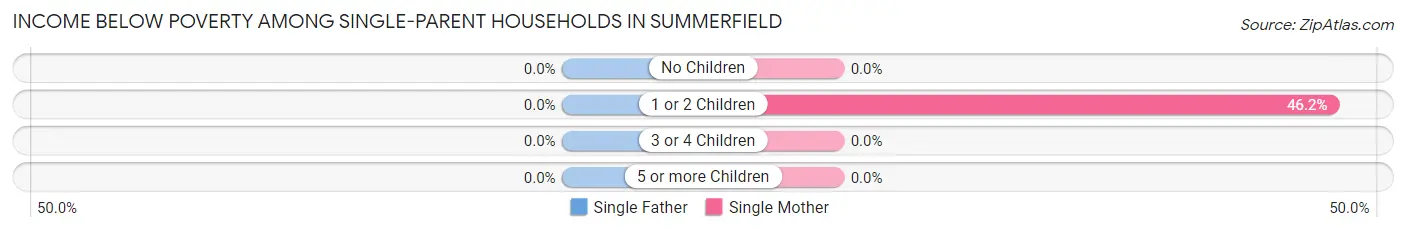
| Children | Single Father | Single Mother |
| No Children | 0 (0.0%) | 0 (0.0%) |
| 1 or 2 Children | 0 (0.0%) | 6 (46.2%) |
| 3 or 4 Children | 0 (0.0%) | 0 (0.0%) |
| 5 or more Children | 0 (0.0%) | 0 (0.0%) |
| Total | 0 (0.0%) | 6 (26.1%) |
Income Below Poverty Among Married-Couple vs Single-Parent Households in Summerfield
The poverty data for Summerfield shows that 6 of the married-couple family households (6.5%) and 6 of the single-parent households (26.1%) are living below the poverty level. Within the married-couple family households, those with no children have the highest poverty rate, with 6 households (7.4%) falling below the poverty line. Among the single-parent households, those with 1 or 2 children have the highest poverty rate, with 6 household (46.2%) living below poverty.
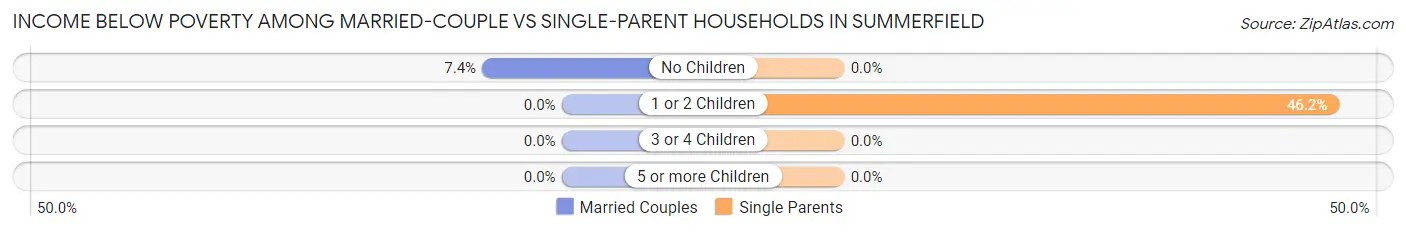
| Children | Married-Couple Families | Single-Parent Households |
| No Children | 6 (7.4%) | 0 (0.0%) |
| 1 or 2 Children | 0 (0.0%) | 6 (46.2%) |
| 3 or 4 Children | 0 (0.0%) | 0 (0.0%) |
| 5 or more Children | 0 (0.0%) | 0 (0.0%) |
| Total | 6 (6.5%) | 6 (26.1%) |
Race in Summerfield
The most populous races in Summerfield are White / Caucasian (395 | 96.8%), Two or more Races (11 | 2.7%), and Hispanic or Latino (8 | 2.0%).
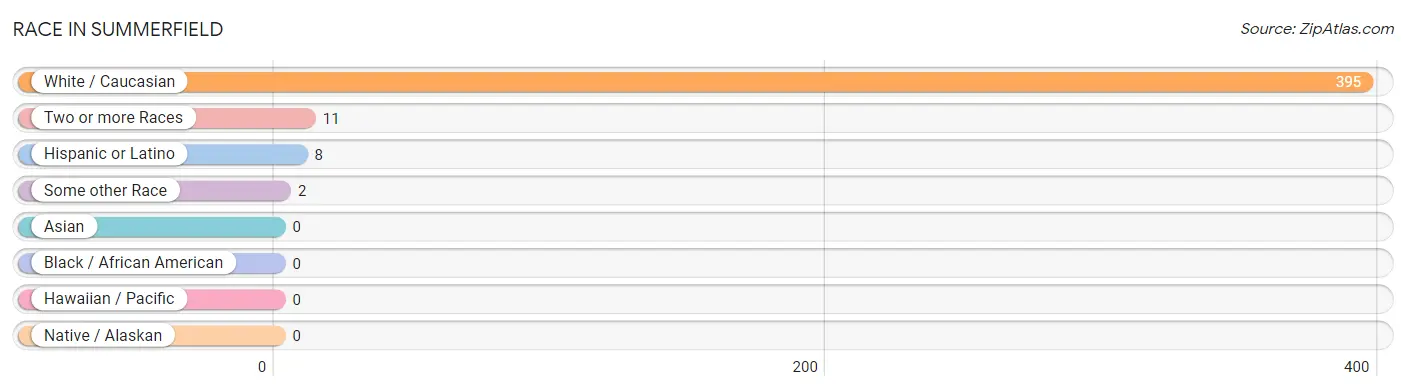
| Race | # Population | % Population |
| Asian | 0 | 0.0% |
| Black / African American | 0 | 0.0% |
| Hawaiian / Pacific | 0 | 0.0% |
| Hispanic or Latino | 8 | 2.0% |
| Native / Alaskan | 0 | 0.0% |
| White / Caucasian | 395 | 96.8% |
| Two or more Races | 11 | 2.7% |
| Some other Race | 2 | 0.5% |
| Total | 408 | 100.0% |
Ancestry in Summerfield
The most populous ancestries reported in Summerfield are German (130 | 31.9%), English (53 | 13.0%), Irish (36 | 8.8%), French (25 | 6.1%), and American (22 | 5.4%), together accounting for 65.2% of all Summerfield residents.
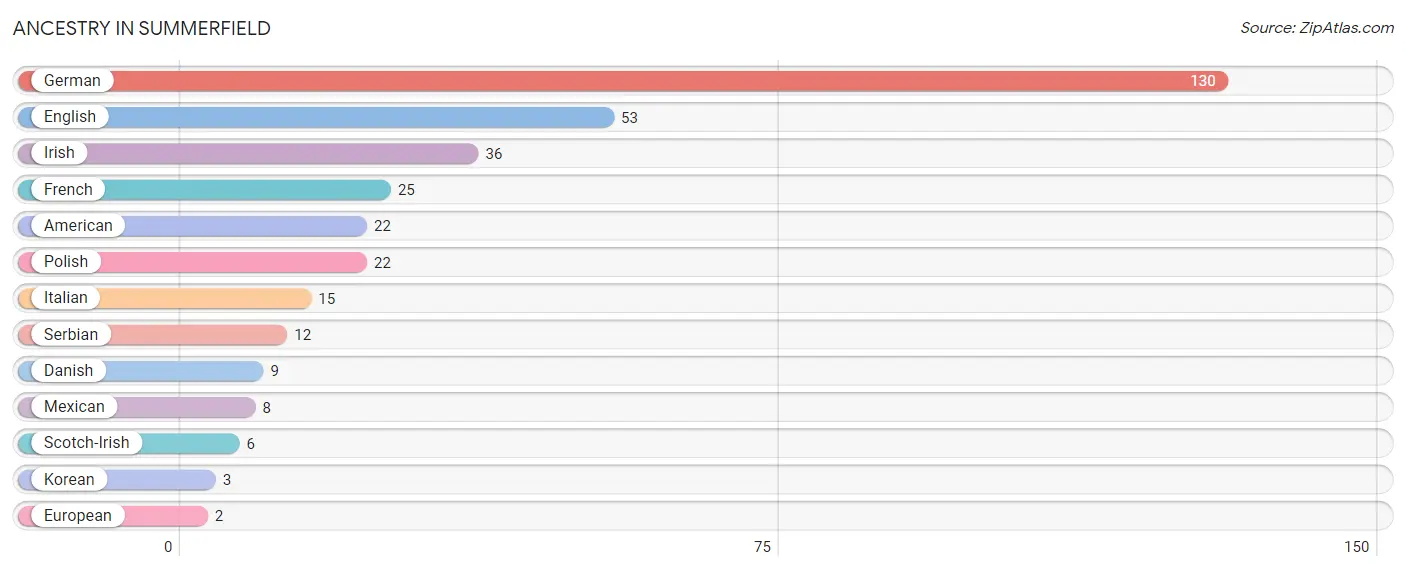
| Ancestry | # Population | % Population |
| American | 22 | 5.4% |
| Danish | 9 | 2.2% |
| English | 53 | 13.0% |
| European | 2 | 0.5% |
| French | 25 | 6.1% |
| German | 130 | 31.9% |
| Irish | 36 | 8.8% |
| Italian | 15 | 3.7% |
| Korean | 3 | 0.7% |
| Mexican | 8 | 2.0% |
| Polish | 22 | 5.4% |
| Scotch-Irish | 6 | 1.5% |
| Serbian | 12 | 2.9% | View All 13 Rows |
Immigrants in Summerfield
The most numerous immigrant groups reported in Summerfield came from Central America (2 | 0.5%), Latin America (2 | 0.5%), and Mexico (2 | 0.5%), together accounting for 1.5% of all Summerfield residents.
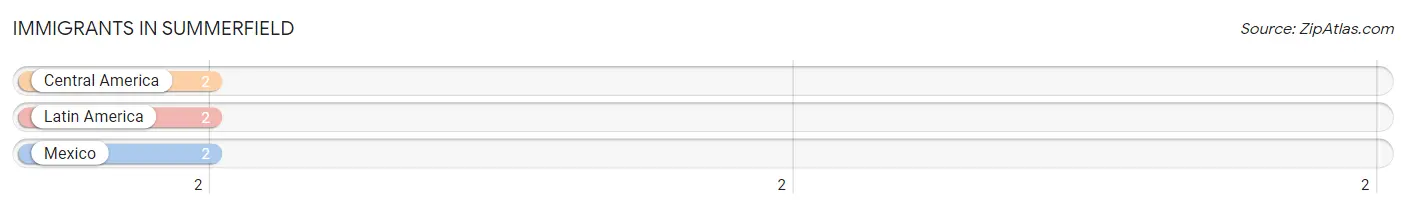
| Immigration Origin | # Population | % Population |
| Central America | 2 | 0.5% |
| Latin America | 2 | 0.5% |
| Mexico | 2 | 0.5% | View All 3 Rows |
Sex and Age in Summerfield
Sex and Age in Summerfield
The most populous age groups in Summerfield are 50 to 54 Years (35 | 17.2%) for men and 35 to 39 Years (34 | 16.6%) for women.
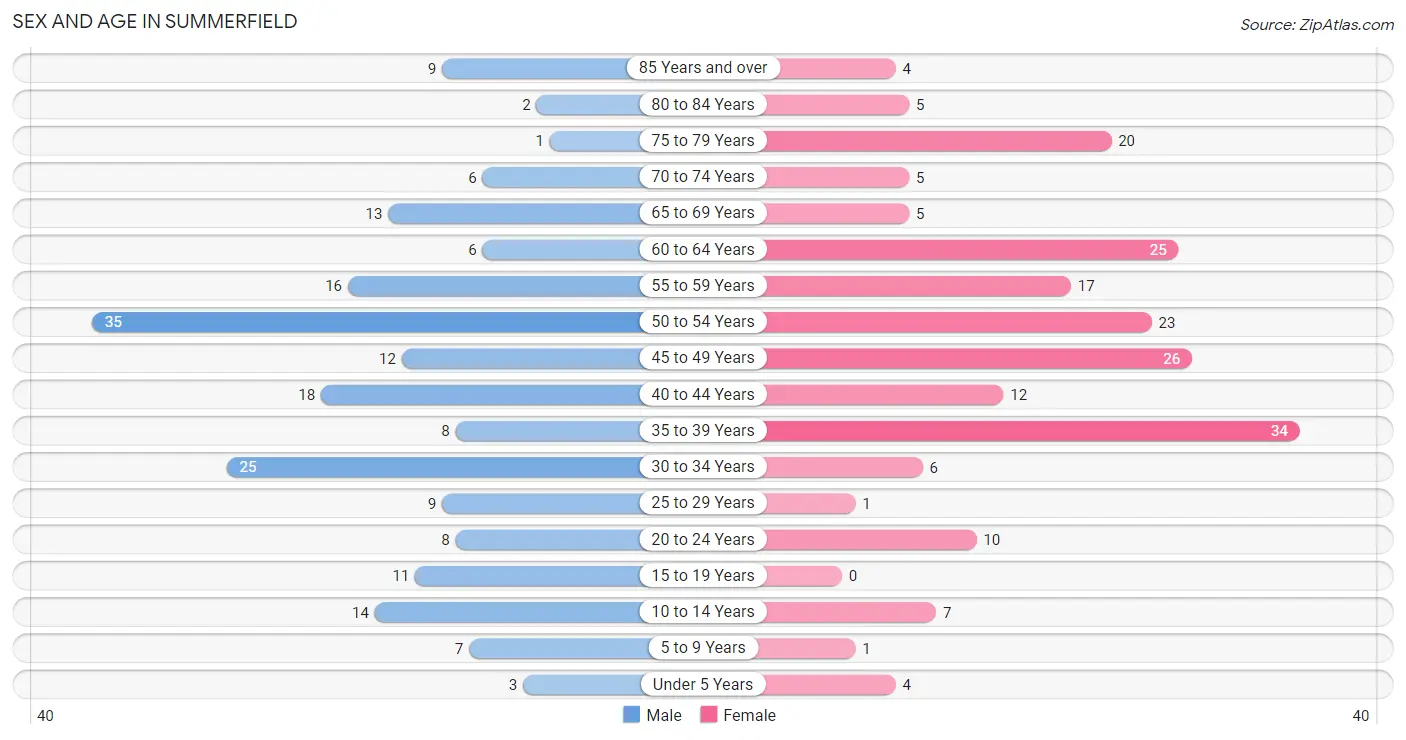
| Age Bracket | Male | Female |
| Under 5 Years | 3 (1.5%) | 4 (1.9%) |
| 5 to 9 Years | 7 (3.5%) | 1 (0.5%) |
| 10 to 14 Years | 14 (6.9%) | 7 (3.4%) |
| 15 to 19 Years | 11 (5.4%) | 0 (0.0%) |
| 20 to 24 Years | 8 (3.9%) | 10 (4.9%) |
| 25 to 29 Years | 9 (4.4%) | 1 (0.5%) |
| 30 to 34 Years | 25 (12.3%) | 6 (2.9%) |
| 35 to 39 Years | 8 (3.9%) | 34 (16.6%) |
| 40 to 44 Years | 18 (8.9%) | 12 (5.9%) |
| 45 to 49 Years | 12 (5.9%) | 26 (12.7%) |
| 50 to 54 Years | 35 (17.2%) | 23 (11.2%) |
| 55 to 59 Years | 16 (7.9%) | 17 (8.3%) |
| 60 to 64 Years | 6 (3.0%) | 25 (12.2%) |
| 65 to 69 Years | 13 (6.4%) | 5 (2.4%) |
| 70 to 74 Years | 6 (3.0%) | 5 (2.4%) |
| 75 to 79 Years | 1 (0.5%) | 20 (9.8%) |
| 80 to 84 Years | 2 (1.0%) | 5 (2.4%) |
| 85 Years and over | 9 (4.4%) | 4 (1.9%) |
| Total | 203 (100.0%) | 205 (100.0%) |
Families and Households in Summerfield
Median Family Size in Summerfield
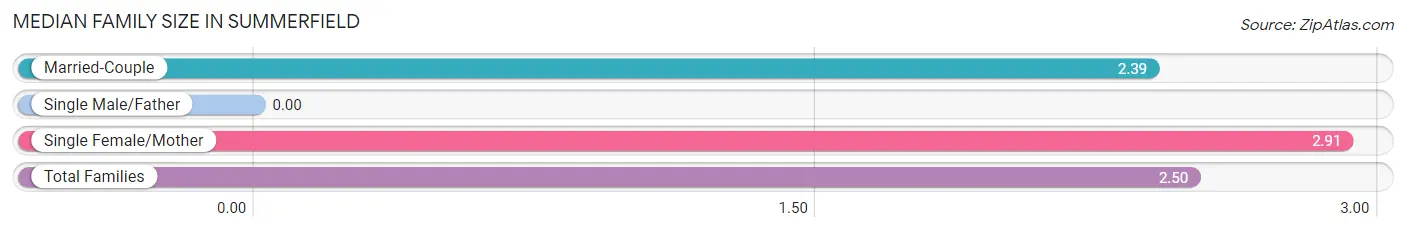
| Family Type | # Families | Family Size |
| Married-Couple | 92 (80.0%) | 2.39 |
| Single Male/Father | 0 (0.0%) | - |
| Single Female/Mother | 23 (20.0%) | 2.91 |
| Total Families | 115 (100.0%) | 2.50 |
Median Household Size in Summerfield
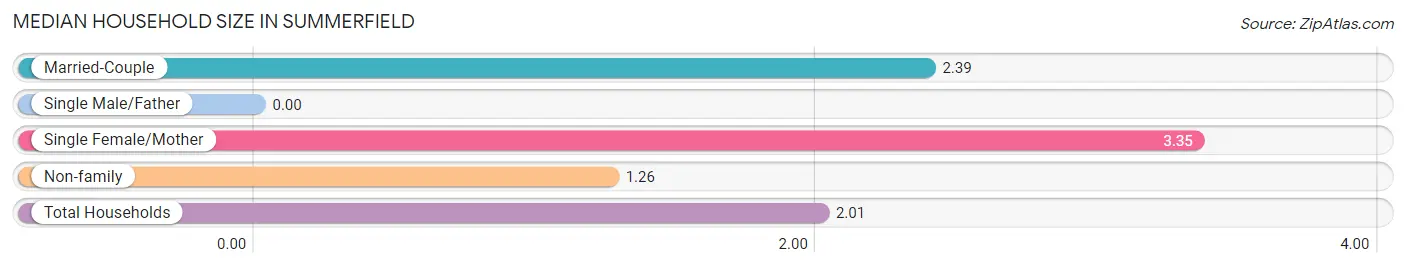
| Household Type | # Households | Household Size |
| Married-Couple | 92 (45.3%) | 2.39 |
| Single Male/Father | 0 (0.0%) | - |
| Single Female/Mother | 23 (11.3%) | 3.35 |
| Non-family | 88 (43.3%) | 1.26 |
| Total Households | 203 (100.0%) | 2.01 |
Household Size by Marriage Status in Summerfield
Out of a total of 203 households in Summerfield, 115 (56.7%) are family households, while 88 (43.3%) are nonfamily households. The most numerous type of family households are 2-person households, comprising 71, and the most common type of nonfamily households are 1-person households, comprising 67.
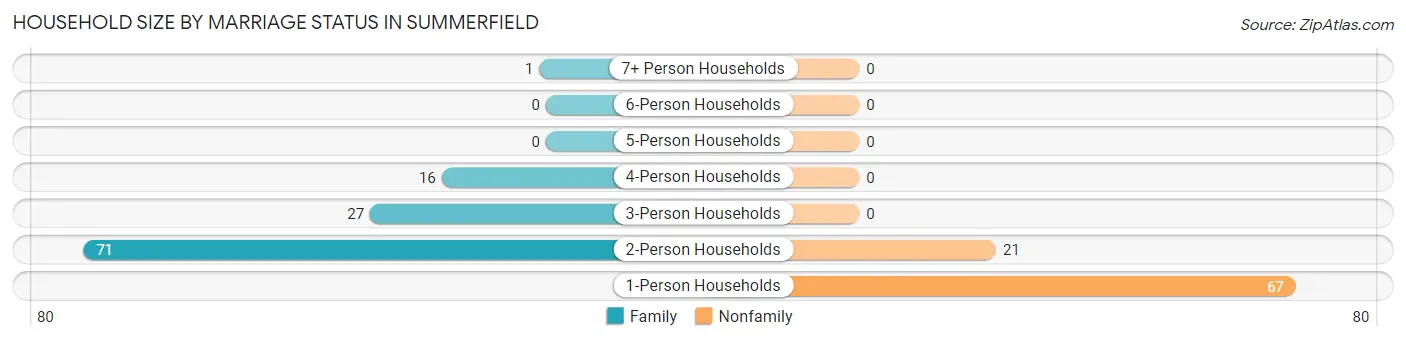
| Household Size | Family Households | Nonfamily Households |
| 1-Person Households | - | 67 (33.0%) |
| 2-Person Households | 71 (35.0%) | 21 (10.3%) |
| 3-Person Households | 27 (13.3%) | 0 (0.0%) |
| 4-Person Households | 16 (7.9%) | 0 (0.0%) |
| 5-Person Households | 0 (0.0%) | 0 (0.0%) |
| 6-Person Households | 0 (0.0%) | 0 (0.0%) |
| 7+ Person Households | 1 (0.5%) | 0 (0.0%) |
| Total | 115 (56.7%) | 88 (43.3%) |
Female Fertility in Summerfield
Fertility by Age in Summerfield
| Age Bracket | Women with Births | Births / 1,000 Women |
| 15 to 19 years | 0 (0.0%) | 0.0 |
| 20 to 34 years | 0 (0.0%) | 0.0 |
| 35 to 50 years | 0 (0.0%) | 0.0 |
| Total | 0 (0.0%) | 0.0 |
Fertility by Age by Marriage Status in Summerfield
| Age Bracket | Married | Unmarried |
| 15 to 19 years | 0 (0.0%) | 0 (0.0%) |
| 20 to 34 years | 0 (0.0%) | 0 (0.0%) |
| 35 to 50 years | 0 (0.0%) | 0 (0.0%) |
| Total | 0 (0.0%) | 0 (0.0%) |
Fertility by Education in Summerfield
| Educational Attainment | Women with Births | Births / 1,000 Women |
| Less than High School | 0 (0.0%) | 0.0 |
| High School Diploma | 0 (0.0%) | 0.0 |
| College or Associate's Degree | 0 (0.0%) | 0.0 |
| Bachelor's Degree | 0 (0.0%) | 0.0 |
| Graduate Degree | 0 (0.0%) | 0.0 |
| Total | 0 (0.0%) | 0.0 |
Fertility by Education by Marriage Status in Summerfield
| Educational Attainment | Married | Unmarried |
| Less than High School | 0 (0.0%) | 0 (0.0%) |
| High School Diploma | 0 (0.0%) | 0 (0.0%) |
| College or Associate's Degree | 0 (0.0%) | 0 (0.0%) |
| Bachelor's Degree | 0 (0.0%) | 0 (0.0%) |
| Graduate Degree | 0 (0.0%) | 0 (0.0%) |
| Total | 0 (0.0%) | 0 (0.0%) |
Employment Characteristics in Summerfield
Employment by Class of Employer in Summerfield
Among the 225 employed individuals in Summerfield, private company employees (179 | 79.6%), not-for-profit organizations (24 | 10.7%), and local government employees (8 | 3.6%) make up the most common classes of employment.
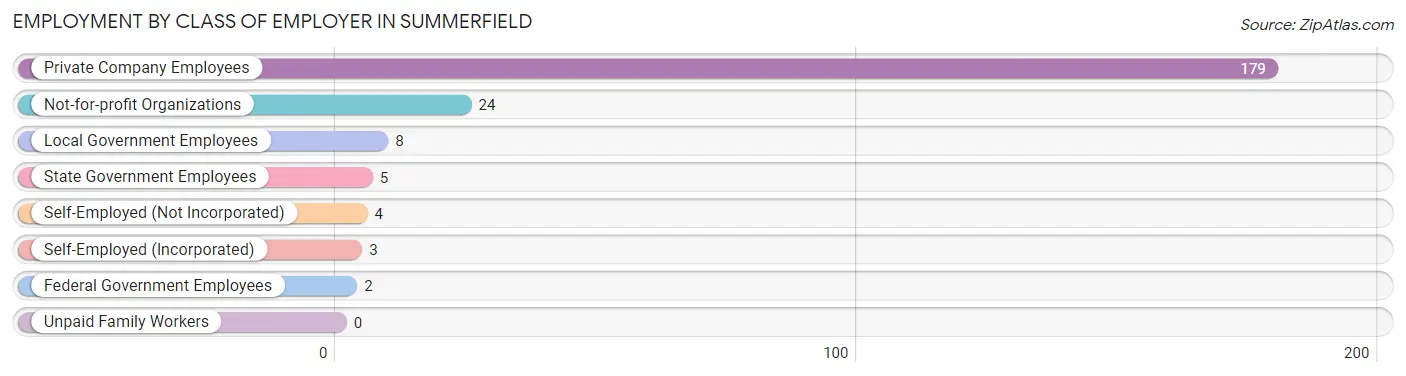
| Employer Class | # Employees | % Employees |
| Private Company Employees | 179 | 79.6% |
| Self-Employed (Incorporated) | 3 | 1.3% |
| Self-Employed (Not Incorporated) | 4 | 1.8% |
| Not-for-profit Organizations | 24 | 10.7% |
| Local Government Employees | 8 | 3.6% |
| State Government Employees | 5 | 2.2% |
| Federal Government Employees | 2 | 0.9% |
| Unpaid Family Workers | 0 | 0.0% |
| Total | 225 | 100.0% |
Employment Status by Age in Summerfield
According to the labor force statistics for Summerfield, out of the total population over 16 years of age (372), 67.7% or 252 individuals are in the labor force, with 8.7% or 22 of them unemployed. The age group with the highest labor force participation rate is 20 to 24 years, with 100.0% or 18 individuals in the labor force. Within the labor force, the 35 to 44 years age range has the highest percentage of unemployed individuals, with 30.6% or 22 of them being unemployed.
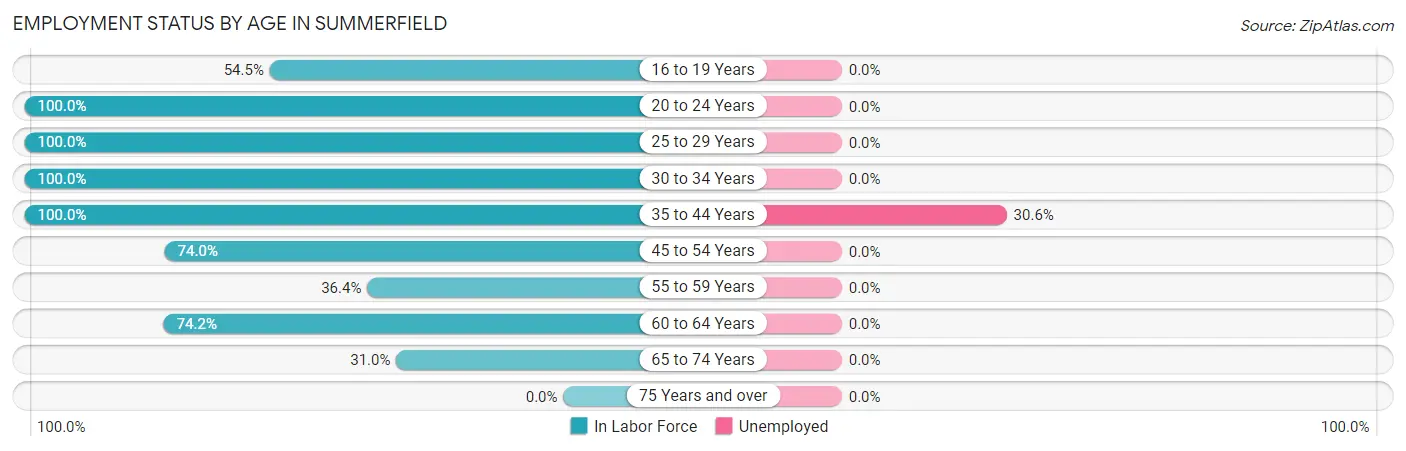
| Age Bracket | In Labor Force | Unemployed |
| 16 to 19 Years | 6 (54.5%) | 0 (0.0%) |
| 20 to 24 Years | 18 (100.0%) | 0 (0.0%) |
| 25 to 29 Years | 10 (100.0%) | 0 (0.0%) |
| 30 to 34 Years | 31 (100.0%) | 0 (0.0%) |
| 35 to 44 Years | 72 (100.0%) | 22 (30.6%) |
| 45 to 54 Years | 71 (74.0%) | 0 (0.0%) |
| 55 to 59 Years | 12 (36.4%) | 0 (0.0%) |
| 60 to 64 Years | 23 (74.2%) | 0 (0.0%) |
| 65 to 74 Years | 9 (31.0%) | 0 (0.0%) |
| 75 Years and over | 0 (0.0%) | 0 (0.0%) |
| Total | 252 (67.7%) | 22 (8.7%) |
Employment Status by Educational Attainment in Summerfield
According to labor force statistics for Summerfield, 80.2% of individuals (219) out of the total population between 25 and 64 years of age (273) are in the labor force, with 10.0% or 22 of them being unemployed. The group with the highest labor force participation rate are those with the educational attainment of bachelor's degree or higher, with 100.0% or 46 individuals in the labor force. Within the labor force, individuals with high school diploma education have the highest percentage of unemployment, with 24.2% or 16 of them being unemployed.
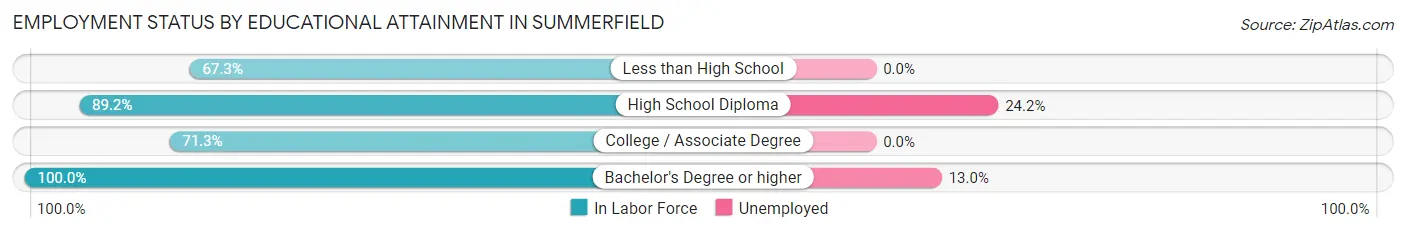
| Educational Attainment | In Labor Force | Unemployed |
| Less than High School | 35 (67.3%) | 0 (0.0%) |
| High School Diploma | 66 (89.2%) | 18 (24.2%) |
| College / Associate Degree | 72 (71.3%) | 0 (0.0%) |
| Bachelor's Degree or higher | 46 (100.0%) | 6 (13.0%) |
| Total | 219 (80.2%) | 27 (10.0%) |
Employment Occupations by Sex in Summerfield
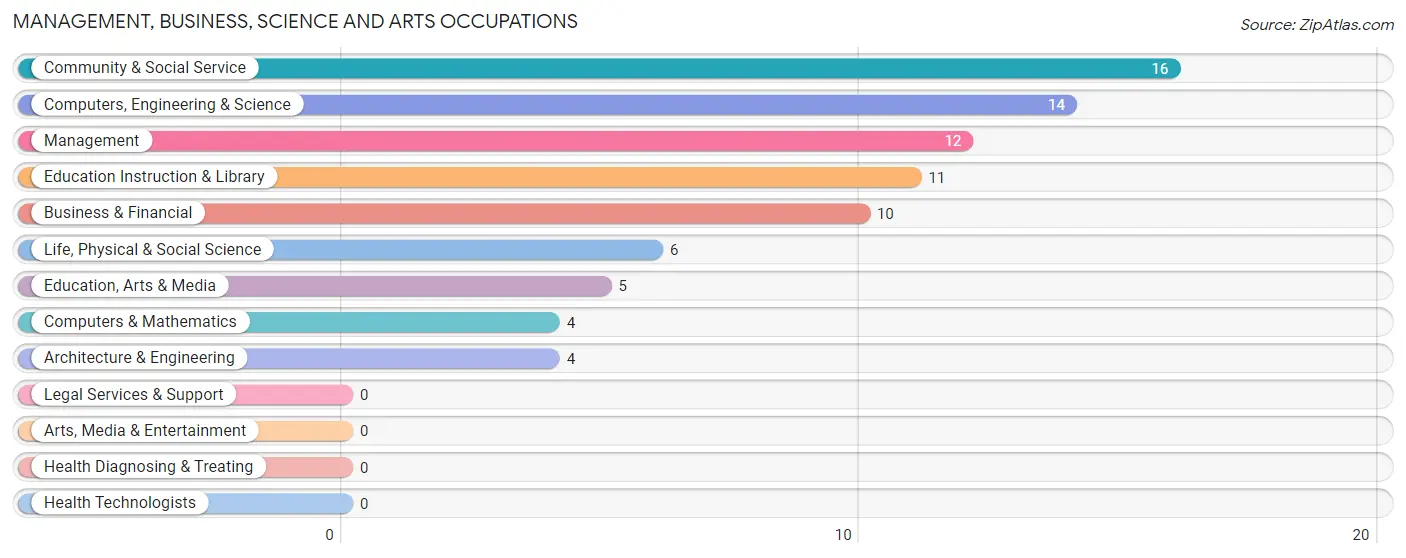
Management, Business, Science and Arts Occupations
The most common Management, Business, Science and Arts occupations in Summerfield are Community & Social Service (16 | 7.0%), Computers, Engineering & Science (14 | 6.1%), Management (12 | 5.2%), Education Instruction & Library (11 | 4.8%), and Business & Financial (10 | 4.3%).
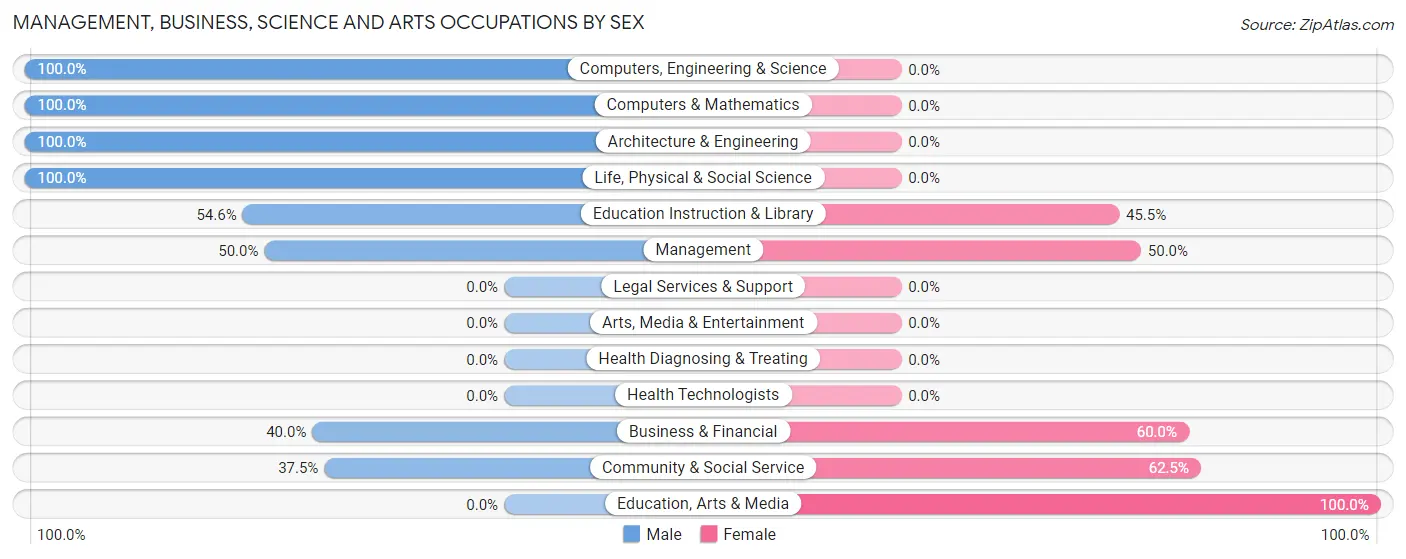
Management, Business, Science and Arts Occupations by Sex
Within the Management, Business, Science and Arts occupations in Summerfield, the most male-oriented occupations are Computers, Engineering & Science (100.0%), Computers & Mathematics (100.0%), and Architecture & Engineering (100.0%), while the most female-oriented occupations are Education, Arts & Media (100.0%), Community & Social Service (62.5%), and Business & Financial (60.0%).
| Occupation | Male | Female |
| Management | 6 (50.0%) | 6 (50.0%) |
| Business & Financial | 4 (40.0%) | 6 (60.0%) |
| Computers, Engineering & Science | 14 (100.0%) | 0 (0.0%) |
| Computers & Mathematics | 4 (100.0%) | 0 (0.0%) |
| Architecture & Engineering | 4 (100.0%) | 0 (0.0%) |
| Life, Physical & Social Science | 6 (100.0%) | 0 (0.0%) |
| Community & Social Service | 6 (37.5%) | 10 (62.5%) |
| Education, Arts & Media | 0 (0.0%) | 5 (100.0%) |
| Legal Services & Support | 0 (0.0%) | 0 (0.0%) |
| Education Instruction & Library | 6 (54.5%) | 5 (45.5%) |
| Arts, Media & Entertainment | 0 (0.0%) | 0 (0.0%) |
| Health Diagnosing & Treating | 0 (0.0%) | 0 (0.0%) |
| Health Technologists | 0 (0.0%) | 0 (0.0%) |
| Total (Category) | 30 (57.7%) | 22 (42.3%) |
| Total (Overall) | 139 (60.4%) | 91 (39.6%) |
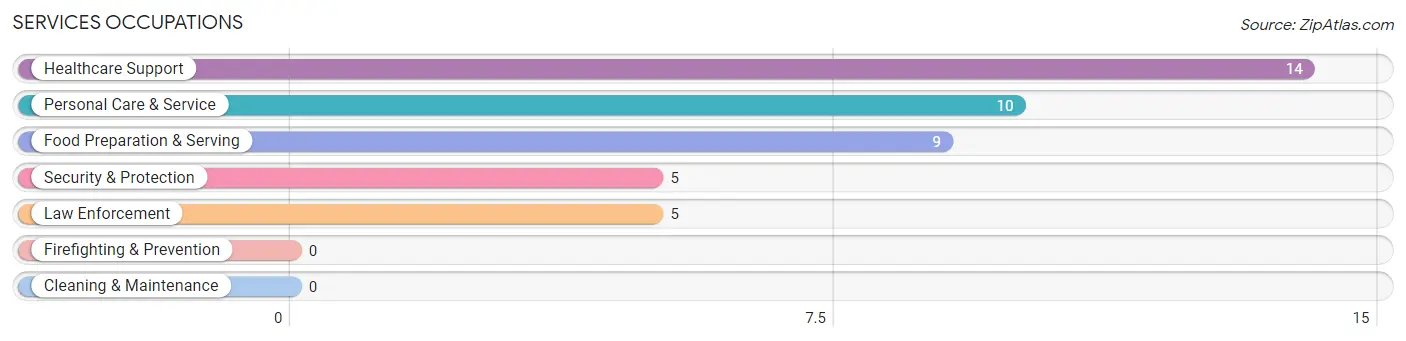
Services Occupations
The most common Services occupations in Summerfield are Healthcare Support (14 | 6.1%), Personal Care & Service (10 | 4.3%), Food Preparation & Serving (9 | 3.9%), Security & Protection (5 | 2.2%), and Law Enforcement (5 | 2.2%).
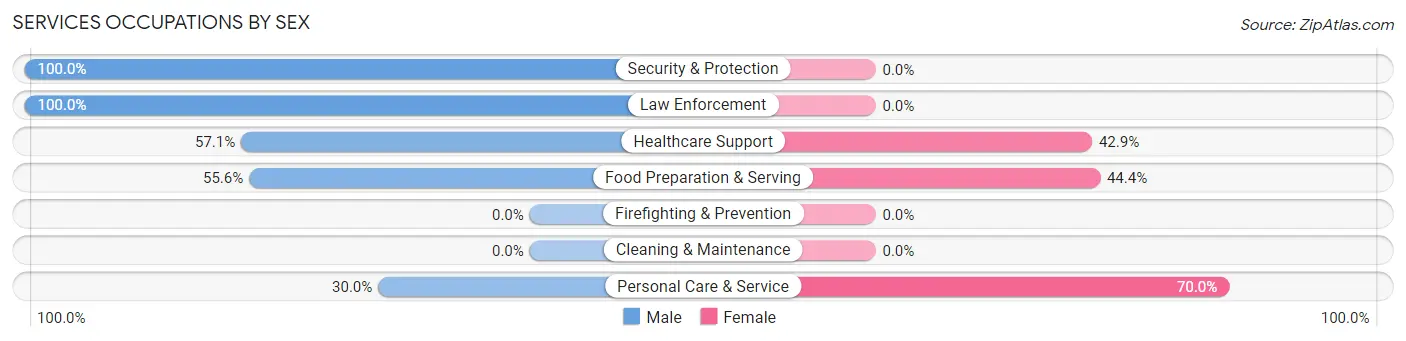
Services Occupations by Sex
Within the Services occupations in Summerfield, the most male-oriented occupations are Security & Protection (100.0%), Law Enforcement (100.0%), and Healthcare Support (57.1%), while the most female-oriented occupations are Personal Care & Service (70.0%), Food Preparation & Serving (44.4%), and Healthcare Support (42.9%).
| Occupation | Male | Female |
| Healthcare Support | 8 (57.1%) | 6 (42.9%) |
| Security & Protection | 5 (100.0%) | 0 (0.0%) |
| Firefighting & Prevention | 0 (0.0%) | 0 (0.0%) |
| Law Enforcement | 5 (100.0%) | 0 (0.0%) |
| Food Preparation & Serving | 5 (55.6%) | 4 (44.4%) |
| Cleaning & Maintenance | 0 (0.0%) | 0 (0.0%) |
| Personal Care & Service | 3 (30.0%) | 7 (70.0%) |
| Total (Category) | 21 (55.3%) | 17 (44.7%) |
| Total (Overall) | 139 (60.4%) | 91 (39.6%) |
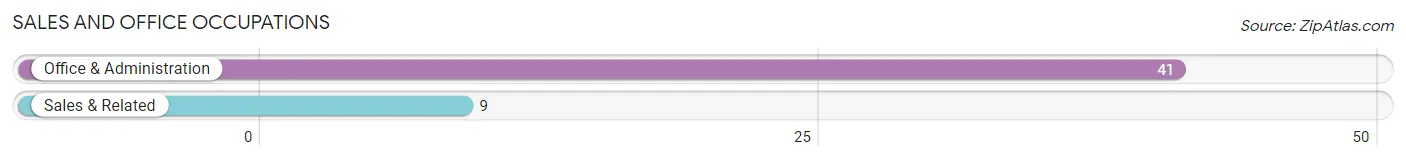
Sales and Office Occupations
The most common Sales and Office occupations in Summerfield are Office & Administration (41 | 17.8%), and Sales & Related (9 | 3.9%).
Sales and Office Occupations by Sex
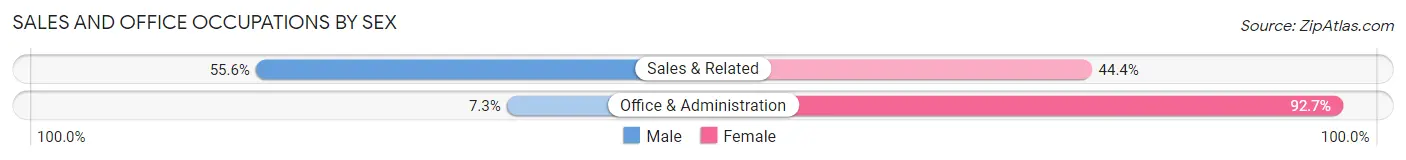
| Occupation | Male | Female |
| Sales & Related | 5 (55.6%) | 4 (44.4%) |
| Office & Administration | 3 (7.3%) | 38 (92.7%) |
| Total (Category) | 8 (16.0%) | 42 (84.0%) |
| Total (Overall) | 139 (60.4%) | 91 (39.6%) |
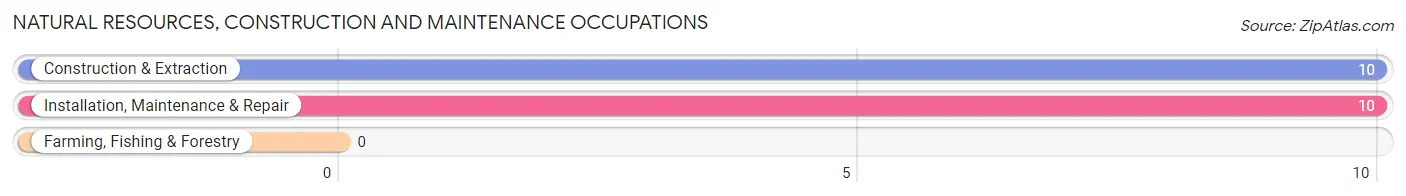
Natural Resources, Construction and Maintenance Occupations
The most common Natural Resources, Construction and Maintenance occupations in Summerfield are Construction & Extraction (10 | 4.3%), and Installation, Maintenance & Repair (10 | 4.3%).
Natural Resources, Construction and Maintenance Occupations by Sex
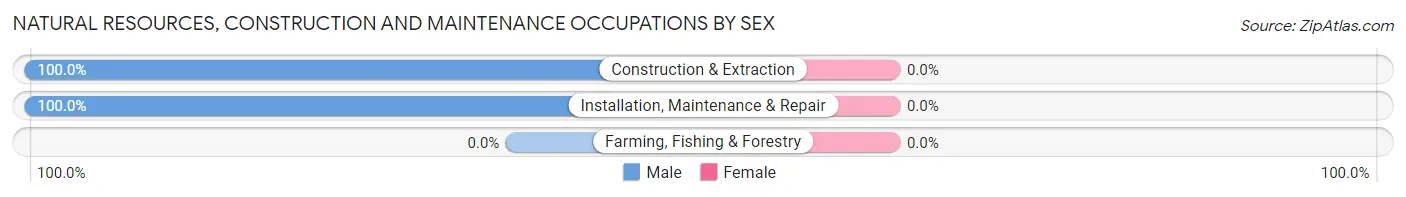
| Occupation | Male | Female |
| Farming, Fishing & Forestry | 0 (0.0%) | 0 (0.0%) |
| Construction & Extraction | 10 (100.0%) | 0 (0.0%) |
| Installation, Maintenance & Repair | 10 (100.0%) | 0 (0.0%) |
| Total (Category) | 20 (100.0%) | 0 (0.0%) |
| Total (Overall) | 139 (60.4%) | 91 (39.6%) |
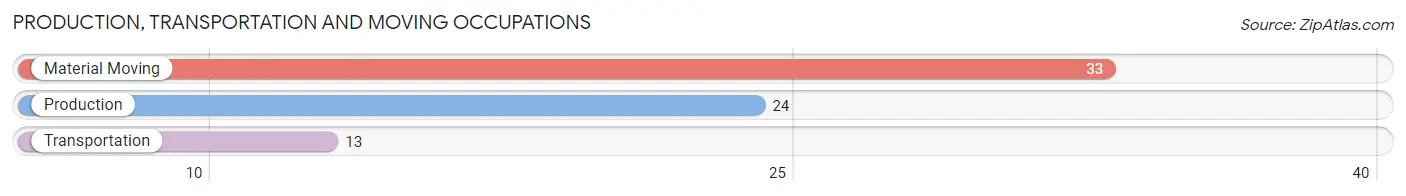
Production, Transportation and Moving Occupations
The most common Production, Transportation and Moving occupations in Summerfield are Material Moving (33 | 14.3%), Production (24 | 10.4%), and Transportation (13 | 5.7%).
Production, Transportation and Moving Occupations by Sex
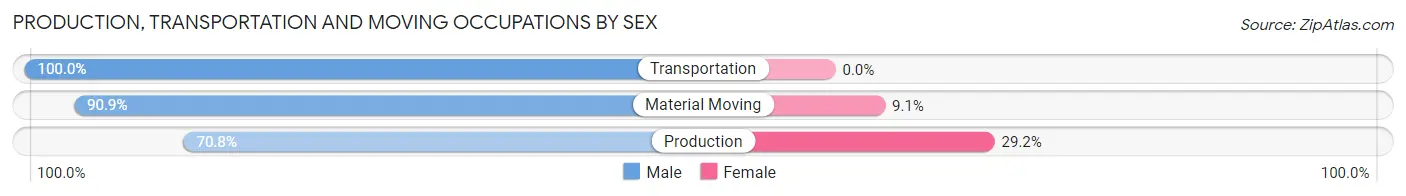
| Occupation | Male | Female |
| Production | 17 (70.8%) | 7 (29.2%) |
| Transportation | 13 (100.0%) | 0 (0.0%) |
| Material Moving | 30 (90.9%) | 3 (9.1%) |
| Total (Category) | 60 (85.7%) | 10 (14.3%) |
| Total (Overall) | 139 (60.4%) | 91 (39.6%) |
Employment Industries by Sex in Summerfield
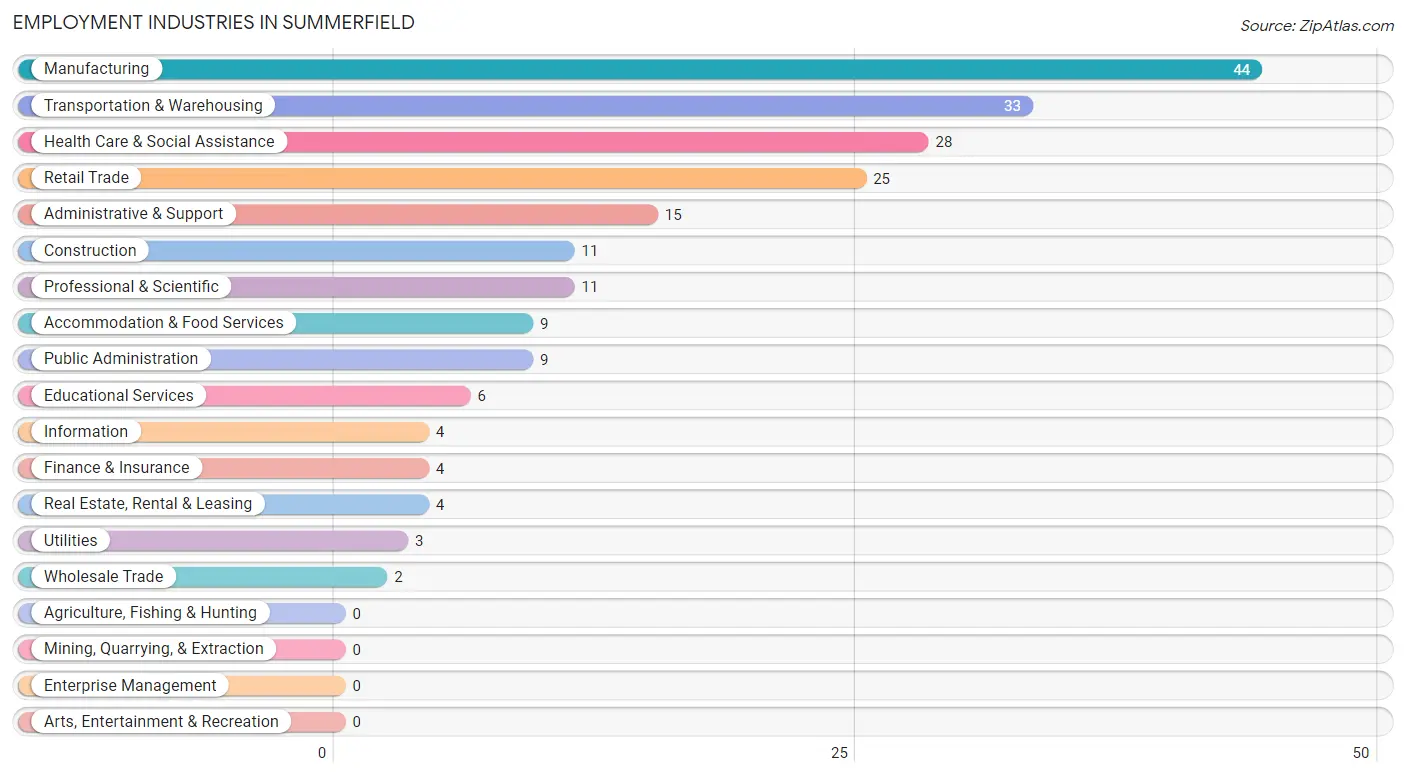
Employment Industries in Summerfield
The major employment industries in Summerfield include Manufacturing (44 | 19.1%), Transportation & Warehousing (33 | 14.3%), Health Care & Social Assistance (28 | 12.2%), Retail Trade (25 | 10.9%), and Administrative & Support (15 | 6.5%).
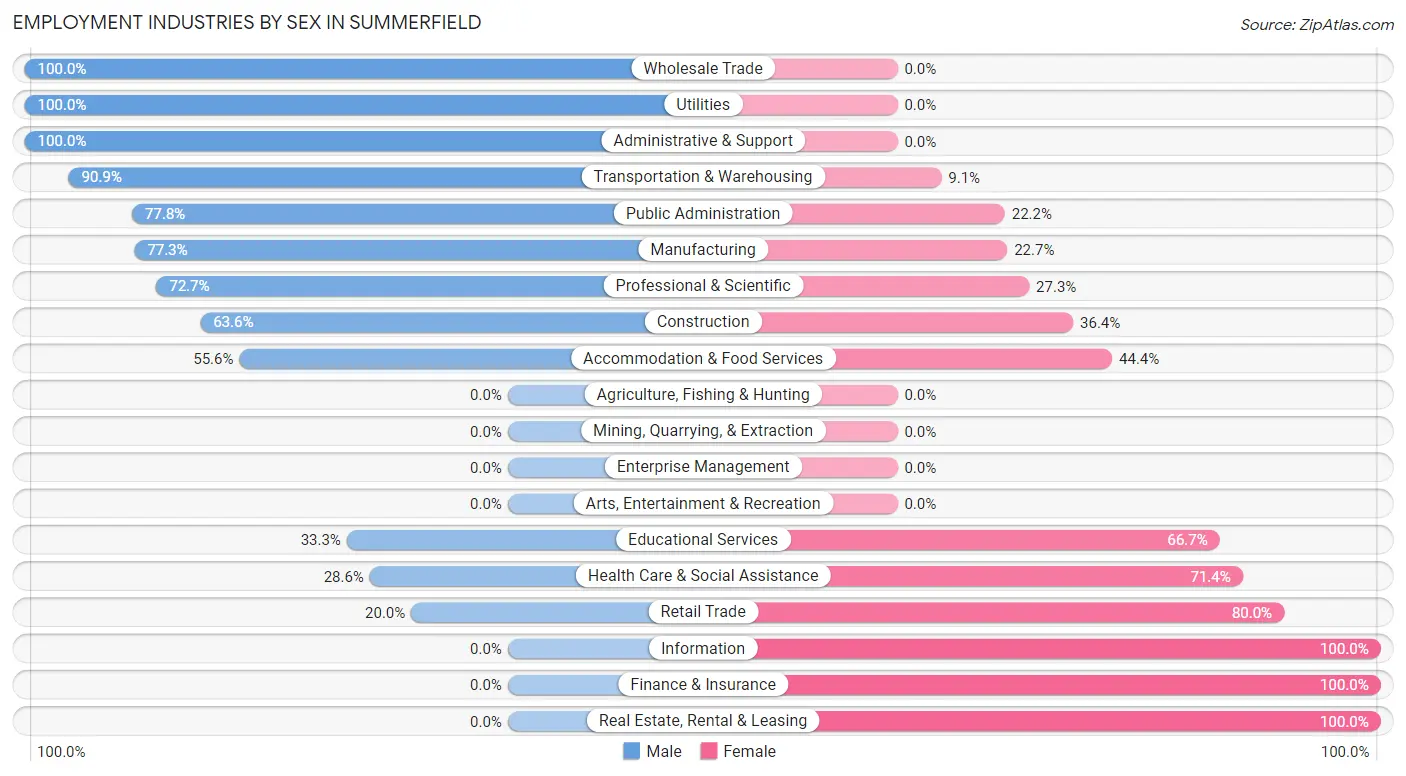
Employment Industries by Sex in Summerfield
The Summerfield industries that see more men than women are Wholesale Trade (100.0%), Utilities (100.0%), and Administrative & Support (100.0%), whereas the industries that tend to have a higher number of women are Information (100.0%), Finance & Insurance (100.0%), and Real Estate, Rental & Leasing (100.0%).
| Industry | Male | Female |
| Agriculture, Fishing & Hunting | 0 (0.0%) | 0 (0.0%) |
| Mining, Quarrying, & Extraction | 0 (0.0%) | 0 (0.0%) |
| Construction | 7 (63.6%) | 4 (36.4%) |
| Manufacturing | 34 (77.3%) | 10 (22.7%) |
| Wholesale Trade | 2 (100.0%) | 0 (0.0%) |
| Retail Trade | 5 (20.0%) | 20 (80.0%) |
| Transportation & Warehousing | 30 (90.9%) | 3 (9.1%) |
| Utilities | 3 (100.0%) | 0 (0.0%) |
| Information | 0 (0.0%) | 4 (100.0%) |
| Finance & Insurance | 0 (0.0%) | 4 (100.0%) |
| Real Estate, Rental & Leasing | 0 (0.0%) | 4 (100.0%) |
| Professional & Scientific | 8 (72.7%) | 3 (27.3%) |
| Enterprise Management | 0 (0.0%) | 0 (0.0%) |
| Administrative & Support | 15 (100.0%) | 0 (0.0%) |
| Educational Services | 2 (33.3%) | 4 (66.7%) |
| Health Care & Social Assistance | 8 (28.6%) | 20 (71.4%) |
| Arts, Entertainment & Recreation | 0 (0.0%) | 0 (0.0%) |
| Accommodation & Food Services | 5 (55.6%) | 4 (44.4%) |
| Public Administration | 7 (77.8%) | 2 (22.2%) |
| Total | 139 (60.4%) | 91 (39.6%) |
Education in Summerfield
School Enrollment in Summerfield
The most common levels of schooling among the 47 students in Summerfield are middle school (16 | 34.0%), elementary school (13 | 27.7%), and college / undergraduate (13 | 27.7%).
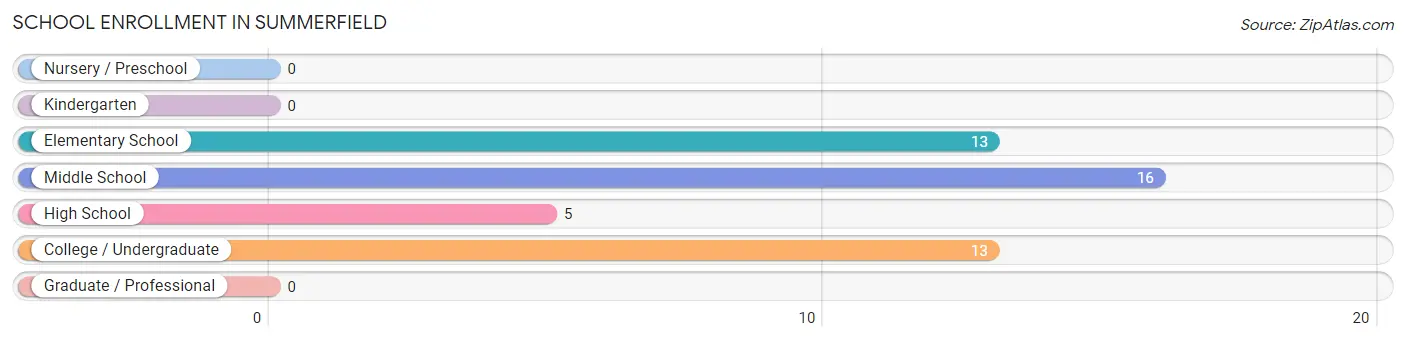
| School Level | # Students | % Students |
| Nursery / Preschool | 0 | 0.0% |
| Kindergarten | 0 | 0.0% |
| Elementary School | 13 | 27.7% |
| Middle School | 16 | 34.0% |
| High School | 5 | 10.6% |
| College / Undergraduate | 13 | 27.7% |
| Graduate / Professional | 0 | 0.0% |
| Total | 47 | 100.0% |
School Enrollment by Age by Funding Source in Summerfield
Out of a total of 47 students who are enrolled in schools in Summerfield, 3 (6.4%) attend a private institution, while the remaining 44 (93.6%) are enrolled in public schools. The age group of 5 to 9 year old has the highest likelihood of being enrolled in private schools, with 3 (37.5% in the age bracket) enrolled. Conversely, the age group of 10 to 14 year olds has the lowest likelihood of being enrolled in a private school, with 21 (100.0% in the age bracket) attending a public institution.
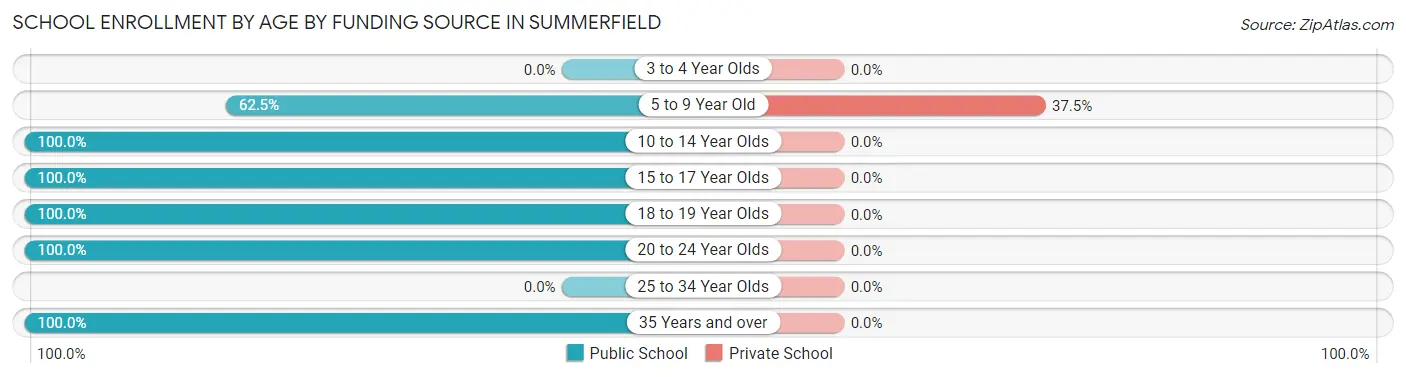
| Age Bracket | Public School | Private School |
| 3 to 4 Year Olds | 0 (0.0%) | 0 (0.0%) |
| 5 to 9 Year Old | 5 (62.5%) | 3 (37.5%) |
| 10 to 14 Year Olds | 21 (100.0%) | 0 (0.0%) |
| 15 to 17 Year Olds | 5 (100.0%) | 0 (0.0%) |
| 18 to 19 Year Olds | 6 (100.0%) | 0 (0.0%) |
| 20 to 24 Year Olds | 4 (100.0%) | 0 (0.0%) |
| 25 to 34 Year Olds | 0 (0.0%) | 0 (0.0%) |
| 35 Years and over | 3 (100.0%) | 0 (0.0%) |
| Total | 44 (93.6%) | 3 (6.4%) |
Educational Attainment by Field of Study in Summerfield
Business (23 | 42.6%), bio, nature & agricultural (8 | 14.8%), physical & health sciences (8 | 14.8%), literature & languages (6 | 11.1%), and arts & humanities (5 | 9.3%) are the most common fields of study among 54 individuals in Summerfield who have obtained a bachelor's degree or higher.
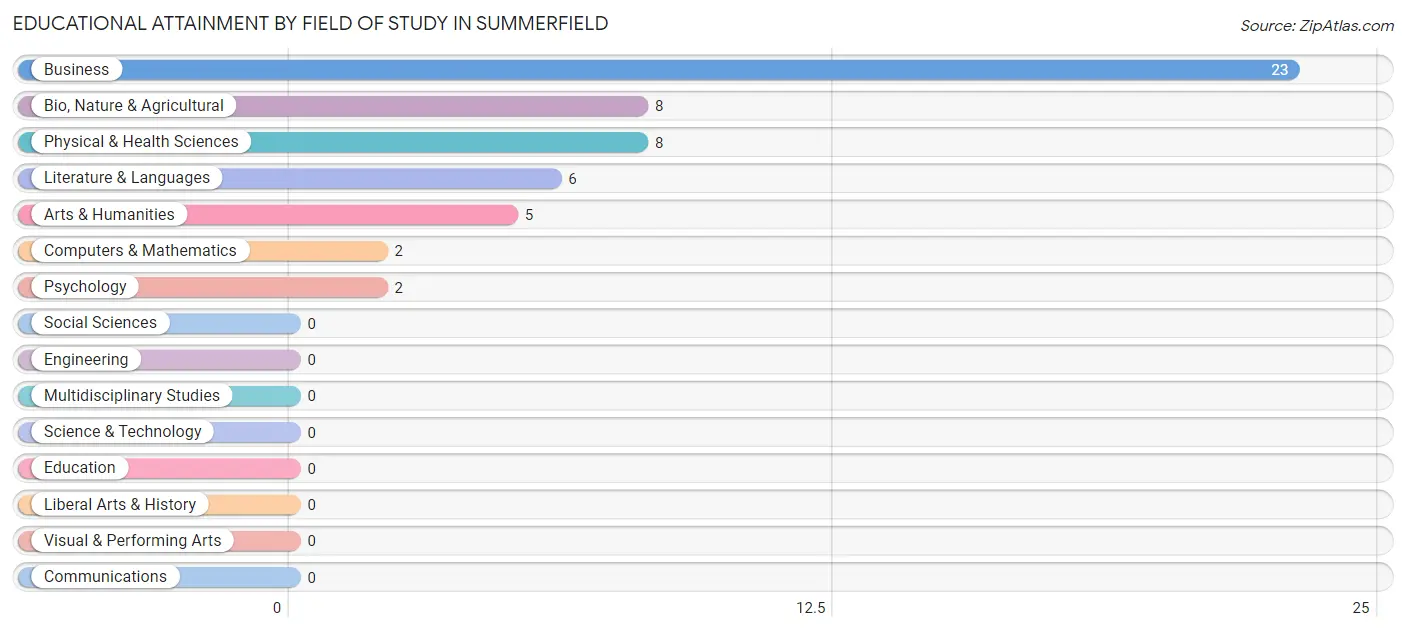
| Field of Study | # Graduates | % Graduates |
| Computers & Mathematics | 2 | 3.7% |
| Bio, Nature & Agricultural | 8 | 14.8% |
| Physical & Health Sciences | 8 | 14.8% |
| Psychology | 2 | 3.7% |
| Social Sciences | 0 | 0.0% |
| Engineering | 0 | 0.0% |
| Multidisciplinary Studies | 0 | 0.0% |
| Science & Technology | 0 | 0.0% |
| Business | 23 | 42.6% |
| Education | 0 | 0.0% |
| Literature & Languages | 6 | 11.1% |
| Liberal Arts & History | 0 | 0.0% |
| Visual & Performing Arts | 0 | 0.0% |
| Communications | 0 | 0.0% |
| Arts & Humanities | 5 | 9.3% |
| Total | 54 | 100.0% |
Transportation & Commute in Summerfield
Vehicle Availability by Sex in Summerfield
The most prevalent vehicle ownership categories in Summerfield are males with 3 vehicles (65, accounting for 48.5%) and females with 3 vehicles (58, making up 71.4%).
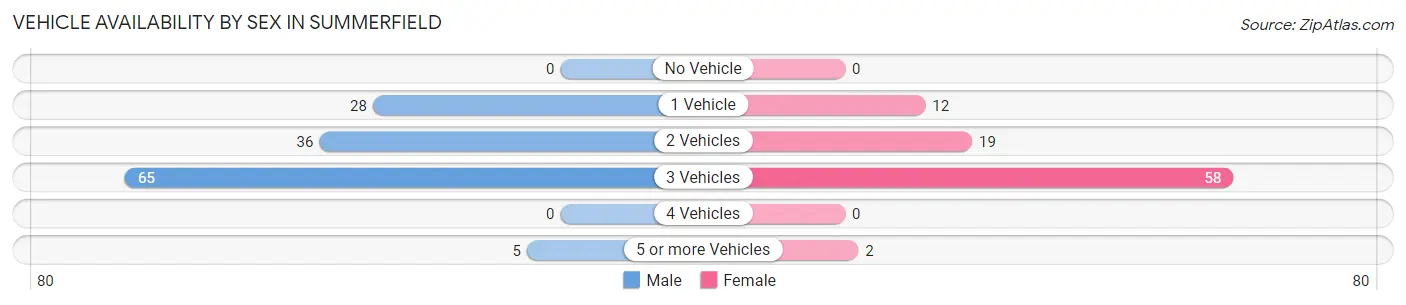
| Vehicles Available | Male | Female |
| No Vehicle | 0 (0.0%) | 0 (0.0%) |
| 1 Vehicle | 28 (20.9%) | 12 (13.2%) |
| 2 Vehicles | 36 (26.9%) | 19 (20.9%) |
| 3 Vehicles | 65 (48.5%) | 58 (63.7%) |
| 4 Vehicles | 0 (0.0%) | 0 (0.0%) |
| 5 or more Vehicles | 5 (3.7%) | 2 (2.2%) |
| Total | 134 (100.0%) | 91 (100.0%) |
Commute Time in Summerfield
The most frequently occuring commute durations in Summerfield are 10 to 14 minutes (43 commuters, 20.0%), 20 to 24 minutes (35 commuters, 16.3%), and 35 to 39 minutes (28 commuters, 13.0%).
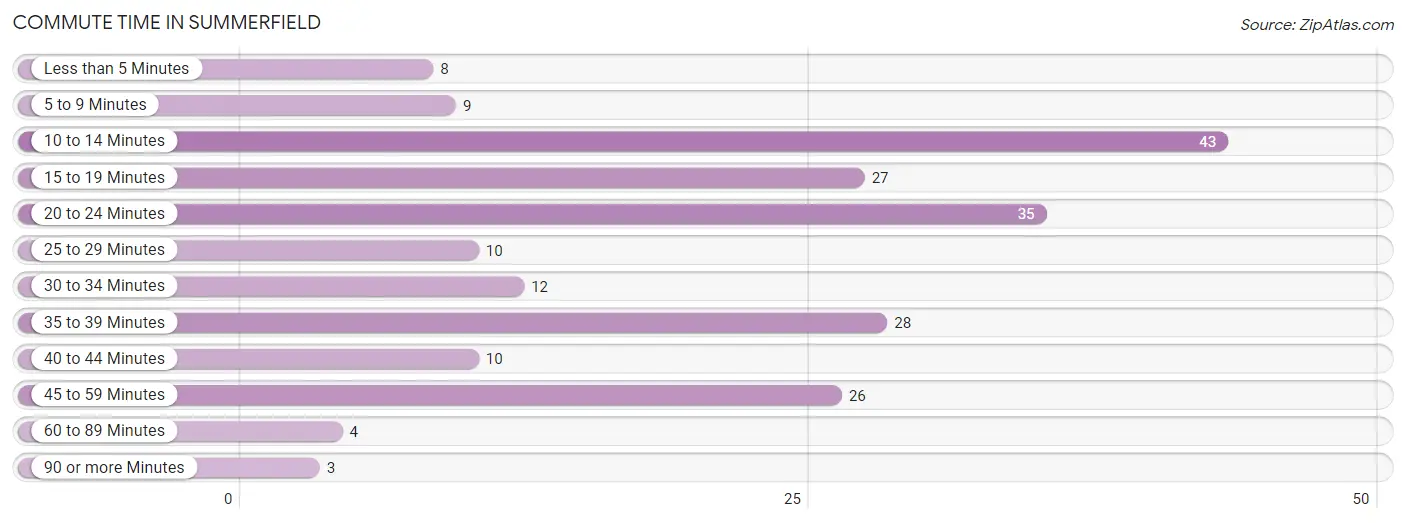
| Commute Time | # Commuters | % Commuters |
| Less than 5 Minutes | 8 | 3.7% |
| 5 to 9 Minutes | 9 | 4.2% |
| 10 to 14 Minutes | 43 | 20.0% |
| 15 to 19 Minutes | 27 | 12.6% |
| 20 to 24 Minutes | 35 | 16.3% |
| 25 to 29 Minutes | 10 | 4.6% |
| 30 to 34 Minutes | 12 | 5.6% |
| 35 to 39 Minutes | 28 | 13.0% |
| 40 to 44 Minutes | 10 | 4.6% |
| 45 to 59 Minutes | 26 | 12.1% |
| 60 to 89 Minutes | 4 | 1.9% |
| 90 or more Minutes | 3 | 1.4% |
Commute Time by Sex in Summerfield
The most common commute times in Summerfield are 10 to 14 minutes (33 commuters, 25.8%) for males and 20 to 24 minutes (22 commuters, 25.3%) for females.
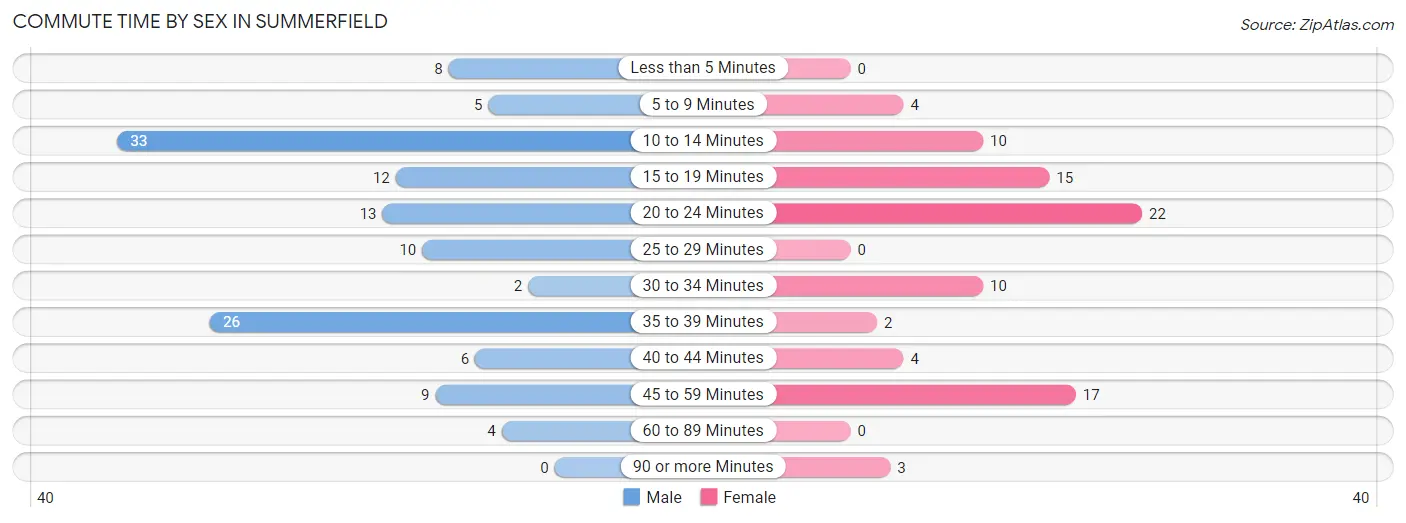
| Commute Time | Male | Female |
| Less than 5 Minutes | 8 (6.2%) | 0 (0.0%) |
| 5 to 9 Minutes | 5 (3.9%) | 4 (4.6%) |
| 10 to 14 Minutes | 33 (25.8%) | 10 (11.5%) |
| 15 to 19 Minutes | 12 (9.4%) | 15 (17.2%) |
| 20 to 24 Minutes | 13 (10.2%) | 22 (25.3%) |
| 25 to 29 Minutes | 10 (7.8%) | 0 (0.0%) |
| 30 to 34 Minutes | 2 (1.6%) | 10 (11.5%) |
| 35 to 39 Minutes | 26 (20.3%) | 2 (2.3%) |
| 40 to 44 Minutes | 6 (4.7%) | 4 (4.6%) |
| 45 to 59 Minutes | 9 (7.0%) | 17 (19.5%) |
| 60 to 89 Minutes | 4 (3.1%) | 0 (0.0%) |
| 90 or more Minutes | 0 (0.0%) | 3 (3.5%) |
Time of Departure to Work by Sex in Summerfield
The most frequent times of departure to work in Summerfield are 4:00 PM to 11:59 PM (22, 17.2%) for males and 7:00 AM to 7:29 AM (22, 25.3%) for females.
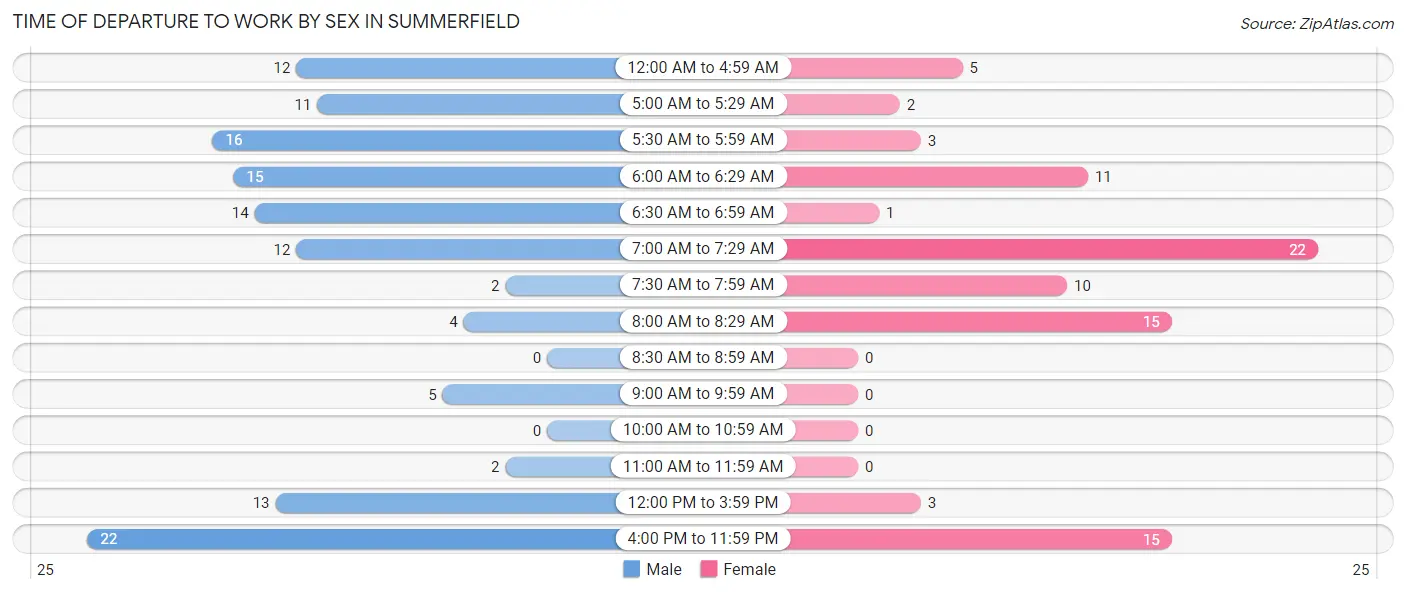
| Time of Departure | Male | Female |
| 12:00 AM to 4:59 AM | 12 (9.4%) | 5 (5.8%) |
| 5:00 AM to 5:29 AM | 11 (8.6%) | 2 (2.3%) |
| 5:30 AM to 5:59 AM | 16 (12.5%) | 3 (3.5%) |
| 6:00 AM to 6:29 AM | 15 (11.7%) | 11 (12.6%) |
| 6:30 AM to 6:59 AM | 14 (10.9%) | 1 (1.1%) |
| 7:00 AM to 7:29 AM | 12 (9.4%) | 22 (25.3%) |
| 7:30 AM to 7:59 AM | 2 (1.6%) | 10 (11.5%) |
| 8:00 AM to 8:29 AM | 4 (3.1%) | 15 (17.2%) |
| 8:30 AM to 8:59 AM | 0 (0.0%) | 0 (0.0%) |
| 9:00 AM to 9:59 AM | 5 (3.9%) | 0 (0.0%) |
| 10:00 AM to 10:59 AM | 0 (0.0%) | 0 (0.0%) |
| 11:00 AM to 11:59 AM | 2 (1.6%) | 0 (0.0%) |
| 12:00 PM to 3:59 PM | 13 (10.2%) | 3 (3.5%) |
| 4:00 PM to 11:59 PM | 22 (17.2%) | 15 (17.2%) |
| Total | 128 (100.0%) | 87 (100.0%) |
Housing Occupancy in Summerfield
Occupancy by Ownership in Summerfield
Of the total 203 dwellings in Summerfield, owner-occupied units account for 157 (77.3%), while renter-occupied units make up 46 (22.7%).
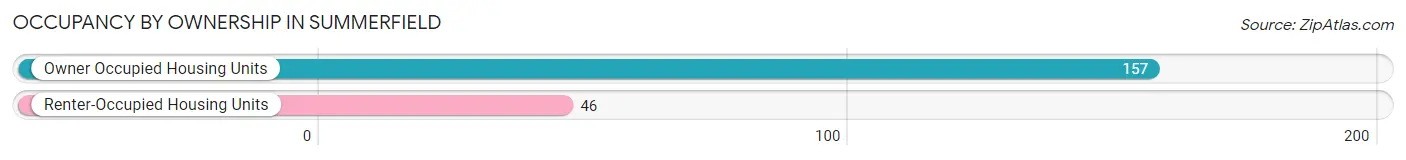
| Occupancy | # Housing Units | % Housing Units |
| Owner Occupied Housing Units | 157 | 77.3% |
| Renter-Occupied Housing Units | 46 | 22.7% |
| Total Occupied Housing Units | 203 | 100.0% |
Occupancy by Household Size in Summerfield
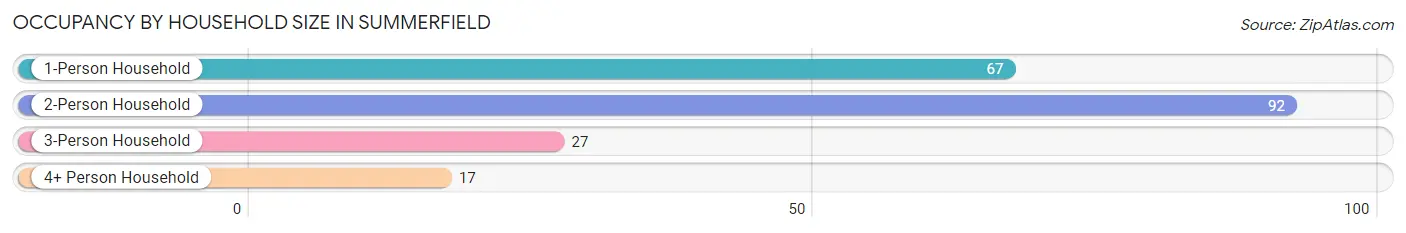
| Household Size | # Housing Units | % Housing Units |
| 1-Person Household | 67 | 33.0% |
| 2-Person Household | 92 | 45.3% |
| 3-Person Household | 27 | 13.3% |
| 4+ Person Household | 17 | 8.4% |
| Total Housing Units | 203 | 100.0% |
Occupancy by Ownership by Household Size in Summerfield
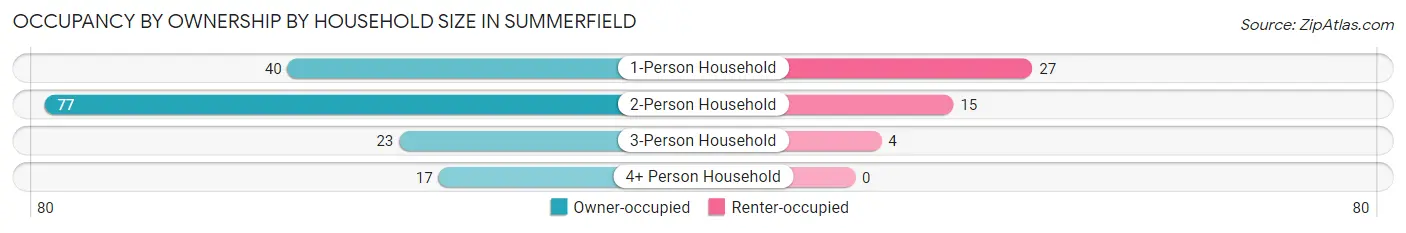
| Household Size | Owner-occupied | Renter-occupied |
| 1-Person Household | 40 (59.7%) | 27 (40.3%) |
| 2-Person Household | 77 (83.7%) | 15 (16.3%) |
| 3-Person Household | 23 (85.2%) | 4 (14.8%) |
| 4+ Person Household | 17 (100.0%) | 0 (0.0%) |
| Total Housing Units | 157 (77.3%) | 46 (22.7%) |
Occupancy by Educational Attainment in Summerfield
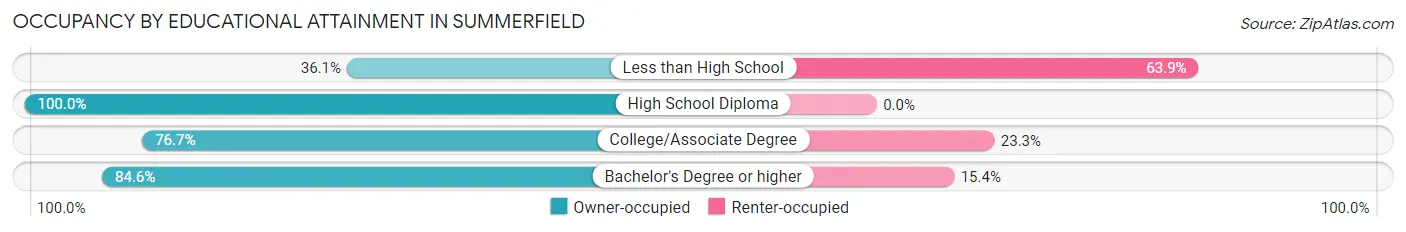
| Household Size | Owner-occupied | Renter-occupied |
| Less than High School | 13 (36.1%) | 23 (63.9%) |
| High School Diploma | 64 (100.0%) | 0 (0.0%) |
| College/Associate Degree | 69 (76.7%) | 21 (23.3%) |
| Bachelor's Degree or higher | 11 (84.6%) | 2 (15.4%) |
Occupancy by Age of Householder in Summerfield
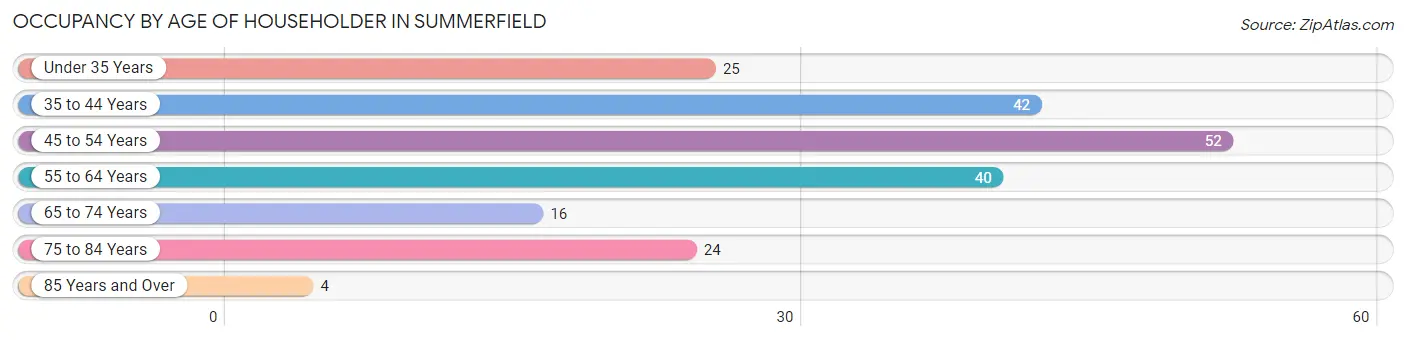
| Age Bracket | # Households | % Households |
| Under 35 Years | 25 | 12.3% |
| 35 to 44 Years | 42 | 20.7% |
| 45 to 54 Years | 52 | 25.6% |
| 55 to 64 Years | 40 | 19.7% |
| 65 to 74 Years | 16 | 7.9% |
| 75 to 84 Years | 24 | 11.8% |
| 85 Years and Over | 4 | 2.0% |
| Total | 203 | 100.0% |
Housing Finances in Summerfield
Median Income by Occupancy in Summerfield
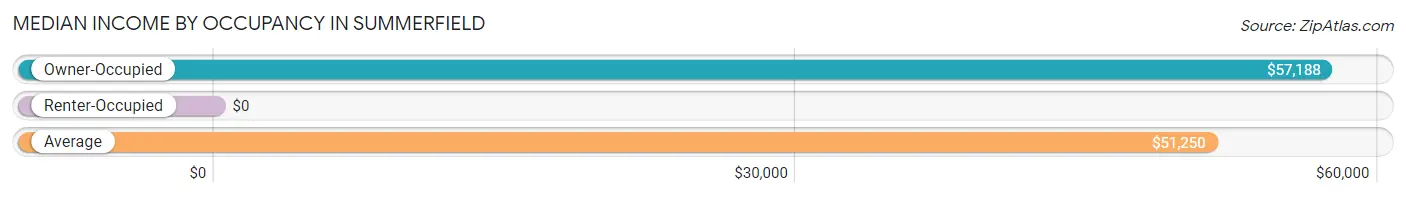
| Occupancy Type | # Households | Median Income |
| Owner-Occupied | 157 (77.3%) | $57,188 |
| Renter-Occupied | 46 (22.7%) | $0 |
| Average | 203 (100.0%) | $51,250 |
Occupancy by Householder Income Bracket in Summerfield
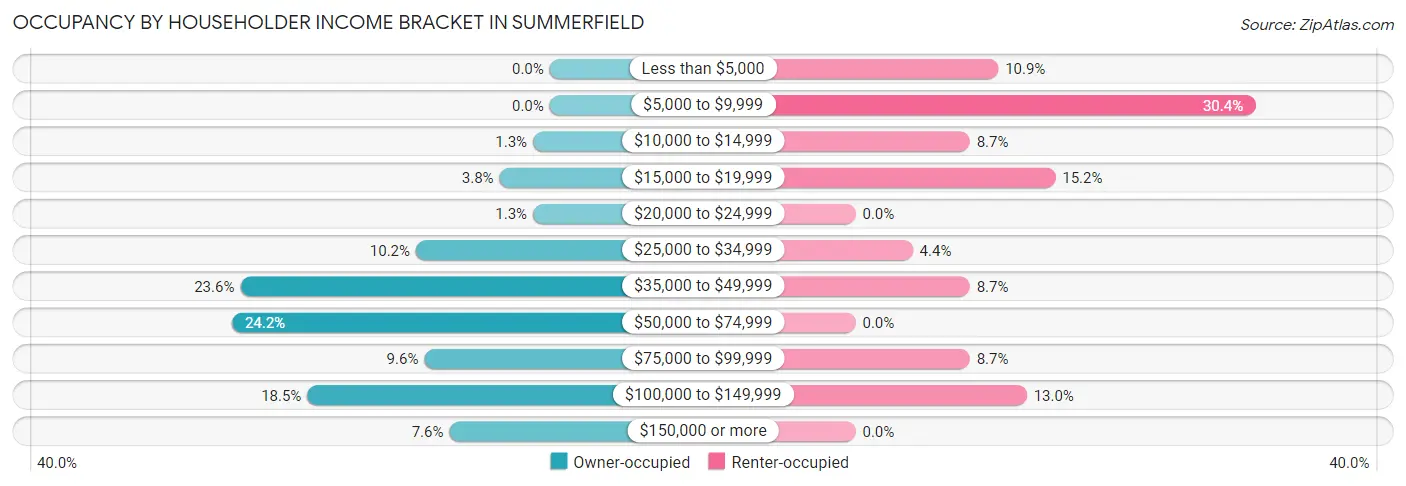
| Income Bracket | Owner-occupied | Renter-occupied |
| Less than $5,000 | 0 (0.0%) | 5 (10.9%) |
| $5,000 to $9,999 | 0 (0.0%) | 14 (30.4%) |
| $10,000 to $14,999 | 2 (1.3%) | 4 (8.7%) |
| $15,000 to $19,999 | 6 (3.8%) | 7 (15.2%) |
| $20,000 to $24,999 | 2 (1.3%) | 0 (0.0%) |
| $25,000 to $34,999 | 16 (10.2%) | 2 (4.3%) |
| $35,000 to $49,999 | 37 (23.6%) | 4 (8.7%) |
| $50,000 to $74,999 | 38 (24.2%) | 0 (0.0%) |
| $75,000 to $99,999 | 15 (9.6%) | 4 (8.7%) |
| $100,000 to $149,999 | 29 (18.5%) | 6 (13.0%) |
| $150,000 or more | 12 (7.6%) | 0 (0.0%) |
| Total | 157 (100.0%) | 46 (100.0%) |
Monthly Housing Cost Tiers in Summerfield
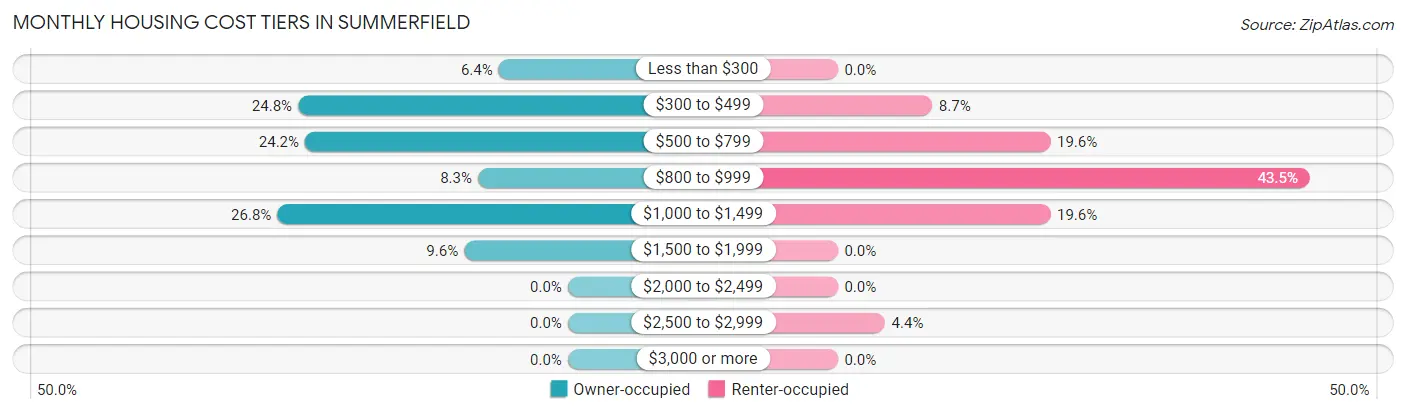
| Monthly Cost | Owner-occupied | Renter-occupied |
| Less than $300 | 10 (6.4%) | 0 (0.0%) |
| $300 to $499 | 39 (24.8%) | 4 (8.7%) |
| $500 to $799 | 38 (24.2%) | 9 (19.6%) |
| $800 to $999 | 13 (8.3%) | 20 (43.5%) |
| $1,000 to $1,499 | 42 (26.8%) | 9 (19.6%) |
| $1,500 to $1,999 | 15 (9.6%) | 0 (0.0%) |
| $2,000 to $2,499 | 0 (0.0%) | 0 (0.0%) |
| $2,500 to $2,999 | 0 (0.0%) | 2 (4.3%) |
| $3,000 or more | 0 (0.0%) | 0 (0.0%) |
| Total | 157 (100.0%) | 46 (100.0%) |
Physical Housing Characteristics in Summerfield
Housing Structures in Summerfield
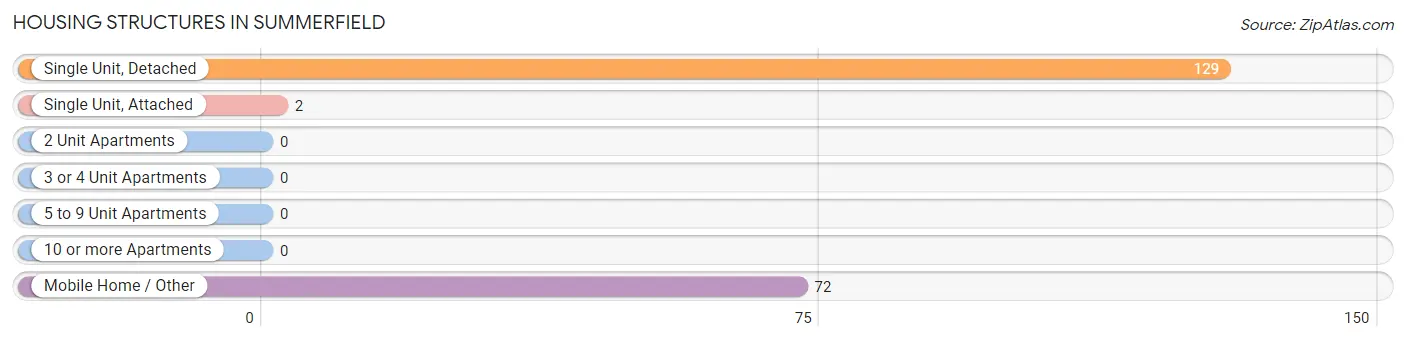
| Structure Type | # Housing Units | % Housing Units |
| Single Unit, Detached | 129 | 63.5% |
| Single Unit, Attached | 2 | 1.0% |
| 2 Unit Apartments | 0 | 0.0% |
| 3 or 4 Unit Apartments | 0 | 0.0% |
| 5 to 9 Unit Apartments | 0 | 0.0% |
| 10 or more Apartments | 0 | 0.0% |
| Mobile Home / Other | 72 | 35.5% |
| Total | 203 | 100.0% |
Housing Structures by Occupancy in Summerfield
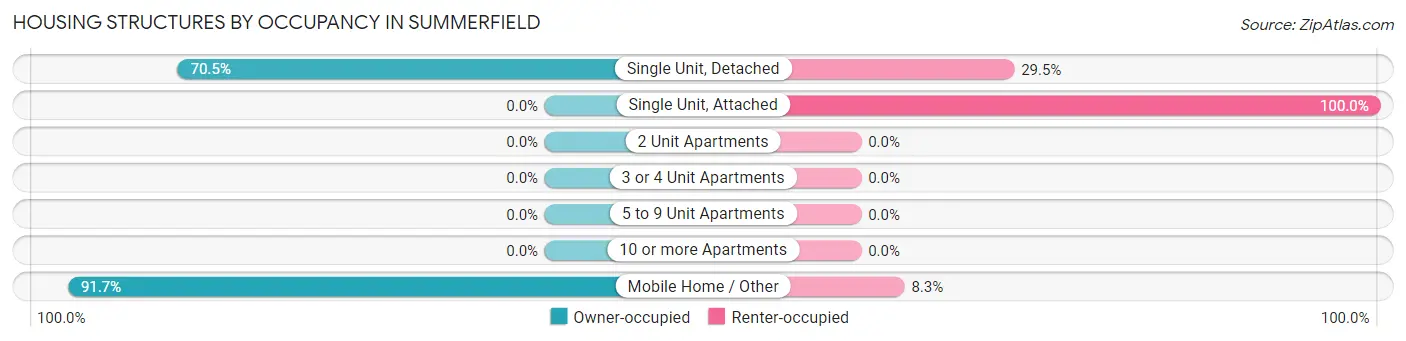
| Structure Type | Owner-occupied | Renter-occupied |
| Single Unit, Detached | 91 (70.5%) | 38 (29.5%) |
| Single Unit, Attached | 0 (0.0%) | 2 (100.0%) |
| 2 Unit Apartments | 0 (0.0%) | 0 (0.0%) |
| 3 or 4 Unit Apartments | 0 (0.0%) | 0 (0.0%) |
| 5 to 9 Unit Apartments | 0 (0.0%) | 0 (0.0%) |
| 10 or more Apartments | 0 (0.0%) | 0 (0.0%) |
| Mobile Home / Other | 66 (91.7%) | 6 (8.3%) |
| Total | 157 (77.3%) | 46 (22.7%) |
Housing Structures by Number of Rooms in Summerfield
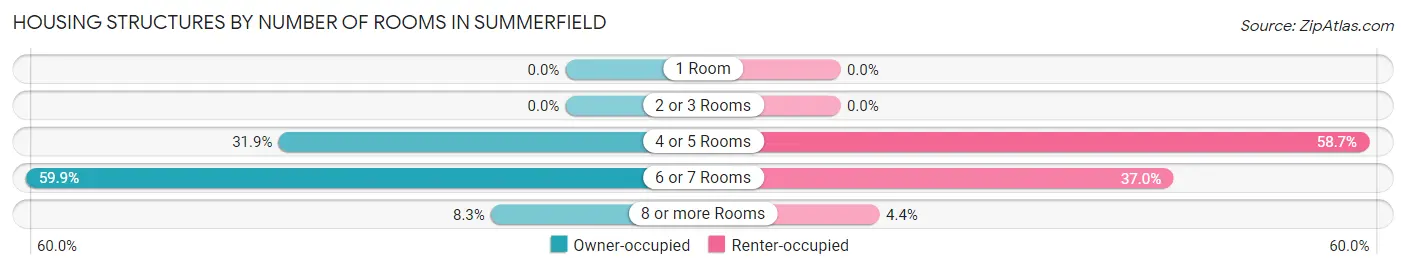
| Number of Rooms | Owner-occupied | Renter-occupied |
| 1 Room | 0 (0.0%) | 0 (0.0%) |
| 2 or 3 Rooms | 0 (0.0%) | 0 (0.0%) |
| 4 or 5 Rooms | 50 (31.9%) | 27 (58.7%) |
| 6 or 7 Rooms | 94 (59.9%) | 17 (37.0%) |
| 8 or more Rooms | 13 (8.3%) | 2 (4.3%) |
| Total | 157 (100.0%) | 46 (100.0%) |
Housing Structure by Heating Type in Summerfield
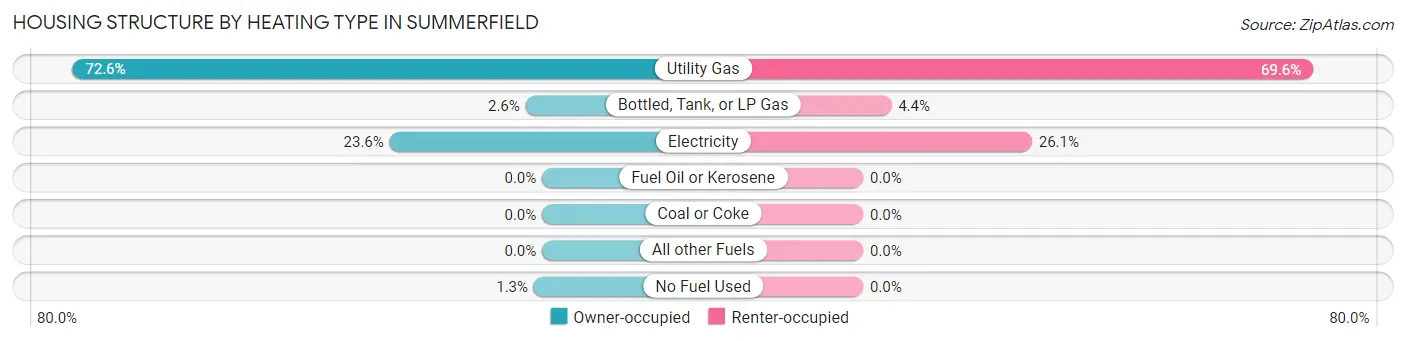
| Heating Type | Owner-occupied | Renter-occupied |
| Utility Gas | 114 (72.6%) | 32 (69.6%) |
| Bottled, Tank, or LP Gas | 4 (2.5%) | 2 (4.3%) |
| Electricity | 37 (23.6%) | 12 (26.1%) |
| Fuel Oil or Kerosene | 0 (0.0%) | 0 (0.0%) |
| Coal or Coke | 0 (0.0%) | 0 (0.0%) |
| All other Fuels | 0 (0.0%) | 0 (0.0%) |
| No Fuel Used | 2 (1.3%) | 0 (0.0%) |
| Total | 157 (100.0%) | 46 (100.0%) |
Household Vehicle Usage in Summerfield
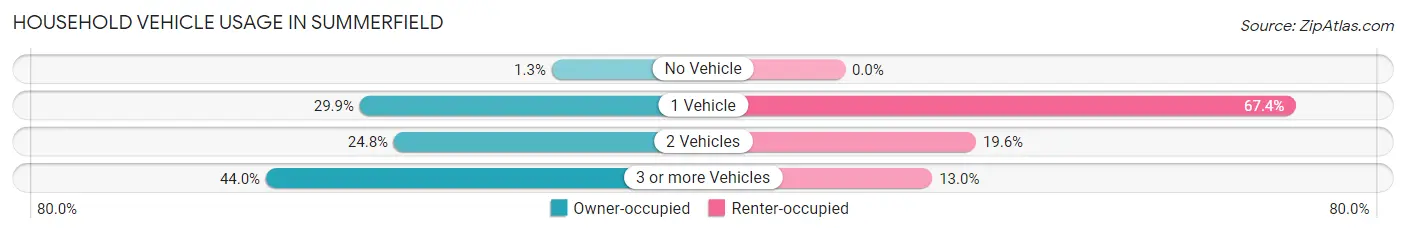
| Vehicles per Household | Owner-occupied | Renter-occupied |
| No Vehicle | 2 (1.3%) | 0 (0.0%) |
| 1 Vehicle | 47 (29.9%) | 31 (67.4%) |
| 2 Vehicles | 39 (24.8%) | 9 (19.6%) |
| 3 or more Vehicles | 69 (44.0%) | 6 (13.0%) |
| Total | 157 (100.0%) | 46 (100.0%) |
Real Estate & Mortgages in Summerfield
Real Estate and Mortgage Overview in Summerfield
| Characteristic | Without Mortgage | With Mortgage |
| Housing Units | 73 | 84 |
| Median Property Value | $45,000 | $87,500 |
| Median Household Income | - | - |
| Monthly Housing Costs | $455 | $0 |
| Real Estate Taxes | $950 | $3 |
Property Value by Mortgage Status in Summerfield
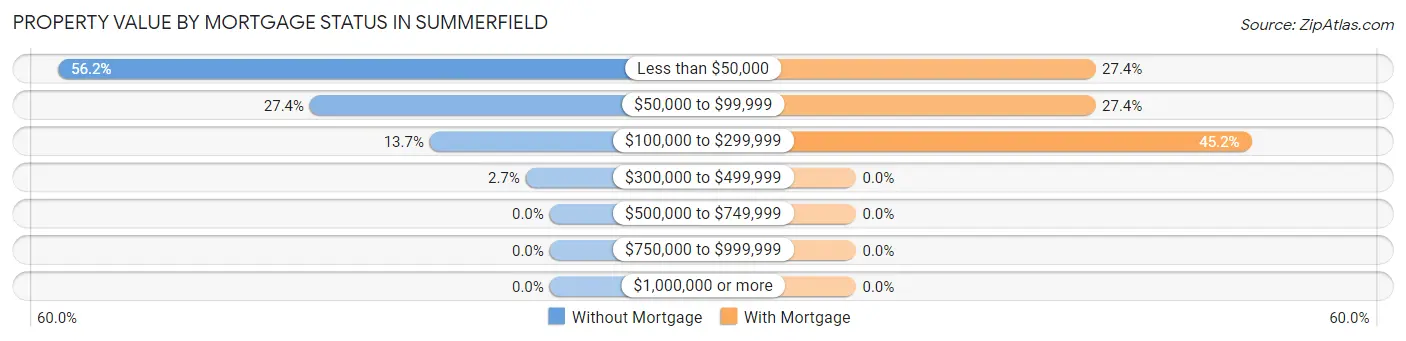
| Property Value | Without Mortgage | With Mortgage |
| Less than $50,000 | 41 (56.2%) | 23 (27.4%) |
| $50,000 to $99,999 | 20 (27.4%) | 23 (27.4%) |
| $100,000 to $299,999 | 10 (13.7%) | 38 (45.2%) |
| $300,000 to $499,999 | 2 (2.7%) | 0 (0.0%) |
| $500,000 to $749,999 | 0 (0.0%) | 0 (0.0%) |
| $750,000 to $999,999 | 0 (0.0%) | 0 (0.0%) |
| $1,000,000 or more | 0 (0.0%) | 0 (0.0%) |
| Total | 73 (100.0%) | 84 (100.0%) |
Household Income by Mortgage Status in Summerfield
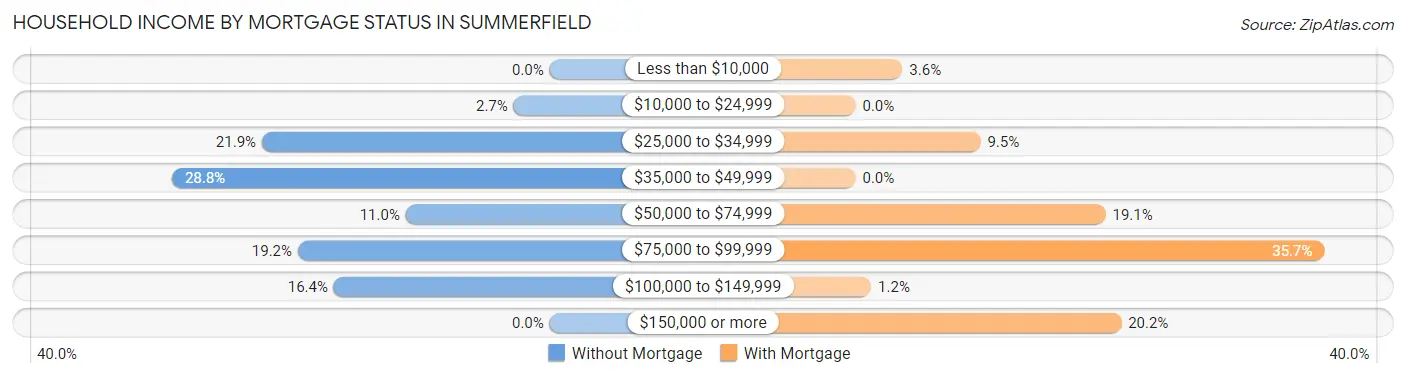
| Household Income | Without Mortgage | With Mortgage |
| Less than $10,000 | 0 (0.0%) | 3 (3.6%) |
| $10,000 to $24,999 | 2 (2.7%) | 0 (0.0%) |
| $25,000 to $34,999 | 16 (21.9%) | 8 (9.5%) |
| $35,000 to $49,999 | 21 (28.8%) | 0 (0.0%) |
| $50,000 to $74,999 | 8 (11.0%) | 16 (19.1%) |
| $75,000 to $99,999 | 14 (19.2%) | 30 (35.7%) |
| $100,000 to $149,999 | 12 (16.4%) | 1 (1.2%) |
| $150,000 or more | 0 (0.0%) | 17 (20.2%) |
| Total | 73 (100.0%) | 84 (100.0%) |
Property Value to Household Income Ratio in Summerfield
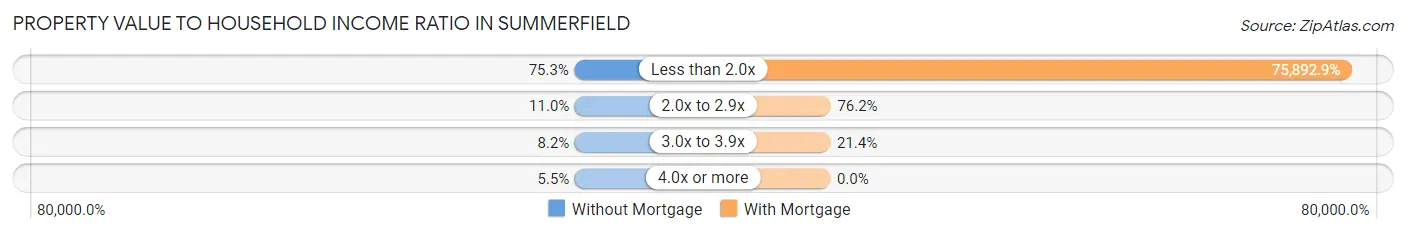
| Value-to-Income Ratio | Without Mortgage | With Mortgage |
| Less than 2.0x | 55 (75.3%) | 63,750 (75,892.9%) |
| 2.0x to 2.9x | 8 (11.0%) | 64 (76.2%) |
| 3.0x to 3.9x | 6 (8.2%) | 18 (21.4%) |
| 4.0x or more | 4 (5.5%) | 0 (0.0%) |
| Total | 73 (100.0%) | 84 (100.0%) |
Real Estate Taxes by Mortgage Status in Summerfield
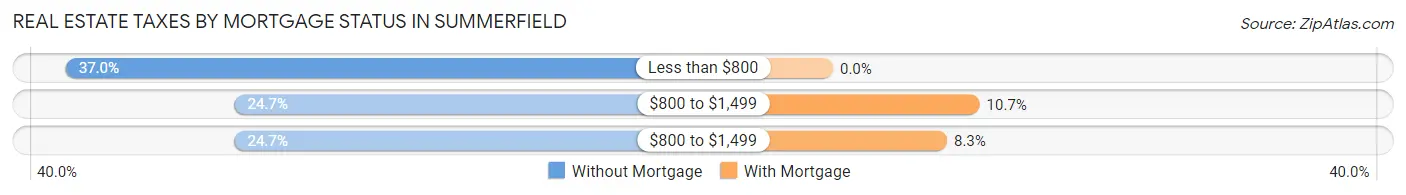
| Property Taxes | Without Mortgage | With Mortgage |
| Less than $800 | 27 (37.0%) | 0 (0.0%) |
| $800 to $1,499 | 18 (24.7%) | 9 (10.7%) |
| $800 to $1,499 | 18 (24.7%) | 7 (8.3%) |
| Total | 73 (100.0%) | 84 (100.0%) |
Health & Disability in Summerfield
Health Insurance Coverage by Age in Summerfield
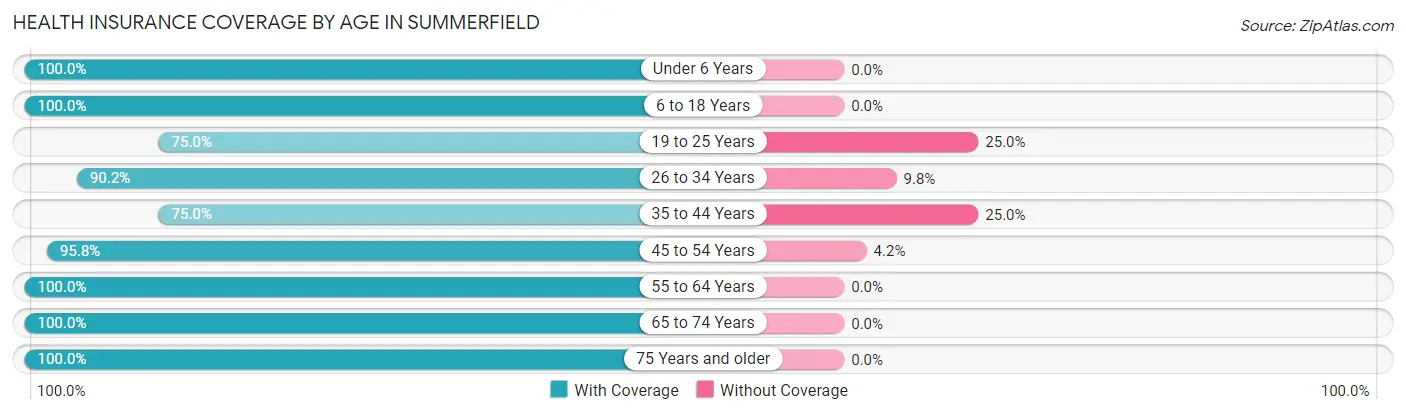
| Age Bracket | With Coverage | Without Coverage |
| Under 6 Years | 7 (100.0%) | 0 (0.0%) |
| 6 to 18 Years | 34 (100.0%) | 0 (0.0%) |
| 19 to 25 Years | 18 (75.0%) | 6 (25.0%) |
| 26 to 34 Years | 37 (90.2%) | 4 (9.8%) |
| 35 to 44 Years | 54 (75.0%) | 18 (25.0%) |
| 45 to 54 Years | 92 (95.8%) | 4 (4.2%) |
| 55 to 64 Years | 64 (100.0%) | 0 (0.0%) |
| 65 to 74 Years | 29 (100.0%) | 0 (0.0%) |
| 75 Years and older | 41 (100.0%) | 0 (0.0%) |
| Total | 376 (92.2%) | 32 (7.8%) |
Health Insurance Coverage by Citizenship Status in Summerfield
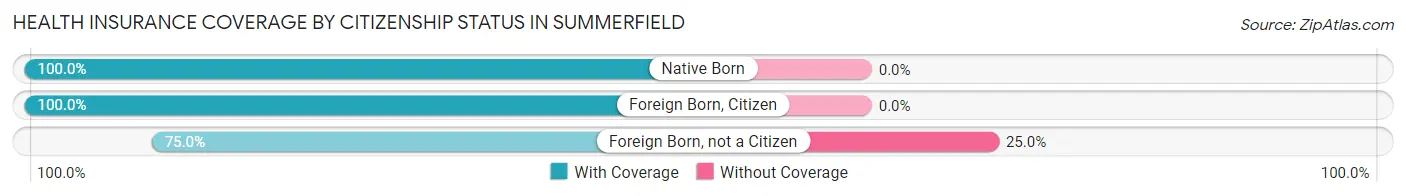
| Citizenship Status | With Coverage | Without Coverage |
| Native Born | 7 (100.0%) | 0 (0.0%) |
| Foreign Born, Citizen | 34 (100.0%) | 0 (0.0%) |
| Foreign Born, not a Citizen | 18 (75.0%) | 6 (25.0%) |
Health Insurance Coverage by Household Income in Summerfield
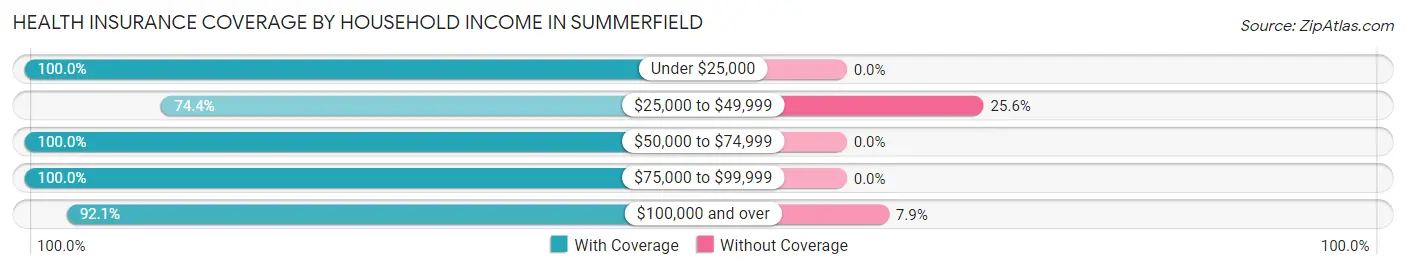
| Household Income | With Coverage | Without Coverage |
| Under $25,000 | 55 (100.0%) | 0 (0.0%) |
| $25,000 to $49,999 | 58 (74.4%) | 20 (25.6%) |
| $50,000 to $74,999 | 87 (100.0%) | 0 (0.0%) |
| $75,000 to $99,999 | 36 (100.0%) | 0 (0.0%) |
| $100,000 and over | 140 (92.1%) | 12 (7.9%) |
Public vs Private Health Insurance Coverage by Age in Summerfield
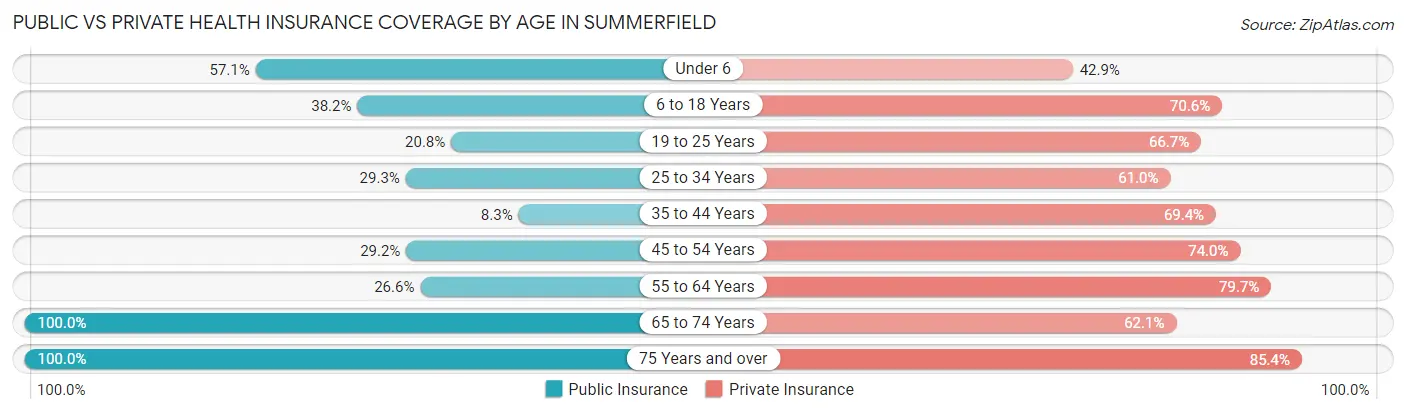
| Age Bracket | Public Insurance | Private Insurance |
| Under 6 | 4 (57.1%) | 3 (42.9%) |
| 6 to 18 Years | 13 (38.2%) | 24 (70.6%) |
| 19 to 25 Years | 5 (20.8%) | 16 (66.7%) |
| 25 to 34 Years | 12 (29.3%) | 25 (61.0%) |
| 35 to 44 Years | 6 (8.3%) | 50 (69.4%) |
| 45 to 54 Years | 28 (29.2%) | 71 (74.0%) |
| 55 to 64 Years | 17 (26.6%) | 51 (79.7%) |
| 65 to 74 Years | 29 (100.0%) | 18 (62.1%) |
| 75 Years and over | 41 (100.0%) | 35 (85.4%) |
| Total | 155 (38.0%) | 293 (71.8%) |
Disability Status by Sex by Age in Summerfield
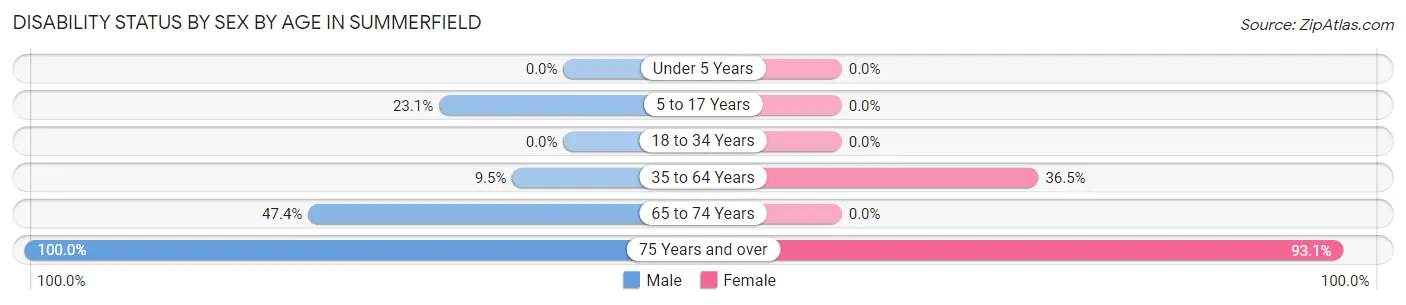
| Age Bracket | Male | Female |
| Under 5 Years | 0 (0.0%) | 0 (0.0%) |
| 5 to 17 Years | 6 (23.1%) | 0 (0.0%) |
| 18 to 34 Years | 0 (0.0%) | 0 (0.0%) |
| 35 to 64 Years | 9 (9.5%) | 50 (36.5%) |
| 65 to 74 Years | 9 (47.4%) | 0 (0.0%) |
| 75 Years and over | 12 (100.0%) | 27 (93.1%) |
Disability Class by Sex by Age in Summerfield
Disability Class: Hearing Difficulty
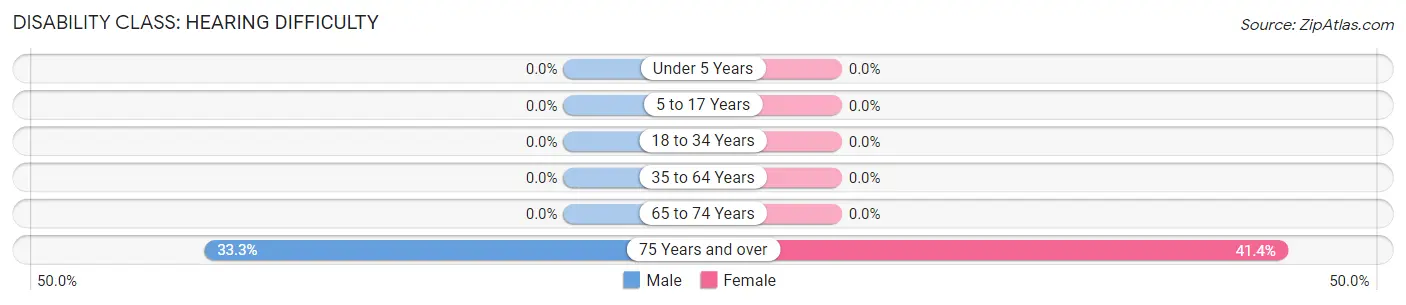
| Age Bracket | Male | Female |
| Under 5 Years | 0 (0.0%) | 0 (0.0%) |
| 5 to 17 Years | 0 (0.0%) | 0 (0.0%) |
| 18 to 34 Years | 0 (0.0%) | 0 (0.0%) |
| 35 to 64 Years | 0 (0.0%) | 0 (0.0%) |
| 65 to 74 Years | 0 (0.0%) | 0 (0.0%) |
| 75 Years and over | 4 (33.3%) | 12 (41.4%) |
Disability Class: Vision Difficulty
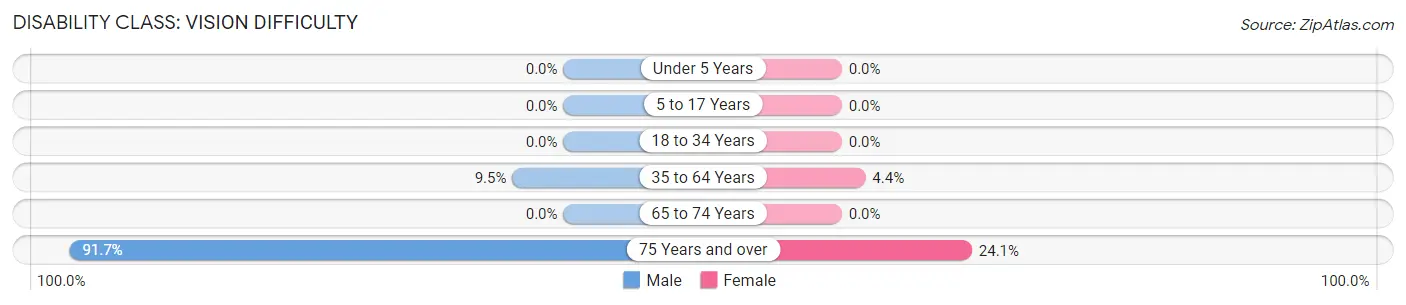
| Age Bracket | Male | Female |
| Under 5 Years | 0 (0.0%) | 0 (0.0%) |
| 5 to 17 Years | 0 (0.0%) | 0 (0.0%) |
| 18 to 34 Years | 0 (0.0%) | 0 (0.0%) |
| 35 to 64 Years | 9 (9.5%) | 6 (4.4%) |
| 65 to 74 Years | 0 (0.0%) | 0 (0.0%) |
| 75 Years and over | 11 (91.7%) | 7 (24.1%) |
Disability Class: Cognitive Difficulty
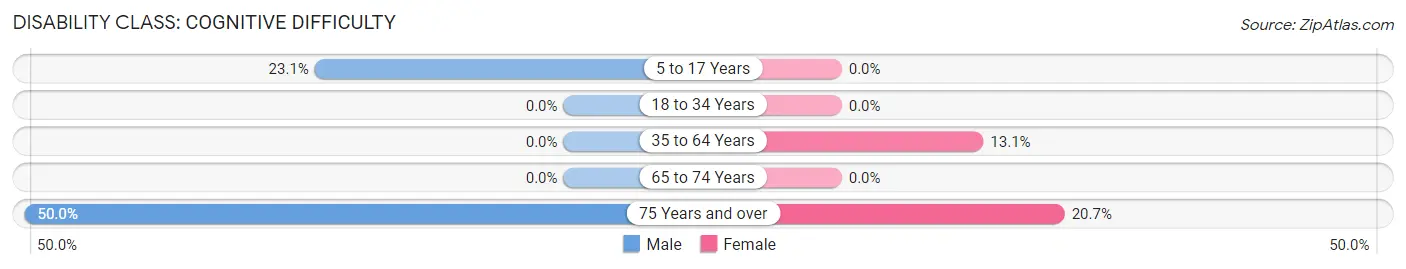
| Age Bracket | Male | Female |
| 5 to 17 Years | 6 (23.1%) | 0 (0.0%) |
| 18 to 34 Years | 0 (0.0%) | 0 (0.0%) |
| 35 to 64 Years | 0 (0.0%) | 18 (13.1%) |
| 65 to 74 Years | 0 (0.0%) | 0 (0.0%) |
| 75 Years and over | 6 (50.0%) | 6 (20.7%) |
Disability Class: Ambulatory Difficulty
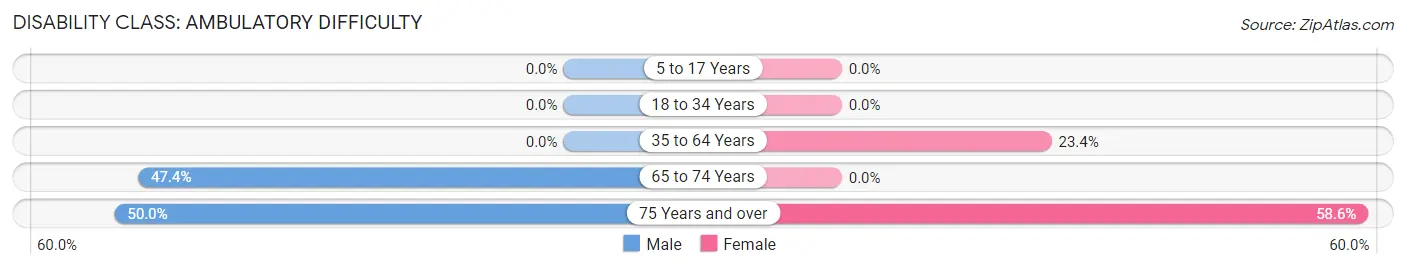
| Age Bracket | Male | Female |
| 5 to 17 Years | 0 (0.0%) | 0 (0.0%) |
| 18 to 34 Years | 0 (0.0%) | 0 (0.0%) |
| 35 to 64 Years | 0 (0.0%) | 32 (23.4%) |
| 65 to 74 Years | 9 (47.4%) | 0 (0.0%) |
| 75 Years and over | 6 (50.0%) | 17 (58.6%) |
Disability Class: Self-Care Difficulty
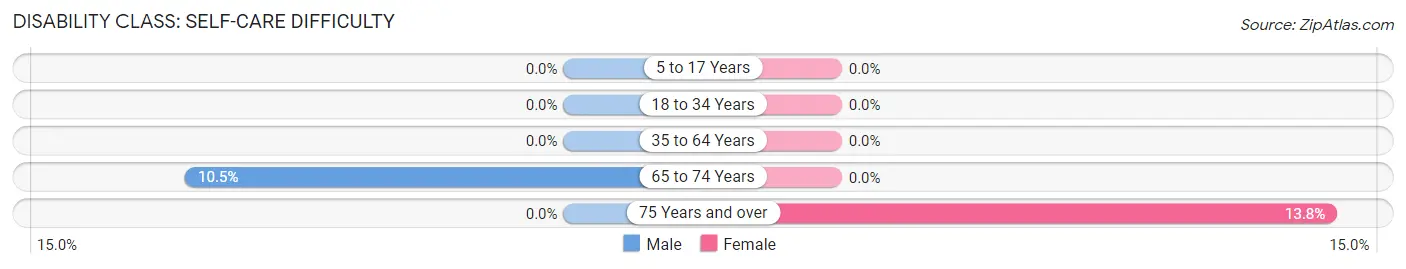
| Age Bracket | Male | Female |
| 5 to 17 Years | 0 (0.0%) | 0 (0.0%) |
| 18 to 34 Years | 0 (0.0%) | 0 (0.0%) |
| 35 to 64 Years | 0 (0.0%) | 0 (0.0%) |
| 65 to 74 Years | 2 (10.5%) | 0 (0.0%) |
| 75 Years and over | 0 (0.0%) | 4 (13.8%) |
Technology Access in Summerfield
Computing Device Access in Summerfield
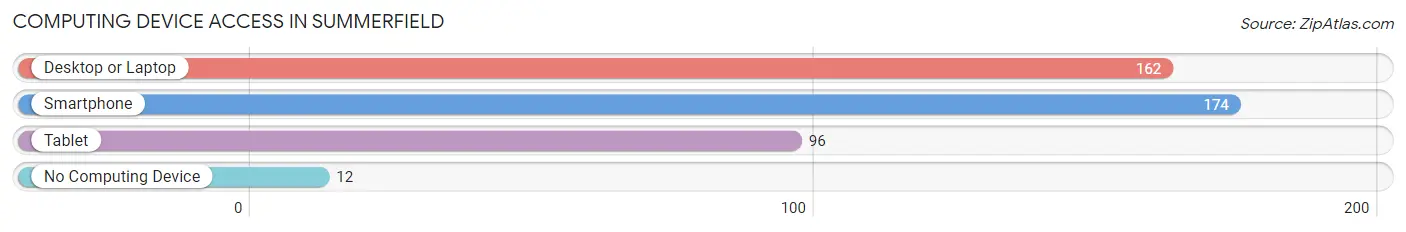
| Device Type | # Households | % Households |
| Desktop or Laptop | 162 | 79.8% |
| Smartphone | 174 | 85.7% |
| Tablet | 96 | 47.3% |
| No Computing Device | 12 | 5.9% |
| Total | 203 | 100.0% |
Internet Access in Summerfield
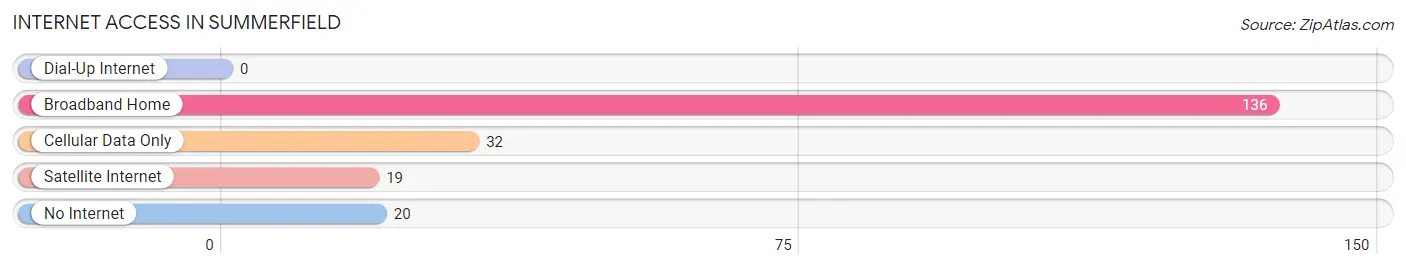
| Internet Type | # Households | % Households |
| Dial-Up Internet | 0 | 0.0% |
| Broadband Home | 136 | 67.0% |
| Cellular Data Only | 32 | 15.8% |
| Satellite Internet | 19 | 9.4% |
| No Internet | 20 | 9.9% |
| Total | 203 | 100.0% |
Summerfield Summary
History
The small village of Summerfield, Illinois is located in the northern part of the state, in the county of McHenry. It is situated on the banks of the Fox River, and is surrounded by the towns of McHenry, Johnsburg, and McCullom Lake. The area was first settled in the early 1800s by a group of German immigrants, who were attracted to the area by its fertile soil and abundant natural resources. The village was officially incorporated in 1872, and was named after the Summerfield family, who were among the first settlers.
The village of Summerfield has a rich history of industry and agriculture. In the late 1800s, the village was home to several sawmills, gristmills, and a brickyard. The brickyard was especially important to the local economy, as it provided the bricks used to build many of the homes and businesses in the area. In the early 1900s, the village was home to several dairy farms, which provided milk and other dairy products to the local population.
In the mid-1900s, the village began to experience a period of growth and development. The village was home to several small businesses, including a grocery store, a hardware store, and a post office. The village also had a school, which served the local population until it closed in the late 1970s.
Geography
Summerfield is located in the northern part of Illinois, in the county of McHenry. It is situated on the banks of the Fox River, and is surrounded by the towns of McHenry, Johnsburg, and McCullom Lake. The village is located approximately 40 miles northwest of Chicago, and is part of the Chicago metropolitan area.
The village of Summerfield is located in a rural area, and is surrounded by farmland and woodlands. The terrain is mostly flat, with some rolling hills in the area. The village is located in a temperate climate, with hot summers and cold winters.
Economy
The village of Summerfield has a small, but diverse economy. The village is home to several small businesses, including a grocery store, a hardware store, and a post office. The village also has a few restaurants and bars, as well as a few small manufacturing companies.
The village is also home to several farms, which produce a variety of crops, including corn, soybeans, and wheat. The village also has a few wineries, which produce a variety of wines.
Demographics
As of the 2010 census, the village of Summerfield had a population of 1,845 people. The population is mostly white (94.3%), with a small percentage of African Americans (2.2%), Hispanics (1.7%), and Asians (1.3%). The median household income in the village is $60,000, and the median age is 43.
Conclusion
The small village of Summerfield, Illinois is a rural community with a rich history of industry and agriculture. The village is home to several small businesses, farms, and wineries, and has a population of 1,845 people. The village is located in a temperate climate, and is part of the Chicago metropolitan area. The village has a diverse economy, and is a great place to live and work.
Common Questions
What is Per Capita Income in Summerfield?
Per Capita income in Summerfield is $33,908.
What is the Median Family Income in Summerfield?
Median Family Income in Summerfield is $66,250.
What is the Median Household income in Summerfield?
Median Household Income in Summerfield is $51,250.
What is Income or Wage Gap in Summerfield?
Income or Wage Gap in Summerfield is 20.5%.
Women in Summerfield earn 79.5 cents for every dollar earned by a man.
What is Inequality or Gini Index in Summerfield?
Inequality or Gini Index in Summerfield is 0.42.
What is the Total Population of Summerfield?
Total Population of Summerfield is 408.
What is the Total Male Population of Summerfield?
Total Male Population of Summerfield is 203.
What is the Total Female Population of Summerfield?
Total Female Population of Summerfield is 205.
What is the Ratio of Males per 100 Females in Summerfield?
There are 99.02 Males per 100 Females in Summerfield.
What is the Ratio of Females per 100 Males in Summerfield?
There are 100.99 Females per 100 Males in Summerfield.
What is the Median Population Age in Summerfield?
Median Population Age in Summerfield is 48.8 Years.
What is the Average Family Size in Summerfield
Average Family Size in Summerfield is 2.5 People.
What is the Average Household Size in Summerfield
Average Household Size in Summerfield is 2.0 People.
How Large is the Labor Force in Summerfield?
There are 252 People in the Labor Forcein in Summerfield.
What is the Percentage of People in the Labor Force in Summerfield?
67.7% of People are in the Labor Force in Summerfield.
What is the Unemployment Rate in Summerfield?
Unemployment Rate in Summerfield is 8.7%.