Stanford, IL Map & Demographics
Stanford Map
Stanford Overview
$34,842
PER CAPITA INCOME
$81,354
AVG FAMILY INCOME
$80,417
AVG HOUSEHOLD INCOME
36.3%
WAGE / INCOME GAP [ % ]
63.7¢/ $1
WAGE / INCOME GAP [ $ ]
$10,629
FAMILY INCOME DEFICIT
0.34
INEQUALITY / GINI INDEX
531
TOTAL POPULATION
311
MALE POPULATION
220
FEMALE POPULATION
141.36
MALES / 100 FEMALES
70.74
FEMALES / 100 MALES
30.9
MEDIAN AGE
3.1
AVG FAMILY SIZE
2.4
AVG HOUSEHOLD SIZE
303
LABOR FORCE [ PEOPLE ]
73.2%
PERCENT IN LABOR FORCE
7.3%
UNEMPLOYMENT RATE
Stanford Zip Codes
Stanford Area Codes
Income in Stanford
Income Overview in Stanford
Per Capita Income in Stanford is $34,842, while median incomes of families and households are $81,354 and $80,417 respectively.
| Characteristic | Number | Measure |
| Per Capita Income | 531 | $34,842 |
| Median Family Income | 123 | $81,354 |
| Mean Family Income | 123 | $81,800 |
| Median Household Income | 218 | $80,417 |
| Mean Household Income | 218 | $81,744 |
| Income Deficit | 123 | $10,629 |
| Wage / Income Gap (%) | 531 | 36.30% |
| Wage / Income Gap ($) | 531 | 63.70¢ per $1 |
| Gini / Inequality Index | 531 | 0.34 |
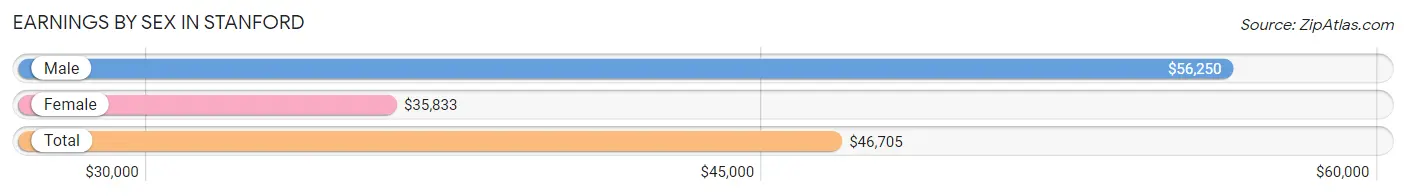
Earnings by Sex in Stanford
Average Earnings in Stanford are $46,705, $56,250 for men and $35,833 for women, a difference of 36.3%.
| Sex | Number | Average Earnings |
| Male | 175 (55.9%) | $56,250 |
| Female | 138 (44.1%) | $35,833 |
| Total | 313 (100.0%) | $46,705 |
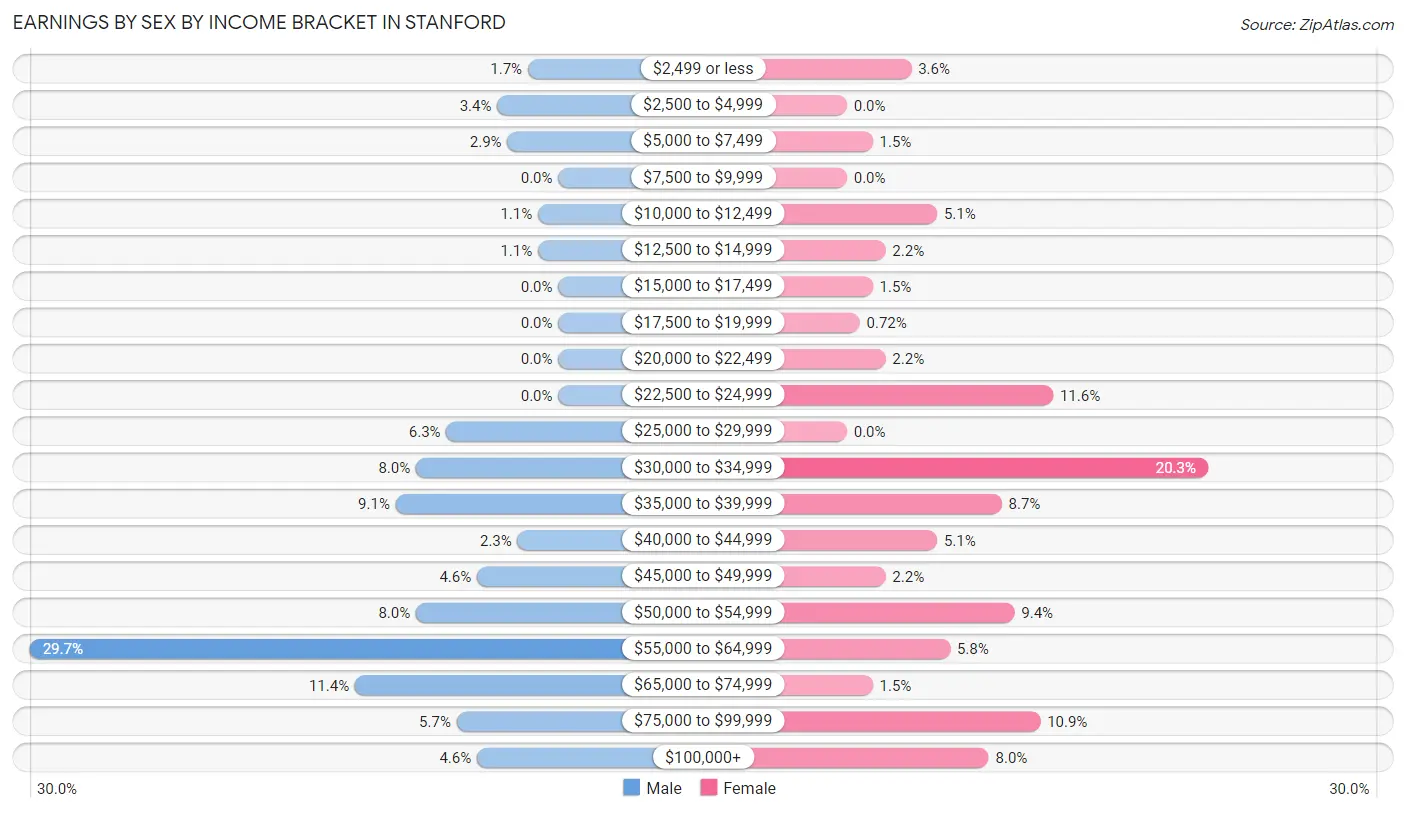
Earnings by Sex by Income Bracket in Stanford
The most common earnings brackets in Stanford are $55,000 to $64,999 for men (52 | 29.7%) and $30,000 to $34,999 for women (28 | 20.3%).
| Income | Male | Female |
| $2,499 or less | 3 (1.7%) | 5 (3.6%) |
| $2,500 to $4,999 | 6 (3.4%) | 0 (0.0%) |
| $5,000 to $7,499 | 5 (2.9%) | 2 (1.5%) |
| $7,500 to $9,999 | 0 (0.0%) | 0 (0.0%) |
| $10,000 to $12,499 | 2 (1.1%) | 7 (5.1%) |
| $12,500 to $14,999 | 2 (1.1%) | 3 (2.2%) |
| $15,000 to $17,499 | 0 (0.0%) | 2 (1.5%) |
| $17,500 to $19,999 | 0 (0.0%) | 1 (0.7%) |
| $20,000 to $22,499 | 0 (0.0%) | 3 (2.2%) |
| $22,500 to $24,999 | 0 (0.0%) | 16 (11.6%) |
| $25,000 to $29,999 | 11 (6.3%) | 0 (0.0%) |
| $30,000 to $34,999 | 14 (8.0%) | 28 (20.3%) |
| $35,000 to $39,999 | 16 (9.1%) | 12 (8.7%) |
| $40,000 to $44,999 | 4 (2.3%) | 7 (5.1%) |
| $45,000 to $49,999 | 8 (4.6%) | 3 (2.2%) |
| $50,000 to $54,999 | 14 (8.0%) | 13 (9.4%) |
| $55,000 to $64,999 | 52 (29.7%) | 8 (5.8%) |
| $65,000 to $74,999 | 20 (11.4%) | 2 (1.5%) |
| $75,000 to $99,999 | 10 (5.7%) | 15 (10.9%) |
| $100,000+ | 8 (4.6%) | 11 (8.0%) |
| Total | 175 (100.0%) | 138 (100.0%) |
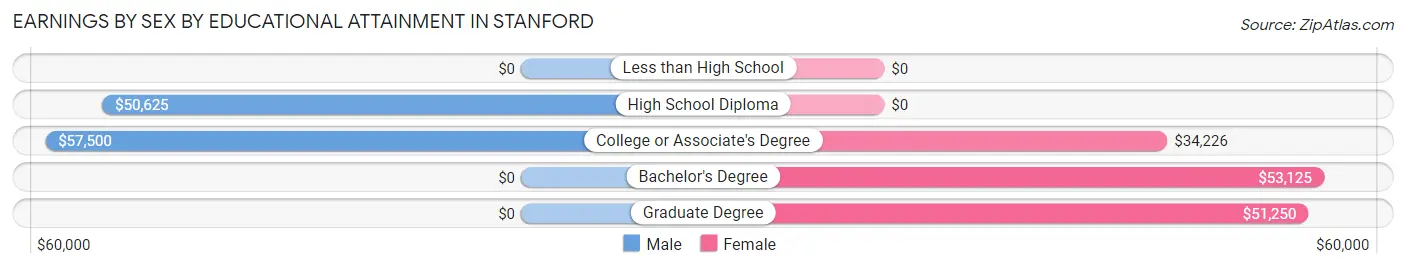
Earnings by Sex by Educational Attainment in Stanford
Average earnings in Stanford are $57,546 for men and $39,167 for women, a difference of 31.9%. Men with an educational attainment of college or associate's degree enjoy the highest average annual earnings of $57,500, while those with high school diploma education earn the least with $50,625. Women with an educational attainment of bachelor's degree earn the most with the average annual earnings of $53,125, while those with college or associate's degree education have the smallest earnings of $34,226.
| Educational Attainment | Male Income | Female Income |
| Less than High School | - | - |
| High School Diploma | $50,625 | $0 |
| College or Associate's Degree | $57,500 | $34,226 |
| Bachelor's Degree | - | - |
| Graduate Degree | - | - |
| Total | $57,546 | $39,167 |
Family Income in Stanford
Family Income Brackets in Stanford
According to the Stanford family income data, there are 37 families falling into the $100,000 to $149,999 income range, which is the most common income bracket and makes up 30.1% of all families.
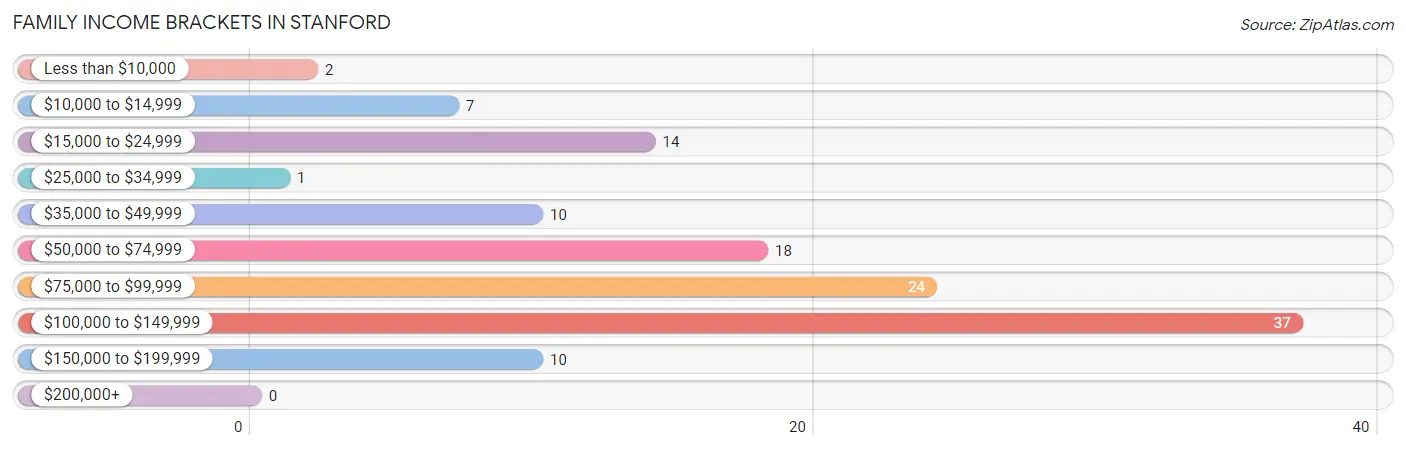
| Income Bracket | # Families | % Families |
| Less than $10,000 | 2 | 1.6% |
| $10,000 to $14,999 | 7 | 5.7% |
| $15,000 to $24,999 | 14 | 11.4% |
| $25,000 to $34,999 | 1 | 0.8% |
| $35,000 to $49,999 | 10 | 8.1% |
| $50,000 to $74,999 | 18 | 14.6% |
| $75,000 to $99,999 | 24 | 19.5% |
| $100,000 to $149,999 | 37 | 30.1% |
| $150,000 to $199,999 | 10 | 8.1% |
| $200,000+ | 0 | 0.0% |
Family Income by Famaliy Size in Stanford
3-person families (41 | 33.3%) account for the highest median family income in Stanford with $107,589 per family, while 2-person families (50 | 40.6%) have the highest median income of $40,156 per family member.
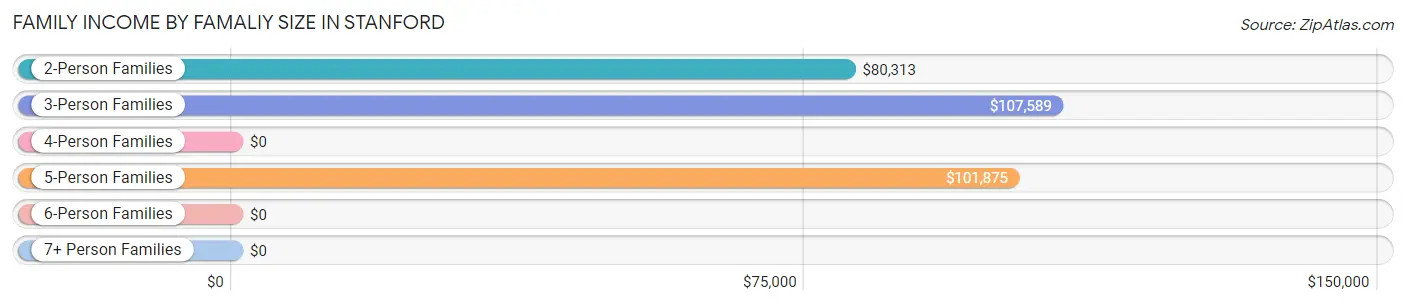
| Income Bracket | # Families | Median Income |
| 2-Person Families | 50 (40.6%) | $80,313 |
| 3-Person Families | 41 (33.3%) | $107,589 |
| 4-Person Families | 18 (14.6%) | $0 |
| 5-Person Families | 13 (10.6%) | $101,875 |
| 6-Person Families | 0 (0.0%) | $0 |
| 7+ Person Families | 1 (0.8%) | $0 |
| Total | 123 (100.0%) | $81,354 |
Family Income by Number of Earners in Stanford
The median family income in Stanford is $81,354, with families comprising 2 earners (44) having the highest median family income of $108,906, while families with no earners (18) have the lowest median family income of $38,750, accounting for 35.8% and 14.6% of families, respectively.
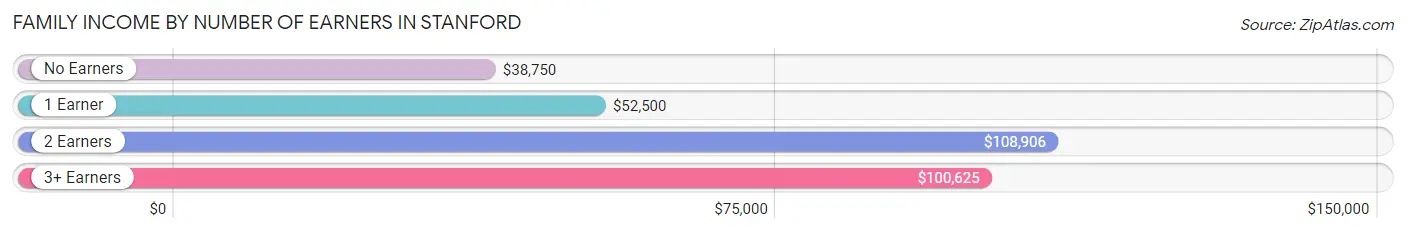
| Number of Earners | # Families | Median Income |
| No Earners | 18 (14.6%) | $38,750 |
| 1 Earner | 48 (39.0%) | $52,500 |
| 2 Earners | 44 (35.8%) | $108,906 |
| 3+ Earners | 13 (10.6%) | $100,625 |
| Total | 123 (100.0%) | $81,354 |
Household Income in Stanford
Household Income Brackets in Stanford
With 75 households falling in the category, the $100,000 to $149,999 income range is the most frequent in Stanford, accounting for 34.4% of all households.
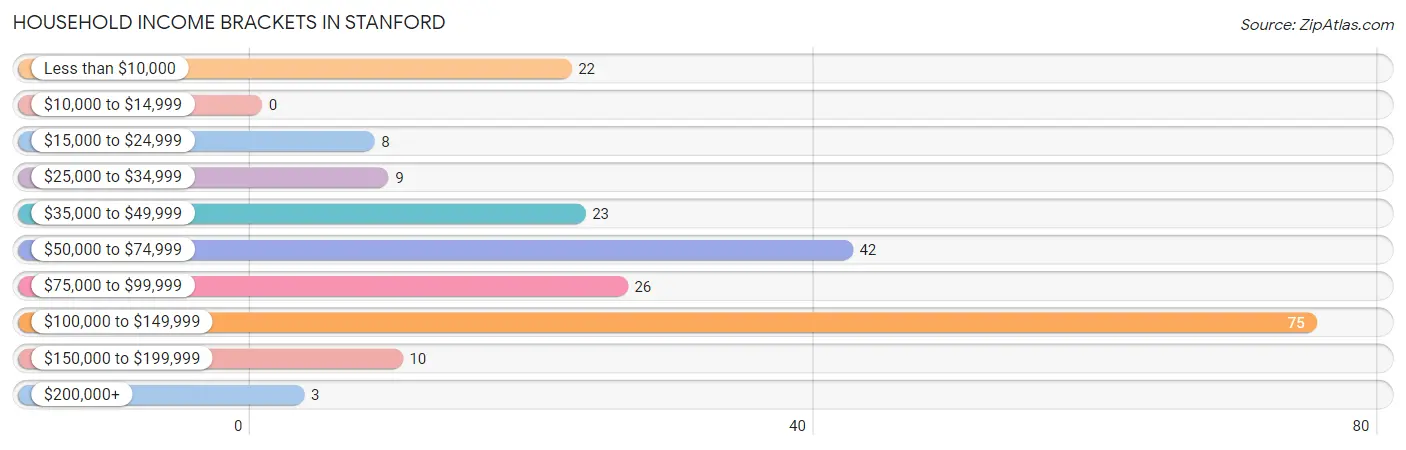
| Income Bracket | # Households | % Households |
| Less than $10,000 | 22 | 10.1% |
| $10,000 to $14,999 | 0 | 0.0% |
| $15,000 to $24,999 | 8 | 3.7% |
| $25,000 to $34,999 | 9 | 4.1% |
| $35,000 to $49,999 | 23 | 10.6% |
| $50,000 to $74,999 | 42 | 19.3% |
| $75,000 to $99,999 | 26 | 11.9% |
| $100,000 to $149,999 | 75 | 34.4% |
| $150,000 to $199,999 | 10 | 4.6% |
| $200,000+ | 3 | 1.4% |
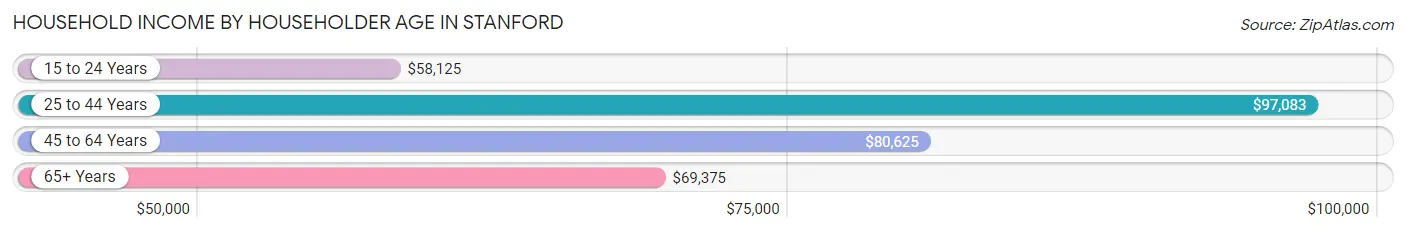
Household Income by Householder Age in Stanford
The median household income in Stanford is $80,417, with the highest median household income of $97,083 found in the 25 to 44 years age bracket for the primary householder. A total of 75 households (34.4%) fall into this category. Meanwhile, the 15 to 24 years age bracket for the primary householder has the lowest median household income of $58,125, with 21 households (9.6%) in this group.
| Income Bracket | # Households | Median Income |
| 15 to 24 Years | 21 (9.6%) | $58,125 |
| 25 to 44 Years | 75 (34.4%) | $97,083 |
| 45 to 64 Years | 95 (43.6%) | $80,625 |
| 65+ Years | 27 (12.4%) | $69,375 |
| Total | 218 (100.0%) | $80,417 |
Poverty in Stanford
Income Below Poverty by Sex and Age in Stanford
With 18.3% poverty level for males and 13.6% for females among the residents of Stanford, under 5 year old males and 6 to 11 year old females are the most vulnerable to poverty, with 18 males (60.0%) and 11 females (44.0%) in their respective age groups living below the poverty level.
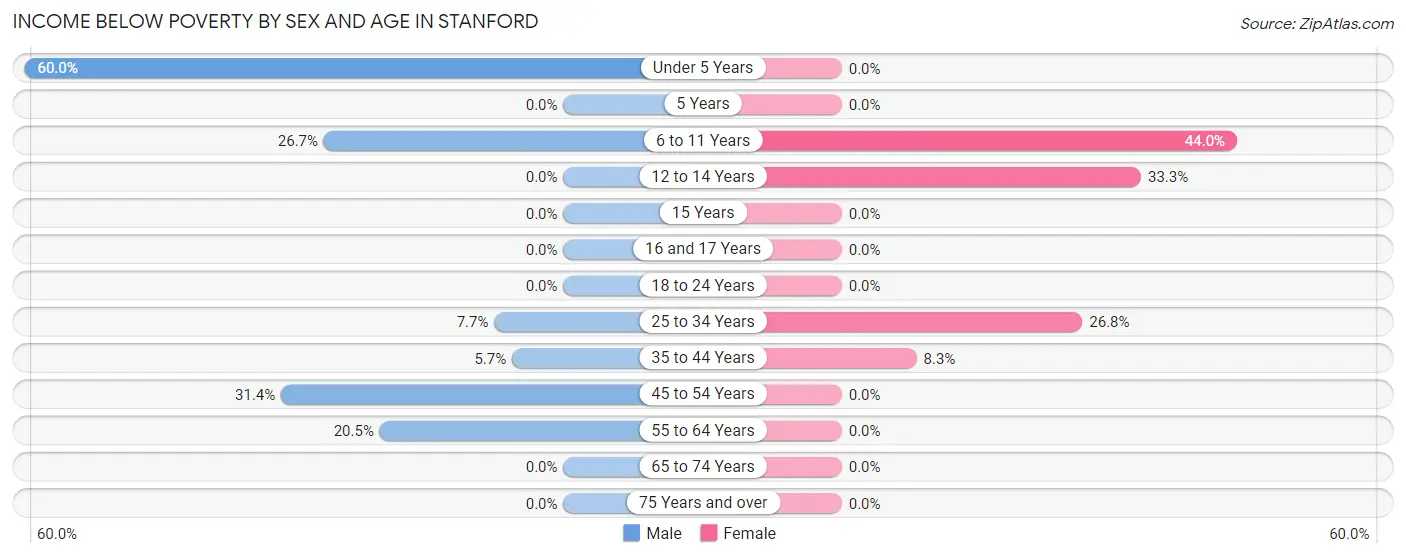
| Age Bracket | Male | Female |
| Under 5 Years | 18 (60.0%) | 0 (0.0%) |
| 5 Years | 0 (0.0%) | 0 (0.0%) |
| 6 to 11 Years | 12 (26.7%) | 11 (44.0%) |
| 12 to 14 Years | 0 (0.0%) | 2 (33.3%) |
| 15 Years | 0 (0.0%) | 0 (0.0%) |
| 16 and 17 Years | 0 (0.0%) | 0 (0.0%) |
| 18 to 24 Years | 0 (0.0%) | 0 (0.0%) |
| 25 to 34 Years | 5 (7.7%) | 15 (26.8%) |
| 35 to 44 Years | 2 (5.7%) | 2 (8.3%) |
| 45 to 54 Years | 11 (31.4%) | 0 (0.0%) |
| 55 to 64 Years | 9 (20.4%) | 0 (0.0%) |
| 65 to 74 Years | 0 (0.0%) | 0 (0.0%) |
| 75 Years and over | 0 (0.0%) | 0 (0.0%) |
| Total | 57 (18.3%) | 30 (13.6%) |
Income Above Poverty by Sex and Age in Stanford
According to the poverty statistics in Stanford, males aged 5 years and females aged under 5 years are the age groups that are most secure financially, with 100.0% of males and 100.0% of females in these age groups living above the poverty line.
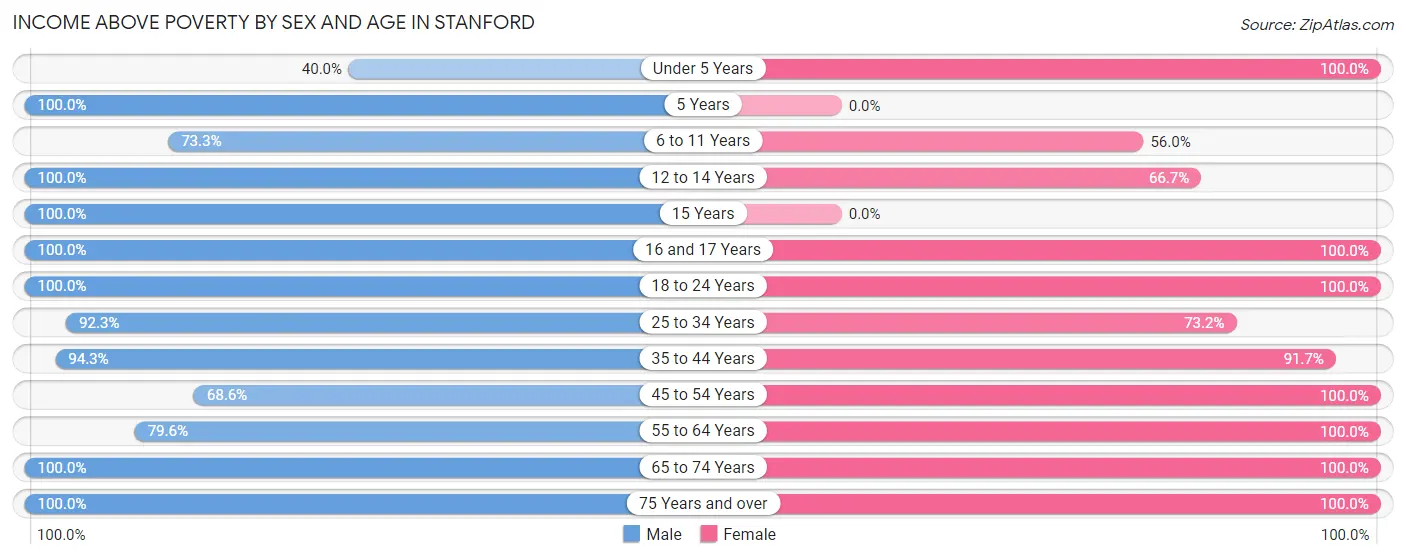
| Age Bracket | Male | Female |
| Under 5 Years | 12 (40.0%) | 4 (100.0%) |
| 5 Years | 3 (100.0%) | 0 (0.0%) |
| 6 to 11 Years | 33 (73.3%) | 14 (56.0%) |
| 12 to 14 Years | 2 (100.0%) | 4 (66.7%) |
| 15 Years | 2 (100.0%) | 0 (0.0%) |
| 16 and 17 Years | 5 (100.0%) | 4 (100.0%) |
| 18 to 24 Years | 24 (100.0%) | 15 (100.0%) |
| 25 to 34 Years | 60 (92.3%) | 41 (73.2%) |
| 35 to 44 Years | 33 (94.3%) | 22 (91.7%) |
| 45 to 54 Years | 24 (68.6%) | 24 (100.0%) |
| 55 to 64 Years | 35 (79.5%) | 38 (100.0%) |
| 65 to 74 Years | 13 (100.0%) | 12 (100.0%) |
| 75 Years and over | 8 (100.0%) | 12 (100.0%) |
| Total | 254 (81.7%) | 190 (86.4%) |
Income Below Poverty Among Married-Couple Families in Stanford
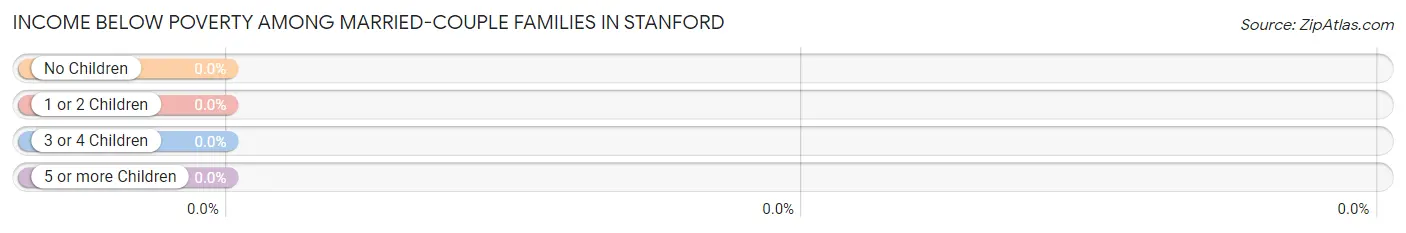
| Children | Above Poverty | Below Poverty |
| No Children | 46 (100.0%) | 0 (0.0%) |
| 1 or 2 Children | 39 (100.0%) | 0 (0.0%) |
| 3 or 4 Children | 6 (100.0%) | 0 (0.0%) |
| 5 or more Children | 0 (0.0%) | 0 (0.0%) |
| Total | 91 (100.0%) | 0 (0.0%) |
Income Below Poverty Among Single-Parent Households in Stanford
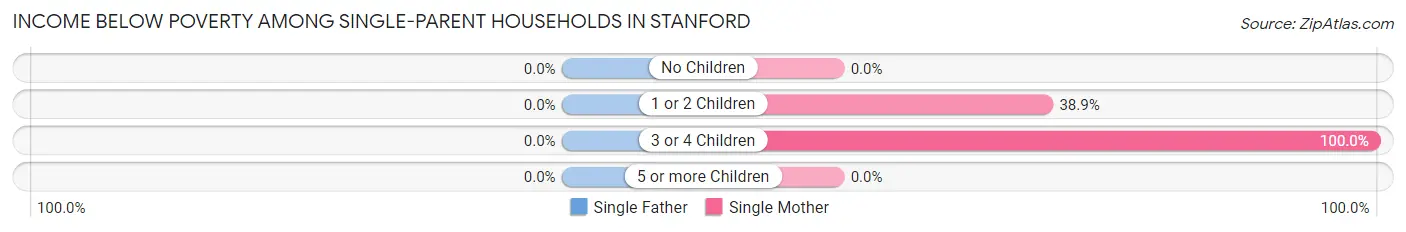
| Children | Single Father | Single Mother |
| No Children | 0 (0.0%) | 0 (0.0%) |
| 1 or 2 Children | 0 (0.0%) | 7 (38.9%) |
| 3 or 4 Children | 0 (0.0%) | 10 (100.0%) |
| 5 or more Children | 0 (0.0%) | 0 (0.0%) |
| Total | 0 (0.0%) | 17 (53.1%) |
Income Below Poverty Among Married-Couple vs Single-Parent Households in Stanford
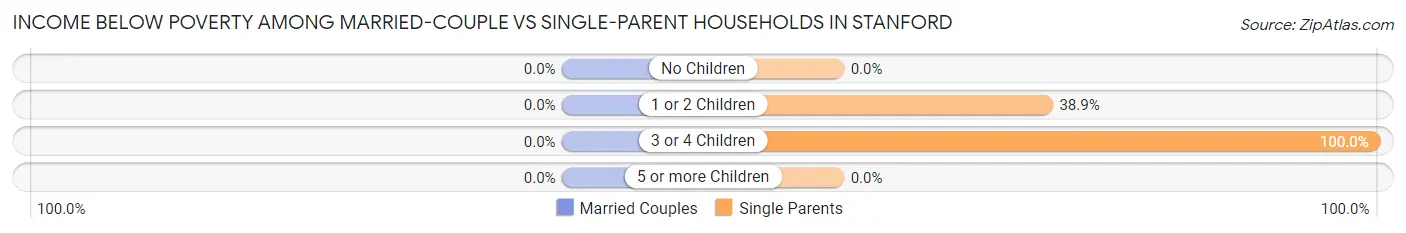
| Children | Married-Couple Families | Single-Parent Households |
| No Children | 0 (0.0%) | 0 (0.0%) |
| 1 or 2 Children | 0 (0.0%) | 7 (38.9%) |
| 3 or 4 Children | 0 (0.0%) | 10 (100.0%) |
| 5 or more Children | 0 (0.0%) | 0 (0.0%) |
| Total | 0 (0.0%) | 17 (53.1%) |
Race in Stanford
The most populous races in Stanford are White / Caucasian (503 | 94.7%), Two or more Races (28 | 5.3%), and Hispanic or Latino (11 | 2.1%).
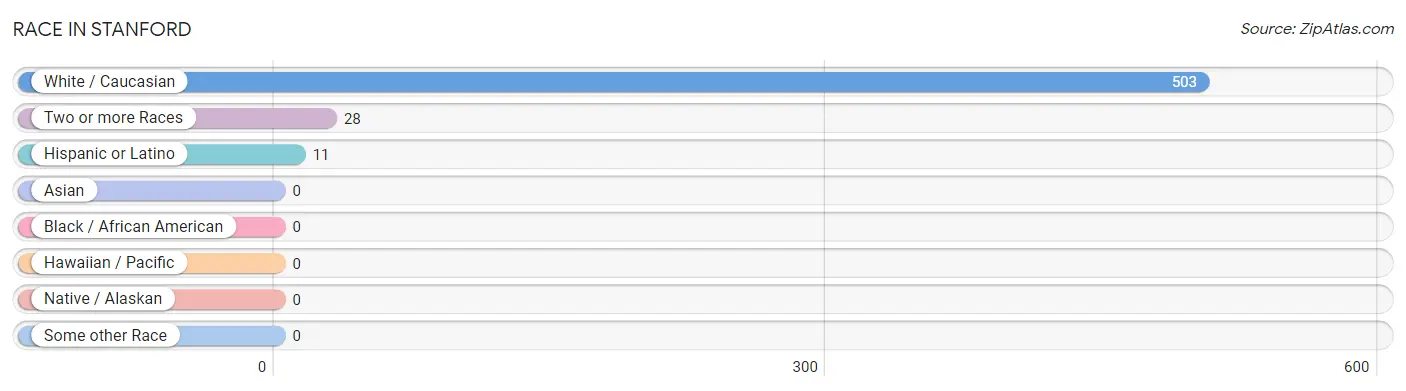
| Race | # Population | % Population |
| Asian | 0 | 0.0% |
| Black / African American | 0 | 0.0% |
| Hawaiian / Pacific | 0 | 0.0% |
| Hispanic or Latino | 11 | 2.1% |
| Native / Alaskan | 0 | 0.0% |
| White / Caucasian | 503 | 94.7% |
| Two or more Races | 28 | 5.3% |
| Some other Race | 0 | 0.0% |
| Total | 531 | 100.0% |
Ancestry in Stanford
The most populous ancestries reported in Stanford are German (126 | 23.7%), Irish (83 | 15.6%), English (59 | 11.1%), American (23 | 4.3%), and European (12 | 2.3%), together accounting for 57.1% of all Stanford residents.
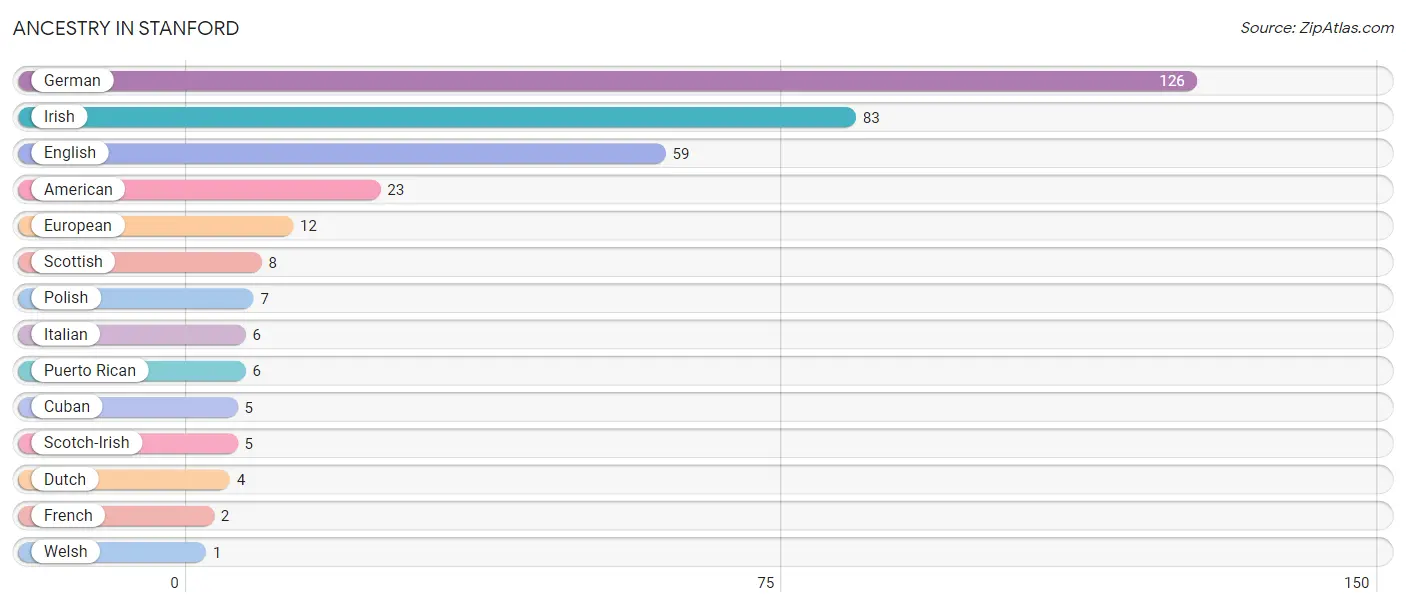
| Ancestry | # Population | % Population |
| American | 23 | 4.3% |
| Cuban | 5 | 0.9% |
| Dutch | 4 | 0.7% |
| English | 59 | 11.1% |
| European | 12 | 2.3% |
| French | 2 | 0.4% |
| German | 126 | 23.7% |
| Irish | 83 | 15.6% |
| Italian | 6 | 1.1% |
| Polish | 7 | 1.3% |
| Puerto Rican | 6 | 1.1% |
| Scotch-Irish | 5 | 0.9% |
| Scottish | 8 | 1.5% |
| Welsh | 1 | 0.2% | View All 14 Rows |
Immigrants in Stanford
The most numerous immigrant groups reported in Stanford came from , and Canada (3 | 0.6%), together accounting for 0.6% of all Stanford residents.

| Immigration Origin | # Population | % Population |
| Canada | 3 | 0.6% | View All 1 Rows |
Sex and Age in Stanford
Sex and Age in Stanford
The most populous age groups in Stanford are 5 to 9 Years (38 | 12.2%) for men and 25 to 29 Years (37 | 16.8%) for women.
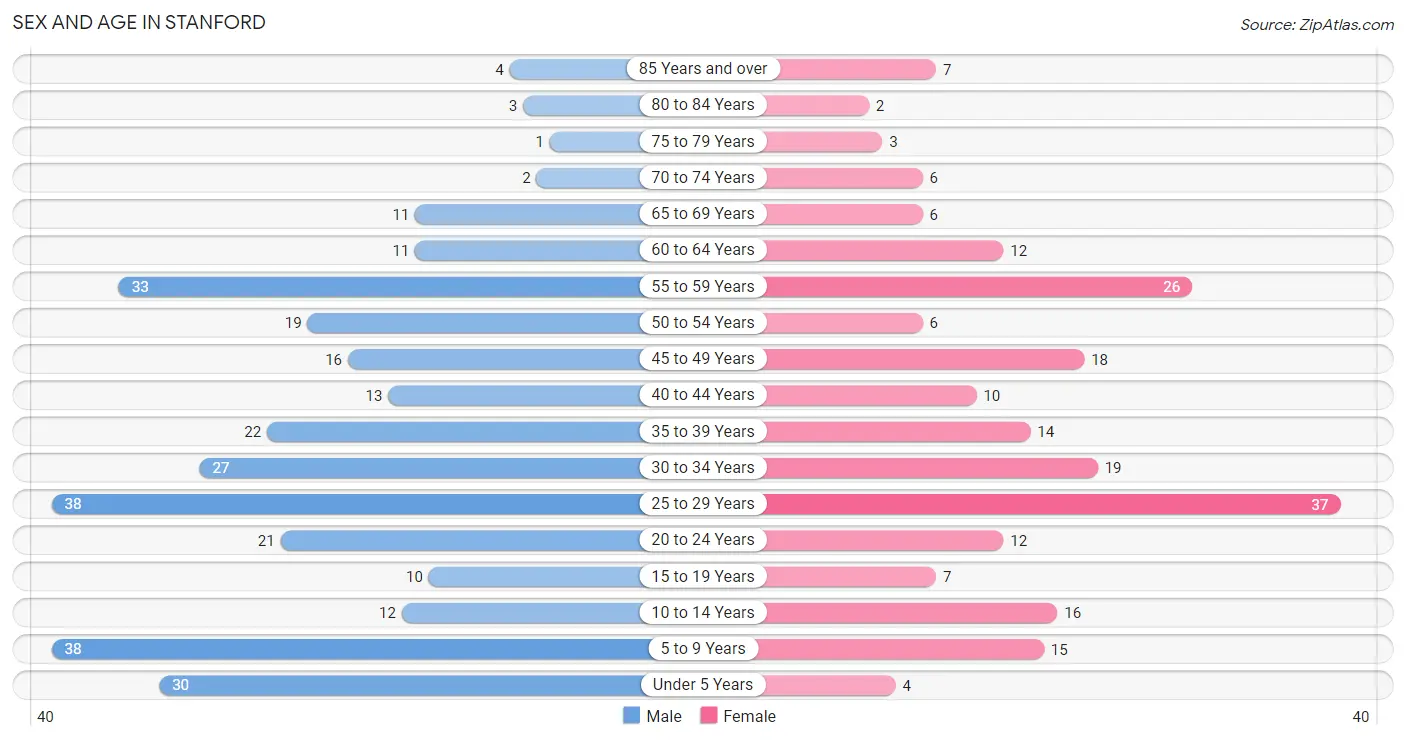
| Age Bracket | Male | Female |
| Under 5 Years | 30 (9.7%) | 4 (1.8%) |
| 5 to 9 Years | 38 (12.2%) | 15 (6.8%) |
| 10 to 14 Years | 12 (3.9%) | 16 (7.3%) |
| 15 to 19 Years | 10 (3.2%) | 7 (3.2%) |
| 20 to 24 Years | 21 (6.8%) | 12 (5.4%) |
| 25 to 29 Years | 38 (12.2%) | 37 (16.8%) |
| 30 to 34 Years | 27 (8.7%) | 19 (8.6%) |
| 35 to 39 Years | 22 (7.1%) | 14 (6.4%) |
| 40 to 44 Years | 13 (4.2%) | 10 (4.5%) |
| 45 to 49 Years | 16 (5.1%) | 18 (8.2%) |
| 50 to 54 Years | 19 (6.1%) | 6 (2.7%) |
| 55 to 59 Years | 33 (10.6%) | 26 (11.8%) |
| 60 to 64 Years | 11 (3.5%) | 12 (5.4%) |
| 65 to 69 Years | 11 (3.5%) | 6 (2.7%) |
| 70 to 74 Years | 2 (0.6%) | 6 (2.7%) |
| 75 to 79 Years | 1 (0.3%) | 3 (1.4%) |
| 80 to 84 Years | 3 (1.0%) | 2 (0.9%) |
| 85 Years and over | 4 (1.3%) | 7 (3.2%) |
| Total | 311 (100.0%) | 220 (100.0%) |
Families and Households in Stanford
Median Family Size in Stanford
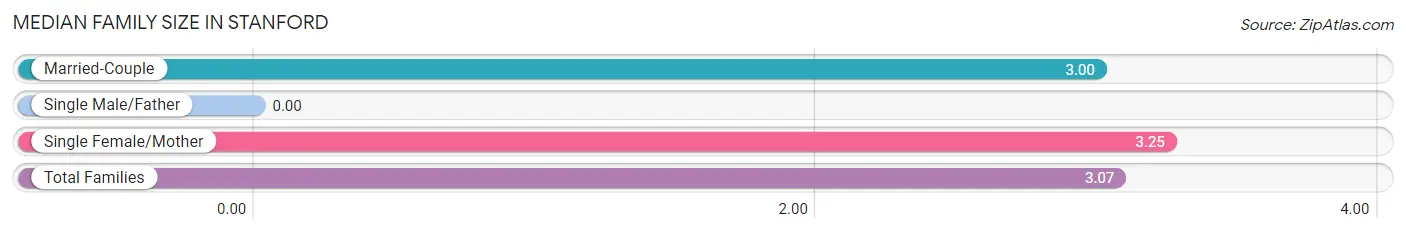
| Family Type | # Families | Family Size |
| Married-Couple | 91 (74.0%) | 3.00 |
| Single Male/Father | 0 (0.0%) | - |
| Single Female/Mother | 32 (26.0%) | 3.25 |
| Total Families | 123 (100.0%) | 3.07 |
Median Household Size in Stanford
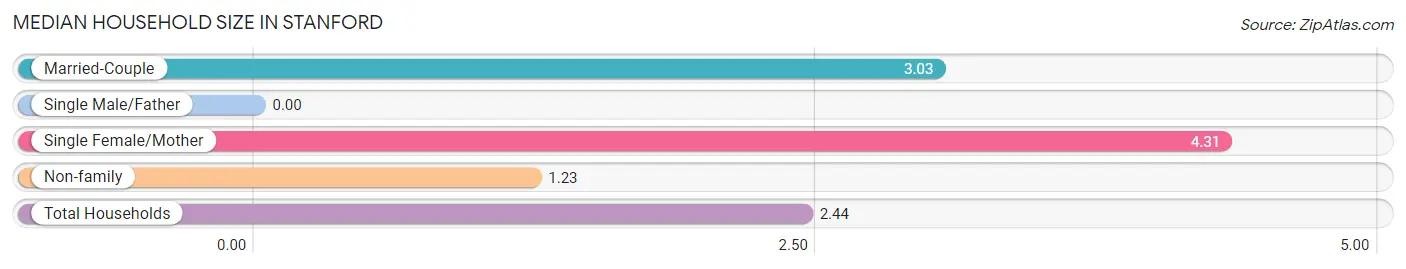
| Household Type | # Households | Household Size |
| Married-Couple | 91 (41.7%) | 3.03 |
| Single Male/Father | 0 (0.0%) | - |
| Single Female/Mother | 32 (14.7%) | 4.31 |
| Non-family | 95 (43.6%) | 1.23 |
| Total Households | 218 (100.0%) | 2.44 |
Household Size by Marriage Status in Stanford
Out of a total of 218 households in Stanford, 123 (56.4%) are family households, while 95 (43.6%) are nonfamily households. The most numerous type of family households are 2-person households, comprising 50, and the most common type of nonfamily households are 1-person households, comprising 76.
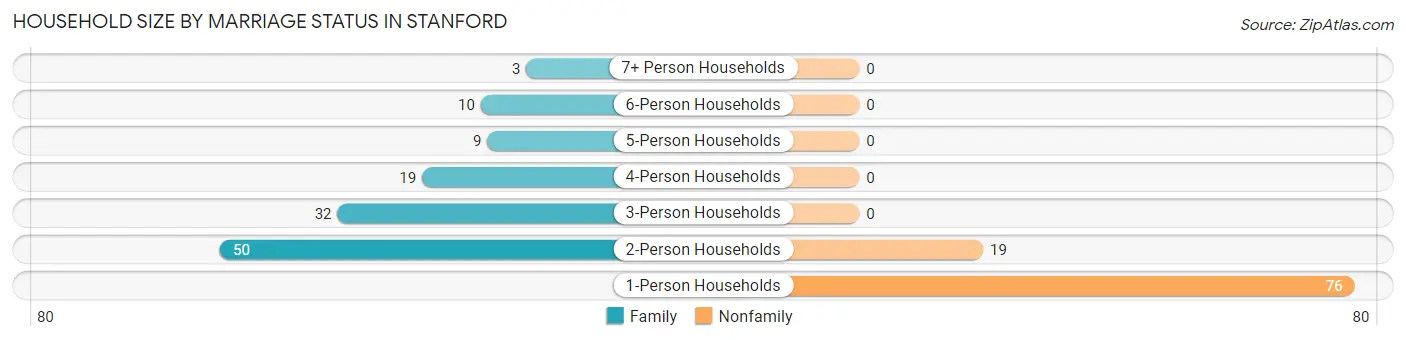
| Household Size | Family Households | Nonfamily Households |
| 1-Person Households | - | 76 (34.9%) |
| 2-Person Households | 50 (22.9%) | 19 (8.7%) |
| 3-Person Households | 32 (14.7%) | 0 (0.0%) |
| 4-Person Households | 19 (8.7%) | 0 (0.0%) |
| 5-Person Households | 9 (4.1%) | 0 (0.0%) |
| 6-Person Households | 10 (4.6%) | 0 (0.0%) |
| 7+ Person Households | 3 (1.4%) | 0 (0.0%) |
| Total | 123 (56.4%) | 95 (43.6%) |
Female Fertility in Stanford
Fertility by Age in Stanford
Average fertility rate in Stanford is 151.0 births per 1,000 women. Women in the age bracket of 20 to 34 years have the highest fertility rate with 221.0 births per 1,000 women. Women in the age bracket of 20 to 34 years acount for 83.3% of all women with births.
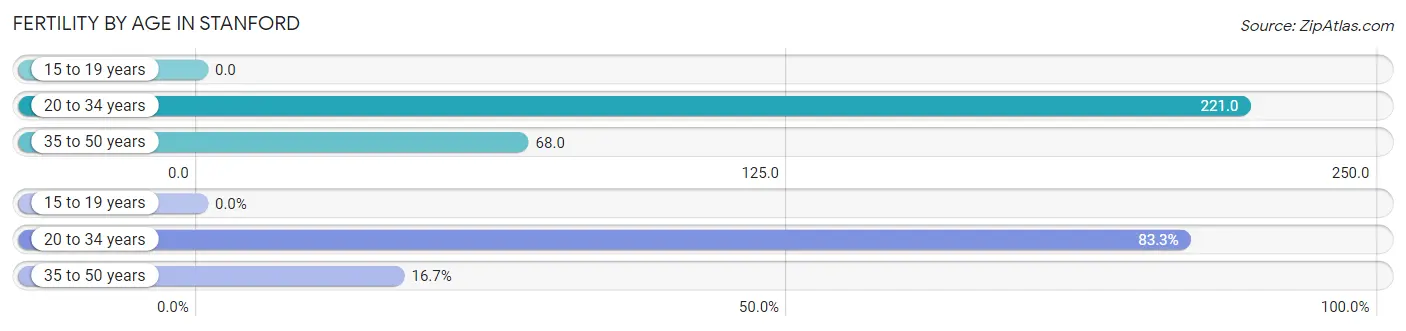
| Age Bracket | Women with Births | Births / 1,000 Women |
| 15 to 19 years | 0 (0.0%) | 0.0 |
| 20 to 34 years | 15 (83.3%) | 221.0 |
| 35 to 50 years | 3 (16.7%) | 68.0 |
| Total | 18 (100.0%) | 151.0 |
Fertility by Age by Marriage Status in Stanford
16.7% of women with births (18) in Stanford are married. The highest percentage of unmarried women with births falls into 20 to 34 years age bracket with 100.0% of them unmarried at the time of birth, while the lowest percentage of unmarried women with births belong to 35 to 50 years age bracket with 0.0% of them unmarried.
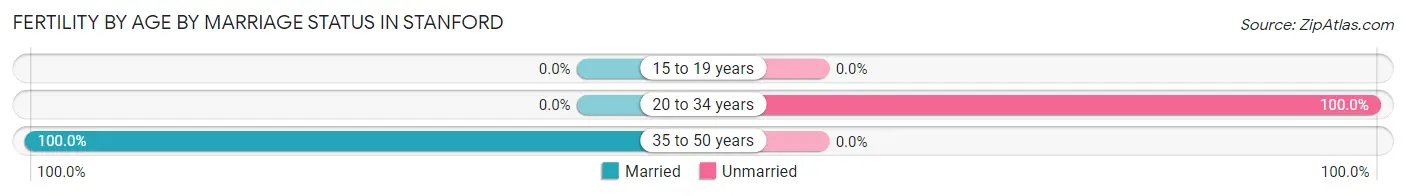
| Age Bracket | Married | Unmarried |
| 15 to 19 years | 0 (0.0%) | 0 (0.0%) |
| 20 to 34 years | 0 (0.0%) | 15 (100.0%) |
| 35 to 50 years | 3 (100.0%) | 0 (0.0%) |
| Total | 3 (16.7%) | 15 (83.3%) |
Fertility by Education in Stanford
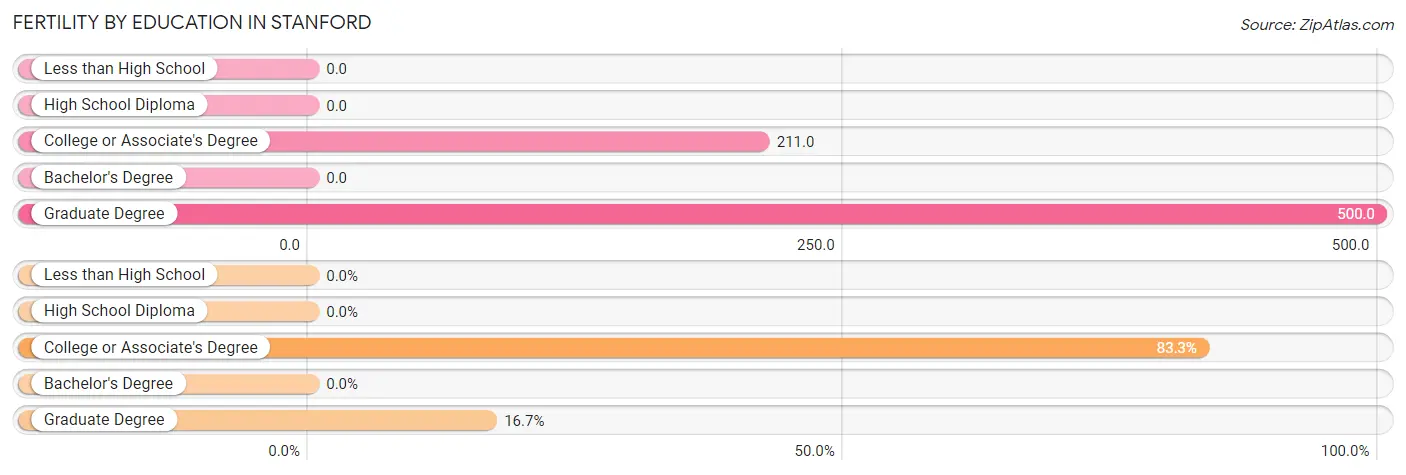
| Educational Attainment | Women with Births | Births / 1,000 Women |
| Less than High School | 0 (0.0%) | 0.0 |
| High School Diploma | 0 (0.0%) | 0.0 |
| College or Associate's Degree | 15 (83.3%) | 211.0 |
| Bachelor's Degree | 0 (0.0%) | 0.0 |
| Graduate Degree | 3 (16.7%) | 500.0 |
| Total | 18 (100.0%) | 151.0 |
Fertility by Education by Marriage Status in Stanford
83.3% of women with births in Stanford are unmarried. Women with the educational attainment of graduate degree are most likely to be married with 100.0% of them married at childbirth, while women with the educational attainment of college or associate's degree are least likely to be married with 100.0% of them unmarried at childbirth.
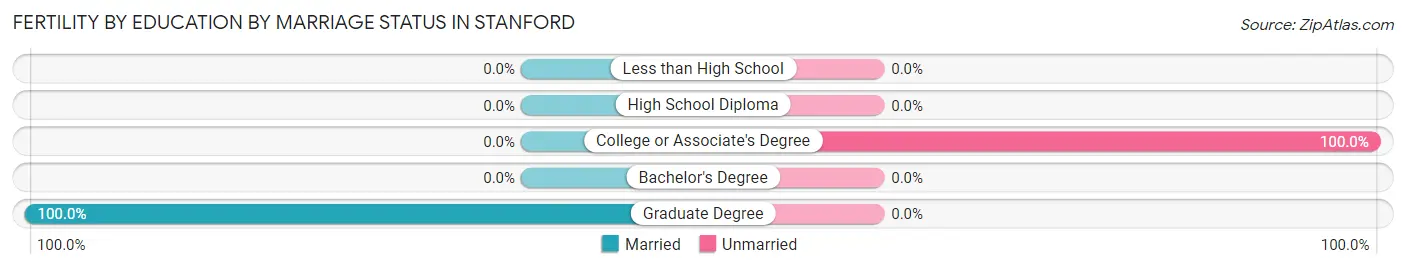
| Educational Attainment | Married | Unmarried |
| Less than High School | 0 (0.0%) | 0 (0.0%) |
| High School Diploma | 0 (0.0%) | 0 (0.0%) |
| College or Associate's Degree | 0 (0.0%) | 15 (100.0%) |
| Bachelor's Degree | 0 (0.0%) | 0 (0.0%) |
| Graduate Degree | 3 (100.0%) | 0 (0.0%) |
| Total | 3 (16.7%) | 15 (83.3%) |
Employment Characteristics in Stanford
Employment by Class of Employer in Stanford
Among the 281 employed individuals in Stanford, private company employees (183 | 65.1%), local government employees (61 | 21.7%), and not-for-profit organizations (16 | 5.7%) make up the most common classes of employment.
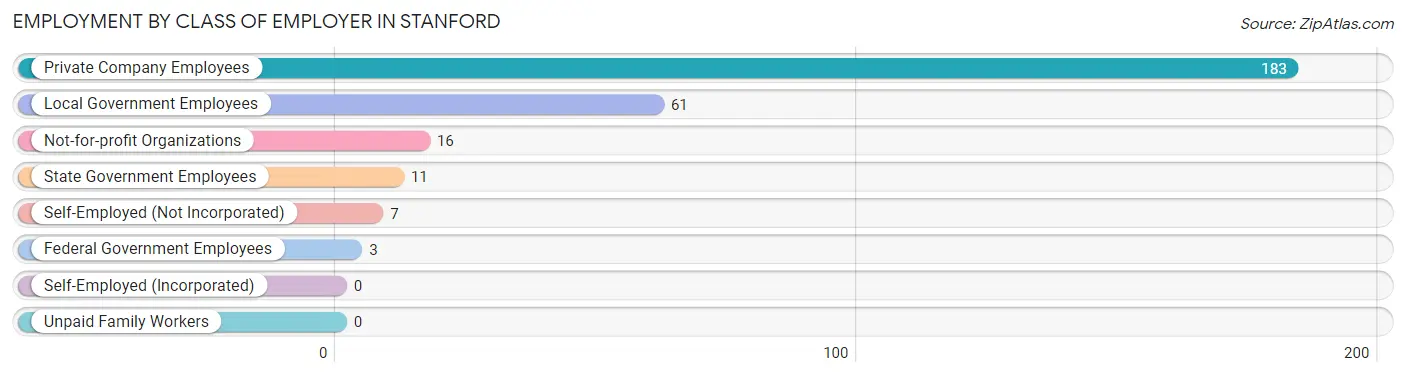
| Employer Class | # Employees | % Employees |
| Private Company Employees | 183 | 65.1% |
| Self-Employed (Incorporated) | 0 | 0.0% |
| Self-Employed (Not Incorporated) | 7 | 2.5% |
| Not-for-profit Organizations | 16 | 5.7% |
| Local Government Employees | 61 | 21.7% |
| State Government Employees | 11 | 3.9% |
| Federal Government Employees | 3 | 1.1% |
| Unpaid Family Workers | 0 | 0.0% |
| Total | 281 | 100.0% |
Employment Status by Age in Stanford
According to the labor force statistics for Stanford, out of the total population over 16 years of age (414), 73.2% or 303 individuals are in the labor force, with 7.3% or 22 of them unemployed. The age group with the highest labor force participation rate is 20 to 24 years, with 100.0% or 33 individuals in the labor force. Within the labor force, the 45 to 54 years age range has the highest percentage of unemployed individuals, with 20.5% or 9 of them being unemployed.
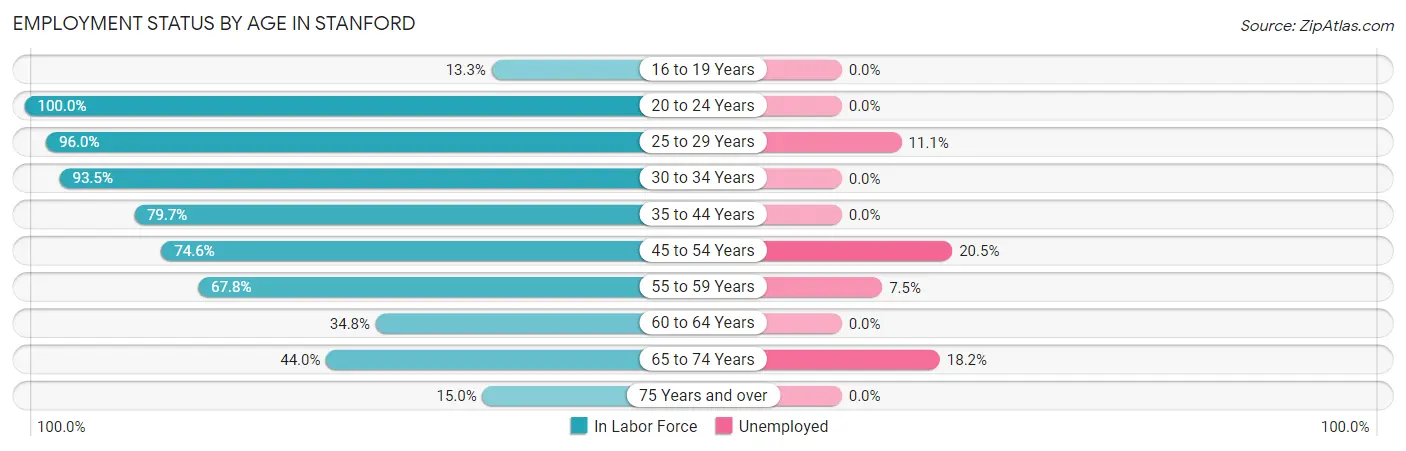
| Age Bracket | In Labor Force | Unemployed |
| 16 to 19 Years | 2 (13.3%) | 0 (0.0%) |
| 20 to 24 Years | 33 (100.0%) | 0 (0.0%) |
| 25 to 29 Years | 72 (96.0%) | 8 (11.1%) |
| 30 to 34 Years | 43 (93.5%) | 0 (0.0%) |
| 35 to 44 Years | 47 (79.7%) | 0 (0.0%) |
| 45 to 54 Years | 44 (74.6%) | 9 (20.5%) |
| 55 to 59 Years | 40 (67.8%) | 3 (7.5%) |
| 60 to 64 Years | 8 (34.8%) | 0 (0.0%) |
| 65 to 74 Years | 11 (44.0%) | 2 (18.2%) |
| 75 Years and over | 3 (15.0%) | 0 (0.0%) |
| Total | 303 (73.2%) | 22 (7.3%) |
Employment Status by Educational Attainment in Stanford
According to labor force statistics for Stanford, 79.1% of individuals (254) out of the total population between 25 and 64 years of age (321) are in the labor force, with 7.9% or 20 of them being unemployed. The group with the highest labor force participation rate are those with the educational attainment of college / associate degree, with 87.8% or 137 individuals in the labor force. Within the labor force, individuals with college / associate degree education have the highest percentage of unemployment, with 14.6% or 20 of them being unemployed.
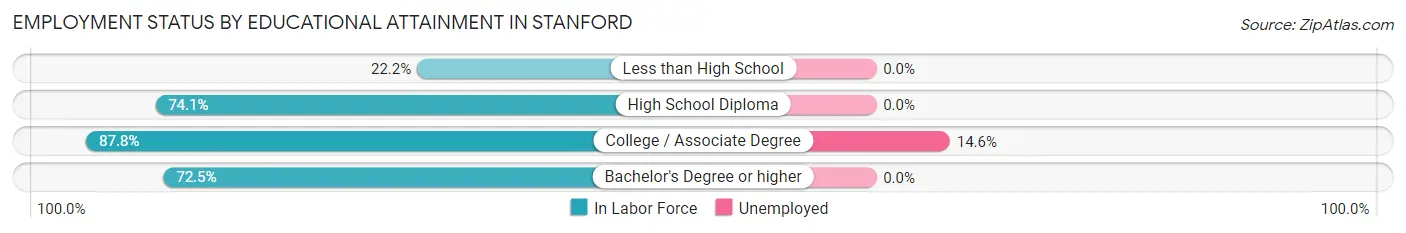
| Educational Attainment | In Labor Force | Unemployed |
| Less than High School | 2 (22.2%) | 0 (0.0%) |
| High School Diploma | 86 (74.1%) | 0 (0.0%) |
| College / Associate Degree | 137 (87.8%) | 23 (14.6%) |
| Bachelor's Degree or higher | 29 (72.5%) | 0 (0.0%) |
| Total | 254 (79.1%) | 25 (7.9%) |
Employment Occupations by Sex in Stanford
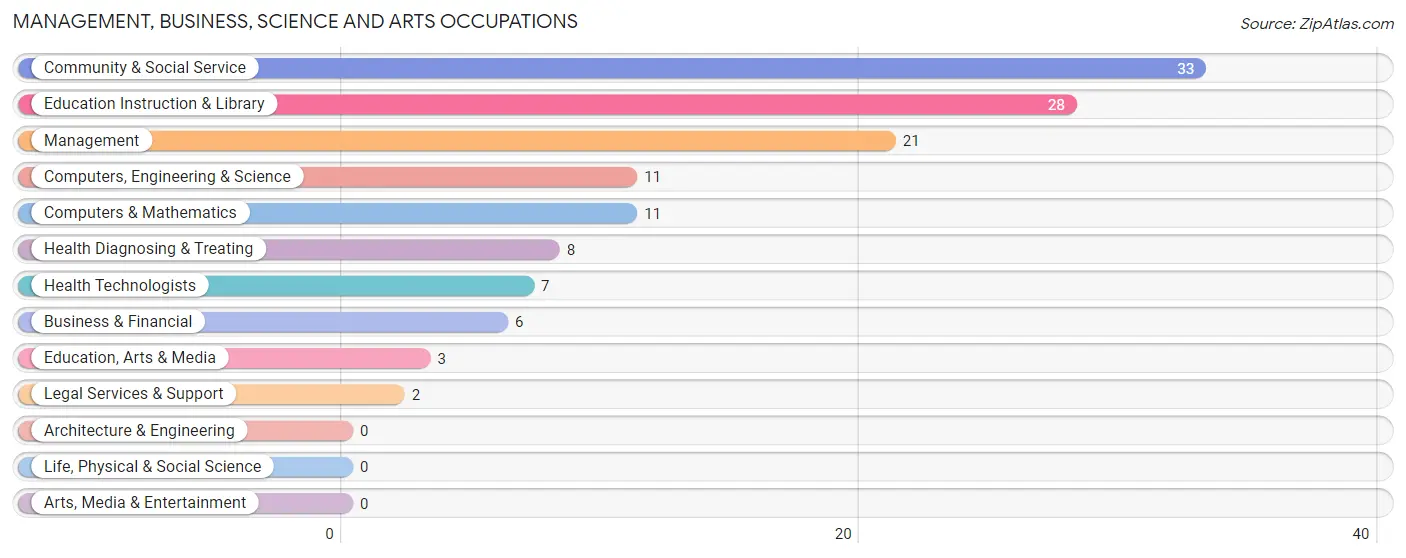
Management, Business, Science and Arts Occupations
The most common Management, Business, Science and Arts occupations in Stanford are Community & Social Service (33 | 11.7%), Education Instruction & Library (28 | 10.0%), Management (21 | 7.5%), Computers, Engineering & Science (11 | 3.9%), and Computers & Mathematics (11 | 3.9%).
Management, Business, Science and Arts Occupations by Sex
Within the Management, Business, Science and Arts occupations in Stanford, the most male-oriented occupations are Management (61.9%), Business & Financial (50.0%), and Computers, Engineering & Science (27.3%), while the most female-oriented occupations are Education, Arts & Media (100.0%), Legal Services & Support (100.0%), and Health Technologists (100.0%).
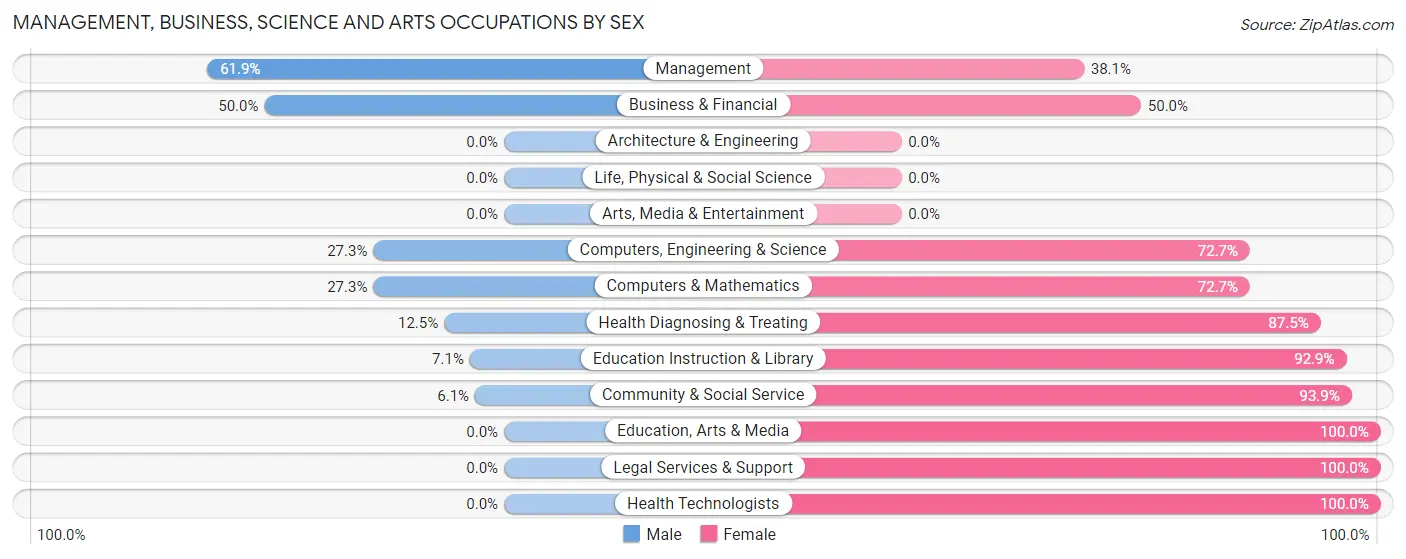
| Occupation | Male | Female |
| Management | 13 (61.9%) | 8 (38.1%) |
| Business & Financial | 3 (50.0%) | 3 (50.0%) |
| Computers, Engineering & Science | 3 (27.3%) | 8 (72.7%) |
| Computers & Mathematics | 3 (27.3%) | 8 (72.7%) |
| Architecture & Engineering | 0 (0.0%) | 0 (0.0%) |
| Life, Physical & Social Science | 0 (0.0%) | 0 (0.0%) |
| Community & Social Service | 2 (6.1%) | 31 (93.9%) |
| Education, Arts & Media | 0 (0.0%) | 3 (100.0%) |
| Legal Services & Support | 0 (0.0%) | 2 (100.0%) |
| Education Instruction & Library | 2 (7.1%) | 26 (92.9%) |
| Arts, Media & Entertainment | 0 (0.0%) | 0 (0.0%) |
| Health Diagnosing & Treating | 1 (12.5%) | 7 (87.5%) |
| Health Technologists | 0 (0.0%) | 7 (100.0%) |
| Total (Category) | 22 (27.9%) | 57 (72.2%) |
| Total (Overall) | 156 (55.5%) | 125 (44.5%) |
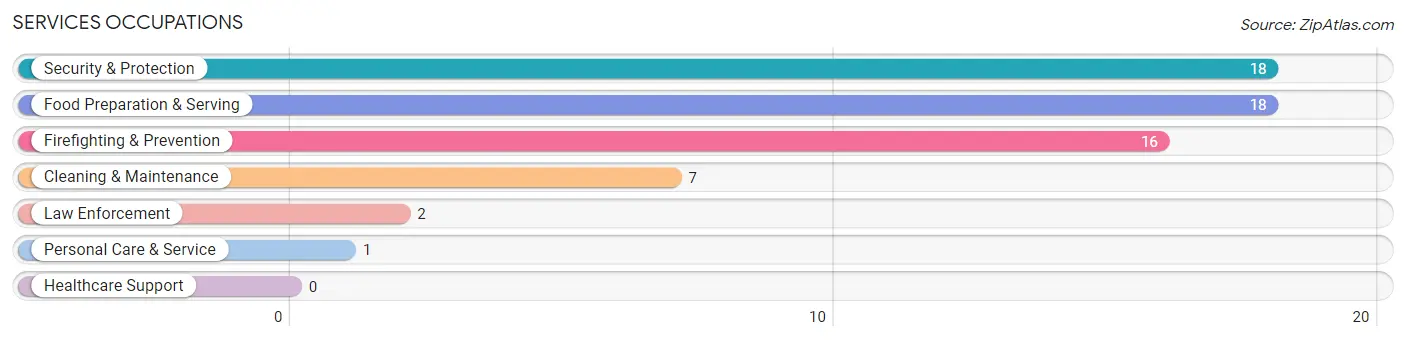
Services Occupations
The most common Services occupations in Stanford are Security & Protection (18 | 6.4%), Food Preparation & Serving (18 | 6.4%), Firefighting & Prevention (16 | 5.7%), Cleaning & Maintenance (7 | 2.5%), and Law Enforcement (2 | 0.7%).
Services Occupations by Sex
Within the Services occupations in Stanford, the most male-oriented occupations are Law Enforcement (100.0%), Cleaning & Maintenance (100.0%), and Security & Protection (88.9%), while the most female-oriented occupations are Personal Care & Service (100.0%), Food Preparation & Serving (83.3%), and Firefighting & Prevention (12.5%).
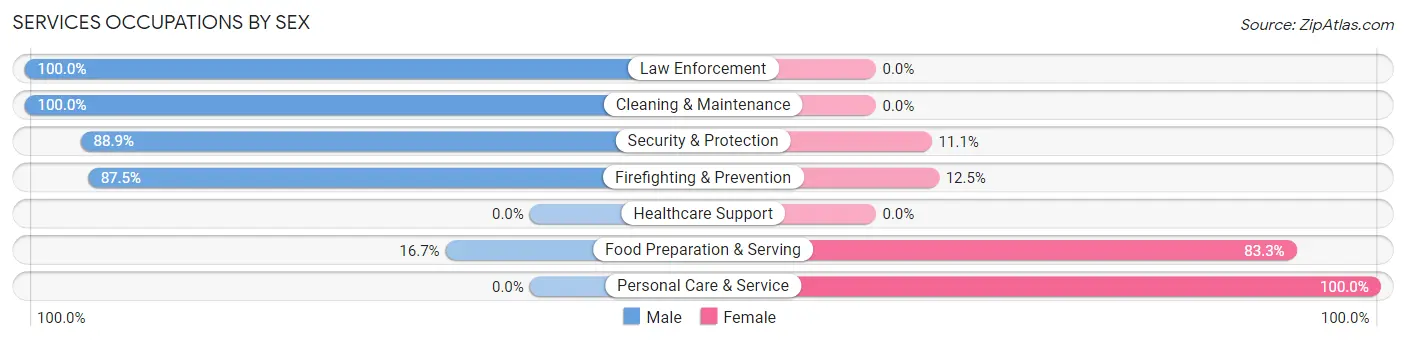
| Occupation | Male | Female |
| Healthcare Support | 0 (0.0%) | 0 (0.0%) |
| Security & Protection | 16 (88.9%) | 2 (11.1%) |
| Firefighting & Prevention | 14 (87.5%) | 2 (12.5%) |
| Law Enforcement | 2 (100.0%) | 0 (0.0%) |
| Food Preparation & Serving | 3 (16.7%) | 15 (83.3%) |
| Cleaning & Maintenance | 7 (100.0%) | 0 (0.0%) |
| Personal Care & Service | 0 (0.0%) | 1 (100.0%) |
| Total (Category) | 26 (59.1%) | 18 (40.9%) |
| Total (Overall) | 156 (55.5%) | 125 (44.5%) |
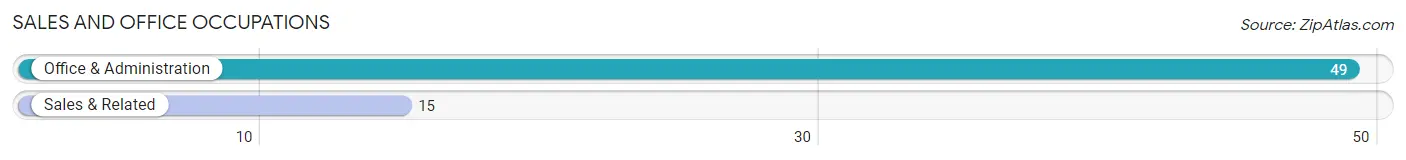
Sales and Office Occupations
The most common Sales and Office occupations in Stanford are Office & Administration (49 | 17.4%), and Sales & Related (15 | 5.3%).
Sales and Office Occupations by Sex
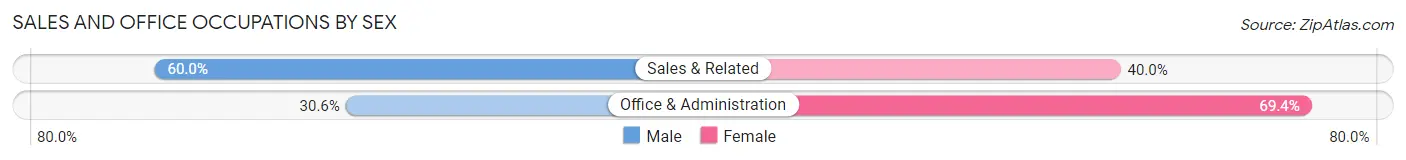
| Occupation | Male | Female |
| Sales & Related | 9 (60.0%) | 6 (40.0%) |
| Office & Administration | 15 (30.6%) | 34 (69.4%) |
| Total (Category) | 24 (37.5%) | 40 (62.5%) |
| Total (Overall) | 156 (55.5%) | 125 (44.5%) |
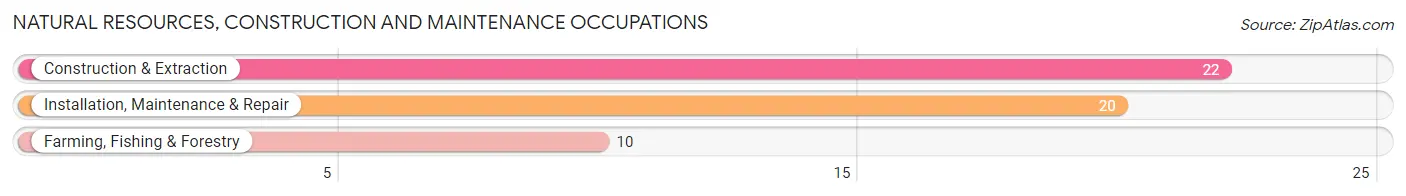
Natural Resources, Construction and Maintenance Occupations
The most common Natural Resources, Construction and Maintenance occupations in Stanford are Construction & Extraction (22 | 7.8%), Installation, Maintenance & Repair (20 | 7.1%), and Farming, Fishing & Forestry (10 | 3.6%).
Natural Resources, Construction and Maintenance Occupations by Sex
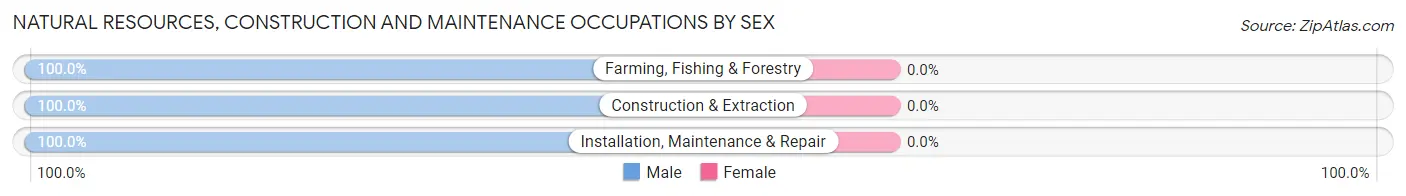
| Occupation | Male | Female |
| Farming, Fishing & Forestry | 10 (100.0%) | 0 (0.0%) |
| Construction & Extraction | 22 (100.0%) | 0 (0.0%) |
| Installation, Maintenance & Repair | 20 (100.0%) | 0 (0.0%) |
| Total (Category) | 52 (100.0%) | 0 (0.0%) |
| Total (Overall) | 156 (55.5%) | 125 (44.5%) |
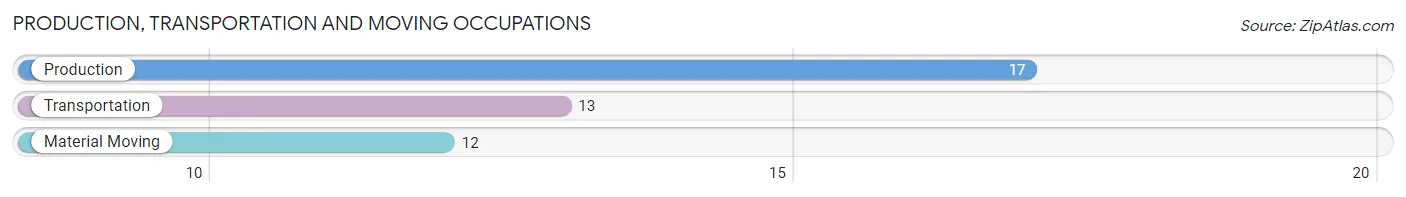
Production, Transportation and Moving Occupations
The most common Production, Transportation and Moving occupations in Stanford are Production (17 | 6.0%), Transportation (13 | 4.6%), and Material Moving (12 | 4.3%).
Production, Transportation and Moving Occupations by Sex
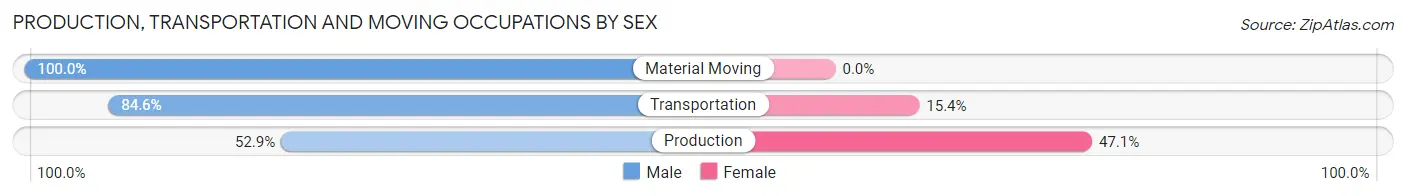
| Occupation | Male | Female |
| Production | 9 (52.9%) | 8 (47.1%) |
| Transportation | 11 (84.6%) | 2 (15.4%) |
| Material Moving | 12 (100.0%) | 0 (0.0%) |
| Total (Category) | 32 (76.2%) | 10 (23.8%) |
| Total (Overall) | 156 (55.5%) | 125 (44.5%) |
Employment Industries by Sex in Stanford
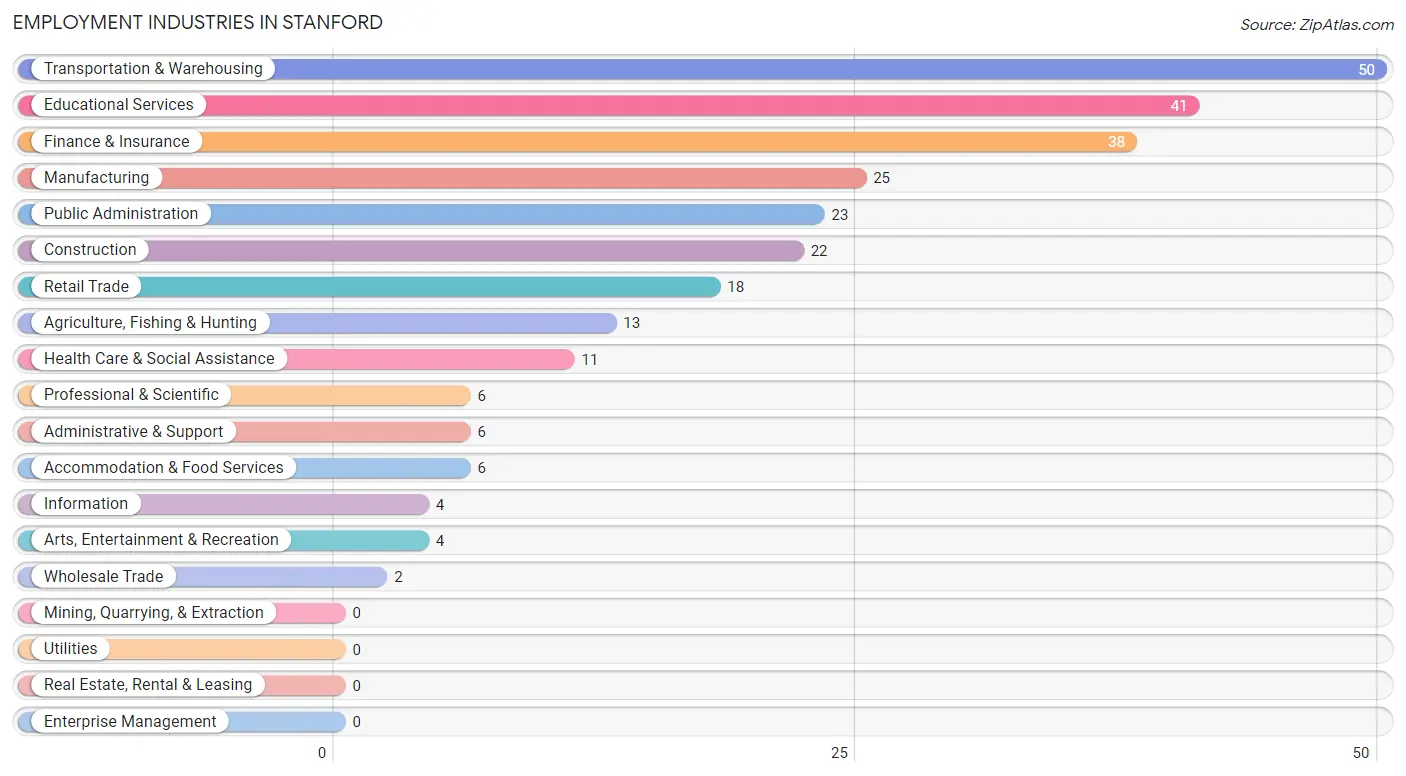
Employment Industries in Stanford
The major employment industries in Stanford include Transportation & Warehousing (50 | 17.8%), Educational Services (41 | 14.6%), Finance & Insurance (38 | 13.5%), Manufacturing (25 | 8.9%), and Public Administration (23 | 8.2%).
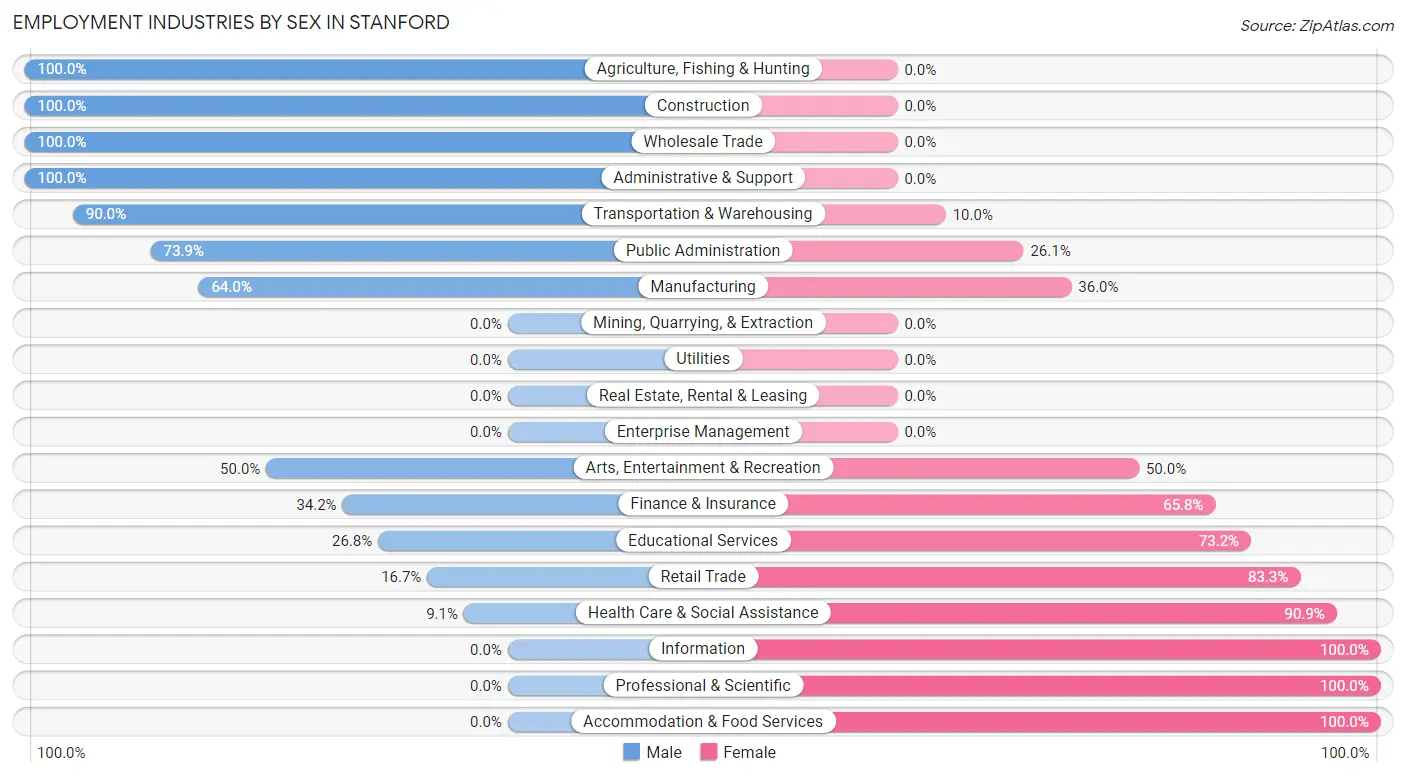
Employment Industries by Sex in Stanford
The Stanford industries that see more men than women are Agriculture, Fishing & Hunting (100.0%), Construction (100.0%), and Wholesale Trade (100.0%), whereas the industries that tend to have a higher number of women are Information (100.0%), Professional & Scientific (100.0%), and Accommodation & Food Services (100.0%).
| Industry | Male | Female |
| Agriculture, Fishing & Hunting | 13 (100.0%) | 0 (0.0%) |
| Mining, Quarrying, & Extraction | 0 (0.0%) | 0 (0.0%) |
| Construction | 22 (100.0%) | 0 (0.0%) |
| Manufacturing | 16 (64.0%) | 9 (36.0%) |
| Wholesale Trade | 2 (100.0%) | 0 (0.0%) |
| Retail Trade | 3 (16.7%) | 15 (83.3%) |
| Transportation & Warehousing | 45 (90.0%) | 5 (10.0%) |
| Utilities | 0 (0.0%) | 0 (0.0%) |
| Information | 0 (0.0%) | 4 (100.0%) |
| Finance & Insurance | 13 (34.2%) | 25 (65.8%) |
| Real Estate, Rental & Leasing | 0 (0.0%) | 0 (0.0%) |
| Professional & Scientific | 0 (0.0%) | 6 (100.0%) |
| Enterprise Management | 0 (0.0%) | 0 (0.0%) |
| Administrative & Support | 6 (100.0%) | 0 (0.0%) |
| Educational Services | 11 (26.8%) | 30 (73.2%) |
| Health Care & Social Assistance | 1 (9.1%) | 10 (90.9%) |
| Arts, Entertainment & Recreation | 2 (50.0%) | 2 (50.0%) |
| Accommodation & Food Services | 0 (0.0%) | 6 (100.0%) |
| Public Administration | 17 (73.9%) | 6 (26.1%) |
| Total | 156 (55.5%) | 125 (44.5%) |
Education in Stanford
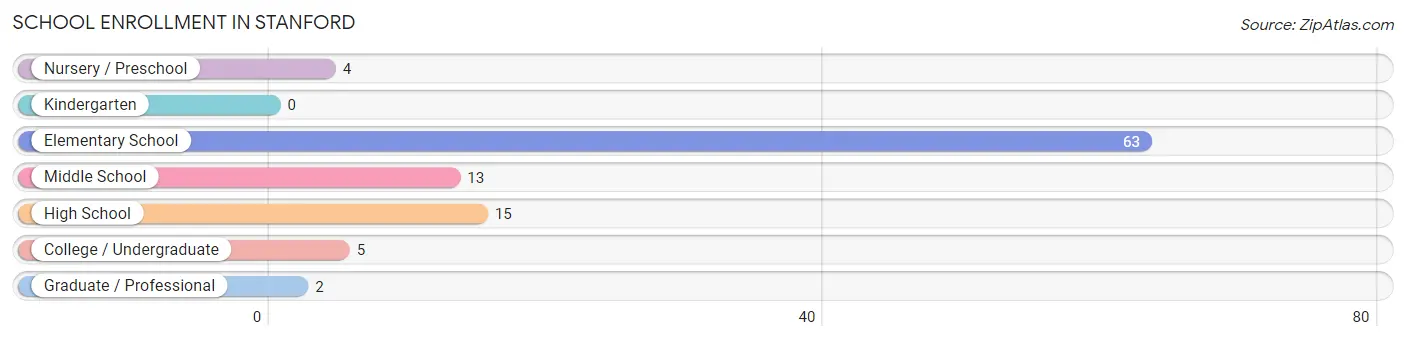
School Enrollment in Stanford
The most common levels of schooling among the 102 students in Stanford are elementary school (63 | 61.8%), high school (15 | 14.7%), and middle school (13 | 12.8%).
| School Level | # Students | % Students |
| Nursery / Preschool | 4 | 3.9% |
| Kindergarten | 0 | 0.0% |
| Elementary School | 63 | 61.8% |
| Middle School | 13 | 12.8% |
| High School | 15 | 14.7% |
| College / Undergraduate | 5 | 4.9% |
| Graduate / Professional | 2 | 2.0% |
| Total | 102 | 100.0% |
School Enrollment by Age by Funding Source in Stanford
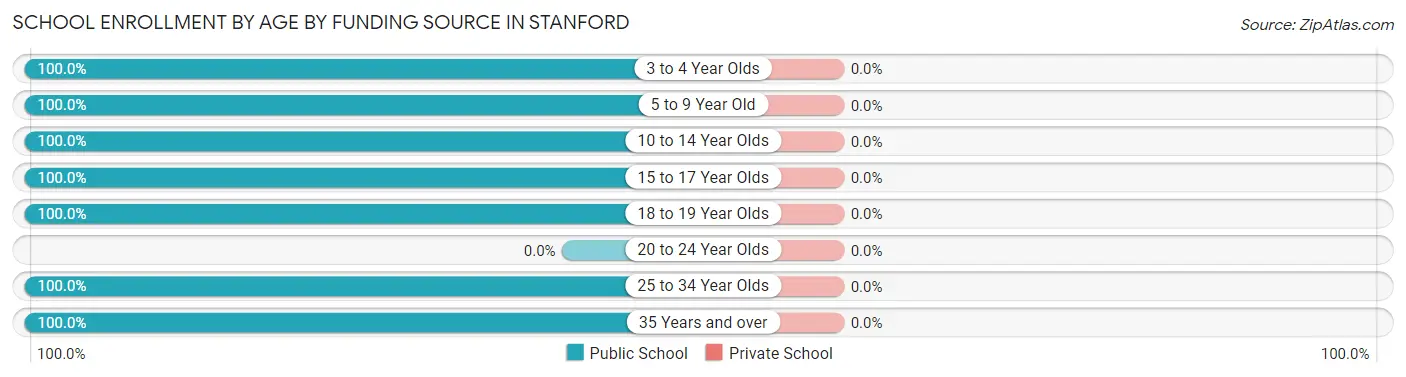
| Age Bracket | Public School | Private School |
| 3 to 4 Year Olds | 4 (100.0%) | 0 (0.0%) |
| 5 to 9 Year Old | 48 (100.0%) | 0 (0.0%) |
| 10 to 14 Year Olds | 28 (100.0%) | 0 (0.0%) |
| 15 to 17 Year Olds | 11 (100.0%) | 0 (0.0%) |
| 18 to 19 Year Olds | 6 (100.0%) | 0 (0.0%) |
| 20 to 24 Year Olds | 0 (0.0%) | 0 (0.0%) |
| 25 to 34 Year Olds | 3 (100.0%) | 0 (0.0%) |
| 35 Years and over | 2 (100.0%) | 0 (0.0%) |
| Total | 102 (100.0%) | 0 (0.0%) |
Educational Attainment by Field of Study in Stanford
Business (13 | 25.0%), education (12 | 23.1%), science & technology (10 | 19.2%), arts & humanities (5 | 9.6%), and bio, nature & agricultural (4 | 7.7%) are the most common fields of study among 52 individuals in Stanford who have obtained a bachelor's degree or higher.
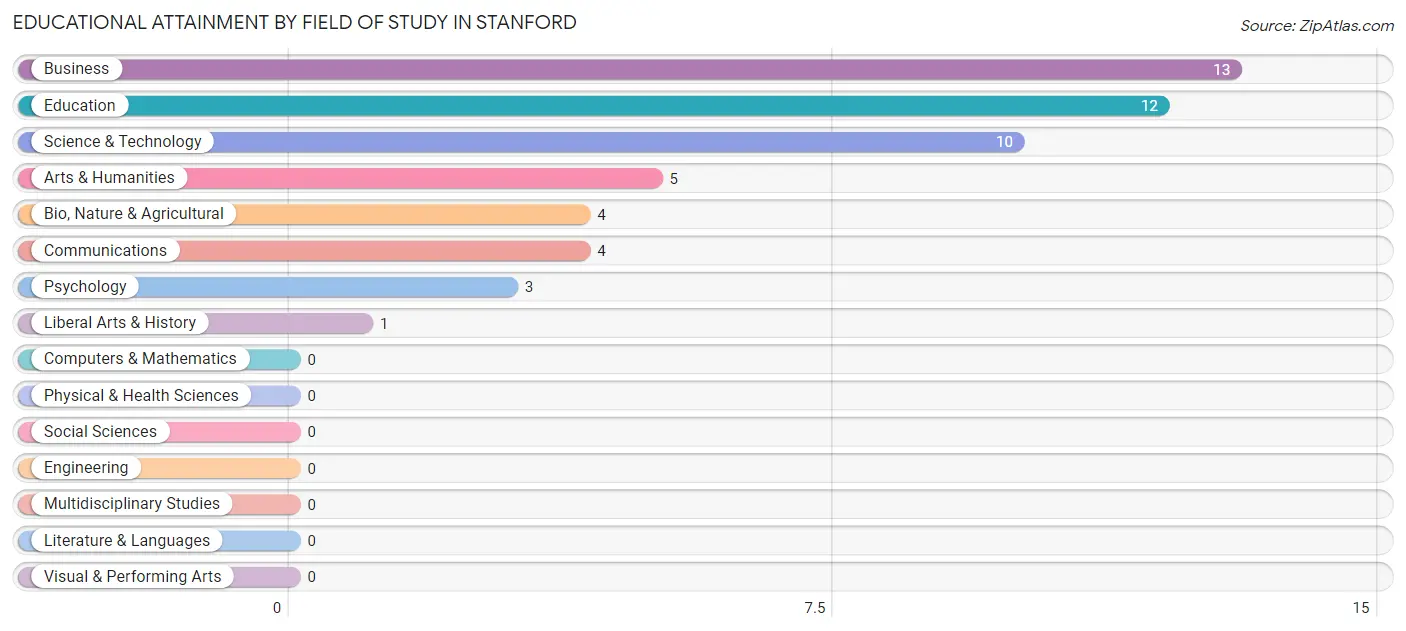
| Field of Study | # Graduates | % Graduates |
| Computers & Mathematics | 0 | 0.0% |
| Bio, Nature & Agricultural | 4 | 7.7% |
| Physical & Health Sciences | 0 | 0.0% |
| Psychology | 3 | 5.8% |
| Social Sciences | 0 | 0.0% |
| Engineering | 0 | 0.0% |
| Multidisciplinary Studies | 0 | 0.0% |
| Science & Technology | 10 | 19.2% |
| Business | 13 | 25.0% |
| Education | 12 | 23.1% |
| Literature & Languages | 0 | 0.0% |
| Liberal Arts & History | 1 | 1.9% |
| Visual & Performing Arts | 0 | 0.0% |
| Communications | 4 | 7.7% |
| Arts & Humanities | 5 | 9.6% |
| Total | 52 | 100.0% |
Transportation & Commute in Stanford
Vehicle Availability by Sex in Stanford
The most prevalent vehicle ownership categories in Stanford are males with 2 vehicles (62, accounting for 39.7%) and females with 2 vehicles (55, making up 49.6%).
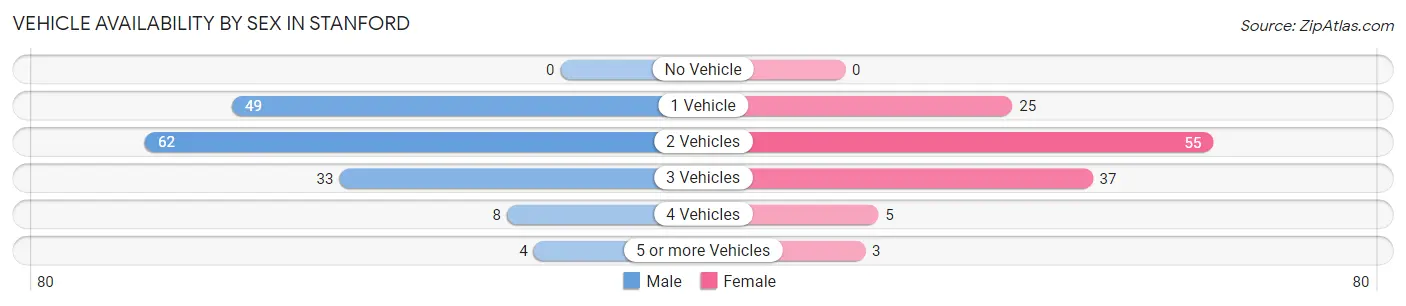
| Vehicles Available | Male | Female |
| No Vehicle | 0 (0.0%) | 0 (0.0%) |
| 1 Vehicle | 49 (31.4%) | 25 (20.0%) |
| 2 Vehicles | 62 (39.7%) | 55 (44.0%) |
| 3 Vehicles | 33 (21.1%) | 37 (29.6%) |
| 4 Vehicles | 8 (5.1%) | 5 (4.0%) |
| 5 or more Vehicles | 4 (2.6%) | 3 (2.4%) |
| Total | 156 (100.0%) | 125 (100.0%) |
Commute Time in Stanford
The most frequently occuring commute durations in Stanford are 20 to 24 minutes (58 commuters, 22.1%), 15 to 19 minutes (41 commuters, 15.6%), and 30 to 34 minutes (41 commuters, 15.6%).
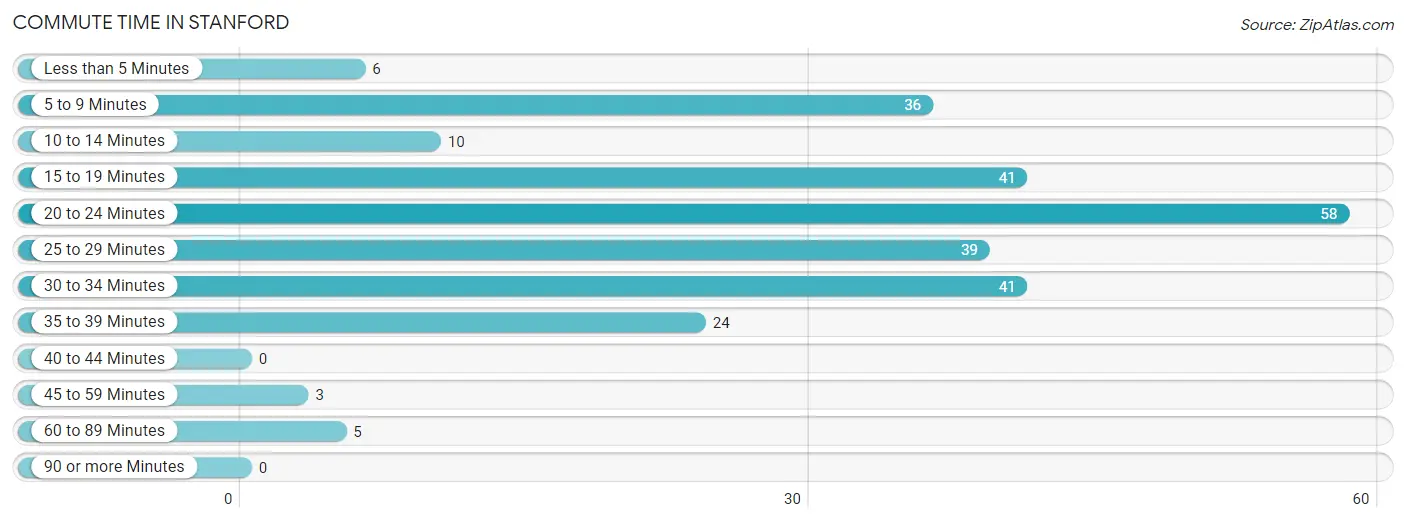
| Commute Time | # Commuters | % Commuters |
| Less than 5 Minutes | 6 | 2.3% |
| 5 to 9 Minutes | 36 | 13.7% |
| 10 to 14 Minutes | 10 | 3.8% |
| 15 to 19 Minutes | 41 | 15.6% |
| 20 to 24 Minutes | 58 | 22.1% |
| 25 to 29 Minutes | 39 | 14.8% |
| 30 to 34 Minutes | 41 | 15.6% |
| 35 to 39 Minutes | 24 | 9.1% |
| 40 to 44 Minutes | 0 | 0.0% |
| 45 to 59 Minutes | 3 | 1.1% |
| 60 to 89 Minutes | 5 | 1.9% |
| 90 or more Minutes | 0 | 0.0% |
Commute Time by Sex in Stanford
The most common commute times in Stanford are 20 to 24 minutes (29 commuters, 19.9%) for males and 20 to 24 minutes (29 commuters, 24.8%) for females.
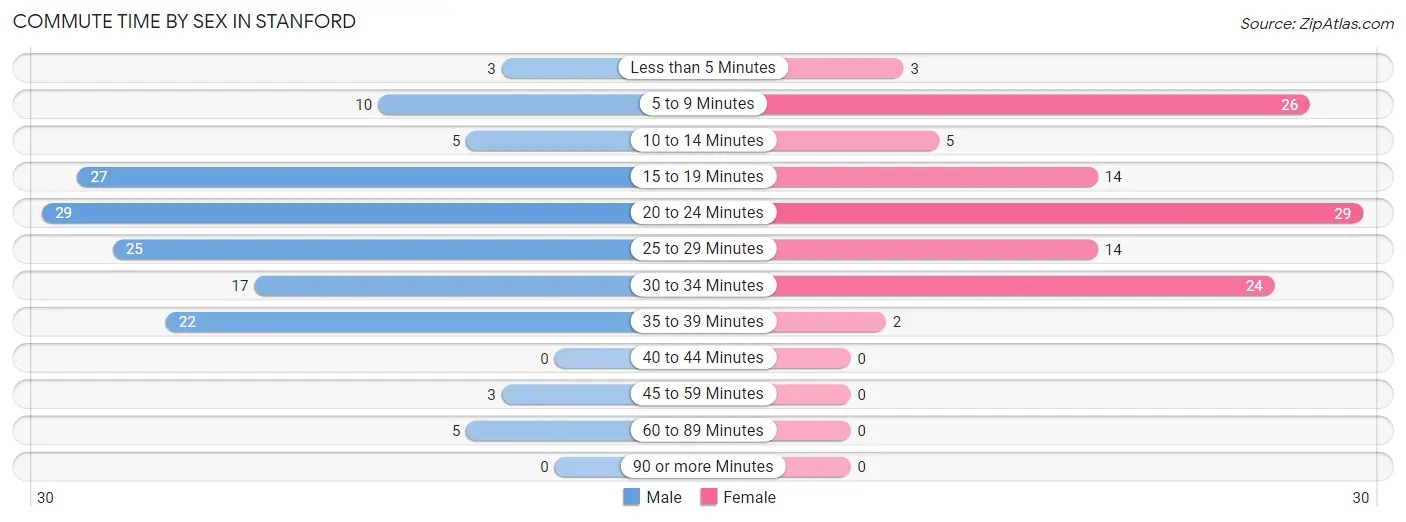
| Commute Time | Male | Female |
| Less than 5 Minutes | 3 (2.1%) | 3 (2.6%) |
| 5 to 9 Minutes | 10 (6.9%) | 26 (22.2%) |
| 10 to 14 Minutes | 5 (3.4%) | 5 (4.3%) |
| 15 to 19 Minutes | 27 (18.5%) | 14 (12.0%) |
| 20 to 24 Minutes | 29 (19.9%) | 29 (24.8%) |
| 25 to 29 Minutes | 25 (17.1%) | 14 (12.0%) |
| 30 to 34 Minutes | 17 (11.6%) | 24 (20.5%) |
| 35 to 39 Minutes | 22 (15.1%) | 2 (1.7%) |
| 40 to 44 Minutes | 0 (0.0%) | 0 (0.0%) |
| 45 to 59 Minutes | 3 (2.1%) | 0 (0.0%) |
| 60 to 89 Minutes | 5 (3.4%) | 0 (0.0%) |
| 90 or more Minutes | 0 (0.0%) | 0 (0.0%) |
Time of Departure to Work by Sex in Stanford
The most frequent times of departure to work in Stanford are 6:00 AM to 6:29 AM (37, 25.3%) for males and 7:00 AM to 7:29 AM (31, 26.5%) for females.
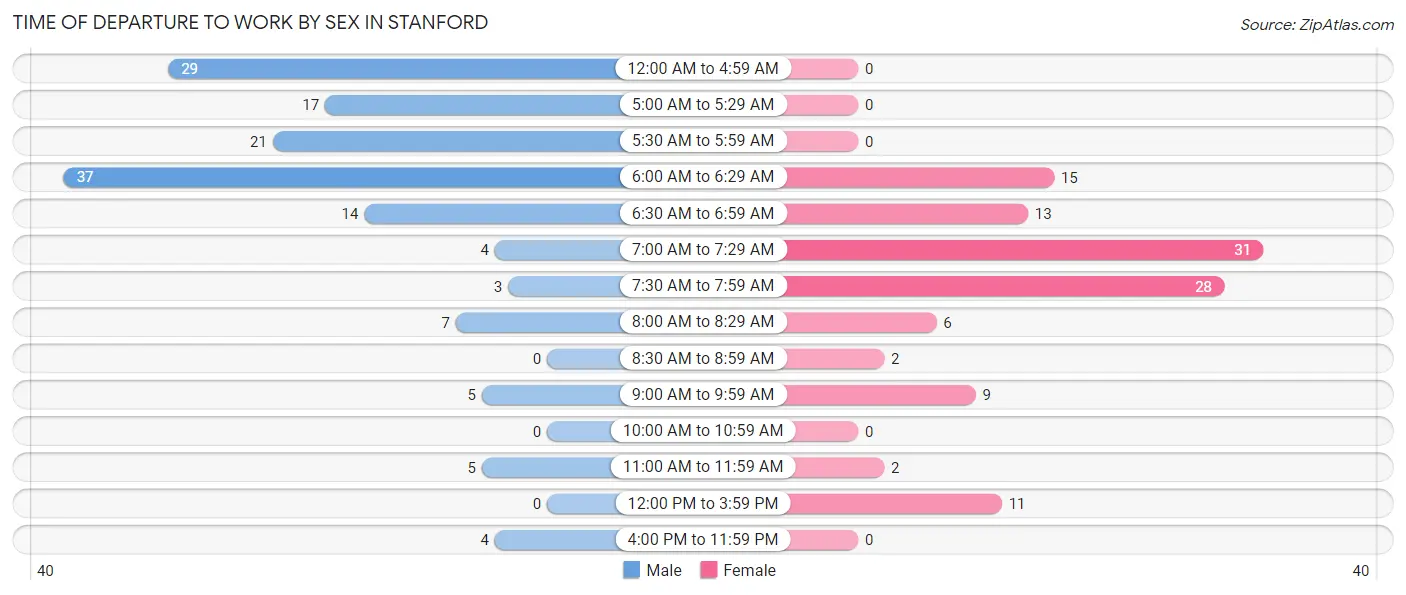
| Time of Departure | Male | Female |
| 12:00 AM to 4:59 AM | 29 (19.9%) | 0 (0.0%) |
| 5:00 AM to 5:29 AM | 17 (11.6%) | 0 (0.0%) |
| 5:30 AM to 5:59 AM | 21 (14.4%) | 0 (0.0%) |
| 6:00 AM to 6:29 AM | 37 (25.3%) | 15 (12.8%) |
| 6:30 AM to 6:59 AM | 14 (9.6%) | 13 (11.1%) |
| 7:00 AM to 7:29 AM | 4 (2.7%) | 31 (26.5%) |
| 7:30 AM to 7:59 AM | 3 (2.1%) | 28 (23.9%) |
| 8:00 AM to 8:29 AM | 7 (4.8%) | 6 (5.1%) |
| 8:30 AM to 8:59 AM | 0 (0.0%) | 2 (1.7%) |
| 9:00 AM to 9:59 AM | 5 (3.4%) | 9 (7.7%) |
| 10:00 AM to 10:59 AM | 0 (0.0%) | 0 (0.0%) |
| 11:00 AM to 11:59 AM | 5 (3.4%) | 2 (1.7%) |
| 12:00 PM to 3:59 PM | 0 (0.0%) | 11 (9.4%) |
| 4:00 PM to 11:59 PM | 4 (2.7%) | 0 (0.0%) |
| Total | 146 (100.0%) | 117 (100.0%) |
Housing Occupancy in Stanford
Occupancy by Ownership in Stanford
Of the total 218 dwellings in Stanford, owner-occupied units account for 192 (88.1%), while renter-occupied units make up 26 (11.9%).
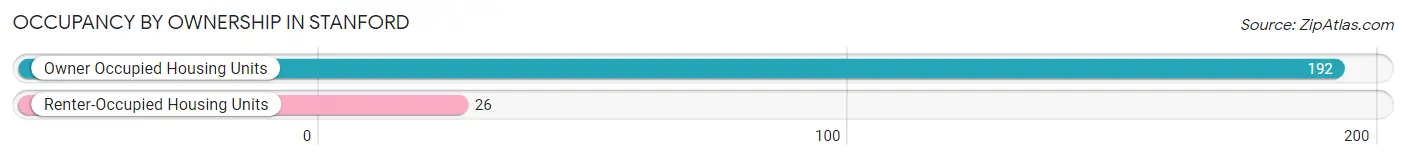
| Occupancy | # Housing Units | % Housing Units |
| Owner Occupied Housing Units | 192 | 88.1% |
| Renter-Occupied Housing Units | 26 | 11.9% |
| Total Occupied Housing Units | 218 | 100.0% |
Occupancy by Household Size in Stanford
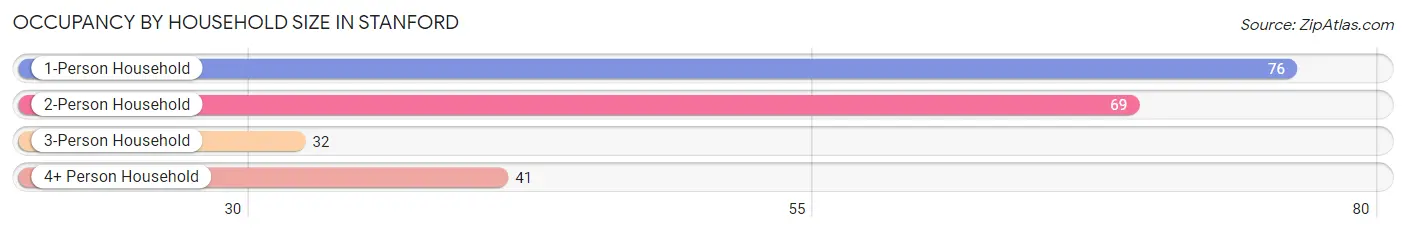
| Household Size | # Housing Units | % Housing Units |
| 1-Person Household | 76 | 34.9% |
| 2-Person Household | 69 | 31.7% |
| 3-Person Household | 32 | 14.7% |
| 4+ Person Household | 41 | 18.8% |
| Total Housing Units | 218 | 100.0% |
Occupancy by Ownership by Household Size in Stanford
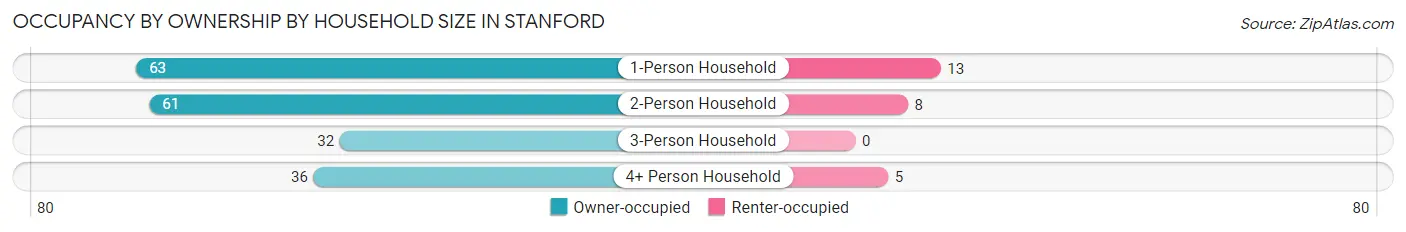
| Household Size | Owner-occupied | Renter-occupied |
| 1-Person Household | 63 (82.9%) | 13 (17.1%) |
| 2-Person Household | 61 (88.4%) | 8 (11.6%) |
| 3-Person Household | 32 (100.0%) | 0 (0.0%) |
| 4+ Person Household | 36 (87.8%) | 5 (12.2%) |
| Total Housing Units | 192 (88.1%) | 26 (11.9%) |
Occupancy by Educational Attainment in Stanford
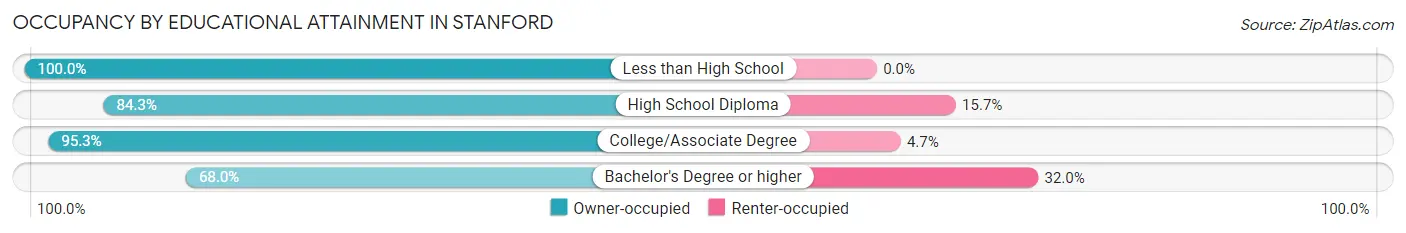
| Household Size | Owner-occupied | Renter-occupied |
| Less than High School | 4 (100.0%) | 0 (0.0%) |
| High School Diploma | 70 (84.3%) | 13 (15.7%) |
| College/Associate Degree | 101 (95.3%) | 5 (4.7%) |
| Bachelor's Degree or higher | 17 (68.0%) | 8 (32.0%) |
Occupancy by Age of Householder in Stanford
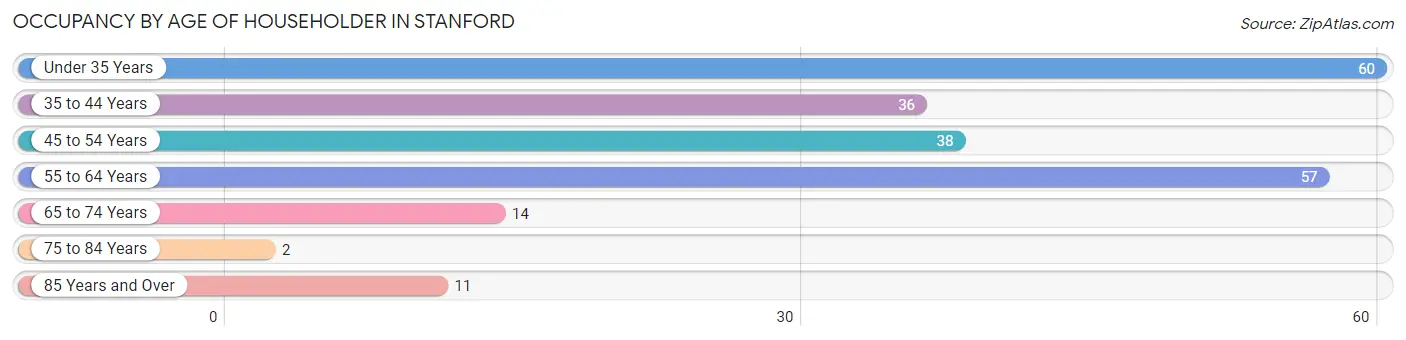
| Age Bracket | # Households | % Households |
| Under 35 Years | 60 | 27.5% |
| 35 to 44 Years | 36 | 16.5% |
| 45 to 54 Years | 38 | 17.4% |
| 55 to 64 Years | 57 | 26.2% |
| 65 to 74 Years | 14 | 6.4% |
| 75 to 84 Years | 2 | 0.9% |
| 85 Years and Over | 11 | 5.1% |
| Total | 218 | 100.0% |
Housing Finances in Stanford
Median Income by Occupancy in Stanford
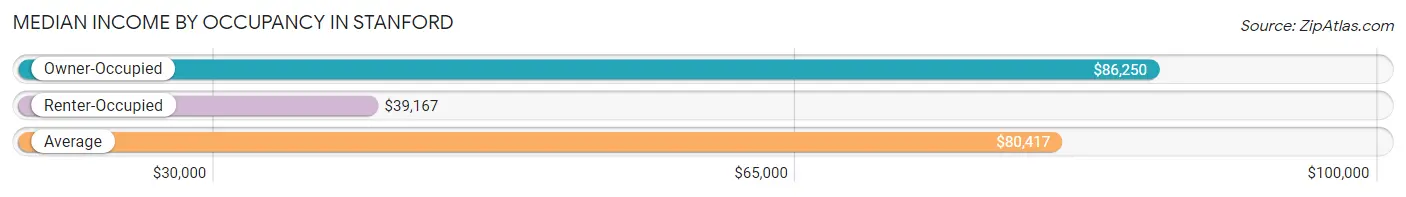
| Occupancy Type | # Households | Median Income |
| Owner-Occupied | 192 (88.1%) | $86,250 |
| Renter-Occupied | 26 (11.9%) | $39,167 |
| Average | 218 (100.0%) | $80,417 |
Occupancy by Householder Income Bracket in Stanford
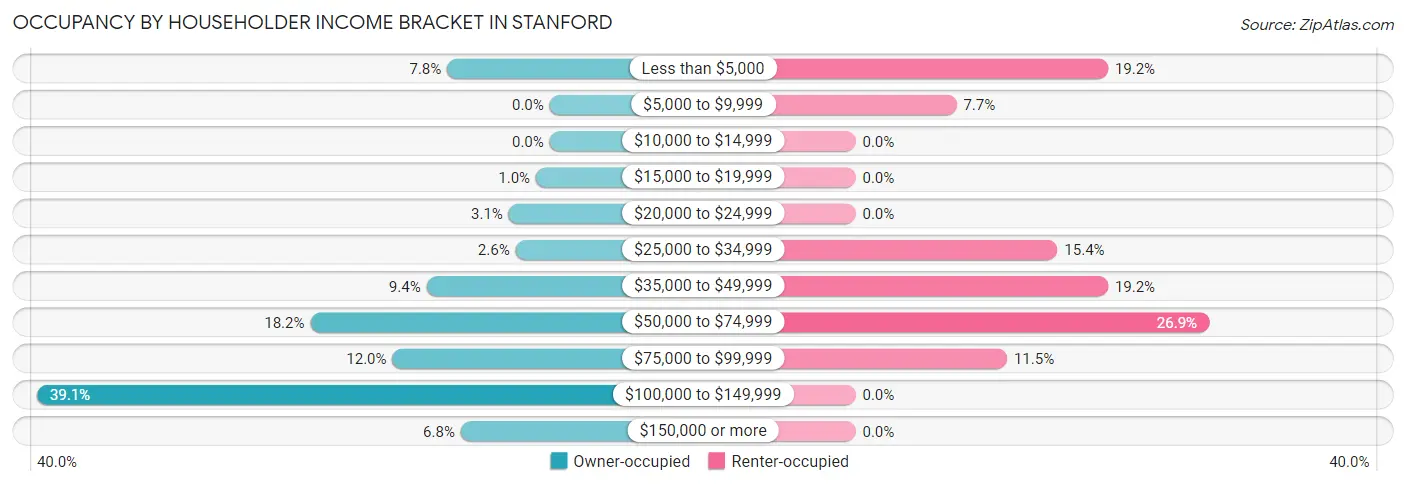
| Income Bracket | Owner-occupied | Renter-occupied |
| Less than $5,000 | 15 (7.8%) | 5 (19.2%) |
| $5,000 to $9,999 | 0 (0.0%) | 2 (7.7%) |
| $10,000 to $14,999 | 0 (0.0%) | 0 (0.0%) |
| $15,000 to $19,999 | 2 (1.0%) | 0 (0.0%) |
| $20,000 to $24,999 | 6 (3.1%) | 0 (0.0%) |
| $25,000 to $34,999 | 5 (2.6%) | 4 (15.4%) |
| $35,000 to $49,999 | 18 (9.4%) | 5 (19.2%) |
| $50,000 to $74,999 | 35 (18.2%) | 7 (26.9%) |
| $75,000 to $99,999 | 23 (12.0%) | 3 (11.5%) |
| $100,000 to $149,999 | 75 (39.1%) | 0 (0.0%) |
| $150,000 or more | 13 (6.8%) | 0 (0.0%) |
| Total | 192 (100.0%) | 26 (100.0%) |
Monthly Housing Cost Tiers in Stanford
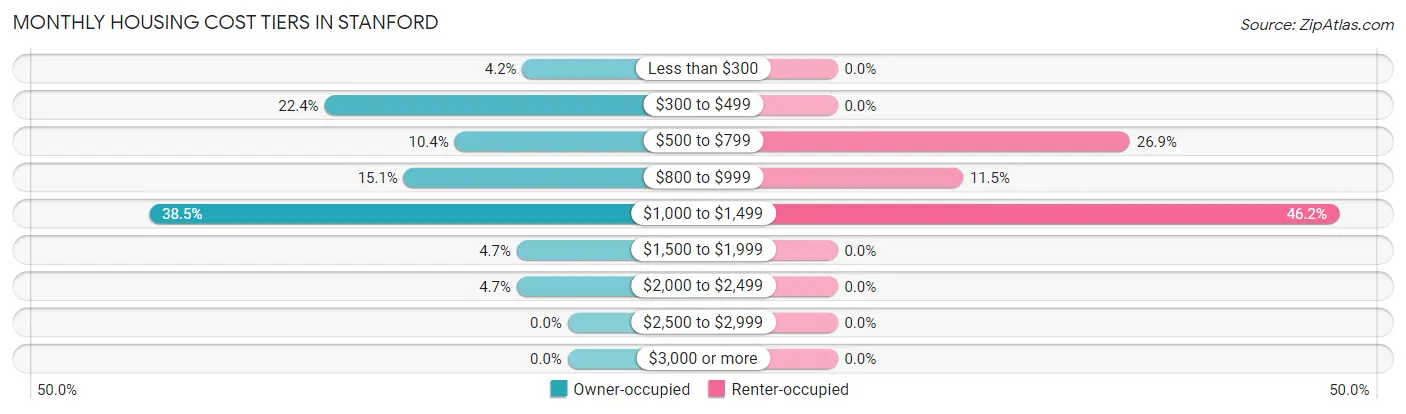
| Monthly Cost | Owner-occupied | Renter-occupied |
| Less than $300 | 8 (4.2%) | 0 (0.0%) |
| $300 to $499 | 43 (22.4%) | 0 (0.0%) |
| $500 to $799 | 20 (10.4%) | 7 (26.9%) |
| $800 to $999 | 29 (15.1%) | 3 (11.5%) |
| $1,000 to $1,499 | 74 (38.5%) | 12 (46.2%) |
| $1,500 to $1,999 | 9 (4.7%) | 0 (0.0%) |
| $2,000 to $2,499 | 9 (4.7%) | 0 (0.0%) |
| $2,500 to $2,999 | 0 (0.0%) | 0 (0.0%) |
| $3,000 or more | 0 (0.0%) | 0 (0.0%) |
| Total | 192 (100.0%) | 26 (100.0%) |
Physical Housing Characteristics in Stanford
Housing Structures in Stanford
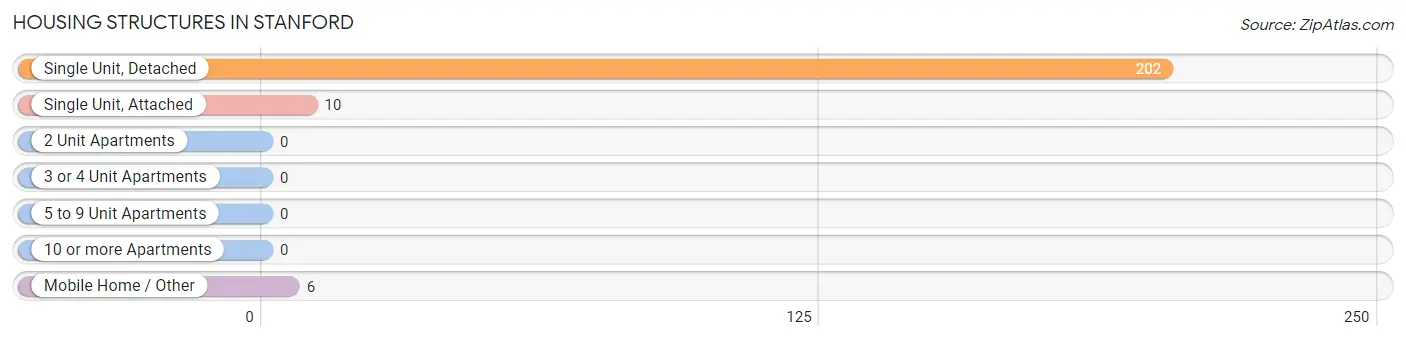
| Structure Type | # Housing Units | % Housing Units |
| Single Unit, Detached | 202 | 92.7% |
| Single Unit, Attached | 10 | 4.6% |
| 2 Unit Apartments | 0 | 0.0% |
| 3 or 4 Unit Apartments | 0 | 0.0% |
| 5 to 9 Unit Apartments | 0 | 0.0% |
| 10 or more Apartments | 0 | 0.0% |
| Mobile Home / Other | 6 | 2.8% |
| Total | 218 | 100.0% |
Housing Structures by Occupancy in Stanford
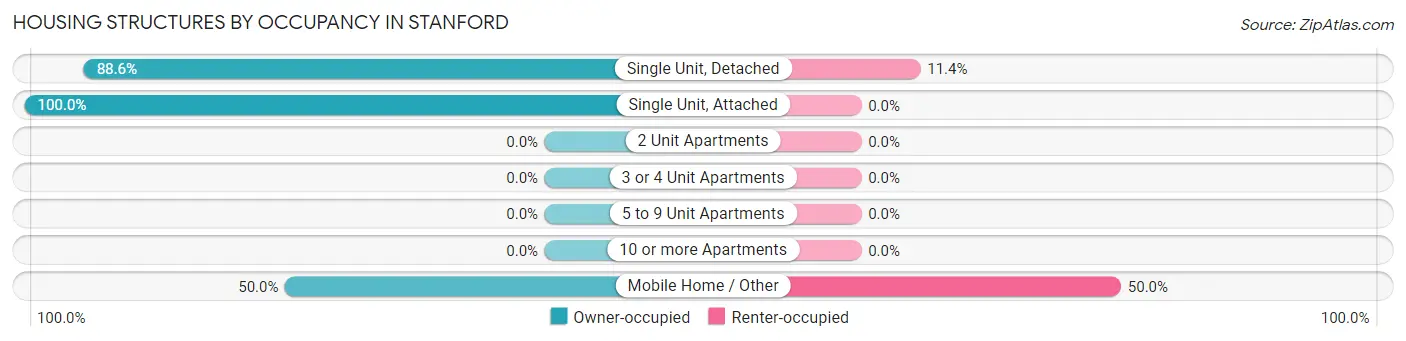
| Structure Type | Owner-occupied | Renter-occupied |
| Single Unit, Detached | 179 (88.6%) | 23 (11.4%) |
| Single Unit, Attached | 10 (100.0%) | 0 (0.0%) |
| 2 Unit Apartments | 0 (0.0%) | 0 (0.0%) |
| 3 or 4 Unit Apartments | 0 (0.0%) | 0 (0.0%) |
| 5 to 9 Unit Apartments | 0 (0.0%) | 0 (0.0%) |
| 10 or more Apartments | 0 (0.0%) | 0 (0.0%) |
| Mobile Home / Other | 3 (50.0%) | 3 (50.0%) |
| Total | 192 (88.1%) | 26 (11.9%) |
Housing Structures by Number of Rooms in Stanford
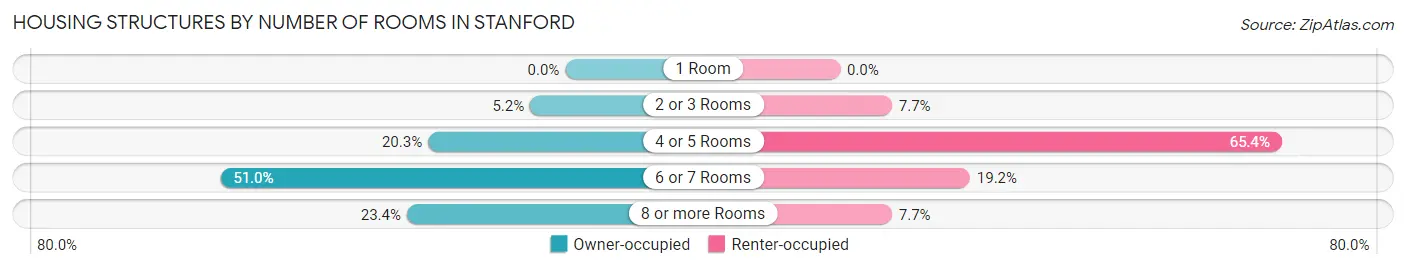
| Number of Rooms | Owner-occupied | Renter-occupied |
| 1 Room | 0 (0.0%) | 0 (0.0%) |
| 2 or 3 Rooms | 10 (5.2%) | 2 (7.7%) |
| 4 or 5 Rooms | 39 (20.3%) | 17 (65.4%) |
| 6 or 7 Rooms | 98 (51.0%) | 5 (19.2%) |
| 8 or more Rooms | 45 (23.4%) | 2 (7.7%) |
| Total | 192 (100.0%) | 26 (100.0%) |
Housing Structure by Heating Type in Stanford
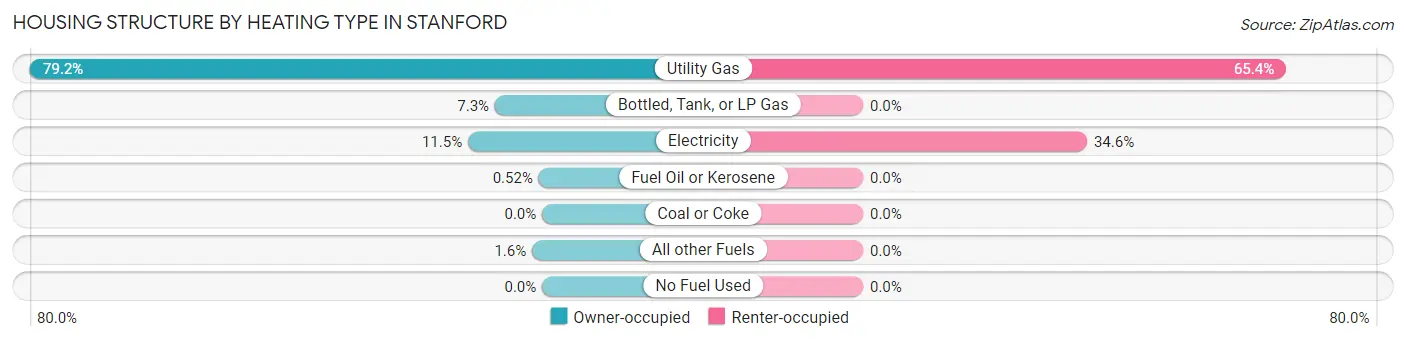
| Heating Type | Owner-occupied | Renter-occupied |
| Utility Gas | 152 (79.2%) | 17 (65.4%) |
| Bottled, Tank, or LP Gas | 14 (7.3%) | 0 (0.0%) |
| Electricity | 22 (11.5%) | 9 (34.6%) |
| Fuel Oil or Kerosene | 1 (0.5%) | 0 (0.0%) |
| Coal or Coke | 0 (0.0%) | 0 (0.0%) |
| All other Fuels | 3 (1.6%) | 0 (0.0%) |
| No Fuel Used | 0 (0.0%) | 0 (0.0%) |
| Total | 192 (100.0%) | 26 (100.0%) |
Household Vehicle Usage in Stanford
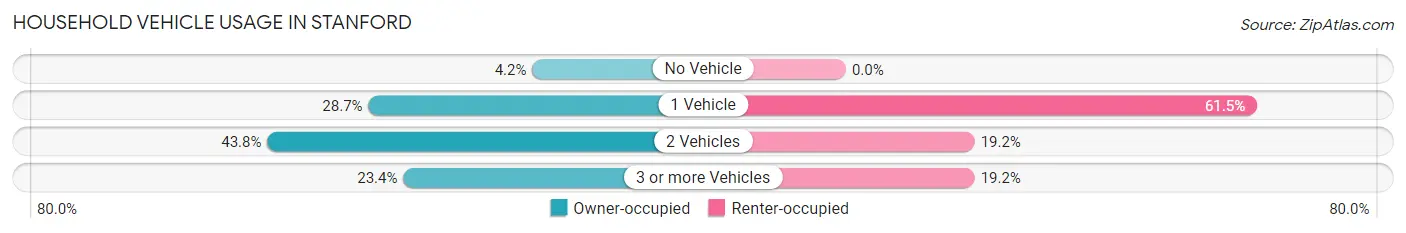
| Vehicles per Household | Owner-occupied | Renter-occupied |
| No Vehicle | 8 (4.2%) | 0 (0.0%) |
| 1 Vehicle | 55 (28.6%) | 16 (61.5%) |
| 2 Vehicles | 84 (43.8%) | 5 (19.2%) |
| 3 or more Vehicles | 45 (23.4%) | 5 (19.2%) |
| Total | 192 (100.0%) | 26 (100.0%) |
Real Estate & Mortgages in Stanford
Real Estate and Mortgage Overview in Stanford
| Characteristic | Without Mortgage | With Mortgage |
| Housing Units | 71 | 121 |
| Median Property Value | $89,500 | $113,700 |
| Median Household Income | $59,625 | $7 |
| Monthly Housing Costs | $454 | $0 |
| Real Estate Taxes | $1,813 | $0 |
Property Value by Mortgage Status in Stanford
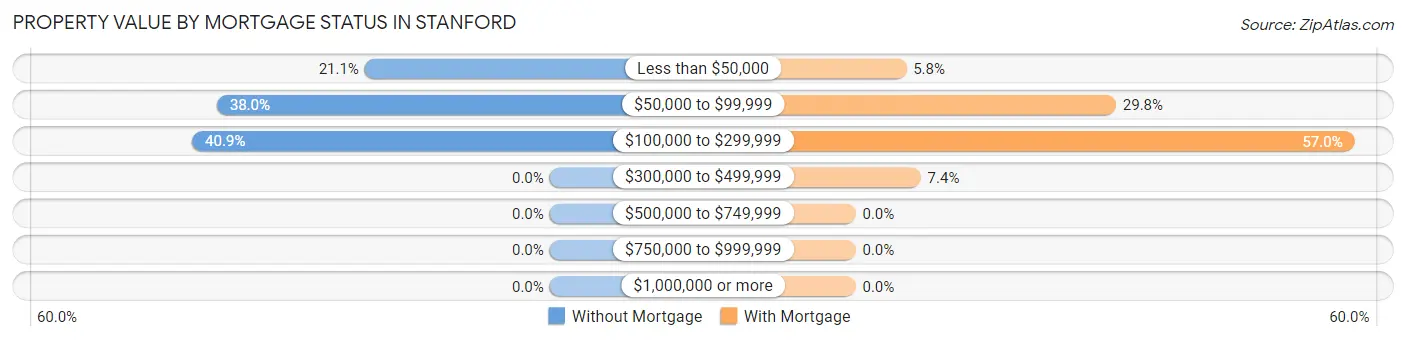
| Property Value | Without Mortgage | With Mortgage |
| Less than $50,000 | 15 (21.1%) | 7 (5.8%) |
| $50,000 to $99,999 | 27 (38.0%) | 36 (29.7%) |
| $100,000 to $299,999 | 29 (40.8%) | 69 (57.0%) |
| $300,000 to $499,999 | 0 (0.0%) | 9 (7.4%) |
| $500,000 to $749,999 | 0 (0.0%) | 0 (0.0%) |
| $750,000 to $999,999 | 0 (0.0%) | 0 (0.0%) |
| $1,000,000 or more | 0 (0.0%) | 0 (0.0%) |
| Total | 71 (100.0%) | 121 (100.0%) |
Household Income by Mortgage Status in Stanford
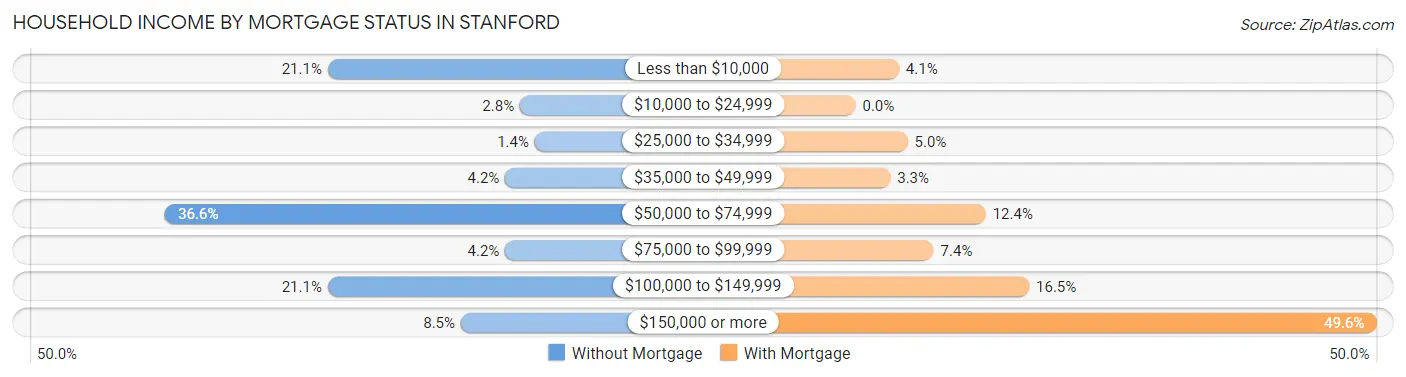
| Household Income | Without Mortgage | With Mortgage |
| Less than $10,000 | 15 (21.1%) | 5 (4.1%) |
| $10,000 to $24,999 | 2 (2.8%) | 0 (0.0%) |
| $25,000 to $34,999 | 1 (1.4%) | 6 (5.0%) |
| $35,000 to $49,999 | 3 (4.2%) | 4 (3.3%) |
| $50,000 to $74,999 | 26 (36.6%) | 15 (12.4%) |
| $75,000 to $99,999 | 3 (4.2%) | 9 (7.4%) |
| $100,000 to $149,999 | 15 (21.1%) | 20 (16.5%) |
| $150,000 or more | 6 (8.5%) | 60 (49.6%) |
| Total | 71 (100.0%) | 121 (100.0%) |
Property Value to Household Income Ratio in Stanford
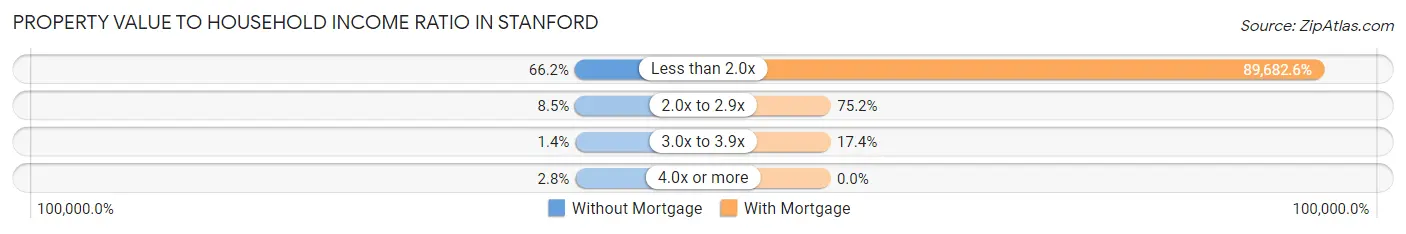
| Value-to-Income Ratio | Without Mortgage | With Mortgage |
| Less than 2.0x | 47 (66.2%) | 108,516 (89,682.6%) |
| 2.0x to 2.9x | 6 (8.5%) | 91 (75.2%) |
| 3.0x to 3.9x | 1 (1.4%) | 21 (17.4%) |
| 4.0x or more | 2 (2.8%) | 0 (0.0%) |
| Total | 71 (100.0%) | 121 (100.0%) |
Real Estate Taxes by Mortgage Status in Stanford
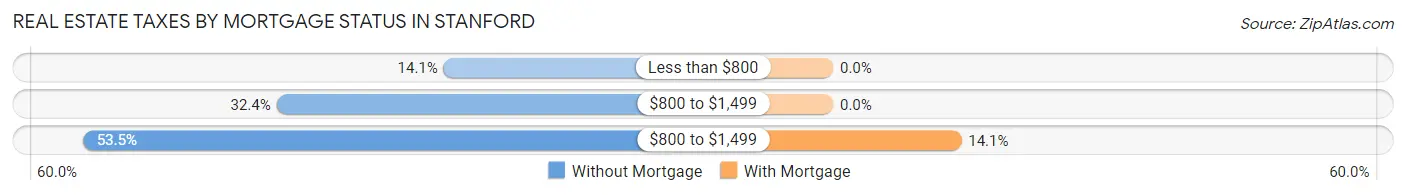
| Property Taxes | Without Mortgage | With Mortgage |
| Less than $800 | 10 (14.1%) | 0 (0.0%) |
| $800 to $1,499 | 23 (32.4%) | 0 (0.0%) |
| $800 to $1,499 | 38 (53.5%) | 17 (14.1%) |
| Total | 71 (100.0%) | 121 (100.0%) |
Health & Disability in Stanford
Health Insurance Coverage by Age in Stanford
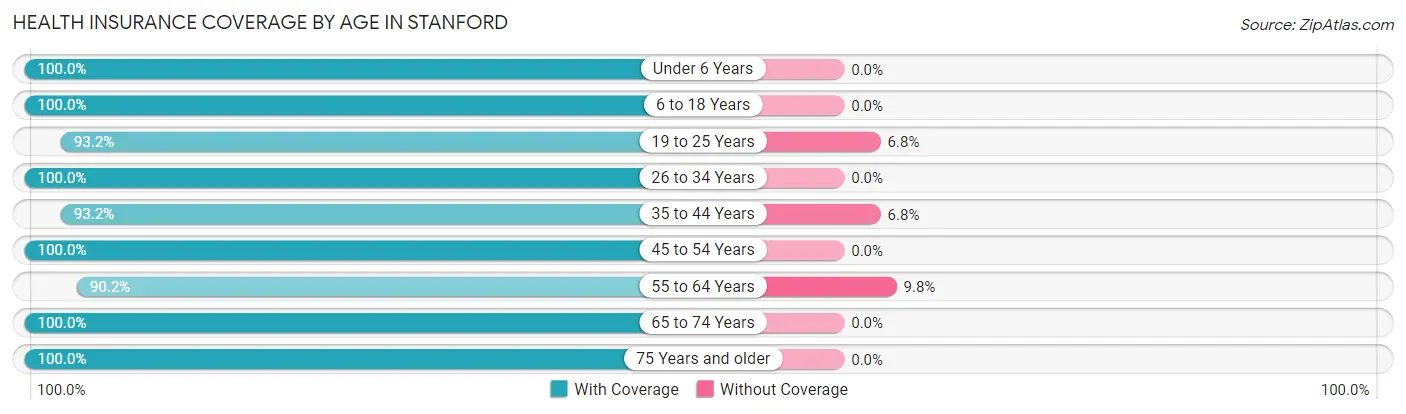
| Age Bracket | With Coverage | Without Coverage |
| Under 6 Years | 37 (100.0%) | 0 (0.0%) |
| 6 to 18 Years | 93 (100.0%) | 0 (0.0%) |
| 19 to 25 Years | 55 (93.2%) | 4 (6.8%) |
| 26 to 34 Years | 97 (100.0%) | 0 (0.0%) |
| 35 to 44 Years | 55 (93.2%) | 4 (6.8%) |
| 45 to 54 Years | 59 (100.0%) | 0 (0.0%) |
| 55 to 64 Years | 74 (90.2%) | 8 (9.8%) |
| 65 to 74 Years | 25 (100.0%) | 0 (0.0%) |
| 75 Years and older | 20 (100.0%) | 0 (0.0%) |
| Total | 515 (97.0%) | 16 (3.0%) |
Health Insurance Coverage by Citizenship Status in Stanford
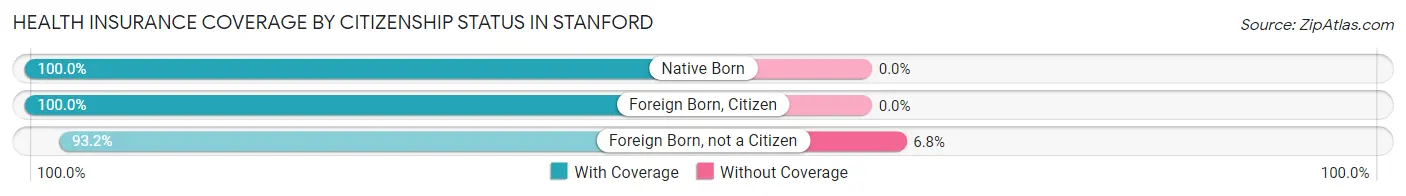
| Citizenship Status | With Coverage | Without Coverage |
| Native Born | 37 (100.0%) | 0 (0.0%) |
| Foreign Born, Citizen | 93 (100.0%) | 0 (0.0%) |
| Foreign Born, not a Citizen | 55 (93.2%) | 4 (6.8%) |
Health Insurance Coverage by Household Income in Stanford
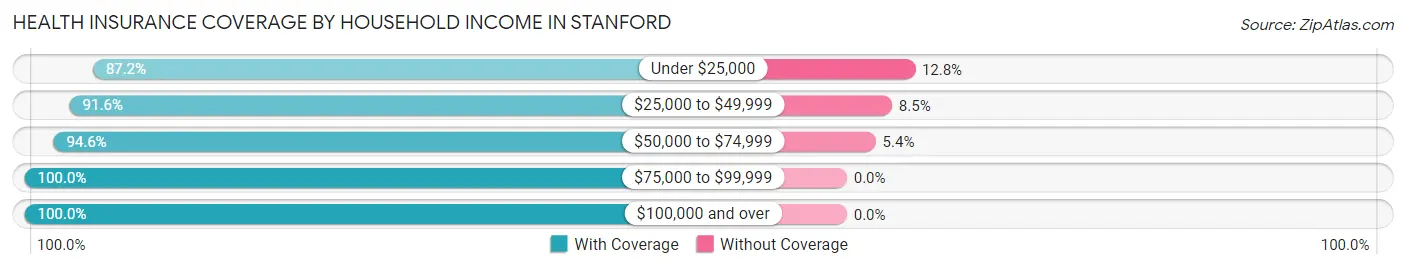
| Household Income | With Coverage | Without Coverage |
| Under $25,000 | 41 (87.2%) | 6 (12.8%) |
| $25,000 to $49,999 | 65 (91.5%) | 6 (8.5%) |
| $50,000 to $74,999 | 70 (94.6%) | 4 (5.4%) |
| $75,000 to $99,999 | 84 (100.0%) | 0 (0.0%) |
| $100,000 and over | 255 (100.0%) | 0 (0.0%) |
Public vs Private Health Insurance Coverage by Age in Stanford
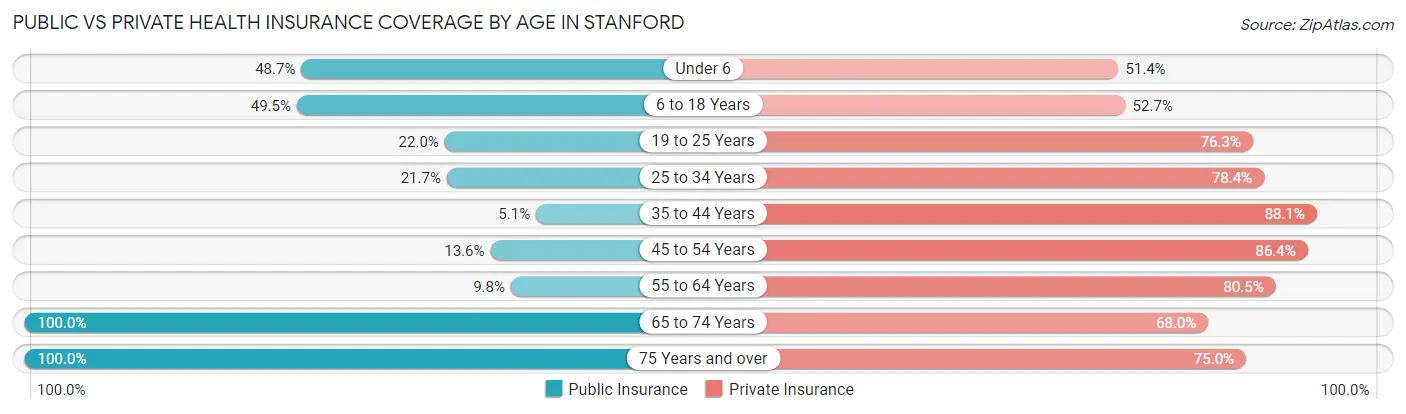
| Age Bracket | Public Insurance | Private Insurance |
| Under 6 | 18 (48.6%) | 19 (51.3%) |
| 6 to 18 Years | 46 (49.5%) | 49 (52.7%) |
| 19 to 25 Years | 13 (22.0%) | 45 (76.3%) |
| 25 to 34 Years | 21 (21.6%) | 76 (78.3%) |
| 35 to 44 Years | 3 (5.1%) | 52 (88.1%) |
| 45 to 54 Years | 8 (13.6%) | 51 (86.4%) |
| 55 to 64 Years | 8 (9.8%) | 66 (80.5%) |
| 65 to 74 Years | 25 (100.0%) | 17 (68.0%) |
| 75 Years and over | 20 (100.0%) | 15 (75.0%) |
| Total | 162 (30.5%) | 390 (73.5%) |
Disability Status by Sex by Age in Stanford
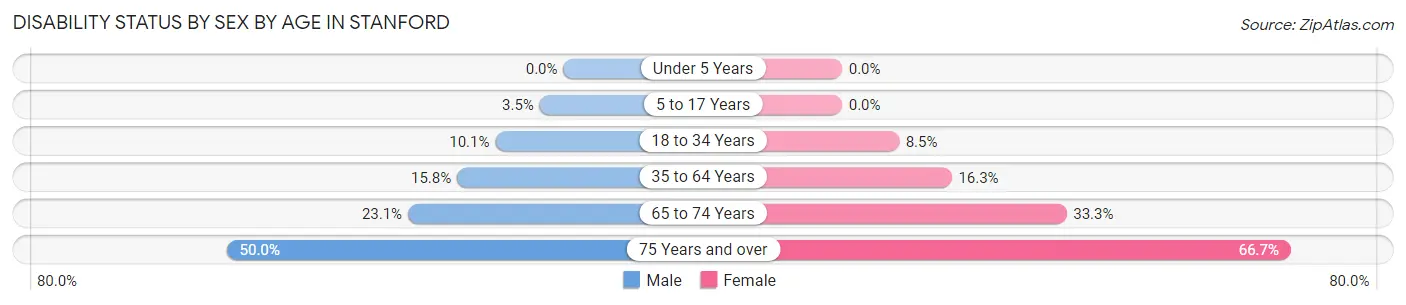
| Age Bracket | Male | Female |
| Under 5 Years | 0 (0.0%) | 0 (0.0%) |
| 5 to 17 Years | 2 (3.5%) | 0 (0.0%) |
| 18 to 34 Years | 9 (10.1%) | 6 (8.5%) |
| 35 to 64 Years | 18 (15.8%) | 14 (16.3%) |
| 65 to 74 Years | 3 (23.1%) | 4 (33.3%) |
| 75 Years and over | 4 (50.0%) | 8 (66.7%) |
Disability Class by Sex by Age in Stanford
Disability Class: Hearing Difficulty
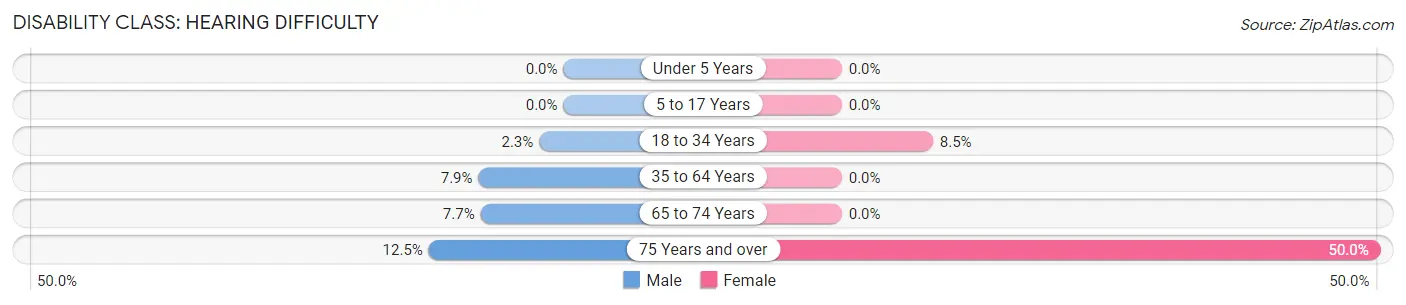
| Age Bracket | Male | Female |
| Under 5 Years | 0 (0.0%) | 0 (0.0%) |
| 5 to 17 Years | 0 (0.0%) | 0 (0.0%) |
| 18 to 34 Years | 2 (2.2%) | 6 (8.5%) |
| 35 to 64 Years | 9 (7.9%) | 0 (0.0%) |
| 65 to 74 Years | 1 (7.7%) | 0 (0.0%) |
| 75 Years and over | 1 (12.5%) | 6 (50.0%) |
Disability Class: Vision Difficulty
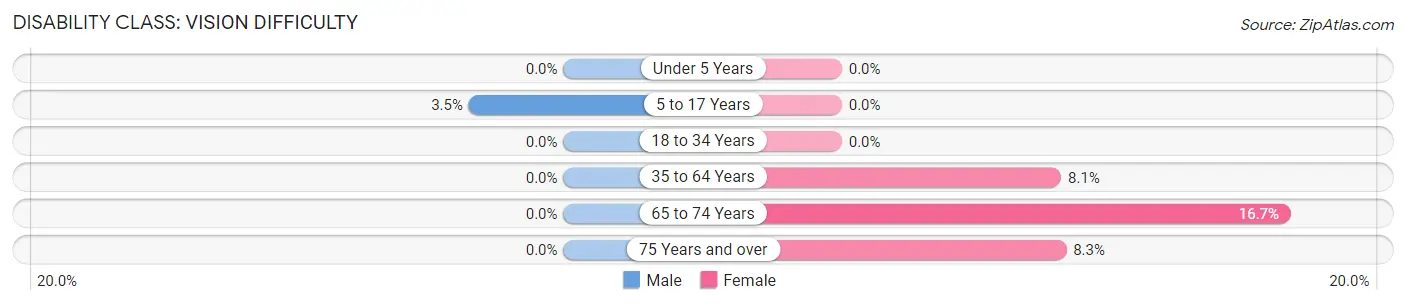
| Age Bracket | Male | Female |
| Under 5 Years | 0 (0.0%) | 0 (0.0%) |
| 5 to 17 Years | 2 (3.5%) | 0 (0.0%) |
| 18 to 34 Years | 0 (0.0%) | 0 (0.0%) |
| 35 to 64 Years | 0 (0.0%) | 7 (8.1%) |
| 65 to 74 Years | 0 (0.0%) | 2 (16.7%) |
| 75 Years and over | 0 (0.0%) | 1 (8.3%) |
Disability Class: Cognitive Difficulty
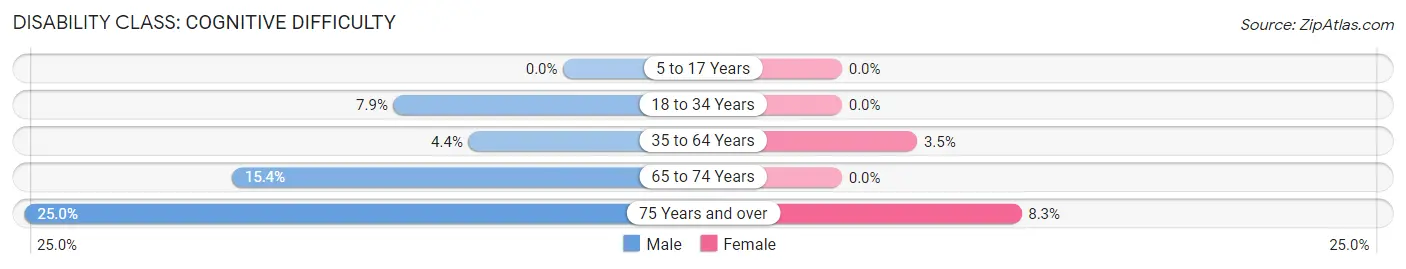
| Age Bracket | Male | Female |
| 5 to 17 Years | 0 (0.0%) | 0 (0.0%) |
| 18 to 34 Years | 7 (7.9%) | 0 (0.0%) |
| 35 to 64 Years | 5 (4.4%) | 3 (3.5%) |
| 65 to 74 Years | 2 (15.4%) | 0 (0.0%) |
| 75 Years and over | 2 (25.0%) | 1 (8.3%) |
Disability Class: Ambulatory Difficulty
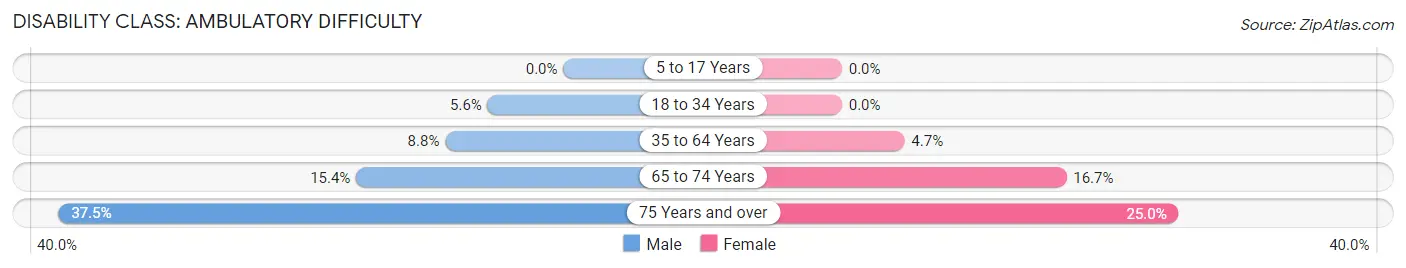
| Age Bracket | Male | Female |
| 5 to 17 Years | 0 (0.0%) | 0 (0.0%) |
| 18 to 34 Years | 5 (5.6%) | 0 (0.0%) |
| 35 to 64 Years | 10 (8.8%) | 4 (4.6%) |
| 65 to 74 Years | 2 (15.4%) | 2 (16.7%) |
| 75 Years and over | 3 (37.5%) | 3 (25.0%) |
Disability Class: Self-Care Difficulty
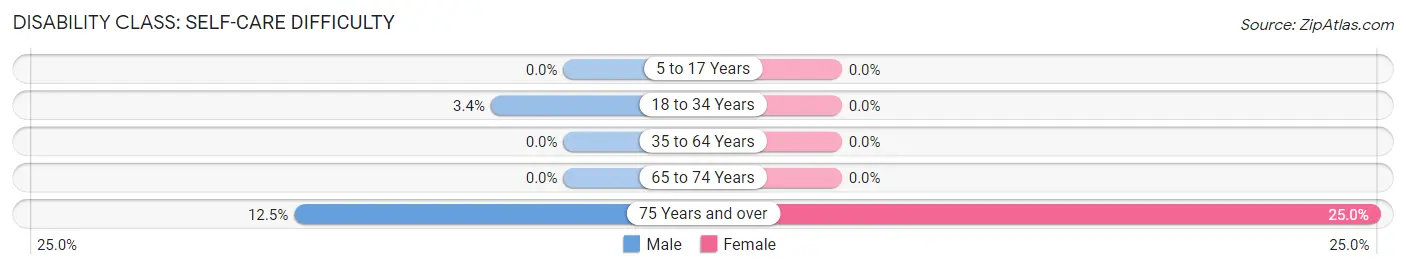
| Age Bracket | Male | Female |
| 5 to 17 Years | 0 (0.0%) | 0 (0.0%) |
| 18 to 34 Years | 3 (3.4%) | 0 (0.0%) |
| 35 to 64 Years | 0 (0.0%) | 0 (0.0%) |
| 65 to 74 Years | 0 (0.0%) | 0 (0.0%) |
| 75 Years and over | 1 (12.5%) | 3 (25.0%) |
Technology Access in Stanford
Computing Device Access in Stanford
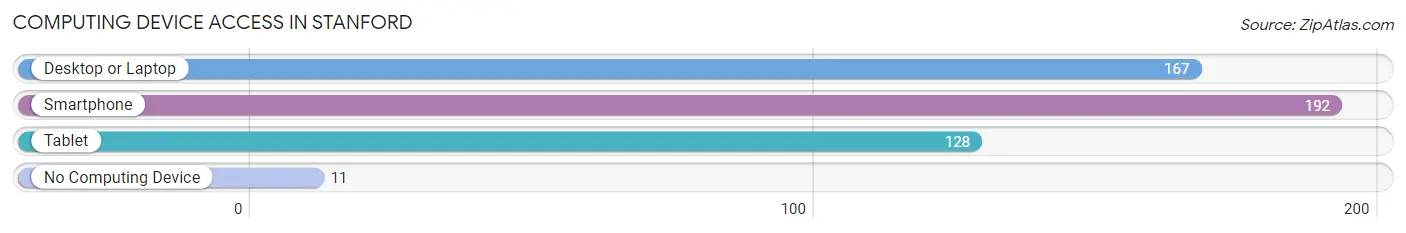
| Device Type | # Households | % Households |
| Desktop or Laptop | 167 | 76.6% |
| Smartphone | 192 | 88.1% |
| Tablet | 128 | 58.7% |
| No Computing Device | 11 | 5.1% |
| Total | 218 | 100.0% |
Internet Access in Stanford
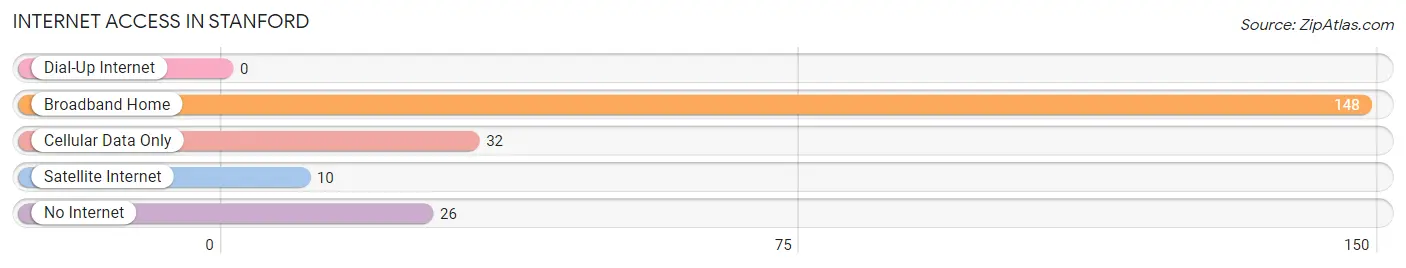
| Internet Type | # Households | % Households |
| Dial-Up Internet | 0 | 0.0% |
| Broadband Home | 148 | 67.9% |
| Cellular Data Only | 32 | 14.7% |
| Satellite Internet | 10 | 4.6% |
| No Internet | 26 | 11.9% |
| Total | 218 | 100.0% |
Stanford Summary
Stanford, Illinois is a small village located in McLean County, Illinois. It is situated in the central part of the state, about 25 miles northeast of Bloomington-Normal. The village has a population of 1,845 people, according to the 2010 census.
History
The area that is now Stanford was first settled in 1829 by a group of settlers from Kentucky. The village was originally known as “Hickory Point”, but was later renamed Stanford in 1854 after the Stanford family, who were among the first settlers. The village was officially incorporated in 1858.
In the late 19th century, Stanford was a thriving agricultural community. The village was home to several grain elevators, a flour mill, a creamery, and a canning factory. The village also had a railroad station, which connected it to the rest of the state.
Geography
Stanford is located in the central part of Illinois, about 25 miles northeast of Bloomington-Normal. The village is situated in the northern part of McLean County, on the banks of the Mackinaw River. The village is surrounded by rolling hills and farmland.
The climate in Stanford is typical of the Midwest, with hot summers and cold winters. The average temperature in the summer is around 75 degrees Fahrenheit, while the average temperature in the winter is around 25 degrees Fahrenheit.
Economy
The economy of Stanford is largely based on agriculture. The village is home to several grain elevators, a flour mill, a creamery, and a canning factory. The village also has a few small businesses, including a grocery store, a hardware store, and a few restaurants.
The village is also home to a few manufacturing companies, including a plastics factory and a metal fabrication plant. The village is also home to a few small technology companies, including a software development firm and a web design company.
Demographics
According to the 2010 census, Stanford has a population of 1,845 people. The village is predominantly white, with about 95% of the population being white. The remaining 5% of the population is made up of African Americans, Hispanics, and Asians.
The median household income in Stanford is $50,000, which is slightly lower than the national average. The village has a poverty rate of about 10%, which is slightly higher than the national average.
The village is home to a few churches, including a Methodist church, a Baptist church, and a Catholic church. The village also has a public library and a few parks.
Stanford is a small village with a rich history and a strong agricultural economy. The village is home to a diverse population and a few small businesses. The village is a great place to live and work, and is a great place to raise a family.
Common Questions
What is Per Capita Income in Stanford?
Per Capita income in Stanford is $34,842.
What is the Median Family Income in Stanford?
Median Family Income in Stanford is $81,354.
What is the Median Household income in Stanford?
Median Household Income in Stanford is $80,417.
What is Income or Wage Gap in Stanford?
Income or Wage Gap in Stanford is 36.3%.
Women in Stanford earn 63.7 cents for every dollar earned by a man.
What is Family Income Deficit in Stanford?
Family Income Deficit in Stanford is $10,629.
Families that are below poverty line in Stanford earn $10,629 less on average than the poverty threshold level.
What is Inequality or Gini Index in Stanford?
Inequality or Gini Index in Stanford is 0.34.
What is the Total Population of Stanford?
Total Population of Stanford is 531.
What is the Total Male Population of Stanford?
Total Male Population of Stanford is 311.
What is the Total Female Population of Stanford?
Total Female Population of Stanford is 220.
What is the Ratio of Males per 100 Females in Stanford?
There are 141.36 Males per 100 Females in Stanford.
What is the Ratio of Females per 100 Males in Stanford?
There are 70.74 Females per 100 Males in Stanford.
What is the Median Population Age in Stanford?
Median Population Age in Stanford is 30.9 Years.
What is the Average Family Size in Stanford
Average Family Size in Stanford is 3.1 People.
What is the Average Household Size in Stanford
Average Household Size in Stanford is 2.4 People.
How Large is the Labor Force in Stanford?
There are 303 People in the Labor Forcein in Stanford.
What is the Percentage of People in the Labor Force in Stanford?
73.2% of People are in the Labor Force in Stanford.
What is the Unemployment Rate in Stanford?
Unemployment Rate in Stanford is 7.3%.