Saybrook, IL Map & Demographics
Saybrook Map
Saybrook Overview
$23,484
PER CAPITA INCOME
$59,318
AVG FAMILY INCOME
$50,625
AVG HOUSEHOLD INCOME
7.1%
WAGE / INCOME GAP [ % ]
92.9¢/ $1
WAGE / INCOME GAP [ $ ]
0.42
INEQUALITY / GINI INDEX
734
TOTAL POPULATION
359
MALE POPULATION
375
FEMALE POPULATION
95.73
MALES / 100 FEMALES
104.46
FEMALES / 100 MALES
37.9
MEDIAN AGE
3.2
AVG FAMILY SIZE
2.6
AVG HOUSEHOLD SIZE
287
LABOR FORCE [ PEOPLE ]
52.1%
PERCENT IN LABOR FORCE
3.1%
UNEMPLOYMENT RATE
Saybrook Zip Codes
Saybrook Area Codes
Income in Saybrook
Income Overview in Saybrook
Per Capita Income in Saybrook is $23,484, while median incomes of families and households are $59,318 and $50,625 respectively.
| Characteristic | Number | Measure |
| Per Capita Income | 734 | $23,484 |
| Median Family Income | 188 | $59,318 |
| Mean Family Income | 188 | $71,691 |
| Median Household Income | 281 | $50,625 |
| Mean Household Income | 281 | $61,105 |
| Income Deficit | 188 | $0 |
| Wage / Income Gap (%) | 734 | 7.09% |
| Wage / Income Gap ($) | 734 | 92.91¢ per $1 |
| Gini / Inequality Index | 734 | 0.42 |
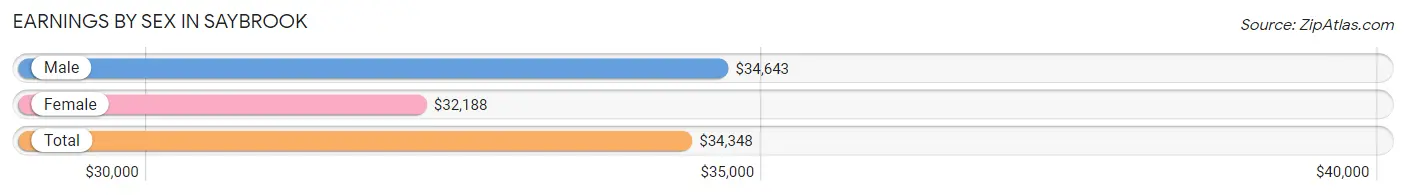
Earnings by Sex in Saybrook
Average Earnings in Saybrook are $34,348, $34,643 for men and $32,188 for women, a difference of 7.1%.
| Sex | Number | Average Earnings |
| Male | 152 (50.7%) | $34,643 |
| Female | 148 (49.3%) | $32,188 |
| Total | 300 (100.0%) | $34,348 |
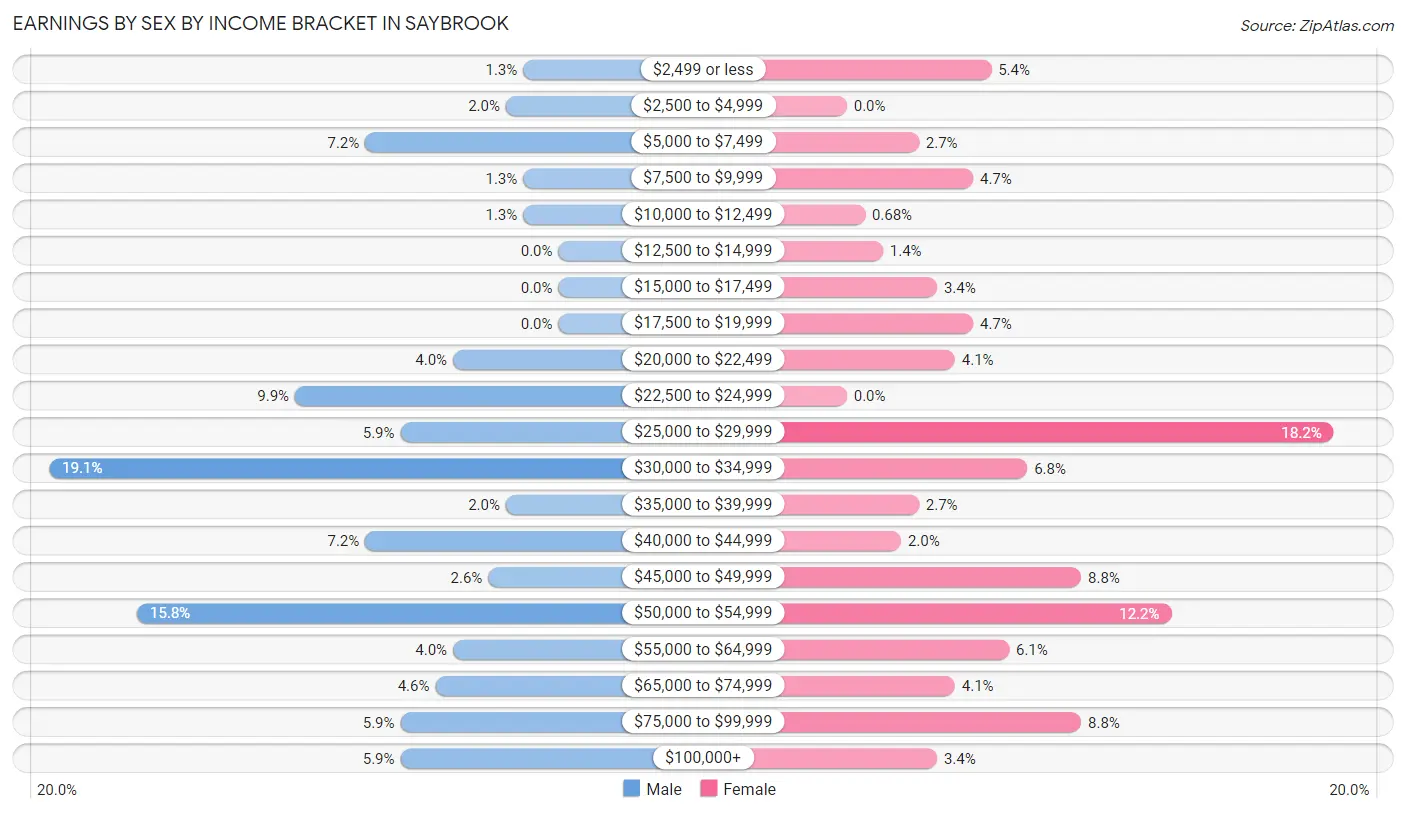
Earnings by Sex by Income Bracket in Saybrook
The most common earnings brackets in Saybrook are $30,000 to $34,999 for men (29 | 19.1%) and $25,000 to $29,999 for women (27 | 18.2%).
| Income | Male | Female |
| $2,499 or less | 2 (1.3%) | 8 (5.4%) |
| $2,500 to $4,999 | 3 (2.0%) | 0 (0.0%) |
| $5,000 to $7,499 | 11 (7.2%) | 4 (2.7%) |
| $7,500 to $9,999 | 2 (1.3%) | 7 (4.7%) |
| $10,000 to $12,499 | 2 (1.3%) | 1 (0.7%) |
| $12,500 to $14,999 | 0 (0.0%) | 2 (1.3%) |
| $15,000 to $17,499 | 0 (0.0%) | 5 (3.4%) |
| $17,500 to $19,999 | 0 (0.0%) | 7 (4.7%) |
| $20,000 to $22,499 | 6 (4.0%) | 6 (4.1%) |
| $22,500 to $24,999 | 15 (9.9%) | 0 (0.0%) |
| $25,000 to $29,999 | 9 (5.9%) | 27 (18.2%) |
| $30,000 to $34,999 | 29 (19.1%) | 10 (6.8%) |
| $35,000 to $39,999 | 3 (2.0%) | 4 (2.7%) |
| $40,000 to $44,999 | 11 (7.2%) | 3 (2.0%) |
| $45,000 to $49,999 | 4 (2.6%) | 13 (8.8%) |
| $50,000 to $54,999 | 24 (15.8%) | 18 (12.2%) |
| $55,000 to $64,999 | 6 (4.0%) | 9 (6.1%) |
| $65,000 to $74,999 | 7 (4.6%) | 6 (4.1%) |
| $75,000 to $99,999 | 9 (5.9%) | 13 (8.8%) |
| $100,000+ | 9 (5.9%) | 5 (3.4%) |
| Total | 152 (100.0%) | 148 (100.0%) |
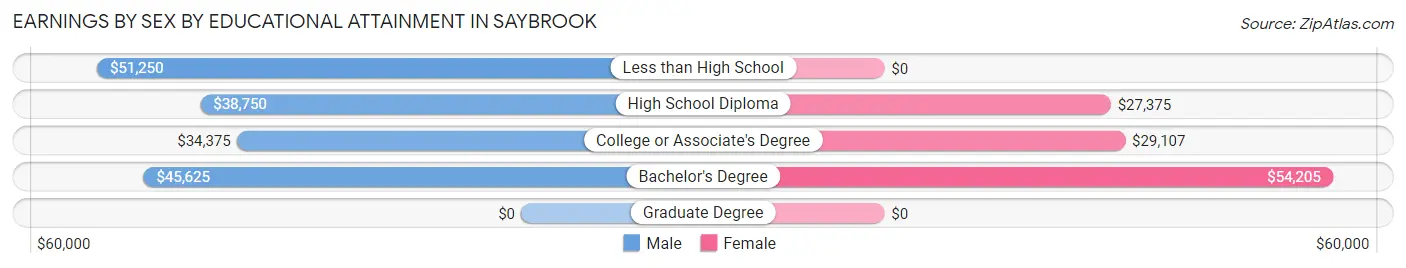
Earnings by Sex by Educational Attainment in Saybrook
Average earnings in Saybrook are $41,071 for men and $47,625 for women, a difference of 13.8%. Men with an educational attainment of less than high school enjoy the highest average annual earnings of $51,250, while those with college or associate's degree education earn the least with $34,375. Women with an educational attainment of bachelor's degree earn the most with the average annual earnings of $54,205, while those with high school diploma education have the smallest earnings of $27,375.
| Educational Attainment | Male Income | Female Income |
| Less than High School | $51,250 | $0 |
| High School Diploma | $38,750 | $27,375 |
| College or Associate's Degree | $34,375 | $29,107 |
| Bachelor's Degree | $45,625 | $54,205 |
| Graduate Degree | - | - |
| Total | $41,071 | $47,625 |
Family Income in Saybrook
Family Income Brackets in Saybrook
According to the Saybrook family income data, there are 59 families falling into the $50,000 to $74,999 income range, which is the most common income bracket and makes up 31.4% of all families. Conversely, the $200,000+ income bracket is the least frequent group with only 1 families (0.5%) belonging to this category.
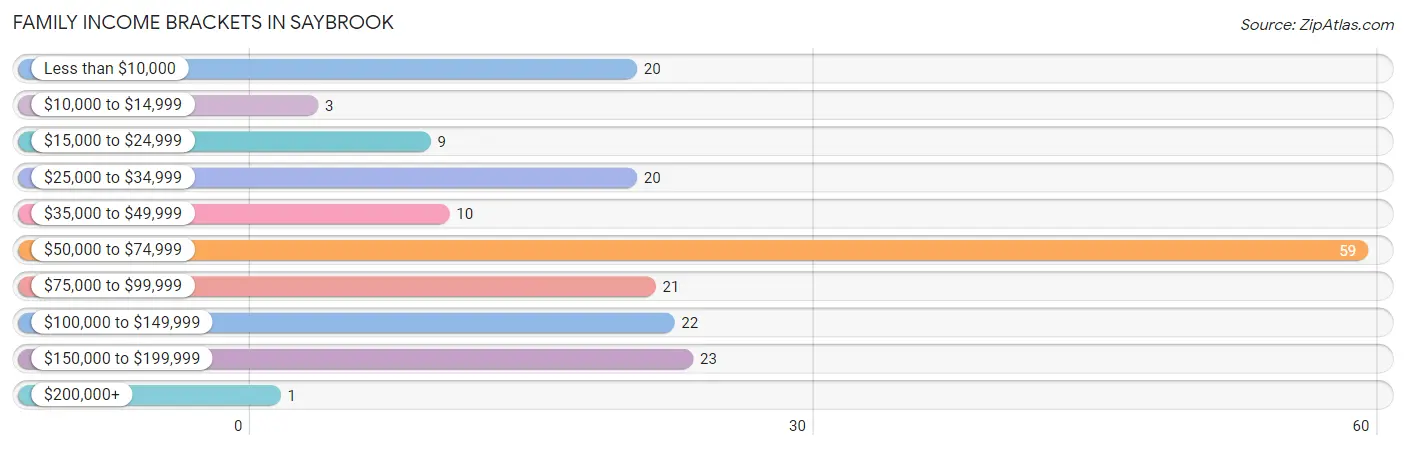
| Income Bracket | # Families | % Families |
| Less than $10,000 | 20 | 10.6% |
| $10,000 to $14,999 | 3 | 1.6% |
| $15,000 to $24,999 | 9 | 4.8% |
| $25,000 to $34,999 | 20 | 10.6% |
| $35,000 to $49,999 | 10 | 5.3% |
| $50,000 to $74,999 | 59 | 31.4% |
| $75,000 to $99,999 | 21 | 11.2% |
| $100,000 to $149,999 | 22 | 11.7% |
| $150,000 to $199,999 | 23 | 12.2% |
| $200,000+ | 1 | 0.5% |
Family Income by Famaliy Size in Saybrook
3-person families (44 | 23.4%) account for the highest median family income in Saybrook with $58,864 per family, while 2-person families (84 | 44.7%) have the highest median income of $29,375 per family member.
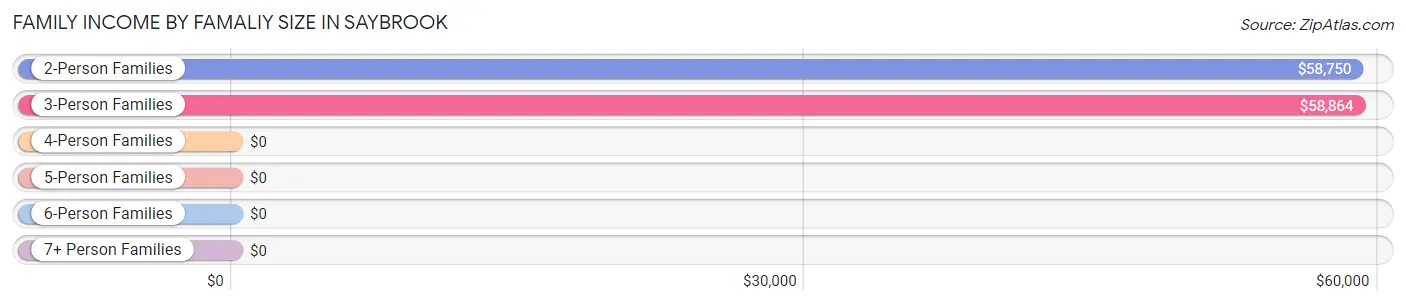
| Income Bracket | # Families | Median Income |
| 2-Person Families | 84 (44.7%) | $58,750 |
| 3-Person Families | 44 (23.4%) | $58,864 |
| 4-Person Families | 17 (9.0%) | $0 |
| 5-Person Families | 25 (13.3%) | $0 |
| 6-Person Families | 11 (5.9%) | $0 |
| 7+ Person Families | 7 (3.7%) | $0 |
| Total | 188 (100.0%) | $59,318 |
Family Income by Number of Earners in Saybrook
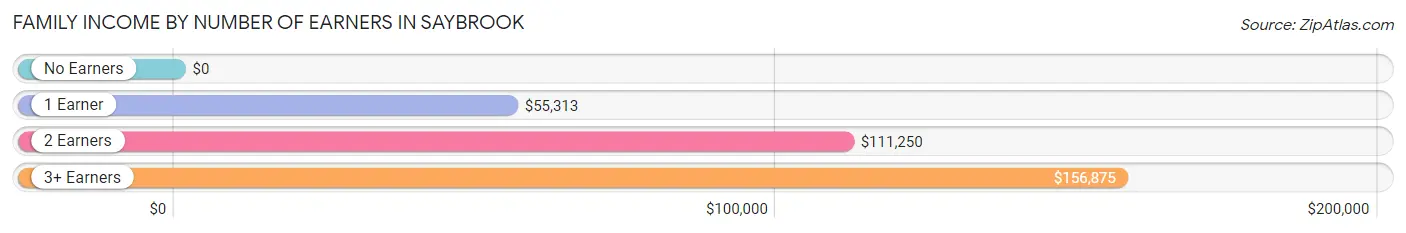
| Number of Earners | # Families | Median Income |
| No Earners | 34 (18.1%) | $0 |
| 1 Earner | 93 (49.5%) | $55,313 |
| 2 Earners | 50 (26.6%) | $111,250 |
| 3+ Earners | 11 (5.9%) | $156,875 |
| Total | 188 (100.0%) | $59,318 |
Household Income in Saybrook
Household Income Brackets in Saybrook
With 68 households falling in the category, the $50,000 to $74,999 income range is the most frequent in Saybrook, accounting for 24.2% of all households. In contrast, only 1 households (0.4%) fall into the $200,000+ income bracket, making it the least populous group.
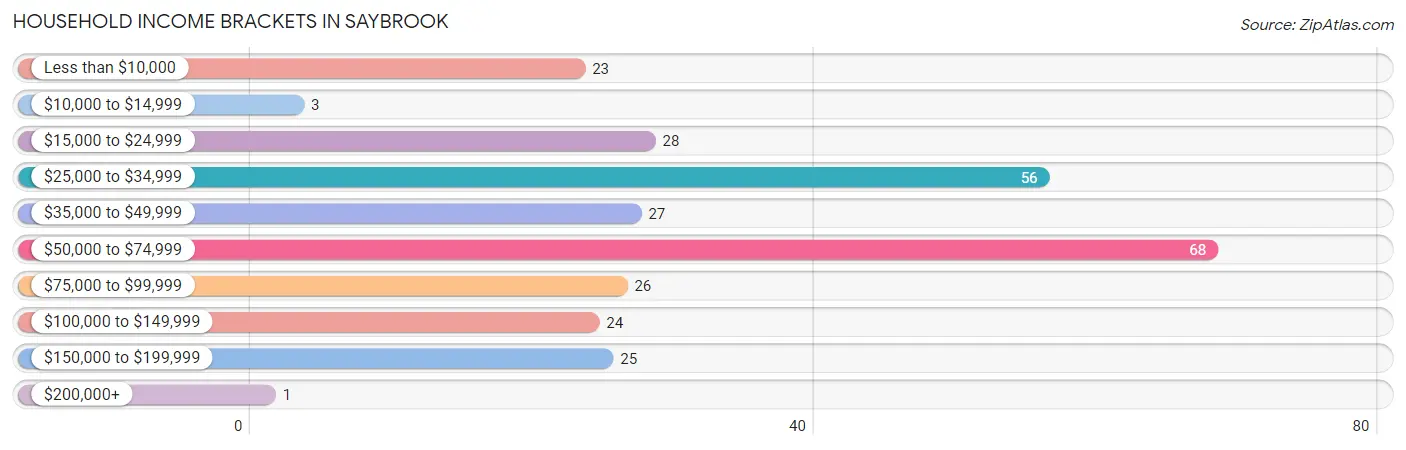
| Income Bracket | # Households | % Households |
| Less than $10,000 | 23 | 8.2% |
| $10,000 to $14,999 | 3 | 1.1% |
| $15,000 to $24,999 | 28 | 10.0% |
| $25,000 to $34,999 | 56 | 19.9% |
| $35,000 to $49,999 | 27 | 9.6% |
| $50,000 to $74,999 | 68 | 24.2% |
| $75,000 to $99,999 | 26 | 9.3% |
| $100,000 to $149,999 | 24 | 8.5% |
| $150,000 to $199,999 | 25 | 8.9% |
| $200,000+ | 1 | 0.4% |
Household Income by Householder Age in Saybrook
The median household income in Saybrook is $50,625, with the highest median household income of $67,917 found in the 25 to 44 years age bracket for the primary householder. A total of 72 households (25.6%) fall into this category. Meanwhile, the 15 to 24 years age bracket for the primary householder has the lowest median household income of $0, with 11 households (3.9%) in this group.
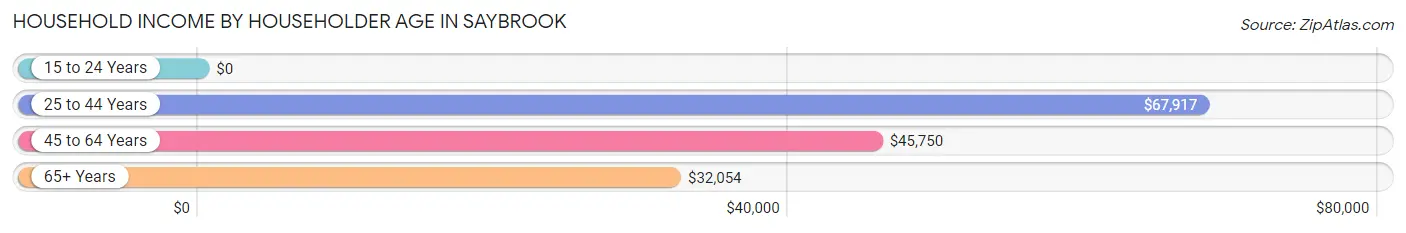
| Income Bracket | # Households | Median Income |
| 15 to 24 Years | 11 (3.9%) | $0 |
| 25 to 44 Years | 72 (25.6%) | $67,917 |
| 45 to 64 Years | 97 (34.5%) | $45,750 |
| 65+ Years | 101 (35.9%) | $32,054 |
| Total | 281 (100.0%) | $50,625 |
Poverty in Saybrook
Income Below Poverty by Sex and Age in Saybrook
With 14.6% poverty level for males and 12.3% for females among the residents of Saybrook, 16 and 17 year old males and 25 to 34 year old females are the most vulnerable to poverty, with 8 males (66.7%) and 6 females (31.6%) in their respective age groups living below the poverty level.
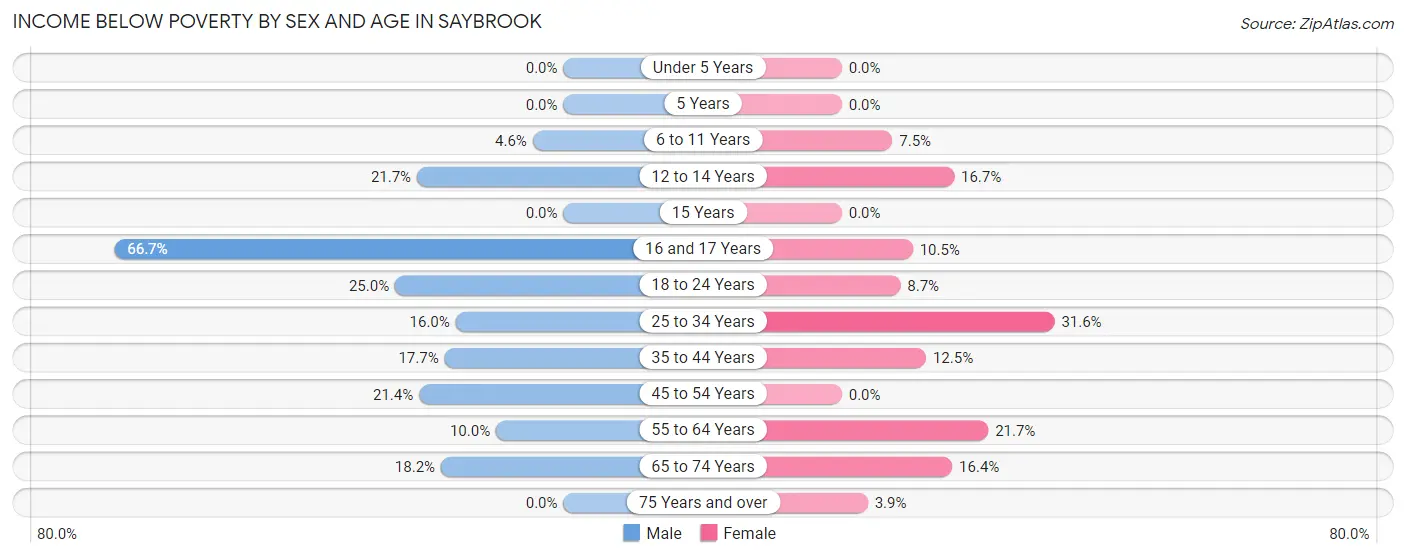
| Age Bracket | Male | Female |
| Under 5 Years | 0 (0.0%) | 0 (0.0%) |
| 5 Years | 0 (0.0%) | 0 (0.0%) |
| 6 to 11 Years | 2 (4.5%) | 3 (7.5%) |
| 12 to 14 Years | 5 (21.7%) | 1 (16.7%) |
| 15 Years | 0 (0.0%) | 0 (0.0%) |
| 16 and 17 Years | 8 (66.7%) | 2 (10.5%) |
| 18 to 24 Years | 3 (25.0%) | 2 (8.7%) |
| 25 to 34 Years | 8 (16.0%) | 6 (31.6%) |
| 35 to 44 Years | 9 (17.6%) | 6 (12.5%) |
| 45 to 54 Years | 6 (21.4%) | 0 (0.0%) |
| 55 to 64 Years | 3 (10.0%) | 15 (21.7%) |
| 65 to 74 Years | 8 (18.2%) | 10 (16.4%) |
| 75 Years and over | 0 (0.0%) | 1 (3.8%) |
| Total | 52 (14.6%) | 46 (12.3%) |
Income Above Poverty by Sex and Age in Saybrook
According to the poverty statistics in Saybrook, males aged under 5 years and females aged under 5 years are the age groups that are most secure financially, with 100.0% of males and 100.0% of females in these age groups living above the poverty line.
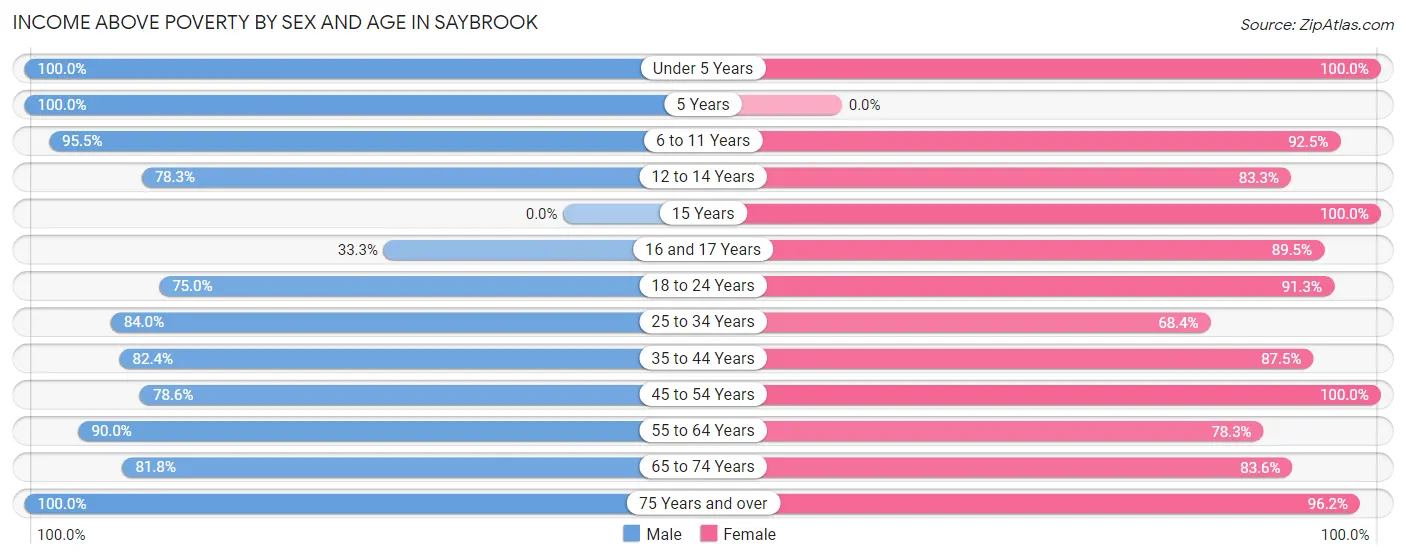
| Age Bracket | Male | Female |
| Under 5 Years | 25 (100.0%) | 22 (100.0%) |
| 5 Years | 18 (100.0%) | 0 (0.0%) |
| 6 to 11 Years | 42 (95.5%) | 37 (92.5%) |
| 12 to 14 Years | 18 (78.3%) | 5 (83.3%) |
| 15 Years | 0 (0.0%) | 3 (100.0%) |
| 16 and 17 Years | 4 (33.3%) | 17 (89.5%) |
| 18 to 24 Years | 9 (75.0%) | 21 (91.3%) |
| 25 to 34 Years | 42 (84.0%) | 13 (68.4%) |
| 35 to 44 Years | 42 (82.4%) | 42 (87.5%) |
| 45 to 54 Years | 22 (78.6%) | 39 (100.0%) |
| 55 to 64 Years | 27 (90.0%) | 54 (78.3%) |
| 65 to 74 Years | 36 (81.8%) | 51 (83.6%) |
| 75 Years and over | 20 (100.0%) | 25 (96.2%) |
| Total | 305 (85.4%) | 329 (87.7%) |
Income Below Poverty Among Married-Couple Families in Saybrook
The poverty statistics for married-couple families in Saybrook show that 3.5% or 5 of the total 145 families live below the poverty line. Families with 1 or 2 children have the highest poverty rate of 11.5%, comprising of 3 families. On the other hand, families with 3 or 4 children have the lowest poverty rate of 0.0%, which includes 0 families.
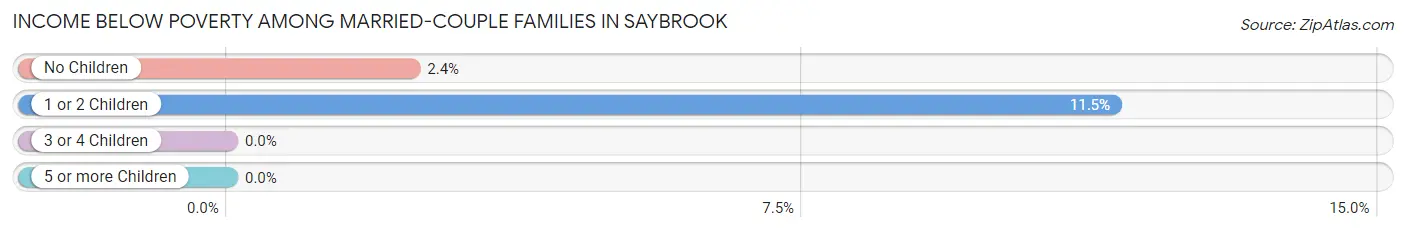
| Children | Above Poverty | Below Poverty |
| No Children | 82 (97.6%) | 2 (2.4%) |
| 1 or 2 Children | 23 (88.5%) | 3 (11.5%) |
| 3 or 4 Children | 28 (100.0%) | 0 (0.0%) |
| 5 or more Children | 7 (100.0%) | 0 (0.0%) |
| Total | 140 (96.6%) | 5 (3.5%) |
Income Below Poverty Among Single-Parent Households in Saybrook
According to the poverty data in Saybrook, 100.0% or 3 single-father households and 60.0% or 24 single-mother households are living below the poverty line. Among single-father households, those with no children have the highest poverty rate, with 3 households (100.0%) experiencing poverty. Likewise, among single-mother households, those with 1 or 2 children have the highest poverty rate, with 11 households (100.0%) falling below the poverty line.
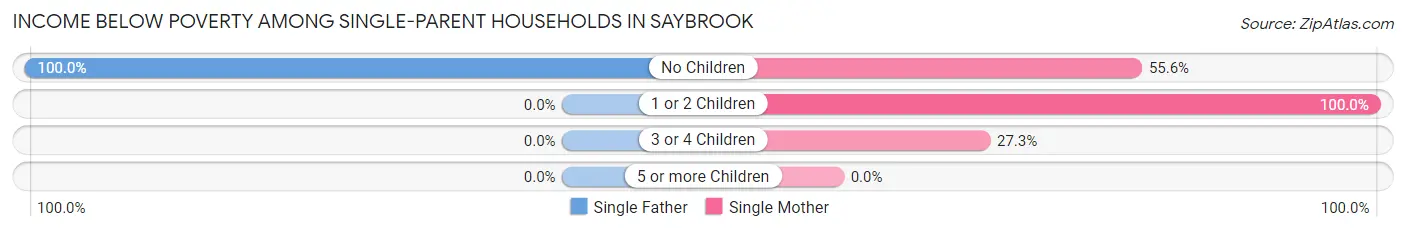
| Children | Single Father | Single Mother |
| No Children | 3 (100.0%) | 10 (55.6%) |
| 1 or 2 Children | 0 (0.0%) | 11 (100.0%) |
| 3 or 4 Children | 0 (0.0%) | 3 (27.3%) |
| 5 or more Children | 0 (0.0%) | 0 (0.0%) |
| Total | 3 (100.0%) | 24 (60.0%) |
Income Below Poverty Among Married-Couple vs Single-Parent Households in Saybrook
The poverty data for Saybrook shows that 5 of the married-couple family households (3.5%) and 27 of the single-parent households (62.8%) are living below the poverty level. Within the married-couple family households, those with 1 or 2 children have the highest poverty rate, with 3 households (11.5%) falling below the poverty line. Among the single-parent households, those with 1 or 2 children have the highest poverty rate, with 11 household (100.0%) living below poverty.
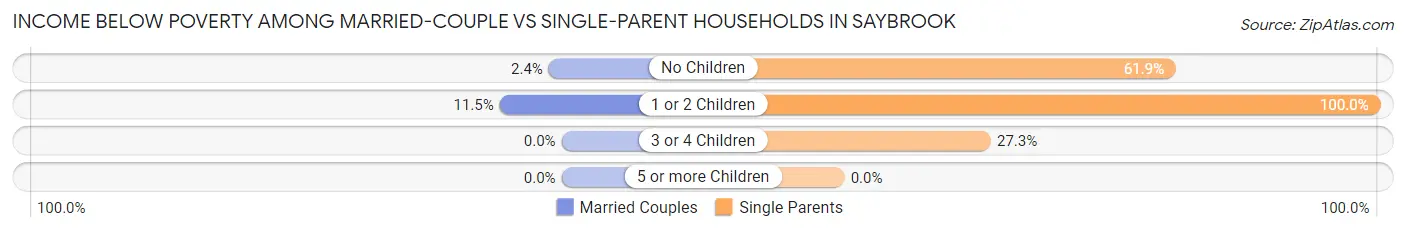
| Children | Married-Couple Families | Single-Parent Households |
| No Children | 2 (2.4%) | 13 (61.9%) |
| 1 or 2 Children | 3 (11.5%) | 11 (100.0%) |
| 3 or 4 Children | 0 (0.0%) | 3 (27.3%) |
| 5 or more Children | 0 (0.0%) | 0 (0.0%) |
| Total | 5 (3.5%) | 27 (62.8%) |
Race in Saybrook
The most populous races in Saybrook are White / Caucasian (659 | 89.8%), Black / African American (50 | 6.8%), and Two or more Races (25 | 3.4%).
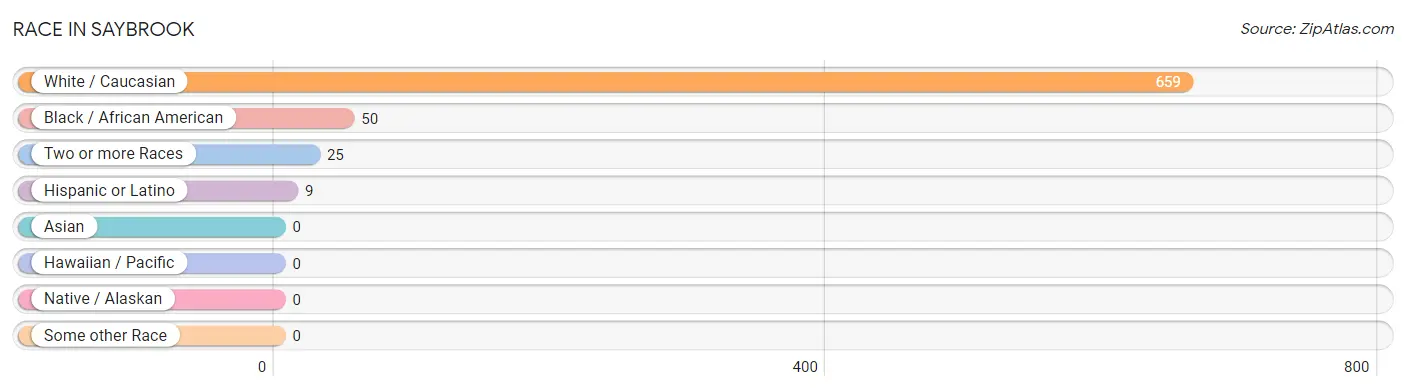
| Race | # Population | % Population |
| Asian | 0 | 0.0% |
| Black / African American | 50 | 6.8% |
| Hawaiian / Pacific | 0 | 0.0% |
| Hispanic or Latino | 9 | 1.2% |
| Native / Alaskan | 0 | 0.0% |
| White / Caucasian | 659 | 89.8% |
| Two or more Races | 25 | 3.4% |
| Some other Race | 0 | 0.0% |
| Total | 734 | 100.0% |
Ancestry in Saybrook
The most populous ancestries reported in Saybrook are German (245 | 33.4%), Irish (148 | 20.2%), American (87 | 11.8%), Polish (65 | 8.9%), and English (60 | 8.2%), together accounting for 82.4% of all Saybrook residents.
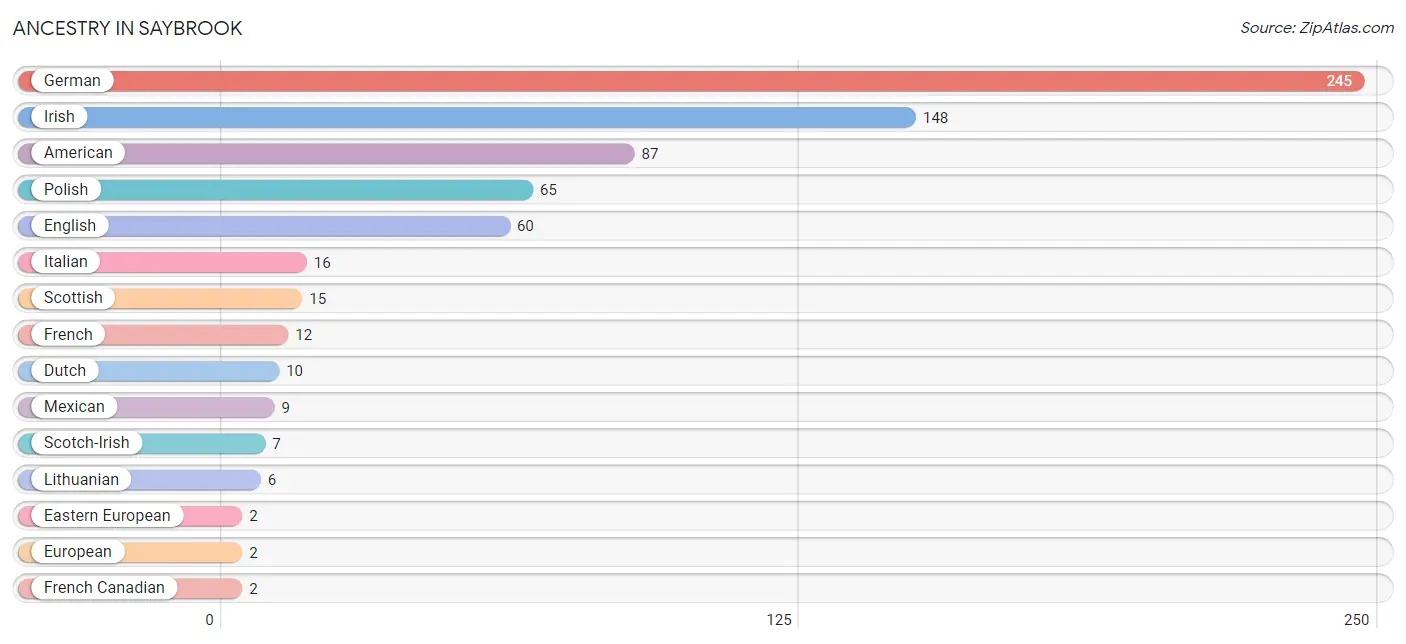
| Ancestry | # Population | % Population |
| American | 87 | 11.8% |
| Dutch | 10 | 1.4% |
| Eastern European | 2 | 0.3% |
| English | 60 | 8.2% |
| European | 2 | 0.3% |
| French | 12 | 1.6% |
| French Canadian | 2 | 0.3% |
| German | 245 | 33.4% |
| Irish | 148 | 20.2% |
| Italian | 16 | 2.2% |
| Lithuanian | 6 | 0.8% |
| Mexican | 9 | 1.2% |
| Norwegian | 2 | 0.3% |
| Polish | 65 | 8.9% |
| Scotch-Irish | 7 | 0.9% |
| Scottish | 15 | 2.0% | View All 16 Rows |
Immigrants in Saybrook
The most numerous immigrant groups reported in Saybrook came from Europe (5 | 0.7%), Germany (5 | 0.7%), and Western Europe (5 | 0.7%), together accounting for 2.0% of all Saybrook residents.
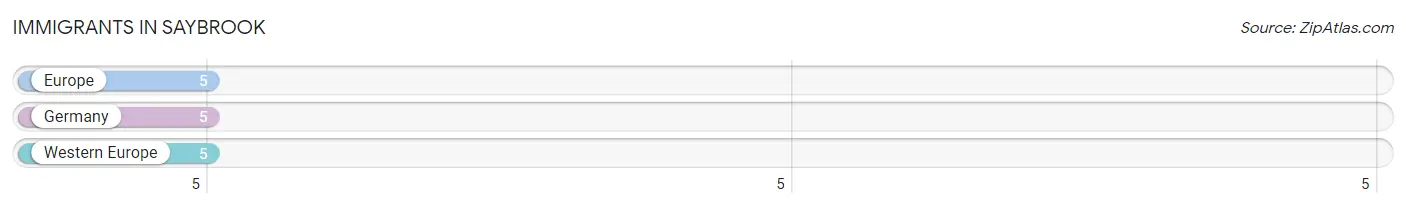
| Immigration Origin | # Population | % Population |
| Europe | 5 | 0.7% |
| Germany | 5 | 0.7% |
| Western Europe | 5 | 0.7% | View All 3 Rows |
Sex and Age in Saybrook
Sex and Age in Saybrook
The most populous age groups in Saybrook are 5 to 9 Years (55 | 15.3%) for men and 65 to 69 Years (47 | 12.5%) for women.
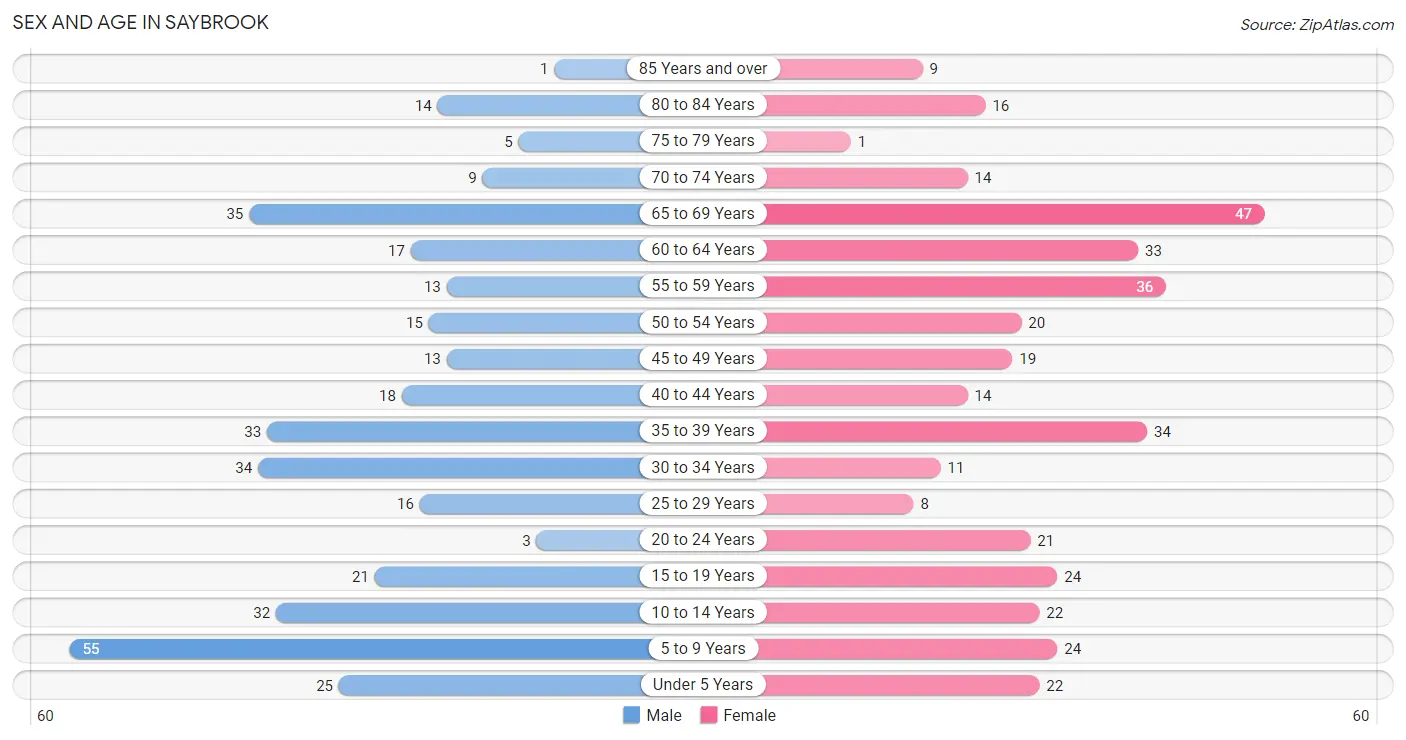
| Age Bracket | Male | Female |
| Under 5 Years | 25 (7.0%) | 22 (5.9%) |
| 5 to 9 Years | 55 (15.3%) | 24 (6.4%) |
| 10 to 14 Years | 32 (8.9%) | 22 (5.9%) |
| 15 to 19 Years | 21 (5.9%) | 24 (6.4%) |
| 20 to 24 Years | 3 (0.8%) | 21 (5.6%) |
| 25 to 29 Years | 16 (4.5%) | 8 (2.1%) |
| 30 to 34 Years | 34 (9.5%) | 11 (2.9%) |
| 35 to 39 Years | 33 (9.2%) | 34 (9.1%) |
| 40 to 44 Years | 18 (5.0%) | 14 (3.7%) |
| 45 to 49 Years | 13 (3.6%) | 19 (5.1%) |
| 50 to 54 Years | 15 (4.2%) | 20 (5.3%) |
| 55 to 59 Years | 13 (3.6%) | 36 (9.6%) |
| 60 to 64 Years | 17 (4.7%) | 33 (8.8%) |
| 65 to 69 Years | 35 (9.8%) | 47 (12.5%) |
| 70 to 74 Years | 9 (2.5%) | 14 (3.7%) |
| 75 to 79 Years | 5 (1.4%) | 1 (0.3%) |
| 80 to 84 Years | 14 (3.9%) | 16 (4.3%) |
| 85 Years and over | 1 (0.3%) | 9 (2.4%) |
| Total | 359 (100.0%) | 375 (100.0%) |
Families and Households in Saybrook
Median Family Size in Saybrook
The median family size in Saybrook is 3.25 persons per family, with married-couple families (145 | 77.1%) accounting for the largest median family size of 3.48 persons per family. On the other hand, single male/father families (3 | 1.6%) represent the smallest median family size with 1.67 persons per family.
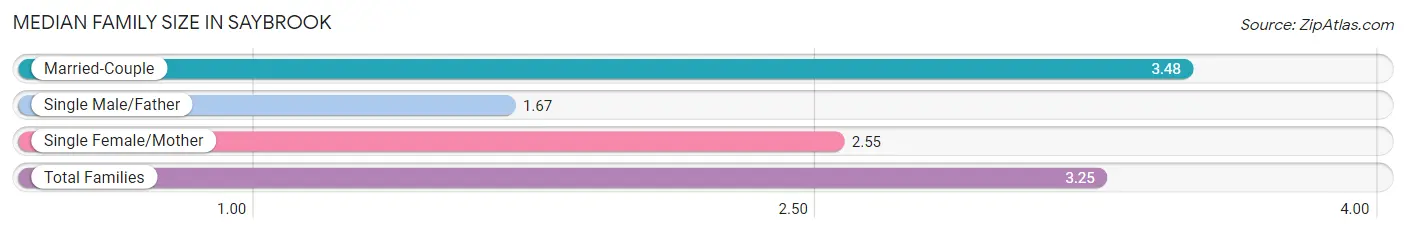
| Family Type | # Families | Family Size |
| Married-Couple | 145 (77.1%) | 3.48 |
| Single Male/Father | 3 (1.6%) | 1.67 |
| Single Female/Mother | 40 (21.3%) | 2.55 |
| Total Families | 188 (100.0%) | 3.25 |
Median Household Size in Saybrook
The median household size in Saybrook is 2.61 persons per household, with married-couple households (145 | 51.6%) accounting for the largest median household size of 3.48 persons per household. non-family households (93 | 33.1%) represent the smallest median household size with 1.22 persons per household.
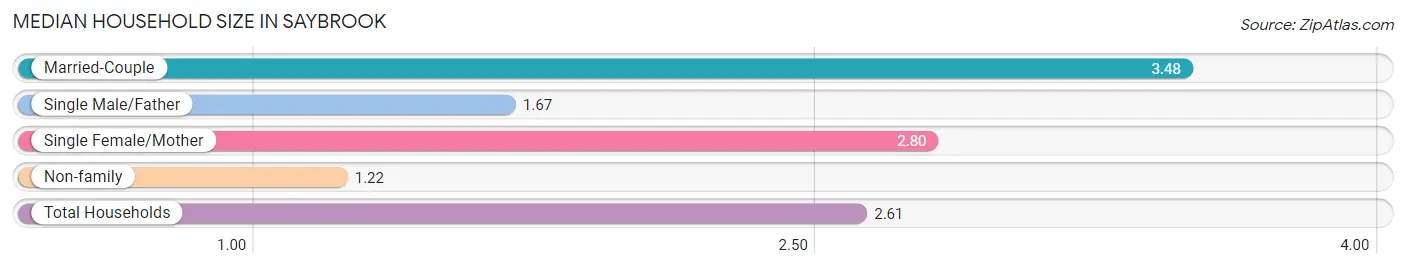
| Household Type | # Households | Household Size |
| Married-Couple | 145 (51.6%) | 3.48 |
| Single Male/Father | 3 (1.1%) | 1.67 |
| Single Female/Mother | 40 (14.2%) | 2.80 |
| Non-family | 93 (33.1%) | 1.22 |
| Total Households | 281 (100.0%) | 2.61 |
Household Size by Marriage Status in Saybrook
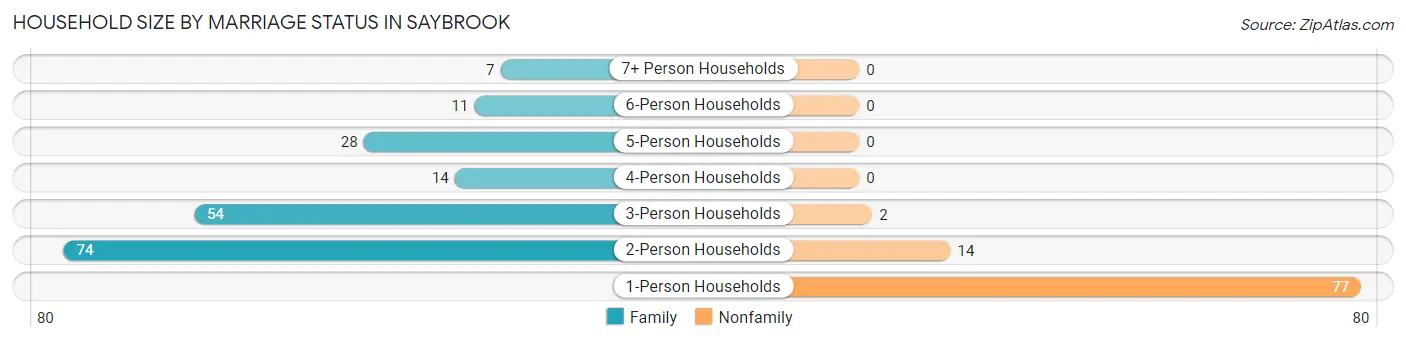
Out of a total of 281 households in Saybrook, 188 (66.9%) are family households, while 93 (33.1%) are nonfamily households. The most numerous type of family households are 2-person households, comprising 74, and the most common type of nonfamily households are 1-person households, comprising 77.
| Household Size | Family Households | Nonfamily Households |
| 1-Person Households | - | 77 (27.4%) |
| 2-Person Households | 74 (26.3%) | 14 (5.0%) |
| 3-Person Households | 54 (19.2%) | 2 (0.7%) |
| 4-Person Households | 14 (5.0%) | 0 (0.0%) |
| 5-Person Households | 28 (10.0%) | 0 (0.0%) |
| 6-Person Households | 11 (3.9%) | 0 (0.0%) |
| 7+ Person Households | 7 (2.5%) | 0 (0.0%) |
| Total | 188 (66.9%) | 93 (33.1%) |
Female Fertility in Saybrook
Fertility by Age in Saybrook
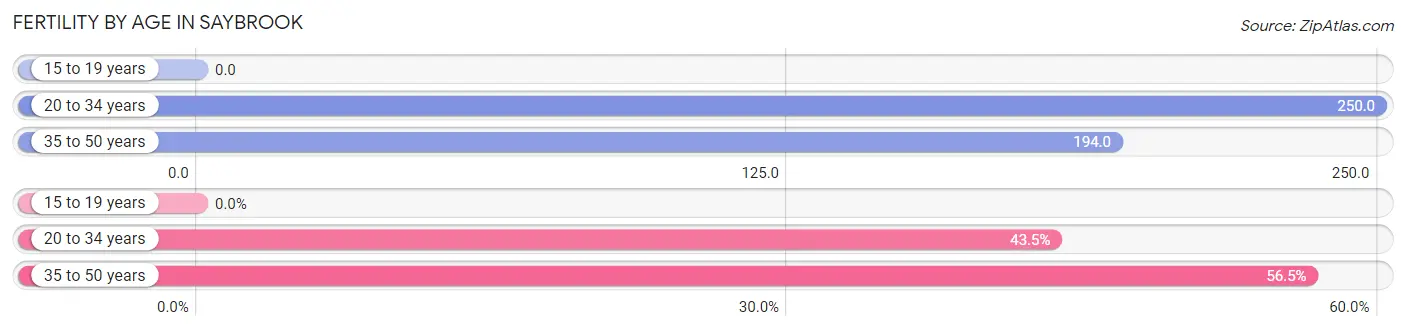
Average fertility rate in Saybrook is 176.0 births per 1,000 women. Women in the age bracket of 20 to 34 years have the highest fertility rate with 250.0 births per 1,000 women. Women in the age bracket of 35 to 50 years acount for 56.5% of all women with births.
| Age Bracket | Women with Births | Births / 1,000 Women |
| 15 to 19 years | 0 (0.0%) | 0.0 |
| 20 to 34 years | 10 (43.5%) | 250.0 |
| 35 to 50 years | 13 (56.5%) | 194.0 |
| Total | 23 (100.0%) | 176.0 |
Fertility by Age by Marriage Status in Saybrook
65.2% of women with births (23) in Saybrook are married. The highest percentage of unmarried women with births falls into 20 to 34 years age bracket with 80.0% of them unmarried at the time of birth, while the lowest percentage of unmarried women with births belong to 35 to 50 years age bracket with 0.0% of them unmarried.
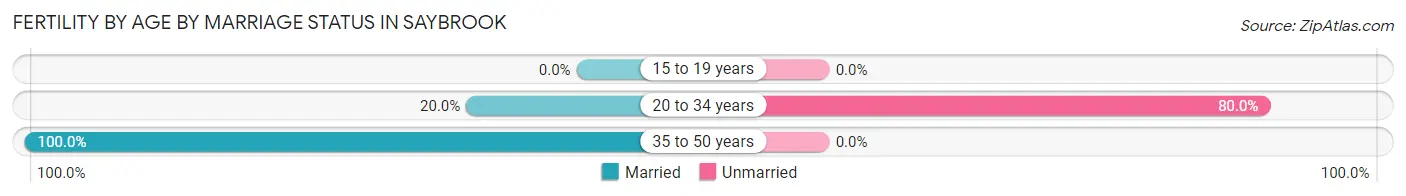
| Age Bracket | Married | Unmarried |
| 15 to 19 years | 0 (0.0%) | 0 (0.0%) |
| 20 to 34 years | 2 (20.0%) | 8 (80.0%) |
| 35 to 50 years | 13 (100.0%) | 0 (0.0%) |
| Total | 15 (65.2%) | 8 (34.8%) |
Fertility by Education in Saybrook
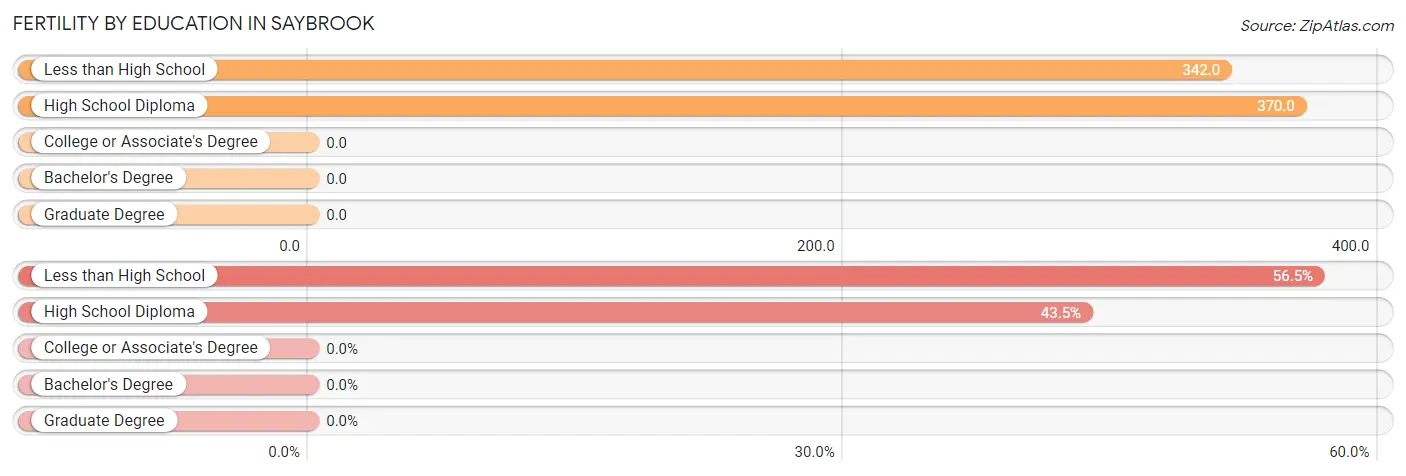
| Educational Attainment | Women with Births | Births / 1,000 Women |
| Less than High School | 13 (56.5%) | 342.0 |
| High School Diploma | 10 (43.5%) | 370.0 |
| College or Associate's Degree | 0 (0.0%) | 0.0 |
| Bachelor's Degree | 0 (0.0%) | 0.0 |
| Graduate Degree | 0 (0.0%) | 0.0 |
| Total | 23 (100.0%) | 176.0 |
Fertility by Education by Marriage Status in Saybrook
34.8% of women with births in Saybrook are unmarried. Women with the educational attainment of less than high school are most likely to be married with 100.0% of them married at childbirth, while women with the educational attainment of high school diploma are least likely to be married with 80.0% of them unmarried at childbirth.
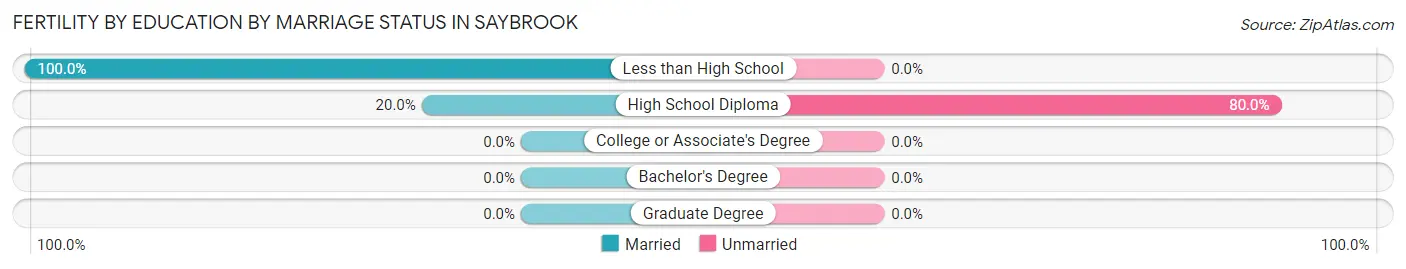
| Educational Attainment | Married | Unmarried |
| Less than High School | 13 (100.0%) | 0 (0.0%) |
| High School Diploma | 2 (20.0%) | 8 (80.0%) |
| College or Associate's Degree | 0 (0.0%) | 0 (0.0%) |
| Bachelor's Degree | 0 (0.0%) | 0 (0.0%) |
| Graduate Degree | 0 (0.0%) | 0 (0.0%) |
| Total | 15 (65.2%) | 8 (34.8%) |
Employment Characteristics in Saybrook
Employment by Class of Employer in Saybrook
Among the 278 employed individuals in Saybrook, private company employees (218 | 78.4%), not-for-profit organizations (22 | 7.9%), and self-employed (not incorporated) (10 | 3.6%) make up the most common classes of employment.
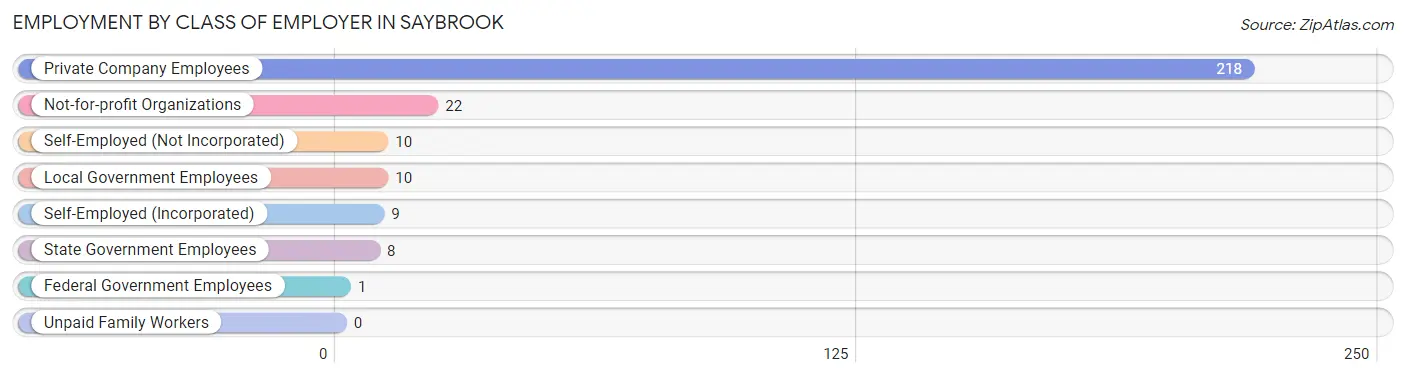
| Employer Class | # Employees | % Employees |
| Private Company Employees | 218 | 78.4% |
| Self-Employed (Incorporated) | 9 | 3.2% |
| Self-Employed (Not Incorporated) | 10 | 3.6% |
| Not-for-profit Organizations | 22 | 7.9% |
| Local Government Employees | 10 | 3.6% |
| State Government Employees | 8 | 2.9% |
| Federal Government Employees | 1 | 0.4% |
| Unpaid Family Workers | 0 | 0.0% |
| Total | 278 | 100.0% |
Employment Status by Age in Saybrook
According to the labor force statistics for Saybrook, out of the total population over 16 years of age (551), 52.1% or 287 individuals are in the labor force, with 3.1% or 9 of them unemployed. The age group with the highest labor force participation rate is 20 to 24 years, with 100.0% or 24 individuals in the labor force. Within the labor force, the 30 to 34 years age range has the highest percentage of unemployed individuals, with 19.0% or 8 of them being unemployed.
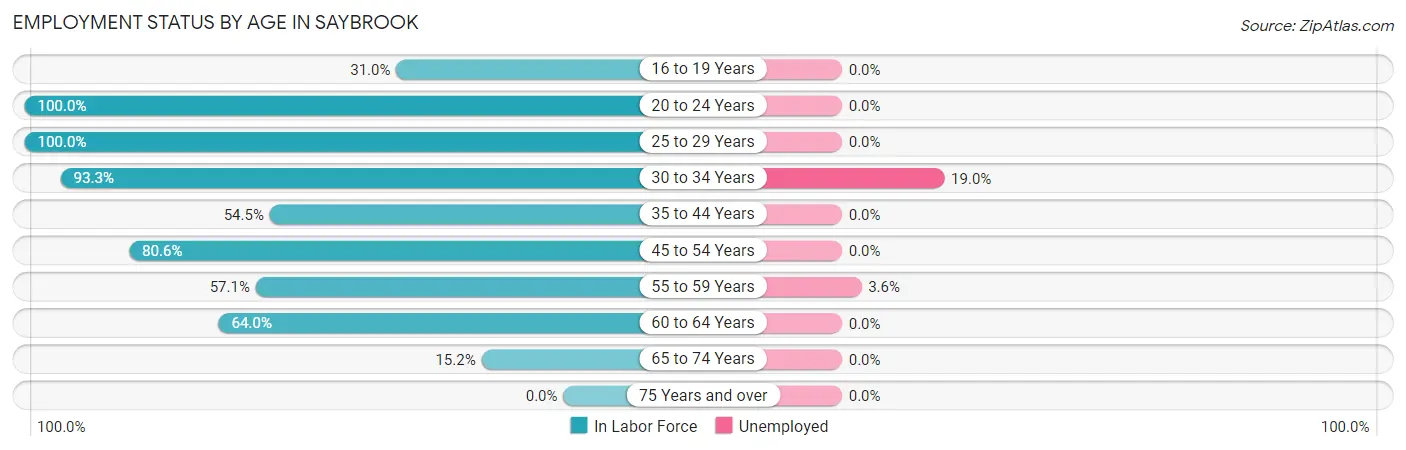
| Age Bracket | In Labor Force | Unemployed |
| 16 to 19 Years | 13 (31.0%) | 0 (0.0%) |
| 20 to 24 Years | 24 (100.0%) | 0 (0.0%) |
| 25 to 29 Years | 24 (100.0%) | 0 (0.0%) |
| 30 to 34 Years | 42 (93.3%) | 8 (19.0%) |
| 35 to 44 Years | 54 (54.5%) | 0 (0.0%) |
| 45 to 54 Years | 54 (80.6%) | 0 (0.0%) |
| 55 to 59 Years | 28 (57.1%) | 1 (3.6%) |
| 60 to 64 Years | 32 (64.0%) | 0 (0.0%) |
| 65 to 74 Years | 16 (15.2%) | 0 (0.0%) |
| 75 Years and over | 0 (0.0%) | 0 (0.0%) |
| Total | 287 (52.1%) | 9 (3.1%) |
Employment Status by Educational Attainment in Saybrook
According to labor force statistics for Saybrook, 70.1% of individuals (234) out of the total population between 25 and 64 years of age (334) are in the labor force, with 3.8% or 9 of them being unemployed. The group with the highest labor force participation rate are those with the educational attainment of bachelor's degree or higher, with 100.0% or 58 individuals in the labor force. Within the labor force, individuals with less than high school education have the highest percentage of unemployment, with 34.8% or 8 of them being unemployed.
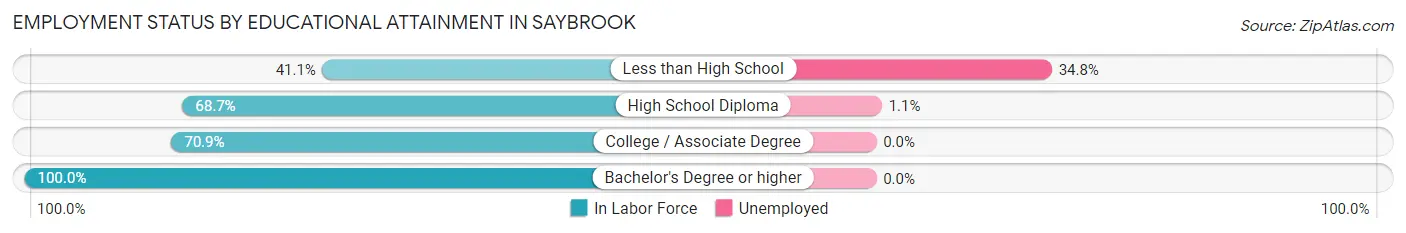
| Educational Attainment | In Labor Force | Unemployed |
| Less than High School | 23 (41.1%) | 19 (34.8%) |
| High School Diploma | 92 (68.7%) | 1 (1.1%) |
| College / Associate Degree | 61 (70.9%) | 0 (0.0%) |
| Bachelor's Degree or higher | 58 (100.0%) | 0 (0.0%) |
| Total | 234 (70.1%) | 13 (3.8%) |
Employment Occupations by Sex in Saybrook
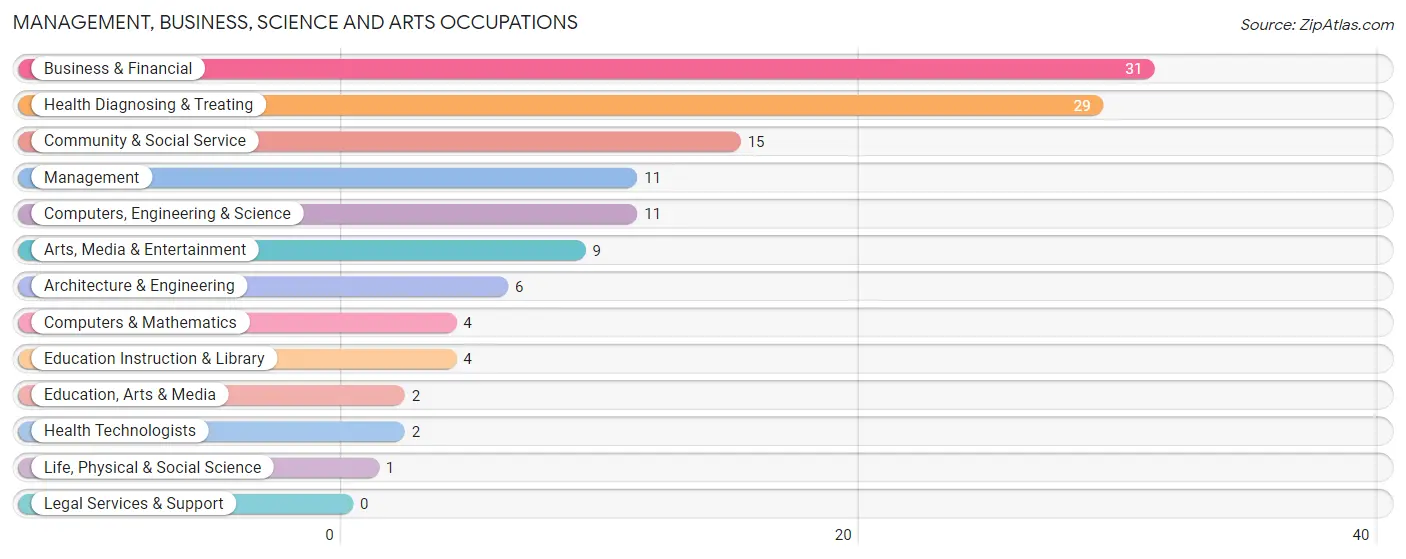
Management, Business, Science and Arts Occupations
The most common Management, Business, Science and Arts occupations in Saybrook are Business & Financial (31 | 11.2%), Health Diagnosing & Treating (29 | 10.4%), Community & Social Service (15 | 5.4%), Management (11 | 4.0%), and Computers, Engineering & Science (11 | 4.0%).
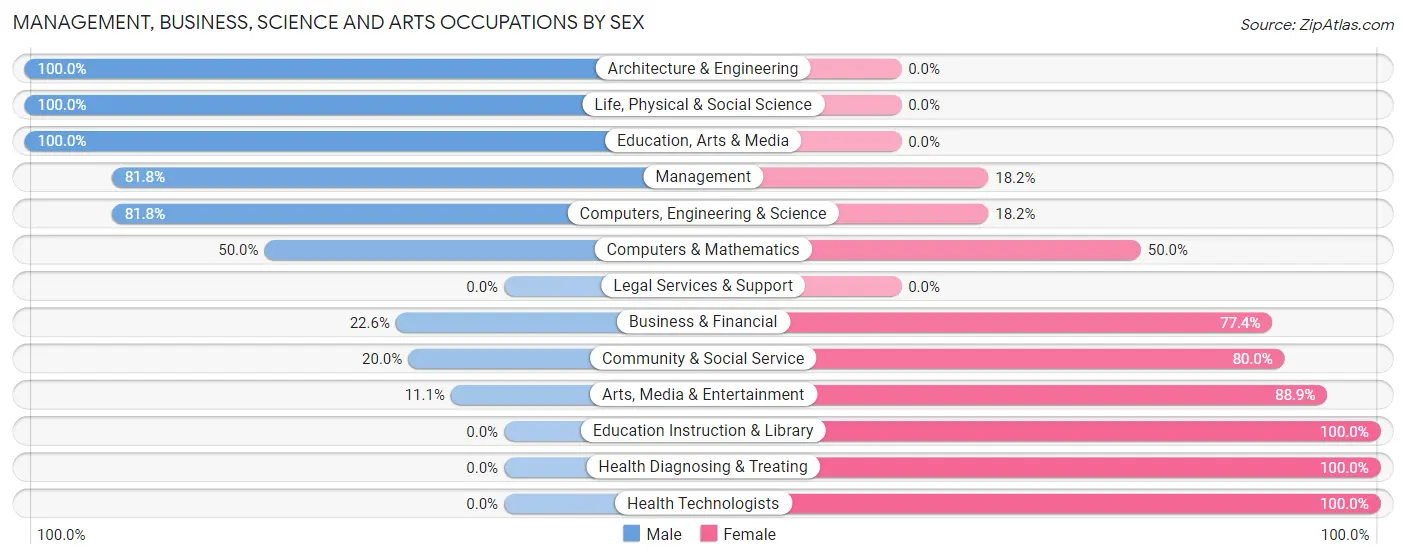
Management, Business, Science and Arts Occupations by Sex
Within the Management, Business, Science and Arts occupations in Saybrook, the most male-oriented occupations are Architecture & Engineering (100.0%), Life, Physical & Social Science (100.0%), and Education, Arts & Media (100.0%), while the most female-oriented occupations are Education Instruction & Library (100.0%), Health Diagnosing & Treating (100.0%), and Health Technologists (100.0%).
| Occupation | Male | Female |
| Management | 9 (81.8%) | 2 (18.2%) |
| Business & Financial | 7 (22.6%) | 24 (77.4%) |
| Computers, Engineering & Science | 9 (81.8%) | 2 (18.2%) |
| Computers & Mathematics | 2 (50.0%) | 2 (50.0%) |
| Architecture & Engineering | 6 (100.0%) | 0 (0.0%) |
| Life, Physical & Social Science | 1 (100.0%) | 0 (0.0%) |
| Community & Social Service | 3 (20.0%) | 12 (80.0%) |
| Education, Arts & Media | 2 (100.0%) | 0 (0.0%) |
| Legal Services & Support | 0 (0.0%) | 0 (0.0%) |
| Education Instruction & Library | 0 (0.0%) | 4 (100.0%) |
| Arts, Media & Entertainment | 1 (11.1%) | 8 (88.9%) |
| Health Diagnosing & Treating | 0 (0.0%) | 29 (100.0%) |
| Health Technologists | 0 (0.0%) | 2 (100.0%) |
| Total (Category) | 28 (28.9%) | 69 (71.1%) |
| Total (Overall) | 138 (49.6%) | 140 (50.4%) |
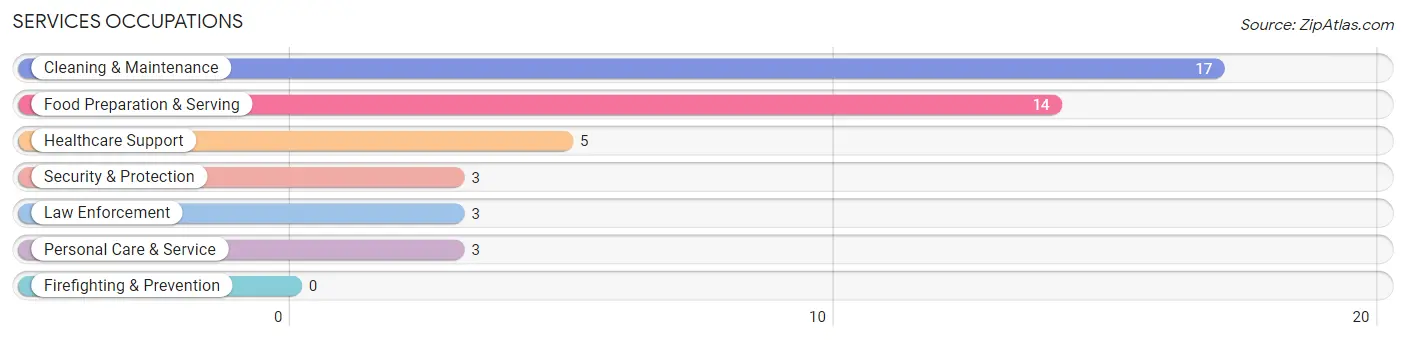
Services Occupations
The most common Services occupations in Saybrook are Cleaning & Maintenance (17 | 6.1%), Food Preparation & Serving (14 | 5.0%), Healthcare Support (5 | 1.8%), Security & Protection (3 | 1.1%), and Law Enforcement (3 | 1.1%).
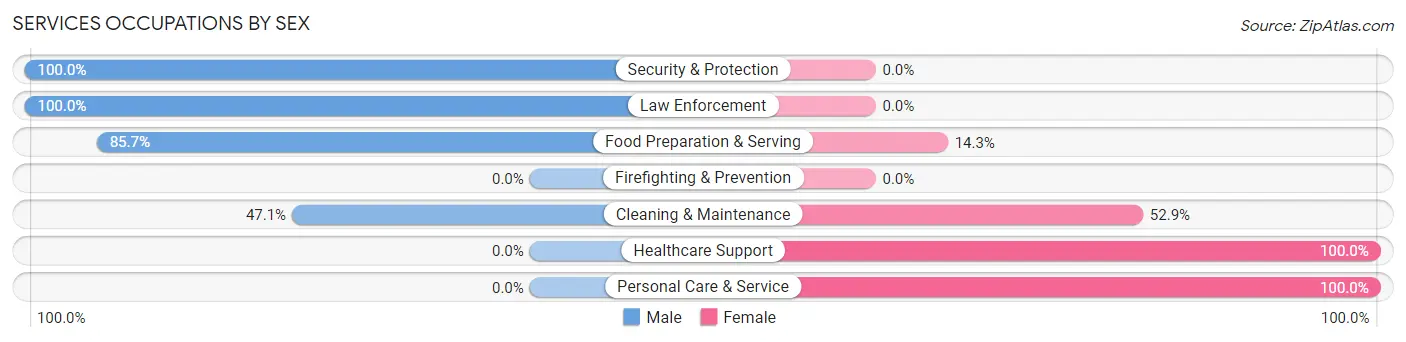
Services Occupations by Sex
Within the Services occupations in Saybrook, the most male-oriented occupations are Security & Protection (100.0%), Law Enforcement (100.0%), and Food Preparation & Serving (85.7%), while the most female-oriented occupations are Healthcare Support (100.0%), Personal Care & Service (100.0%), and Cleaning & Maintenance (52.9%).
| Occupation | Male | Female |
| Healthcare Support | 0 (0.0%) | 5 (100.0%) |
| Security & Protection | 3 (100.0%) | 0 (0.0%) |
| Firefighting & Prevention | 0 (0.0%) | 0 (0.0%) |
| Law Enforcement | 3 (100.0%) | 0 (0.0%) |
| Food Preparation & Serving | 12 (85.7%) | 2 (14.3%) |
| Cleaning & Maintenance | 8 (47.1%) | 9 (52.9%) |
| Personal Care & Service | 0 (0.0%) | 3 (100.0%) |
| Total (Category) | 23 (54.8%) | 19 (45.2%) |
| Total (Overall) | 138 (49.6%) | 140 (50.4%) |
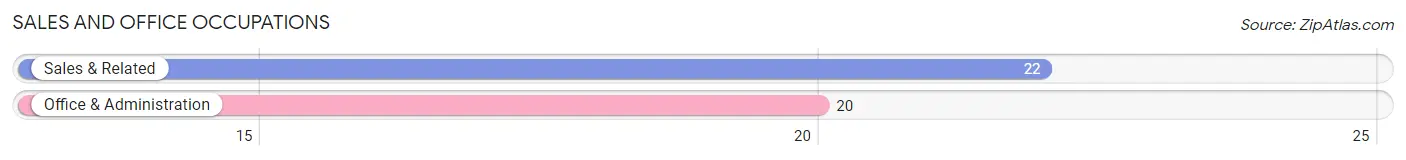
Sales and Office Occupations
The most common Sales and Office occupations in Saybrook are Sales & Related (22 | 7.9%), and Office & Administration (20 | 7.2%).
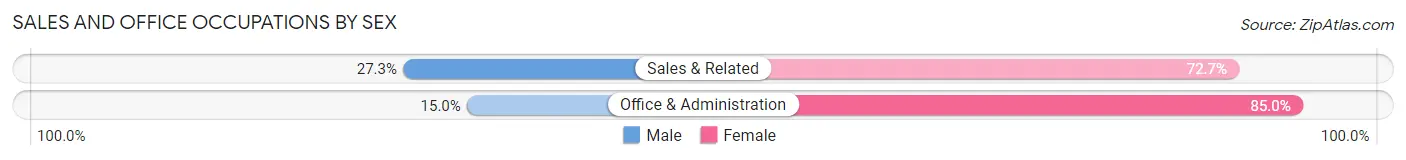
Sales and Office Occupations by Sex
| Occupation | Male | Female |
| Sales & Related | 6 (27.3%) | 16 (72.7%) |
| Office & Administration | 3 (15.0%) | 17 (85.0%) |
| Total (Category) | 9 (21.4%) | 33 (78.6%) |
| Total (Overall) | 138 (49.6%) | 140 (50.4%) |
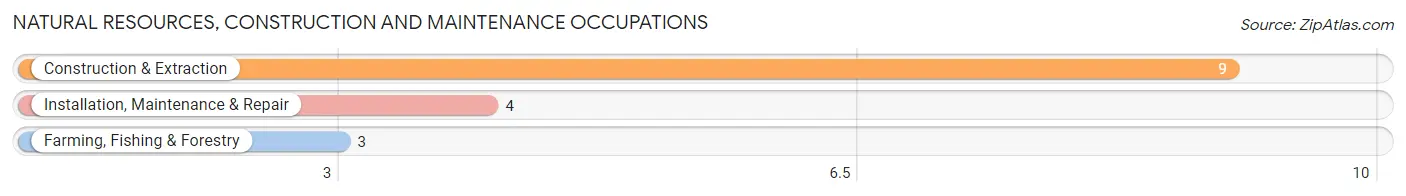
Natural Resources, Construction and Maintenance Occupations
The most common Natural Resources, Construction and Maintenance occupations in Saybrook are Construction & Extraction (9 | 3.2%), Installation, Maintenance & Repair (4 | 1.4%), and Farming, Fishing & Forestry (3 | 1.1%).
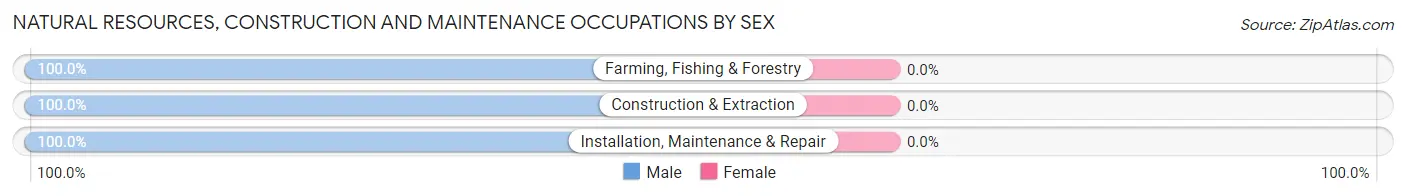
Natural Resources, Construction and Maintenance Occupations by Sex
| Occupation | Male | Female |
| Farming, Fishing & Forestry | 3 (100.0%) | 0 (0.0%) |
| Construction & Extraction | 9 (100.0%) | 0 (0.0%) |
| Installation, Maintenance & Repair | 4 (100.0%) | 0 (0.0%) |
| Total (Category) | 16 (100.0%) | 0 (0.0%) |
| Total (Overall) | 138 (49.6%) | 140 (50.4%) |
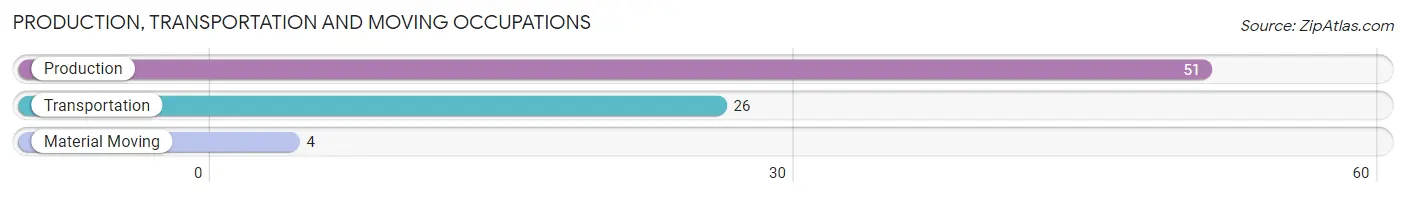
Production, Transportation and Moving Occupations
The most common Production, Transportation and Moving occupations in Saybrook are Production (51 | 18.3%), Transportation (26 | 9.3%), and Material Moving (4 | 1.4%).
Production, Transportation and Moving Occupations by Sex
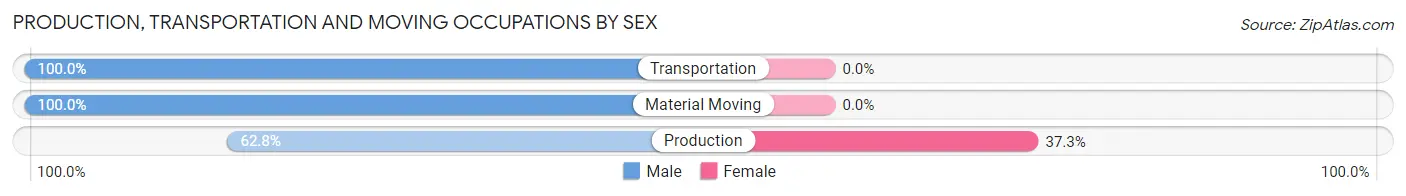
| Occupation | Male | Female |
| Production | 32 (62.7%) | 19 (37.2%) |
| Transportation | 26 (100.0%) | 0 (0.0%) |
| Material Moving | 4 (100.0%) | 0 (0.0%) |
| Total (Category) | 62 (76.5%) | 19 (23.5%) |
| Total (Overall) | 138 (49.6%) | 140 (50.4%) |
Employment Industries by Sex in Saybrook
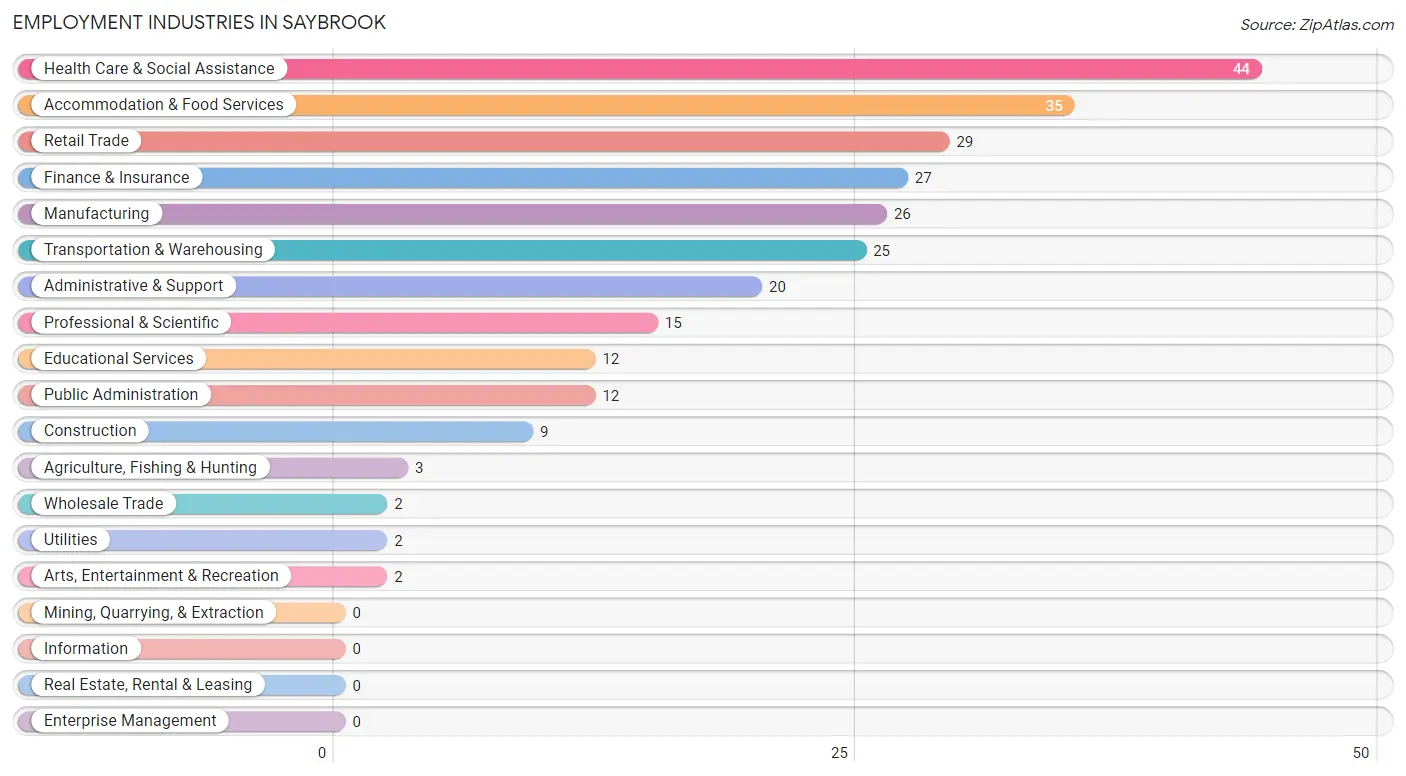
Employment Industries in Saybrook
The major employment industries in Saybrook include Health Care & Social Assistance (44 | 15.8%), Accommodation & Food Services (35 | 12.6%), Retail Trade (29 | 10.4%), Finance & Insurance (27 | 9.7%), and Manufacturing (26 | 9.3%).
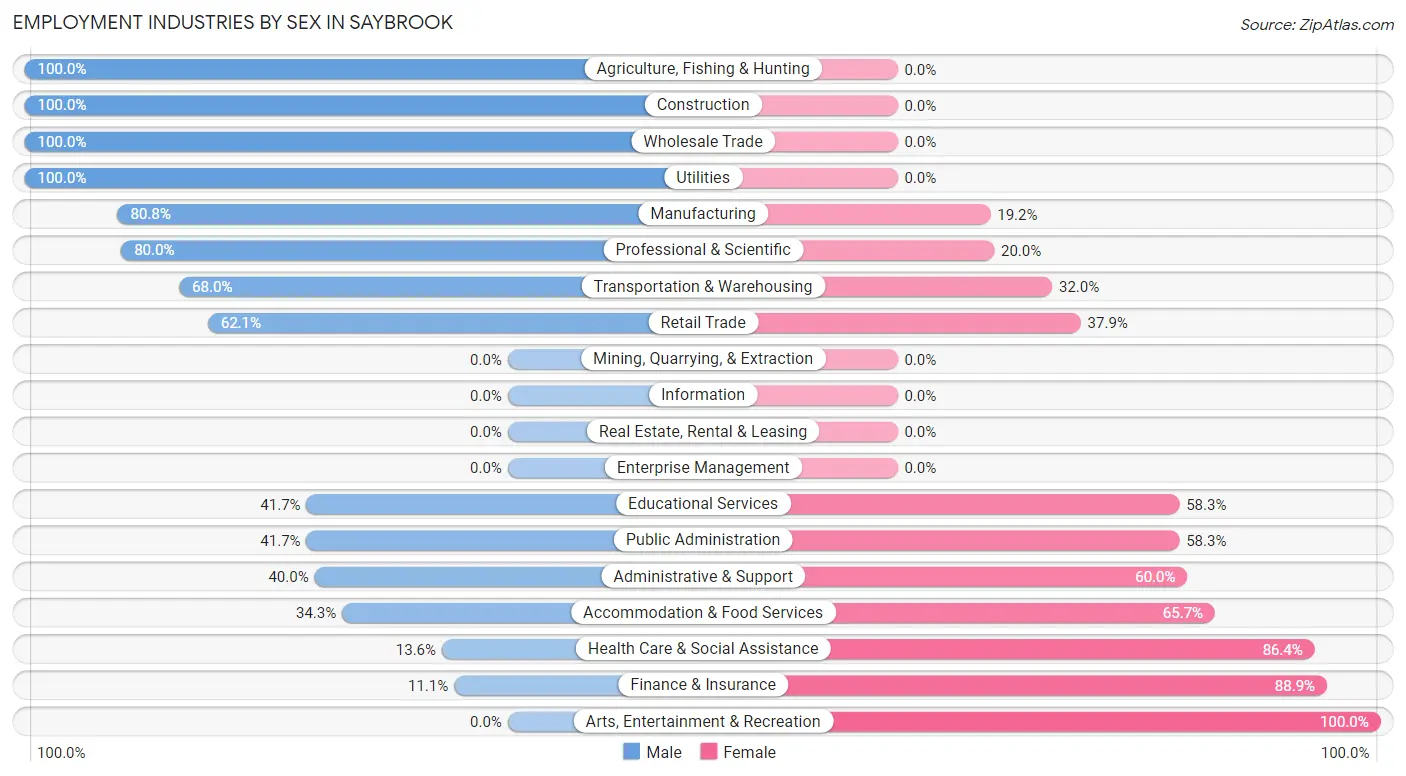
Employment Industries by Sex in Saybrook
The Saybrook industries that see more men than women are Agriculture, Fishing & Hunting (100.0%), Construction (100.0%), and Wholesale Trade (100.0%), whereas the industries that tend to have a higher number of women are Arts, Entertainment & Recreation (100.0%), Finance & Insurance (88.9%), and Health Care & Social Assistance (86.4%).
| Industry | Male | Female |
| Agriculture, Fishing & Hunting | 3 (100.0%) | 0 (0.0%) |
| Mining, Quarrying, & Extraction | 0 (0.0%) | 0 (0.0%) |
| Construction | 9 (100.0%) | 0 (0.0%) |
| Manufacturing | 21 (80.8%) | 5 (19.2%) |
| Wholesale Trade | 2 (100.0%) | 0 (0.0%) |
| Retail Trade | 18 (62.1%) | 11 (37.9%) |
| Transportation & Warehousing | 17 (68.0%) | 8 (32.0%) |
| Utilities | 2 (100.0%) | 0 (0.0%) |
| Information | 0 (0.0%) | 0 (0.0%) |
| Finance & Insurance | 3 (11.1%) | 24 (88.9%) |
| Real Estate, Rental & Leasing | 0 (0.0%) | 0 (0.0%) |
| Professional & Scientific | 12 (80.0%) | 3 (20.0%) |
| Enterprise Management | 0 (0.0%) | 0 (0.0%) |
| Administrative & Support | 8 (40.0%) | 12 (60.0%) |
| Educational Services | 5 (41.7%) | 7 (58.3%) |
| Health Care & Social Assistance | 6 (13.6%) | 38 (86.4%) |
| Arts, Entertainment & Recreation | 0 (0.0%) | 2 (100.0%) |
| Accommodation & Food Services | 12 (34.3%) | 23 (65.7%) |
| Public Administration | 5 (41.7%) | 7 (58.3%) |
| Total | 138 (49.6%) | 140 (50.4%) |
Education in Saybrook
School Enrollment in Saybrook
The most common levels of schooling among the 192 students in Saybrook are elementary school (59 | 30.7%), high school (46 | 24.0%), and middle school (37 | 19.3%).
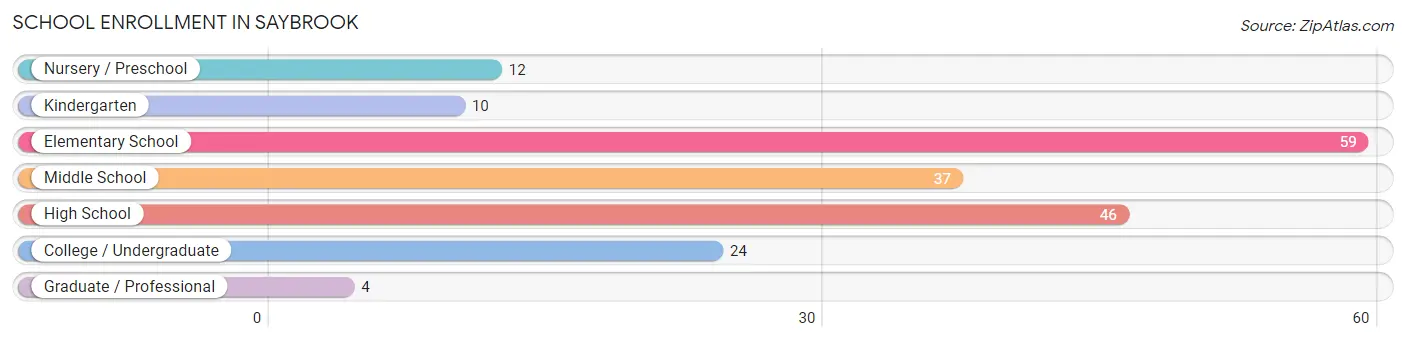
| School Level | # Students | % Students |
| Nursery / Preschool | 12 | 6.2% |
| Kindergarten | 10 | 5.2% |
| Elementary School | 59 | 30.7% |
| Middle School | 37 | 19.3% |
| High School | 46 | 24.0% |
| College / Undergraduate | 24 | 12.5% |
| Graduate / Professional | 4 | 2.1% |
| Total | 192 | 100.0% |
School Enrollment by Age by Funding Source in Saybrook
Out of a total of 192 students who are enrolled in schools in Saybrook, 40 (20.8%) attend a private institution, while the remaining 152 (79.2%) are enrolled in public schools. The age group of 35 years and over has the highest likelihood of being enrolled in private schools, with 6 (60.0% in the age bracket) enrolled. Conversely, the age group of 3 to 4 year olds has the lowest likelihood of being enrolled in a private school, with 1 (100.0% in the age bracket) attending a public institution.
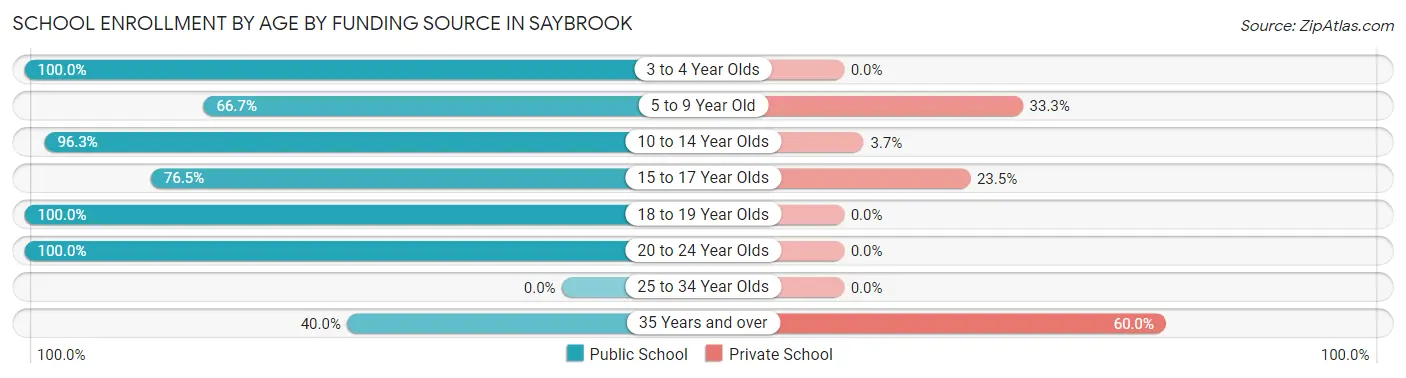
| Age Bracket | Public School | Private School |
| 3 to 4 Year Olds | 1 (100.0%) | 0 (0.0%) |
| 5 to 9 Year Old | 48 (66.7%) | 24 (33.3%) |
| 10 to 14 Year Olds | 52 (96.3%) | 2 (3.7%) |
| 15 to 17 Year Olds | 26 (76.5%) | 8 (23.5%) |
| 18 to 19 Year Olds | 11 (100.0%) | 0 (0.0%) |
| 20 to 24 Year Olds | 10 (100.0%) | 0 (0.0%) |
| 25 to 34 Year Olds | 0 (0.0%) | 0 (0.0%) |
| 35 Years and over | 4 (40.0%) | 6 (60.0%) |
| Total | 152 (79.2%) | 40 (20.8%) |
Educational Attainment by Field of Study in Saybrook
Education (15 | 22.7%), science & technology (13 | 19.7%), business (8 | 12.1%), arts & humanities (8 | 12.1%), and literature & languages (6 | 9.1%) are the most common fields of study among 66 individuals in Saybrook who have obtained a bachelor's degree or higher.
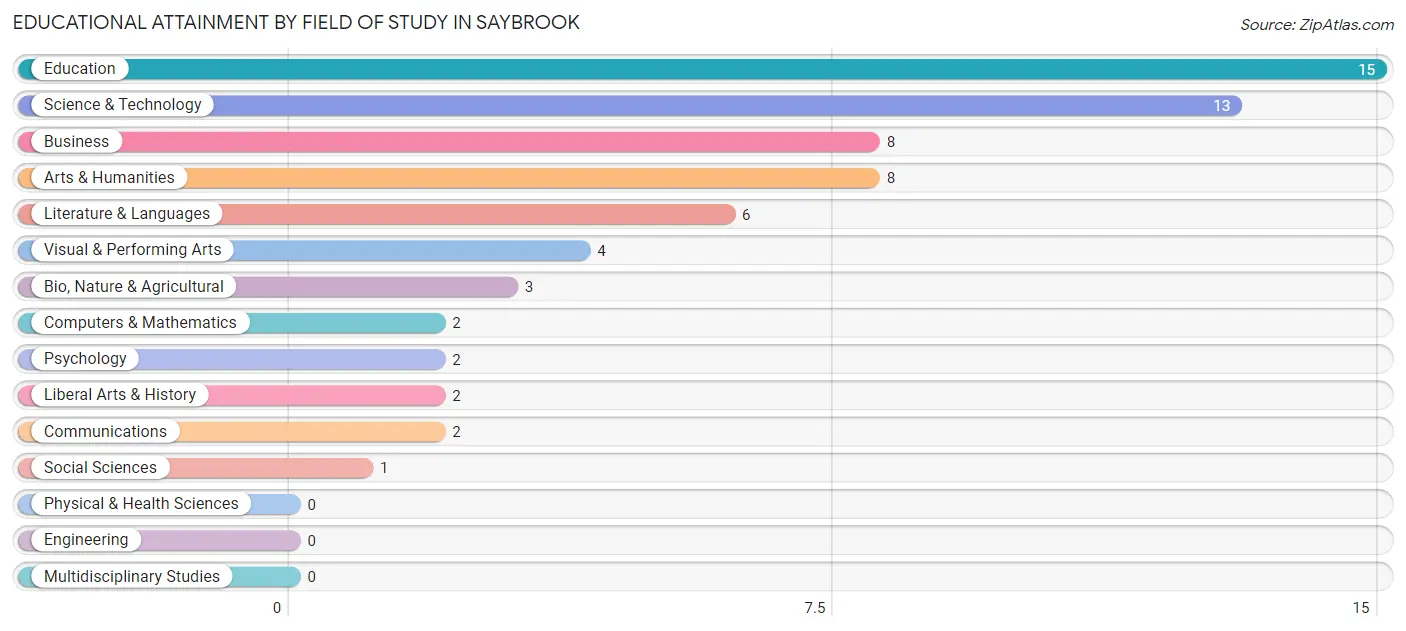
| Field of Study | # Graduates | % Graduates |
| Computers & Mathematics | 2 | 3.0% |
| Bio, Nature & Agricultural | 3 | 4.5% |
| Physical & Health Sciences | 0 | 0.0% |
| Psychology | 2 | 3.0% |
| Social Sciences | 1 | 1.5% |
| Engineering | 0 | 0.0% |
| Multidisciplinary Studies | 0 | 0.0% |
| Science & Technology | 13 | 19.7% |
| Business | 8 | 12.1% |
| Education | 15 | 22.7% |
| Literature & Languages | 6 | 9.1% |
| Liberal Arts & History | 2 | 3.0% |
| Visual & Performing Arts | 4 | 6.1% |
| Communications | 2 | 3.0% |
| Arts & Humanities | 8 | 12.1% |
| Total | 66 | 100.0% |
Transportation & Commute in Saybrook
Vehicle Availability by Sex in Saybrook
The most prevalent vehicle ownership categories in Saybrook are males with 3 vehicles (63, accounting for 45.7%) and females with 3 vehicles (50, making up 45.0%).
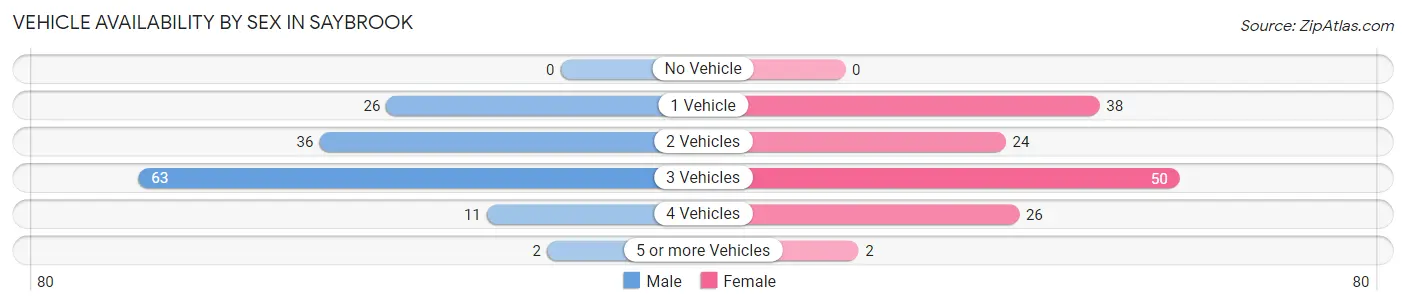
| Vehicles Available | Male | Female |
| No Vehicle | 0 (0.0%) | 0 (0.0%) |
| 1 Vehicle | 26 (18.8%) | 38 (27.1%) |
| 2 Vehicles | 36 (26.1%) | 24 (17.1%) |
| 3 Vehicles | 63 (45.7%) | 50 (35.7%) |
| 4 Vehicles | 11 (8.0%) | 26 (18.6%) |
| 5 or more Vehicles | 2 (1.5%) | 2 (1.4%) |
| Total | 138 (100.0%) | 140 (100.0%) |
Commute Time in Saybrook
The most frequently occuring commute durations in Saybrook are 45 to 59 minutes (72 commuters, 29.4%), 40 to 44 minutes (30 commuters, 12.2%), and 15 to 19 minutes (29 commuters, 11.8%).
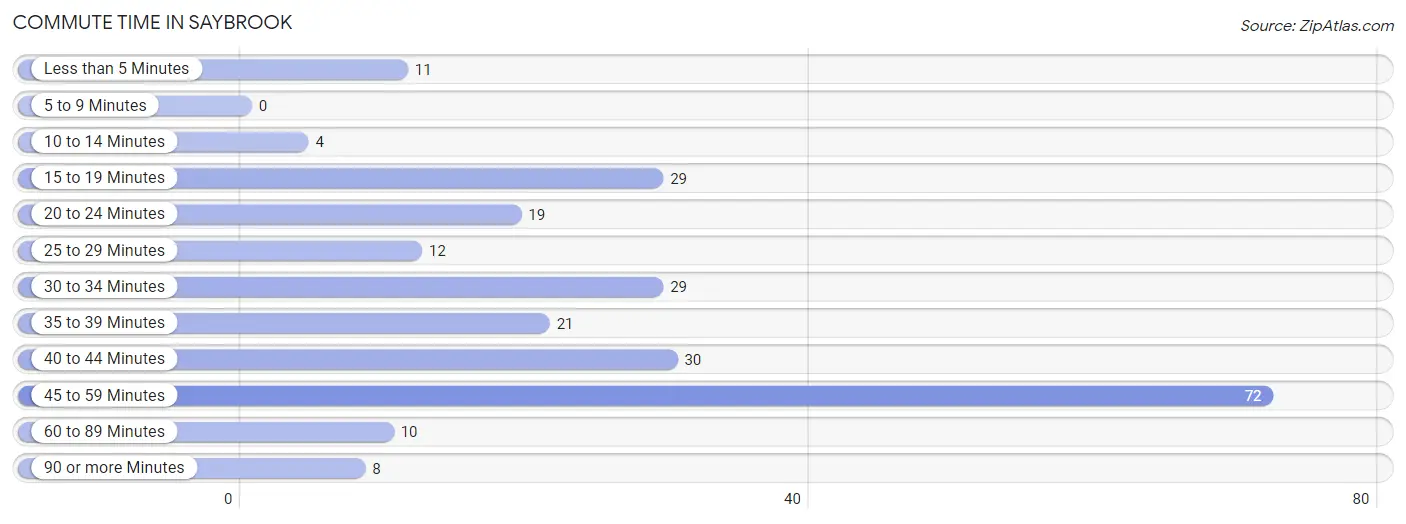
| Commute Time | # Commuters | % Commuters |
| Less than 5 Minutes | 11 | 4.5% |
| 5 to 9 Minutes | 0 | 0.0% |
| 10 to 14 Minutes | 4 | 1.6% |
| 15 to 19 Minutes | 29 | 11.8% |
| 20 to 24 Minutes | 19 | 7.8% |
| 25 to 29 Minutes | 12 | 4.9% |
| 30 to 34 Minutes | 29 | 11.8% |
| 35 to 39 Minutes | 21 | 8.6% |
| 40 to 44 Minutes | 30 | 12.2% |
| 45 to 59 Minutes | 72 | 29.4% |
| 60 to 89 Minutes | 10 | 4.1% |
| 90 or more Minutes | 8 | 3.3% |
Commute Time by Sex in Saybrook
The most common commute times in Saybrook are 45 to 59 minutes (41 commuters, 33.1%) for males and 45 to 59 minutes (31 commuters, 25.6%) for females.
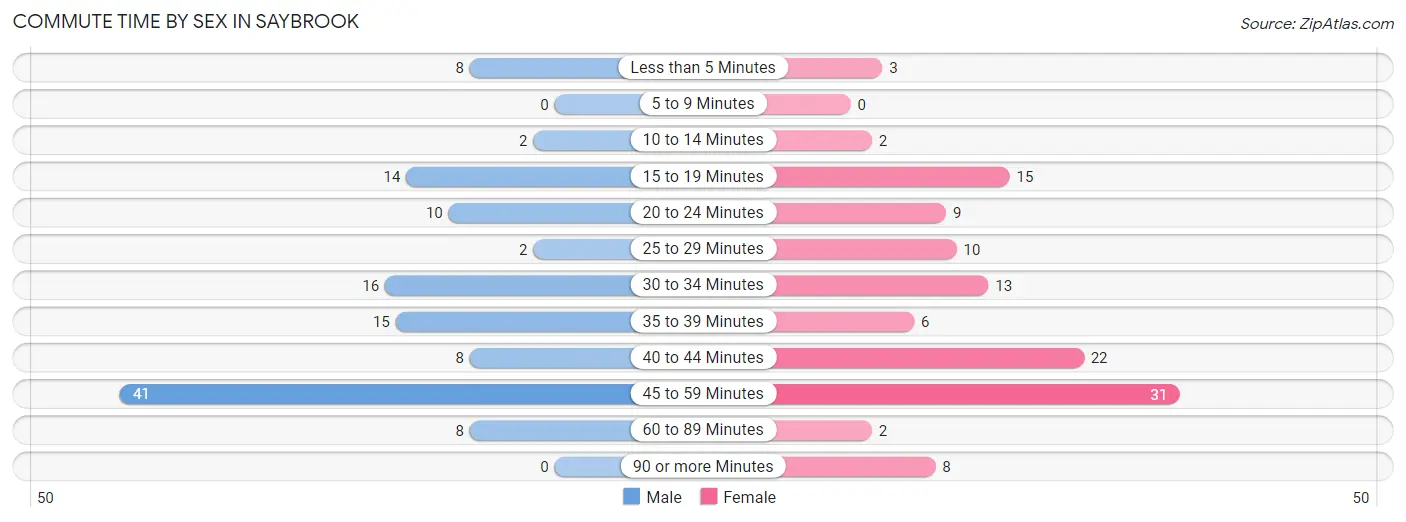
| Commute Time | Male | Female |
| Less than 5 Minutes | 8 (6.5%) | 3 (2.5%) |
| 5 to 9 Minutes | 0 (0.0%) | 0 (0.0%) |
| 10 to 14 Minutes | 2 (1.6%) | 2 (1.7%) |
| 15 to 19 Minutes | 14 (11.3%) | 15 (12.4%) |
| 20 to 24 Minutes | 10 (8.1%) | 9 (7.4%) |
| 25 to 29 Minutes | 2 (1.6%) | 10 (8.3%) |
| 30 to 34 Minutes | 16 (12.9%) | 13 (10.7%) |
| 35 to 39 Minutes | 15 (12.1%) | 6 (5.0%) |
| 40 to 44 Minutes | 8 (6.5%) | 22 (18.2%) |
| 45 to 59 Minutes | 41 (33.1%) | 31 (25.6%) |
| 60 to 89 Minutes | 8 (6.5%) | 2 (1.7%) |
| 90 or more Minutes | 0 (0.0%) | 8 (6.6%) |
Time of Departure to Work by Sex in Saybrook
The most frequent times of departure to work in Saybrook are 12:00 AM to 4:59 AM (33, 26.6%) for males and 6:00 AM to 6:29 AM (25, 20.7%) for females.
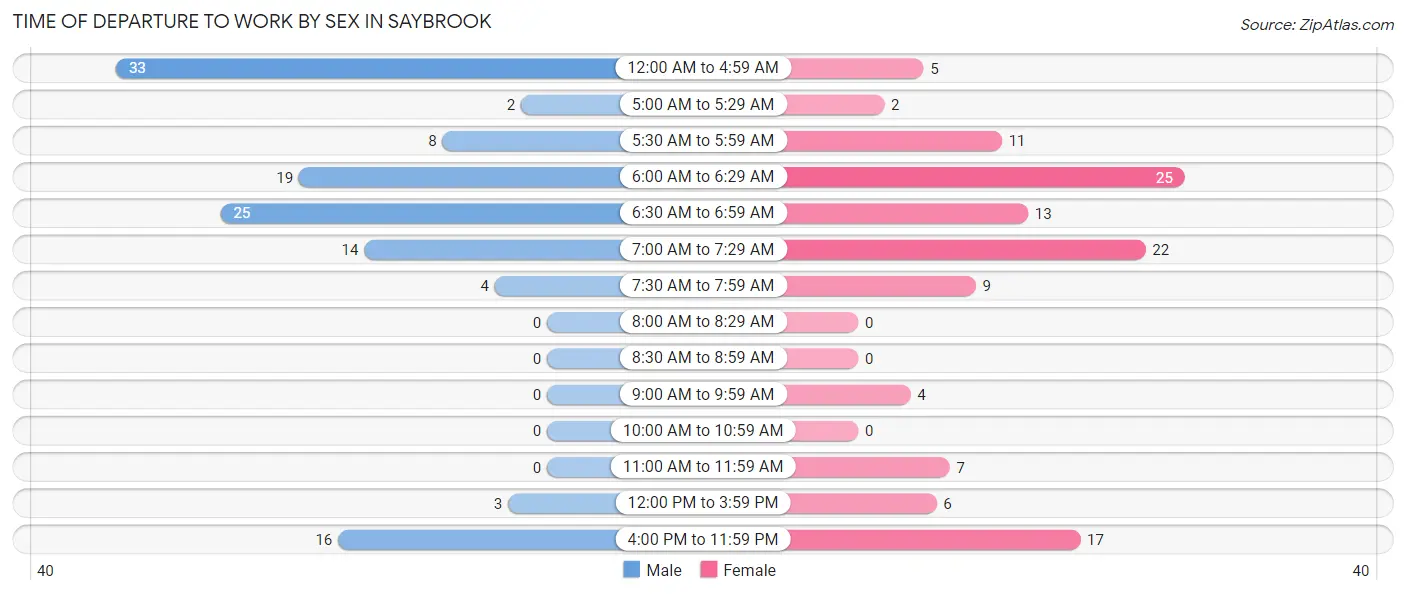
| Time of Departure | Male | Female |
| 12:00 AM to 4:59 AM | 33 (26.6%) | 5 (4.1%) |
| 5:00 AM to 5:29 AM | 2 (1.6%) | 2 (1.7%) |
| 5:30 AM to 5:59 AM | 8 (6.5%) | 11 (9.1%) |
| 6:00 AM to 6:29 AM | 19 (15.3%) | 25 (20.7%) |
| 6:30 AM to 6:59 AM | 25 (20.2%) | 13 (10.7%) |
| 7:00 AM to 7:29 AM | 14 (11.3%) | 22 (18.2%) |
| 7:30 AM to 7:59 AM | 4 (3.2%) | 9 (7.4%) |
| 8:00 AM to 8:29 AM | 0 (0.0%) | 0 (0.0%) |
| 8:30 AM to 8:59 AM | 0 (0.0%) | 0 (0.0%) |
| 9:00 AM to 9:59 AM | 0 (0.0%) | 4 (3.3%) |
| 10:00 AM to 10:59 AM | 0 (0.0%) | 0 (0.0%) |
| 11:00 AM to 11:59 AM | 0 (0.0%) | 7 (5.8%) |
| 12:00 PM to 3:59 PM | 3 (2.4%) | 6 (5.0%) |
| 4:00 PM to 11:59 PM | 16 (12.9%) | 17 (14.1%) |
| Total | 124 (100.0%) | 121 (100.0%) |
Housing Occupancy in Saybrook
Occupancy by Ownership in Saybrook
Of the total 281 dwellings in Saybrook, owner-occupied units account for 241 (85.8%), while renter-occupied units make up 40 (14.2%).
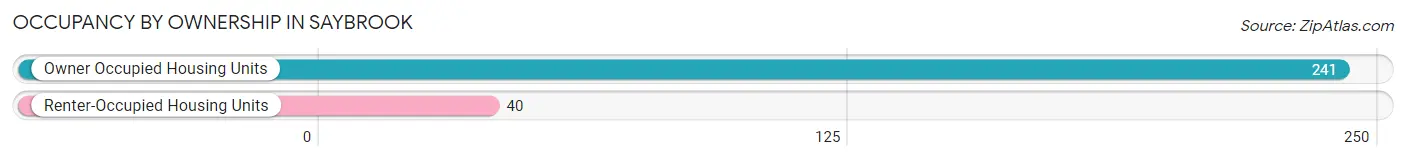
| Occupancy | # Housing Units | % Housing Units |
| Owner Occupied Housing Units | 241 | 85.8% |
| Renter-Occupied Housing Units | 40 | 14.2% |
| Total Occupied Housing Units | 281 | 100.0% |
Occupancy by Household Size in Saybrook
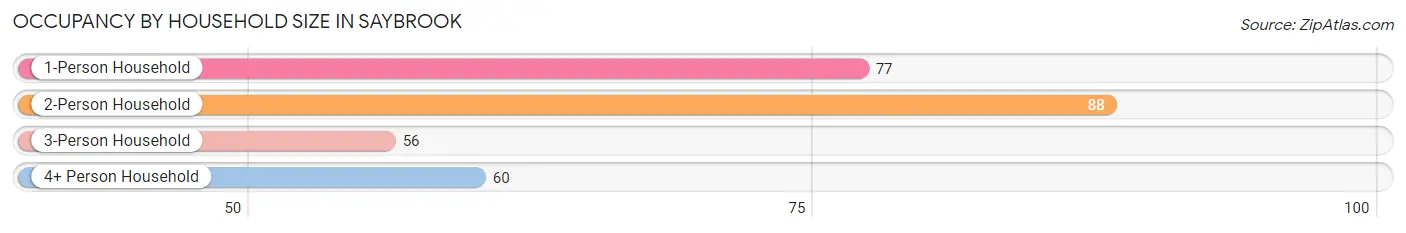
| Household Size | # Housing Units | % Housing Units |
| 1-Person Household | 77 | 27.4% |
| 2-Person Household | 88 | 31.3% |
| 3-Person Household | 56 | 19.9% |
| 4+ Person Household | 60 | 21.3% |
| Total Housing Units | 281 | 100.0% |
Occupancy by Ownership by Household Size in Saybrook
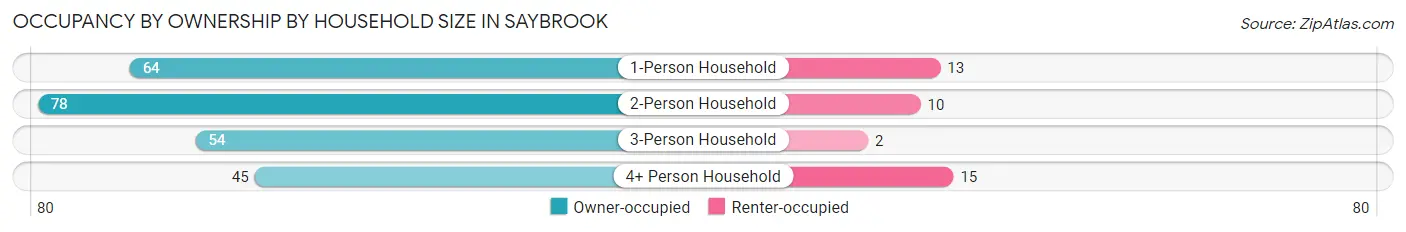
| Household Size | Owner-occupied | Renter-occupied |
| 1-Person Household | 64 (83.1%) | 13 (16.9%) |
| 2-Person Household | 78 (88.6%) | 10 (11.4%) |
| 3-Person Household | 54 (96.4%) | 2 (3.6%) |
| 4+ Person Household | 45 (75.0%) | 15 (25.0%) |
| Total Housing Units | 241 (85.8%) | 40 (14.2%) |
Occupancy by Educational Attainment in Saybrook
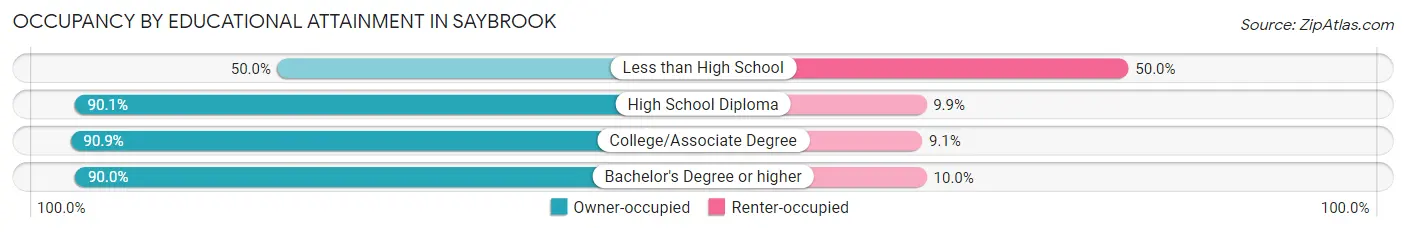
| Household Size | Owner-occupied | Renter-occupied |
| Less than High School | 16 (50.0%) | 16 (50.0%) |
| High School Diploma | 109 (90.1%) | 12 (9.9%) |
| College/Associate Degree | 80 (90.9%) | 8 (9.1%) |
| Bachelor's Degree or higher | 36 (90.0%) | 4 (10.0%) |
Occupancy by Age of Householder in Saybrook
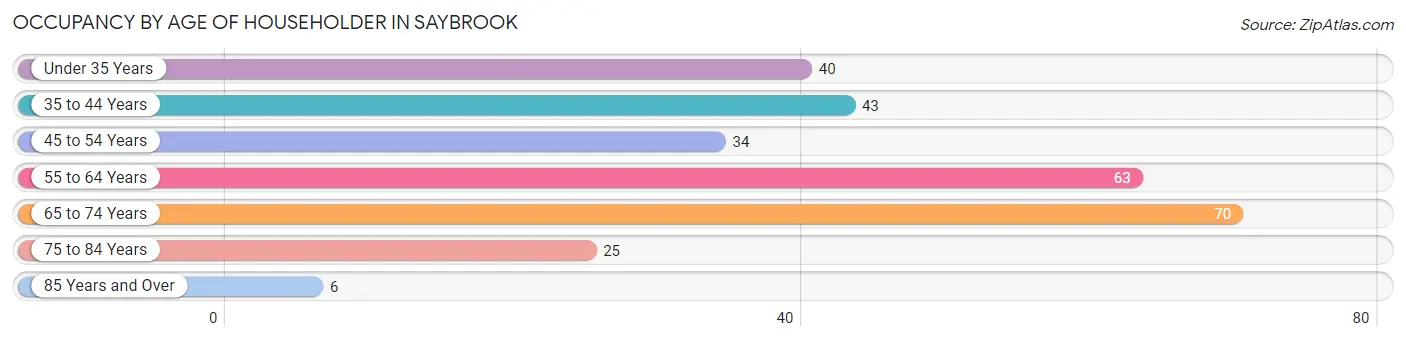
| Age Bracket | # Households | % Households |
| Under 35 Years | 40 | 14.2% |
| 35 to 44 Years | 43 | 15.3% |
| 45 to 54 Years | 34 | 12.1% |
| 55 to 64 Years | 63 | 22.4% |
| 65 to 74 Years | 70 | 24.9% |
| 75 to 84 Years | 25 | 8.9% |
| 85 Years and Over | 6 | 2.1% |
| Total | 281 | 100.0% |
Housing Finances in Saybrook
Median Income by Occupancy in Saybrook
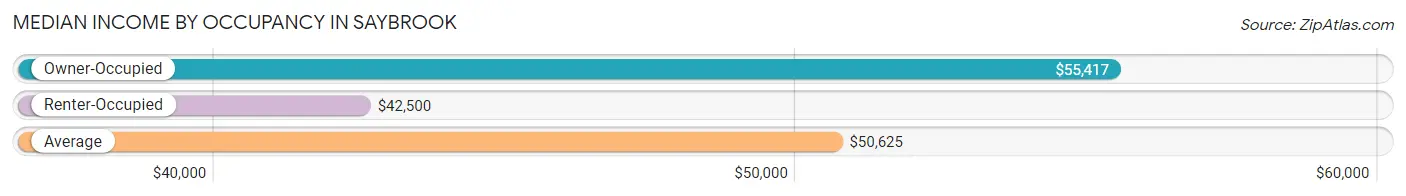
| Occupancy Type | # Households | Median Income |
| Owner-Occupied | 241 (85.8%) | $55,417 |
| Renter-Occupied | 40 (14.2%) | $42,500 |
| Average | 281 (100.0%) | $50,625 |
Occupancy by Householder Income Bracket in Saybrook
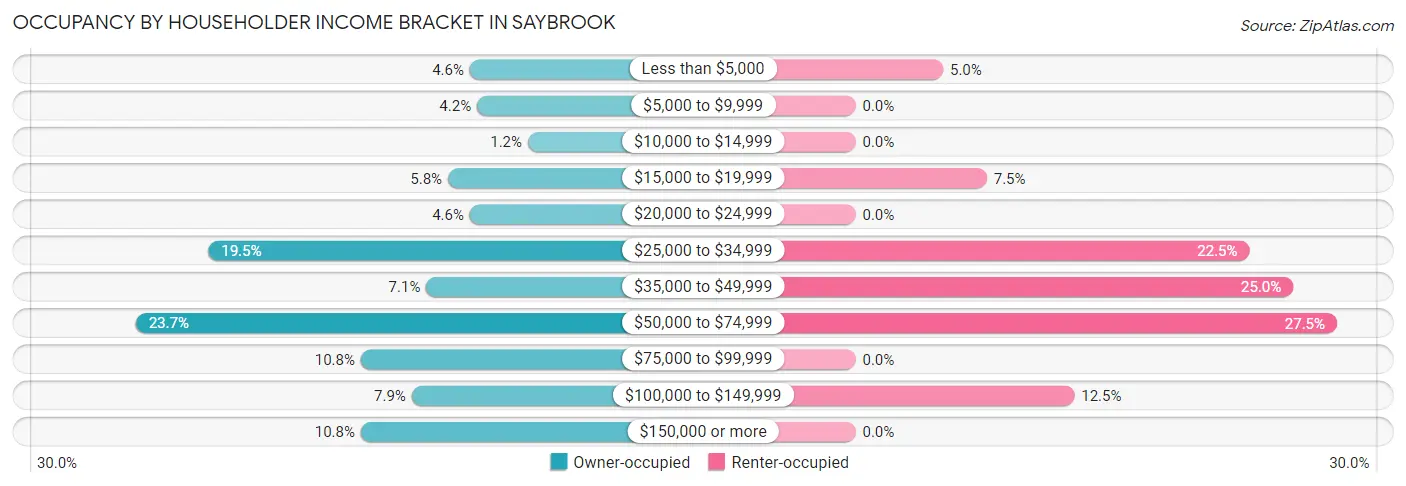
| Income Bracket | Owner-occupied | Renter-occupied |
| Less than $5,000 | 11 (4.6%) | 2 (5.0%) |
| $5,000 to $9,999 | 10 (4.2%) | 0 (0.0%) |
| $10,000 to $14,999 | 3 (1.2%) | 0 (0.0%) |
| $15,000 to $19,999 | 14 (5.8%) | 3 (7.5%) |
| $20,000 to $24,999 | 11 (4.6%) | 0 (0.0%) |
| $25,000 to $34,999 | 47 (19.5%) | 9 (22.5%) |
| $35,000 to $49,999 | 17 (7.0%) | 10 (25.0%) |
| $50,000 to $74,999 | 57 (23.6%) | 11 (27.5%) |
| $75,000 to $99,999 | 26 (10.8%) | 0 (0.0%) |
| $100,000 to $149,999 | 19 (7.9%) | 5 (12.5%) |
| $150,000 or more | 26 (10.8%) | 0 (0.0%) |
| Total | 241 (100.0%) | 40 (100.0%) |
Monthly Housing Cost Tiers in Saybrook
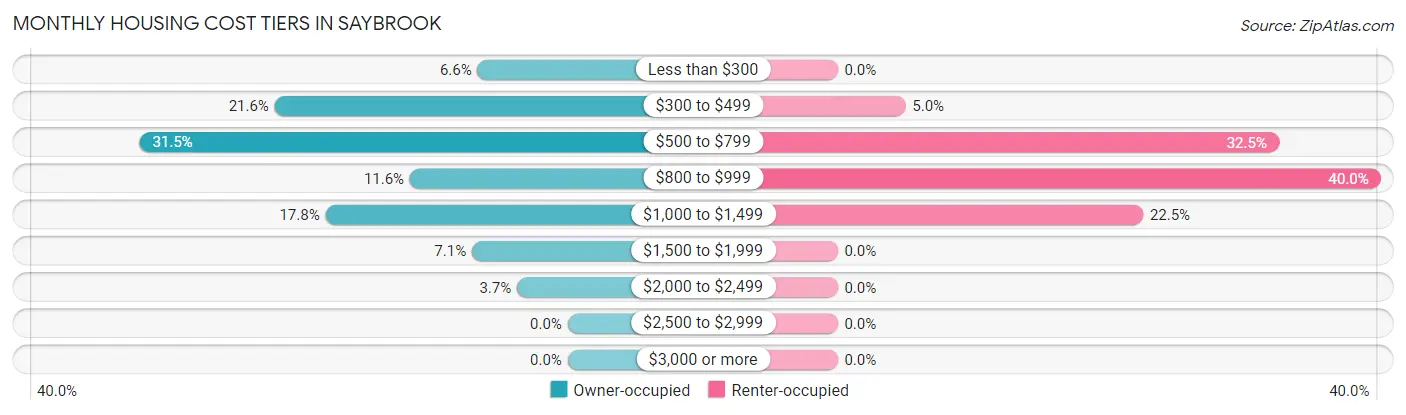
| Monthly Cost | Owner-occupied | Renter-occupied |
| Less than $300 | 16 (6.6%) | 0 (0.0%) |
| $300 to $499 | 52 (21.6%) | 2 (5.0%) |
| $500 to $799 | 76 (31.5%) | 13 (32.5%) |
| $800 to $999 | 28 (11.6%) | 16 (40.0%) |
| $1,000 to $1,499 | 43 (17.8%) | 9 (22.5%) |
| $1,500 to $1,999 | 17 (7.0%) | 0 (0.0%) |
| $2,000 to $2,499 | 9 (3.7%) | 0 (0.0%) |
| $2,500 to $2,999 | 0 (0.0%) | 0 (0.0%) |
| $3,000 or more | 0 (0.0%) | 0 (0.0%) |
| Total | 241 (100.0%) | 40 (100.0%) |
Physical Housing Characteristics in Saybrook
Housing Structures in Saybrook
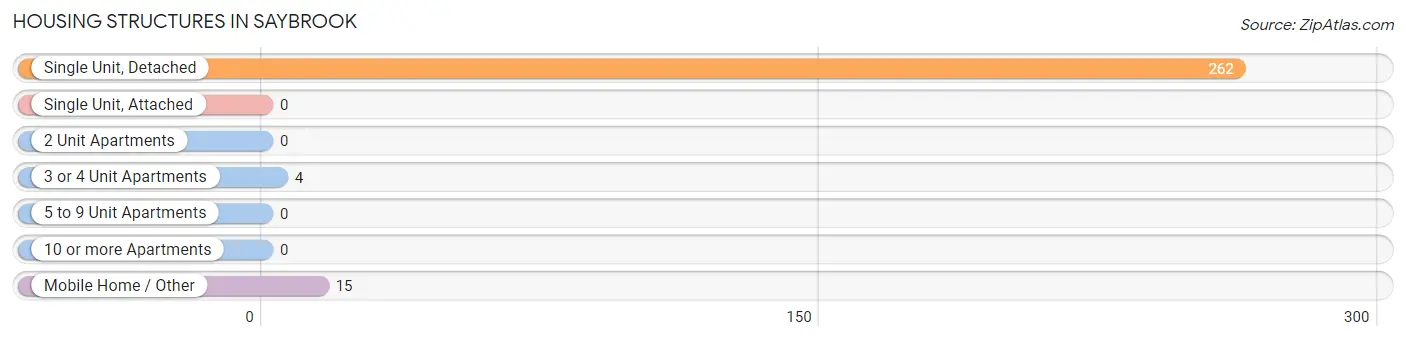
| Structure Type | # Housing Units | % Housing Units |
| Single Unit, Detached | 262 | 93.2% |
| Single Unit, Attached | 0 | 0.0% |
| 2 Unit Apartments | 0 | 0.0% |
| 3 or 4 Unit Apartments | 4 | 1.4% |
| 5 to 9 Unit Apartments | 0 | 0.0% |
| 10 or more Apartments | 0 | 0.0% |
| Mobile Home / Other | 15 | 5.3% |
| Total | 281 | 100.0% |
Housing Structures by Occupancy in Saybrook
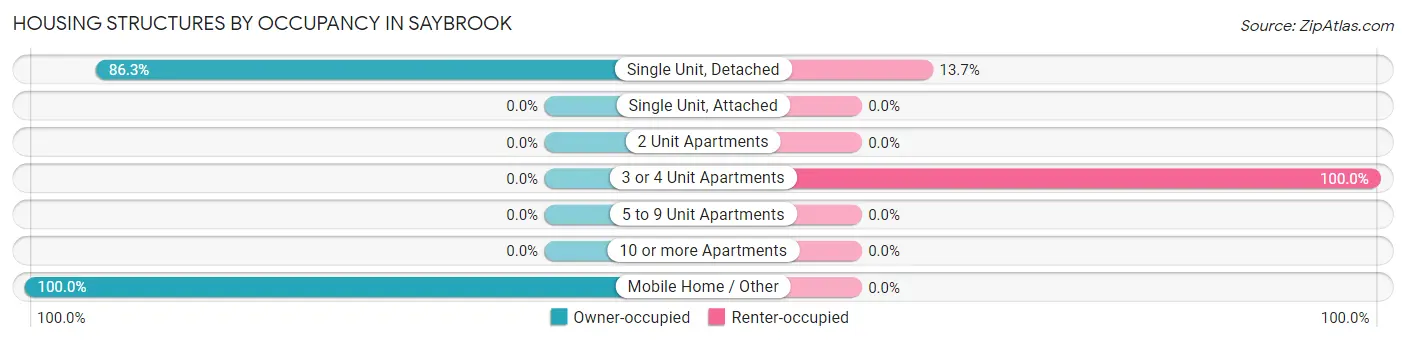
| Structure Type | Owner-occupied | Renter-occupied |
| Single Unit, Detached | 226 (86.3%) | 36 (13.7%) |
| Single Unit, Attached | 0 (0.0%) | 0 (0.0%) |
| 2 Unit Apartments | 0 (0.0%) | 0 (0.0%) |
| 3 or 4 Unit Apartments | 0 (0.0%) | 4 (100.0%) |
| 5 to 9 Unit Apartments | 0 (0.0%) | 0 (0.0%) |
| 10 or more Apartments | 0 (0.0%) | 0 (0.0%) |
| Mobile Home / Other | 15 (100.0%) | 0 (0.0%) |
| Total | 241 (85.8%) | 40 (14.2%) |
Housing Structures by Number of Rooms in Saybrook
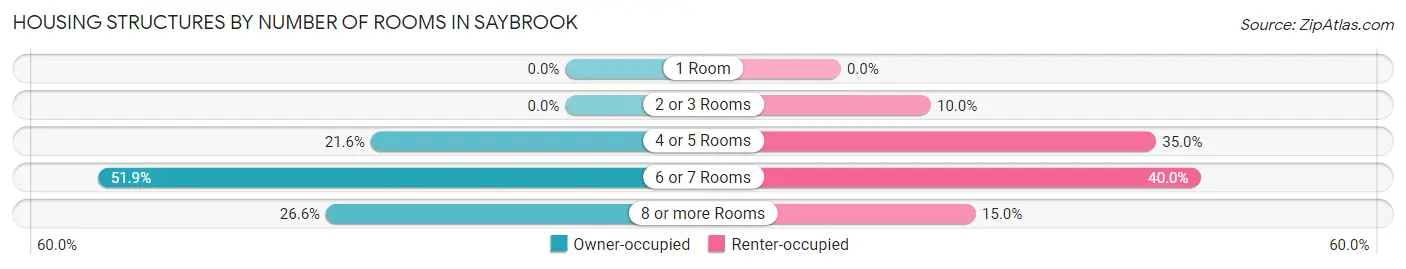
| Number of Rooms | Owner-occupied | Renter-occupied |
| 1 Room | 0 (0.0%) | 0 (0.0%) |
| 2 or 3 Rooms | 0 (0.0%) | 4 (10.0%) |
| 4 or 5 Rooms | 52 (21.6%) | 14 (35.0%) |
| 6 or 7 Rooms | 125 (51.9%) | 16 (40.0%) |
| 8 or more Rooms | 64 (26.6%) | 6 (15.0%) |
| Total | 241 (100.0%) | 40 (100.0%) |
Housing Structure by Heating Type in Saybrook
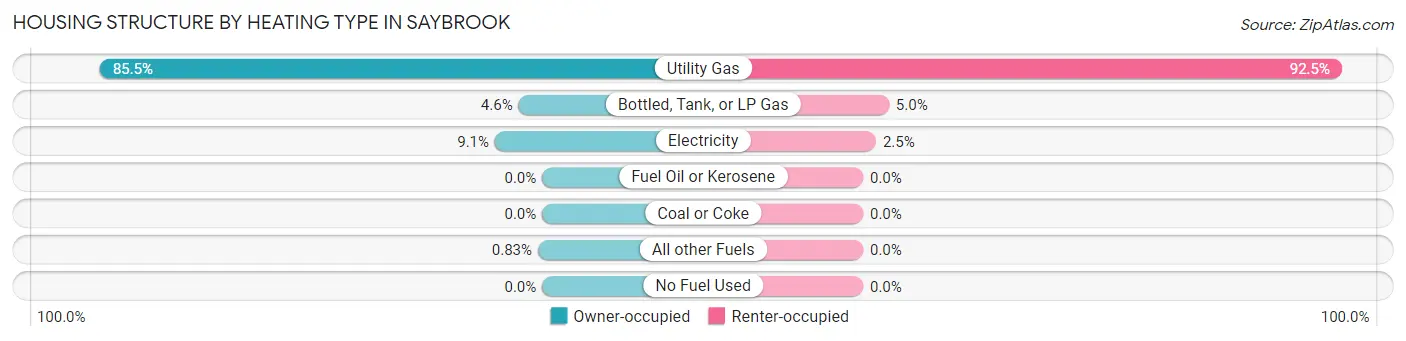
| Heating Type | Owner-occupied | Renter-occupied |
| Utility Gas | 206 (85.5%) | 37 (92.5%) |
| Bottled, Tank, or LP Gas | 11 (4.6%) | 2 (5.0%) |
| Electricity | 22 (9.1%) | 1 (2.5%) |
| Fuel Oil or Kerosene | 0 (0.0%) | 0 (0.0%) |
| Coal or Coke | 0 (0.0%) | 0 (0.0%) |
| All other Fuels | 2 (0.8%) | 0 (0.0%) |
| No Fuel Used | 0 (0.0%) | 0 (0.0%) |
| Total | 241 (100.0%) | 40 (100.0%) |
Household Vehicle Usage in Saybrook
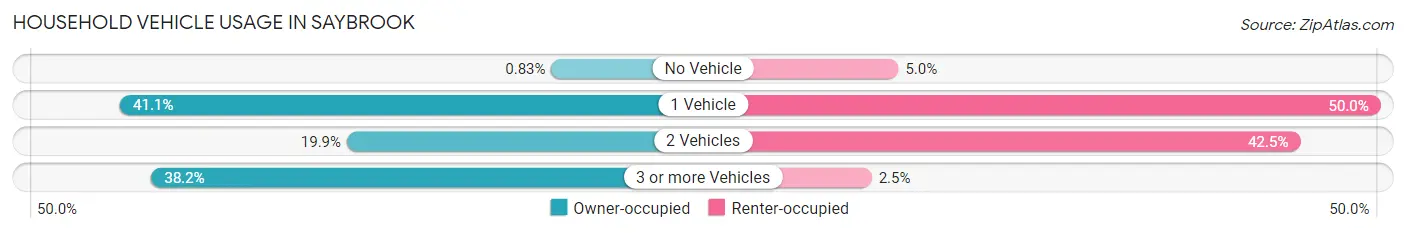
| Vehicles per Household | Owner-occupied | Renter-occupied |
| No Vehicle | 2 (0.8%) | 2 (5.0%) |
| 1 Vehicle | 99 (41.1%) | 20 (50.0%) |
| 2 Vehicles | 48 (19.9%) | 17 (42.5%) |
| 3 or more Vehicles | 92 (38.2%) | 1 (2.5%) |
| Total | 241 (100.0%) | 40 (100.0%) |
Real Estate & Mortgages in Saybrook
Real Estate and Mortgage Overview in Saybrook
| Characteristic | Without Mortgage | With Mortgage |
| Housing Units | 97 | 144 |
| Median Property Value | $71,000 | $106,500 |
| Median Household Income | $51,250 | $24 |
| Monthly Housing Costs | $422 | $0 |
| Real Estate Taxes | $1,662 | $11 |
Property Value by Mortgage Status in Saybrook
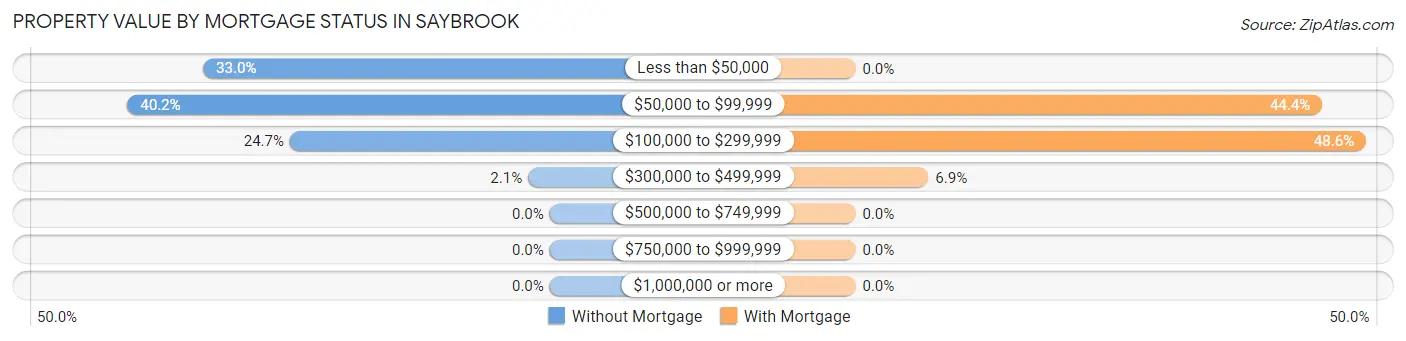
| Property Value | Without Mortgage | With Mortgage |
| Less than $50,000 | 32 (33.0%) | 0 (0.0%) |
| $50,000 to $99,999 | 39 (40.2%) | 64 (44.4%) |
| $100,000 to $299,999 | 24 (24.7%) | 70 (48.6%) |
| $300,000 to $499,999 | 2 (2.1%) | 10 (6.9%) |
| $500,000 to $749,999 | 0 (0.0%) | 0 (0.0%) |
| $750,000 to $999,999 | 0 (0.0%) | 0 (0.0%) |
| $1,000,000 or more | 0 (0.0%) | 0 (0.0%) |
| Total | 97 (100.0%) | 144 (100.0%) |
Household Income by Mortgage Status in Saybrook
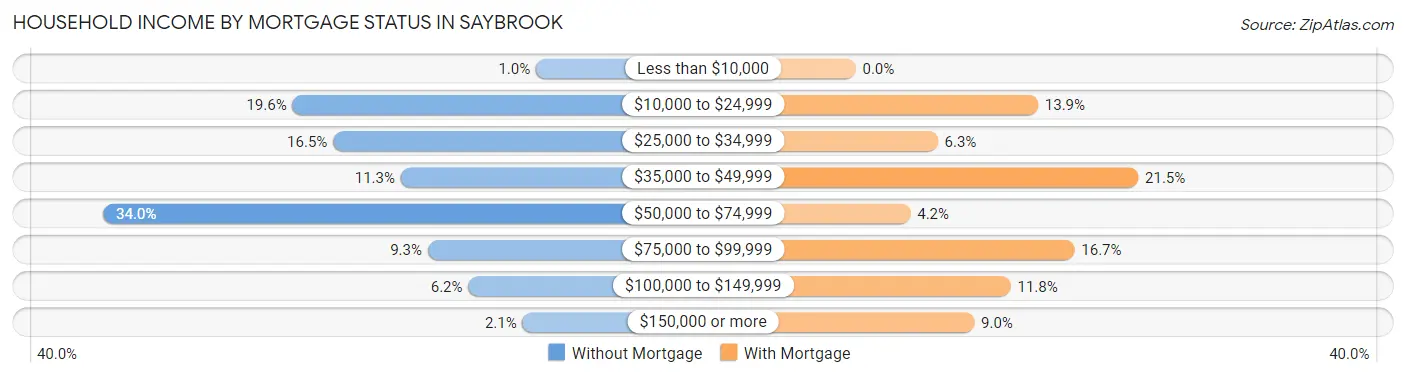
| Household Income | Without Mortgage | With Mortgage |
| Less than $10,000 | 1 (1.0%) | 0 (0.0%) |
| $10,000 to $24,999 | 19 (19.6%) | 20 (13.9%) |
| $25,000 to $34,999 | 16 (16.5%) | 9 (6.2%) |
| $35,000 to $49,999 | 11 (11.3%) | 31 (21.5%) |
| $50,000 to $74,999 | 33 (34.0%) | 6 (4.2%) |
| $75,000 to $99,999 | 9 (9.3%) | 24 (16.7%) |
| $100,000 to $149,999 | 6 (6.2%) | 17 (11.8%) |
| $150,000 or more | 2 (2.1%) | 13 (9.0%) |
| Total | 97 (100.0%) | 144 (100.0%) |
Property Value to Household Income Ratio in Saybrook
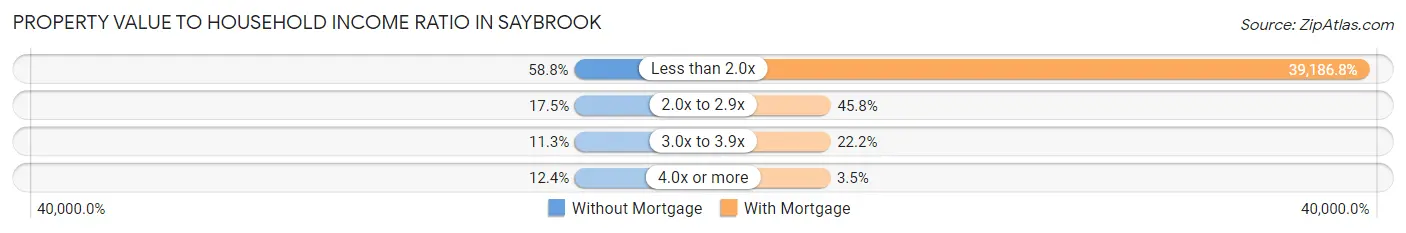
| Value-to-Income Ratio | Without Mortgage | With Mortgage |
| Less than 2.0x | 57 (58.8%) | 56,429 (39,186.8%) |
| 2.0x to 2.9x | 17 (17.5%) | 66 (45.8%) |
| 3.0x to 3.9x | 11 (11.3%) | 32 (22.2%) |
| 4.0x or more | 12 (12.4%) | 5 (3.5%) |
| Total | 97 (100.0%) | 144 (100.0%) |
Real Estate Taxes by Mortgage Status in Saybrook
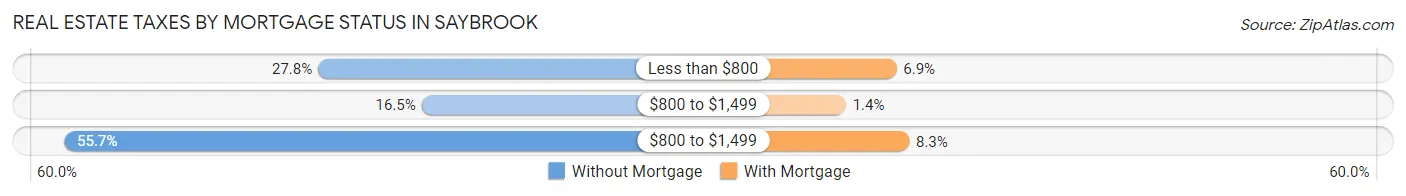
| Property Taxes | Without Mortgage | With Mortgage |
| Less than $800 | 27 (27.8%) | 10 (6.9%) |
| $800 to $1,499 | 16 (16.5%) | 2 (1.4%) |
| $800 to $1,499 | 54 (55.7%) | 12 (8.3%) |
| Total | 97 (100.0%) | 144 (100.0%) |
Health & Disability in Saybrook
Health Insurance Coverage by Age in Saybrook
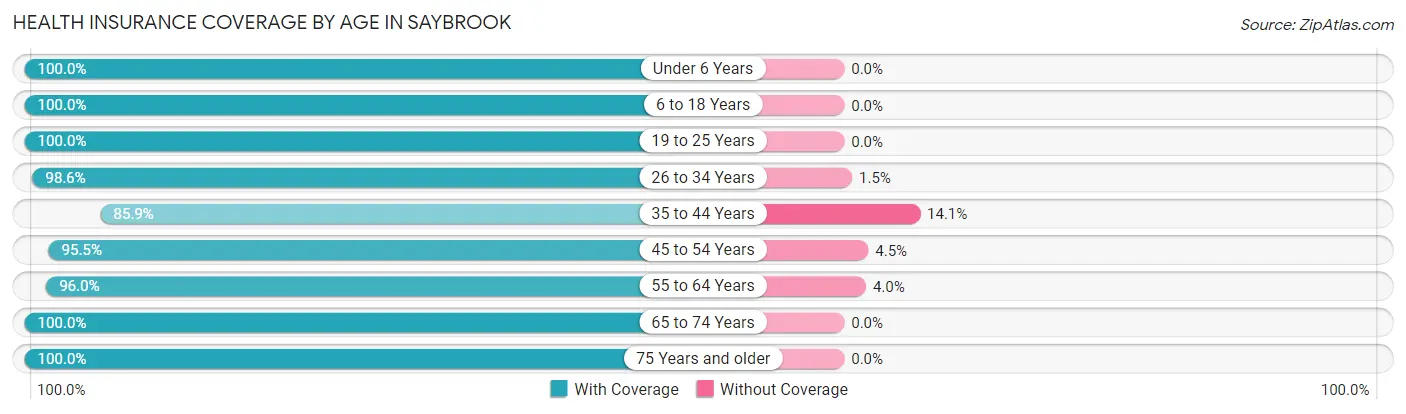
| Age Bracket | With Coverage | Without Coverage |
| Under 6 Years | 65 (100.0%) | 0 (0.0%) |
| 6 to 18 Years | 158 (100.0%) | 0 (0.0%) |
| 19 to 25 Years | 26 (100.0%) | 0 (0.0%) |
| 26 to 34 Years | 68 (98.6%) | 1 (1.5%) |
| 35 to 44 Years | 85 (85.9%) | 14 (14.1%) |
| 45 to 54 Years | 64 (95.5%) | 3 (4.5%) |
| 55 to 64 Years | 95 (96.0%) | 4 (4.0%) |
| 65 to 74 Years | 105 (100.0%) | 0 (0.0%) |
| 75 Years and older | 46 (100.0%) | 0 (0.0%) |
| Total | 712 (97.0%) | 22 (3.0%) |
Health Insurance Coverage by Citizenship Status in Saybrook
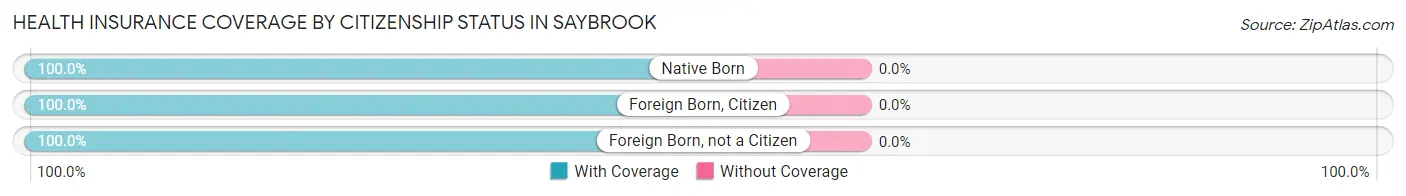
| Citizenship Status | With Coverage | Without Coverage |
| Native Born | 65 (100.0%) | 0 (0.0%) |
| Foreign Born, Citizen | 158 (100.0%) | 0 (0.0%) |
| Foreign Born, not a Citizen | 26 (100.0%) | 0 (0.0%) |
Health Insurance Coverage by Household Income in Saybrook
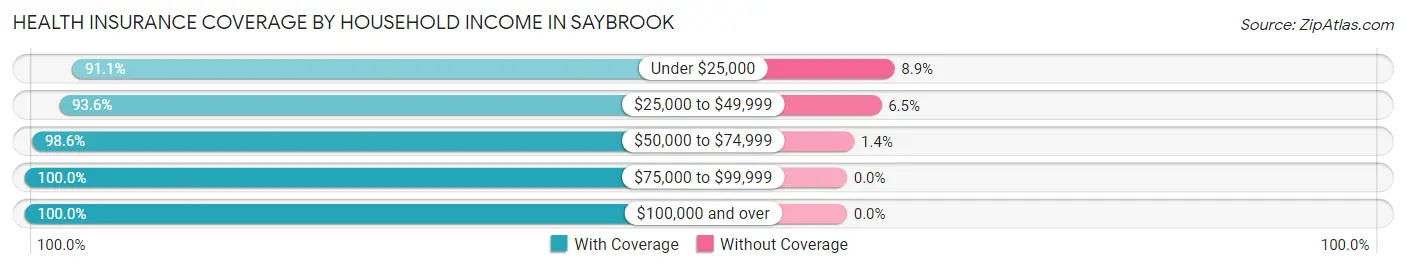
| Household Income | With Coverage | Without Coverage |
| Under $25,000 | 92 (91.1%) | 9 (8.9%) |
| $25,000 to $49,999 | 145 (93.5%) | 10 (6.5%) |
| $50,000 to $74,999 | 215 (98.6%) | 3 (1.4%) |
| $75,000 to $99,999 | 92 (100.0%) | 0 (0.0%) |
| $100,000 and over | 168 (100.0%) | 0 (0.0%) |
Public vs Private Health Insurance Coverage by Age in Saybrook
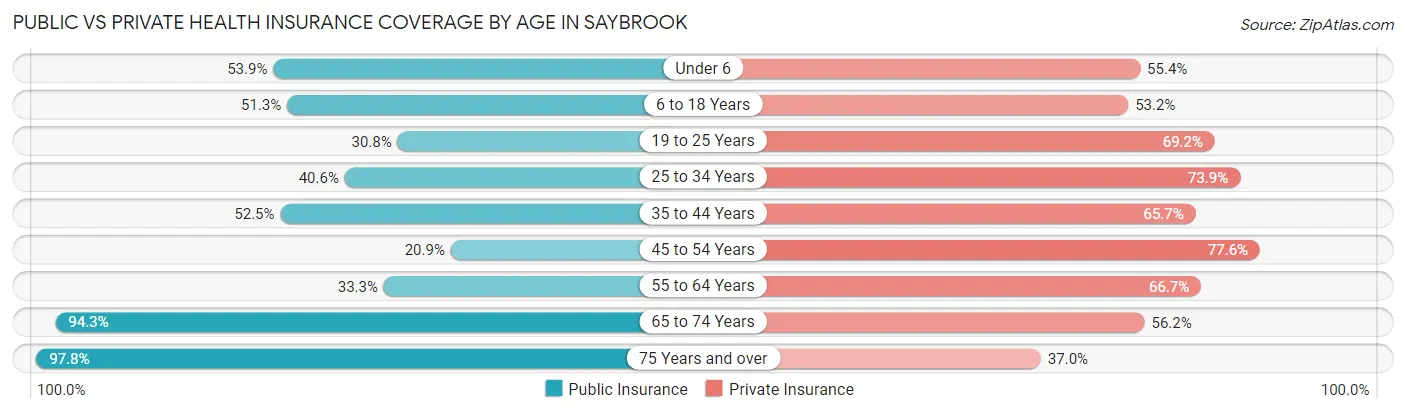
| Age Bracket | Public Insurance | Private Insurance |
| Under 6 | 35 (53.8%) | 36 (55.4%) |
| 6 to 18 Years | 81 (51.3%) | 84 (53.2%) |
| 19 to 25 Years | 8 (30.8%) | 18 (69.2%) |
| 25 to 34 Years | 28 (40.6%) | 51 (73.9%) |
| 35 to 44 Years | 52 (52.5%) | 65 (65.7%) |
| 45 to 54 Years | 14 (20.9%) | 52 (77.6%) |
| 55 to 64 Years | 33 (33.3%) | 66 (66.7%) |
| 65 to 74 Years | 99 (94.3%) | 59 (56.2%) |
| 75 Years and over | 45 (97.8%) | 17 (37.0%) |
| Total | 395 (53.8%) | 448 (61.0%) |
Disability Status by Sex by Age in Saybrook
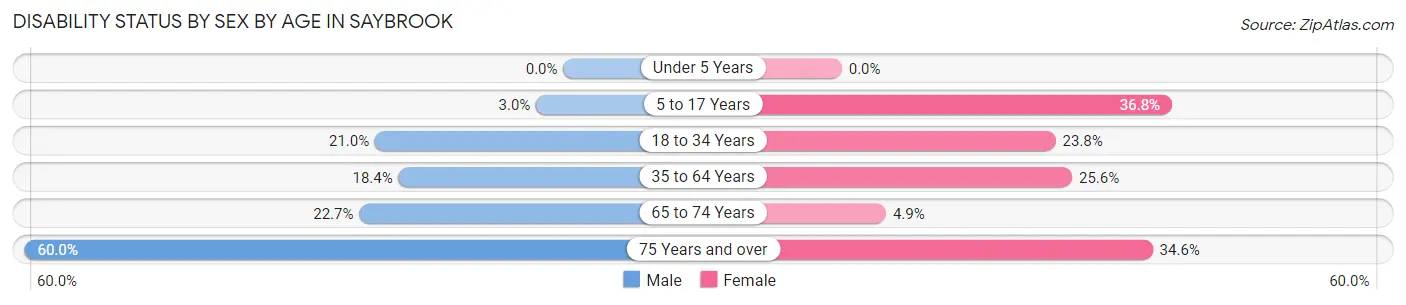
| Age Bracket | Male | Female |
| Under 5 Years | 0 (0.0%) | 0 (0.0%) |
| 5 to 17 Years | 3 (3.0%) | 25 (36.8%) |
| 18 to 34 Years | 13 (21.0%) | 10 (23.8%) |
| 35 to 64 Years | 20 (18.3%) | 40 (25.6%) |
| 65 to 74 Years | 10 (22.7%) | 3 (4.9%) |
| 75 Years and over | 12 (60.0%) | 9 (34.6%) |
Disability Class by Sex by Age in Saybrook
Disability Class: Hearing Difficulty
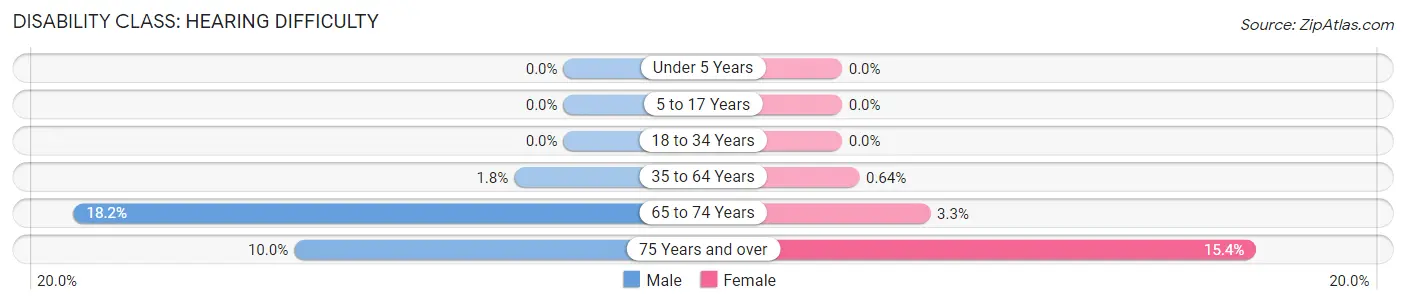
| Age Bracket | Male | Female |
| Under 5 Years | 0 (0.0%) | 0 (0.0%) |
| 5 to 17 Years | 0 (0.0%) | 0 (0.0%) |
| 18 to 34 Years | 0 (0.0%) | 0 (0.0%) |
| 35 to 64 Years | 2 (1.8%) | 1 (0.6%) |
| 65 to 74 Years | 8 (18.2%) | 2 (3.3%) |
| 75 Years and over | 2 (10.0%) | 4 (15.4%) |
Disability Class: Vision Difficulty
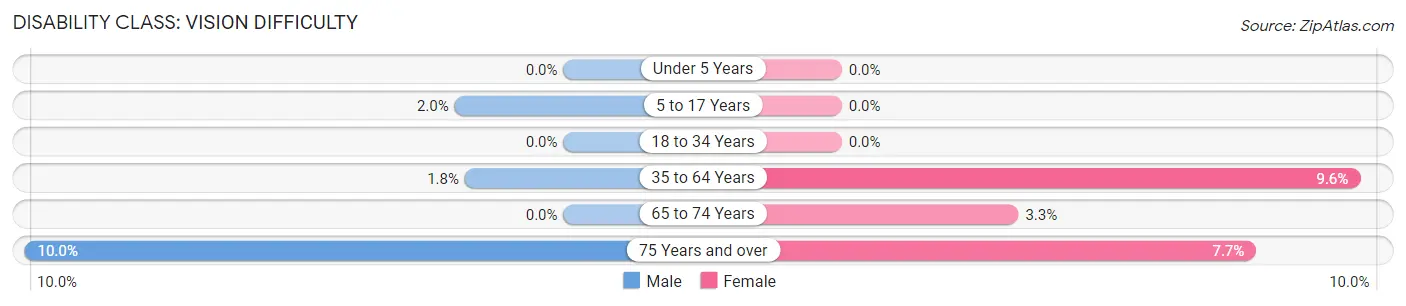
| Age Bracket | Male | Female |
| Under 5 Years | 0 (0.0%) | 0 (0.0%) |
| 5 to 17 Years | 2 (2.0%) | 0 (0.0%) |
| 18 to 34 Years | 0 (0.0%) | 0 (0.0%) |
| 35 to 64 Years | 2 (1.8%) | 15 (9.6%) |
| 65 to 74 Years | 0 (0.0%) | 2 (3.3%) |
| 75 Years and over | 2 (10.0%) | 2 (7.7%) |
Disability Class: Cognitive Difficulty
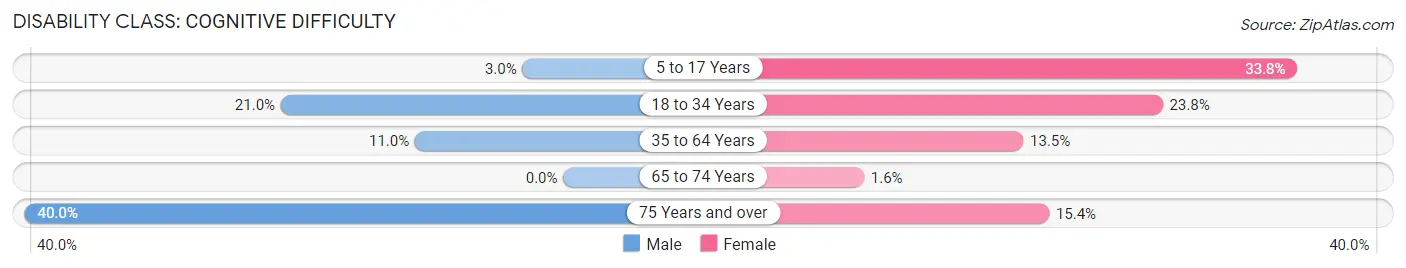
| Age Bracket | Male | Female |
| 5 to 17 Years | 3 (3.0%) | 23 (33.8%) |
| 18 to 34 Years | 13 (21.0%) | 10 (23.8%) |
| 35 to 64 Years | 12 (11.0%) | 21 (13.5%) |
| 65 to 74 Years | 0 (0.0%) | 1 (1.6%) |
| 75 Years and over | 8 (40.0%) | 4 (15.4%) |
Disability Class: Ambulatory Difficulty
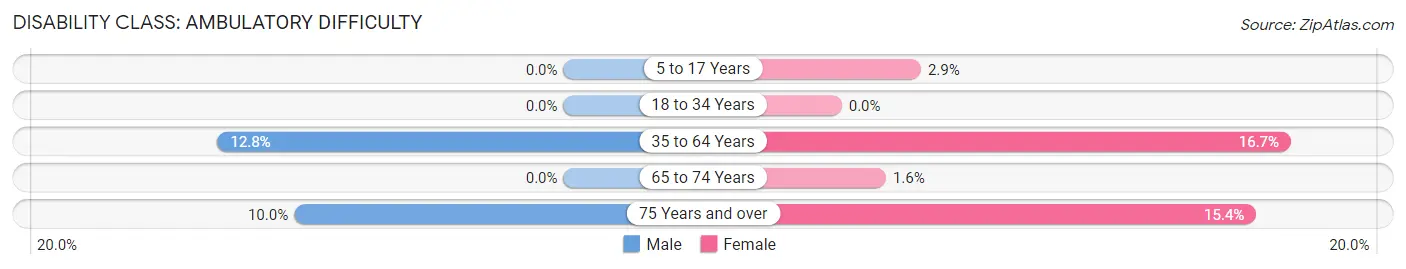
| Age Bracket | Male | Female |
| 5 to 17 Years | 0 (0.0%) | 2 (2.9%) |
| 18 to 34 Years | 0 (0.0%) | 0 (0.0%) |
| 35 to 64 Years | 14 (12.8%) | 26 (16.7%) |
| 65 to 74 Years | 0 (0.0%) | 1 (1.6%) |
| 75 Years and over | 2 (10.0%) | 4 (15.4%) |
Disability Class: Self-Care Difficulty
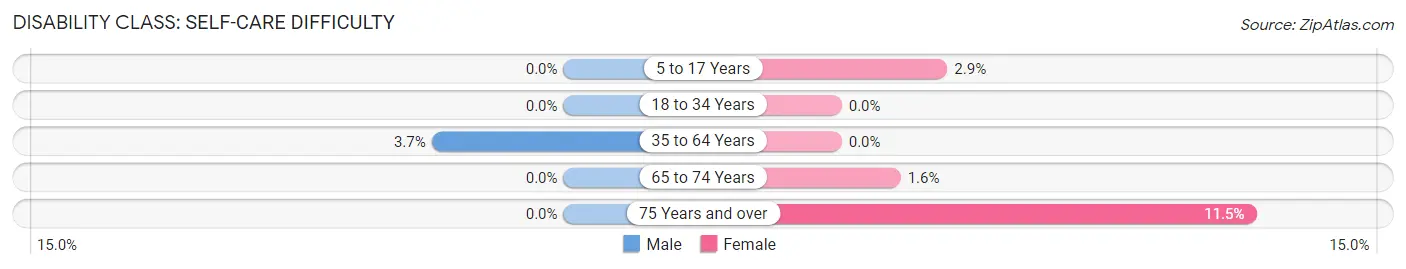
| Age Bracket | Male | Female |
| 5 to 17 Years | 0 (0.0%) | 2 (2.9%) |
| 18 to 34 Years | 0 (0.0%) | 0 (0.0%) |
| 35 to 64 Years | 4 (3.7%) | 0 (0.0%) |
| 65 to 74 Years | 0 (0.0%) | 1 (1.6%) |
| 75 Years and over | 0 (0.0%) | 3 (11.5%) |
Technology Access in Saybrook
Computing Device Access in Saybrook
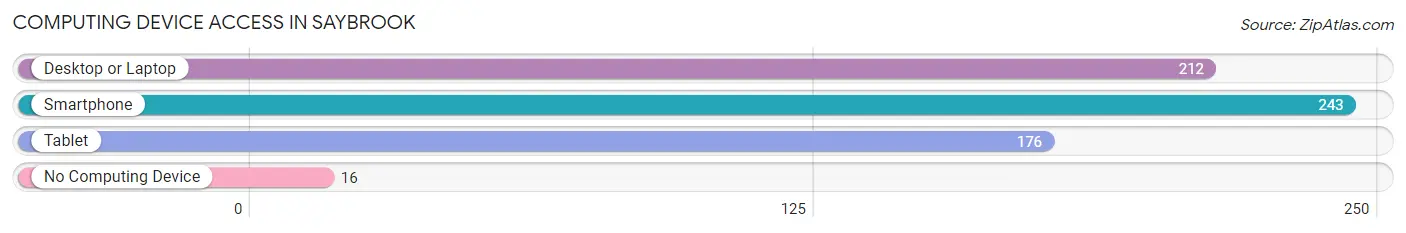
| Device Type | # Households | % Households |
| Desktop or Laptop | 212 | 75.4% |
| Smartphone | 243 | 86.5% |
| Tablet | 176 | 62.6% |
| No Computing Device | 16 | 5.7% |
| Total | 281 | 100.0% |
Internet Access in Saybrook
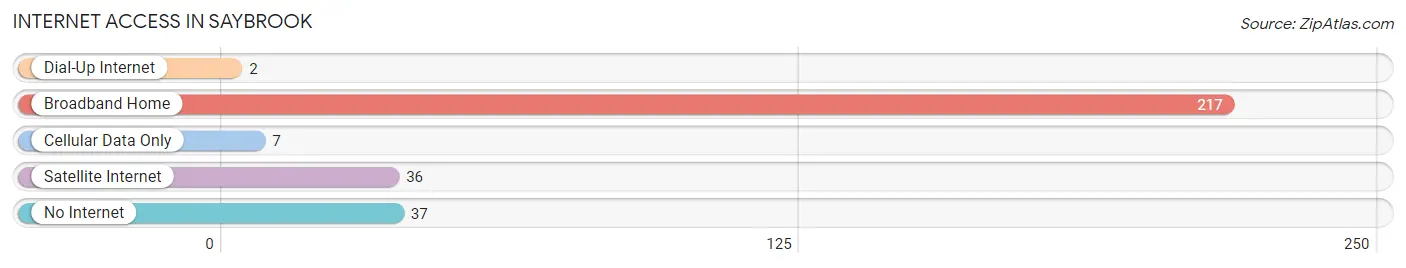
| Internet Type | # Households | % Households |
| Dial-Up Internet | 2 | 0.7% |
| Broadband Home | 217 | 77.2% |
| Cellular Data Only | 7 | 2.5% |
| Satellite Internet | 36 | 12.8% |
| No Internet | 37 | 13.2% |
| Total | 281 | 100.0% |
Saybrook Summary
History
Saybrook, Illinois is a small village located in McLean County, Illinois. It is situated on the banks of the Sangamon River, about 10 miles south of Bloomington. The village was founded in 1854 by a group of settlers from Saybrook, Connecticut. The settlers named the village after their hometown in Connecticut.
The first settlers in Saybrook were mostly farmers, and the village quickly grew to become a thriving agricultural community. The village was incorporated in 1872, and the first mayor was elected in 1873.
In the late 19th century, Saybrook was a bustling community with a variety of businesses, including a flour mill, a sawmill, a blacksmith shop, a general store, and a hotel. The village also had a post office, a school, and a church.
In the early 20th century, Saybrook experienced a period of growth and prosperity. The village was connected to the outside world by the Chicago and Alton Railroad, which ran through the village. This allowed for the transportation of goods and people to and from Saybrook.
The village also experienced a period of decline in the mid-20th century. The railroad was abandoned in the 1950s, and the village’s population began to decline. By the 1970s, the village had become a small, quiet community.
Geography
Saybrook is located in McLean County, Illinois, about 10 miles south of Bloomington. The village is situated on the banks of the Sangamon River. The village is surrounded by farmland and is located in a rural area.
The village has a total area of 0.6 square miles, all of which is land. The village is located at an elevation of 690 feet above sea level.
Economy
The economy of Saybrook is largely based on agriculture. The village is surrounded by farmland, and many of the residents are involved in farming. The village also has a few small businesses, including a general store and a restaurant.
The village is also home to a few small manufacturing companies. These companies produce a variety of products, including furniture, clothing, and automotive parts.
Demographics
As of the 2010 census, the population of Saybrook was 1,093. The village has a population density of 1,817 people per square mile. The median age of the village is 44.7 years.
The racial makeup of the village is 97.3% White, 0.7% African American, 0.2% Native American, 0.2% Asian, 0.2% from other races, and 1.6% from two or more races.
The median household income in Saybrook is $50,938. The per capita income is $21,945. About 8.3% of the population is below the poverty line.
Conclusion
Saybrook, Illinois is a small village located in McLean County, Illinois. It was founded in 1854 by a group of settlers from Saybrook, Connecticut. The village has a population of 1,093 and is largely an agricultural community. The village has a few small businesses, and the economy is largely based on agriculture. The median household income in Saybrook is $50,938, and the per capita income is $21,945.
Common Questions
What is Per Capita Income in Saybrook?
Per Capita income in Saybrook is $23,484.
What is the Median Family Income in Saybrook?
Median Family Income in Saybrook is $59,318.
What is the Median Household income in Saybrook?
Median Household Income in Saybrook is $50,625.
What is Income or Wage Gap in Saybrook?
Income or Wage Gap in Saybrook is 7.1%.
Women in Saybrook earn 92.9 cents for every dollar earned by a man.
What is Inequality or Gini Index in Saybrook?
Inequality or Gini Index in Saybrook is 0.42.
What is the Total Population of Saybrook?
Total Population of Saybrook is 734.
What is the Total Male Population of Saybrook?
Total Male Population of Saybrook is 359.
What is the Total Female Population of Saybrook?
Total Female Population of Saybrook is 375.
What is the Ratio of Males per 100 Females in Saybrook?
There are 95.73 Males per 100 Females in Saybrook.
What is the Ratio of Females per 100 Males in Saybrook?
There are 104.46 Females per 100 Males in Saybrook.
What is the Median Population Age in Saybrook?
Median Population Age in Saybrook is 37.9 Years.
What is the Average Family Size in Saybrook
Average Family Size in Saybrook is 3.2 People.
What is the Average Household Size in Saybrook
Average Household Size in Saybrook is 2.6 People.
How Large is the Labor Force in Saybrook?
There are 287 People in the Labor Forcein in Saybrook.
What is the Percentage of People in the Labor Force in Saybrook?
52.1% of People are in the Labor Force in Saybrook.
What is the Unemployment Rate in Saybrook?
Unemployment Rate in Saybrook is 3.1%.