Sandoval, IL Map & Demographics
Sandoval Map
Sandoval Overview
$22,610
PER CAPITA INCOME
$43,021
AVG FAMILY INCOME
$50,148
AVG HOUSEHOLD INCOME
55.8%
WAGE / INCOME GAP [ % ]
44.2¢/ $1
WAGE / INCOME GAP [ $ ]
0.37
INEQUALITY / GINI INDEX
982
TOTAL POPULATION
502
MALE POPULATION
480
FEMALE POPULATION
104.58
MALES / 100 FEMALES
95.62
FEMALES / 100 MALES
37.8
MEDIAN AGE
3.0
AVG FAMILY SIZE
2.4
AVG HOUSEHOLD SIZE
385
LABOR FORCE [ PEOPLE ]
47.1%
PERCENT IN LABOR FORCE
8.8%
UNEMPLOYMENT RATE
Sandoval Zip Codes
Sandoval Area Codes
Income in Sandoval
Income Overview in Sandoval
Per Capita Income in Sandoval is $22,610, while median incomes of families and households are $43,021 and $50,148 respectively.
| Characteristic | Number | Measure |
| Per Capita Income | 982 | $22,610 |
| Median Family Income | 231 | $43,021 |
| Mean Family Income | 231 | $58,873 |
| Median Household Income | 405 | $50,148 |
| Mean Household Income | 405 | $53,910 |
| Income Deficit | 231 | $0 |
| Wage / Income Gap (%) | 982 | 55.76% |
| Wage / Income Gap ($) | 982 | 44.24¢ per $1 |
| Gini / Inequality Index | 982 | 0.37 |
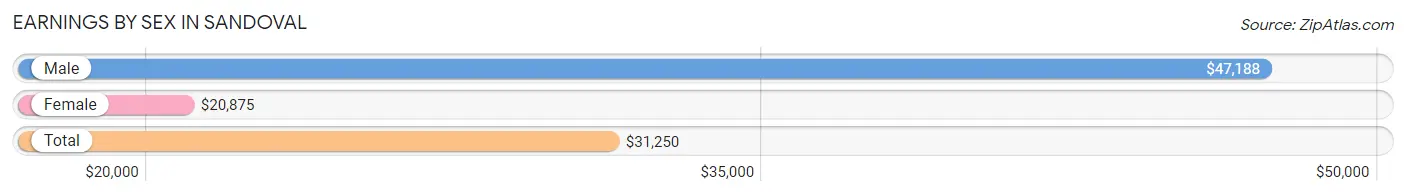
Earnings by Sex in Sandoval
Average Earnings in Sandoval are $31,250, $47,188 for men and $20,875 for women, a difference of 55.8%.
| Sex | Number | Average Earnings |
| Male | 221 (55.0%) | $47,188 |
| Female | 181 (45.0%) | $20,875 |
| Total | 402 (100.0%) | $31,250 |
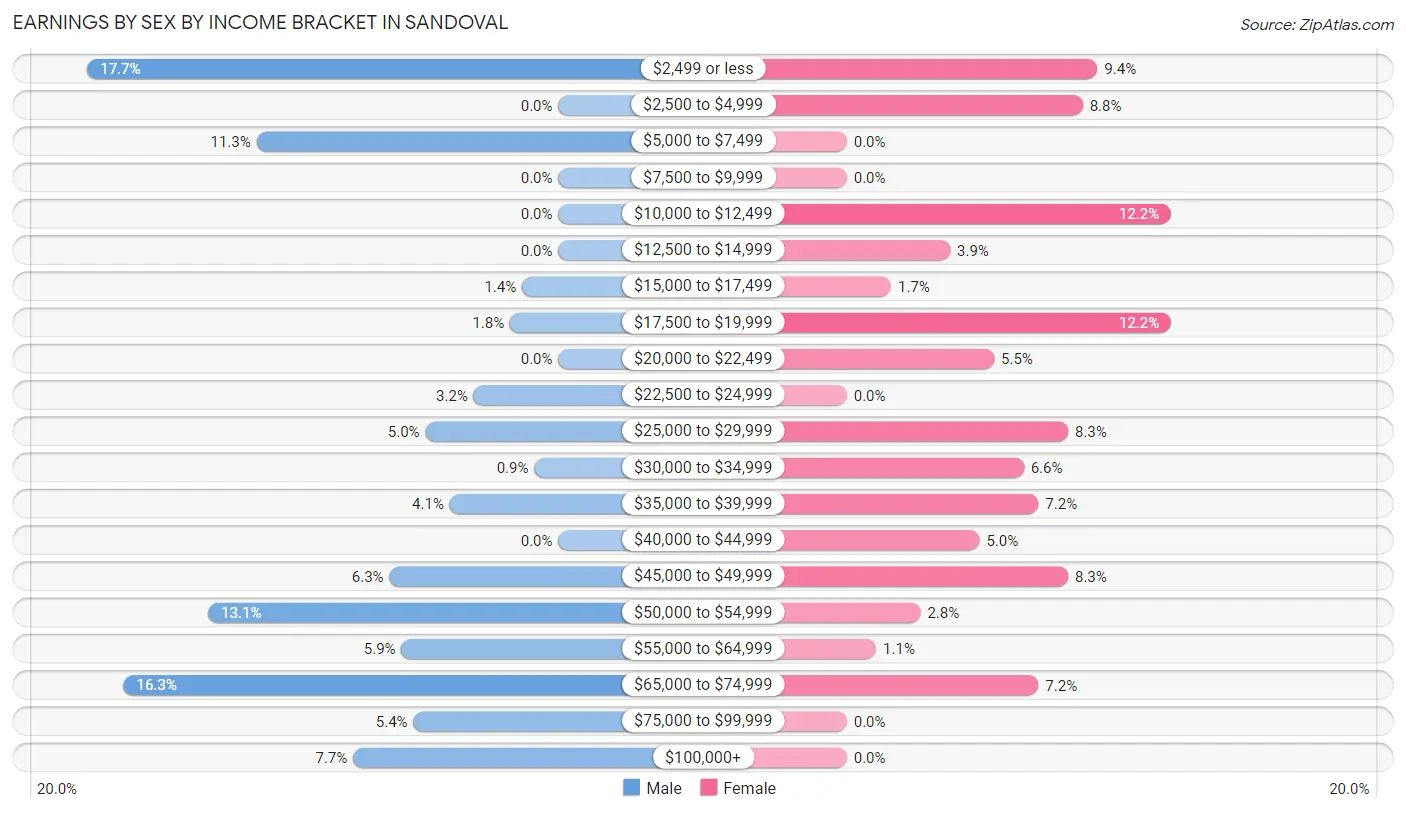
Earnings by Sex by Income Bracket in Sandoval
The most common earnings brackets in Sandoval are $2,499 or less for men (39 | 17.6%) and $10,000 to $12,499 for women (22 | 12.1%).
| Income | Male | Female |
| $2,499 or less | 39 (17.6%) | 17 (9.4%) |
| $2,500 to $4,999 | 0 (0.0%) | 16 (8.8%) |
| $5,000 to $7,499 | 25 (11.3%) | 0 (0.0%) |
| $7,500 to $9,999 | 0 (0.0%) | 0 (0.0%) |
| $10,000 to $12,499 | 0 (0.0%) | 22 (12.1%) |
| $12,500 to $14,999 | 0 (0.0%) | 7 (3.9%) |
| $15,000 to $17,499 | 3 (1.4%) | 3 (1.7%) |
| $17,500 to $19,999 | 4 (1.8%) | 22 (12.1%) |
| $20,000 to $22,499 | 0 (0.0%) | 10 (5.5%) |
| $22,500 to $24,999 | 7 (3.2%) | 0 (0.0%) |
| $25,000 to $29,999 | 11 (5.0%) | 15 (8.3%) |
| $30,000 to $34,999 | 2 (0.9%) | 12 (6.6%) |
| $35,000 to $39,999 | 9 (4.1%) | 13 (7.2%) |
| $40,000 to $44,999 | 0 (0.0%) | 9 (5.0%) |
| $45,000 to $49,999 | 14 (6.3%) | 15 (8.3%) |
| $50,000 to $54,999 | 29 (13.1%) | 5 (2.8%) |
| $55,000 to $64,999 | 13 (5.9%) | 2 (1.1%) |
| $65,000 to $74,999 | 36 (16.3%) | 13 (7.2%) |
| $75,000 to $99,999 | 12 (5.4%) | 0 (0.0%) |
| $100,000+ | 17 (7.7%) | 0 (0.0%) |
| Total | 221 (100.0%) | 181 (100.0%) |
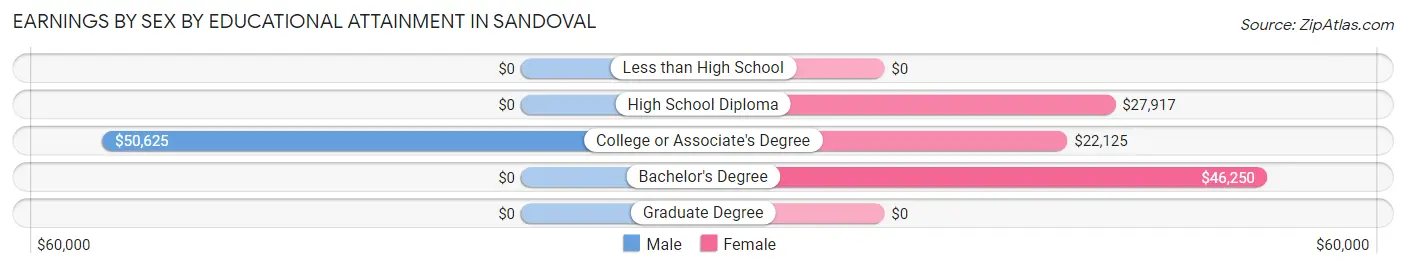
Earnings by Sex by Educational Attainment in Sandoval
Average earnings in Sandoval are $50,625 for men and $25,833 for women, a difference of 49.0%. Men with an educational attainment of college or associate's degree enjoy the highest average annual earnings of $50,625, while those with college or associate's degree education earn the least with $50,625. Women with an educational attainment of bachelor's degree earn the most with the average annual earnings of $46,250, while those with college or associate's degree education have the smallest earnings of $22,125.
| Educational Attainment | Male Income | Female Income |
| Less than High School | - | - |
| High School Diploma | - | - |
| College or Associate's Degree | $50,625 | $22,125 |
| Bachelor's Degree | - | - |
| Graduate Degree | - | - |
| Total | $50,625 | $25,833 |
Family Income in Sandoval
Family Income Brackets in Sandoval
According to the Sandoval family income data, there are 87 families falling into the $35,000 to $49,999 income range, which is the most common income bracket and makes up 37.7% of all families.
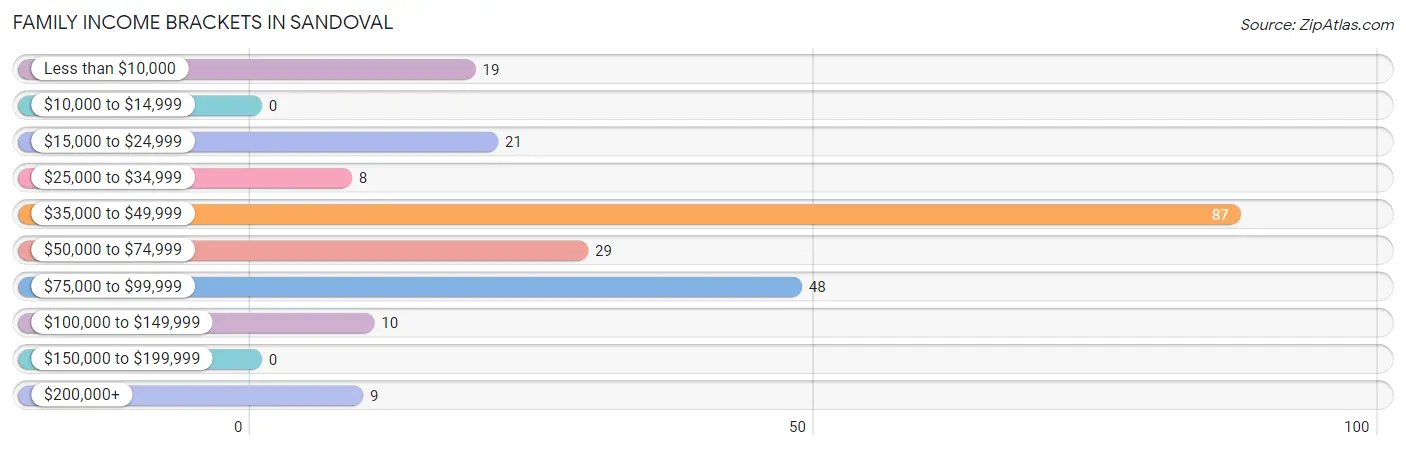
| Income Bracket | # Families | % Families |
| Less than $10,000 | 19 | 8.2% |
| $10,000 to $14,999 | 0 | 0.0% |
| $15,000 to $24,999 | 21 | 9.1% |
| $25,000 to $34,999 | 8 | 3.5% |
| $35,000 to $49,999 | 87 | 37.7% |
| $50,000 to $74,999 | 29 | 12.6% |
| $75,000 to $99,999 | 48 | 20.8% |
| $100,000 to $149,999 | 10 | 4.3% |
| $150,000 to $199,999 | 0 | 0.0% |
| $200,000+ | 9 | 3.9% |
Family Income by Famaliy Size in Sandoval
3-person families (51 | 22.1%) account for the highest median family income in Sandoval with $67,250 per family, while 2-person families (111 | 48.0%) have the highest median income of $24,188 per family member.
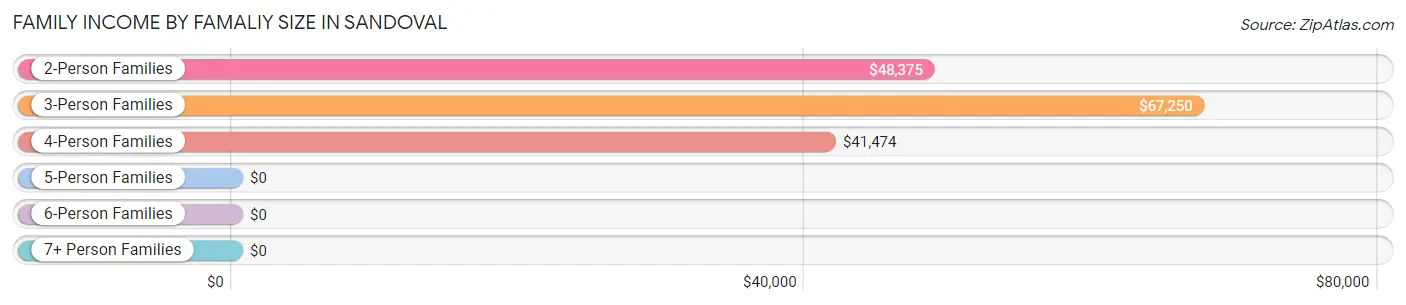
| Income Bracket | # Families | Median Income |
| 2-Person Families | 111 (48.0%) | $48,375 |
| 3-Person Families | 51 (22.1%) | $67,250 |
| 4-Person Families | 52 (22.5%) | $41,474 |
| 5-Person Families | 15 (6.5%) | $0 |
| 6-Person Families | 2 (0.9%) | $0 |
| 7+ Person Families | 0 (0.0%) | $0 |
| Total | 231 (100.0%) | $43,021 |
Family Income by Number of Earners in Sandoval
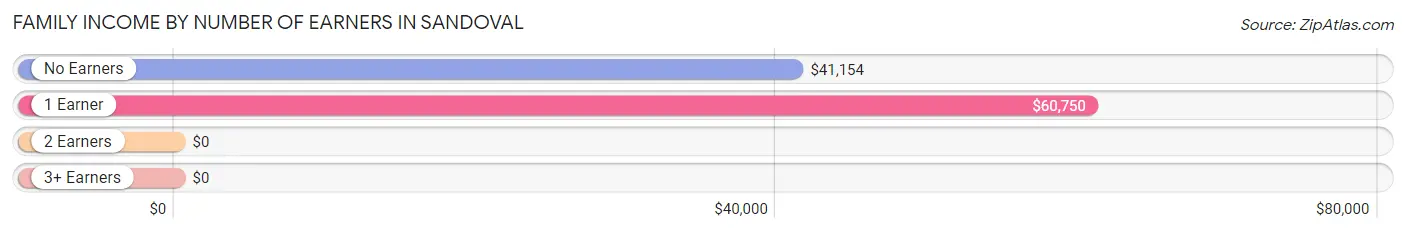
| Number of Earners | # Families | Median Income |
| No Earners | 84 (36.4%) | $41,154 |
| 1 Earner | 67 (29.0%) | $60,750 |
| 2 Earners | 59 (25.5%) | $0 |
| 3+ Earners | 21 (9.1%) | $0 |
| Total | 231 (100.0%) | $43,021 |
Household Income in Sandoval
Household Income Brackets in Sandoval
With 115 households falling in the category, the $50,000 to $74,999 income range is the most frequent in Sandoval, accounting for 28.4% of all households.
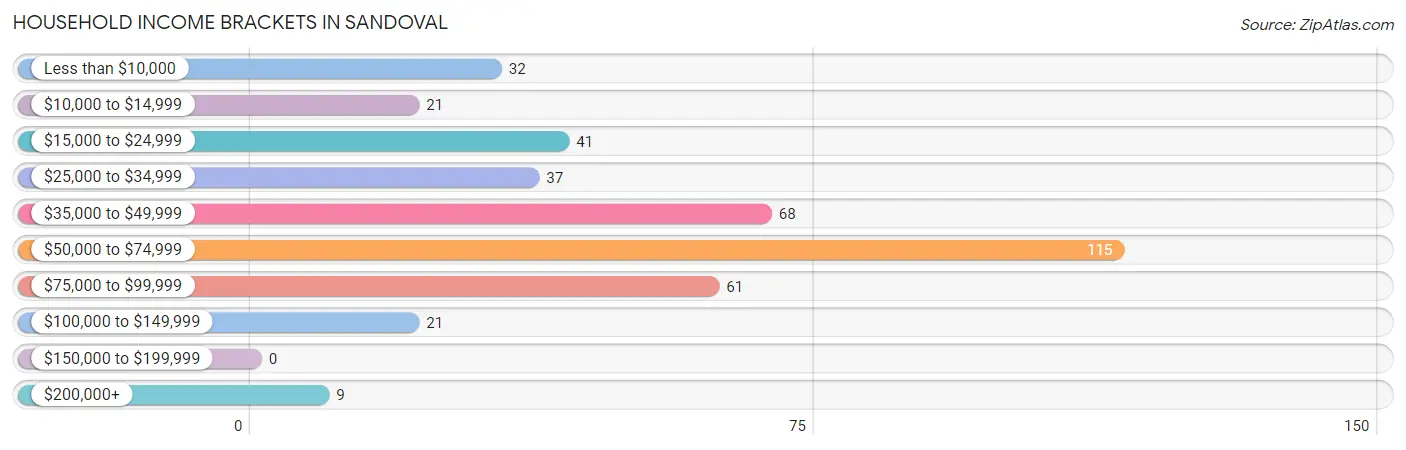
| Income Bracket | # Households | % Households |
| Less than $10,000 | 32 | 7.9% |
| $10,000 to $14,999 | 21 | 5.2% |
| $15,000 to $24,999 | 41 | 10.1% |
| $25,000 to $34,999 | 37 | 9.1% |
| $35,000 to $49,999 | 68 | 16.8% |
| $50,000 to $74,999 | 115 | 28.4% |
| $75,000 to $99,999 | 61 | 15.1% |
| $100,000 to $149,999 | 21 | 5.2% |
| $150,000 to $199,999 | 0 | 0.0% |
| $200,000+ | 9 | 2.2% |
Household Income by Householder Age in Sandoval
The median household income in Sandoval is $50,148, with the highest median household income of $51,994 found in the 45 to 64 years age bracket for the primary householder. A total of 153 households (37.8%) fall into this category. Meanwhile, the 15 to 24 years age bracket for the primary householder has the lowest median household income of $0, with 9 households (2.2%) in this group.
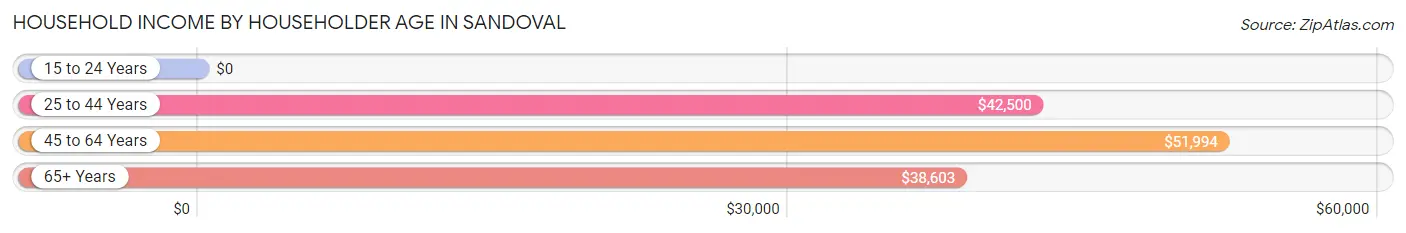
| Income Bracket | # Households | Median Income |
| 15 to 24 Years | 9 (2.2%) | $0 |
| 25 to 44 Years | 114 (28.1%) | $42,500 |
| 45 to 64 Years | 153 (37.8%) | $51,994 |
| 65+ Years | 129 (31.9%) | $38,603 |
| Total | 405 (100.0%) | $50,148 |
Poverty in Sandoval
Income Below Poverty by Sex and Age in Sandoval
With 23.7% poverty level for males and 24.9% for females among the residents of Sandoval, 12 to 14 year old males and 15 year old females are the most vulnerable to poverty, with 3 males (60.0%) and 2 females (100.0%) in their respective age groups living below the poverty level.
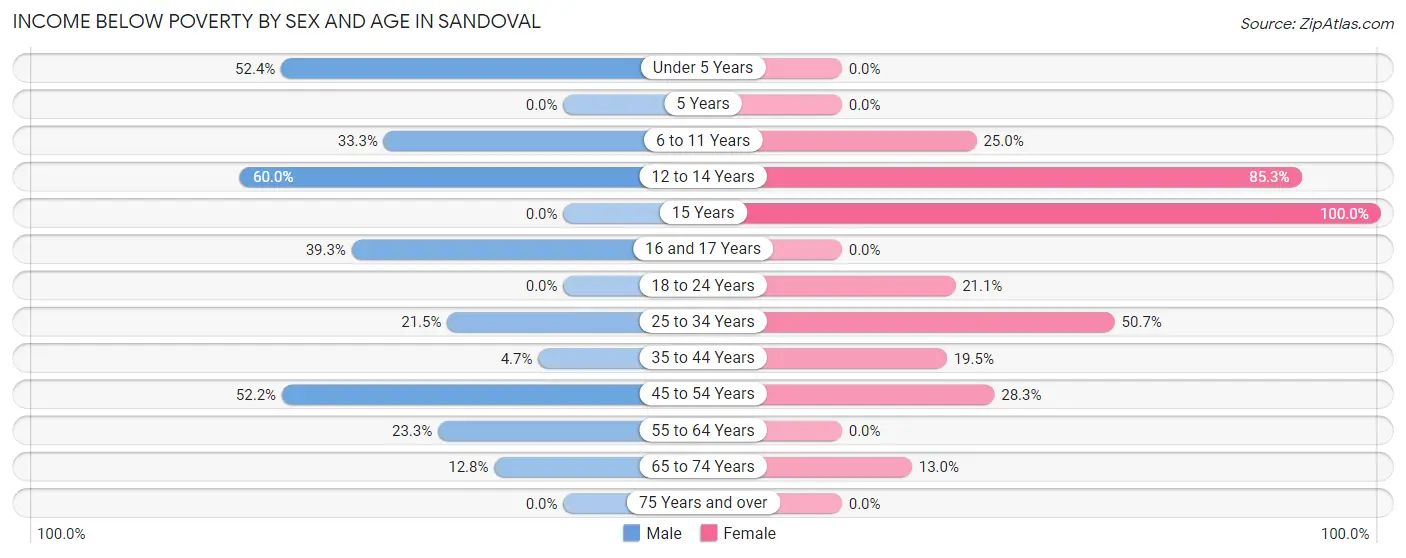
| Age Bracket | Male | Female |
| Under 5 Years | 11 (52.4%) | 0 (0.0%) |
| 5 Years | 0 (0.0%) | 0 (0.0%) |
| 6 to 11 Years | 17 (33.3%) | 3 (25.0%) |
| 12 to 14 Years | 3 (60.0%) | 29 (85.3%) |
| 15 Years | 0 (0.0%) | 2 (100.0%) |
| 16 and 17 Years | 11 (39.3%) | 0 (0.0%) |
| 18 to 24 Years | 0 (0.0%) | 4 (21.0%) |
| 25 to 34 Years | 14 (21.5%) | 39 (50.6%) |
| 35 to 44 Years | 4 (4.6%) | 15 (19.5%) |
| 45 to 54 Years | 35 (52.2%) | 15 (28.3%) |
| 55 to 64 Years | 10 (23.3%) | 0 (0.0%) |
| 65 to 74 Years | 10 (12.8%) | 10 (13.0%) |
| 75 Years and over | 0 (0.0%) | 0 (0.0%) |
| Total | 115 (23.7%) | 117 (24.9%) |
Income Above Poverty by Sex and Age in Sandoval
According to the poverty statistics in Sandoval, males aged 15 years and females aged under 5 years are the age groups that are most secure financially, with 100.0% of males and 100.0% of females in these age groups living above the poverty line.
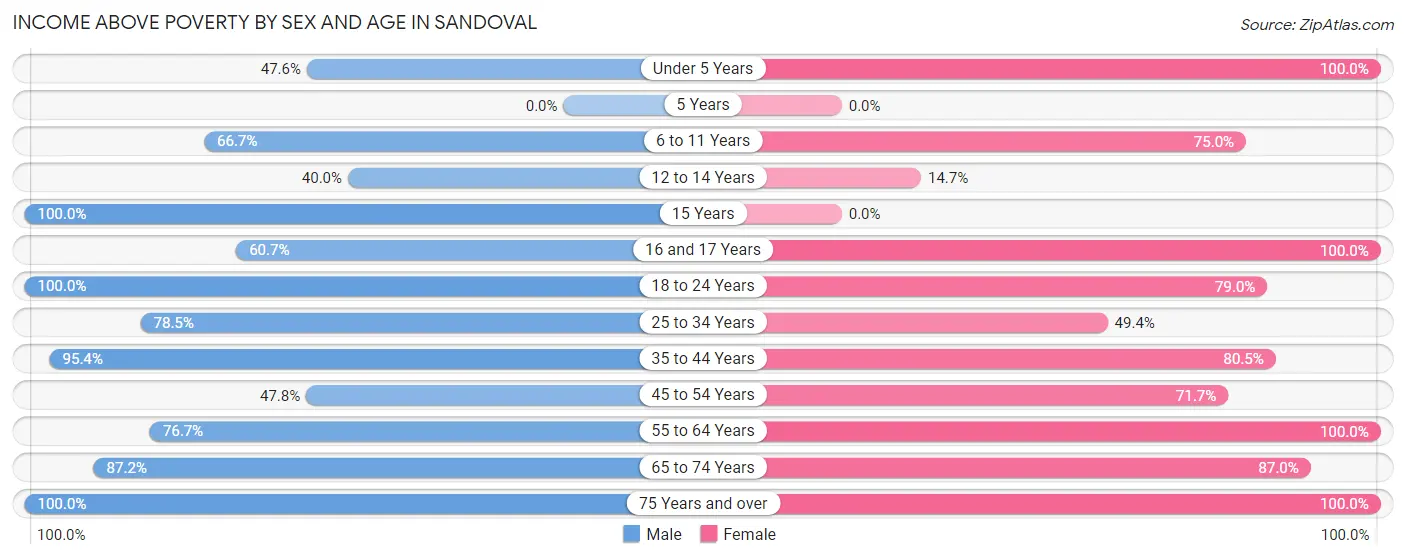
| Age Bracket | Male | Female |
| Under 5 Years | 10 (47.6%) | 11 (100.0%) |
| 5 Years | 0 (0.0%) | 0 (0.0%) |
| 6 to 11 Years | 34 (66.7%) | 9 (75.0%) |
| 12 to 14 Years | 2 (40.0%) | 5 (14.7%) |
| 15 Years | 2 (100.0%) | 0 (0.0%) |
| 16 and 17 Years | 17 (60.7%) | 5 (100.0%) |
| 18 to 24 Years | 26 (100.0%) | 15 (78.9%) |
| 25 to 34 Years | 51 (78.5%) | 38 (49.3%) |
| 35 to 44 Years | 82 (95.4%) | 62 (80.5%) |
| 45 to 54 Years | 32 (47.8%) | 38 (71.7%) |
| 55 to 64 Years | 33 (76.7%) | 84 (100.0%) |
| 65 to 74 Years | 68 (87.2%) | 67 (87.0%) |
| 75 Years and over | 14 (100.0%) | 19 (100.0%) |
| Total | 371 (76.3%) | 353 (75.1%) |
Income Below Poverty Among Married-Couple Families in Sandoval
The poverty statistics for married-couple families in Sandoval show that 12.1% or 15 of the total 124 families live below the poverty line. Families with 3 or 4 children have the highest poverty rate of 50.0%, comprising of 3 families. On the other hand, families with 1 or 2 children have the lowest poverty rate of 0.0%, which includes 0 families.
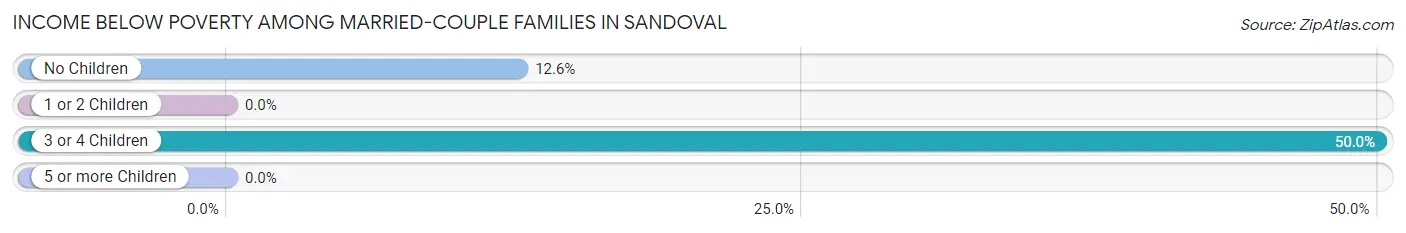
| Children | Above Poverty | Below Poverty |
| No Children | 83 (87.4%) | 12 (12.6%) |
| 1 or 2 Children | 23 (100.0%) | 0 (0.0%) |
| 3 or 4 Children | 3 (50.0%) | 3 (50.0%) |
| 5 or more Children | 0 (0.0%) | 0 (0.0%) |
| Total | 109 (87.9%) | 15 (12.1%) |
Income Below Poverty Among Single-Parent Households in Sandoval
According to the poverty data in Sandoval, 20.8% or 5 single-father households and 19.3% or 16 single-mother households are living below the poverty line. Among single-father households, those with no children have the highest poverty rate, with 5 households (27.8%) experiencing poverty. Likewise, among single-mother households, those with 3 or 4 children have the highest poverty rate, with 10 households (100.0%) falling below the poverty line.
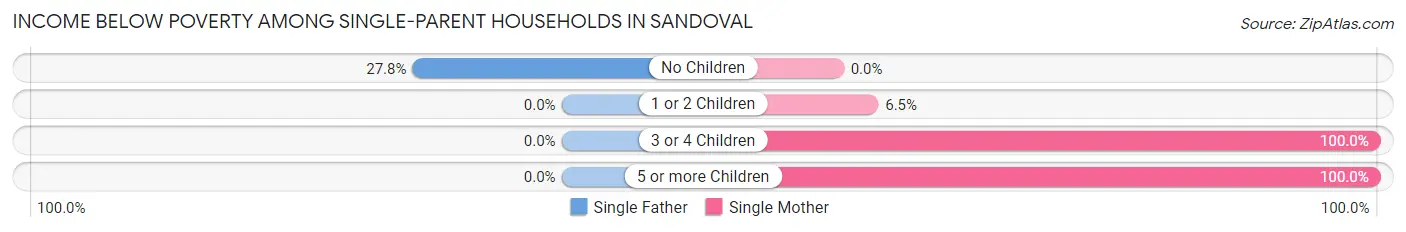
| Children | Single Father | Single Mother |
| No Children | 5 (27.8%) | 0 (0.0%) |
| 1 or 2 Children | 0 (0.0%) | 4 (6.5%) |
| 3 or 4 Children | 0 (0.0%) | 10 (100.0%) |
| 5 or more Children | 0 (0.0%) | 2 (100.0%) |
| Total | 5 (20.8%) | 16 (19.3%) |
Income Below Poverty Among Married-Couple vs Single-Parent Households in Sandoval
The poverty data for Sandoval shows that 15 of the married-couple family households (12.1%) and 21 of the single-parent households (19.6%) are living below the poverty level. Within the married-couple family households, those with 3 or 4 children have the highest poverty rate, with 3 households (50.0%) falling below the poverty line. Among the single-parent households, those with 5 or more children have the highest poverty rate, with 2 household (100.0%) living below poverty.
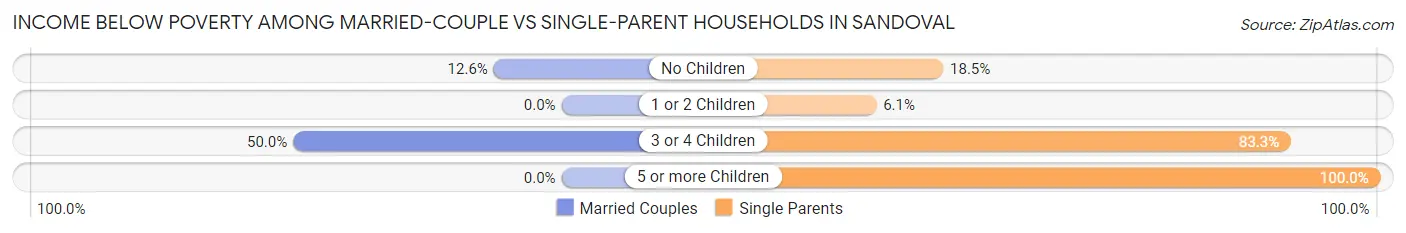
| Children | Married-Couple Families | Single-Parent Households |
| No Children | 12 (12.6%) | 5 (18.5%) |
| 1 or 2 Children | 0 (0.0%) | 4 (6.1%) |
| 3 or 4 Children | 3 (50.0%) | 10 (83.3%) |
| 5 or more Children | 0 (0.0%) | 2 (100.0%) |
| Total | 15 (12.1%) | 21 (19.6%) |
Race in Sandoval
The most populous races in Sandoval are White / Caucasian (877 | 89.3%), Two or more Races (76 | 7.7%), and Hispanic or Latino (48 | 4.9%).
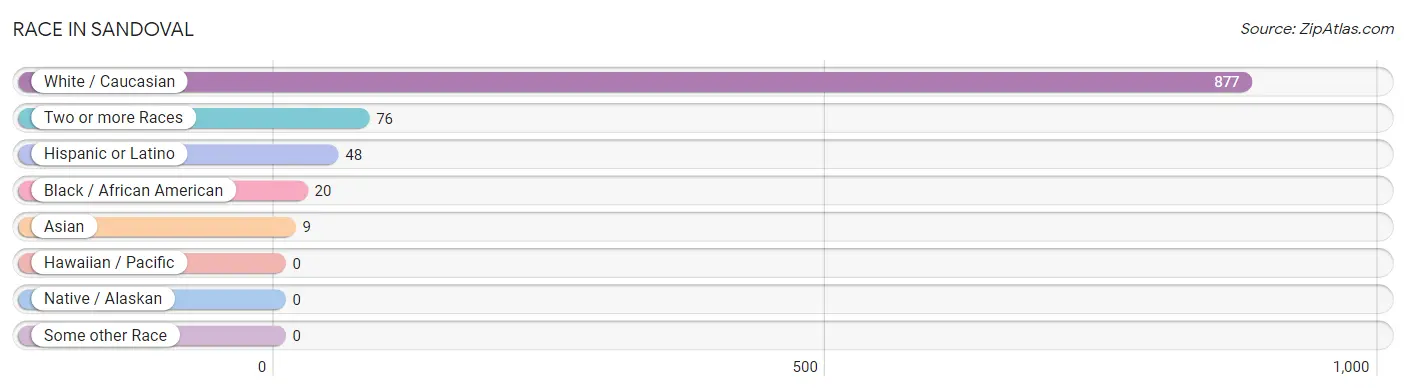
| Race | # Population | % Population |
| Asian | 9 | 0.9% |
| Black / African American | 20 | 2.0% |
| Hawaiian / Pacific | 0 | 0.0% |
| Hispanic or Latino | 48 | 4.9% |
| Native / Alaskan | 0 | 0.0% |
| White / Caucasian | 877 | 89.3% |
| Two or more Races | 76 | 7.7% |
| Some other Race | 0 | 0.0% |
| Total | 982 | 100.0% |
Ancestry in Sandoval
The most populous ancestries reported in Sandoval are German (220 | 22.4%), Irish (124 | 12.6%), English (107 | 10.9%), Mexican (48 | 4.9%), and American (40 | 4.1%), together accounting for 54.9% of all Sandoval residents.
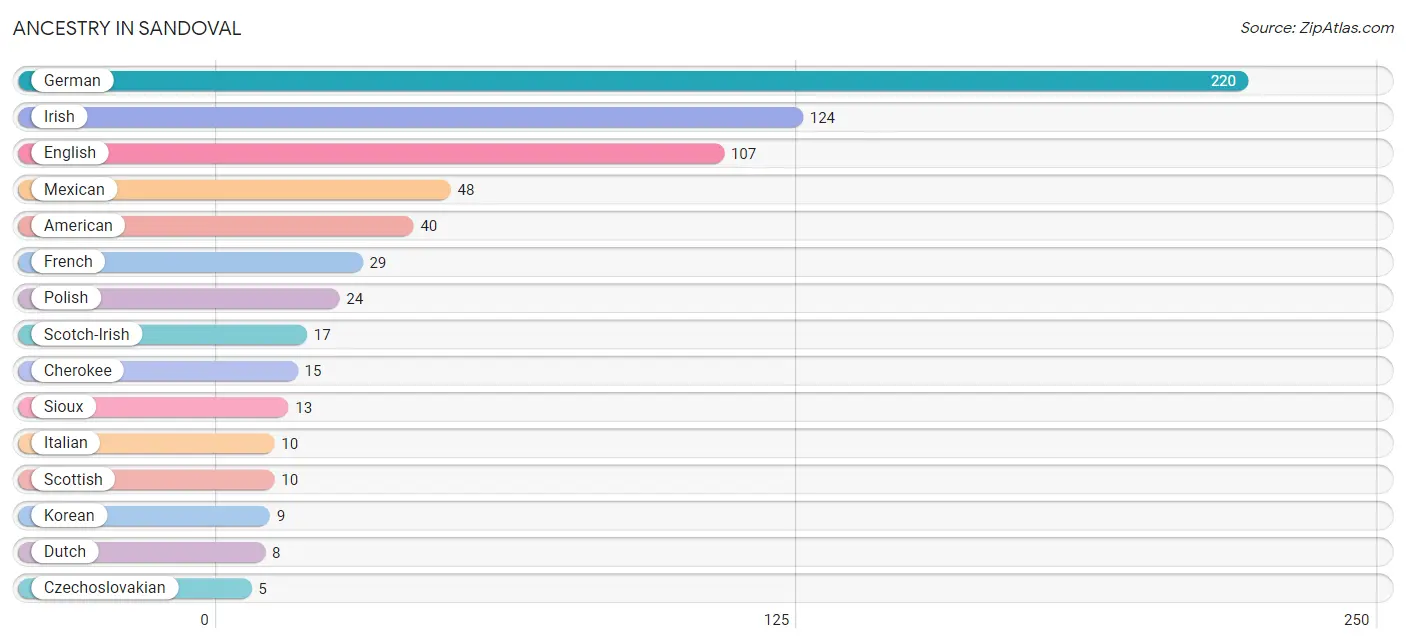
| Ancestry | # Population | % Population |
| American | 40 | 4.1% |
| British | 3 | 0.3% |
| Burmese | 2 | 0.2% |
| Cherokee | 15 | 1.5% |
| Czechoslovakian | 5 | 0.5% |
| Dutch | 8 | 0.8% |
| English | 107 | 10.9% |
| French | 29 | 2.9% |
| German | 220 | 22.4% |
| Irish | 124 | 12.6% |
| Italian | 10 | 1.0% |
| Korean | 9 | 0.9% |
| Mexican | 48 | 4.9% |
| Polish | 24 | 2.4% |
| Scotch-Irish | 17 | 1.7% |
| Scottish | 10 | 1.0% |
| Sioux | 13 | 1.3% | View All 17 Rows |
Immigrants in Sandoval
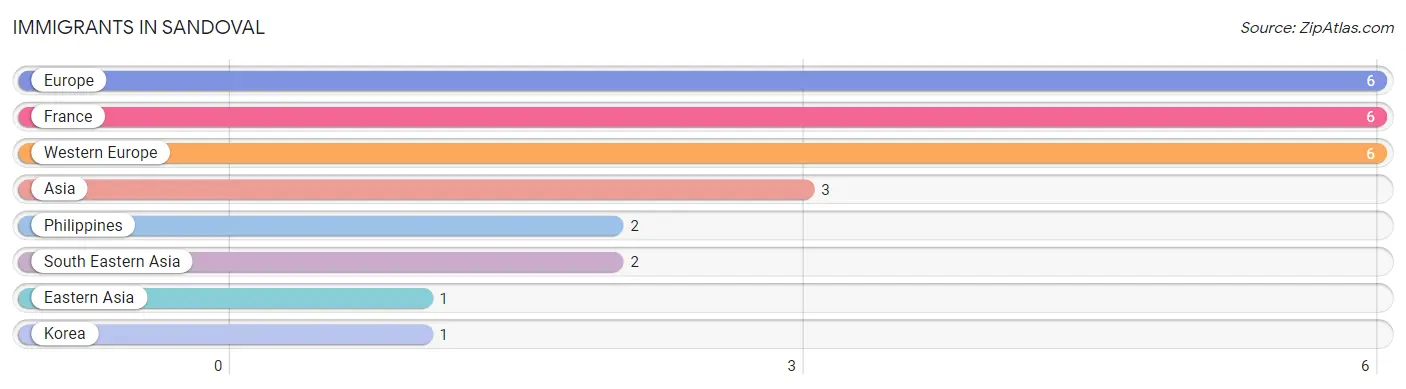
The most numerous immigrant groups reported in Sandoval came from Europe (6 | 0.6%), France (6 | 0.6%), Western Europe (6 | 0.6%), Asia (3 | 0.3%), and Philippines (2 | 0.2%), together accounting for 2.3% of all Sandoval residents.
| Immigration Origin | # Population | % Population |
| Asia | 3 | 0.3% |
| Eastern Asia | 1 | 0.1% |
| Europe | 6 | 0.6% |
| France | 6 | 0.6% |
| Korea | 1 | 0.1% |
| Philippines | 2 | 0.2% |
| South Eastern Asia | 2 | 0.2% |
| Western Europe | 6 | 0.6% | View All 8 Rows |
Sex and Age in Sandoval
Sex and Age in Sandoval
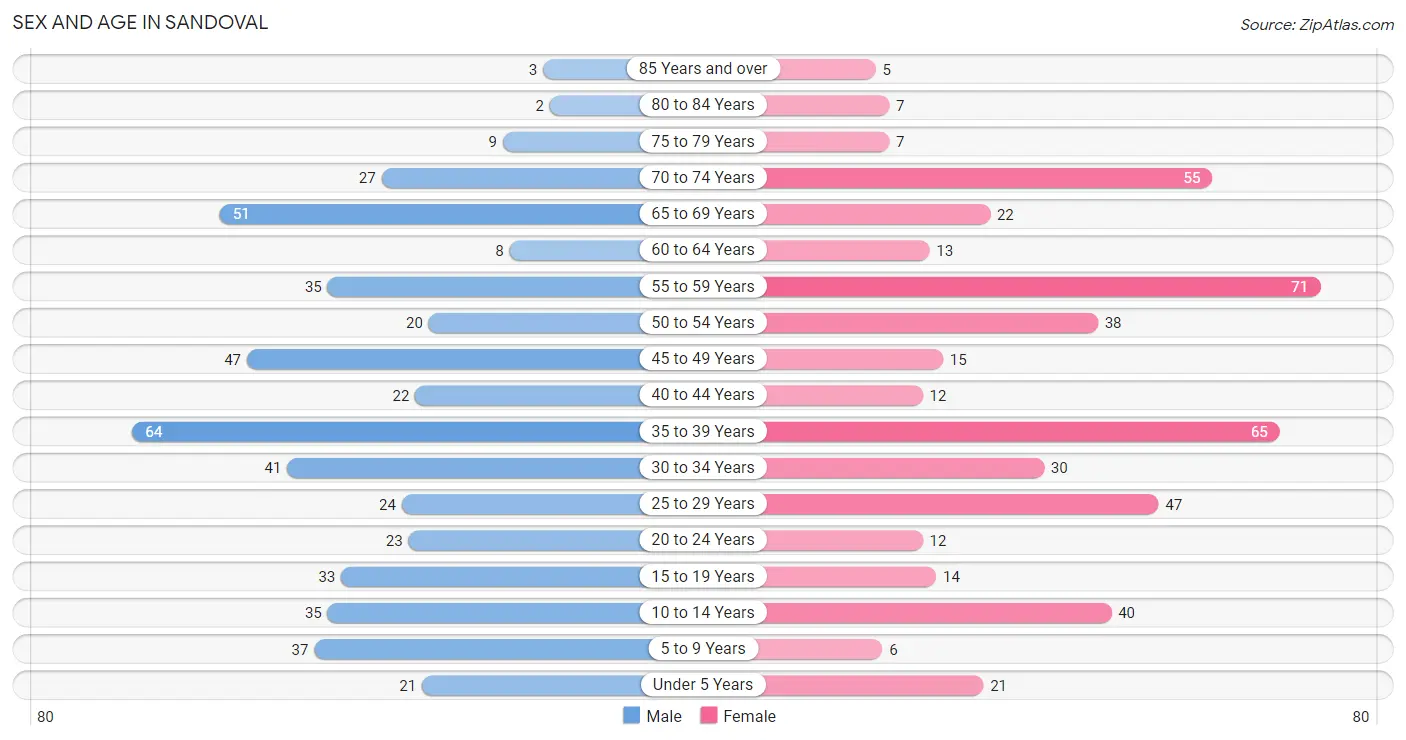
The most populous age groups in Sandoval are 35 to 39 Years (64 | 12.8%) for men and 55 to 59 Years (71 | 14.8%) for women.
| Age Bracket | Male | Female |
| Under 5 Years | 21 (4.2%) | 21 (4.4%) |
| 5 to 9 Years | 37 (7.4%) | 6 (1.3%) |
| 10 to 14 Years | 35 (7.0%) | 40 (8.3%) |
| 15 to 19 Years | 33 (6.6%) | 14 (2.9%) |
| 20 to 24 Years | 23 (4.6%) | 12 (2.5%) |
| 25 to 29 Years | 24 (4.8%) | 47 (9.8%) |
| 30 to 34 Years | 41 (8.2%) | 30 (6.2%) |
| 35 to 39 Years | 64 (12.8%) | 65 (13.5%) |
| 40 to 44 Years | 22 (4.4%) | 12 (2.5%) |
| 45 to 49 Years | 47 (9.4%) | 15 (3.1%) |
| 50 to 54 Years | 20 (4.0%) | 38 (7.9%) |
| 55 to 59 Years | 35 (7.0%) | 71 (14.8%) |
| 60 to 64 Years | 8 (1.6%) | 13 (2.7%) |
| 65 to 69 Years | 51 (10.2%) | 22 (4.6%) |
| 70 to 74 Years | 27 (5.4%) | 55 (11.5%) |
| 75 to 79 Years | 9 (1.8%) | 7 (1.5%) |
| 80 to 84 Years | 2 (0.4%) | 7 (1.5%) |
| 85 Years and over | 3 (0.6%) | 5 (1.0%) |
| Total | 502 (100.0%) | 480 (100.0%) |
Families and Households in Sandoval
Median Family Size in Sandoval
The median family size in Sandoval is 3.05 persons per family, with single female/mother families (83 | 35.9%) accounting for the largest median family size of 3.95 persons per family. On the other hand, single male/father families (24 | 10.4%) represent the smallest median family size with 2.46 persons per family.
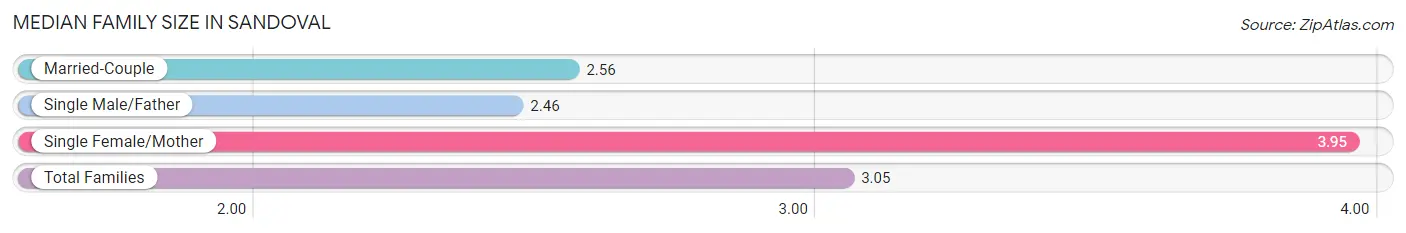
| Family Type | # Families | Family Size |
| Married-Couple | 124 (53.7%) | 2.56 |
| Single Male/Father | 24 (10.4%) | 2.46 |
| Single Female/Mother | 83 (35.9%) | 3.95 |
| Total Families | 231 (100.0%) | 3.05 |
Median Household Size in Sandoval
The median household size in Sandoval is 2.42 persons per household, with single female/mother households (83 | 20.5%) accounting for the largest median household size of 4.87 persons per household. non-family households (174 | 43.0%) represent the smallest median household size with 1.13 persons per household.
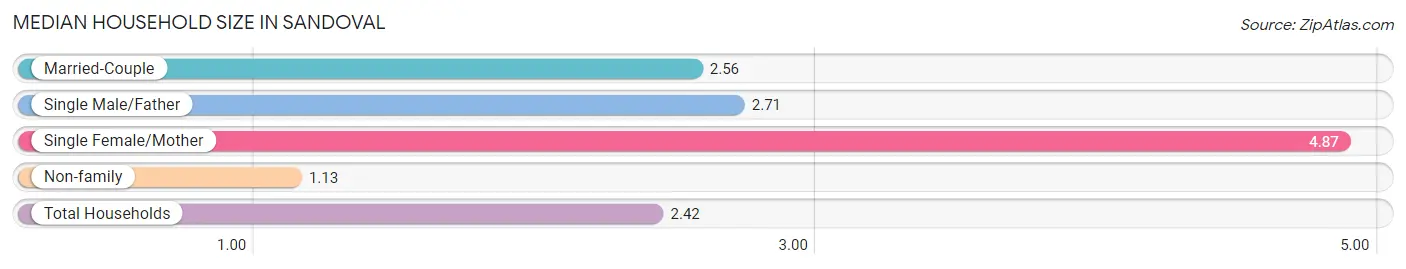
| Household Type | # Households | Household Size |
| Married-Couple | 124 (30.6%) | 2.56 |
| Single Male/Father | 24 (5.9%) | 2.71 |
| Single Female/Mother | 83 (20.5%) | 4.87 |
| Non-family | 174 (43.0%) | 1.13 |
| Total Households | 405 (100.0%) | 2.42 |
Household Size by Marriage Status in Sandoval
Out of a total of 405 households in Sandoval, 231 (57.0%) are family households, while 174 (43.0%) are nonfamily households. The most numerous type of family households are 2-person households, comprising 107, and the most common type of nonfamily households are 1-person households, comprising 154.
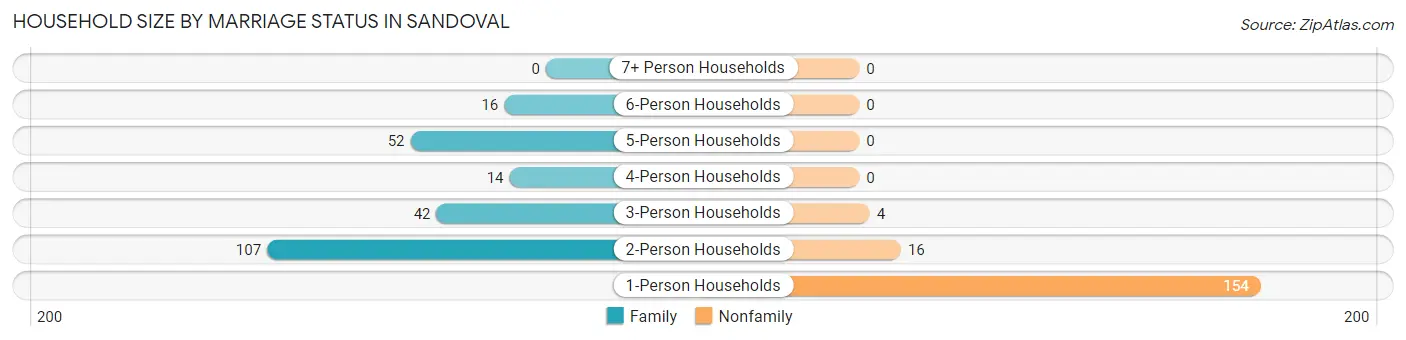
| Household Size | Family Households | Nonfamily Households |
| 1-Person Households | - | 154 (38.0%) |
| 2-Person Households | 107 (26.4%) | 16 (4.0%) |
| 3-Person Households | 42 (10.4%) | 4 (1.0%) |
| 4-Person Households | 14 (3.5%) | 0 (0.0%) |
| 5-Person Households | 52 (12.8%) | 0 (0.0%) |
| 6-Person Households | 16 (4.0%) | 0 (0.0%) |
| 7+ Person Households | 0 (0.0%) | 0 (0.0%) |
| Total | 231 (57.0%) | 174 (43.0%) |
Female Fertility in Sandoval
Fertility by Age in Sandoval
Average fertility rate in Sandoval is 65.0 births per 1,000 women. Women in the age bracket of 15 to 19 years have the highest fertility rate with 286.0 births per 1,000 women. Women in the age bracket of 20 to 34 years acount for 53.8% of all women with births.
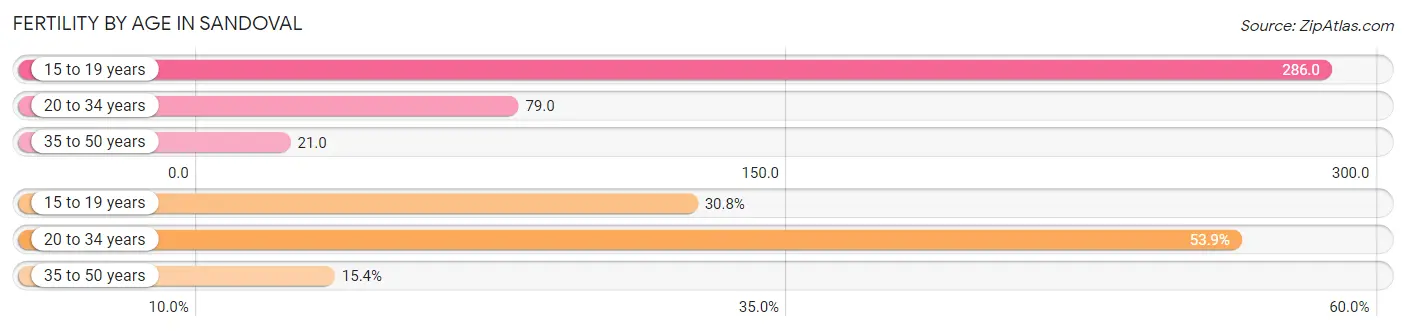
| Age Bracket | Women with Births | Births / 1,000 Women |
| 15 to 19 years | 4 (30.8%) | 286.0 |
| 20 to 34 years | 7 (53.8%) | 79.0 |
| 35 to 50 years | 2 (15.4%) | 21.0 |
| Total | 13 (100.0%) | 65.0 |
Fertility by Age by Marriage Status in Sandoval
15.4% of women with births (13) in Sandoval are married. The highest percentage of unmarried women with births falls into 15 to 19 years age bracket with 100.0% of them unmarried at the time of birth, while the lowest percentage of unmarried women with births belong to 35 to 50 years age bracket with 0.0% of them unmarried.
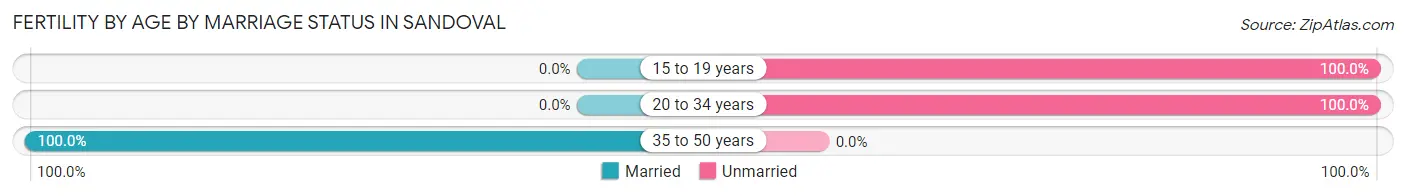
| Age Bracket | Married | Unmarried |
| 15 to 19 years | 0 (0.0%) | 4 (100.0%) |
| 20 to 34 years | 0 (0.0%) | 7 (100.0%) |
| 35 to 50 years | 2 (100.0%) | 0 (0.0%) |
| Total | 2 (15.4%) | 11 (84.6%) |
Fertility by Education in Sandoval
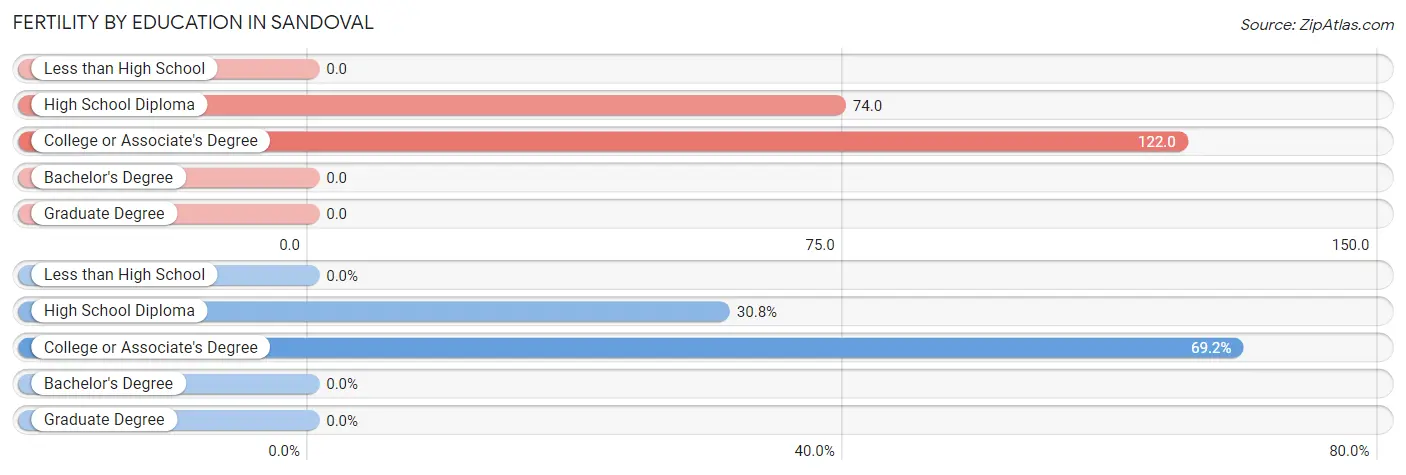
| Educational Attainment | Women with Births | Births / 1,000 Women |
| Less than High School | 0 (0.0%) | 0.0 |
| High School Diploma | 4 (30.8%) | 74.0 |
| College or Associate's Degree | 9 (69.2%) | 122.0 |
| Bachelor's Degree | 0 (0.0%) | 0.0 |
| Graduate Degree | 0 (0.0%) | 0.0 |
| Total | 13 (100.0%) | 65.0 |
Fertility by Education by Marriage Status in Sandoval
84.6% of women with births in Sandoval are unmarried. Women with the educational attainment of college or associate's degree are most likely to be married with 22.2% of them married at childbirth, while women with the educational attainment of high school diploma are least likely to be married with 100.0% of them unmarried at childbirth.
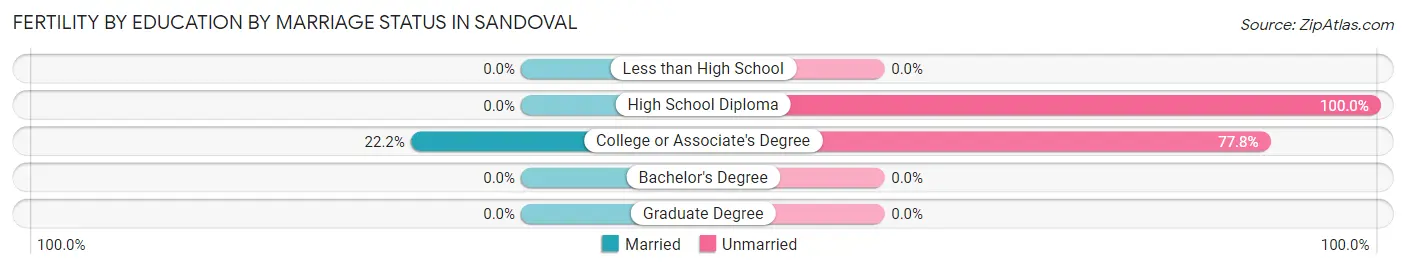
| Educational Attainment | Married | Unmarried |
| Less than High School | 0 (0.0%) | 0 (0.0%) |
| High School Diploma | 0 (0.0%) | 4 (100.0%) |
| College or Associate's Degree | 2 (22.2%) | 7 (77.8%) |
| Bachelor's Degree | 0 (0.0%) | 0 (0.0%) |
| Graduate Degree | 0 (0.0%) | 0 (0.0%) |
| Total | 2 (15.4%) | 11 (84.6%) |
Employment Characteristics in Sandoval
Employment by Class of Employer in Sandoval
Among the 328 employed individuals in Sandoval, private company employees (249 | 75.9%), self-employed (not incorporated) (23 | 7.0%), and state government employees (20 | 6.1%) make up the most common classes of employment.
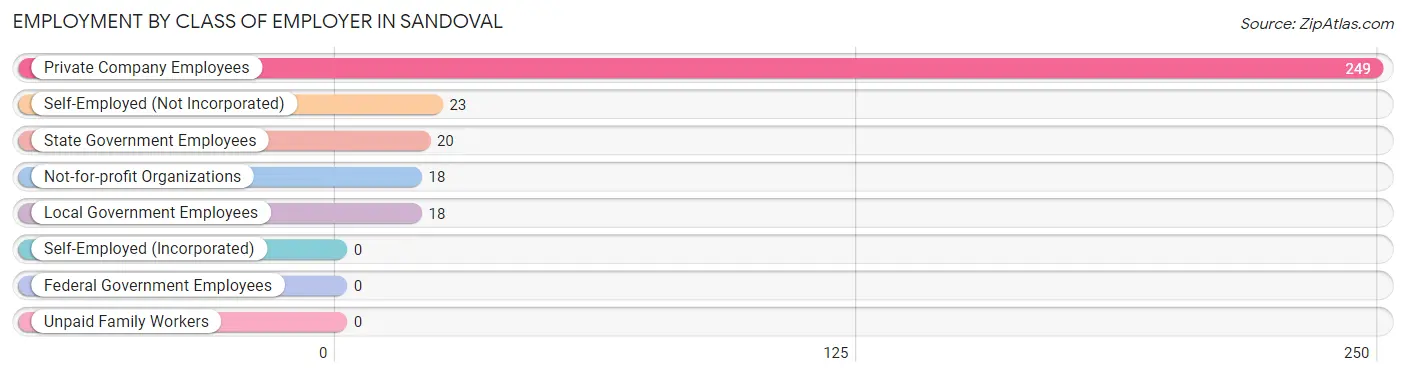
| Employer Class | # Employees | % Employees |
| Private Company Employees | 249 | 75.9% |
| Self-Employed (Incorporated) | 0 | 0.0% |
| Self-Employed (Not Incorporated) | 23 | 7.0% |
| Not-for-profit Organizations | 18 | 5.5% |
| Local Government Employees | 18 | 5.5% |
| State Government Employees | 20 | 6.1% |
| Federal Government Employees | 0 | 0.0% |
| Unpaid Family Workers | 0 | 0.0% |
| Total | 328 | 100.0% |
Employment Status by Age in Sandoval
According to the labor force statistics for Sandoval, out of the total population over 16 years of age (818), 47.1% or 385 individuals are in the labor force, with 8.8% or 34 of them unemployed. The age group with the highest labor force participation rate is 20 to 24 years, with 100.0% or 35 individuals in the labor force. Within the labor force, the 20 to 24 years age range has the highest percentage of unemployed individuals, with 25.7% or 9 of them being unemployed.
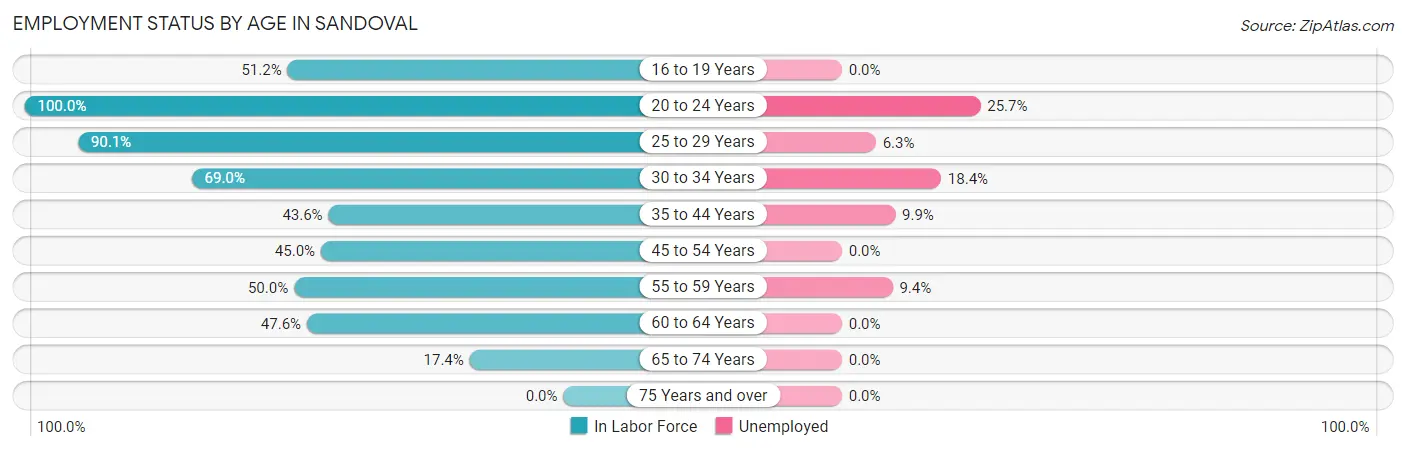
| Age Bracket | In Labor Force | Unemployed |
| 16 to 19 Years | 22 (51.2%) | 0 (0.0%) |
| 20 to 24 Years | 35 (100.0%) | 9 (25.7%) |
| 25 to 29 Years | 64 (90.1%) | 4 (6.3%) |
| 30 to 34 Years | 49 (69.0%) | 9 (18.4%) |
| 35 to 44 Years | 71 (43.6%) | 7 (9.9%) |
| 45 to 54 Years | 54 (45.0%) | 0 (0.0%) |
| 55 to 59 Years | 53 (50.0%) | 5 (9.4%) |
| 60 to 64 Years | 10 (47.6%) | 0 (0.0%) |
| 65 to 74 Years | 27 (17.4%) | 0 (0.0%) |
| 75 Years and over | 0 (0.0%) | 0 (0.0%) |
| Total | 385 (47.1%) | 34 (8.8%) |
Employment Status by Educational Attainment in Sandoval
According to labor force statistics for Sandoval, 54.5% of individuals (301) out of the total population between 25 and 64 years of age (552) are in the labor force, with 8.3% or 25 of them being unemployed. The group with the highest labor force participation rate are those with the educational attainment of college / associate degree, with 90.2% or 157 individuals in the labor force. Within the labor force, individuals with less than high school education have the highest percentage of unemployment, with 100.0% or 5 of them being unemployed.
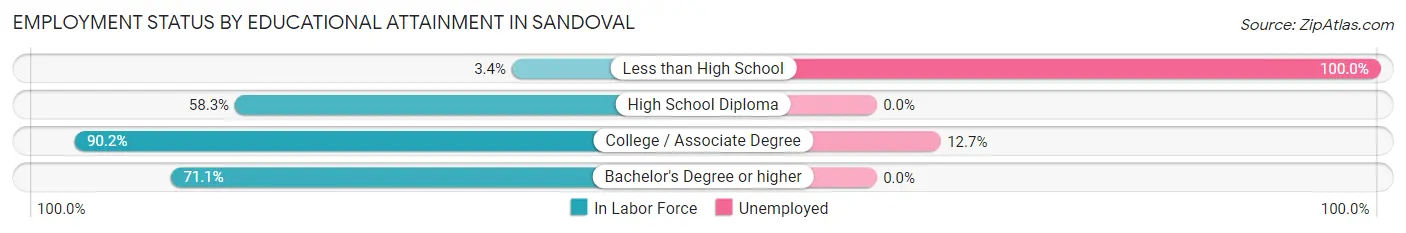
| Educational Attainment | In Labor Force | Unemployed |
| Less than High School | 5 (3.4%) | 148 (100.0%) |
| High School Diploma | 112 (58.3%) | 0 (0.0%) |
| College / Associate Degree | 157 (90.2%) | 22 (12.7%) |
| Bachelor's Degree or higher | 27 (71.1%) | 0 (0.0%) |
| Total | 301 (54.5%) | 46 (8.3%) |
Employment Occupations by Sex in Sandoval
Management, Business, Science and Arts Occupations
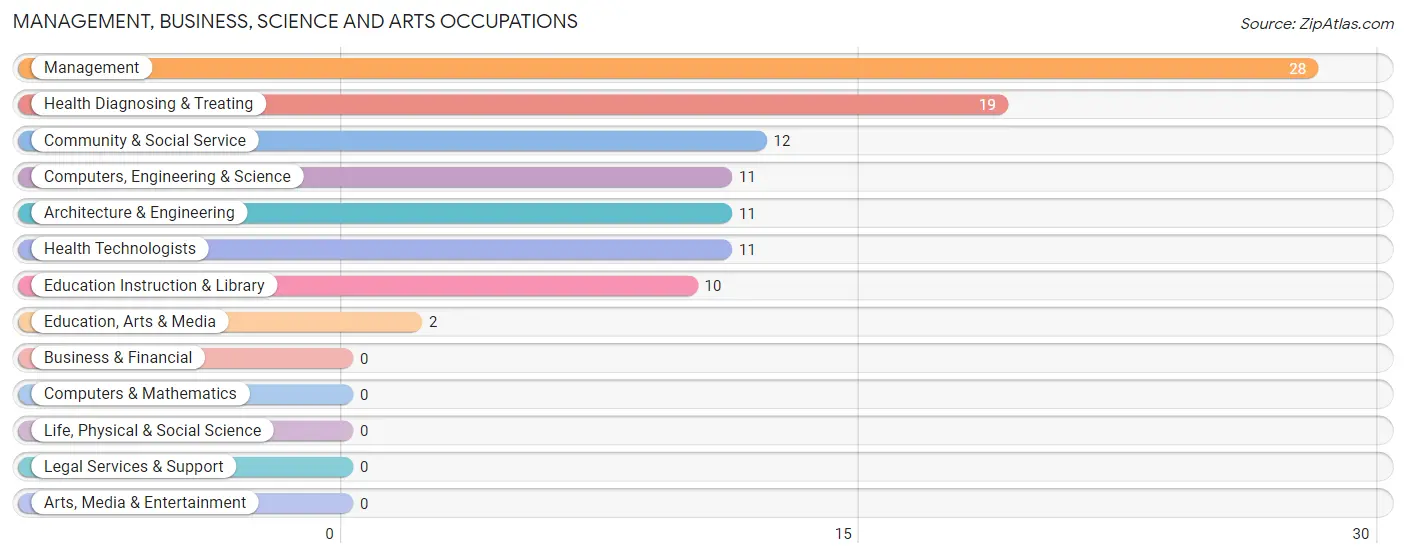
The most common Management, Business, Science and Arts occupations in Sandoval are Management (28 | 8.0%), Health Diagnosing & Treating (19 | 5.4%), Community & Social Service (12 | 3.4%), Computers, Engineering & Science (11 | 3.1%), and Architecture & Engineering (11 | 3.1%).
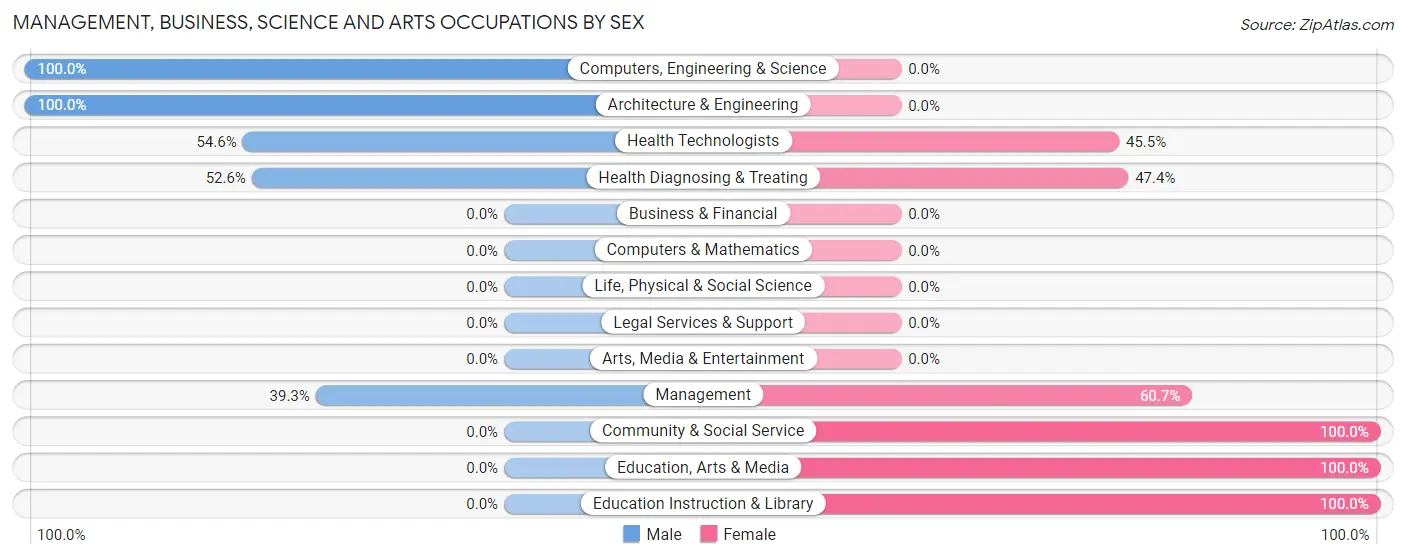
Management, Business, Science and Arts Occupations by Sex
Within the Management, Business, Science and Arts occupations in Sandoval, the most male-oriented occupations are Computers, Engineering & Science (100.0%), Architecture & Engineering (100.0%), and Health Technologists (54.5%), while the most female-oriented occupations are Community & Social Service (100.0%), Education, Arts & Media (100.0%), and Education Instruction & Library (100.0%).
| Occupation | Male | Female |
| Management | 11 (39.3%) | 17 (60.7%) |
| Business & Financial | 0 (0.0%) | 0 (0.0%) |
| Computers, Engineering & Science | 11 (100.0%) | 0 (0.0%) |
| Computers & Mathematics | 0 (0.0%) | 0 (0.0%) |
| Architecture & Engineering | 11 (100.0%) | 0 (0.0%) |
| Life, Physical & Social Science | 0 (0.0%) | 0 (0.0%) |
| Community & Social Service | 0 (0.0%) | 12 (100.0%) |
| Education, Arts & Media | 0 (0.0%) | 2 (100.0%) |
| Legal Services & Support | 0 (0.0%) | 0 (0.0%) |
| Education Instruction & Library | 0 (0.0%) | 10 (100.0%) |
| Arts, Media & Entertainment | 0 (0.0%) | 0 (0.0%) |
| Health Diagnosing & Treating | 10 (52.6%) | 9 (47.4%) |
| Health Technologists | 6 (54.5%) | 5 (45.5%) |
| Total (Category) | 32 (45.7%) | 38 (54.3%) |
| Total (Overall) | 189 (53.8%) | 162 (46.2%) |
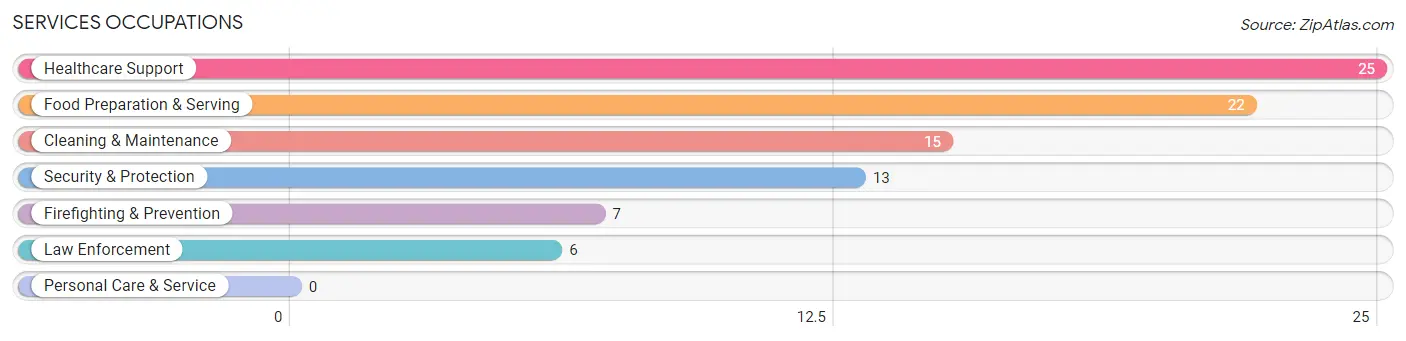
Services Occupations
The most common Services occupations in Sandoval are Healthcare Support (25 | 7.1%), Food Preparation & Serving (22 | 6.3%), Cleaning & Maintenance (15 | 4.3%), Security & Protection (13 | 3.7%), and Firefighting & Prevention (7 | 2.0%).
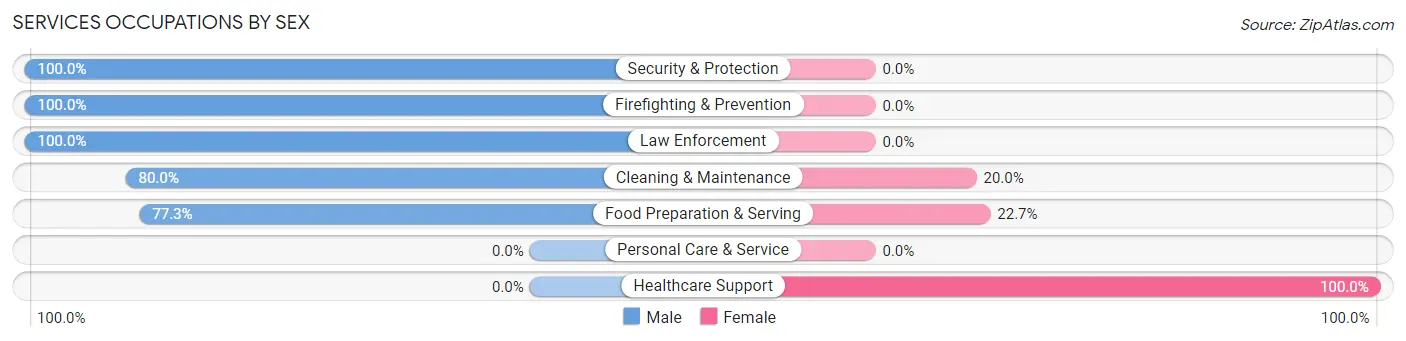
Services Occupations by Sex
Within the Services occupations in Sandoval, the most male-oriented occupations are Security & Protection (100.0%), Firefighting & Prevention (100.0%), and Law Enforcement (100.0%), while the most female-oriented occupations are Healthcare Support (100.0%), Food Preparation & Serving (22.7%), and Cleaning & Maintenance (20.0%).
| Occupation | Male | Female |
| Healthcare Support | 0 (0.0%) | 25 (100.0%) |
| Security & Protection | 13 (100.0%) | 0 (0.0%) |
| Firefighting & Prevention | 7 (100.0%) | 0 (0.0%) |
| Law Enforcement | 6 (100.0%) | 0 (0.0%) |
| Food Preparation & Serving | 17 (77.3%) | 5 (22.7%) |
| Cleaning & Maintenance | 12 (80.0%) | 3 (20.0%) |
| Personal Care & Service | 0 (0.0%) | 0 (0.0%) |
| Total (Category) | 42 (56.0%) | 33 (44.0%) |
| Total (Overall) | 189 (53.8%) | 162 (46.2%) |
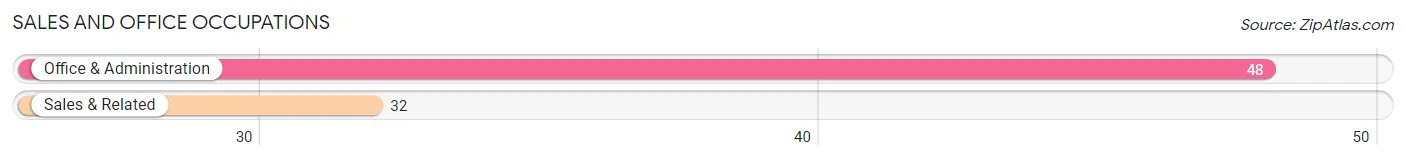
Sales and Office Occupations
The most common Sales and Office occupations in Sandoval are Office & Administration (48 | 13.7%), and Sales & Related (32 | 9.1%).
Sales and Office Occupations by Sex
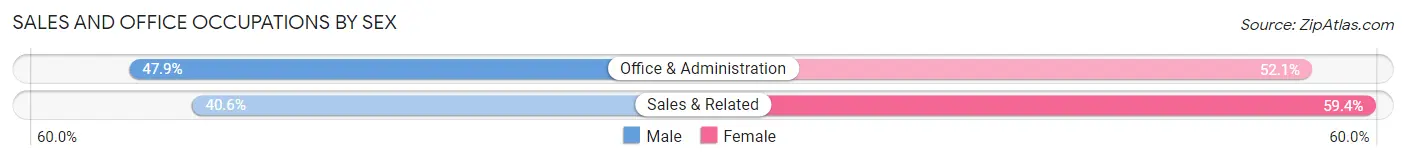
| Occupation | Male | Female |
| Sales & Related | 13 (40.6%) | 19 (59.4%) |
| Office & Administration | 23 (47.9%) | 25 (52.1%) |
| Total (Category) | 36 (45.0%) | 44 (55.0%) |
| Total (Overall) | 189 (53.8%) | 162 (46.2%) |
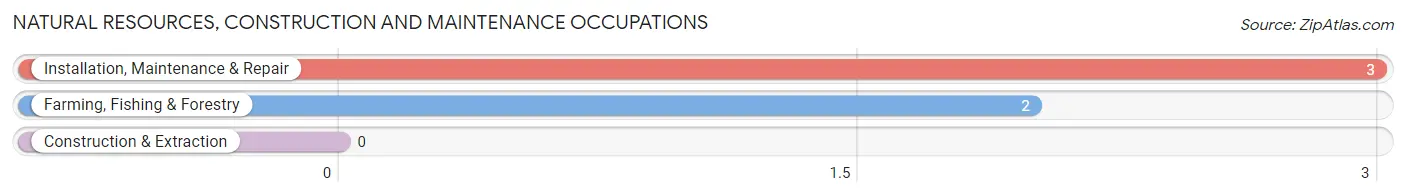
Natural Resources, Construction and Maintenance Occupations
The most common Natural Resources, Construction and Maintenance occupations in Sandoval are Installation, Maintenance & Repair (3 | 0.9%), and Farming, Fishing & Forestry (2 | 0.6%).
Natural Resources, Construction and Maintenance Occupations by Sex
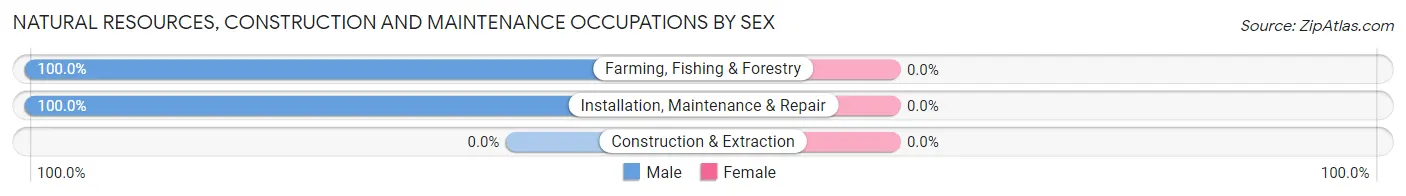
| Occupation | Male | Female |
| Farming, Fishing & Forestry | 2 (100.0%) | 0 (0.0%) |
| Construction & Extraction | 0 (0.0%) | 0 (0.0%) |
| Installation, Maintenance & Repair | 3 (100.0%) | 0 (0.0%) |
| Total (Category) | 5 (100.0%) | 0 (0.0%) |
| Total (Overall) | 189 (53.8%) | 162 (46.2%) |
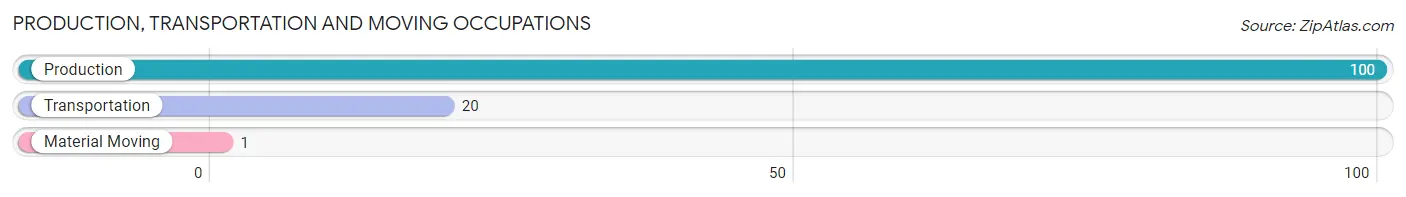
Production, Transportation and Moving Occupations
The most common Production, Transportation and Moving occupations in Sandoval are Production (100 | 28.5%), Transportation (20 | 5.7%), and Material Moving (1 | 0.3%).
Production, Transportation and Moving Occupations by Sex
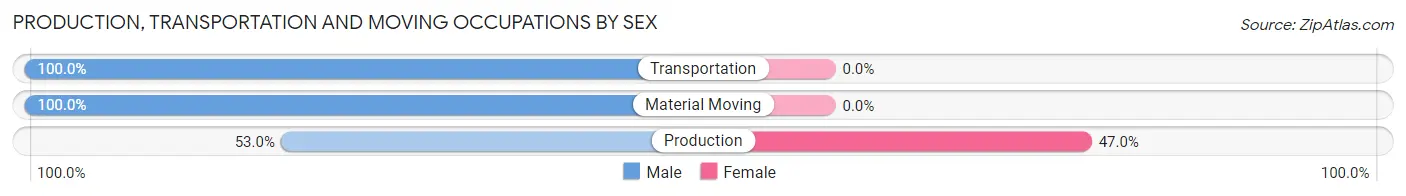
| Occupation | Male | Female |
| Production | 53 (53.0%) | 47 (47.0%) |
| Transportation | 20 (100.0%) | 0 (0.0%) |
| Material Moving | 1 (100.0%) | 0 (0.0%) |
| Total (Category) | 74 (61.2%) | 47 (38.8%) |
| Total (Overall) | 189 (53.8%) | 162 (46.2%) |
Employment Industries by Sex in Sandoval
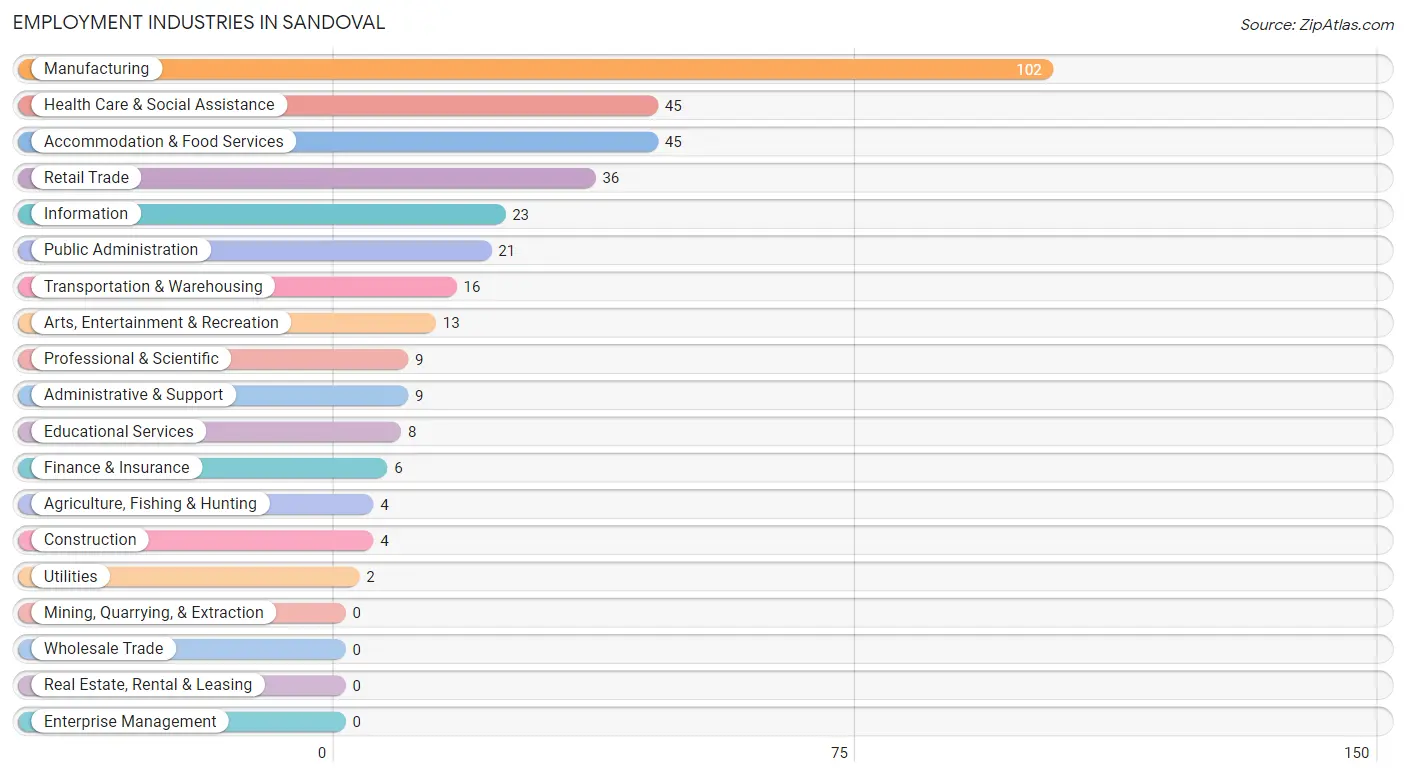
Employment Industries in Sandoval
The major employment industries in Sandoval include Manufacturing (102 | 29.1%), Health Care & Social Assistance (45 | 12.8%), Accommodation & Food Services (45 | 12.8%), Retail Trade (36 | 10.3%), and Information (23 | 6.6%).
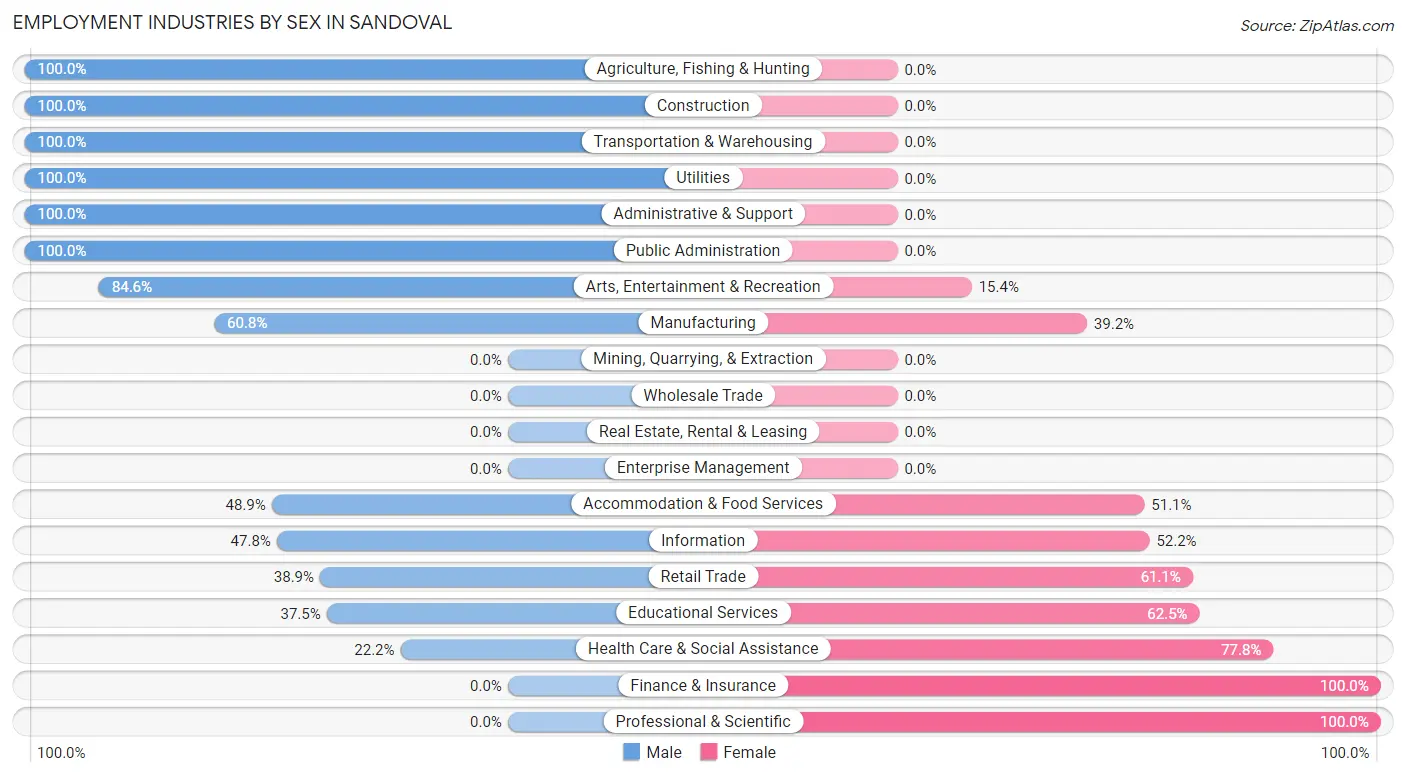
Employment Industries by Sex in Sandoval
The Sandoval industries that see more men than women are Agriculture, Fishing & Hunting (100.0%), Construction (100.0%), and Transportation & Warehousing (100.0%), whereas the industries that tend to have a higher number of women are Finance & Insurance (100.0%), Professional & Scientific (100.0%), and Health Care & Social Assistance (77.8%).
| Industry | Male | Female |
| Agriculture, Fishing & Hunting | 4 (100.0%) | 0 (0.0%) |
| Mining, Quarrying, & Extraction | 0 (0.0%) | 0 (0.0%) |
| Construction | 4 (100.0%) | 0 (0.0%) |
| Manufacturing | 62 (60.8%) | 40 (39.2%) |
| Wholesale Trade | 0 (0.0%) | 0 (0.0%) |
| Retail Trade | 14 (38.9%) | 22 (61.1%) |
| Transportation & Warehousing | 16 (100.0%) | 0 (0.0%) |
| Utilities | 2 (100.0%) | 0 (0.0%) |
| Information | 11 (47.8%) | 12 (52.2%) |
| Finance & Insurance | 0 (0.0%) | 6 (100.0%) |
| Real Estate, Rental & Leasing | 0 (0.0%) | 0 (0.0%) |
| Professional & Scientific | 0 (0.0%) | 9 (100.0%) |
| Enterprise Management | 0 (0.0%) | 0 (0.0%) |
| Administrative & Support | 9 (100.0%) | 0 (0.0%) |
| Educational Services | 3 (37.5%) | 5 (62.5%) |
| Health Care & Social Assistance | 10 (22.2%) | 35 (77.8%) |
| Arts, Entertainment & Recreation | 11 (84.6%) | 2 (15.4%) |
| Accommodation & Food Services | 22 (48.9%) | 23 (51.1%) |
| Public Administration | 21 (100.0%) | 0 (0.0%) |
| Total | 189 (53.8%) | 162 (46.2%) |
Education in Sandoval
School Enrollment in Sandoval
The most common levels of schooling among the 182 students in Sandoval are elementary school (56 | 30.8%), middle school (54 | 29.7%), and high school (41 | 22.5%).
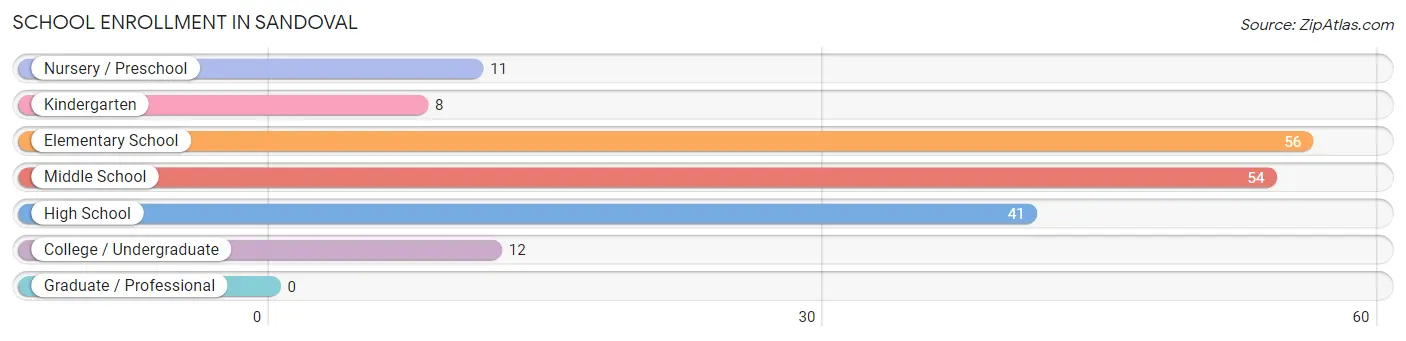
| School Level | # Students | % Students |
| Nursery / Preschool | 11 | 6.0% |
| Kindergarten | 8 | 4.4% |
| Elementary School | 56 | 30.8% |
| Middle School | 54 | 29.7% |
| High School | 41 | 22.5% |
| College / Undergraduate | 12 | 6.6% |
| Graduate / Professional | 0 | 0.0% |
| Total | 182 | 100.0% |
School Enrollment by Age by Funding Source in Sandoval
Out of a total of 182 students who are enrolled in schools in Sandoval, 20 (11.0%) attend a private institution, while the remaining 162 (89.0%) are enrolled in public schools. The age group of 3 to 4 year olds has the highest likelihood of being enrolled in private schools, with 9 (81.8% in the age bracket) enrolled. Conversely, the age group of 15 to 17 year olds has the lowest likelihood of being enrolled in a private school, with 37 (100.0% in the age bracket) attending a public institution.
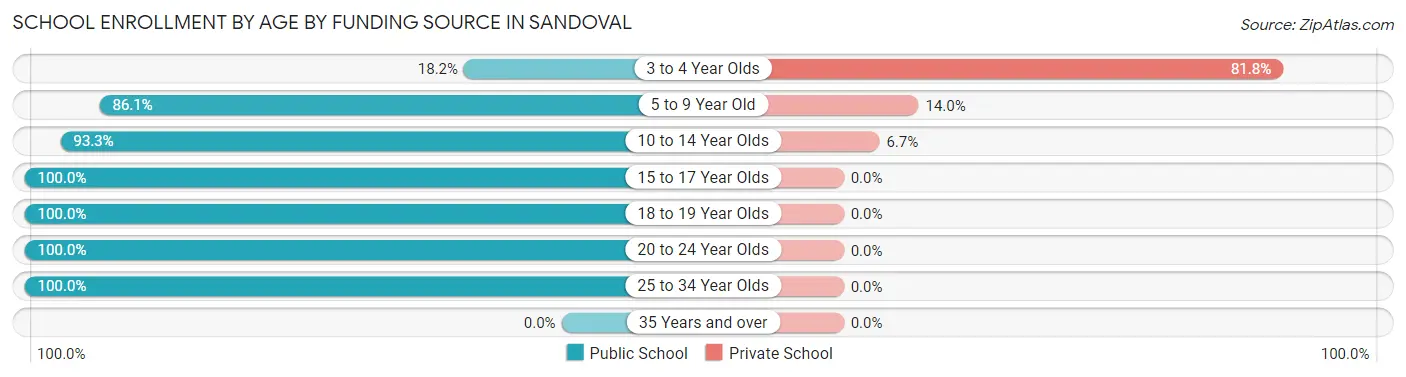
| Age Bracket | Public School | Private School |
| 3 to 4 Year Olds | 2 (18.2%) | 9 (81.8%) |
| 5 to 9 Year Old | 37 (86.1%) | 6 (14.0%) |
| 10 to 14 Year Olds | 70 (93.3%) | 5 (6.7%) |
| 15 to 17 Year Olds | 37 (100.0%) | 0 (0.0%) |
| 18 to 19 Year Olds | 4 (100.0%) | 0 (0.0%) |
| 20 to 24 Year Olds | 3 (100.0%) | 0 (0.0%) |
| 25 to 34 Year Olds | 9 (100.0%) | 0 (0.0%) |
| 35 Years and over | 0 (0.0%) | 0 (0.0%) |
| Total | 162 (89.0%) | 20 (11.0%) |
Educational Attainment by Field of Study in Sandoval
Education (30 | 54.5%), physical & health sciences (9 | 16.4%), business (6 | 10.9%), psychology (4 | 7.3%), and computers & mathematics (3 | 5.4%) are the most common fields of study among 55 individuals in Sandoval who have obtained a bachelor's degree or higher.
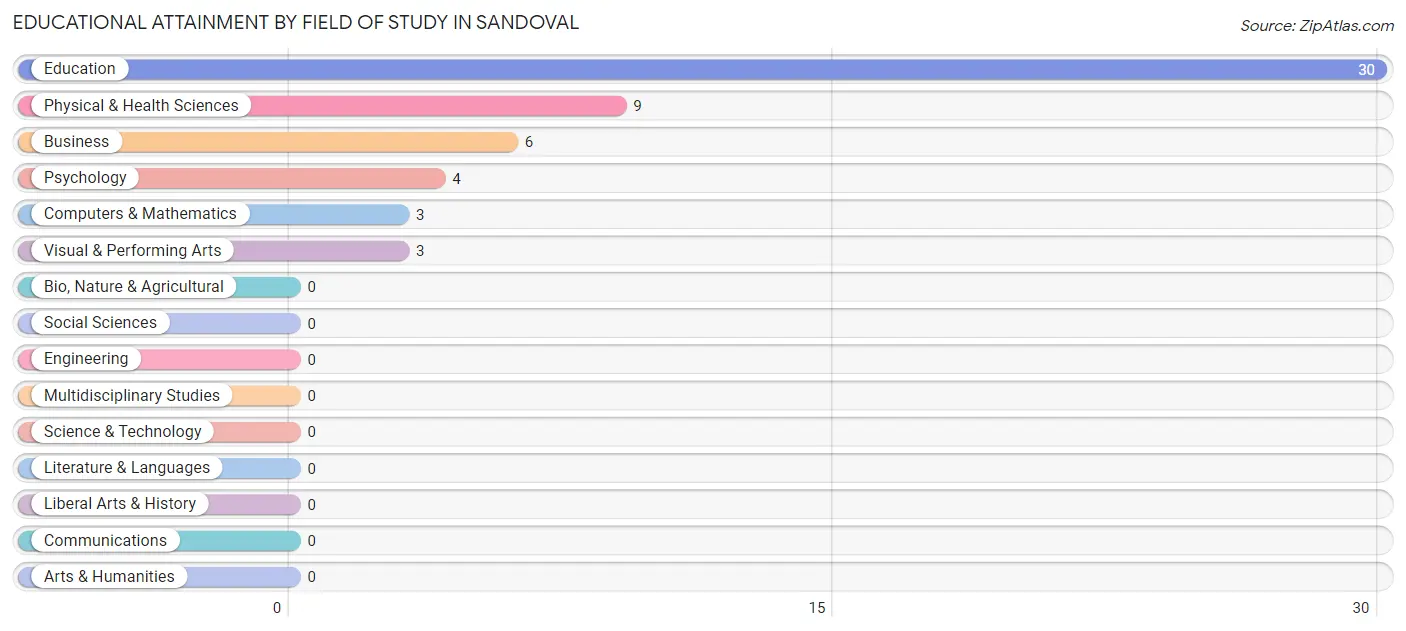
| Field of Study | # Graduates | % Graduates |
| Computers & Mathematics | 3 | 5.4% |
| Bio, Nature & Agricultural | 0 | 0.0% |
| Physical & Health Sciences | 9 | 16.4% |
| Psychology | 4 | 7.3% |
| Social Sciences | 0 | 0.0% |
| Engineering | 0 | 0.0% |
| Multidisciplinary Studies | 0 | 0.0% |
| Science & Technology | 0 | 0.0% |
| Business | 6 | 10.9% |
| Education | 30 | 54.5% |
| Literature & Languages | 0 | 0.0% |
| Liberal Arts & History | 0 | 0.0% |
| Visual & Performing Arts | 3 | 5.4% |
| Communications | 0 | 0.0% |
| Arts & Humanities | 0 | 0.0% |
| Total | 55 | 100.0% |
Transportation & Commute in Sandoval
Vehicle Availability by Sex in Sandoval
The most prevalent vehicle ownership categories in Sandoval are males with 2 vehicles (94, accounting for 52.8%) and females with 2 vehicles (66, making up 62.7%).
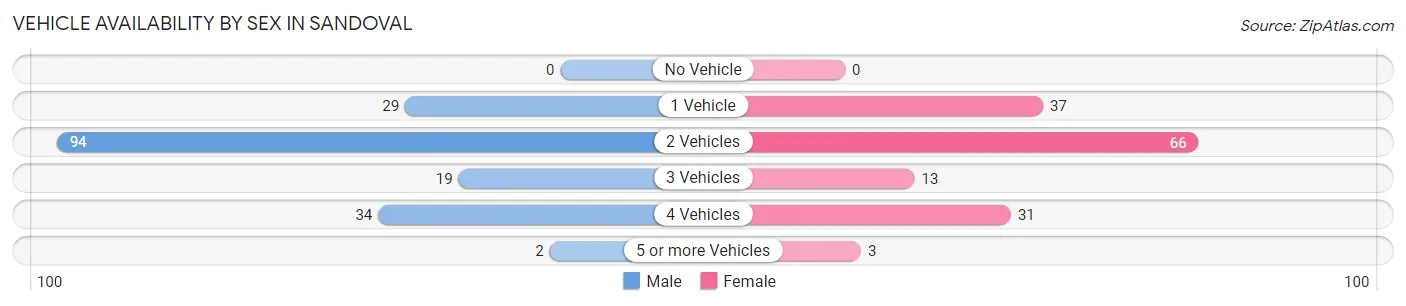
| Vehicles Available | Male | Female |
| No Vehicle | 0 (0.0%) | 0 (0.0%) |
| 1 Vehicle | 29 (16.3%) | 37 (24.7%) |
| 2 Vehicles | 94 (52.8%) | 66 (44.0%) |
| 3 Vehicles | 19 (10.7%) | 13 (8.7%) |
| 4 Vehicles | 34 (19.1%) | 31 (20.7%) |
| 5 or more Vehicles | 2 (1.1%) | 3 (2.0%) |
| Total | 178 (100.0%) | 150 (100.0%) |
Commute Time in Sandoval
The most frequently occuring commute durations in Sandoval are 10 to 14 minutes (68 commuters, 23.1%), 15 to 19 minutes (64 commuters, 21.8%), and 25 to 29 minutes (36 commuters, 12.2%).
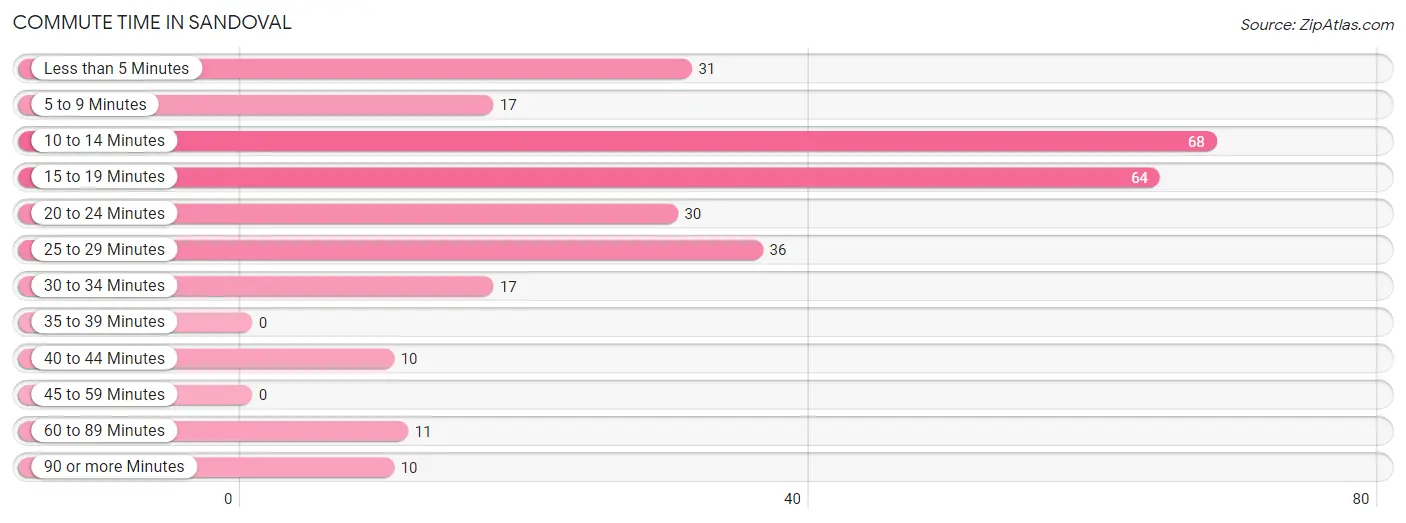
| Commute Time | # Commuters | % Commuters |
| Less than 5 Minutes | 31 | 10.5% |
| 5 to 9 Minutes | 17 | 5.8% |
| 10 to 14 Minutes | 68 | 23.1% |
| 15 to 19 Minutes | 64 | 21.8% |
| 20 to 24 Minutes | 30 | 10.2% |
| 25 to 29 Minutes | 36 | 12.2% |
| 30 to 34 Minutes | 17 | 5.8% |
| 35 to 39 Minutes | 0 | 0.0% |
| 40 to 44 Minutes | 10 | 3.4% |
| 45 to 59 Minutes | 0 | 0.0% |
| 60 to 89 Minutes | 11 | 3.7% |
| 90 or more Minutes | 10 | 3.4% |
Commute Time by Sex in Sandoval
The most common commute times in Sandoval are 15 to 19 minutes (53 commuters, 31.7%) for males and 10 to 14 minutes (37 commuters, 29.1%) for females.
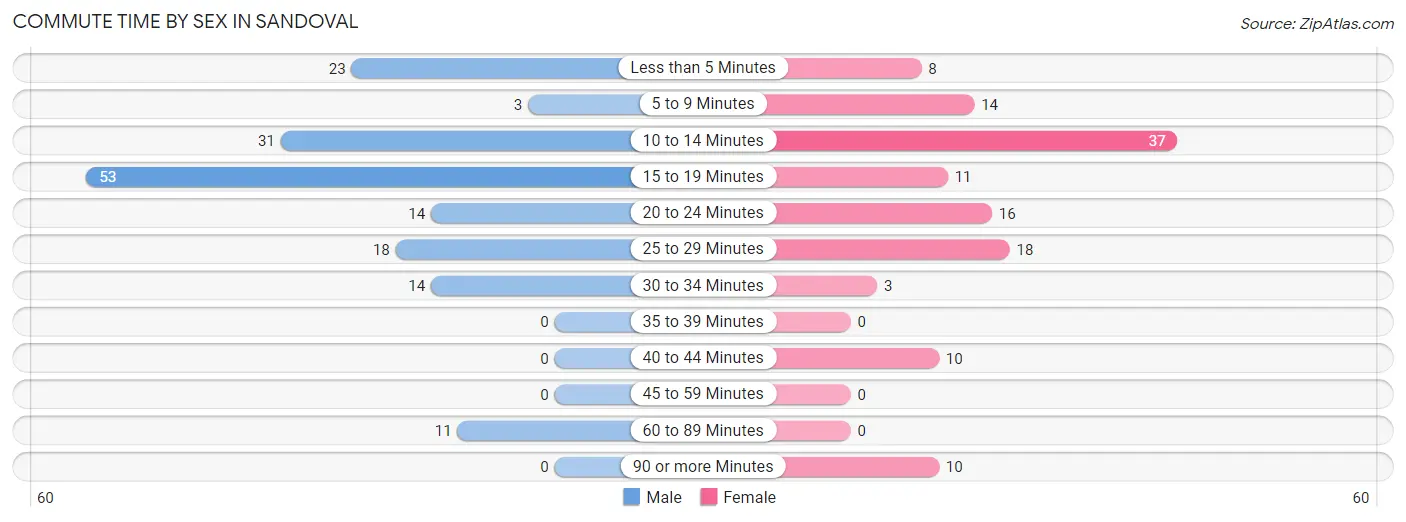
| Commute Time | Male | Female |
| Less than 5 Minutes | 23 (13.8%) | 8 (6.3%) |
| 5 to 9 Minutes | 3 (1.8%) | 14 (11.0%) |
| 10 to 14 Minutes | 31 (18.6%) | 37 (29.1%) |
| 15 to 19 Minutes | 53 (31.7%) | 11 (8.7%) |
| 20 to 24 Minutes | 14 (8.4%) | 16 (12.6%) |
| 25 to 29 Minutes | 18 (10.8%) | 18 (14.2%) |
| 30 to 34 Minutes | 14 (8.4%) | 3 (2.4%) |
| 35 to 39 Minutes | 0 (0.0%) | 0 (0.0%) |
| 40 to 44 Minutes | 0 (0.0%) | 10 (7.9%) |
| 45 to 59 Minutes | 0 (0.0%) | 0 (0.0%) |
| 60 to 89 Minutes | 11 (6.6%) | 0 (0.0%) |
| 90 or more Minutes | 0 (0.0%) | 10 (7.9%) |
Time of Departure to Work by Sex in Sandoval
The most frequent times of departure to work in Sandoval are 12:00 PM to 3:59 PM (40, 23.9%) for males and 12:00 PM to 3:59 PM (22, 17.3%) for females.
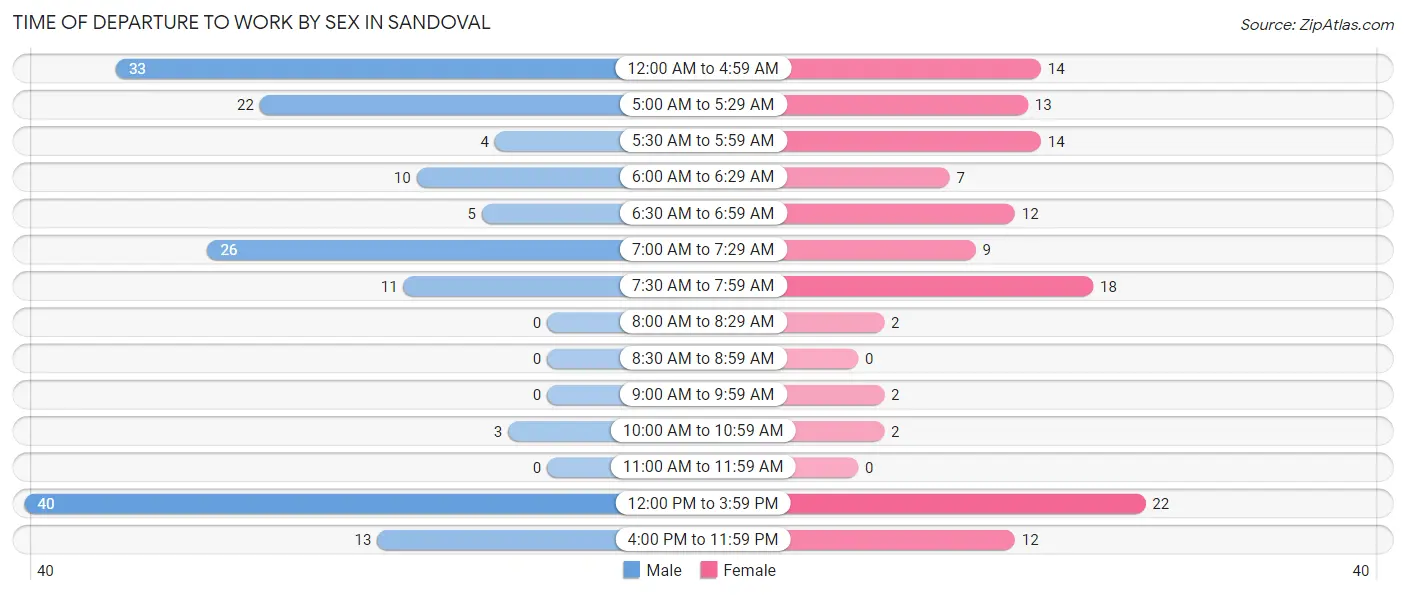
| Time of Departure | Male | Female |
| 12:00 AM to 4:59 AM | 33 (19.8%) | 14 (11.0%) |
| 5:00 AM to 5:29 AM | 22 (13.2%) | 13 (10.2%) |
| 5:30 AM to 5:59 AM | 4 (2.4%) | 14 (11.0%) |
| 6:00 AM to 6:29 AM | 10 (6.0%) | 7 (5.5%) |
| 6:30 AM to 6:59 AM | 5 (3.0%) | 12 (9.5%) |
| 7:00 AM to 7:29 AM | 26 (15.6%) | 9 (7.1%) |
| 7:30 AM to 7:59 AM | 11 (6.6%) | 18 (14.2%) |
| 8:00 AM to 8:29 AM | 0 (0.0%) | 2 (1.6%) |
| 8:30 AM to 8:59 AM | 0 (0.0%) | 0 (0.0%) |
| 9:00 AM to 9:59 AM | 0 (0.0%) | 2 (1.6%) |
| 10:00 AM to 10:59 AM | 3 (1.8%) | 2 (1.6%) |
| 11:00 AM to 11:59 AM | 0 (0.0%) | 0 (0.0%) |
| 12:00 PM to 3:59 PM | 40 (23.9%) | 22 (17.3%) |
| 4:00 PM to 11:59 PM | 13 (7.8%) | 12 (9.5%) |
| Total | 167 (100.0%) | 127 (100.0%) |
Housing Occupancy in Sandoval
Occupancy by Ownership in Sandoval
Of the total 405 dwellings in Sandoval, owner-occupied units account for 292 (72.1%), while renter-occupied units make up 113 (27.9%).
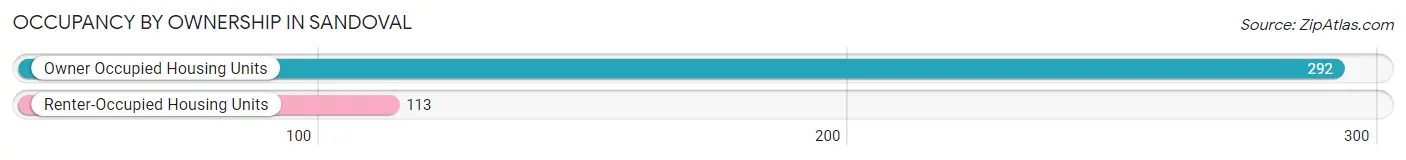
| Occupancy | # Housing Units | % Housing Units |
| Owner Occupied Housing Units | 292 | 72.1% |
| Renter-Occupied Housing Units | 113 | 27.9% |
| Total Occupied Housing Units | 405 | 100.0% |
Occupancy by Household Size in Sandoval
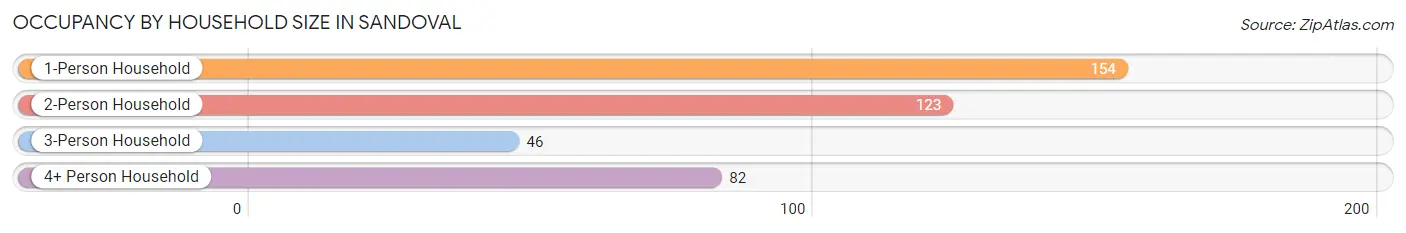
| Household Size | # Housing Units | % Housing Units |
| 1-Person Household | 154 | 38.0% |
| 2-Person Household | 123 | 30.4% |
| 3-Person Household | 46 | 11.4% |
| 4+ Person Household | 82 | 20.3% |
| Total Housing Units | 405 | 100.0% |
Occupancy by Ownership by Household Size in Sandoval
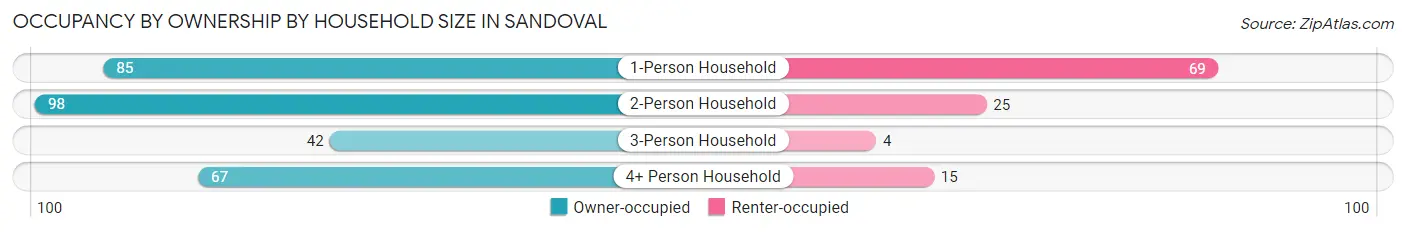
| Household Size | Owner-occupied | Renter-occupied |
| 1-Person Household | 85 (55.2%) | 69 (44.8%) |
| 2-Person Household | 98 (79.7%) | 25 (20.3%) |
| 3-Person Household | 42 (91.3%) | 4 (8.7%) |
| 4+ Person Household | 67 (81.7%) | 15 (18.3%) |
| Total Housing Units | 292 (72.1%) | 113 (27.9%) |
Occupancy by Educational Attainment in Sandoval
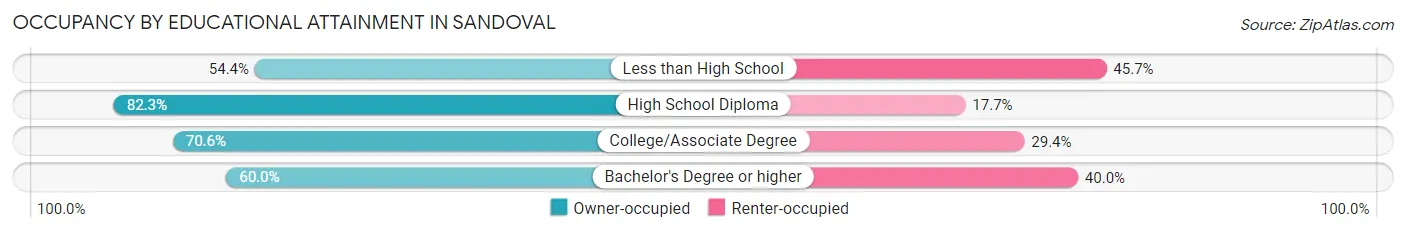
| Household Size | Owner-occupied | Renter-occupied |
| Less than High School | 25 (54.3%) | 21 (45.7%) |
| High School Diploma | 121 (82.3%) | 26 (17.7%) |
| College/Associate Degree | 125 (70.6%) | 52 (29.4%) |
| Bachelor's Degree or higher | 21 (60.0%) | 14 (40.0%) |
Occupancy by Age of Householder in Sandoval
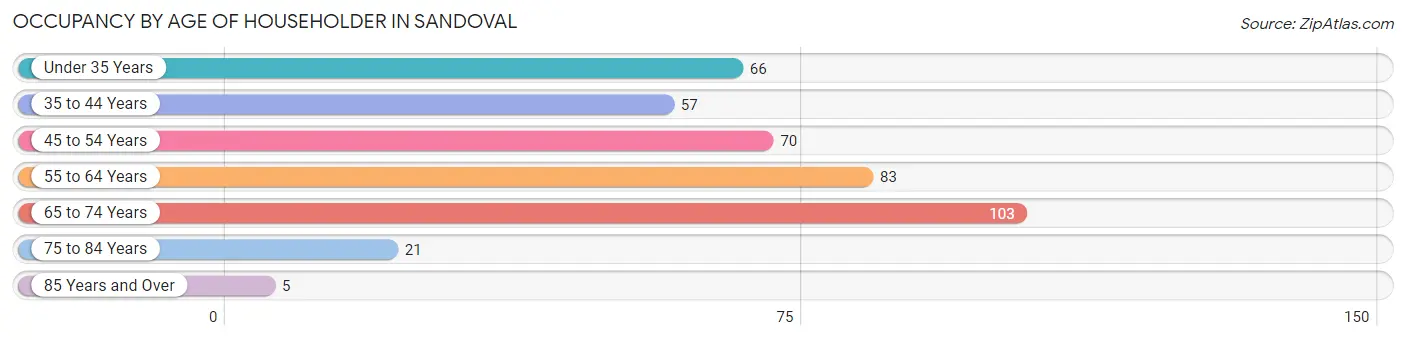
| Age Bracket | # Households | % Households |
| Under 35 Years | 66 | 16.3% |
| 35 to 44 Years | 57 | 14.1% |
| 45 to 54 Years | 70 | 17.3% |
| 55 to 64 Years | 83 | 20.5% |
| 65 to 74 Years | 103 | 25.4% |
| 75 to 84 Years | 21 | 5.2% |
| 85 Years and Over | 5 | 1.2% |
| Total | 405 | 100.0% |
Housing Finances in Sandoval
Median Income by Occupancy in Sandoval
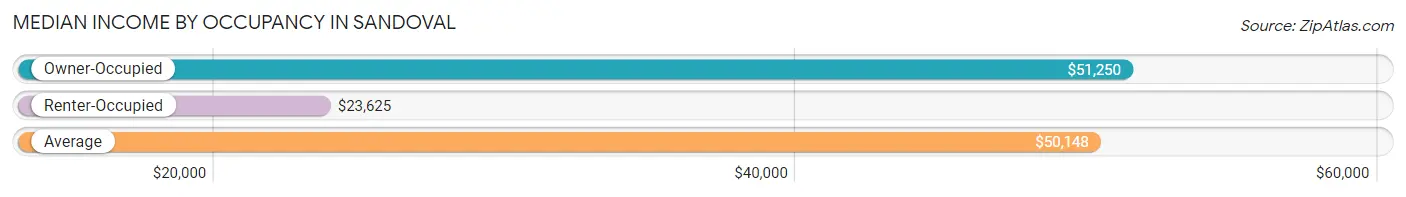
| Occupancy Type | # Households | Median Income |
| Owner-Occupied | 292 (72.1%) | $51,250 |
| Renter-Occupied | 113 (27.9%) | $23,625 |
| Average | 405 (100.0%) | $50,148 |
Occupancy by Householder Income Bracket in Sandoval
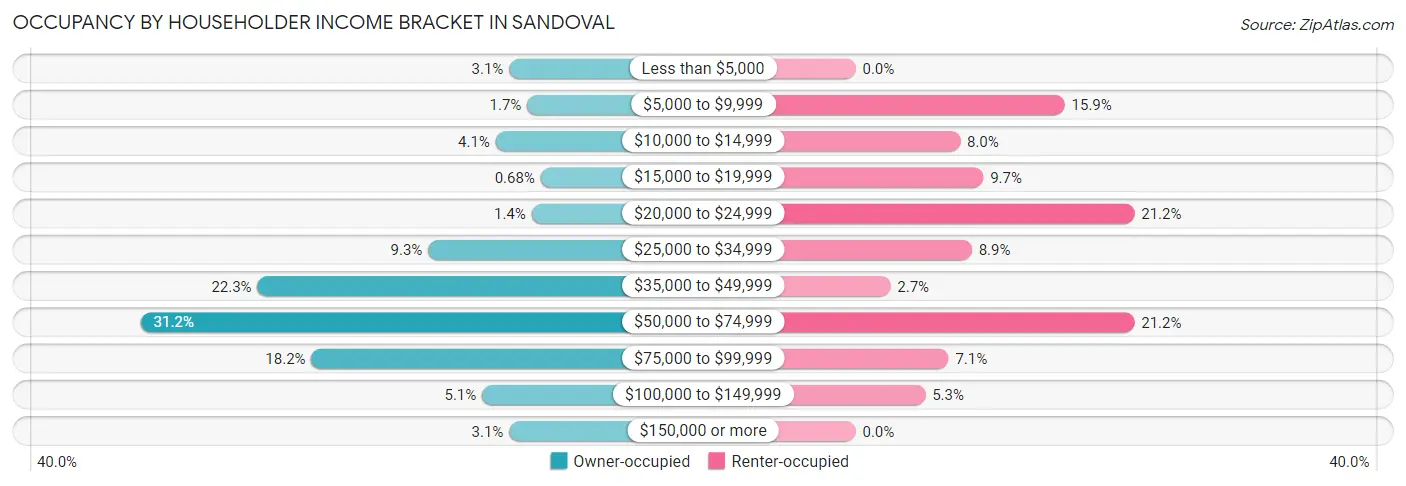
| Income Bracket | Owner-occupied | Renter-occupied |
| Less than $5,000 | 9 (3.1%) | 0 (0.0%) |
| $5,000 to $9,999 | 5 (1.7%) | 18 (15.9%) |
| $10,000 to $14,999 | 12 (4.1%) | 9 (8.0%) |
| $15,000 to $19,999 | 2 (0.7%) | 11 (9.7%) |
| $20,000 to $24,999 | 4 (1.4%) | 24 (21.2%) |
| $25,000 to $34,999 | 27 (9.2%) | 10 (8.8%) |
| $35,000 to $49,999 | 65 (22.3%) | 3 (2.6%) |
| $50,000 to $74,999 | 91 (31.2%) | 24 (21.2%) |
| $75,000 to $99,999 | 53 (18.1%) | 8 (7.1%) |
| $100,000 to $149,999 | 15 (5.1%) | 6 (5.3%) |
| $150,000 or more | 9 (3.1%) | 0 (0.0%) |
| Total | 292 (100.0%) | 113 (100.0%) |
Monthly Housing Cost Tiers in Sandoval
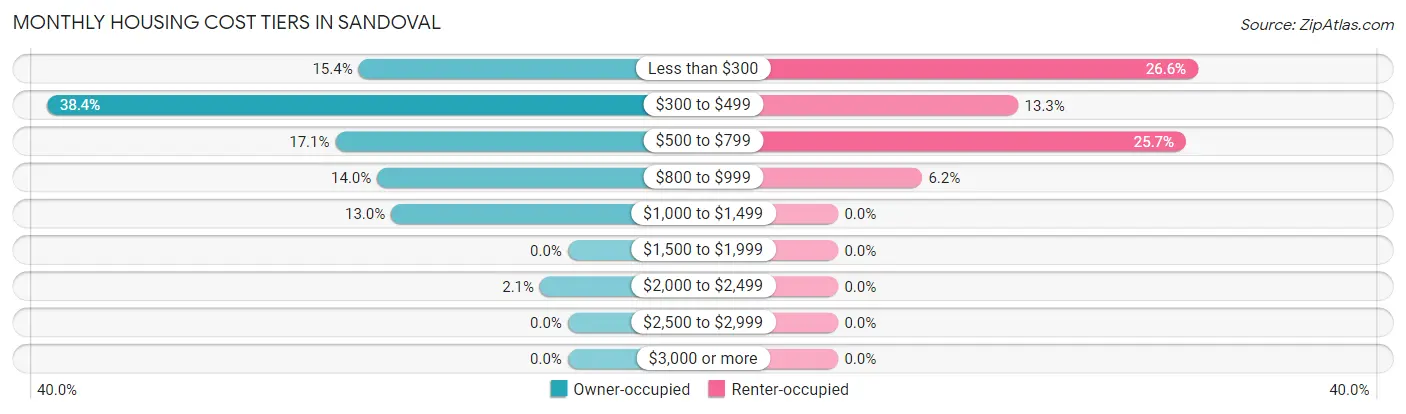
| Monthly Cost | Owner-occupied | Renter-occupied |
| Less than $300 | 45 (15.4%) | 30 (26.6%) |
| $300 to $499 | 112 (38.4%) | 15 (13.3%) |
| $500 to $799 | 50 (17.1%) | 29 (25.7%) |
| $800 to $999 | 41 (14.0%) | 7 (6.2%) |
| $1,000 to $1,499 | 38 (13.0%) | 0 (0.0%) |
| $1,500 to $1,999 | 0 (0.0%) | 0 (0.0%) |
| $2,000 to $2,499 | 6 (2.1%) | 0 (0.0%) |
| $2,500 to $2,999 | 0 (0.0%) | 0 (0.0%) |
| $3,000 or more | 0 (0.0%) | 0 (0.0%) |
| Total | 292 (100.0%) | 113 (100.0%) |
Physical Housing Characteristics in Sandoval
Housing Structures in Sandoval
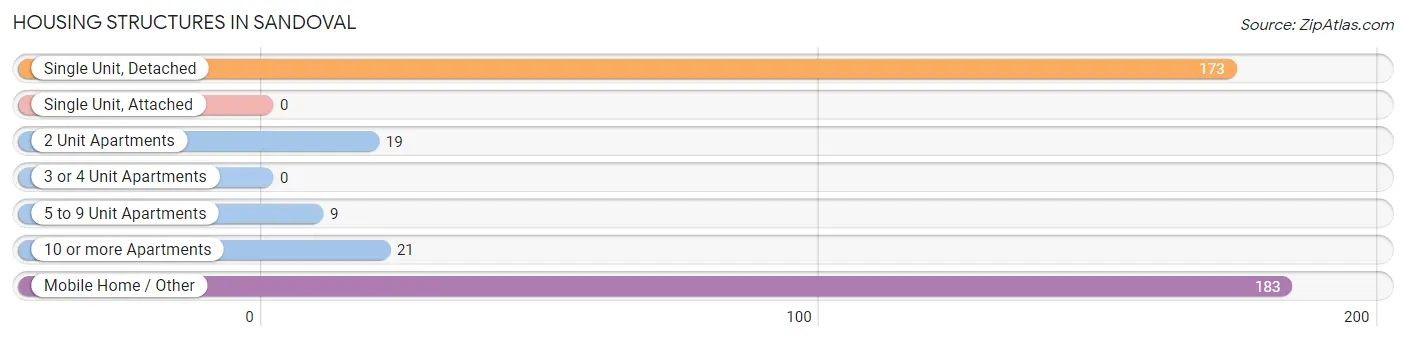
| Structure Type | # Housing Units | % Housing Units |
| Single Unit, Detached | 173 | 42.7% |
| Single Unit, Attached | 0 | 0.0% |
| 2 Unit Apartments | 19 | 4.7% |
| 3 or 4 Unit Apartments | 0 | 0.0% |
| 5 to 9 Unit Apartments | 9 | 2.2% |
| 10 or more Apartments | 21 | 5.2% |
| Mobile Home / Other | 183 | 45.2% |
| Total | 405 | 100.0% |
Housing Structures by Occupancy in Sandoval

| Structure Type | Owner-occupied | Renter-occupied |
| Single Unit, Detached | 123 (71.1%) | 50 (28.9%) |
| Single Unit, Attached | 0 (0.0%) | 0 (0.0%) |
| 2 Unit Apartments | 9 (47.4%) | 10 (52.6%) |
| 3 or 4 Unit Apartments | 0 (0.0%) | 0 (0.0%) |
| 5 to 9 Unit Apartments | 0 (0.0%) | 9 (100.0%) |
| 10 or more Apartments | 0 (0.0%) | 21 (100.0%) |
| Mobile Home / Other | 160 (87.4%) | 23 (12.6%) |
| Total | 292 (72.1%) | 113 (27.9%) |
Housing Structures by Number of Rooms in Sandoval
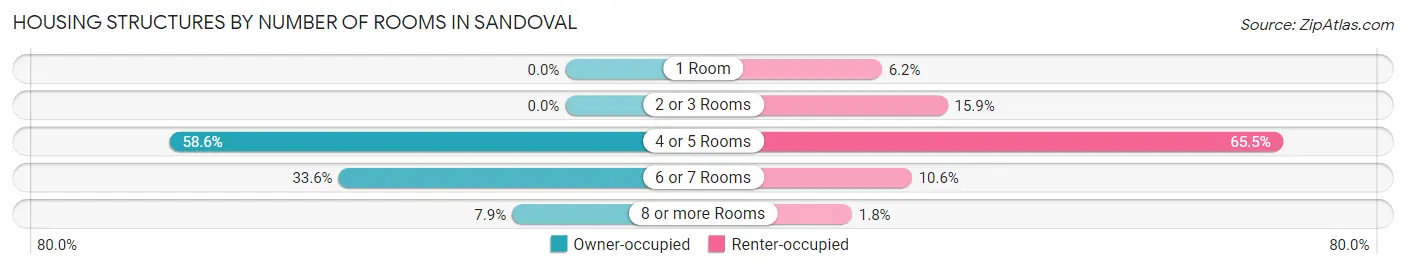
| Number of Rooms | Owner-occupied | Renter-occupied |
| 1 Room | 0 (0.0%) | 7 (6.2%) |
| 2 or 3 Rooms | 0 (0.0%) | 18 (15.9%) |
| 4 or 5 Rooms | 171 (58.6%) | 74 (65.5%) |
| 6 or 7 Rooms | 98 (33.6%) | 12 (10.6%) |
| 8 or more Rooms | 23 (7.9%) | 2 (1.8%) |
| Total | 292 (100.0%) | 113 (100.0%) |
Housing Structure by Heating Type in Sandoval
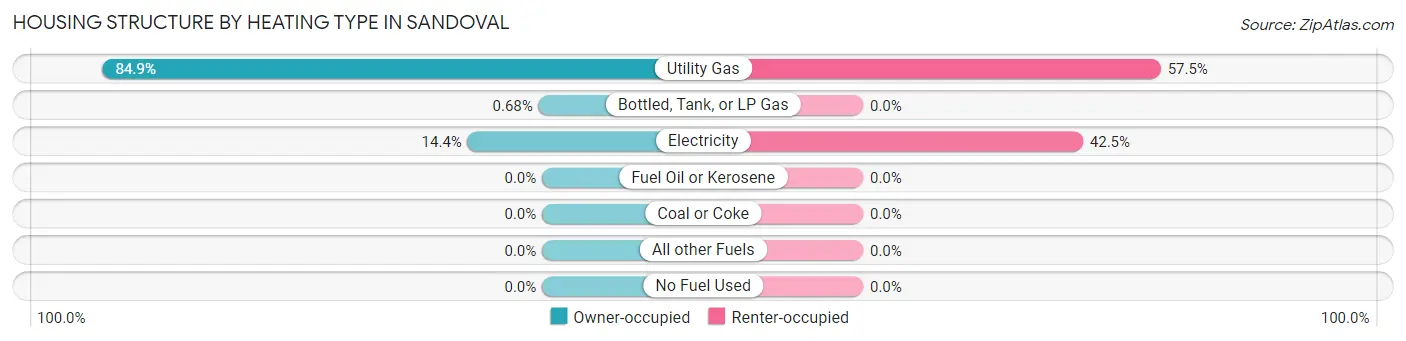
| Heating Type | Owner-occupied | Renter-occupied |
| Utility Gas | 248 (84.9%) | 65 (57.5%) |
| Bottled, Tank, or LP Gas | 2 (0.7%) | 0 (0.0%) |
| Electricity | 42 (14.4%) | 48 (42.5%) |
| Fuel Oil or Kerosene | 0 (0.0%) | 0 (0.0%) |
| Coal or Coke | 0 (0.0%) | 0 (0.0%) |
| All other Fuels | 0 (0.0%) | 0 (0.0%) |
| No Fuel Used | 0 (0.0%) | 0 (0.0%) |
| Total | 292 (100.0%) | 113 (100.0%) |
Household Vehicle Usage in Sandoval
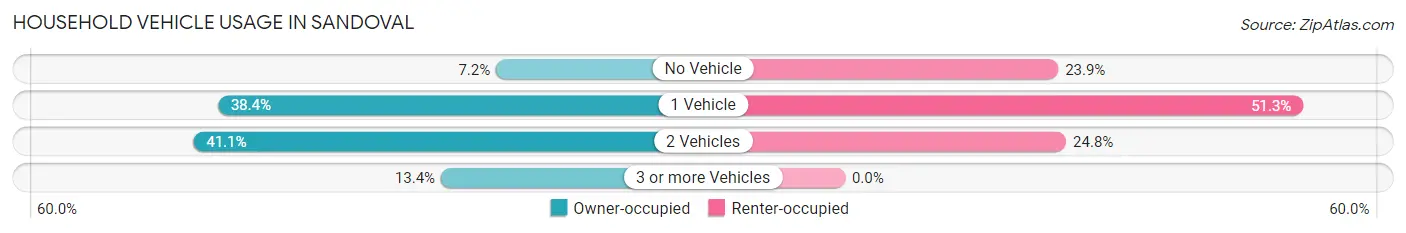
| Vehicles per Household | Owner-occupied | Renter-occupied |
| No Vehicle | 21 (7.2%) | 27 (23.9%) |
| 1 Vehicle | 112 (38.4%) | 58 (51.3%) |
| 2 Vehicles | 120 (41.1%) | 28 (24.8%) |
| 3 or more Vehicles | 39 (13.4%) | 0 (0.0%) |
| Total | 292 (100.0%) | 113 (100.0%) |
Real Estate & Mortgages in Sandoval
Real Estate and Mortgage Overview in Sandoval
| Characteristic | Without Mortgage | With Mortgage |
| Housing Units | 190 | 102 |
| Median Property Value | - | - |
| Median Household Income | $51,193 | $0 |
| Monthly Housing Costs | $402 | $0 |
| Real Estate Taxes | $271 | $19 |
Property Value by Mortgage Status in Sandoval
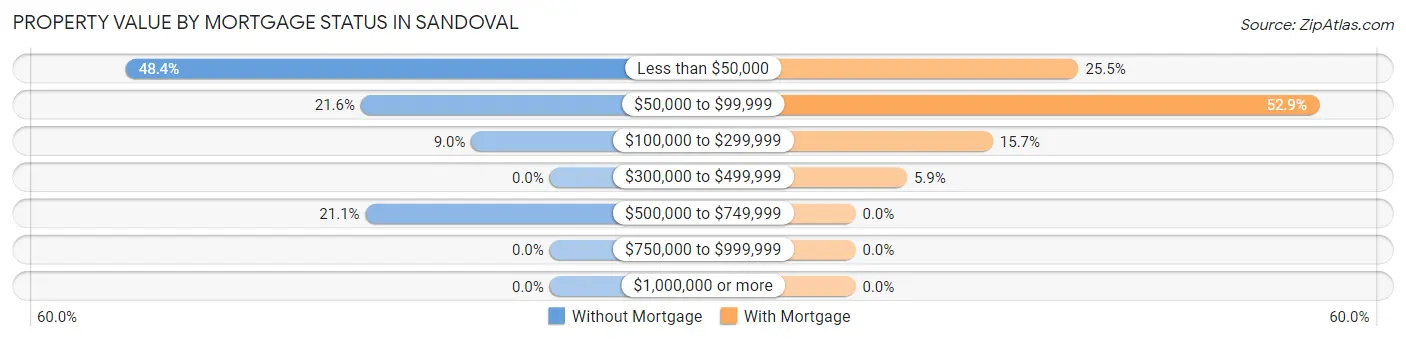
| Property Value | Without Mortgage | With Mortgage |
| Less than $50,000 | 92 (48.4%) | 26 (25.5%) |
| $50,000 to $99,999 | 41 (21.6%) | 54 (52.9%) |
| $100,000 to $299,999 | 17 (8.9%) | 16 (15.7%) |
| $300,000 to $499,999 | 0 (0.0%) | 6 (5.9%) |
| $500,000 to $749,999 | 40 (21.0%) | 0 (0.0%) |
| $750,000 to $999,999 | 0 (0.0%) | 0 (0.0%) |
| $1,000,000 or more | 0 (0.0%) | 0 (0.0%) |
| Total | 190 (100.0%) | 102 (100.0%) |
Household Income by Mortgage Status in Sandoval
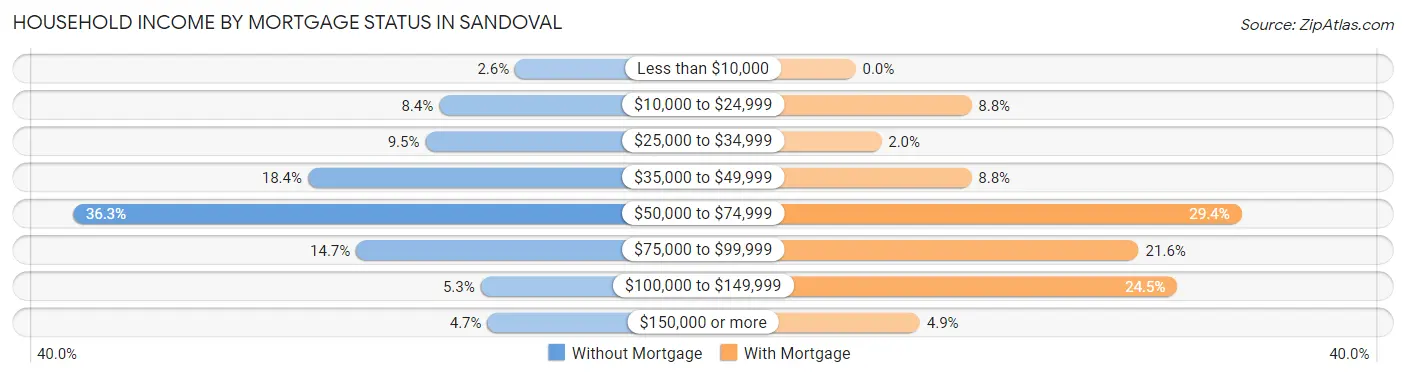
| Household Income | Without Mortgage | With Mortgage |
| Less than $10,000 | 5 (2.6%) | 0 (0.0%) |
| $10,000 to $24,999 | 16 (8.4%) | 9 (8.8%) |
| $25,000 to $34,999 | 18 (9.5%) | 2 (2.0%) |
| $35,000 to $49,999 | 35 (18.4%) | 9 (8.8%) |
| $50,000 to $74,999 | 69 (36.3%) | 30 (29.4%) |
| $75,000 to $99,999 | 28 (14.7%) | 22 (21.6%) |
| $100,000 to $149,999 | 10 (5.3%) | 25 (24.5%) |
| $150,000 or more | 9 (4.7%) | 5 (4.9%) |
| Total | 190 (100.0%) | 102 (100.0%) |
Property Value to Household Income Ratio in Sandoval
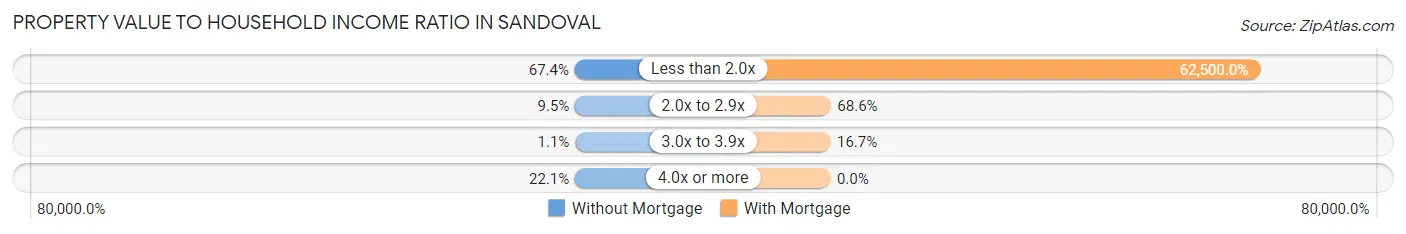
| Value-to-Income Ratio | Without Mortgage | With Mortgage |
| Less than 2.0x | 128 (67.4%) | 63,750 (62,500.0%) |
| 2.0x to 2.9x | 18 (9.5%) | 70 (68.6%) |
| 3.0x to 3.9x | 2 (1.1%) | 17 (16.7%) |
| 4.0x or more | 42 (22.1%) | 0 (0.0%) |
| Total | 190 (100.0%) | 102 (100.0%) |
Real Estate Taxes by Mortgage Status in Sandoval
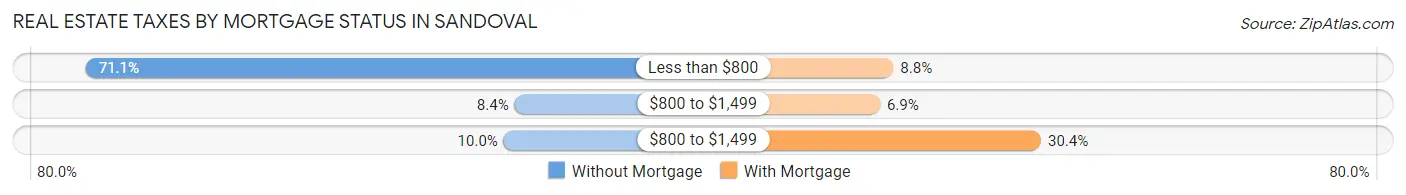
| Property Taxes | Without Mortgage | With Mortgage |
| Less than $800 | 135 (71.1%) | 9 (8.8%) |
| $800 to $1,499 | 16 (8.4%) | 7 (6.9%) |
| $800 to $1,499 | 19 (10.0%) | 31 (30.4%) |
| Total | 190 (100.0%) | 102 (100.0%) |
Health & Disability in Sandoval
Health Insurance Coverage by Age in Sandoval
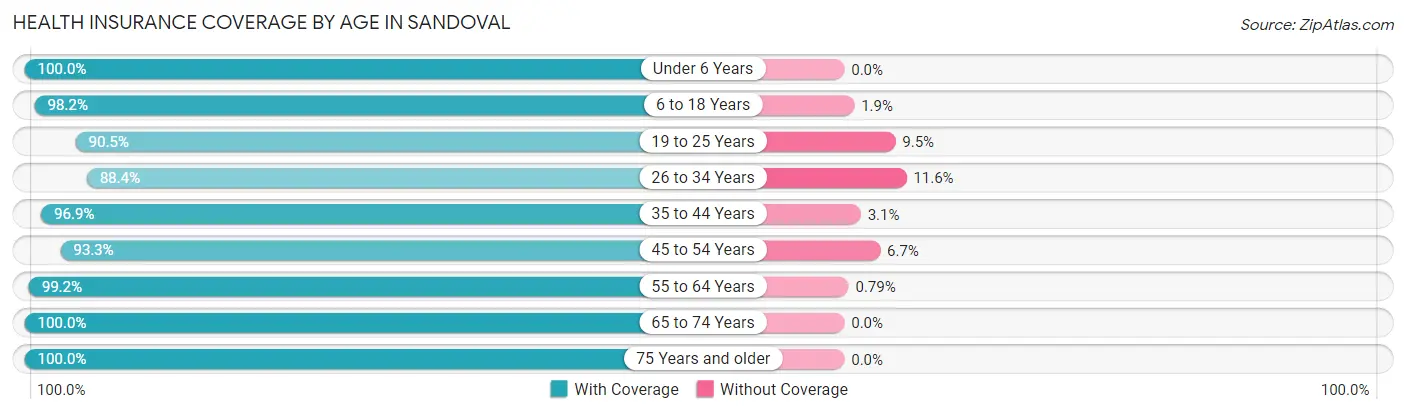
| Age Bracket | With Coverage | Without Coverage |
| Under 6 Years | 42 (100.0%) | 0 (0.0%) |
| 6 to 18 Years | 159 (98.2%) | 3 (1.8%) |
| 19 to 25 Years | 38 (90.5%) | 4 (9.5%) |
| 26 to 34 Years | 122 (88.4%) | 16 (11.6%) |
| 35 to 44 Years | 158 (96.9%) | 5 (3.1%) |
| 45 to 54 Years | 112 (93.3%) | 8 (6.7%) |
| 55 to 64 Years | 126 (99.2%) | 1 (0.8%) |
| 65 to 74 Years | 155 (100.0%) | 0 (0.0%) |
| 75 Years and older | 33 (100.0%) | 0 (0.0%) |
| Total | 945 (96.2%) | 37 (3.8%) |
Health Insurance Coverage by Citizenship Status in Sandoval
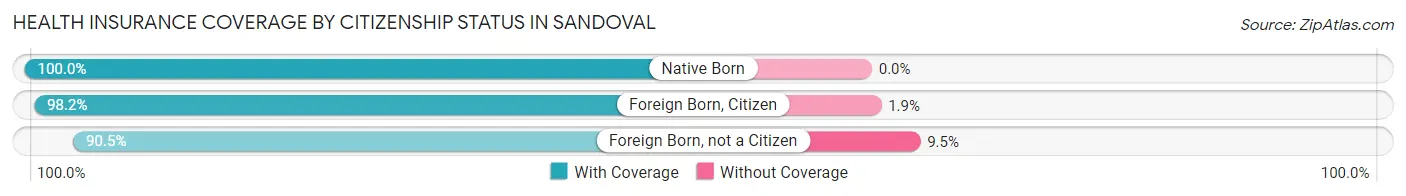
| Citizenship Status | With Coverage | Without Coverage |
| Native Born | 42 (100.0%) | 0 (0.0%) |
| Foreign Born, Citizen | 159 (98.2%) | 3 (1.8%) |
| Foreign Born, not a Citizen | 38 (90.5%) | 4 (9.5%) |
Health Insurance Coverage by Household Income in Sandoval
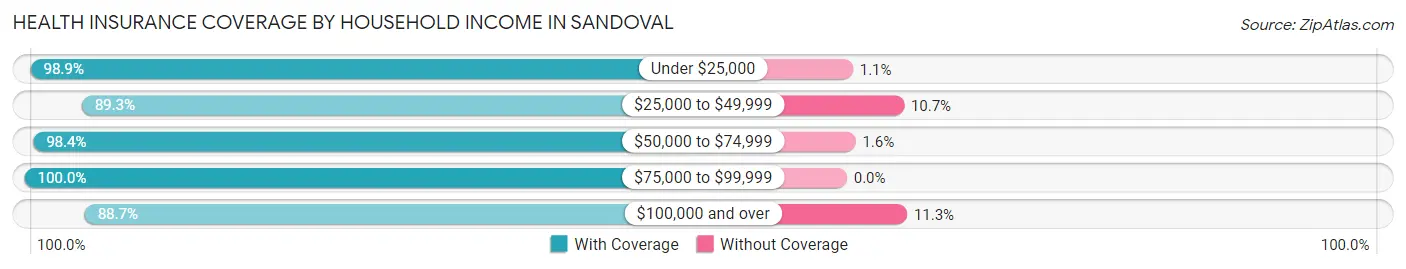
| Household Income | With Coverage | Without Coverage |
| Under $25,000 | 177 (98.9%) | 2 (1.1%) |
| $25,000 to $49,999 | 175 (89.3%) | 21 (10.7%) |
| $50,000 to $74,999 | 365 (98.4%) | 6 (1.6%) |
| $75,000 to $99,999 | 165 (100.0%) | 0 (0.0%) |
| $100,000 and over | 63 (88.7%) | 8 (11.3%) |
Public vs Private Health Insurance Coverage by Age in Sandoval
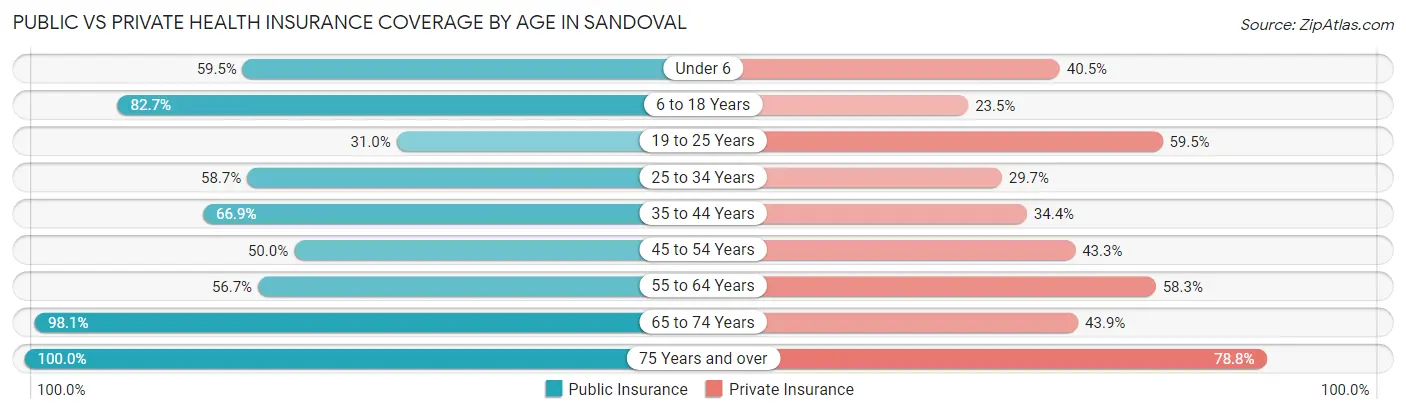
| Age Bracket | Public Insurance | Private Insurance |
| Under 6 | 25 (59.5%) | 17 (40.5%) |
| 6 to 18 Years | 134 (82.7%) | 38 (23.5%) |
| 19 to 25 Years | 13 (30.9%) | 25 (59.5%) |
| 25 to 34 Years | 81 (58.7%) | 41 (29.7%) |
| 35 to 44 Years | 109 (66.9%) | 56 (34.4%) |
| 45 to 54 Years | 60 (50.0%) | 52 (43.3%) |
| 55 to 64 Years | 72 (56.7%) | 74 (58.3%) |
| 65 to 74 Years | 152 (98.1%) | 68 (43.9%) |
| 75 Years and over | 33 (100.0%) | 26 (78.8%) |
| Total | 679 (69.1%) | 397 (40.4%) |
Disability Status by Sex by Age in Sandoval
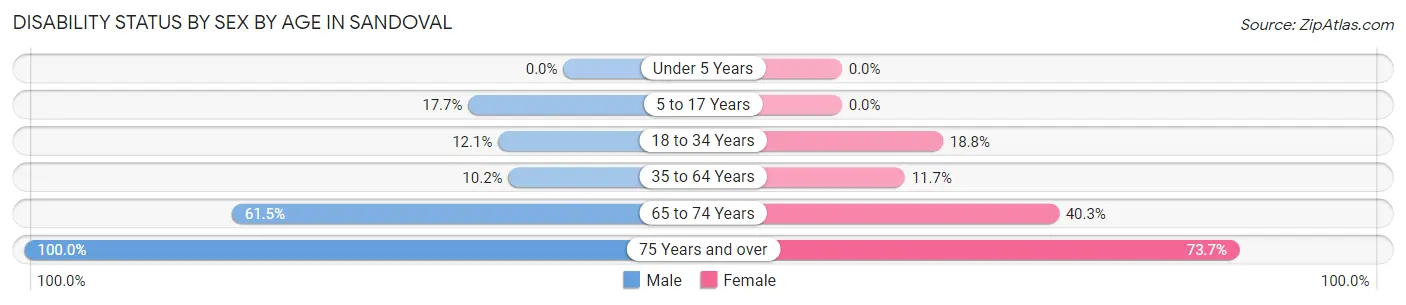
| Age Bracket | Male | Female |
| Under 5 Years | 0 (0.0%) | 0 (0.0%) |
| 5 to 17 Years | 18 (17.6%) | 0 (0.0%) |
| 18 to 34 Years | 11 (12.1%) | 18 (18.8%) |
| 35 to 64 Years | 20 (10.2%) | 25 (11.7%) |
| 65 to 74 Years | 48 (61.5%) | 31 (40.3%) |
| 75 Years and over | 14 (100.0%) | 14 (73.7%) |
Disability Class by Sex by Age in Sandoval
Disability Class: Hearing Difficulty
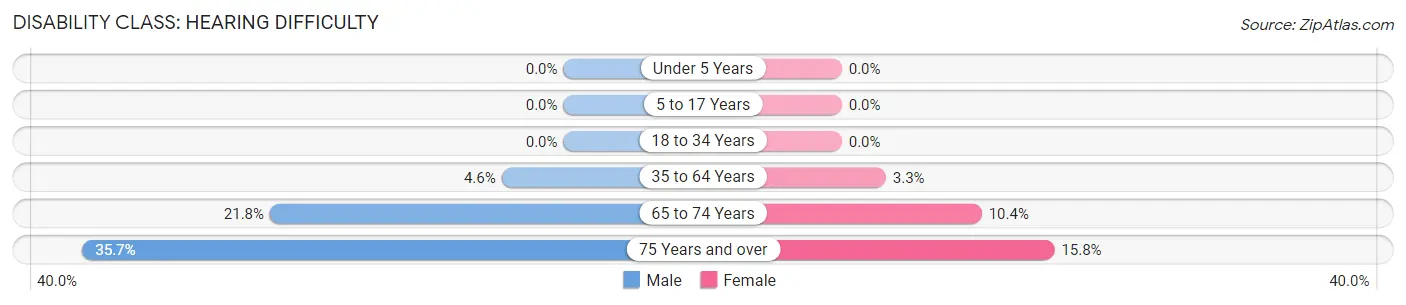
| Age Bracket | Male | Female |
| Under 5 Years | 0 (0.0%) | 0 (0.0%) |
| 5 to 17 Years | 0 (0.0%) | 0 (0.0%) |
| 18 to 34 Years | 0 (0.0%) | 0 (0.0%) |
| 35 to 64 Years | 9 (4.6%) | 7 (3.3%) |
| 65 to 74 Years | 17 (21.8%) | 8 (10.4%) |
| 75 Years and over | 5 (35.7%) | 3 (15.8%) |
Disability Class: Vision Difficulty
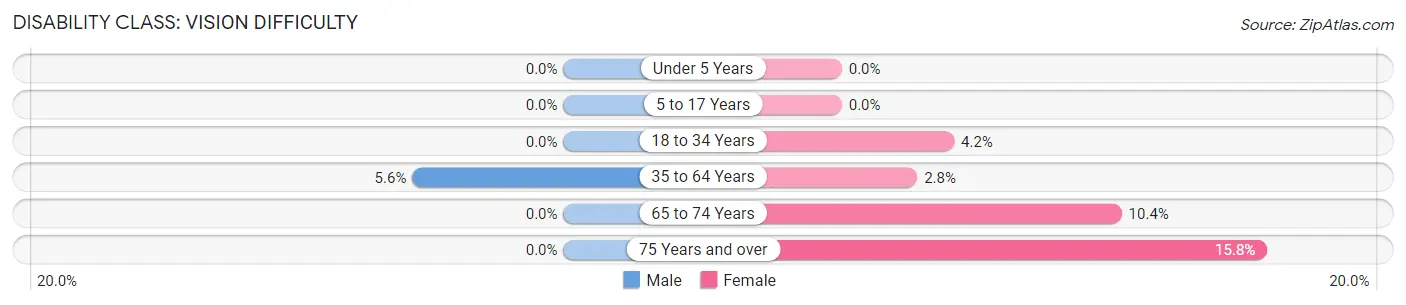
| Age Bracket | Male | Female |
| Under 5 Years | 0 (0.0%) | 0 (0.0%) |
| 5 to 17 Years | 0 (0.0%) | 0 (0.0%) |
| 18 to 34 Years | 0 (0.0%) | 4 (4.2%) |
| 35 to 64 Years | 11 (5.6%) | 6 (2.8%) |
| 65 to 74 Years | 0 (0.0%) | 8 (10.4%) |
| 75 Years and over | 0 (0.0%) | 3 (15.8%) |
Disability Class: Cognitive Difficulty
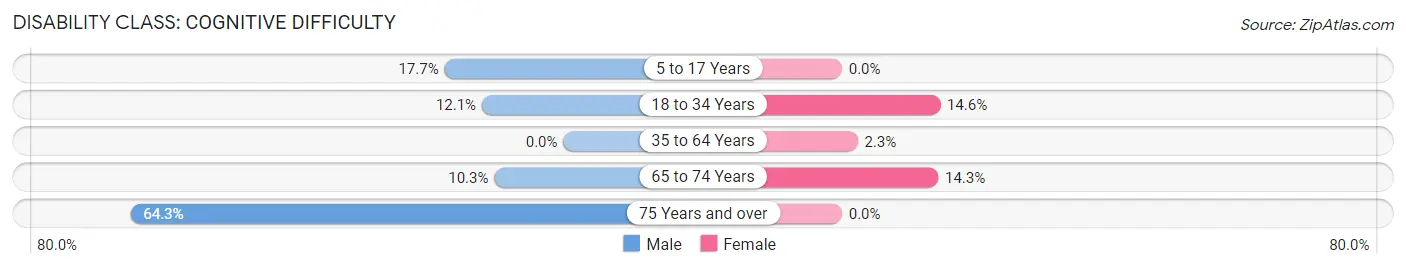
| Age Bracket | Male | Female |
| 5 to 17 Years | 18 (17.6%) | 0 (0.0%) |
| 18 to 34 Years | 11 (12.1%) | 14 (14.6%) |
| 35 to 64 Years | 0 (0.0%) | 5 (2.3%) |
| 65 to 74 Years | 8 (10.3%) | 11 (14.3%) |
| 75 Years and over | 9 (64.3%) | 0 (0.0%) |
Disability Class: Ambulatory Difficulty
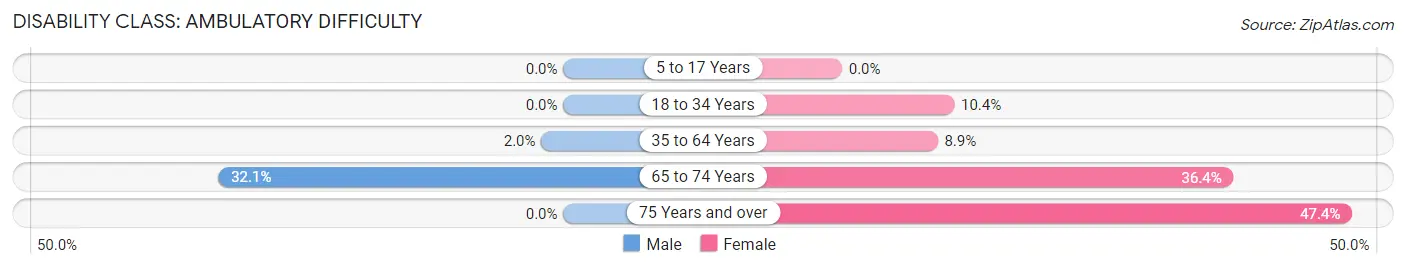
| Age Bracket | Male | Female |
| 5 to 17 Years | 0 (0.0%) | 0 (0.0%) |
| 18 to 34 Years | 0 (0.0%) | 10 (10.4%) |
| 35 to 64 Years | 4 (2.0%) | 19 (8.9%) |
| 65 to 74 Years | 25 (32.1%) | 28 (36.4%) |
| 75 Years and over | 0 (0.0%) | 9 (47.4%) |
Disability Class: Self-Care Difficulty
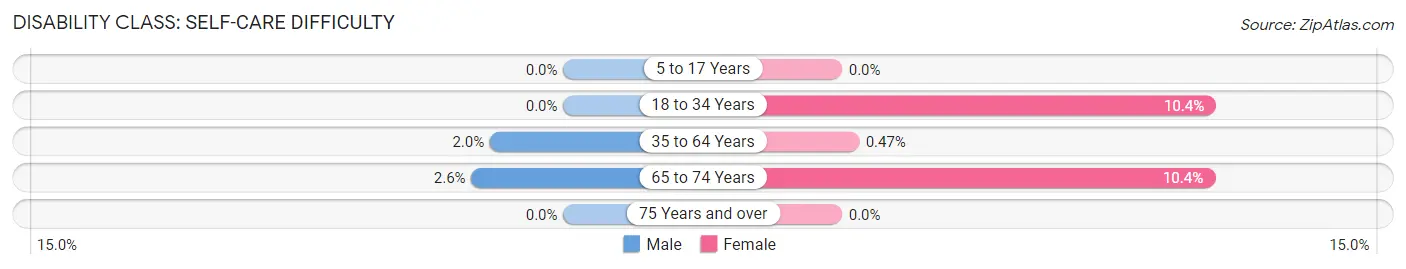
| Age Bracket | Male | Female |
| 5 to 17 Years | 0 (0.0%) | 0 (0.0%) |
| 18 to 34 Years | 0 (0.0%) | 10 (10.4%) |
| 35 to 64 Years | 4 (2.0%) | 1 (0.5%) |
| 65 to 74 Years | 2 (2.6%) | 8 (10.4%) |
| 75 Years and over | 0 (0.0%) | 0 (0.0%) |
Technology Access in Sandoval
Computing Device Access in Sandoval
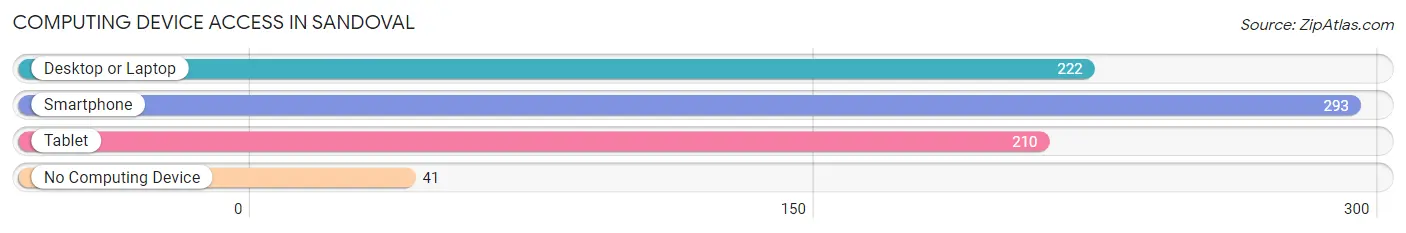
| Device Type | # Households | % Households |
| Desktop or Laptop | 222 | 54.8% |
| Smartphone | 293 | 72.4% |
| Tablet | 210 | 51.8% |
| No Computing Device | 41 | 10.1% |
| Total | 405 | 100.0% |
Internet Access in Sandoval
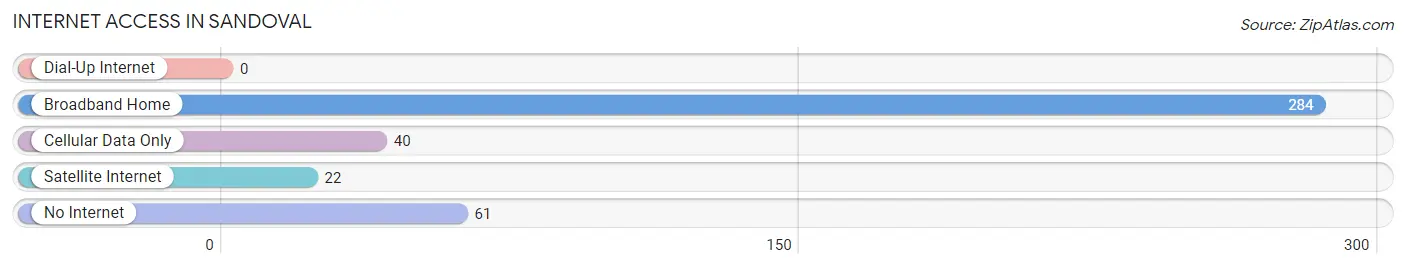
| Internet Type | # Households | % Households |
| Dial-Up Internet | 0 | 0.0% |
| Broadband Home | 284 | 70.1% |
| Cellular Data Only | 40 | 9.9% |
| Satellite Internet | 22 | 5.4% |
| No Internet | 61 | 15.1% |
| Total | 405 | 100.0% |
Sandoval Summary
History
Sandoval, Illinois is a small village located in Marion County, Illinois. It is situated on the banks of the Kaskaskia River, approximately 25 miles east of Centralia. The village was founded in 1836 by a group of settlers from Kentucky, led by William Sandoval. The settlers were attracted to the area due to its fertile soil and abundant natural resources.
The village was originally known as Sandoval’s Settlement, but was later changed to Sandoval in 1839. The village was incorporated in 1854 and has remained a small, rural community ever since.
The village was a major stop on the Illinois Central Railroad, which ran through the area from 1854 to 1971. The railroad provided a major economic boost to the village, as it allowed for the transportation of goods and people to and from the area.
The village was also home to a number of businesses, including a flour mill, a sawmill, a blacksmith shop, a general store, and a hotel. The village also had a post office, which opened in 1854 and is still in operation today.
The village was also home to a number of churches, including the First Baptist Church, which was founded in 1854. The church is still in operation today and is the oldest church in the village.
Geography
Sandoval is located in Marion County, Illinois, approximately 25 miles east of Centralia. The village is situated on the banks of the Kaskaskia River, which is a tributary of the Mississippi River. The village is surrounded by rolling hills and farmland, and is located in the heart of the Midwest.
The village has a total area of 0.6 square miles, all of which is land. The village is located at an elevation of 645 feet above sea level.
Economy
The economy of Sandoval is largely based on agriculture. The village is home to a number of farms, which produce a variety of crops, including corn, soybeans, wheat, and hay. The village also has a number of small businesses, including a grocery store, a hardware store, and a restaurant.
The village is also home to a number of manufacturing companies, including a plastics factory and a metal fabrication plant. The village is also home to a number of service-based businesses, including a bank, a post office, and a number of medical and dental offices.
Demographics
As of the 2010 census, the population of Sandoval was 1,093. The population is largely white (97.2%), with a small percentage of African Americans (1.2%) and Hispanics (1.6%). The median household income is $41,250, and the median home value is $90,000.
The village is served by the Sandoval Community Unit School District, which includes an elementary school, a middle school, and a high school. The village is also home to a number of churches, including the First Baptist Church, which was founded in 1854.
Conclusion
Sandoval, Illinois is a small village located in Marion County, Illinois. It is situated on the banks of the Kaskaskia River, approximately 25 miles east of Centralia. The village was founded in 1836 by a group of settlers from Kentucky, led by William Sandoval. The village has a total area of 0.6 square miles, all of which is land. The economy of Sandoval is largely based on agriculture, and the village is home to a number of small businesses. As of the 2010 census, the population of Sandoval was 1,093. The village is served by the Sandoval Community Unit School District, and is home to a number of churches, including the First Baptist Church, which was founded in 1854.
Common Questions
What is Per Capita Income in Sandoval?
Per Capita income in Sandoval is $22,610.
What is the Median Family Income in Sandoval?
Median Family Income in Sandoval is $43,021.
What is the Median Household income in Sandoval?
Median Household Income in Sandoval is $50,148.
What is Income or Wage Gap in Sandoval?
Income or Wage Gap in Sandoval is 55.8%.
Women in Sandoval earn 44.2 cents for every dollar earned by a man.
What is Inequality or Gini Index in Sandoval?
Inequality or Gini Index in Sandoval is 0.37.
What is the Total Population of Sandoval?
Total Population of Sandoval is 982.
What is the Total Male Population of Sandoval?
Total Male Population of Sandoval is 502.
What is the Total Female Population of Sandoval?
Total Female Population of Sandoval is 480.
What is the Ratio of Males per 100 Females in Sandoval?
There are 104.58 Males per 100 Females in Sandoval.
What is the Ratio of Females per 100 Males in Sandoval?
There are 95.62 Females per 100 Males in Sandoval.
What is the Median Population Age in Sandoval?
Median Population Age in Sandoval is 37.8 Years.
What is the Average Family Size in Sandoval
Average Family Size in Sandoval is 3.0 People.
What is the Average Household Size in Sandoval
Average Household Size in Sandoval is 2.4 People.
How Large is the Labor Force in Sandoval?
There are 385 People in the Labor Forcein in Sandoval.
What is the Percentage of People in the Labor Force in Sandoval?
47.1% of People are in the Labor Force in Sandoval.
What is the Unemployment Rate in Sandoval?
Unemployment Rate in Sandoval is 8.8%.