Salem, IL Map & Demographics
Salem Map
Salem Overview
$29,768
PER CAPITA INCOME
$57,260
AVG FAMILY INCOME
$55,536
AVG HOUSEHOLD INCOME
31.6%
WAGE / INCOME GAP [ % ]
68.4¢/ $1
WAGE / INCOME GAP [ $ ]
$11,267
FAMILY INCOME DEFICIT
0.44
INEQUALITY / GINI INDEX
7,228
TOTAL POPULATION
3,354
MALE POPULATION
3,874
FEMALE POPULATION
86.58
MALES / 100 FEMALES
115.50
FEMALES / 100 MALES
36.4
MEDIAN AGE
2.9
AVG FAMILY SIZE
2.4
AVG HOUSEHOLD SIZE
3,633
LABOR FORCE [ PEOPLE ]
63.4%
PERCENT IN LABOR FORCE
4.5%
UNEMPLOYMENT RATE
Salem Zip Codes
Salem Area Codes
Income in Salem
Income Overview in Salem
Per Capita Income in Salem is $29,768, while median incomes of families and households are $57,260 and $55,536 respectively.
| Characteristic | Number | Measure |
| Per Capita Income | 7,228 | $29,768 |
| Median Family Income | 1,826 | $57,260 |
| Mean Family Income | 1,826 | $83,806 |
| Median Household Income | 2,971 | $55,536 |
| Mean Household Income | 2,971 | $70,945 |
| Income Deficit | 1,826 | $11,267 |
| Wage / Income Gap (%) | 7,228 | 31.61% |
| Wage / Income Gap ($) | 7,228 | 68.39¢ per $1 |
| Gini / Inequality Index | 7,228 | 0.44 |
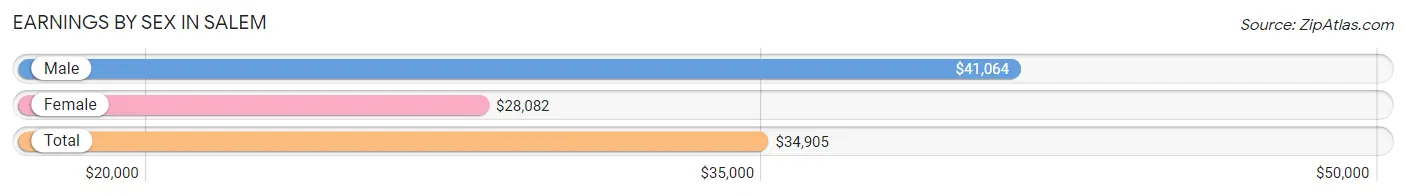
Earnings by Sex in Salem
Average Earnings in Salem are $34,905, $41,064 for men and $28,082 for women, a difference of 31.6%.
| Sex | Number | Average Earnings |
| Male | 1,903 (50.6%) | $41,064 |
| Female | 1,859 (49.4%) | $28,082 |
| Total | 3,762 (100.0%) | $34,905 |
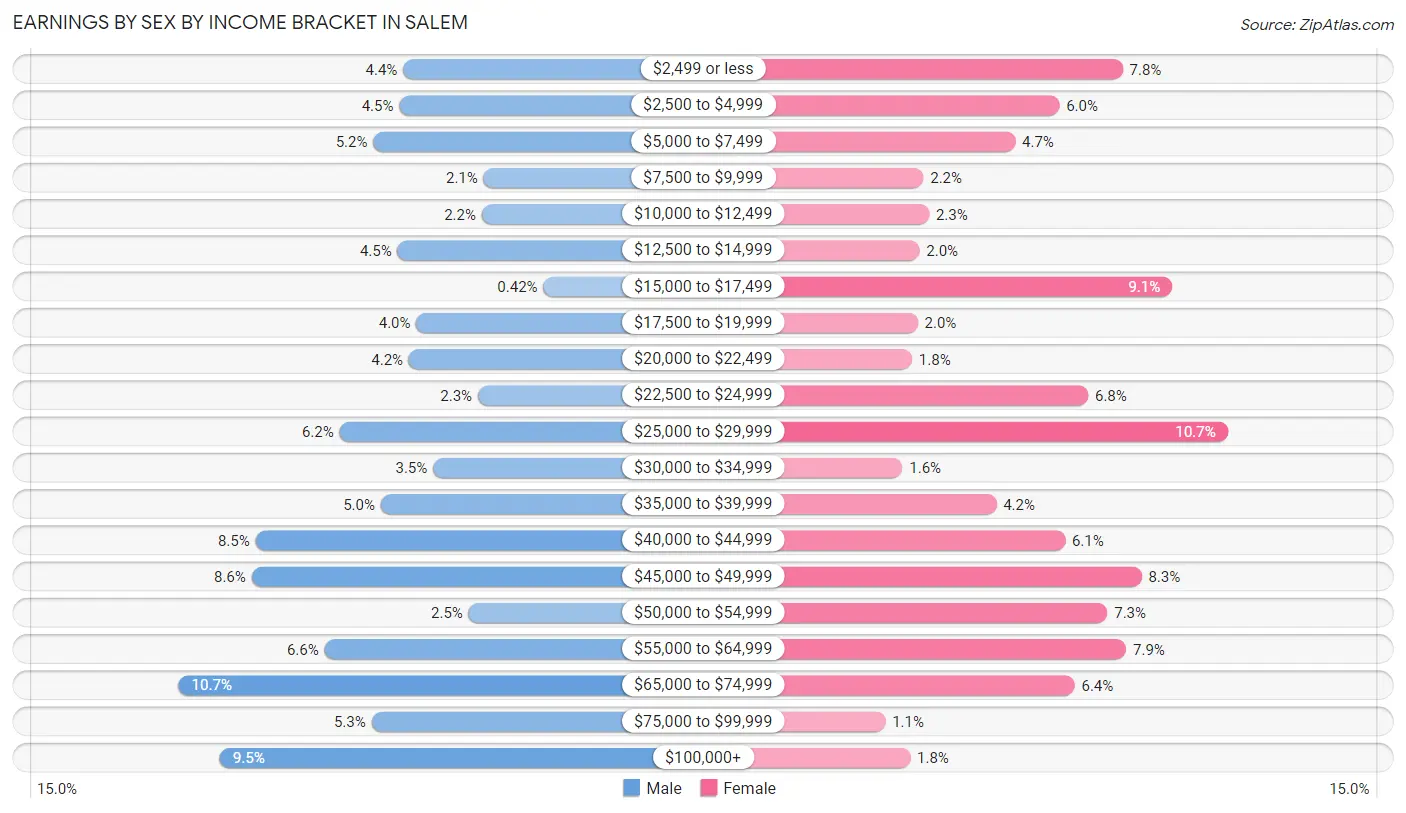
Earnings by Sex by Income Bracket in Salem
The most common earnings brackets in Salem are $65,000 to $74,999 for men (203 | 10.7%) and $25,000 to $29,999 for women (199 | 10.7%).
| Income | Male | Female |
| $2,499 or less | 83 (4.4%) | 144 (7.7%) |
| $2,500 to $4,999 | 85 (4.5%) | 111 (6.0%) |
| $5,000 to $7,499 | 99 (5.2%) | 88 (4.7%) |
| $7,500 to $9,999 | 40 (2.1%) | 40 (2.1%) |
| $10,000 to $12,499 | 41 (2.1%) | 43 (2.3%) |
| $12,500 to $14,999 | 86 (4.5%) | 38 (2.0%) |
| $15,000 to $17,499 | 8 (0.4%) | 170 (9.1%) |
| $17,500 to $19,999 | 76 (4.0%) | 37 (2.0%) |
| $20,000 to $22,499 | 80 (4.2%) | 34 (1.8%) |
| $22,500 to $24,999 | 43 (2.3%) | 126 (6.8%) |
| $25,000 to $29,999 | 117 (6.1%) | 199 (10.7%) |
| $30,000 to $34,999 | 67 (3.5%) | 29 (1.6%) |
| $35,000 to $39,999 | 95 (5.0%) | 78 (4.2%) |
| $40,000 to $44,999 | 162 (8.5%) | 114 (6.1%) |
| $45,000 to $49,999 | 164 (8.6%) | 154 (8.3%) |
| $50,000 to $54,999 | 48 (2.5%) | 136 (7.3%) |
| $55,000 to $64,999 | 125 (6.6%) | 146 (7.9%) |
| $65,000 to $74,999 | 203 (10.7%) | 119 (6.4%) |
| $75,000 to $99,999 | 100 (5.2%) | 20 (1.1%) |
| $100,000+ | 181 (9.5%) | 33 (1.8%) |
| Total | 1,903 (100.0%) | 1,859 (100.0%) |
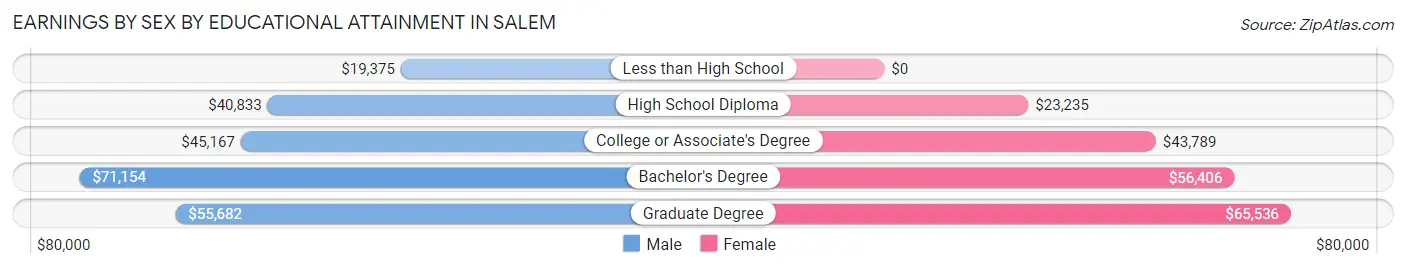
Earnings by Sex by Educational Attainment in Salem
Average earnings in Salem are $45,261 for men and $38,092 for women, a difference of 15.8%. Men with an educational attainment of bachelor's degree enjoy the highest average annual earnings of $71,154, while those with less than high school education earn the least with $19,375. Women with an educational attainment of graduate degree earn the most with the average annual earnings of $65,536, while those with high school diploma education have the smallest earnings of $23,235.
| Educational Attainment | Male Income | Female Income |
| Less than High School | $19,375 | $0 |
| High School Diploma | $40,833 | $23,235 |
| College or Associate's Degree | $45,167 | $43,789 |
| Bachelor's Degree | $71,154 | $56,406 |
| Graduate Degree | $55,682 | $65,536 |
| Total | $45,261 | $38,092 |
Family Income in Salem
Family Income Brackets in Salem
According to the Salem family income data, there are 356 families falling into the $50,000 to $74,999 income range, which is the most common income bracket and makes up 19.5% of all families. Conversely, the $10,000 to $14,999 income bracket is the least frequent group with only 57 families (3.1%) belonging to this category.
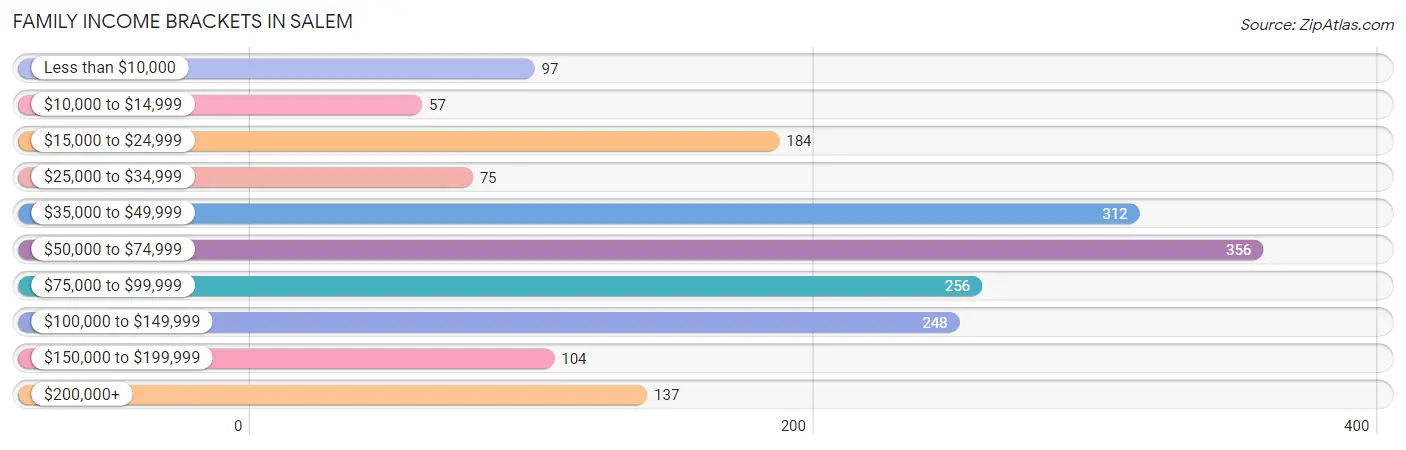
| Income Bracket | # Families | % Families |
| Less than $10,000 | 97 | 5.3% |
| $10,000 to $14,999 | 57 | 3.1% |
| $15,000 to $24,999 | 184 | 10.1% |
| $25,000 to $34,999 | 75 | 4.1% |
| $35,000 to $49,999 | 312 | 17.1% |
| $50,000 to $74,999 | 356 | 19.5% |
| $75,000 to $99,999 | 256 | 14.0% |
| $100,000 to $149,999 | 248 | 13.6% |
| $150,000 to $199,999 | 104 | 5.7% |
| $200,000+ | 137 | 7.5% |
Family Income by Famaliy Size in Salem
3-person families (393 | 21.5%) account for the highest median family income in Salem with $71,250 per family, while 2-person families (914 | 50.0%) have the highest median income of $28,285 per family member.
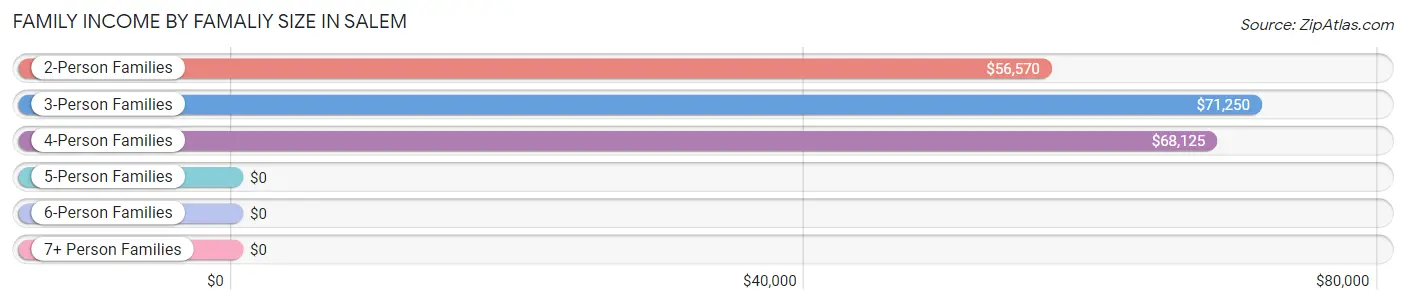
| Income Bracket | # Families | Median Income |
| 2-Person Families | 914 (50.0%) | $56,570 |
| 3-Person Families | 393 (21.5%) | $71,250 |
| 4-Person Families | 364 (19.9%) | $68,125 |
| 5-Person Families | 121 (6.6%) | $0 |
| 6-Person Families | 29 (1.6%) | $0 |
| 7+ Person Families | 5 (0.3%) | $0 |
| Total | 1,826 (100.0%) | $57,260 |
Family Income by Number of Earners in Salem
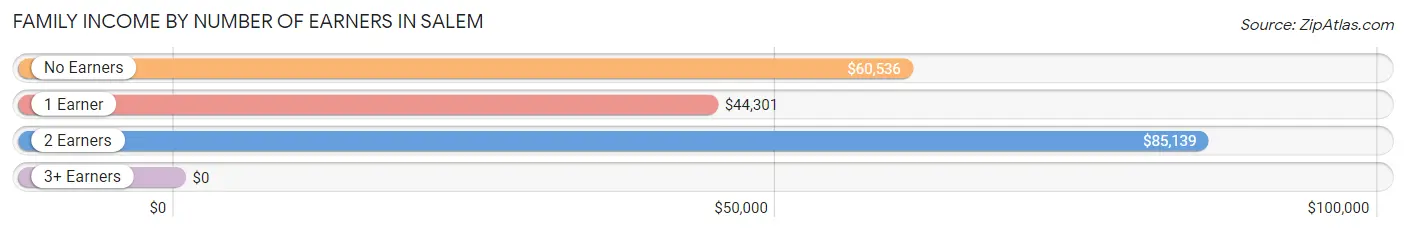
| Number of Earners | # Families | Median Income |
| No Earners | 265 (14.5%) | $60,536 |
| 1 Earner | 721 (39.5%) | $44,301 |
| 2 Earners | 661 (36.2%) | $85,139 |
| 3+ Earners | 179 (9.8%) | $0 |
| Total | 1,826 (100.0%) | $57,260 |
Household Income in Salem
Household Income Brackets in Salem
With 657 households falling in the category, the $50,000 to $74,999 income range is the most frequent in Salem, accounting for 22.1% of all households. In contrast, only 110 households (3.7%) fall into the $150,000 to $199,999 income bracket, making it the least populous group.
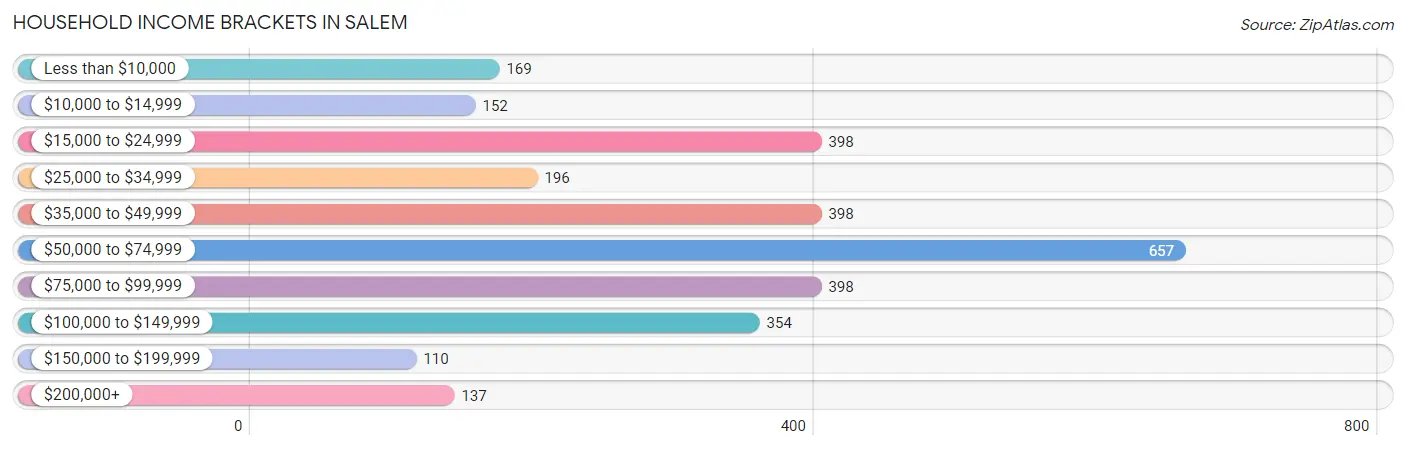
| Income Bracket | # Households | % Households |
| Less than $10,000 | 169 | 5.7% |
| $10,000 to $14,999 | 152 | 5.1% |
| $15,000 to $24,999 | 398 | 13.4% |
| $25,000 to $34,999 | 196 | 6.6% |
| $35,000 to $49,999 | 398 | 13.4% |
| $50,000 to $74,999 | 657 | 22.1% |
| $75,000 to $99,999 | 398 | 13.4% |
| $100,000 to $149,999 | 354 | 11.9% |
| $150,000 to $199,999 | 110 | 3.7% |
| $200,000+ | 137 | 4.6% |
Household Income by Householder Age in Salem
The median household income in Salem is $55,536, with the highest median household income of $71,250 found in the 45 to 64 years age bracket for the primary householder. A total of 902 households (30.4%) fall into this category. Meanwhile, the 15 to 24 years age bracket for the primary householder has the lowest median household income of $27,639, with 70 households (2.4%) in this group.
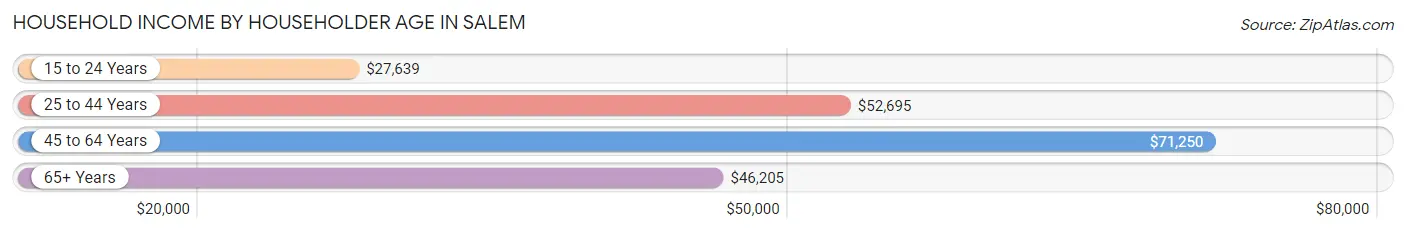
| Income Bracket | # Households | Median Income |
| 15 to 24 Years | 70 (2.4%) | $27,639 |
| 25 to 44 Years | 1,176 (39.6%) | $52,695 |
| 45 to 64 Years | 902 (30.4%) | $71,250 |
| 65+ Years | 823 (27.7%) | $46,205 |
| Total | 2,971 (100.0%) | $55,536 |
Poverty in Salem
Income Below Poverty by Sex and Age in Salem
With 17.6% poverty level for males and 23.7% for females among the residents of Salem, 5 year old males and 5 year old females are the most vulnerable to poverty, with 25 males (56.8%) and 18 females (100.0%) in their respective age groups living below the poverty level.
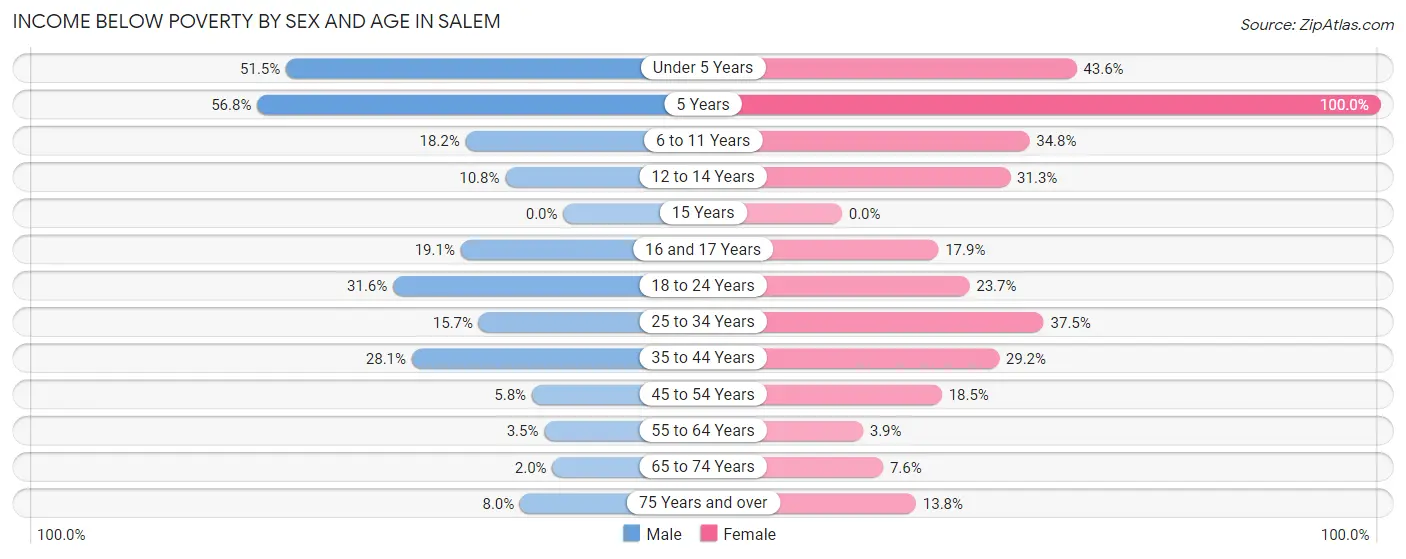
| Age Bracket | Male | Female |
| Under 5 Years | 123 (51.5%) | 108 (43.5%) |
| 5 Years | 25 (56.8%) | 18 (100.0%) |
| 6 to 11 Years | 47 (18.1%) | 119 (34.8%) |
| 12 to 14 Years | 7 (10.8%) | 35 (31.2%) |
| 15 Years | 0 (0.0%) | 0 (0.0%) |
| 16 and 17 Years | 16 (19.1%) | 29 (17.9%) |
| 18 to 24 Years | 85 (31.6%) | 66 (23.7%) |
| 25 to 34 Years | 95 (15.7%) | 212 (37.5%) |
| 35 to 44 Years | 115 (28.1%) | 130 (29.1%) |
| 45 to 54 Years | 21 (5.8%) | 79 (18.5%) |
| 55 to 64 Years | 14 (3.5%) | 13 (3.9%) |
| 65 to 74 Years | 5 (2.0%) | 33 (7.6%) |
| 75 Years and over | 13 (8.0%) | 48 (13.8%) |
| Total | 566 (17.6%) | 890 (23.7%) |
Income Above Poverty by Sex and Age in Salem
According to the poverty statistics in Salem, males aged 15 years and females aged 15 years are the age groups that are most secure financially, with 100.0% of males and 100.0% of females in these age groups living above the poverty line.
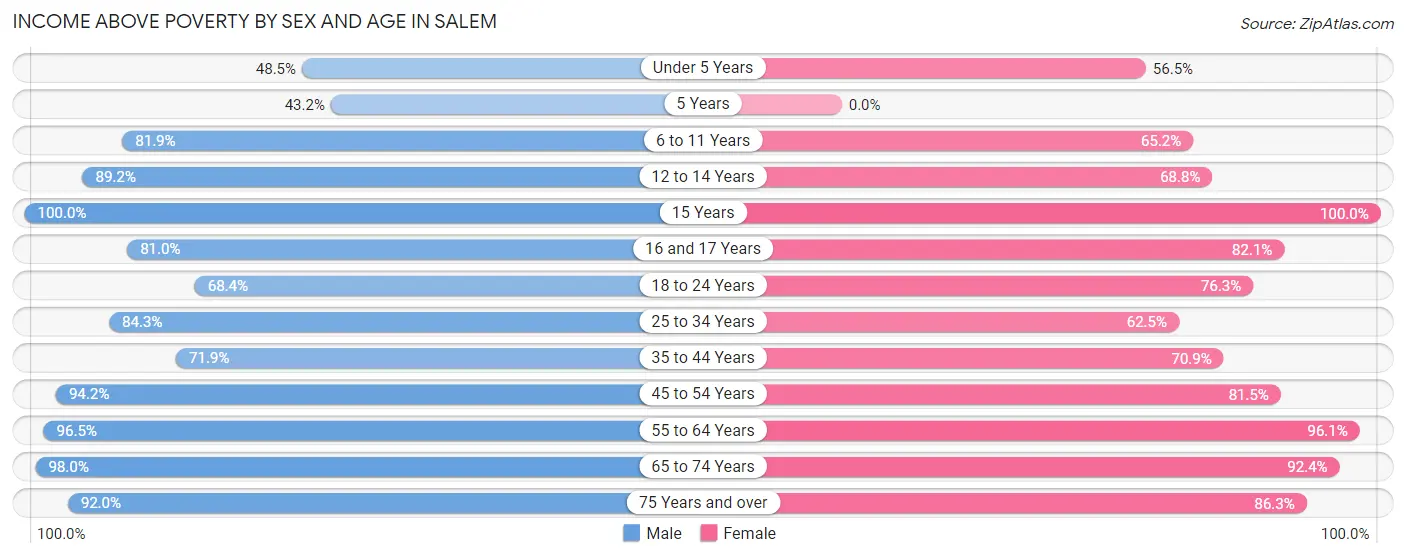
| Age Bracket | Male | Female |
| Under 5 Years | 116 (48.5%) | 140 (56.5%) |
| 5 Years | 19 (43.2%) | 0 (0.0%) |
| 6 to 11 Years | 212 (81.9%) | 223 (65.2%) |
| 12 to 14 Years | 58 (89.2%) | 77 (68.8%) |
| 15 Years | 81 (100.0%) | 42 (100.0%) |
| 16 and 17 Years | 68 (80.9%) | 133 (82.1%) |
| 18 to 24 Years | 184 (68.4%) | 213 (76.3%) |
| 25 to 34 Years | 511 (84.3%) | 354 (62.5%) |
| 35 to 44 Years | 294 (71.9%) | 316 (70.9%) |
| 45 to 54 Years | 339 (94.2%) | 347 (81.5%) |
| 55 to 64 Years | 381 (96.5%) | 320 (96.1%) |
| 65 to 74 Years | 241 (98.0%) | 399 (92.4%) |
| 75 Years and over | 149 (92.0%) | 301 (86.3%) |
| Total | 2,653 (82.4%) | 2,865 (76.3%) |
Income Below Poverty Among Married-Couple Families in Salem
The poverty statistics for married-couple families in Salem show that 8.5% or 95 of the total 1,116 families live below the poverty line. Families with 3 or 4 children have the highest poverty rate of 43.3%, comprising of 26 families. On the other hand, families with no children have the lowest poverty rate of 2.5%, which includes 17 families.
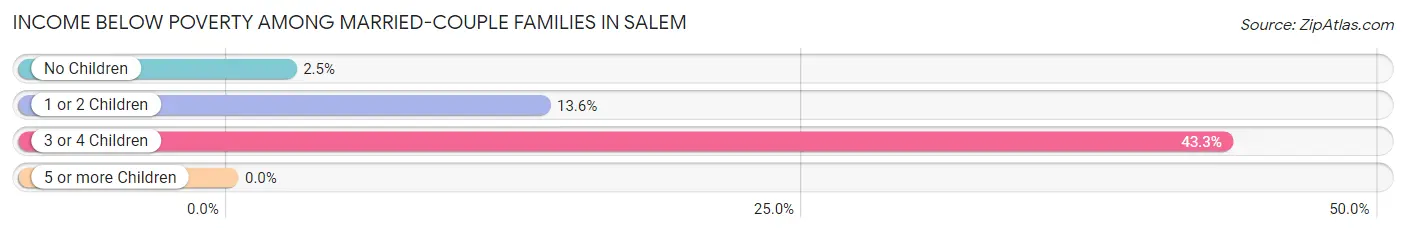
| Children | Above Poverty | Below Poverty |
| No Children | 656 (97.5%) | 17 (2.5%) |
| 1 or 2 Children | 331 (86.4%) | 52 (13.6%) |
| 3 or 4 Children | 34 (56.7%) | 26 (43.3%) |
| 5 or more Children | 0 (0.0%) | 0 (0.0%) |
| Total | 1,021 (91.5%) | 95 (8.5%) |
Income Below Poverty Among Single-Parent Households in Salem
According to the poverty data in Salem, 13.8% or 25 single-father households and 35.7% or 189 single-mother households are living below the poverty line. Among single-father households, those with 5 or more children have the highest poverty rate, with 16 households (76.2%) experiencing poverty. Likewise, among single-mother households, those with no children have the highest poverty rate, with 38 households (42.2%) falling below the poverty line.
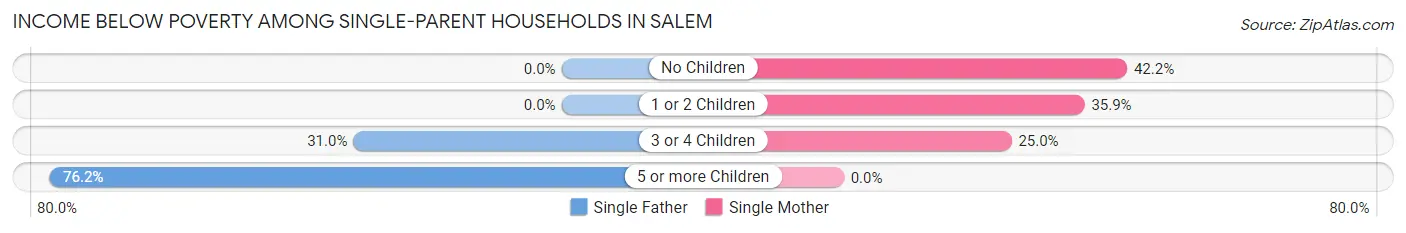
| Children | Single Father | Single Mother |
| No Children | 0 (0.0%) | 38 (42.2%) |
| 1 or 2 Children | 0 (0.0%) | 136 (35.9%) |
| 3 or 4 Children | 9 (31.0%) | 15 (25.0%) |
| 5 or more Children | 16 (76.2%) | 0 (0.0%) |
| Total | 25 (13.8%) | 189 (35.7%) |
Income Below Poverty Among Married-Couple vs Single-Parent Households in Salem
The poverty data for Salem shows that 95 of the married-couple family households (8.5%) and 214 of the single-parent households (30.1%) are living below the poverty level. Within the married-couple family households, those with 3 or 4 children have the highest poverty rate, with 26 households (43.3%) falling below the poverty line. Among the single-parent households, those with 5 or more children have the highest poverty rate, with 16 household (76.2%) living below poverty.
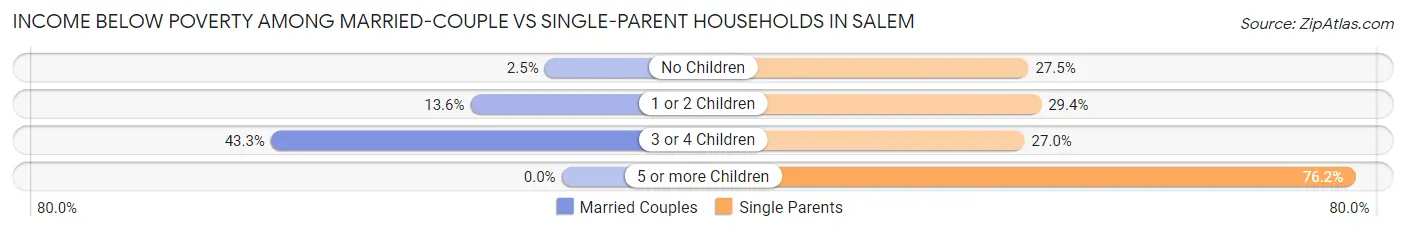
| Children | Married-Couple Families | Single-Parent Households |
| No Children | 17 (2.5%) | 38 (27.5%) |
| 1 or 2 Children | 52 (13.6%) | 136 (29.4%) |
| 3 or 4 Children | 26 (43.3%) | 24 (27.0%) |
| 5 or more Children | 0 (0.0%) | 16 (76.2%) |
| Total | 95 (8.5%) | 214 (30.1%) |
Race in Salem
The most populous races in Salem are White / Caucasian (6,773 | 93.7%), Black / African American (244 | 3.4%), and Two or more Races (162 | 2.2%).
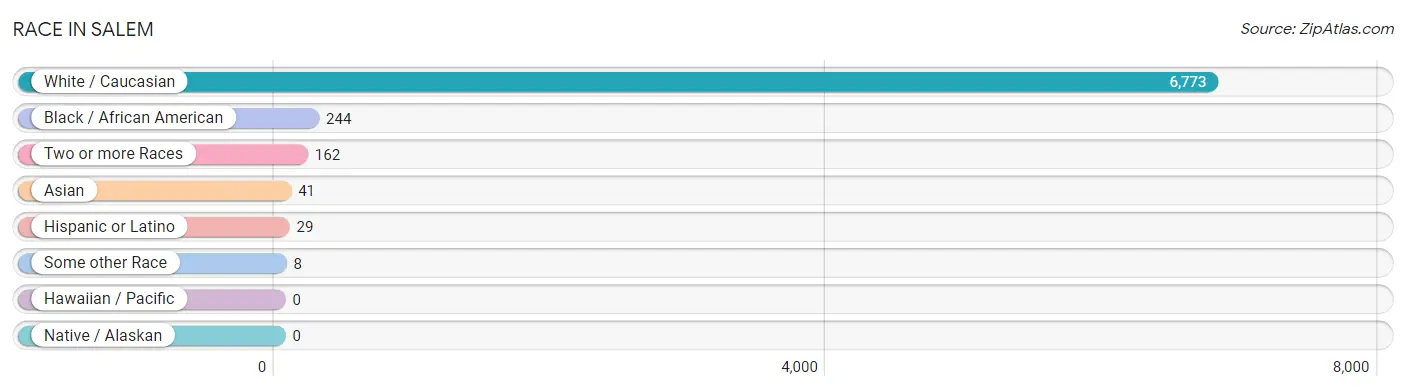
| Race | # Population | % Population |
| Asian | 41 | 0.6% |
| Black / African American | 244 | 3.4% |
| Hawaiian / Pacific | 0 | 0.0% |
| Hispanic or Latino | 29 | 0.4% |
| Native / Alaskan | 0 | 0.0% |
| White / Caucasian | 6,773 | 93.7% |
| Two or more Races | 162 | 2.2% |
| Some other Race | 8 | 0.1% |
| Total | 7,228 | 100.0% |
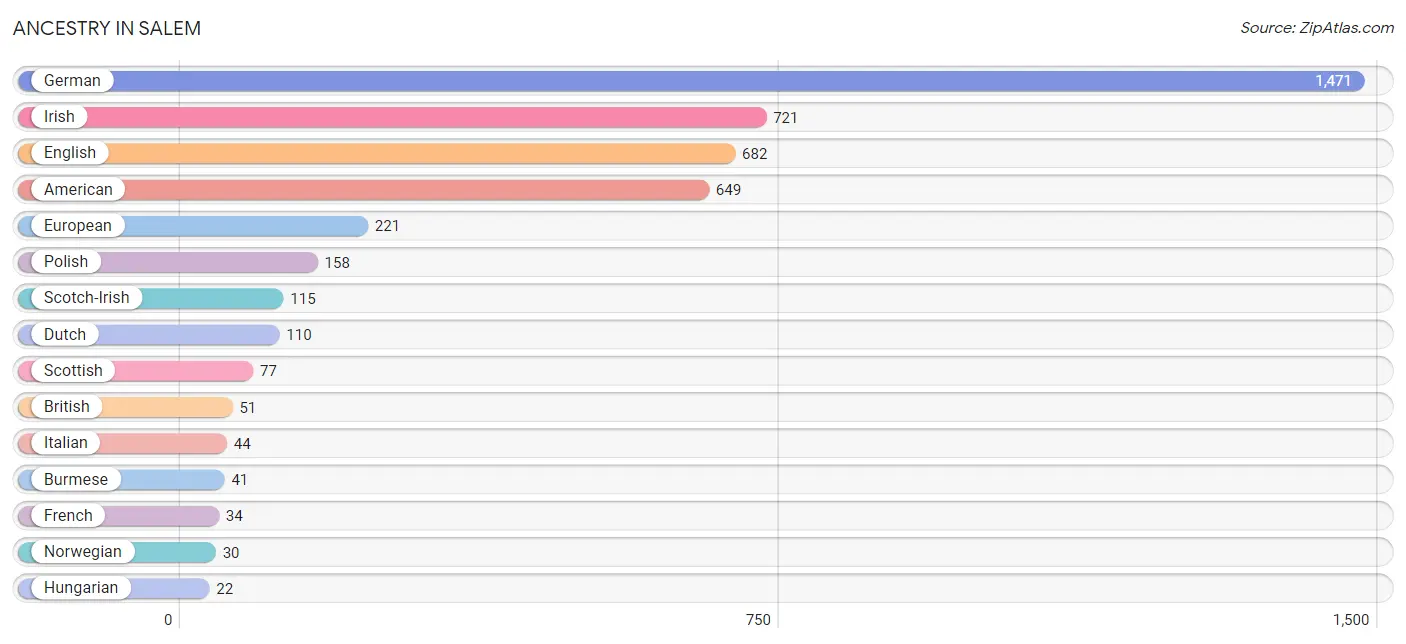
Ancestry in Salem
The most populous ancestries reported in Salem are German (1,471 | 20.3%), Irish (721 | 10.0%), English (682 | 9.4%), American (649 | 9.0%), and European (221 | 3.1%), together accounting for 51.8% of all Salem residents.
| Ancestry | # Population | % Population |
| Albanian | 10 | 0.1% |
| American | 649 | 9.0% |
| Austrian | 15 | 0.2% |
| Belgian | 8 | 0.1% |
| Bhutanese | 6 | 0.1% |
| British | 51 | 0.7% |
| Burmese | 41 | 0.6% |
| Cherokee | 6 | 0.1% |
| Danish | 16 | 0.2% |
| Dutch | 110 | 1.5% |
| English | 682 | 9.4% |
| European | 221 | 3.1% |
| French | 34 | 0.5% |
| German | 1,471 | 20.3% |
| Hungarian | 22 | 0.3% |
| Indian (Asian) | 6 | 0.1% |
| Irish | 721 | 10.0% |
| Italian | 44 | 0.6% |
| Korean | 10 | 0.1% |
| Mexican | 18 | 0.3% |
| Norwegian | 30 | 0.4% |
| Polish | 158 | 2.2% |
| Scotch-Irish | 115 | 1.6% |
| Scottish | 77 | 1.1% |
| Swedish | 8 | 0.1% |
| Welsh | 5 | 0.1% | View All 26 Rows |
Immigrants in Salem
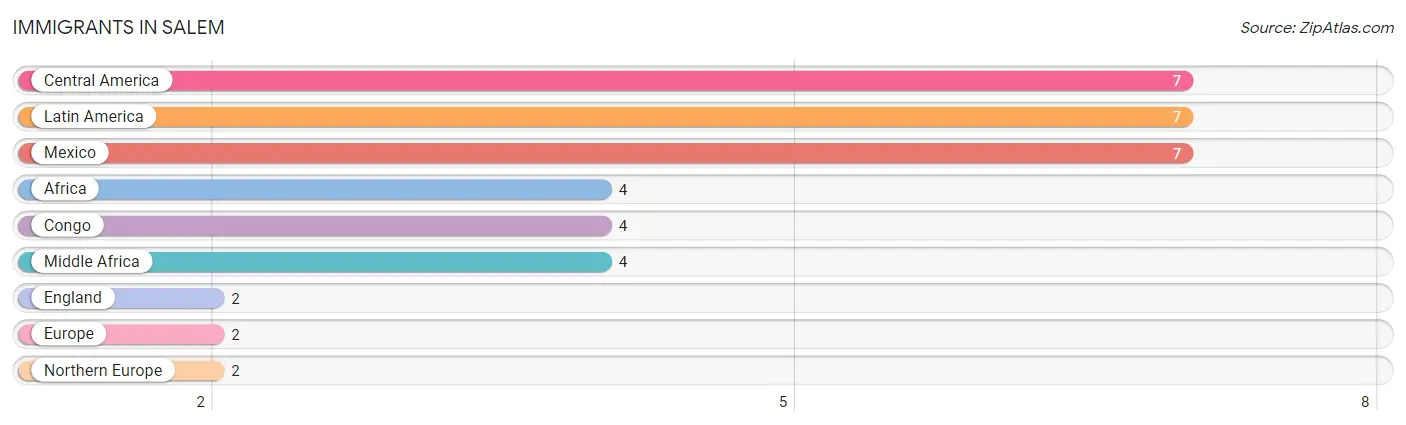
The most numerous immigrant groups reported in Salem came from Central America (7 | 0.1%), Latin America (7 | 0.1%), Mexico (7 | 0.1%), Africa (4 | 0.1%), and Congo (4 | 0.1%), together accounting for 0.4% of all Salem residents.
| Immigration Origin | # Population | % Population |
| Africa | 4 | 0.1% |
| Central America | 7 | 0.1% |
| Congo | 4 | 0.1% |
| England | 2 | 0.0% |
| Europe | 2 | 0.0% |
| Latin America | 7 | 0.1% |
| Mexico | 7 | 0.1% |
| Middle Africa | 4 | 0.1% |
| Northern Europe | 2 | 0.0% | View All 9 Rows |
Sex and Age in Salem
Sex and Age in Salem
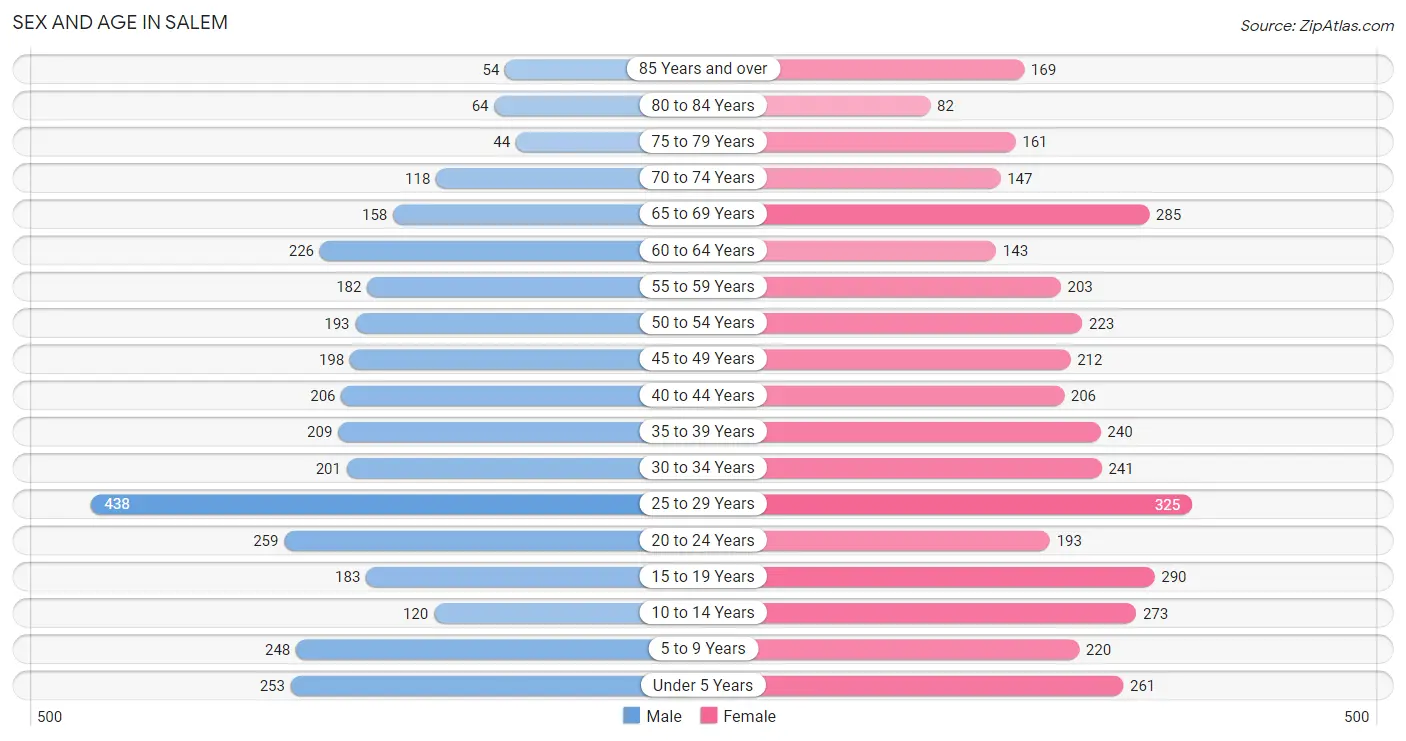
The most populous age groups in Salem are 25 to 29 Years (438 | 13.1%) for men and 25 to 29 Years (325 | 8.4%) for women.
| Age Bracket | Male | Female |
| Under 5 Years | 253 (7.5%) | 261 (6.7%) |
| 5 to 9 Years | 248 (7.4%) | 220 (5.7%) |
| 10 to 14 Years | 120 (3.6%) | 273 (7.0%) |
| 15 to 19 Years | 183 (5.5%) | 290 (7.5%) |
| 20 to 24 Years | 259 (7.7%) | 193 (5.0%) |
| 25 to 29 Years | 438 (13.1%) | 325 (8.4%) |
| 30 to 34 Years | 201 (6.0%) | 241 (6.2%) |
| 35 to 39 Years | 209 (6.2%) | 240 (6.2%) |
| 40 to 44 Years | 206 (6.1%) | 206 (5.3%) |
| 45 to 49 Years | 198 (5.9%) | 212 (5.5%) |
| 50 to 54 Years | 193 (5.8%) | 223 (5.8%) |
| 55 to 59 Years | 182 (5.4%) | 203 (5.2%) |
| 60 to 64 Years | 226 (6.7%) | 143 (3.7%) |
| 65 to 69 Years | 158 (4.7%) | 285 (7.4%) |
| 70 to 74 Years | 118 (3.5%) | 147 (3.8%) |
| 75 to 79 Years | 44 (1.3%) | 161 (4.2%) |
| 80 to 84 Years | 64 (1.9%) | 82 (2.1%) |
| 85 Years and over | 54 (1.6%) | 169 (4.4%) |
| Total | 3,354 (100.0%) | 3,874 (100.0%) |
Families and Households in Salem
Median Family Size in Salem
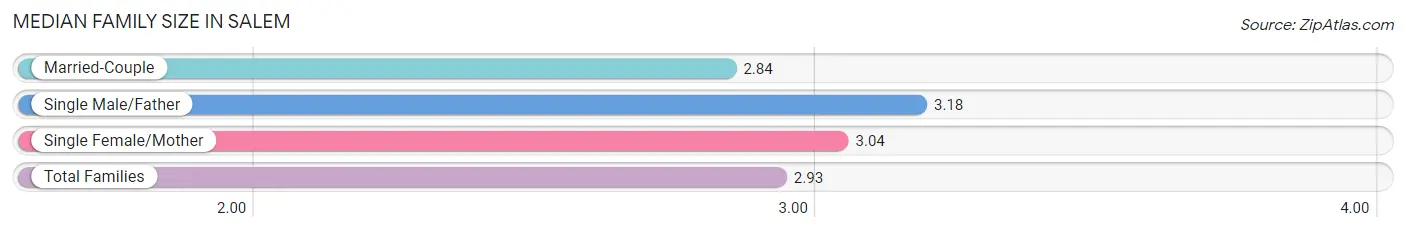
The median family size in Salem is 2.93 persons per family, with single male/father families (181 | 9.9%) accounting for the largest median family size of 3.18 persons per family. On the other hand, married-couple families (1,116 | 61.1%) represent the smallest median family size with 2.84 persons per family.
| Family Type | # Families | Family Size |
| Married-Couple | 1,116 (61.1%) | 2.84 |
| Single Male/Father | 181 (9.9%) | 3.18 |
| Single Female/Mother | 529 (29.0%) | 3.04 |
| Total Families | 1,826 (100.0%) | 2.93 |
Median Household Size in Salem
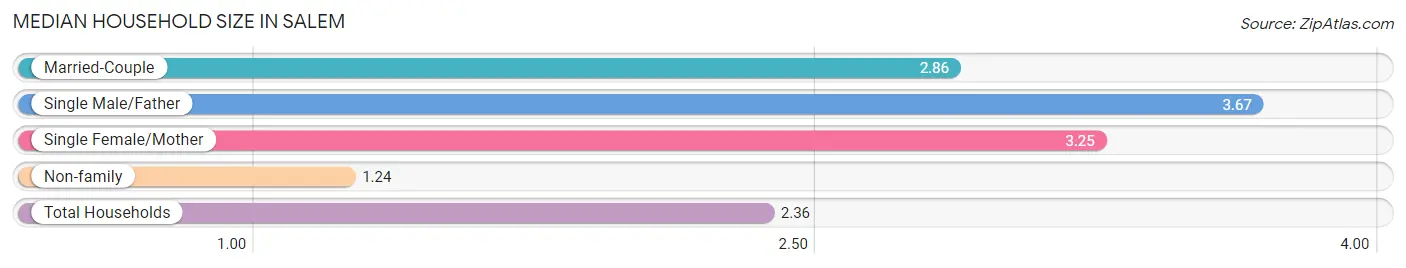
The median household size in Salem is 2.36 persons per household, with single male/father households (181 | 6.1%) accounting for the largest median household size of 3.67 persons per household. non-family households (1,145 | 38.5%) represent the smallest median household size with 1.24 persons per household.
| Household Type | # Households | Household Size |
| Married-Couple | 1,116 (37.6%) | 2.86 |
| Single Male/Father | 181 (6.1%) | 3.67 |
| Single Female/Mother | 529 (17.8%) | 3.25 |
| Non-family | 1,145 (38.5%) | 1.24 |
| Total Households | 2,971 (100.0%) | 2.36 |
Household Size by Marriage Status in Salem
Out of a total of 2,971 households in Salem, 1,826 (61.5%) are family households, while 1,145 (38.5%) are nonfamily households. The most numerous type of family households are 2-person households, comprising 851, and the most common type of nonfamily households are 1-person households, comprising 933.
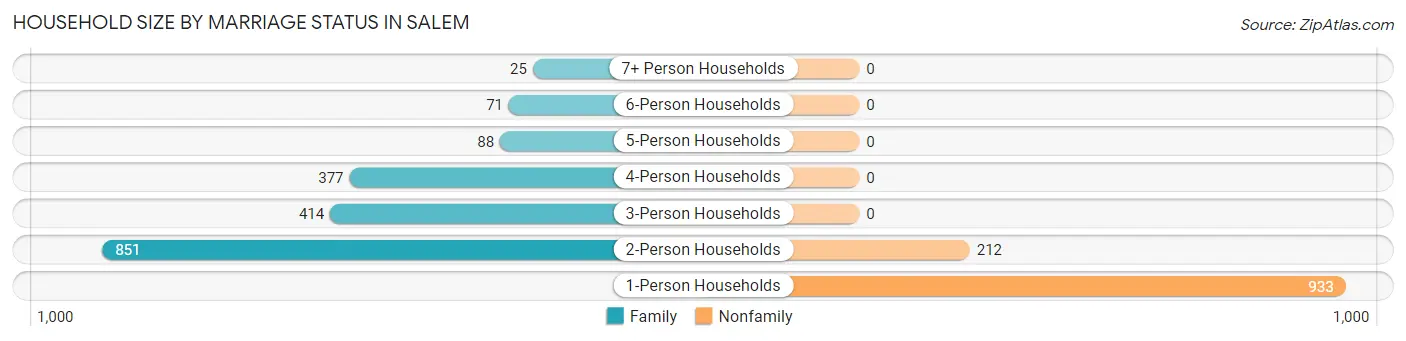
| Household Size | Family Households | Nonfamily Households |
| 1-Person Households | - | 933 (31.4%) |
| 2-Person Households | 851 (28.6%) | 212 (7.1%) |
| 3-Person Households | 414 (13.9%) | 0 (0.0%) |
| 4-Person Households | 377 (12.7%) | 0 (0.0%) |
| 5-Person Households | 88 (3.0%) | 0 (0.0%) |
| 6-Person Households | 71 (2.4%) | 0 (0.0%) |
| 7+ Person Households | 25 (0.8%) | 0 (0.0%) |
| Total | 1,826 (61.5%) | 1,145 (38.5%) |
Female Fertility in Salem
Fertility by Age in Salem
Average fertility rate in Salem is 87.0 births per 1,000 women. Women in the age bracket of 20 to 34 years have the highest fertility rate with 126.0 births per 1,000 women. Women in the age bracket of 20 to 34 years acount for 63.2% of all women with births.
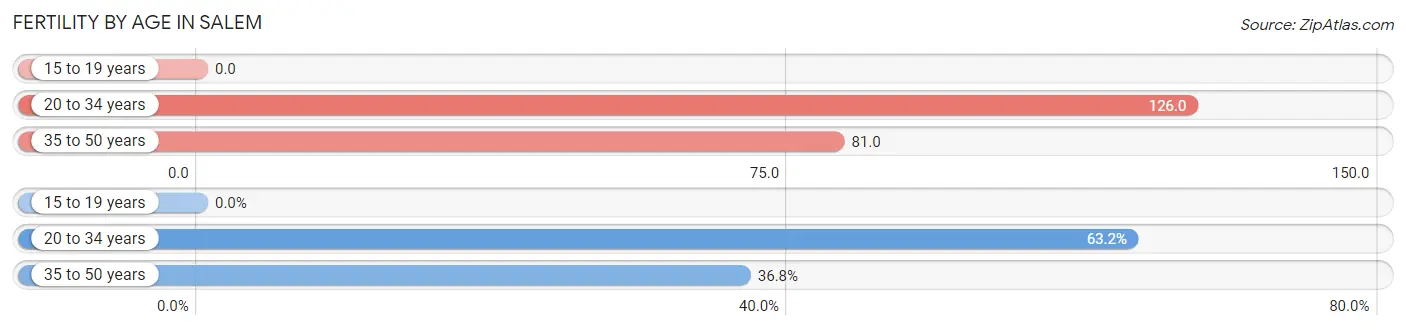
| Age Bracket | Women with Births | Births / 1,000 Women |
| 15 to 19 years | 0 (0.0%) | 0.0 |
| 20 to 34 years | 96 (63.2%) | 126.0 |
| 35 to 50 years | 56 (36.8%) | 81.0 |
| Total | 152 (100.0%) | 87.0 |
Fertility by Age by Marriage Status in Salem
51.3% of women with births (152) in Salem are married. The highest percentage of unmarried women with births falls into 35 to 50 years age bracket with 50.0% of them unmarried at the time of birth, while the lowest percentage of unmarried women with births belong to 20 to 34 years age bracket with 47.9% of them unmarried.
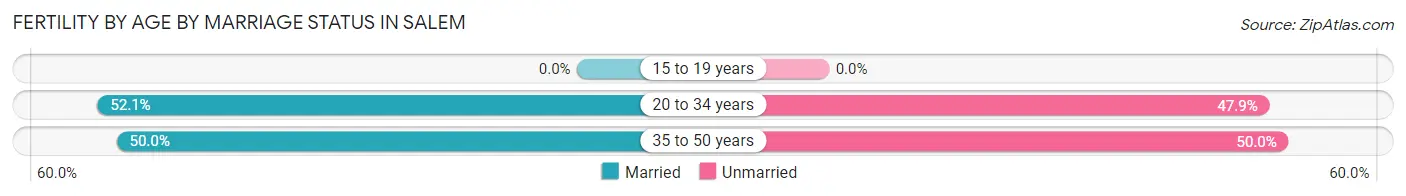
| Age Bracket | Married | Unmarried |
| 15 to 19 years | 0 (0.0%) | 0 (0.0%) |
| 20 to 34 years | 50 (52.1%) | 46 (47.9%) |
| 35 to 50 years | 28 (50.0%) | 28 (50.0%) |
| Total | 78 (51.3%) | 74 (48.7%) |
Fertility by Education in Salem
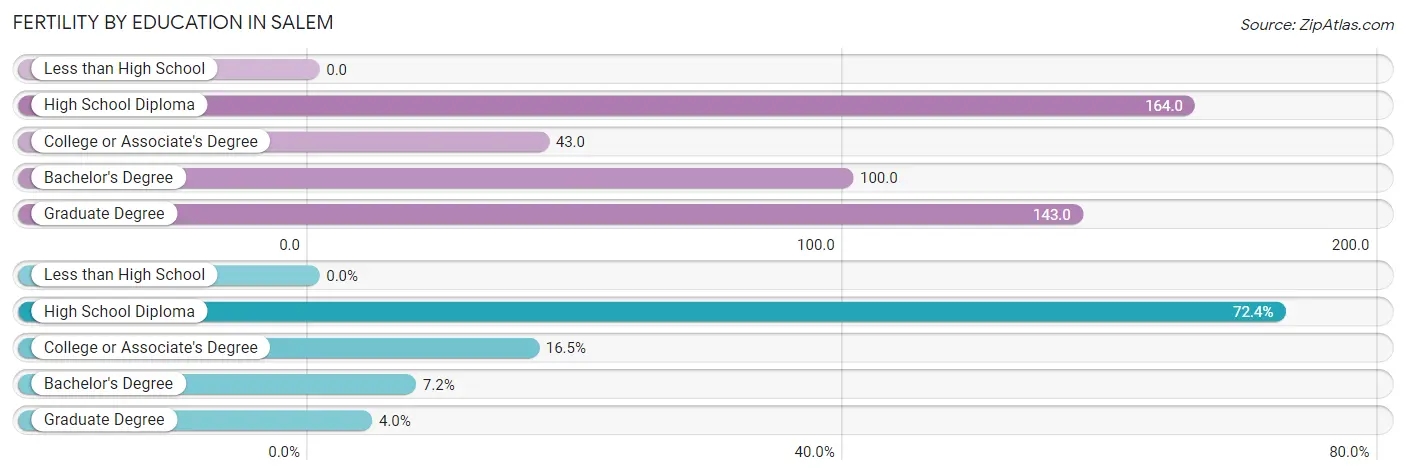
| Educational Attainment | Women with Births | Births / 1,000 Women |
| Less than High School | 0 (0.0%) | 0.0 |
| High School Diploma | 110 (72.4%) | 164.0 |
| College or Associate's Degree | 25 (16.5%) | 43.0 |
| Bachelor's Degree | 11 (7.2%) | 100.0 |
| Graduate Degree | 6 (4.0%) | 143.0 |
| Total | 152 (100.0%) | 87.0 |
Fertility by Education by Marriage Status in Salem
48.7% of women with births in Salem are unmarried. Women with the educational attainment of college or associate's degree are most likely to be married with 100.0% of them married at childbirth, while women with the educational attainment of graduate degree are least likely to be married with 100.0% of them unmarried at childbirth.
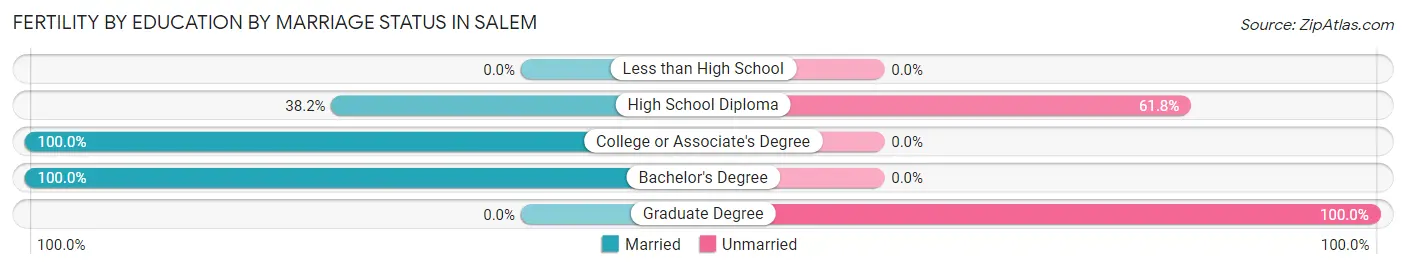
| Educational Attainment | Married | Unmarried |
| Less than High School | 0 (0.0%) | 0 (0.0%) |
| High School Diploma | 42 (38.2%) | 68 (61.8%) |
| College or Associate's Degree | 25 (100.0%) | 0 (0.0%) |
| Bachelor's Degree | 11 (100.0%) | 0 (0.0%) |
| Graduate Degree | 0 (0.0%) | 6 (100.0%) |
| Total | 78 (51.3%) | 74 (48.7%) |
Employment Characteristics in Salem
Employment by Class of Employer in Salem
Among the 3,406 employed individuals in Salem, private company employees (2,502 | 73.5%), not-for-profit organizations (298 | 8.7%), and local government employees (177 | 5.2%) make up the most common classes of employment.
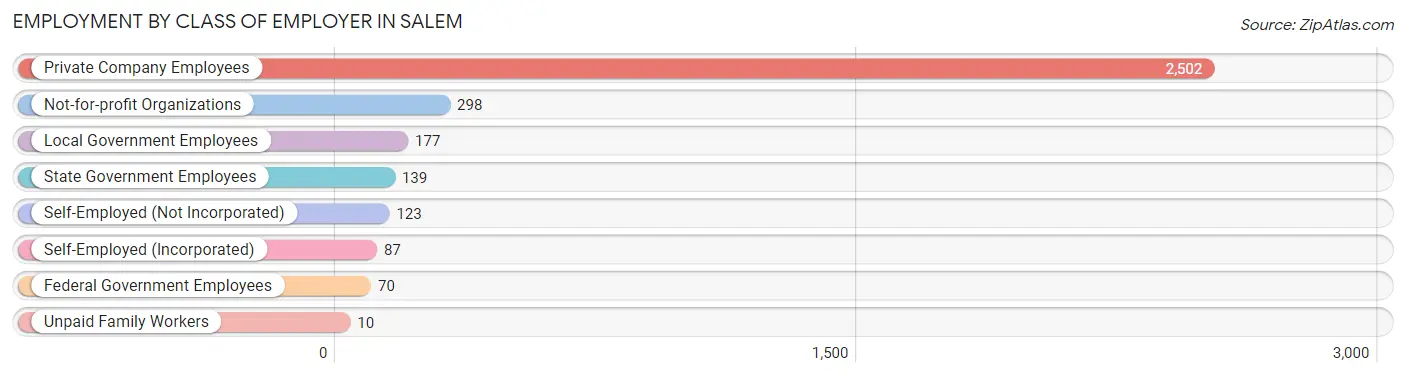
| Employer Class | # Employees | % Employees |
| Private Company Employees | 2,502 | 73.5% |
| Self-Employed (Incorporated) | 87 | 2.5% |
| Self-Employed (Not Incorporated) | 123 | 3.6% |
| Not-for-profit Organizations | 298 | 8.7% |
| Local Government Employees | 177 | 5.2% |
| State Government Employees | 139 | 4.1% |
| Federal Government Employees | 70 | 2.1% |
| Unpaid Family Workers | 10 | 0.3% |
| Total | 3,406 | 100.0% |
Employment Status by Age in Salem
According to the labor force statistics for Salem, out of the total population over 16 years of age (5,730), 63.4% or 3,633 individuals are in the labor force, with 4.5% or 163 of them unemployed. The age group with the highest labor force participation rate is 35 to 44 years, with 90.6% or 780 individuals in the labor force. Within the labor force, the 35 to 44 years age range has the highest percentage of unemployed individuals, with 15.9% or 124 of them being unemployed.
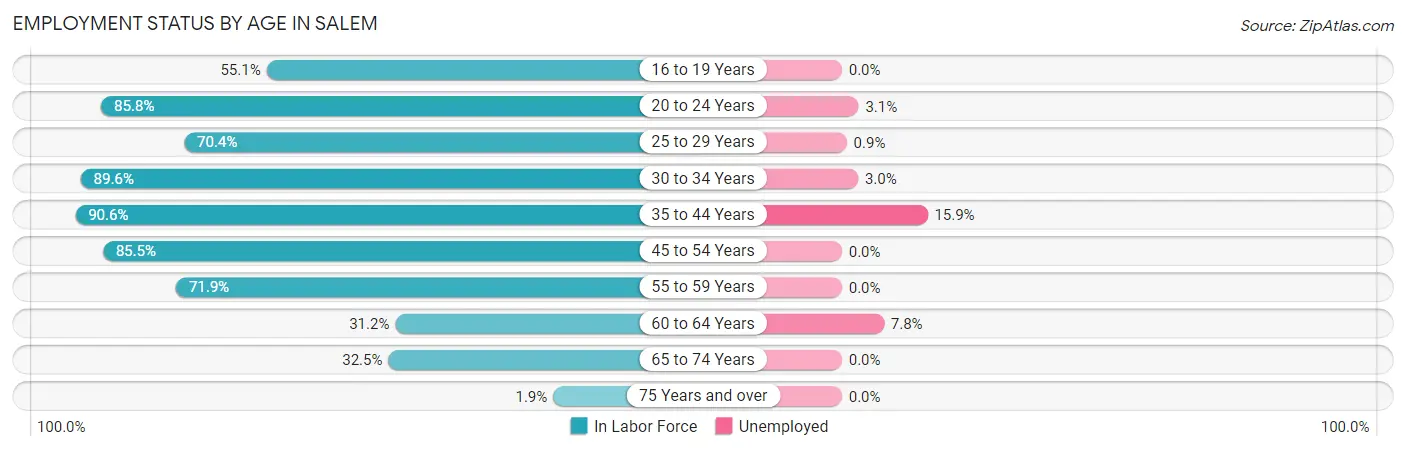
| Age Bracket | In Labor Force | Unemployed |
| 16 to 19 Years | 193 (55.1%) | 0 (0.0%) |
| 20 to 24 Years | 388 (85.8%) | 12 (3.1%) |
| 25 to 29 Years | 537 (70.4%) | 5 (0.9%) |
| 30 to 34 Years | 396 (89.6%) | 12 (3.0%) |
| 35 to 44 Years | 780 (90.6%) | 124 (15.9%) |
| 45 to 54 Years | 706 (85.5%) | 0 (0.0%) |
| 55 to 59 Years | 277 (71.9%) | 0 (0.0%) |
| 60 to 64 Years | 115 (31.2%) | 9 (7.8%) |
| 65 to 74 Years | 230 (32.5%) | 0 (0.0%) |
| 75 Years and over | 11 (1.9%) | 0 (0.0%) |
| Total | 3,633 (63.4%) | 163 (4.5%) |
Employment Status by Educational Attainment in Salem
According to labor force statistics for Salem, 77.1% of individuals (2,811) out of the total population between 25 and 64 years of age (3,646) are in the labor force, with 5.4% or 152 of them being unemployed. The group with the highest labor force participation rate are those with the educational attainment of college / associate degree, with 84.7% or 1,275 individuals in the labor force. Within the labor force, individuals with high school diploma education have the highest percentage of unemployment, with 11.6% or 121 of them being unemployed.
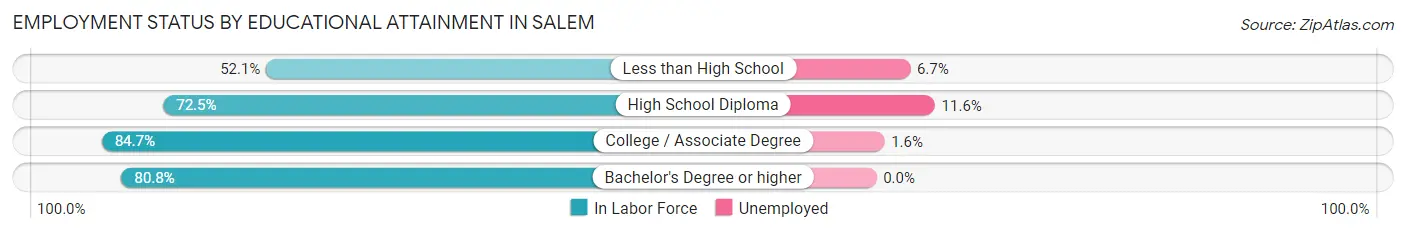
| Educational Attainment | In Labor Force | Unemployed |
| Less than High School | 134 (52.1%) | 17 (6.7%) |
| High School Diploma | 1,040 (72.5%) | 166 (11.6%) |
| College / Associate Degree | 1,275 (84.7%) | 24 (1.6%) |
| Bachelor's Degree or higher | 363 (80.8%) | 0 (0.0%) |
| Total | 2,811 (77.1%) | 197 (5.4%) |
Employment Occupations by Sex in Salem
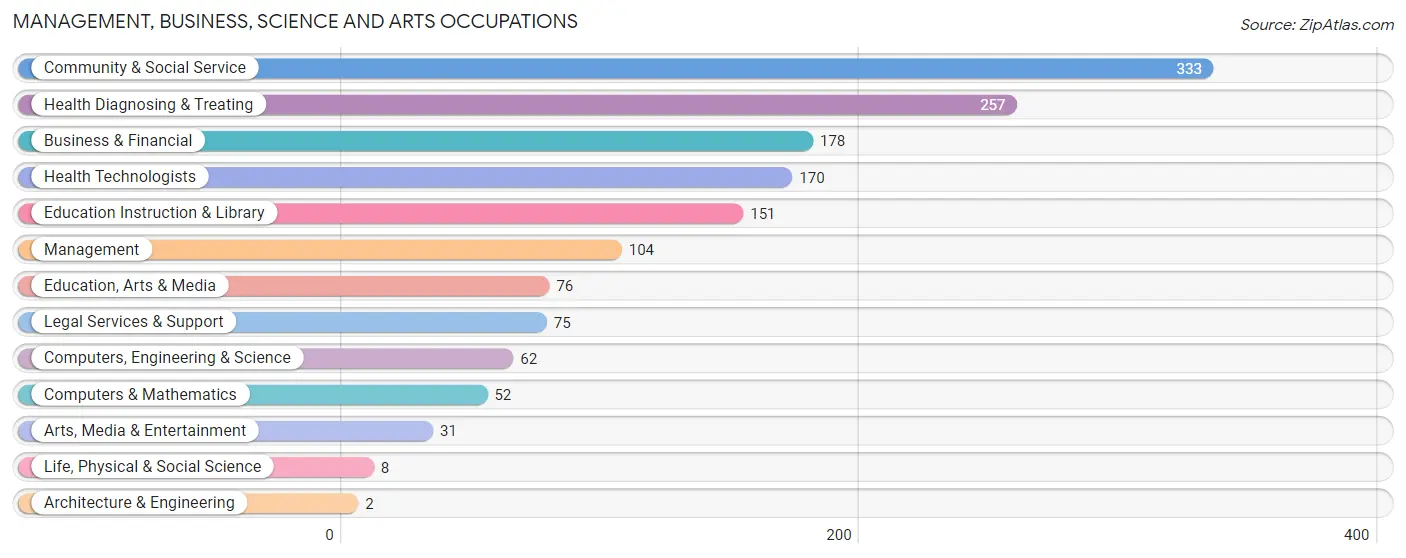
Management, Business, Science and Arts Occupations
The most common Management, Business, Science and Arts occupations in Salem are Community & Social Service (333 | 9.6%), Health Diagnosing & Treating (257 | 7.4%), Business & Financial (178 | 5.1%), Health Technologists (170 | 4.9%), and Education Instruction & Library (151 | 4.4%).
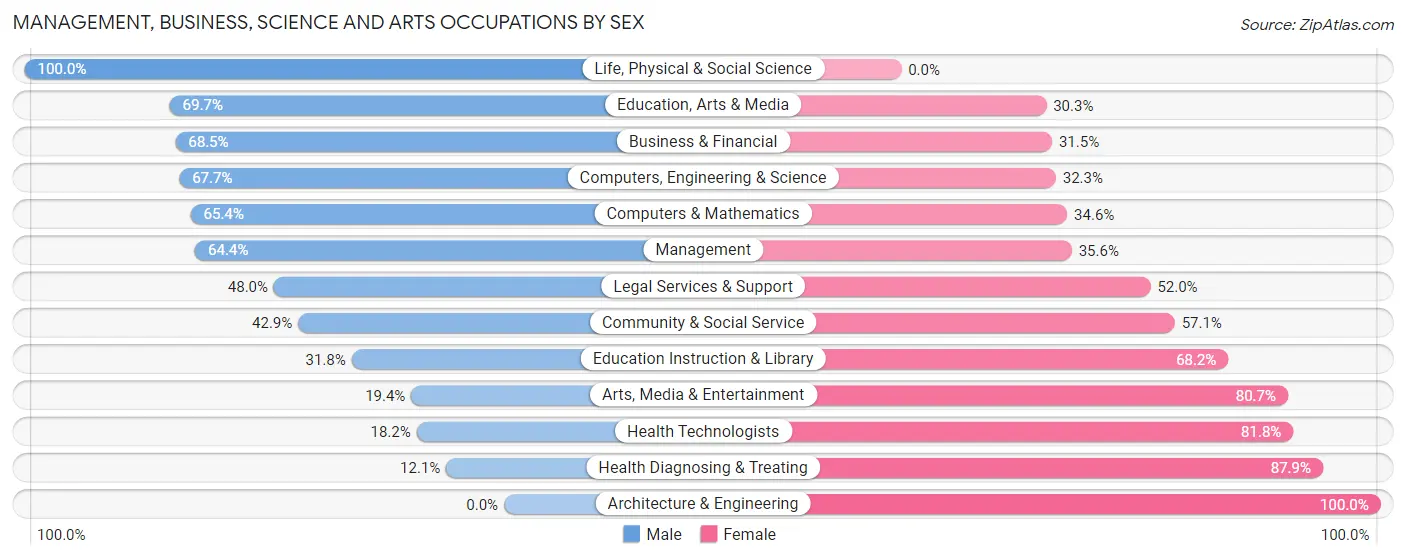
Management, Business, Science and Arts Occupations by Sex
Within the Management, Business, Science and Arts occupations in Salem, the most male-oriented occupations are Life, Physical & Social Science (100.0%), Education, Arts & Media (69.7%), and Business & Financial (68.5%), while the most female-oriented occupations are Architecture & Engineering (100.0%), Health Diagnosing & Treating (87.9%), and Health Technologists (81.8%).
| Occupation | Male | Female |
| Management | 67 (64.4%) | 37 (35.6%) |
| Business & Financial | 122 (68.5%) | 56 (31.5%) |
| Computers, Engineering & Science | 42 (67.7%) | 20 (32.3%) |
| Computers & Mathematics | 34 (65.4%) | 18 (34.6%) |
| Architecture & Engineering | 0 (0.0%) | 2 (100.0%) |
| Life, Physical & Social Science | 8 (100.0%) | 0 (0.0%) |
| Community & Social Service | 143 (42.9%) | 190 (57.1%) |
| Education, Arts & Media | 53 (69.7%) | 23 (30.3%) |
| Legal Services & Support | 36 (48.0%) | 39 (52.0%) |
| Education Instruction & Library | 48 (31.8%) | 103 (68.2%) |
| Arts, Media & Entertainment | 6 (19.4%) | 25 (80.6%) |
| Health Diagnosing & Treating | 31 (12.1%) | 226 (87.9%) |
| Health Technologists | 31 (18.2%) | 139 (81.8%) |
| Total (Category) | 405 (43.4%) | 529 (56.6%) |
| Total (Overall) | 1,725 (49.8%) | 1,737 (50.2%) |
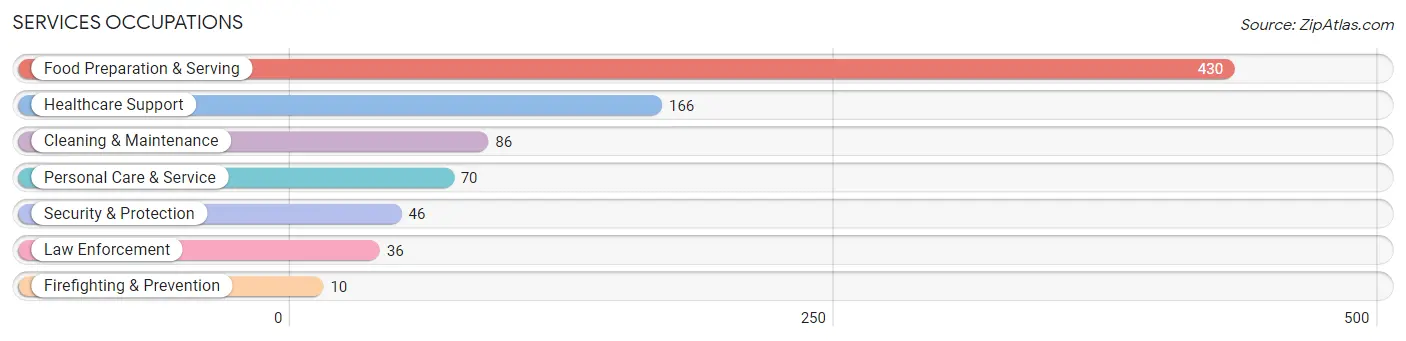
Services Occupations
The most common Services occupations in Salem are Food Preparation & Serving (430 | 12.4%), Healthcare Support (166 | 4.8%), Cleaning & Maintenance (86 | 2.5%), Personal Care & Service (70 | 2.0%), and Security & Protection (46 | 1.3%).
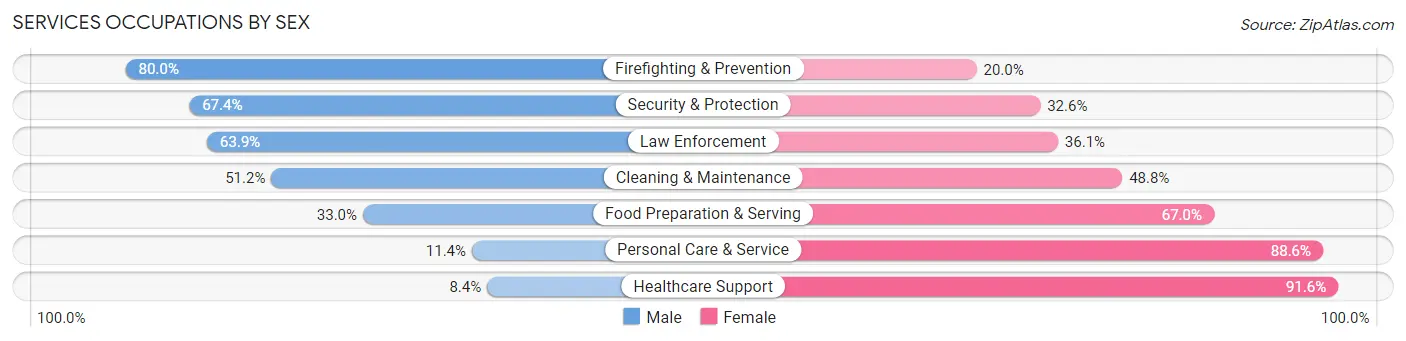
Services Occupations by Sex
Within the Services occupations in Salem, the most male-oriented occupations are Firefighting & Prevention (80.0%), Security & Protection (67.4%), and Law Enforcement (63.9%), while the most female-oriented occupations are Healthcare Support (91.6%), Personal Care & Service (88.6%), and Food Preparation & Serving (67.0%).
| Occupation | Male | Female |
| Healthcare Support | 14 (8.4%) | 152 (91.6%) |
| Security & Protection | 31 (67.4%) | 15 (32.6%) |
| Firefighting & Prevention | 8 (80.0%) | 2 (20.0%) |
| Law Enforcement | 23 (63.9%) | 13 (36.1%) |
| Food Preparation & Serving | 142 (33.0%) | 288 (67.0%) |
| Cleaning & Maintenance | 44 (51.2%) | 42 (48.8%) |
| Personal Care & Service | 8 (11.4%) | 62 (88.6%) |
| Total (Category) | 239 (29.9%) | 559 (70.1%) |
| Total (Overall) | 1,725 (49.8%) | 1,737 (50.2%) |
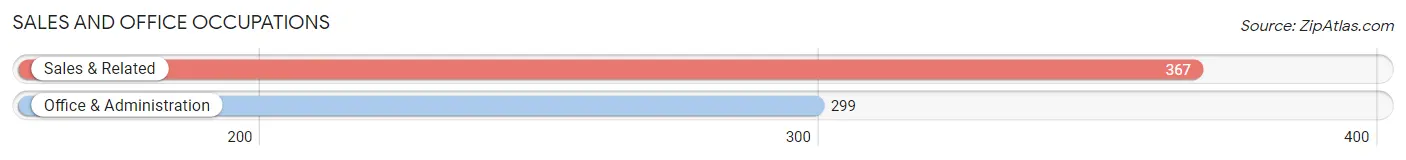
Sales and Office Occupations
The most common Sales and Office occupations in Salem are Sales & Related (367 | 10.6%), and Office & Administration (299 | 8.6%).
Sales and Office Occupations by Sex
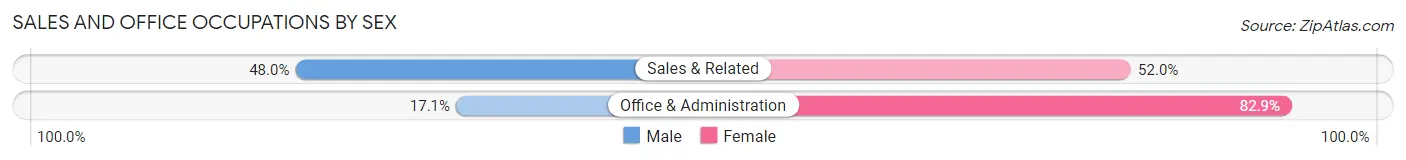
| Occupation | Male | Female |
| Sales & Related | 176 (48.0%) | 191 (52.0%) |
| Office & Administration | 51 (17.1%) | 248 (82.9%) |
| Total (Category) | 227 (34.1%) | 439 (65.9%) |
| Total (Overall) | 1,725 (49.8%) | 1,737 (50.2%) |
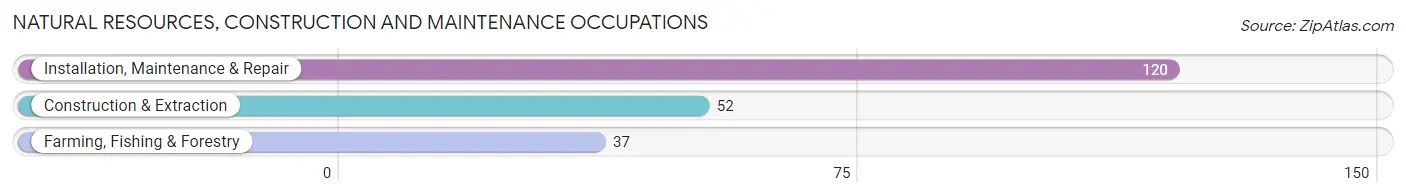
Natural Resources, Construction and Maintenance Occupations
The most common Natural Resources, Construction and Maintenance occupations in Salem are Installation, Maintenance & Repair (120 | 3.5%), Construction & Extraction (52 | 1.5%), and Farming, Fishing & Forestry (37 | 1.1%).
Natural Resources, Construction and Maintenance Occupations by Sex
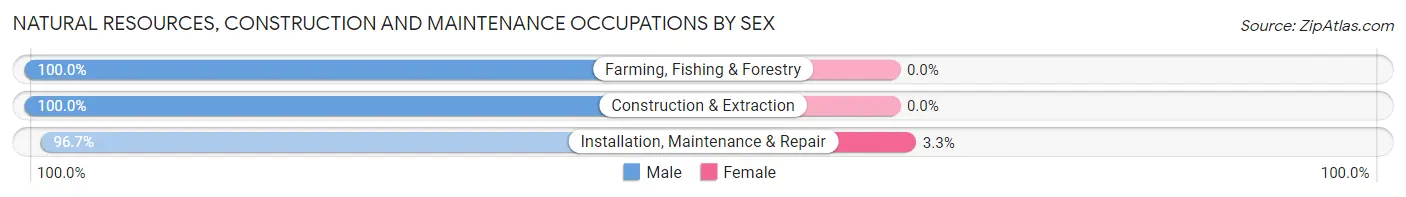
| Occupation | Male | Female |
| Farming, Fishing & Forestry | 37 (100.0%) | 0 (0.0%) |
| Construction & Extraction | 52 (100.0%) | 0 (0.0%) |
| Installation, Maintenance & Repair | 116 (96.7%) | 4 (3.3%) |
| Total (Category) | 205 (98.1%) | 4 (1.9%) |
| Total (Overall) | 1,725 (49.8%) | 1,737 (50.2%) |
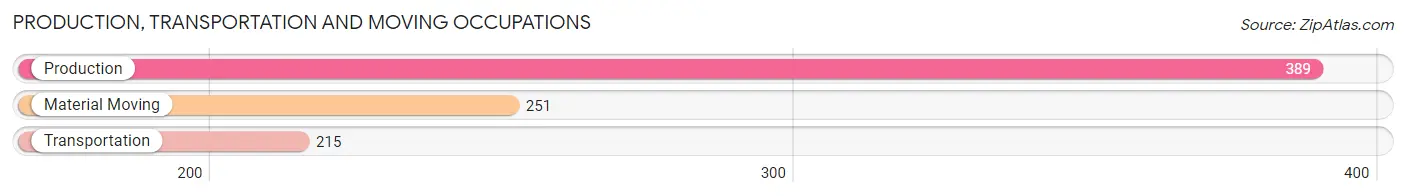
Production, Transportation and Moving Occupations
The most common Production, Transportation and Moving occupations in Salem are Production (389 | 11.2%), Material Moving (251 | 7.2%), and Transportation (215 | 6.2%).
Production, Transportation and Moving Occupations by Sex
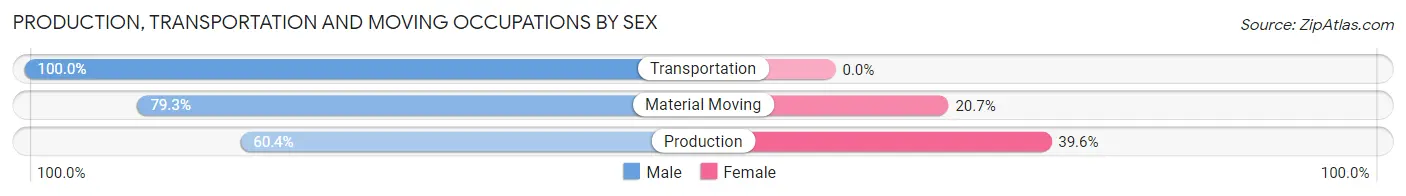
| Occupation | Male | Female |
| Production | 235 (60.4%) | 154 (39.6%) |
| Transportation | 215 (100.0%) | 0 (0.0%) |
| Material Moving | 199 (79.3%) | 52 (20.7%) |
| Total (Category) | 649 (75.9%) | 206 (24.1%) |
| Total (Overall) | 1,725 (49.8%) | 1,737 (50.2%) |
Employment Industries by Sex in Salem
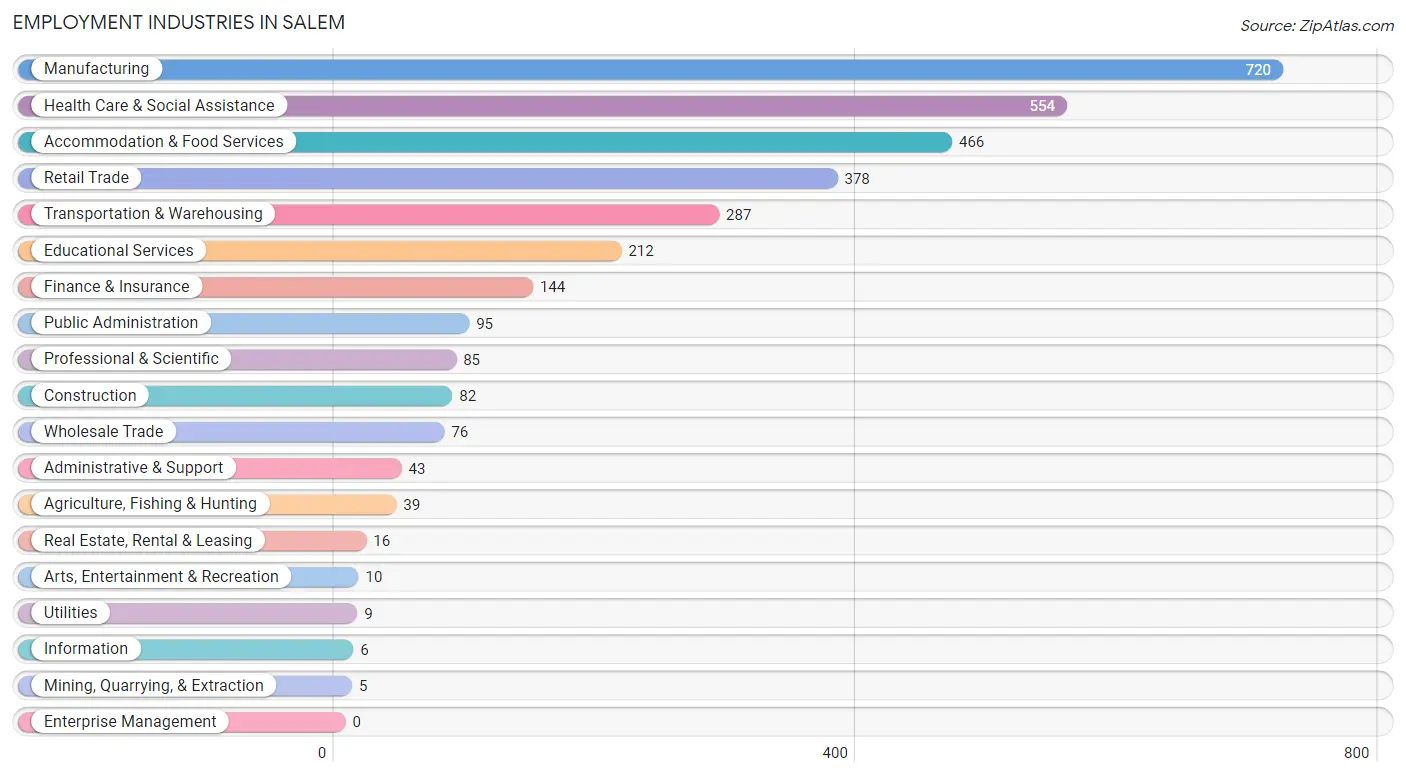
Employment Industries in Salem
The major employment industries in Salem include Manufacturing (720 | 20.8%), Health Care & Social Assistance (554 | 16.0%), Accommodation & Food Services (466 | 13.5%), Retail Trade (378 | 10.9%), and Transportation & Warehousing (287 | 8.3%).
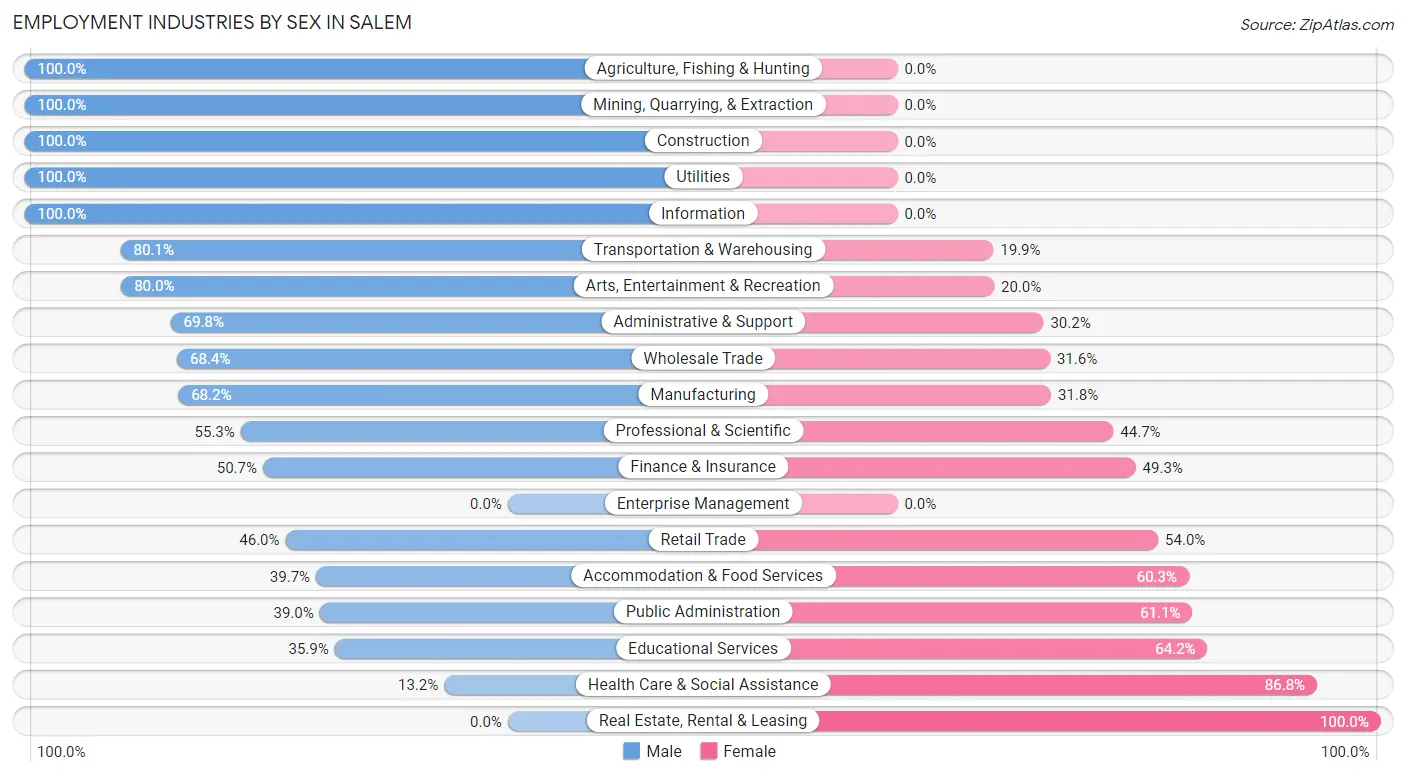
Employment Industries by Sex in Salem
The Salem industries that see more men than women are Agriculture, Fishing & Hunting (100.0%), Mining, Quarrying, & Extraction (100.0%), and Construction (100.0%), whereas the industries that tend to have a higher number of women are Real Estate, Rental & Leasing (100.0%), Health Care & Social Assistance (86.8%), and Educational Services (64.1%).
| Industry | Male | Female |
| Agriculture, Fishing & Hunting | 39 (100.0%) | 0 (0.0%) |
| Mining, Quarrying, & Extraction | 5 (100.0%) | 0 (0.0%) |
| Construction | 82 (100.0%) | 0 (0.0%) |
| Manufacturing | 491 (68.2%) | 229 (31.8%) |
| Wholesale Trade | 52 (68.4%) | 24 (31.6%) |
| Retail Trade | 174 (46.0%) | 204 (54.0%) |
| Transportation & Warehousing | 230 (80.1%) | 57 (19.9%) |
| Utilities | 9 (100.0%) | 0 (0.0%) |
| Information | 6 (100.0%) | 0 (0.0%) |
| Finance & Insurance | 73 (50.7%) | 71 (49.3%) |
| Real Estate, Rental & Leasing | 0 (0.0%) | 16 (100.0%) |
| Professional & Scientific | 47 (55.3%) | 38 (44.7%) |
| Enterprise Management | 0 (0.0%) | 0 (0.0%) |
| Administrative & Support | 30 (69.8%) | 13 (30.2%) |
| Educational Services | 76 (35.8%) | 136 (64.1%) |
| Health Care & Social Assistance | 73 (13.2%) | 481 (86.8%) |
| Arts, Entertainment & Recreation | 8 (80.0%) | 2 (20.0%) |
| Accommodation & Food Services | 185 (39.7%) | 281 (60.3%) |
| Public Administration | 37 (39.0%) | 58 (61.1%) |
| Total | 1,725 (49.8%) | 1,737 (50.2%) |
Education in Salem
School Enrollment in Salem
The most common levels of schooling among the 1,522 students in Salem are high school (391 | 25.7%), middle school (385 | 25.3%), and elementary school (352 | 23.1%).
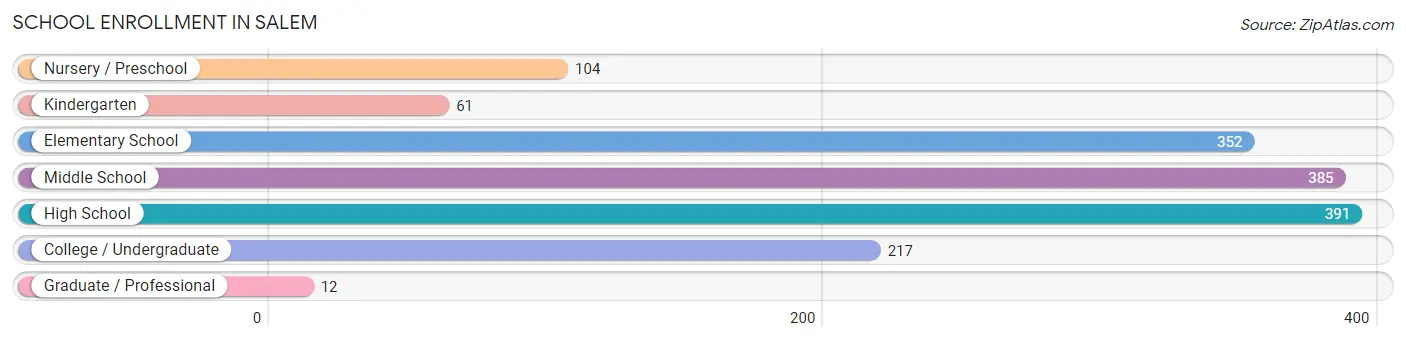
| School Level | # Students | % Students |
| Nursery / Preschool | 104 | 6.8% |
| Kindergarten | 61 | 4.0% |
| Elementary School | 352 | 23.1% |
| Middle School | 385 | 25.3% |
| High School | 391 | 25.7% |
| College / Undergraduate | 217 | 14.3% |
| Graduate / Professional | 12 | 0.8% |
| Total | 1,522 | 100.0% |
School Enrollment by Age by Funding Source in Salem
Out of a total of 1,522 students who are enrolled in schools in Salem, 68 (4.5%) attend a private institution, while the remaining 1,454 (95.5%) are enrolled in public schools. The age group of 5 to 9 year old has the highest likelihood of being enrolled in private schools, with 64 (14.2% in the age bracket) enrolled. Conversely, the age group of 10 to 14 year olds has the lowest likelihood of being enrolled in a private school, with 377 (100.0% in the age bracket) attending a public institution.
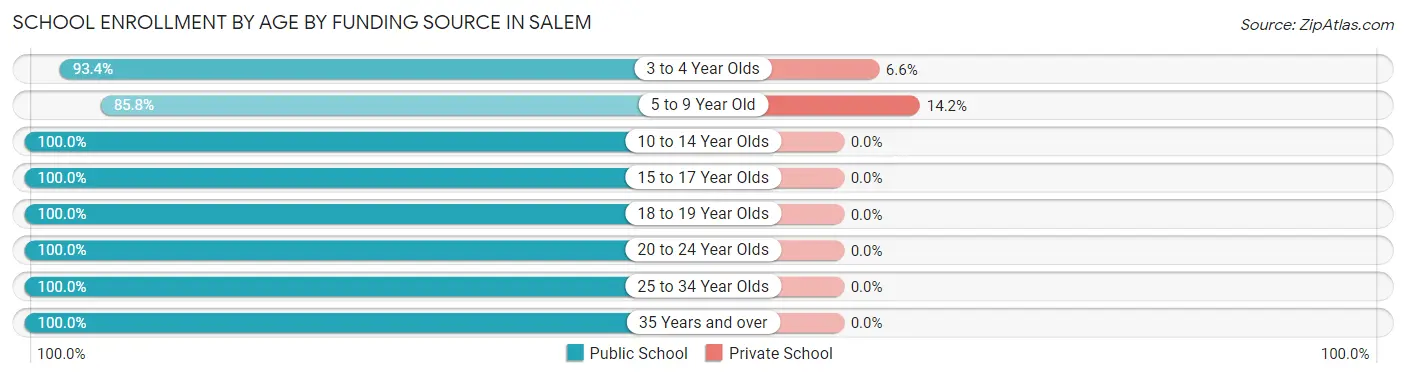
| Age Bracket | Public School | Private School |
| 3 to 4 Year Olds | 57 (93.4%) | 4 (6.6%) |
| 5 to 9 Year Old | 387 (85.8%) | 64 (14.2%) |
| 10 to 14 Year Olds | 377 (100.0%) | 0 (0.0%) |
| 15 to 17 Year Olds | 369 (100.0%) | 0 (0.0%) |
| 18 to 19 Year Olds | 48 (100.0%) | 0 (0.0%) |
| 20 to 24 Year Olds | 136 (100.0%) | 0 (0.0%) |
| 25 to 34 Year Olds | 68 (100.0%) | 0 (0.0%) |
| 35 Years and over | 12 (100.0%) | 0 (0.0%) |
| Total | 1,454 (95.5%) | 68 (4.5%) |
Educational Attainment by Field of Study in Salem
Education (216 | 29.2%), business (111 | 15.0%), computers & mathematics (79 | 10.7%), science & technology (77 | 10.4%), and literature & languages (43 | 5.8%) are the most common fields of study among 739 individuals in Salem who have obtained a bachelor's degree or higher.
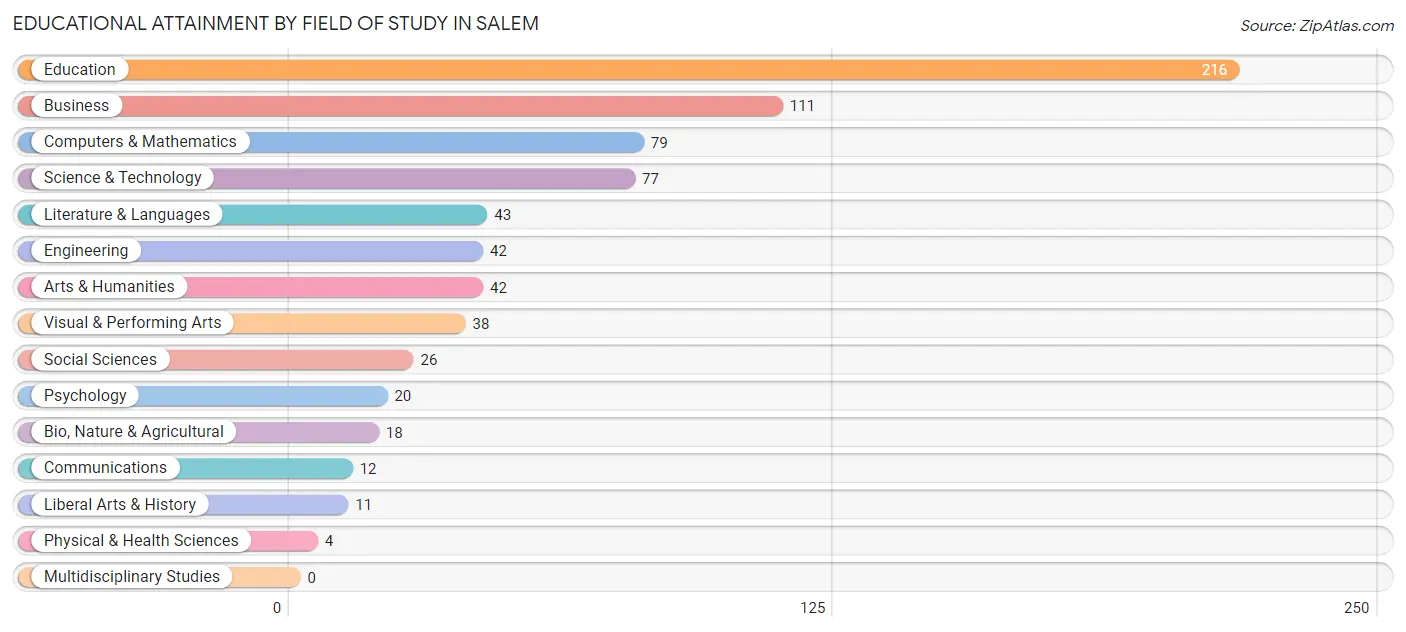
| Field of Study | # Graduates | % Graduates |
| Computers & Mathematics | 79 | 10.7% |
| Bio, Nature & Agricultural | 18 | 2.4% |
| Physical & Health Sciences | 4 | 0.5% |
| Psychology | 20 | 2.7% |
| Social Sciences | 26 | 3.5% |
| Engineering | 42 | 5.7% |
| Multidisciplinary Studies | 0 | 0.0% |
| Science & Technology | 77 | 10.4% |
| Business | 111 | 15.0% |
| Education | 216 | 29.2% |
| Literature & Languages | 43 | 5.8% |
| Liberal Arts & History | 11 | 1.5% |
| Visual & Performing Arts | 38 | 5.1% |
| Communications | 12 | 1.6% |
| Arts & Humanities | 42 | 5.7% |
| Total | 739 | 100.0% |
Transportation & Commute in Salem
Vehicle Availability by Sex in Salem
The most prevalent vehicle ownership categories in Salem are males with 2 vehicles (823, accounting for 47.8%) and females with 2 vehicles (864, making up 49.0%).
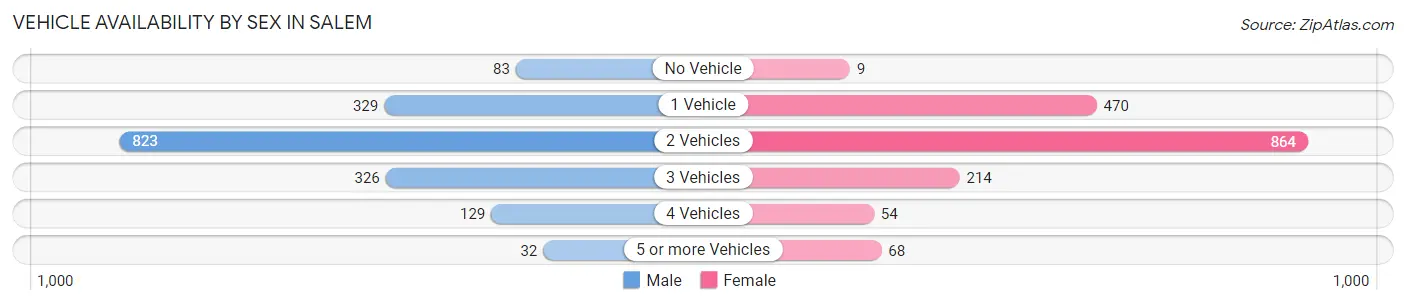
| Vehicles Available | Male | Female |
| No Vehicle | 83 (4.8%) | 9 (0.5%) |
| 1 Vehicle | 329 (19.1%) | 470 (28.0%) |
| 2 Vehicles | 823 (47.8%) | 864 (51.5%) |
| 3 Vehicles | 326 (18.9%) | 214 (12.8%) |
| 4 Vehicles | 129 (7.5%) | 54 (3.2%) |
| 5 or more Vehicles | 32 (1.9%) | 68 (4.1%) |
| Total | 1,722 (100.0%) | 1,679 (100.0%) |
Commute Time in Salem
The most frequently occuring commute durations in Salem are 5 to 9 minutes (1,251 commuters, 38.1%), 10 to 14 minutes (630 commuters, 19.2%), and 20 to 24 minutes (391 commuters, 11.9%).
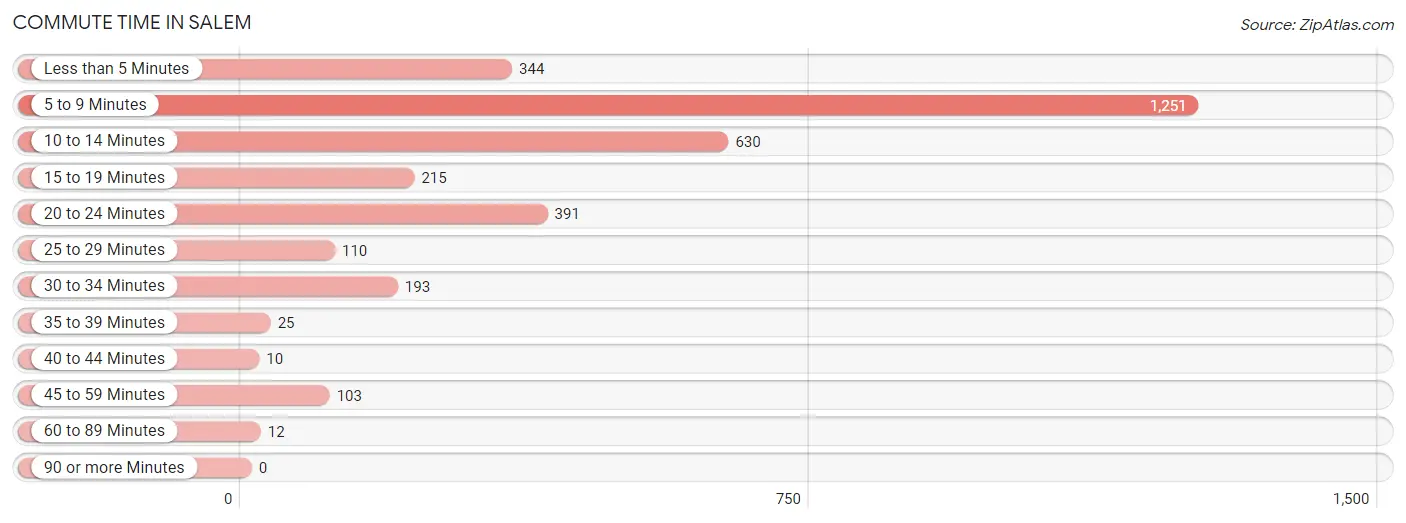
| Commute Time | # Commuters | % Commuters |
| Less than 5 Minutes | 344 | 10.5% |
| 5 to 9 Minutes | 1,251 | 38.1% |
| 10 to 14 Minutes | 630 | 19.2% |
| 15 to 19 Minutes | 215 | 6.6% |
| 20 to 24 Minutes | 391 | 11.9% |
| 25 to 29 Minutes | 110 | 3.4% |
| 30 to 34 Minutes | 193 | 5.9% |
| 35 to 39 Minutes | 25 | 0.8% |
| 40 to 44 Minutes | 10 | 0.3% |
| 45 to 59 Minutes | 103 | 3.1% |
| 60 to 89 Minutes | 12 | 0.4% |
| 90 or more Minutes | 0 | 0.0% |
Commute Time by Sex in Salem
The most common commute times in Salem are 5 to 9 minutes (626 commuters, 37.5%) for males and 5 to 9 minutes (625 commuters, 38.7%) for females.
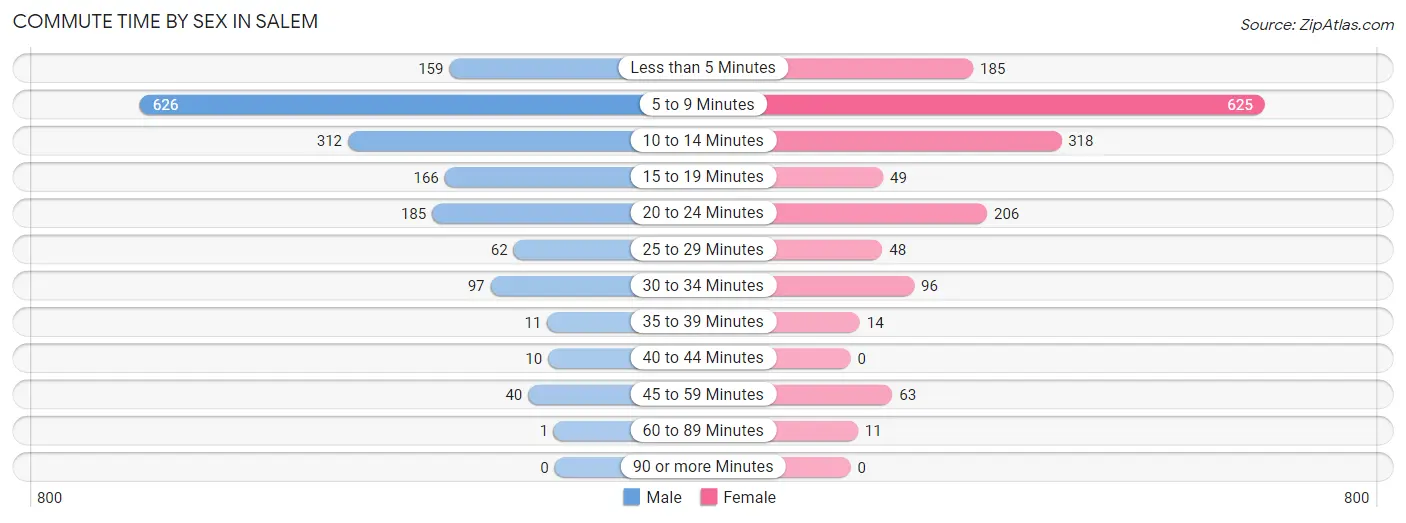
| Commute Time | Male | Female |
| Less than 5 Minutes | 159 (9.5%) | 185 (11.5%) |
| 5 to 9 Minutes | 626 (37.5%) | 625 (38.7%) |
| 10 to 14 Minutes | 312 (18.7%) | 318 (19.7%) |
| 15 to 19 Minutes | 166 (10.0%) | 49 (3.0%) |
| 20 to 24 Minutes | 185 (11.1%) | 206 (12.8%) |
| 25 to 29 Minutes | 62 (3.7%) | 48 (3.0%) |
| 30 to 34 Minutes | 97 (5.8%) | 96 (5.9%) |
| 35 to 39 Minutes | 11 (0.7%) | 14 (0.9%) |
| 40 to 44 Minutes | 10 (0.6%) | 0 (0.0%) |
| 45 to 59 Minutes | 40 (2.4%) | 63 (3.9%) |
| 60 to 89 Minutes | 1 (0.1%) | 11 (0.7%) |
| 90 or more Minutes | 0 (0.0%) | 0 (0.0%) |
Time of Departure to Work by Sex in Salem
The most frequent times of departure to work in Salem are 6:30 AM to 6:59 AM (278, 16.7%) for males and 4:00 PM to 11:59 PM (313, 19.4%) for females.
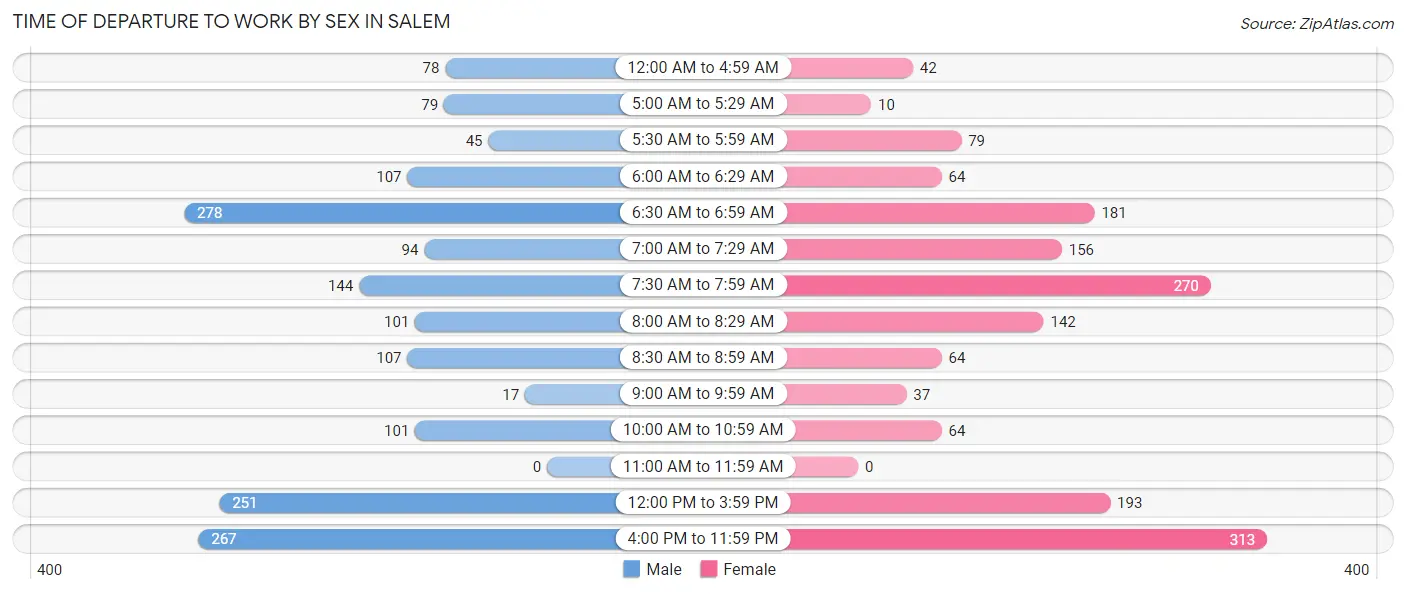
| Time of Departure | Male | Female |
| 12:00 AM to 4:59 AM | 78 (4.7%) | 42 (2.6%) |
| 5:00 AM to 5:29 AM | 79 (4.7%) | 10 (0.6%) |
| 5:30 AM to 5:59 AM | 45 (2.7%) | 79 (4.9%) |
| 6:00 AM to 6:29 AM | 107 (6.4%) | 64 (4.0%) |
| 6:30 AM to 6:59 AM | 278 (16.7%) | 181 (11.2%) |
| 7:00 AM to 7:29 AM | 94 (5.6%) | 156 (9.7%) |
| 7:30 AM to 7:59 AM | 144 (8.6%) | 270 (16.7%) |
| 8:00 AM to 8:29 AM | 101 (6.0%) | 142 (8.8%) |
| 8:30 AM to 8:59 AM | 107 (6.4%) | 64 (4.0%) |
| 9:00 AM to 9:59 AM | 17 (1.0%) | 37 (2.3%) |
| 10:00 AM to 10:59 AM | 101 (6.0%) | 64 (4.0%) |
| 11:00 AM to 11:59 AM | 0 (0.0%) | 0 (0.0%) |
| 12:00 PM to 3:59 PM | 251 (15.0%) | 193 (11.9%) |
| 4:00 PM to 11:59 PM | 267 (16.0%) | 313 (19.4%) |
| Total | 1,669 (100.0%) | 1,615 (100.0%) |
Housing Occupancy in Salem
Occupancy by Ownership in Salem
Of the total 2,971 dwellings in Salem, owner-occupied units account for 1,806 (60.8%), while renter-occupied units make up 1,165 (39.2%).
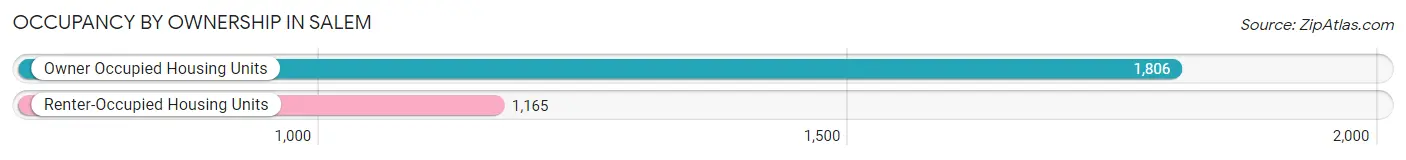
| Occupancy | # Housing Units | % Housing Units |
| Owner Occupied Housing Units | 1,806 | 60.8% |
| Renter-Occupied Housing Units | 1,165 | 39.2% |
| Total Occupied Housing Units | 2,971 | 100.0% |
Occupancy by Household Size in Salem
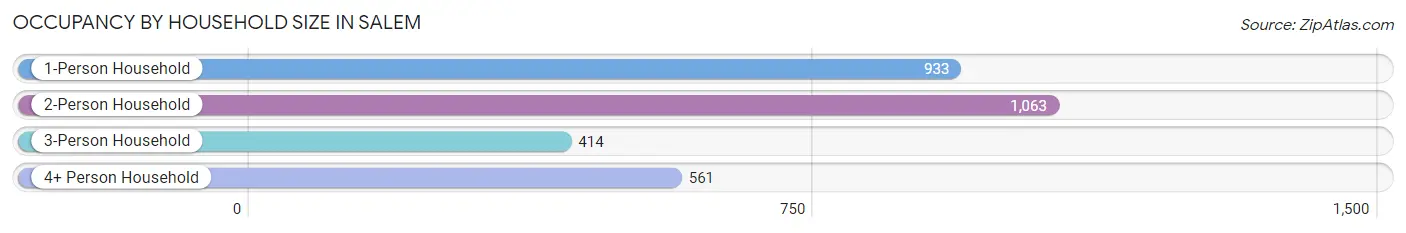
| Household Size | # Housing Units | % Housing Units |
| 1-Person Household | 933 | 31.4% |
| 2-Person Household | 1,063 | 35.8% |
| 3-Person Household | 414 | 13.9% |
| 4+ Person Household | 561 | 18.9% |
| Total Housing Units | 2,971 | 100.0% |
Occupancy by Ownership by Household Size in Salem
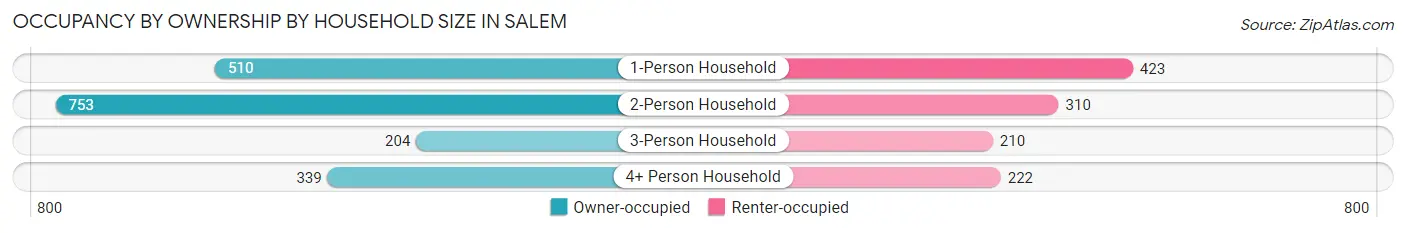
| Household Size | Owner-occupied | Renter-occupied |
| 1-Person Household | 510 (54.7%) | 423 (45.3%) |
| 2-Person Household | 753 (70.8%) | 310 (29.2%) |
| 3-Person Household | 204 (49.3%) | 210 (50.7%) |
| 4+ Person Household | 339 (60.4%) | 222 (39.6%) |
| Total Housing Units | 1,806 (60.8%) | 1,165 (39.2%) |
Occupancy by Educational Attainment in Salem
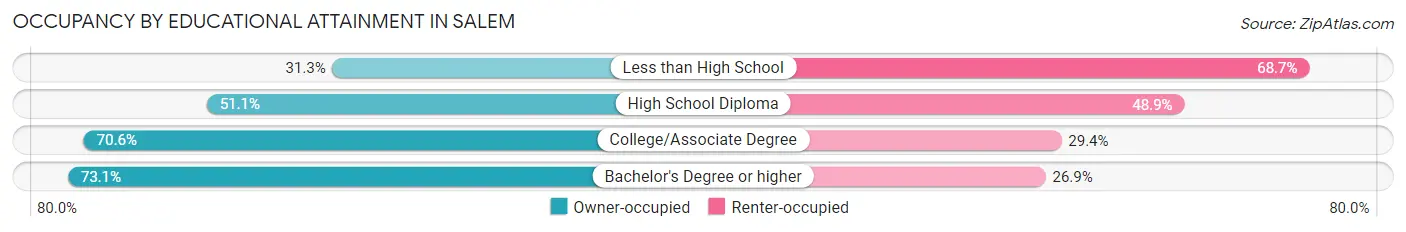
| Household Size | Owner-occupied | Renter-occupied |
| Less than High School | 67 (31.3%) | 147 (68.7%) |
| High School Diploma | 577 (51.1%) | 552 (48.9%) |
| College/Associate Degree | 808 (70.6%) | 336 (29.4%) |
| Bachelor's Degree or higher | 354 (73.1%) | 130 (26.9%) |
Occupancy by Age of Householder in Salem
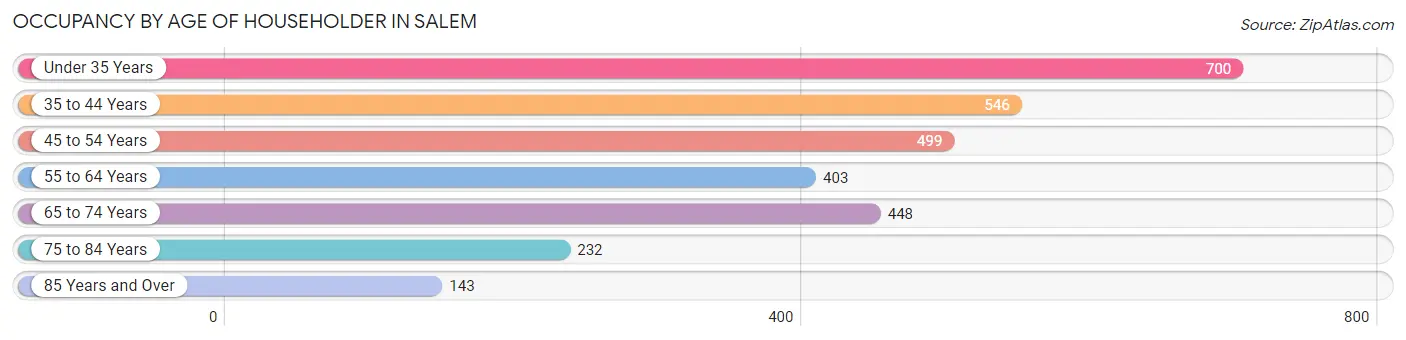
| Age Bracket | # Households | % Households |
| Under 35 Years | 700 | 23.6% |
| 35 to 44 Years | 546 | 18.4% |
| 45 to 54 Years | 499 | 16.8% |
| 55 to 64 Years | 403 | 13.6% |
| 65 to 74 Years | 448 | 15.1% |
| 75 to 84 Years | 232 | 7.8% |
| 85 Years and Over | 143 | 4.8% |
| Total | 2,971 | 100.0% |
Housing Finances in Salem
Median Income by Occupancy in Salem
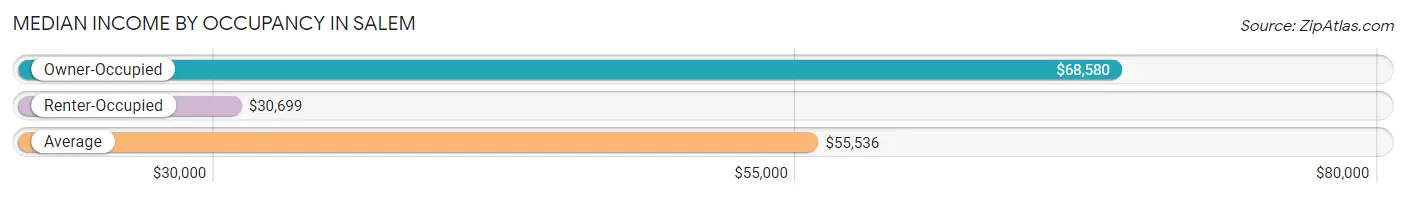
| Occupancy Type | # Households | Median Income |
| Owner-Occupied | 1,806 (60.8%) | $68,580 |
| Renter-Occupied | 1,165 (39.2%) | $30,699 |
| Average | 2,971 (100.0%) | $55,536 |
Occupancy by Householder Income Bracket in Salem
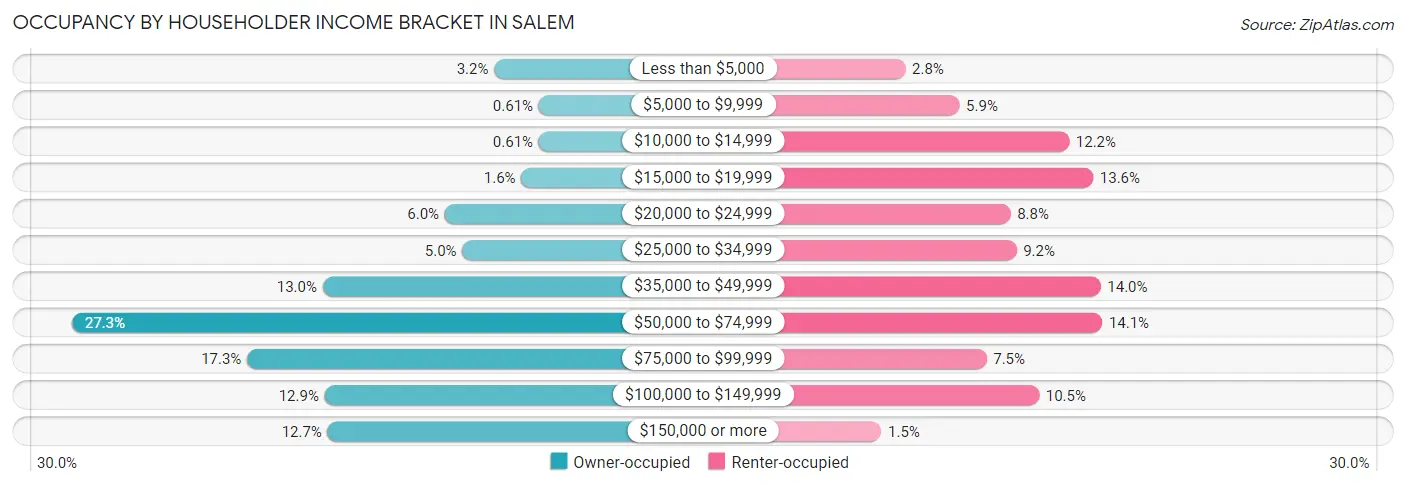
| Income Bracket | Owner-occupied | Renter-occupied |
| Less than $5,000 | 57 (3.2%) | 33 (2.8%) |
| $5,000 to $9,999 | 11 (0.6%) | 69 (5.9%) |
| $10,000 to $14,999 | 11 (0.6%) | 142 (12.2%) |
| $15,000 to $19,999 | 29 (1.6%) | 158 (13.6%) |
| $20,000 to $24,999 | 108 (6.0%) | 103 (8.8%) |
| $25,000 to $34,999 | 90 (5.0%) | 107 (9.2%) |
| $35,000 to $49,999 | 234 (13.0%) | 163 (14.0%) |
| $50,000 to $74,999 | 493 (27.3%) | 164 (14.1%) |
| $75,000 to $99,999 | 312 (17.3%) | 87 (7.5%) |
| $100,000 to $149,999 | 232 (12.9%) | 122 (10.5%) |
| $150,000 or more | 229 (12.7%) | 17 (1.5%) |
| Total | 1,806 (100.0%) | 1,165 (100.0%) |
Monthly Housing Cost Tiers in Salem
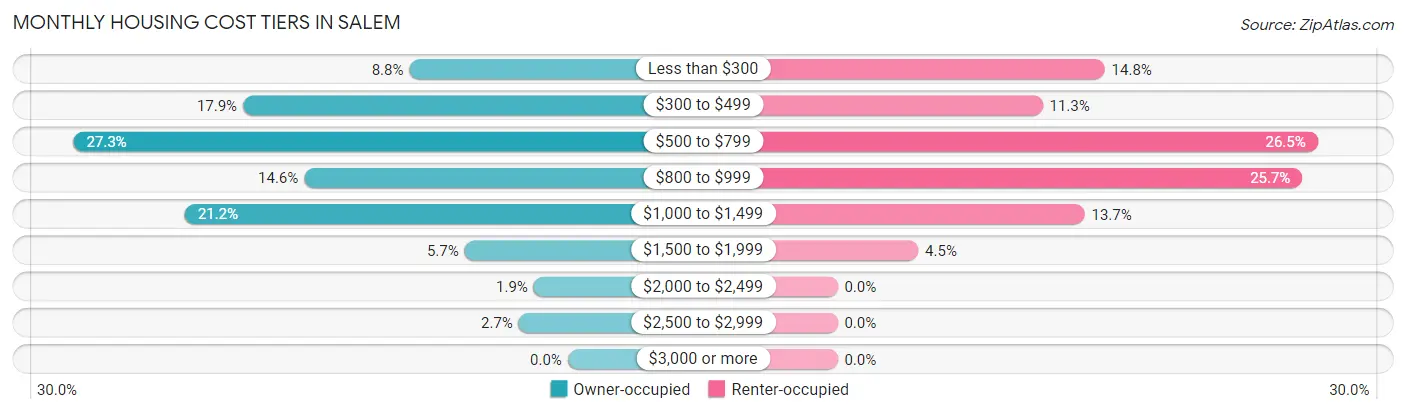
| Monthly Cost | Owner-occupied | Renter-occupied |
| Less than $300 | 158 (8.7%) | 172 (14.8%) |
| $300 to $499 | 324 (17.9%) | 132 (11.3%) |
| $500 to $799 | 493 (27.3%) | 309 (26.5%) |
| $800 to $999 | 263 (14.6%) | 299 (25.7%) |
| $1,000 to $1,499 | 382 (21.1%) | 159 (13.7%) |
| $1,500 to $1,999 | 103 (5.7%) | 52 (4.5%) |
| $2,000 to $2,499 | 34 (1.9%) | 0 (0.0%) |
| $2,500 to $2,999 | 49 (2.7%) | 0 (0.0%) |
| $3,000 or more | 0 (0.0%) | 0 (0.0%) |
| Total | 1,806 (100.0%) | 1,165 (100.0%) |
Physical Housing Characteristics in Salem
Housing Structures in Salem
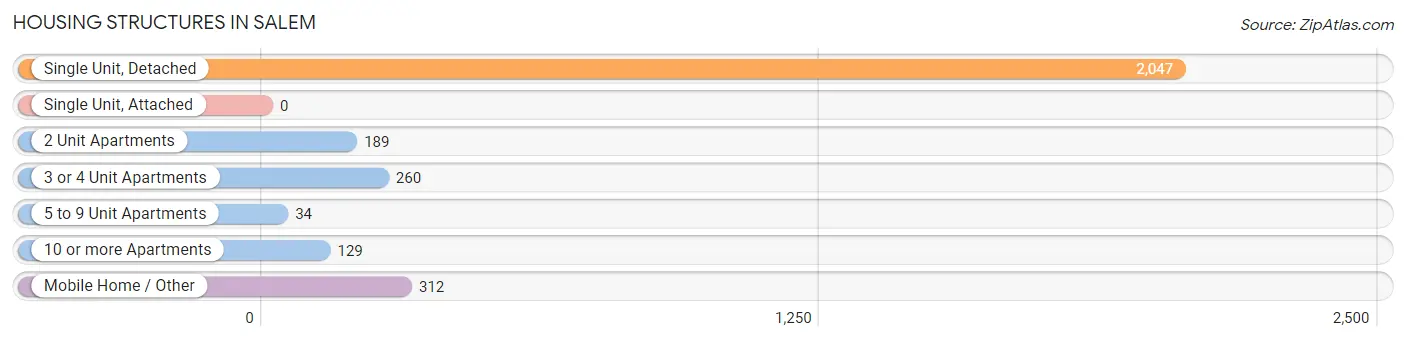
| Structure Type | # Housing Units | % Housing Units |
| Single Unit, Detached | 2,047 | 68.9% |
| Single Unit, Attached | 0 | 0.0% |
| 2 Unit Apartments | 189 | 6.4% |
| 3 or 4 Unit Apartments | 260 | 8.7% |
| 5 to 9 Unit Apartments | 34 | 1.1% |
| 10 or more Apartments | 129 | 4.3% |
| Mobile Home / Other | 312 | 10.5% |
| Total | 2,971 | 100.0% |
Housing Structures by Occupancy in Salem
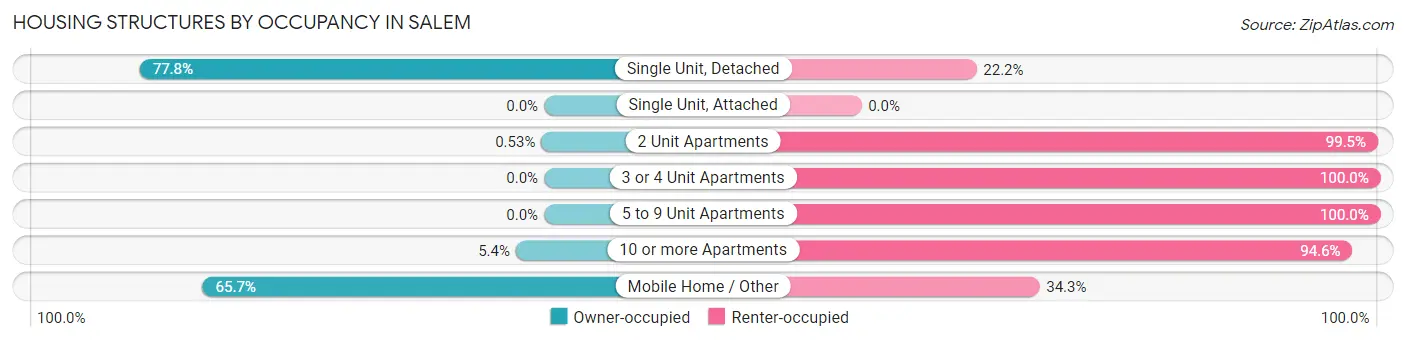
| Structure Type | Owner-occupied | Renter-occupied |
| Single Unit, Detached | 1,593 (77.8%) | 454 (22.2%) |
| Single Unit, Attached | 0 (0.0%) | 0 (0.0%) |
| 2 Unit Apartments | 1 (0.5%) | 188 (99.5%) |
| 3 or 4 Unit Apartments | 0 (0.0%) | 260 (100.0%) |
| 5 to 9 Unit Apartments | 0 (0.0%) | 34 (100.0%) |
| 10 or more Apartments | 7 (5.4%) | 122 (94.6%) |
| Mobile Home / Other | 205 (65.7%) | 107 (34.3%) |
| Total | 1,806 (60.8%) | 1,165 (39.2%) |
Housing Structures by Number of Rooms in Salem
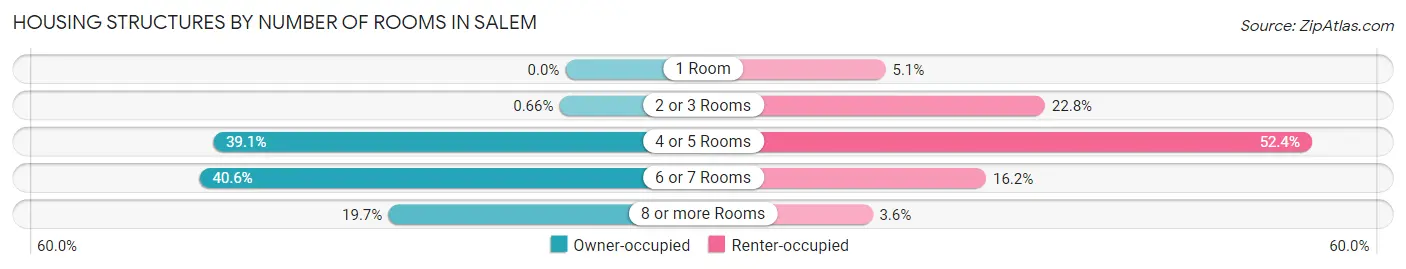
| Number of Rooms | Owner-occupied | Renter-occupied |
| 1 Room | 0 (0.0%) | 59 (5.1%) |
| 2 or 3 Rooms | 12 (0.7%) | 265 (22.8%) |
| 4 or 5 Rooms | 706 (39.1%) | 610 (52.4%) |
| 6 or 7 Rooms | 733 (40.6%) | 189 (16.2%) |
| 8 or more Rooms | 355 (19.7%) | 42 (3.6%) |
| Total | 1,806 (100.0%) | 1,165 (100.0%) |
Housing Structure by Heating Type in Salem
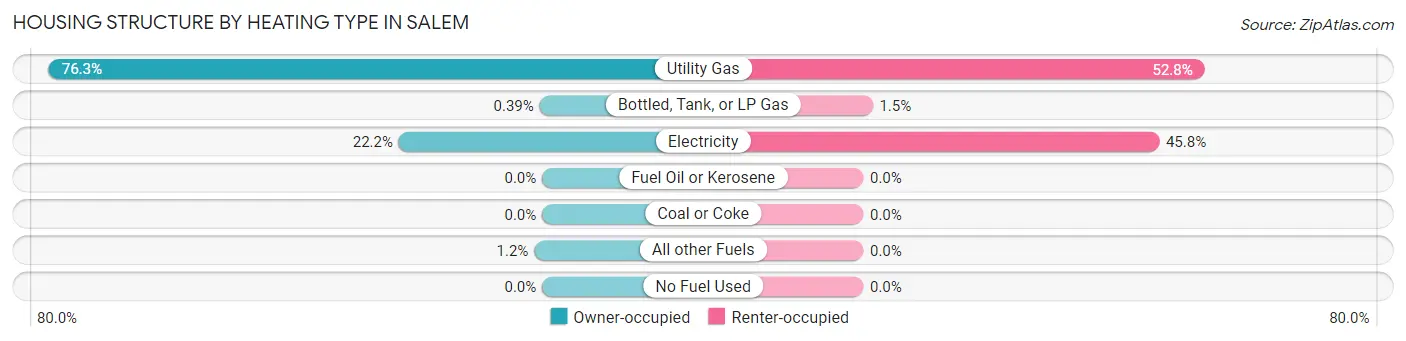
| Heating Type | Owner-occupied | Renter-occupied |
| Utility Gas | 1,377 (76.2%) | 615 (52.8%) |
| Bottled, Tank, or LP Gas | 7 (0.4%) | 17 (1.5%) |
| Electricity | 400 (22.2%) | 533 (45.8%) |
| Fuel Oil or Kerosene | 0 (0.0%) | 0 (0.0%) |
| Coal or Coke | 0 (0.0%) | 0 (0.0%) |
| All other Fuels | 22 (1.2%) | 0 (0.0%) |
| No Fuel Used | 0 (0.0%) | 0 (0.0%) |
| Total | 1,806 (100.0%) | 1,165 (100.0%) |
Household Vehicle Usage in Salem
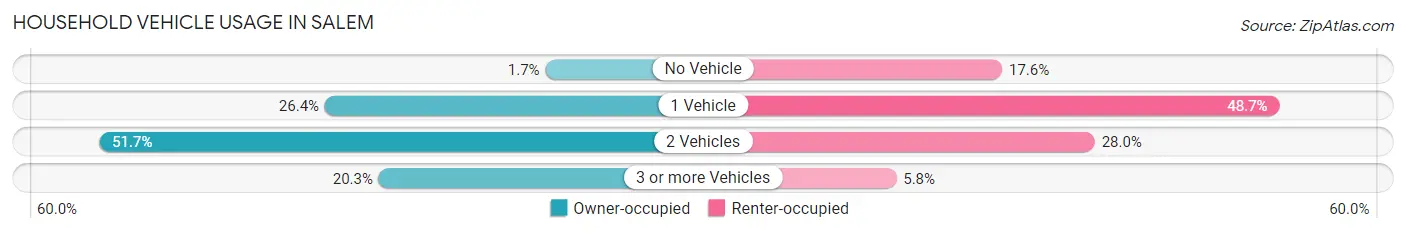
| Vehicles per Household | Owner-occupied | Renter-occupied |
| No Vehicle | 30 (1.7%) | 205 (17.6%) |
| 1 Vehicle | 476 (26.4%) | 567 (48.7%) |
| 2 Vehicles | 933 (51.7%) | 326 (28.0%) |
| 3 or more Vehicles | 367 (20.3%) | 67 (5.8%) |
| Total | 1,806 (100.0%) | 1,165 (100.0%) |
Real Estate & Mortgages in Salem
Real Estate and Mortgage Overview in Salem
| Characteristic | Without Mortgage | With Mortgage |
| Housing Units | 771 | 1,035 |
| Median Property Value | $90,900 | $98,000 |
| Median Household Income | $66,836 | $133 |
| Monthly Housing Costs | $478 | $0 |
| Real Estate Taxes | $1,374 | $32 |
Property Value by Mortgage Status in Salem
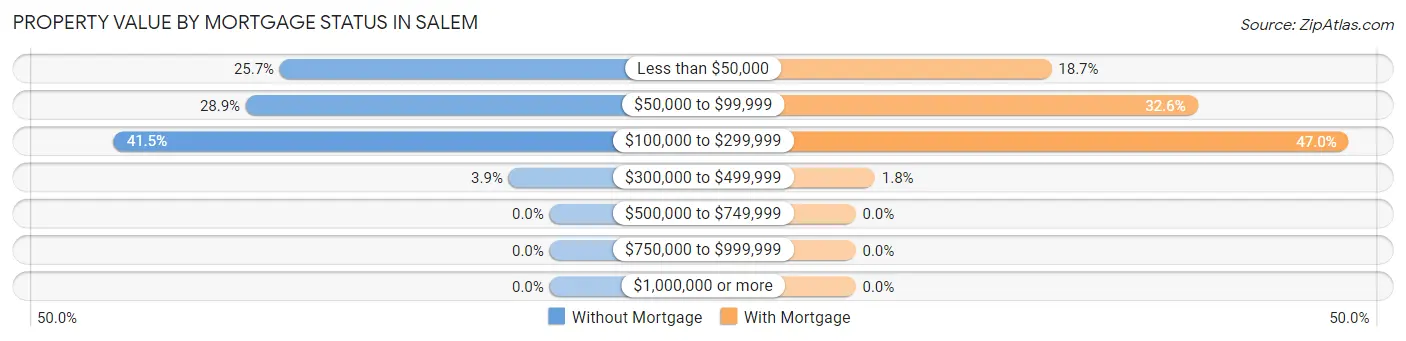
| Property Value | Without Mortgage | With Mortgage |
| Less than $50,000 | 198 (25.7%) | 193 (18.6%) |
| $50,000 to $99,999 | 223 (28.9%) | 337 (32.6%) |
| $100,000 to $299,999 | 320 (41.5%) | 486 (47.0%) |
| $300,000 to $499,999 | 30 (3.9%) | 19 (1.8%) |
| $500,000 to $749,999 | 0 (0.0%) | 0 (0.0%) |
| $750,000 to $999,999 | 0 (0.0%) | 0 (0.0%) |
| $1,000,000 or more | 0 (0.0%) | 0 (0.0%) |
| Total | 771 (100.0%) | 1,035 (100.0%) |
Household Income by Mortgage Status in Salem
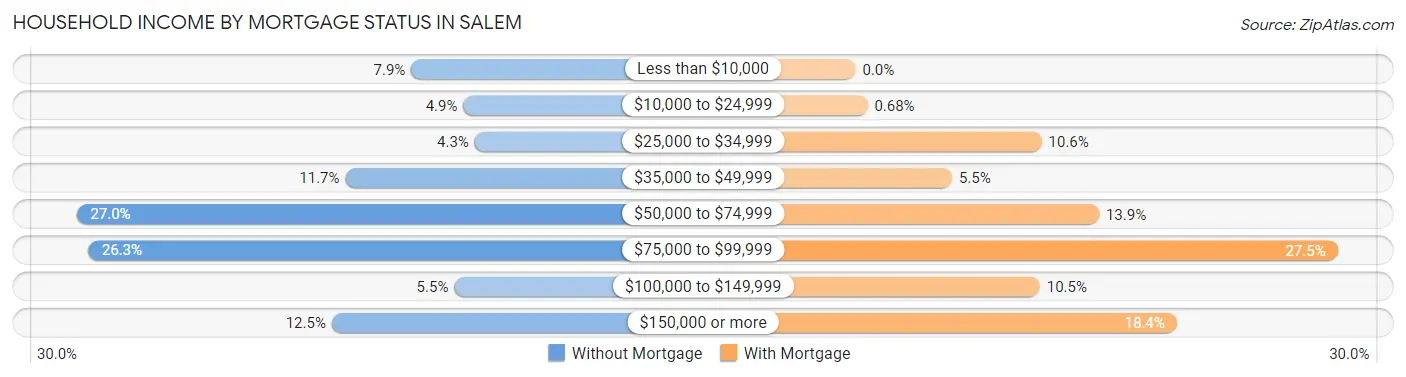
| Household Income | Without Mortgage | With Mortgage |
| Less than $10,000 | 61 (7.9%) | 0 (0.0%) |
| $10,000 to $24,999 | 38 (4.9%) | 7 (0.7%) |
| $25,000 to $34,999 | 33 (4.3%) | 110 (10.6%) |
| $35,000 to $49,999 | 90 (11.7%) | 57 (5.5%) |
| $50,000 to $74,999 | 208 (27.0%) | 144 (13.9%) |
| $75,000 to $99,999 | 203 (26.3%) | 285 (27.5%) |
| $100,000 to $149,999 | 42 (5.4%) | 109 (10.5%) |
| $150,000 or more | 96 (12.4%) | 190 (18.4%) |
| Total | 771 (100.0%) | 1,035 (100.0%) |
Property Value to Household Income Ratio in Salem
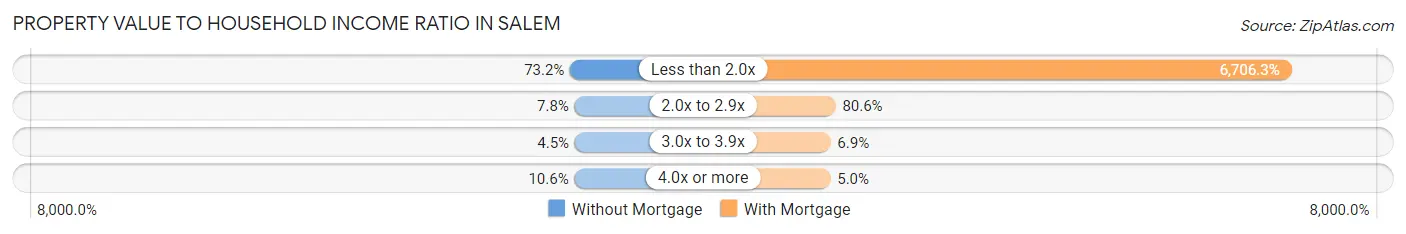
| Value-to-Income Ratio | Without Mortgage | With Mortgage |
| Less than 2.0x | 564 (73.2%) | 69,410 (6,706.3%) |
| 2.0x to 2.9x | 60 (7.8%) | 834 (80.6%) |
| 3.0x to 3.9x | 35 (4.5%) | 71 (6.9%) |
| 4.0x or more | 82 (10.6%) | 52 (5.0%) |
| Total | 771 (100.0%) | 1,035 (100.0%) |
Real Estate Taxes by Mortgage Status in Salem
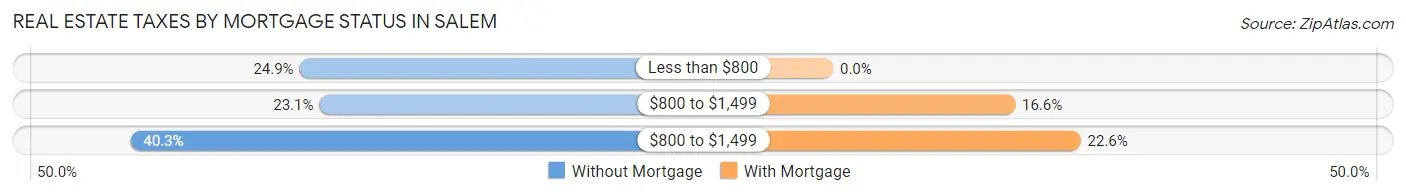
| Property Taxes | Without Mortgage | With Mortgage |
| Less than $800 | 192 (24.9%) | 0 (0.0%) |
| $800 to $1,499 | 178 (23.1%) | 172 (16.6%) |
| $800 to $1,499 | 311 (40.3%) | 234 (22.6%) |
| Total | 771 (100.0%) | 1,035 (100.0%) |
Health & Disability in Salem
Health Insurance Coverage by Age in Salem
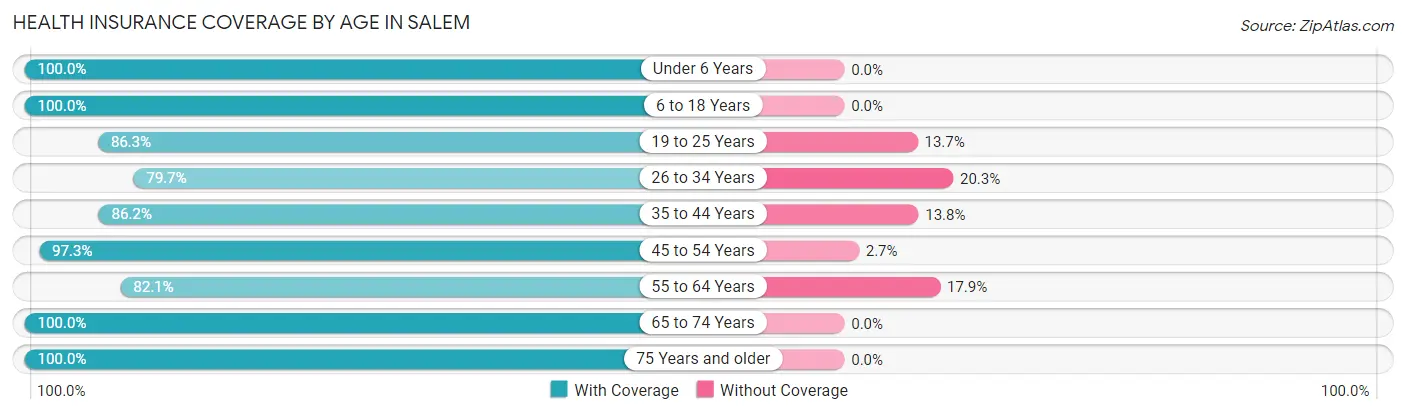
| Age Bracket | With Coverage | Without Coverage |
| Under 6 Years | 595 (100.0%) | 0 (0.0%) |
| 6 to 18 Years | 1,213 (100.0%) | 0 (0.0%) |
| 19 to 25 Years | 632 (86.3%) | 100 (13.7%) |
| 26 to 34 Years | 735 (79.7%) | 187 (20.3%) |
| 35 to 44 Years | 737 (86.2%) | 118 (13.8%) |
| 45 to 54 Years | 756 (97.3%) | 21 (2.7%) |
| 55 to 64 Years | 598 (82.1%) | 130 (17.9%) |
| 65 to 74 Years | 678 (100.0%) | 0 (0.0%) |
| 75 Years and older | 511 (100.0%) | 0 (0.0%) |
| Total | 6,455 (92.1%) | 556 (7.9%) |
Health Insurance Coverage by Citizenship Status in Salem
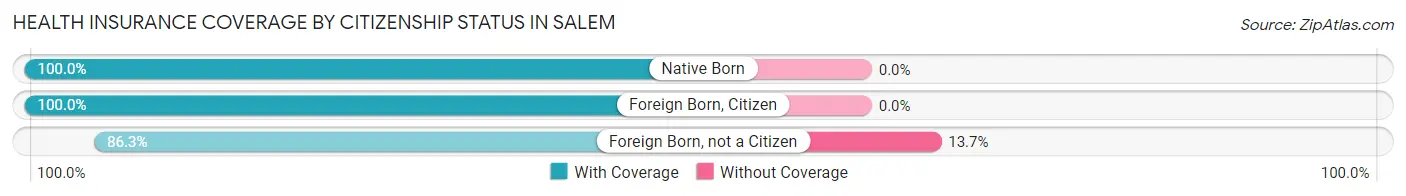
| Citizenship Status | With Coverage | Without Coverage |
| Native Born | 595 (100.0%) | 0 (0.0%) |
| Foreign Born, Citizen | 1,213 (100.0%) | 0 (0.0%) |
| Foreign Born, not a Citizen | 632 (86.3%) | 100 (13.7%) |
Health Insurance Coverage by Household Income in Salem
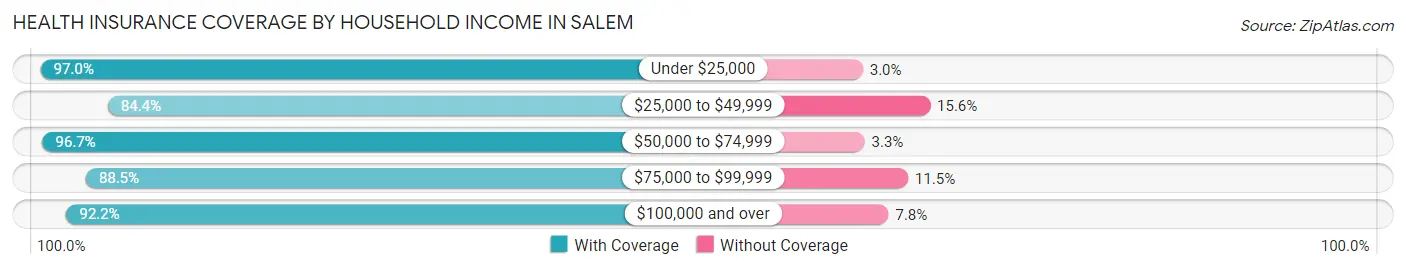
| Household Income | With Coverage | Without Coverage |
| Under $25,000 | 1,331 (97.0%) | 41 (3.0%) |
| $25,000 to $49,999 | 1,119 (84.4%) | 207 (15.6%) |
| $50,000 to $74,999 | 1,505 (96.7%) | 52 (3.3%) |
| $75,000 to $99,999 | 910 (88.5%) | 118 (11.5%) |
| $100,000 and over | 1,579 (92.2%) | 134 (7.8%) |
Public vs Private Health Insurance Coverage by Age in Salem
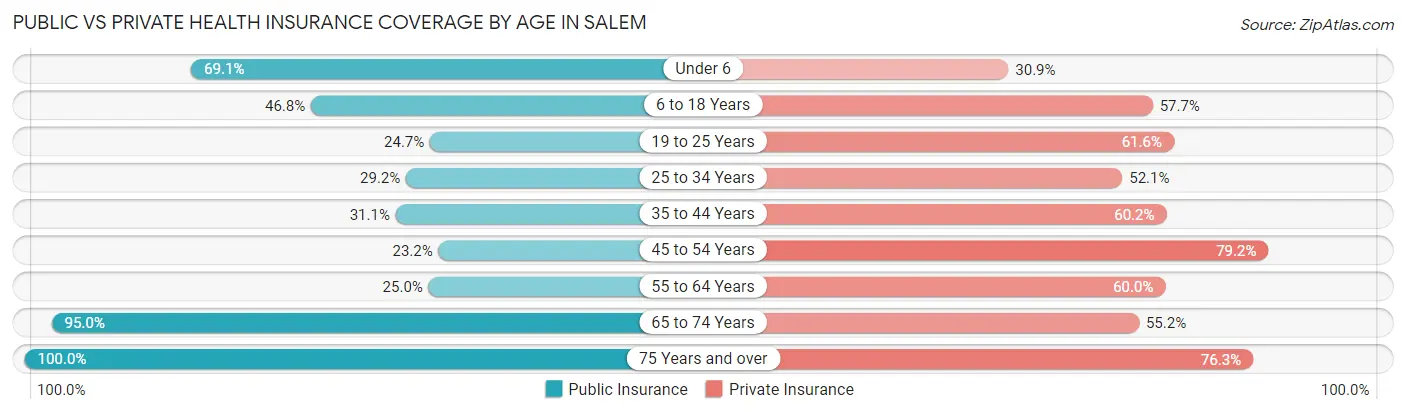
| Age Bracket | Public Insurance | Private Insurance |
| Under 6 | 411 (69.1%) | 184 (30.9%) |
| 6 to 18 Years | 568 (46.8%) | 700 (57.7%) |
| 19 to 25 Years | 181 (24.7%) | 451 (61.6%) |
| 25 to 34 Years | 269 (29.2%) | 480 (52.1%) |
| 35 to 44 Years | 266 (31.1%) | 515 (60.2%) |
| 45 to 54 Years | 180 (23.2%) | 615 (79.1%) |
| 55 to 64 Years | 182 (25.0%) | 437 (60.0%) |
| 65 to 74 Years | 644 (95.0%) | 374 (55.2%) |
| 75 Years and over | 511 (100.0%) | 390 (76.3%) |
| Total | 3,212 (45.8%) | 4,146 (59.1%) |
Disability Status by Sex by Age in Salem
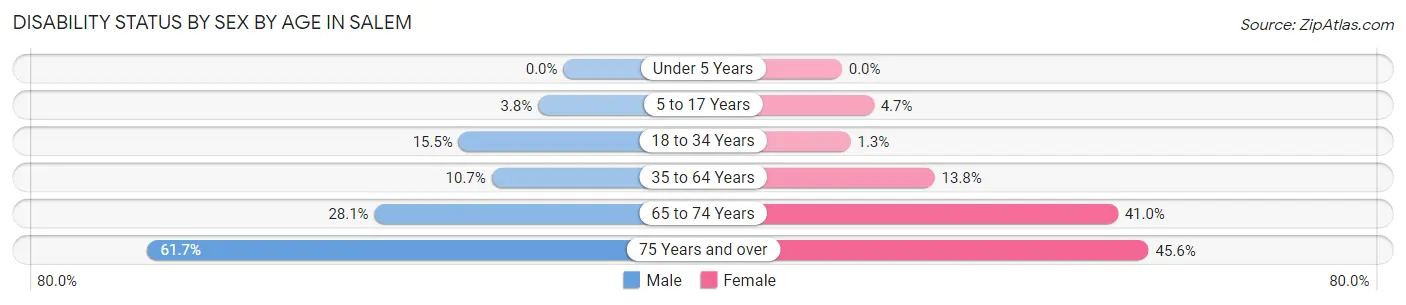
| Age Bracket | Male | Female |
| Under 5 Years | 0 (0.0%) | 0 (0.0%) |
| 5 to 17 Years | 20 (3.7%) | 33 (4.7%) |
| 18 to 34 Years | 136 (15.5%) | 11 (1.3%) |
| 35 to 64 Years | 123 (10.6%) | 166 (13.8%) |
| 65 to 74 Years | 69 (28.1%) | 177 (41.0%) |
| 75 Years and over | 100 (61.7%) | 159 (45.6%) |
Disability Class by Sex by Age in Salem
Disability Class: Hearing Difficulty
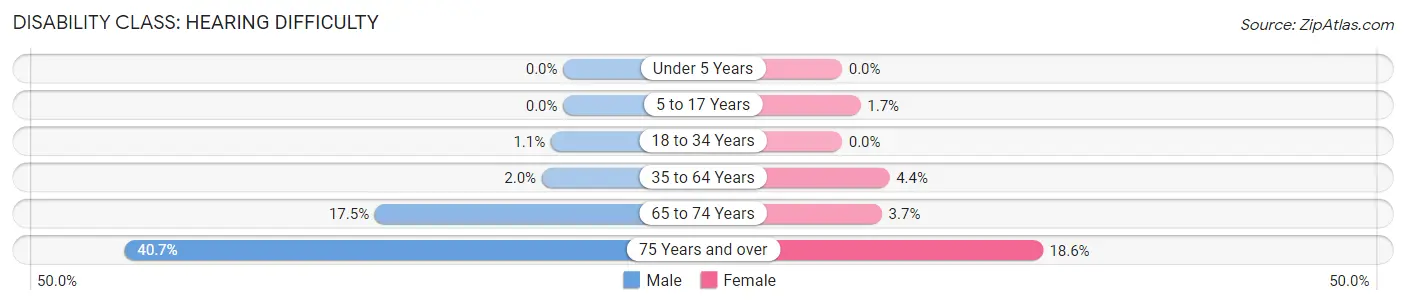
| Age Bracket | Male | Female |
| Under 5 Years | 0 (0.0%) | 0 (0.0%) |
| 5 to 17 Years | 0 (0.0%) | 12 (1.7%) |
| 18 to 34 Years | 10 (1.1%) | 0 (0.0%) |
| 35 to 64 Years | 23 (2.0%) | 53 (4.4%) |
| 65 to 74 Years | 43 (17.5%) | 16 (3.7%) |
| 75 Years and over | 66 (40.7%) | 65 (18.6%) |
Disability Class: Vision Difficulty
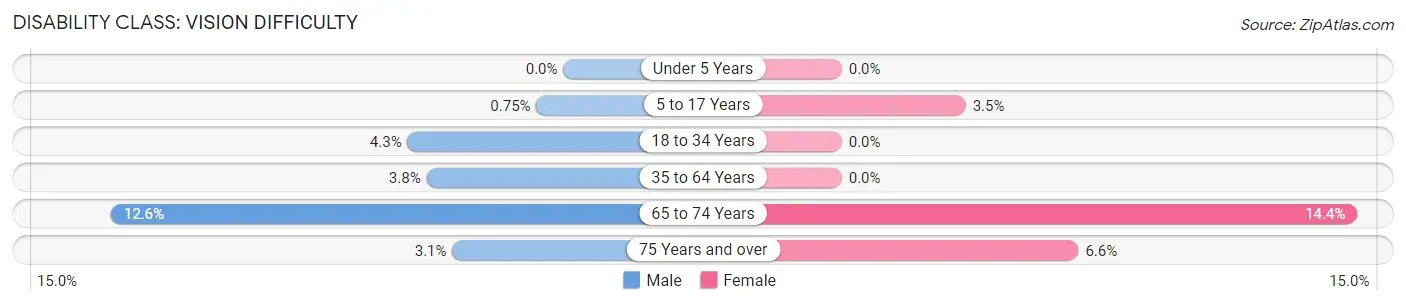
| Age Bracket | Male | Female |
| Under 5 Years | 0 (0.0%) | 0 (0.0%) |
| 5 to 17 Years | 4 (0.7%) | 24 (3.5%) |
| 18 to 34 Years | 38 (4.3%) | 0 (0.0%) |
| 35 to 64 Years | 44 (3.8%) | 0 (0.0%) |
| 65 to 74 Years | 31 (12.6%) | 62 (14.3%) |
| 75 Years and over | 5 (3.1%) | 23 (6.6%) |
Disability Class: Cognitive Difficulty
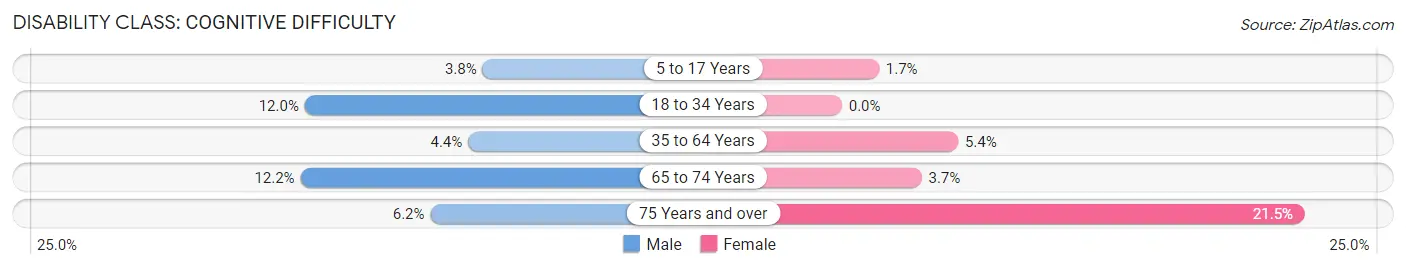
| Age Bracket | Male | Female |
| 5 to 17 Years | 20 (3.7%) | 12 (1.7%) |
| 18 to 34 Years | 105 (12.0%) | 0 (0.0%) |
| 35 to 64 Years | 51 (4.4%) | 65 (5.4%) |
| 65 to 74 Years | 30 (12.2%) | 16 (3.7%) |
| 75 Years and over | 10 (6.2%) | 75 (21.5%) |
Disability Class: Ambulatory Difficulty
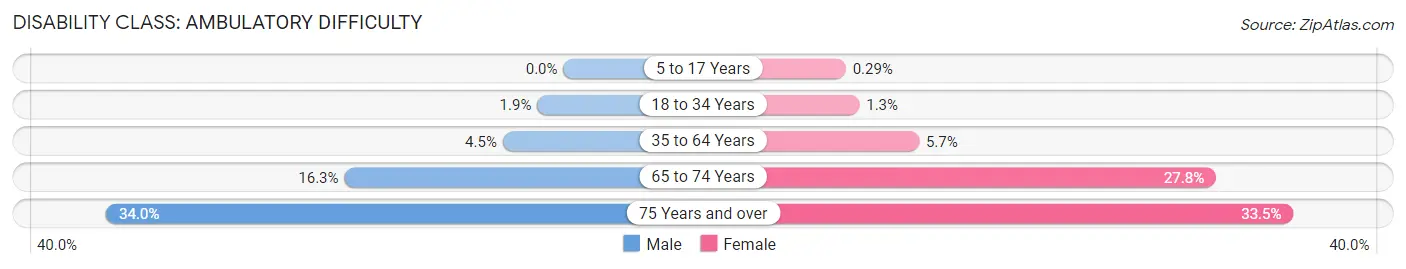
| Age Bracket | Male | Female |
| 5 to 17 Years | 0 (0.0%) | 2 (0.3%) |
| 18 to 34 Years | 17 (1.9%) | 11 (1.3%) |
| 35 to 64 Years | 52 (4.5%) | 69 (5.7%) |
| 65 to 74 Years | 40 (16.3%) | 120 (27.8%) |
| 75 Years and over | 55 (34.0%) | 117 (33.5%) |
Disability Class: Self-Care Difficulty
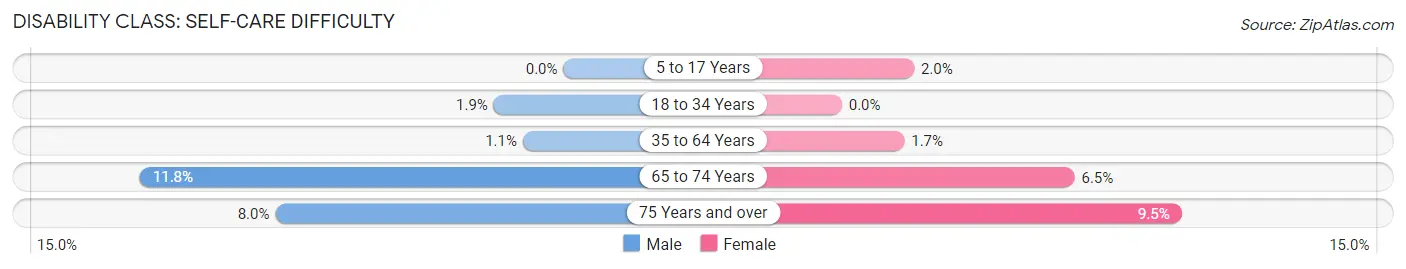
| Age Bracket | Male | Female |
| 5 to 17 Years | 0 (0.0%) | 14 (2.0%) |
| 18 to 34 Years | 17 (1.9%) | 0 (0.0%) |
| 35 to 64 Years | 13 (1.1%) | 21 (1.7%) |
| 65 to 74 Years | 29 (11.8%) | 28 (6.5%) |
| 75 Years and over | 13 (8.0%) | 33 (9.5%) |
Technology Access in Salem
Computing Device Access in Salem
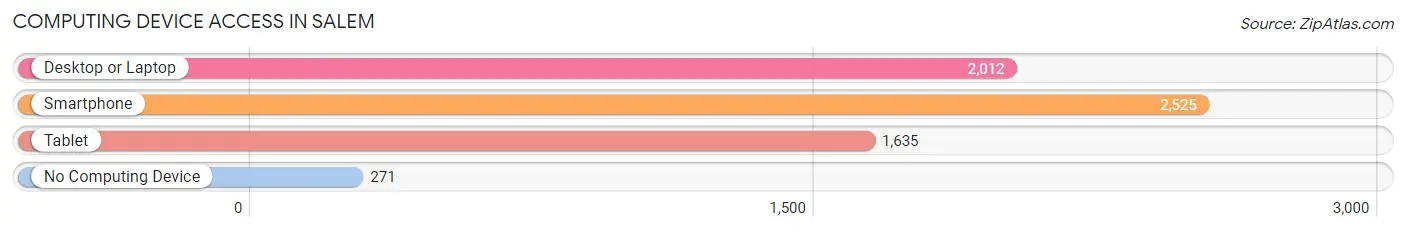
| Device Type | # Households | % Households |
| Desktop or Laptop | 2,012 | 67.7% |
| Smartphone | 2,525 | 85.0% |
| Tablet | 1,635 | 55.0% |
| No Computing Device | 271 | 9.1% |
| Total | 2,971 | 100.0% |
Internet Access in Salem
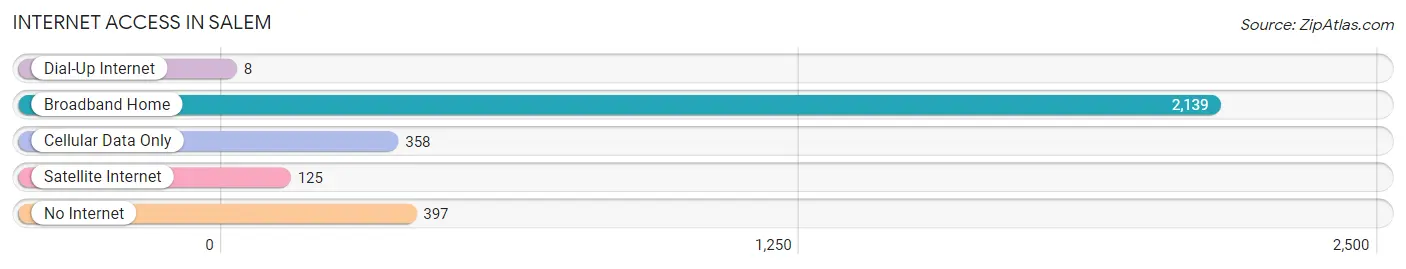
| Internet Type | # Households | % Households |
| Dial-Up Internet | 8 | 0.3% |
| Broadband Home | 2,139 | 72.0% |
| Cellular Data Only | 358 | 12.0% |
| Satellite Internet | 125 | 4.2% |
| No Internet | 397 | 13.4% |
| Total | 2,971 | 100.0% |
Salem Summary
Salem, Illinois is a city located in Marion County, Illinois, United States. It is the county seat of Marion County and is located in the southern part of the state. The population of Salem was 7,485 at the 2010 census.
History
The area that is now Salem was first settled in 1814 by John Hay. He was a veteran of the War of 1812 and was granted a land grant in the area. He built a log cabin and began farming the land. The area was known as Hay’s Settlement and was the first settlement in Marion County.
In 1820, the town was officially laid out and named Salem. The name was chosen in honor of Salem, Massachusetts, which was the hometown of many of the settlers. The town was incorporated in 1845 and was designated as the county seat of Marion County.
In the late 19th century, Salem was a major center for coal mining. The coal industry was the main source of employment for the town and the surrounding area. The coal mines were eventually closed in the early 20th century and the town shifted to a more agricultural-based economy.
Geography
Salem is located in the southern part of Marion County, Illinois. It is situated at the intersection of Illinois Route 37 and Illinois Route 50. The city is located about 60 miles east of St. Louis, Missouri and about 90 miles south of Chicago, Illinois.
The city has a total area of 4.2 square miles, all of which is land. The city is located in the Shawnee Hills region of Illinois and is surrounded by rolling hills and farmland. The city is located in the Kaskaskia River watershed.
Economy
The economy of Salem is largely based on agriculture and manufacturing. The city is home to several manufacturing companies, including a plastics manufacturer, a metal fabrication company, and a food processing plant.
The city is also home to several agricultural businesses, including a large dairy farm and several grain elevators. The city is also home to several retail businesses, including a grocery store, a hardware store, and several restaurants.
Demographics
As of the 2010 census, the population of Salem was 7,485. The racial makeup of the city was 95.2% White, 0.7% African American, 0.3% Native American, 0.7% Asian, 0.1% Pacific Islander, 1.3% from other races, and 1.7% from two or more races. Hispanic or Latino of any race were 3.2% of the population.
The median income for a household in the city was $37,917 and the median income for a family was $45,938. The per capita income for the city was $18,945. About 11.2% of families and 14.2% of the population were below the poverty line, including 19.2% of those under age 18 and 8.2% of those age 65 or over.
Common Questions
What is Per Capita Income in Salem?
Per Capita income in Salem is $29,768.
What is the Median Family Income in Salem?
Median Family Income in Salem is $57,260.
What is the Median Household income in Salem?
Median Household Income in Salem is $55,536.
What is Income or Wage Gap in Salem?
Income or Wage Gap in Salem is 31.6%.
Women in Salem earn 68.4 cents for every dollar earned by a man.
What is Family Income Deficit in Salem?
Family Income Deficit in Salem is $11,267.
Families that are below poverty line in Salem earn $11,267 less on average than the poverty threshold level.
What is Inequality or Gini Index in Salem?
Inequality or Gini Index in Salem is 0.44.
What is the Total Population of Salem?
Total Population of Salem is 7,228.
What is the Total Male Population of Salem?
Total Male Population of Salem is 3,354.
What is the Total Female Population of Salem?
Total Female Population of Salem is 3,874.
What is the Ratio of Males per 100 Females in Salem?
There are 86.58 Males per 100 Females in Salem.
What is the Ratio of Females per 100 Males in Salem?
There are 115.50 Females per 100 Males in Salem.
What is the Median Population Age in Salem?
Median Population Age in Salem is 36.4 Years.
What is the Average Family Size in Salem
Average Family Size in Salem is 2.9 People.
What is the Average Household Size in Salem
Average Household Size in Salem is 2.4 People.
How Large is the Labor Force in Salem?
There are 3,633 People in the Labor Forcein in Salem.
What is the Percentage of People in the Labor Force in Salem?
63.4% of People are in the Labor Force in Salem.
What is the Unemployment Rate in Salem?
Unemployment Rate in Salem is 4.5%.