Roanoke, IL Map & Demographics
Roanoke Map
Roanoke Overview
$33,146
PER CAPITA INCOME
$82,917
AVG FAMILY INCOME
$69,250
AVG HOUSEHOLD INCOME
42.3%
WAGE / INCOME GAP [ % ]
57.7¢/ $1
WAGE / INCOME GAP [ $ ]
0.37
INEQUALITY / GINI INDEX
2,011
TOTAL POPULATION
1,035
MALE POPULATION
976
FEMALE POPULATION
106.05
MALES / 100 FEMALES
94.30
FEMALES / 100 MALES
39.1
MEDIAN AGE
3.2
AVG FAMILY SIZE
2.6
AVG HOUSEHOLD SIZE
1,019
LABOR FORCE [ PEOPLE ]
64.1%
PERCENT IN LABOR FORCE
1.6%
UNEMPLOYMENT RATE
Roanoke Zip Codes
Roanoke Area Codes
Income in Roanoke
Income Overview in Roanoke
Per Capita Income in Roanoke is $33,146, while median incomes of families and households are $82,917 and $69,250 respectively.
| Characteristic | Number | Measure |
| Per Capita Income | 2,011 | $33,146 |
| Median Family Income | 536 | $82,917 |
| Mean Family Income | 536 | $95,205 |
| Median Household Income | 746 | $69,250 |
| Mean Household Income | 746 | $85,353 |
| Income Deficit | 536 | $0 |
| Wage / Income Gap (%) | 2,011 | 42.27% |
| Wage / Income Gap ($) | 2,011 | 57.73¢ per $1 |
| Gini / Inequality Index | 2,011 | 0.37 |
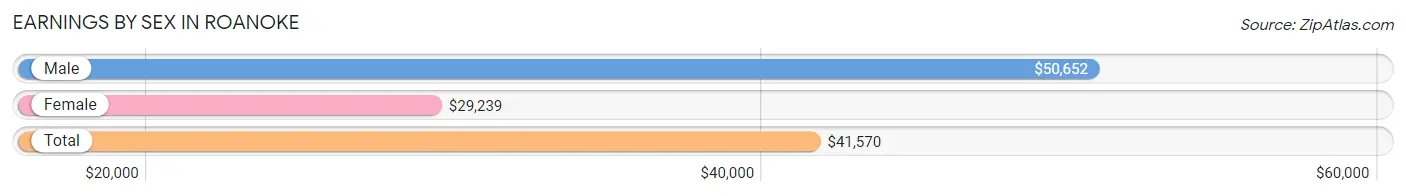
Earnings by Sex in Roanoke
Average Earnings in Roanoke are $41,570, $50,652 for men and $29,239 for women, a difference of 42.3%.
| Sex | Number | Average Earnings |
| Male | 552 (50.5%) | $50,652 |
| Female | 542 (49.5%) | $29,239 |
| Total | 1,094 (100.0%) | $41,570 |
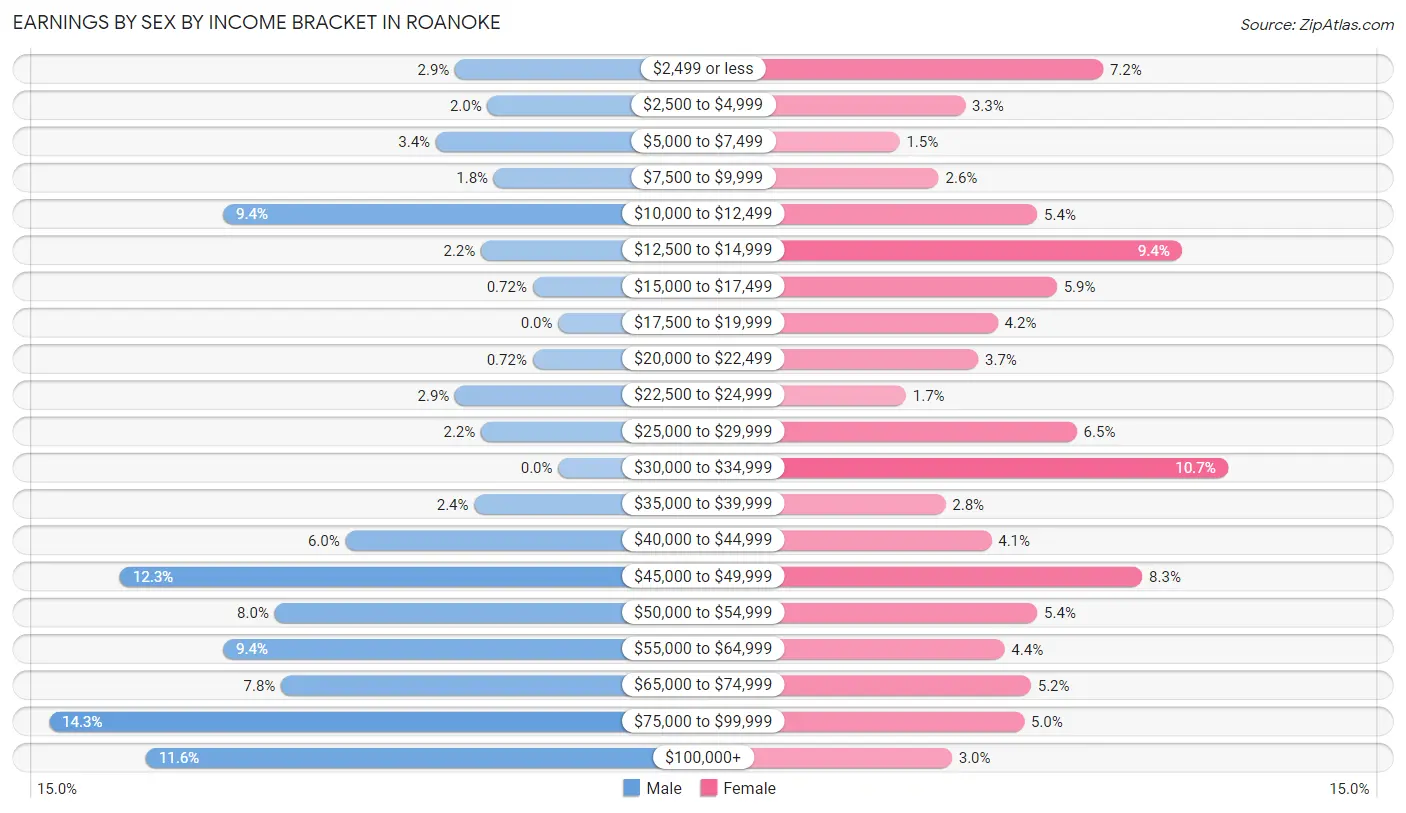
Earnings by Sex by Income Bracket in Roanoke
The most common earnings brackets in Roanoke are $75,000 to $99,999 for men (79 | 14.3%) and $30,000 to $34,999 for women (58 | 10.7%).
| Income | Male | Female |
| $2,499 or less | 16 (2.9%) | 39 (7.2%) |
| $2,500 to $4,999 | 11 (2.0%) | 18 (3.3%) |
| $5,000 to $7,499 | 19 (3.4%) | 8 (1.5%) |
| $7,500 to $9,999 | 10 (1.8%) | 14 (2.6%) |
| $10,000 to $12,499 | 52 (9.4%) | 29 (5.3%) |
| $12,500 to $14,999 | 12 (2.2%) | 51 (9.4%) |
| $15,000 to $17,499 | 4 (0.7%) | 32 (5.9%) |
| $17,500 to $19,999 | 0 (0.0%) | 23 (4.2%) |
| $20,000 to $22,499 | 4 (0.7%) | 20 (3.7%) |
| $22,500 to $24,999 | 16 (2.9%) | 9 (1.7%) |
| $25,000 to $29,999 | 12 (2.2%) | 35 (6.5%) |
| $30,000 to $34,999 | 0 (0.0%) | 58 (10.7%) |
| $35,000 to $39,999 | 13 (2.4%) | 15 (2.8%) |
| $40,000 to $44,999 | 33 (6.0%) | 22 (4.1%) |
| $45,000 to $49,999 | 68 (12.3%) | 45 (8.3%) |
| $50,000 to $54,999 | 44 (8.0%) | 29 (5.3%) |
| $55,000 to $64,999 | 52 (9.4%) | 24 (4.4%) |
| $65,000 to $74,999 | 43 (7.8%) | 28 (5.2%) |
| $75,000 to $99,999 | 79 (14.3%) | 27 (5.0%) |
| $100,000+ | 64 (11.6%) | 16 (2.9%) |
| Total | 552 (100.0%) | 542 (100.0%) |
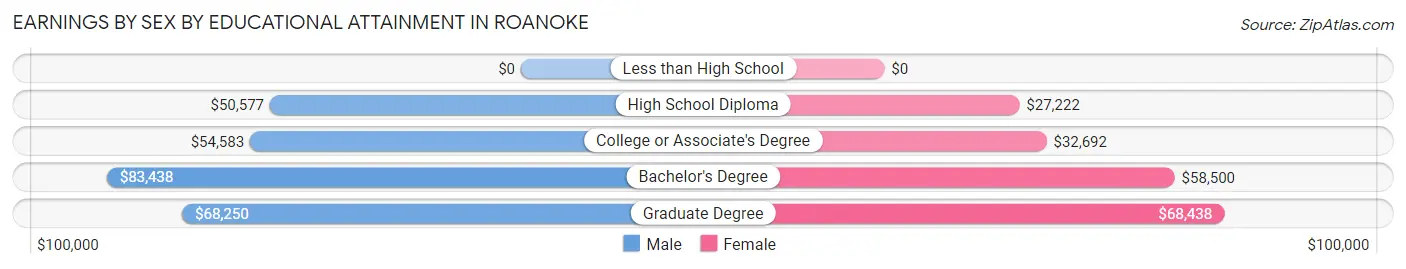
Earnings by Sex by Educational Attainment in Roanoke
Average earnings in Roanoke are $58,021 for men and $34,412 for women, a difference of 40.7%. Men with an educational attainment of bachelor's degree enjoy the highest average annual earnings of $83,438, while those with high school diploma education earn the least with $50,577. Women with an educational attainment of graduate degree earn the most with the average annual earnings of $68,438, while those with high school diploma education have the smallest earnings of $27,222.
| Educational Attainment | Male Income | Female Income |
| Less than High School | - | - |
| High School Diploma | $50,577 | $27,222 |
| College or Associate's Degree | $54,583 | $32,692 |
| Bachelor's Degree | $83,438 | $58,500 |
| Graduate Degree | $68,250 | $68,438 |
| Total | $58,021 | $34,412 |
Family Income in Roanoke
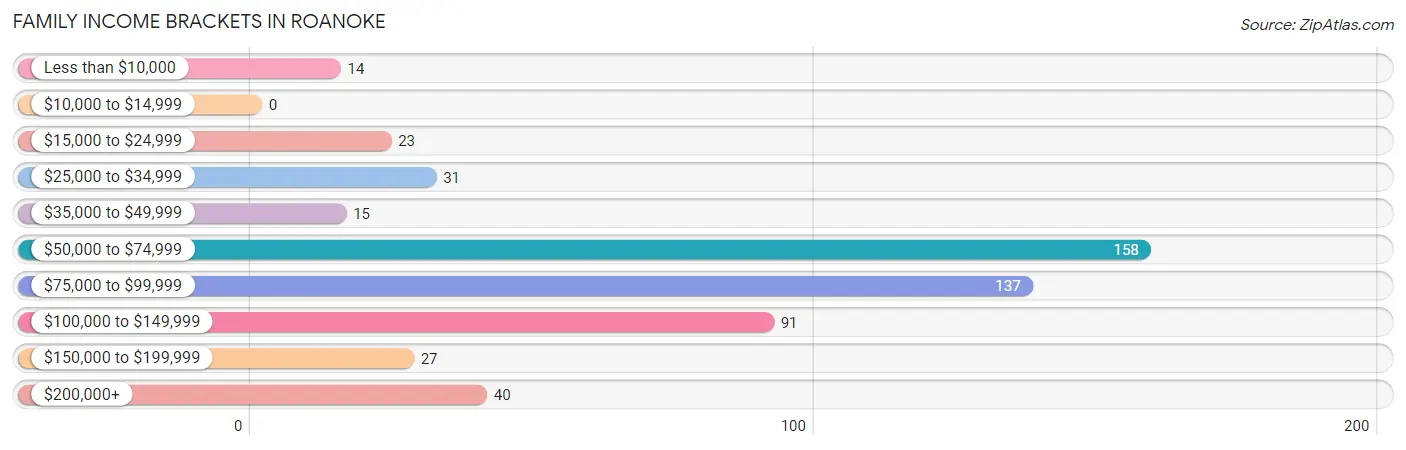
Family Income Brackets in Roanoke
According to the Roanoke family income data, there are 158 families falling into the $50,000 to $74,999 income range, which is the most common income bracket and makes up 29.5% of all families.
| Income Bracket | # Families | % Families |
| Less than $10,000 | 14 | 2.6% |
| $10,000 to $14,999 | 0 | 0.0% |
| $15,000 to $24,999 | 23 | 4.3% |
| $25,000 to $34,999 | 31 | 5.8% |
| $35,000 to $49,999 | 15 | 2.8% |
| $50,000 to $74,999 | 158 | 29.5% |
| $75,000 to $99,999 | 137 | 25.6% |
| $100,000 to $149,999 | 91 | 17.0% |
| $150,000 to $199,999 | 27 | 5.0% |
| $200,000+ | 40 | 7.5% |
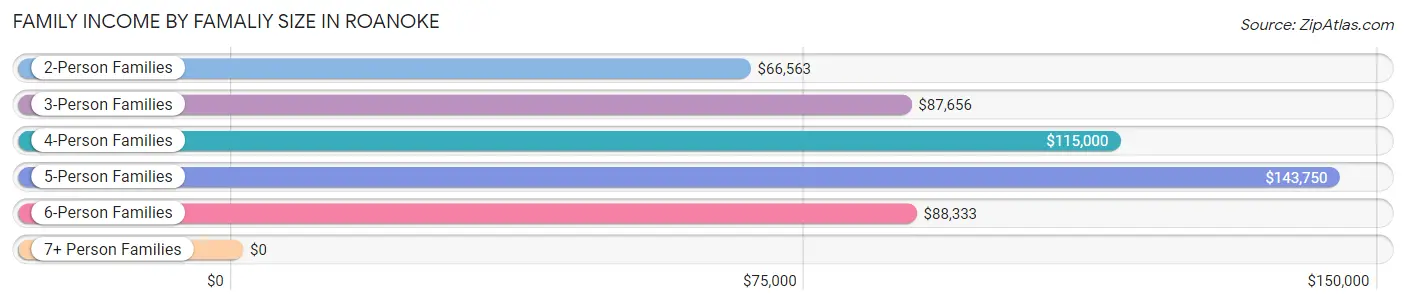
Family Income by Famaliy Size in Roanoke
5-person families (57 | 10.6%) account for the highest median family income in Roanoke with $143,750 per family, while 2-person families (280 | 52.2%) have the highest median income of $33,282 per family member.
| Income Bracket | # Families | Median Income |
| 2-Person Families | 280 (52.2%) | $66,563 |
| 3-Person Families | 119 (22.2%) | $87,656 |
| 4-Person Families | 56 (10.4%) | $115,000 |
| 5-Person Families | 57 (10.6%) | $143,750 |
| 6-Person Families | 24 (4.5%) | $88,333 |
| 7+ Person Families | 0 (0.0%) | $0 |
| Total | 536 (100.0%) | $82,917 |
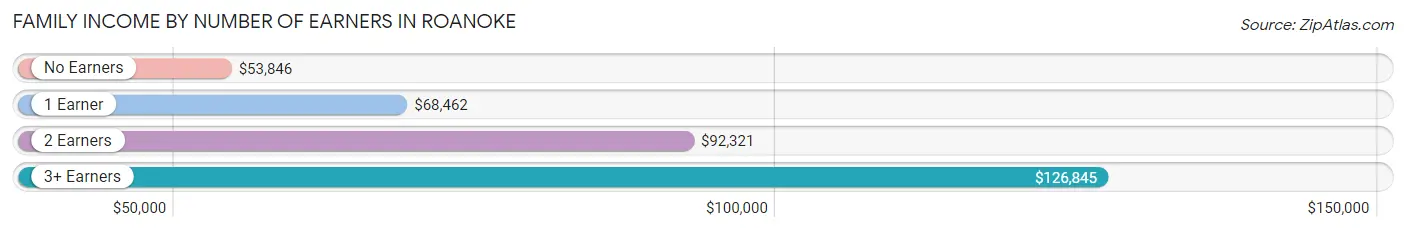
Family Income by Number of Earners in Roanoke
The median family income in Roanoke is $82,917, with families comprising 3+ earners (87) having the highest median family income of $126,845, while families with no earners (100) have the lowest median family income of $53,846, accounting for 16.2% and 18.7% of families, respectively.
| Number of Earners | # Families | Median Income |
| No Earners | 100 (18.7%) | $53,846 |
| 1 Earner | 118 (22.0%) | $68,462 |
| 2 Earners | 231 (43.1%) | $92,321 |
| 3+ Earners | 87 (16.2%) | $126,845 |
| Total | 536 (100.0%) | $82,917 |
Household Income in Roanoke
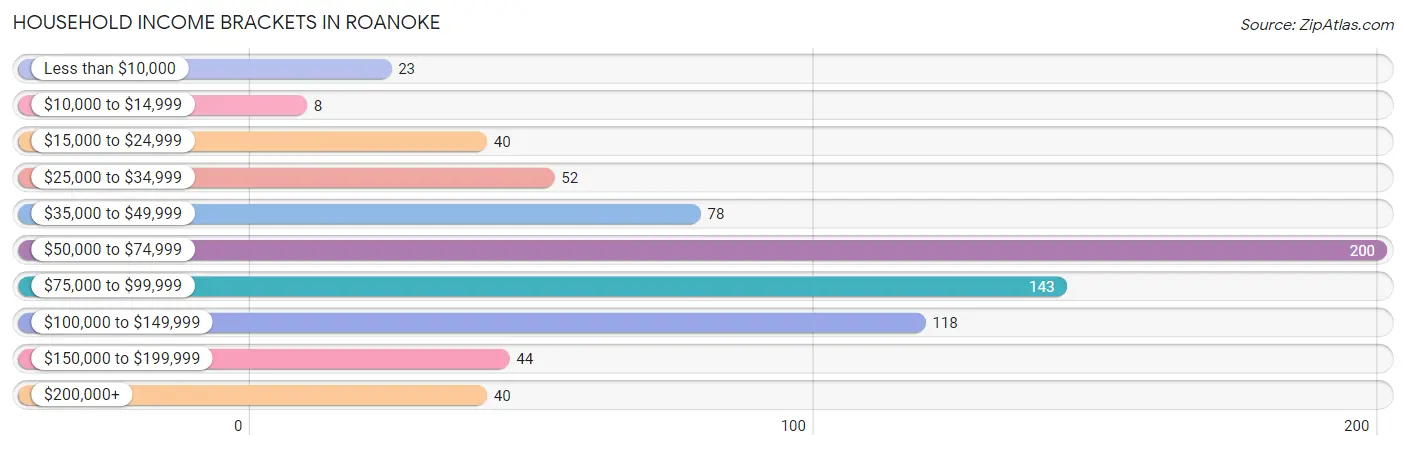
Household Income Brackets in Roanoke
With 200 households falling in the category, the $50,000 to $74,999 income range is the most frequent in Roanoke, accounting for 26.8% of all households. In contrast, only 8 households (1.1%) fall into the $10,000 to $14,999 income bracket, making it the least populous group.
| Income Bracket | # Households | % Households |
| Less than $10,000 | 23 | 3.1% |
| $10,000 to $14,999 | 8 | 1.1% |
| $15,000 to $24,999 | 40 | 5.4% |
| $25,000 to $34,999 | 52 | 7.0% |
| $35,000 to $49,999 | 78 | 10.5% |
| $50,000 to $74,999 | 200 | 26.8% |
| $75,000 to $99,999 | 143 | 19.2% |
| $100,000 to $149,999 | 118 | 15.8% |
| $150,000 to $199,999 | 44 | 5.9% |
| $200,000+ | 40 | 5.4% |
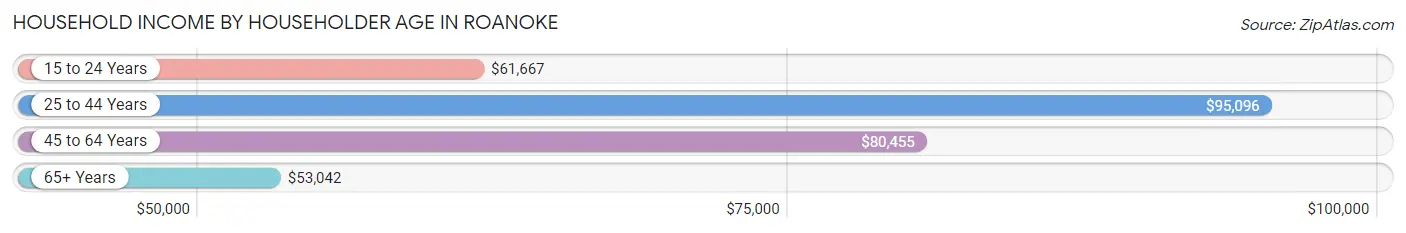
Household Income by Householder Age in Roanoke
The median household income in Roanoke is $69,250, with the highest median household income of $95,096 found in the 25 to 44 years age bracket for the primary householder. A total of 227 households (30.4%) fall into this category. Meanwhile, the 65+ years age bracket for the primary householder has the lowest median household income of $53,042, with 217 households (29.1%) in this group.
| Income Bracket | # Households | Median Income |
| 15 to 24 Years | 52 (7.0%) | $61,667 |
| 25 to 44 Years | 227 (30.4%) | $95,096 |
| 45 to 64 Years | 250 (33.5%) | $80,455 |
| 65+ Years | 217 (29.1%) | $53,042 |
| Total | 746 (100.0%) | $69,250 |
Poverty in Roanoke
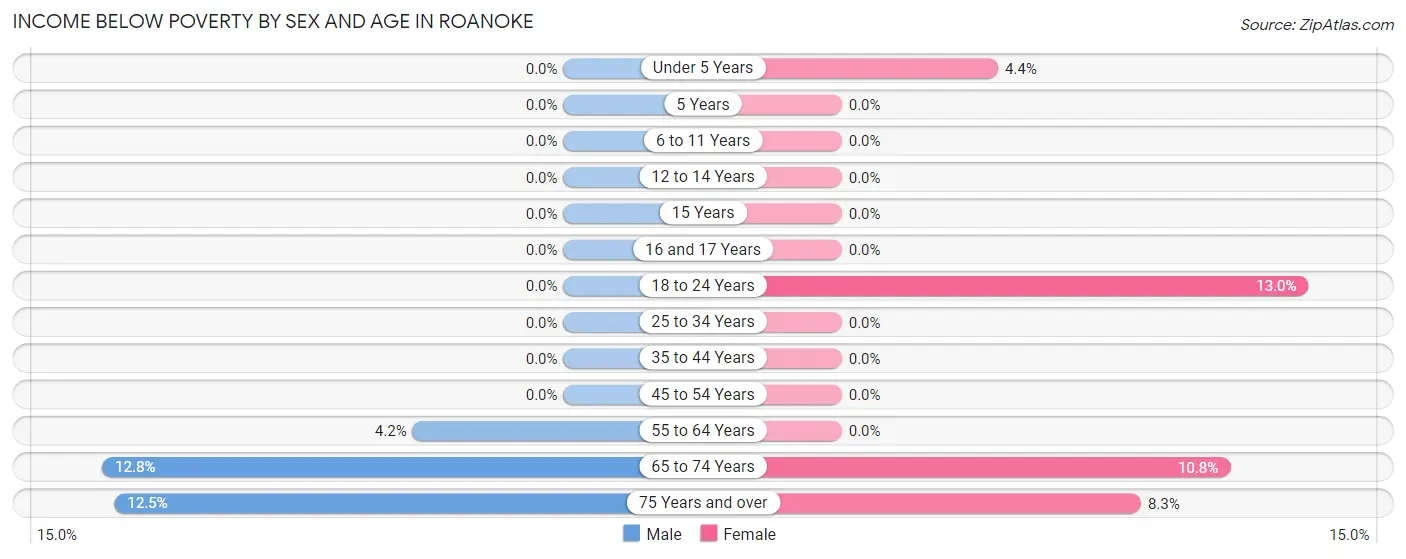
Income Below Poverty by Sex and Age in Roanoke
With 2.8% poverty level for males and 3.3% for females among the residents of Roanoke, 65 to 74 year old males and 18 to 24 year old females are the most vulnerable to poverty, with 14 males (12.8%) and 10 females (13.0%) in their respective age groups living below the poverty level.
| Age Bracket | Male | Female |
| Under 5 Years | 0 (0.0%) | 3 (4.3%) |
| 5 Years | 0 (0.0%) | 0 (0.0%) |
| 6 to 11 Years | 0 (0.0%) | 0 (0.0%) |
| 12 to 14 Years | 0 (0.0%) | 0 (0.0%) |
| 15 Years | 0 (0.0%) | 0 (0.0%) |
| 16 and 17 Years | 0 (0.0%) | 0 (0.0%) |
| 18 to 24 Years | 0 (0.0%) | 10 (13.0%) |
| 25 to 34 Years | 0 (0.0%) | 0 (0.0%) |
| 35 to 44 Years | 0 (0.0%) | 0 (0.0%) |
| 45 to 54 Years | 0 (0.0%) | 0 (0.0%) |
| 55 to 64 Years | 5 (4.2%) | 0 (0.0%) |
| 65 to 74 Years | 14 (12.8%) | 12 (10.8%) |
| 75 Years and over | 9 (12.5%) | 6 (8.3%) |
| Total | 28 (2.8%) | 31 (3.3%) |
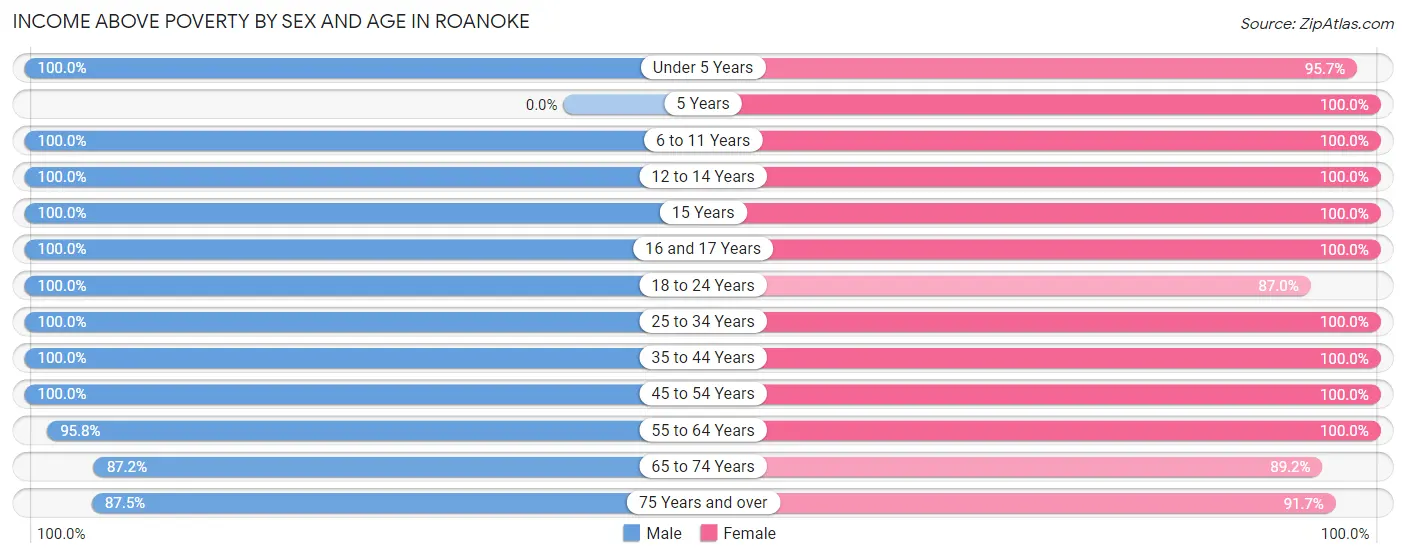
Income Above Poverty by Sex and Age in Roanoke
According to the poverty statistics in Roanoke, males aged under 5 years and females aged 5 years are the age groups that are most secure financially, with 100.0% of males and 100.0% of females in these age groups living above the poverty line.
| Age Bracket | Male | Female |
| Under 5 Years | 74 (100.0%) | 66 (95.7%) |
| 5 Years | 0 (0.0%) | 9 (100.0%) |
| 6 to 11 Years | 69 (100.0%) | 48 (100.0%) |
| 12 to 14 Years | 91 (100.0%) | 22 (100.0%) |
| 15 Years | 20 (100.0%) | 20 (100.0%) |
| 16 and 17 Years | 21 (100.0%) | 75 (100.0%) |
| 18 to 24 Years | 108 (100.0%) | 67 (87.0%) |
| 25 to 34 Years | 125 (100.0%) | 132 (100.0%) |
| 35 to 44 Years | 70 (100.0%) | 94 (100.0%) |
| 45 to 54 Years | 140 (100.0%) | 98 (100.0%) |
| 55 to 64 Years | 114 (95.8%) | 114 (100.0%) |
| 65 to 74 Years | 95 (87.2%) | 99 (89.2%) |
| 75 Years and over | 63 (87.5%) | 66 (91.7%) |
| Total | 990 (97.3%) | 910 (96.7%) |
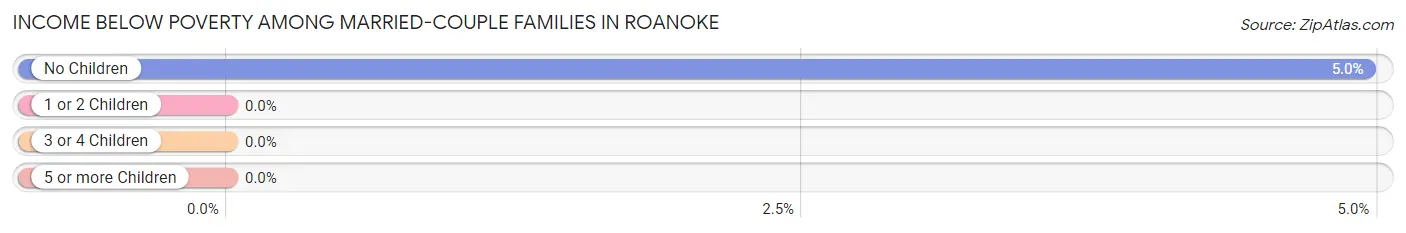
Income Below Poverty Among Married-Couple Families in Roanoke
The poverty statistics for married-couple families in Roanoke show that 3.2% or 14 of the total 443 families live below the poverty line. Families with no children have the highest poverty rate of 5.0%, comprising of 14 families. On the other hand, families with 1 or 2 children have the lowest poverty rate of 0.0%, which includes 0 families.
| Children | Above Poverty | Below Poverty |
| No Children | 269 (95.1%) | 14 (5.0%) |
| 1 or 2 Children | 95 (100.0%) | 0 (0.0%) |
| 3 or 4 Children | 65 (100.0%) | 0 (0.0%) |
| 5 or more Children | 0 (0.0%) | 0 (0.0%) |
| Total | 429 (96.8%) | 14 (3.2%) |
Income Below Poverty Among Single-Parent Households in Roanoke
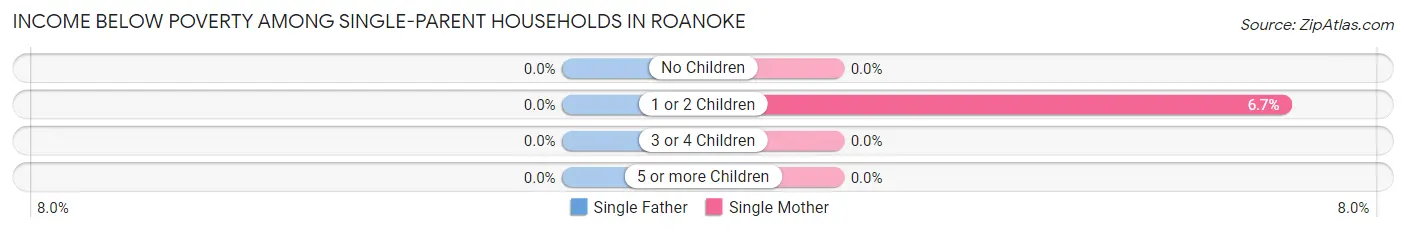
| Children | Single Father | Single Mother |
| No Children | 0 (0.0%) | 0 (0.0%) |
| 1 or 2 Children | 0 (0.0%) | 3 (6.7%) |
| 3 or 4 Children | 0 (0.0%) | 0 (0.0%) |
| 5 or more Children | 0 (0.0%) | 0 (0.0%) |
| Total | 0 (0.0%) | 3 (4.8%) |
Income Below Poverty Among Married-Couple vs Single-Parent Households in Roanoke
The poverty data for Roanoke shows that 14 of the married-couple family households (3.2%) and 3 of the single-parent households (3.2%) are living below the poverty level. Within the married-couple family households, those with no children have the highest poverty rate, with 14 households (5.0%) falling below the poverty line. Among the single-parent households, those with 1 or 2 children have the highest poverty rate, with 3 household (5.4%) living below poverty.
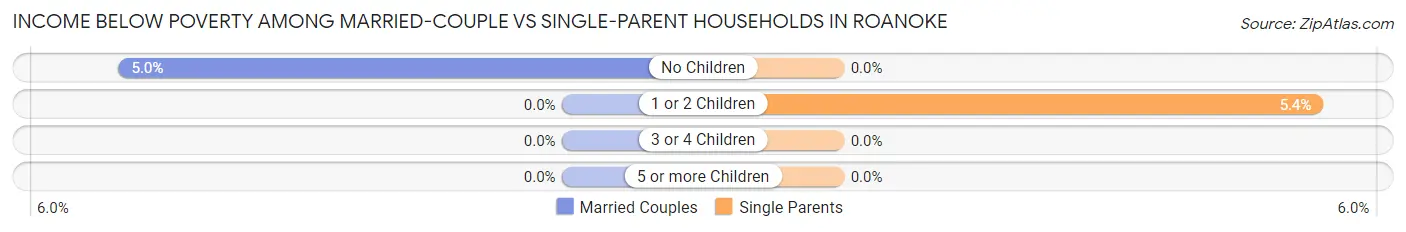
| Children | Married-Couple Families | Single-Parent Households |
| No Children | 14 (5.0%) | 0 (0.0%) |
| 1 or 2 Children | 0 (0.0%) | 3 (5.4%) |
| 3 or 4 Children | 0 (0.0%) | 0 (0.0%) |
| 5 or more Children | 0 (0.0%) | 0 (0.0%) |
| Total | 14 (3.2%) | 3 (3.2%) |
Race in Roanoke
The most populous races in Roanoke are White / Caucasian (1,906 | 94.8%), Hispanic or Latino (184 | 9.1%), and Two or more Races (105 | 5.2%).
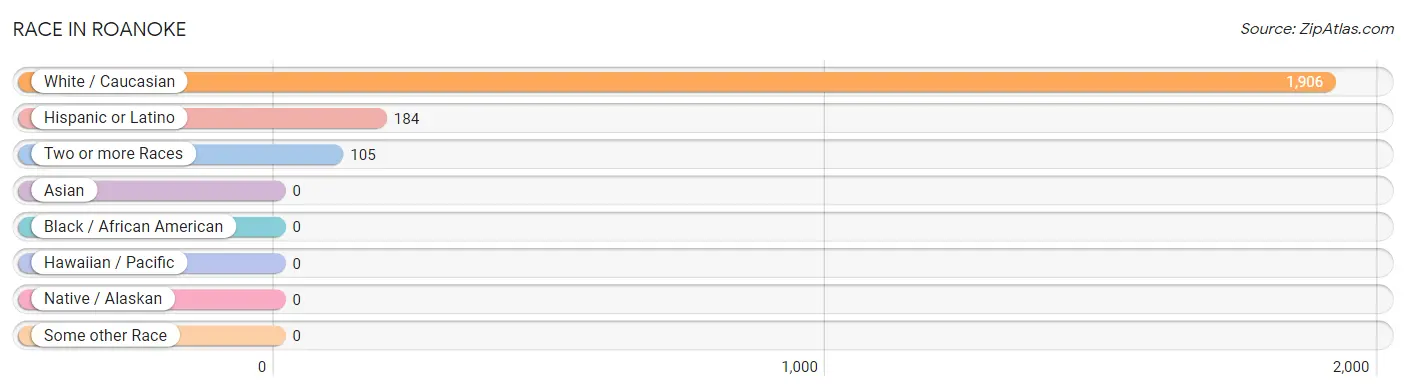
| Race | # Population | % Population |
| Asian | 0 | 0.0% |
| Black / African American | 0 | 0.0% |
| Hawaiian / Pacific | 0 | 0.0% |
| Hispanic or Latino | 184 | 9.1% |
| Native / Alaskan | 0 | 0.0% |
| White / Caucasian | 1,906 | 94.8% |
| Two or more Races | 105 | 5.2% |
| Some other Race | 0 | 0.0% |
| Total | 2,011 | 100.0% |
Ancestry in Roanoke
The most populous ancestries reported in Roanoke are German (765 | 38.0%), Irish (274 | 13.6%), Mexican (184 | 9.1%), Italian (148 | 7.4%), and English (119 | 5.9%), together accounting for 74.1% of all Roanoke residents.
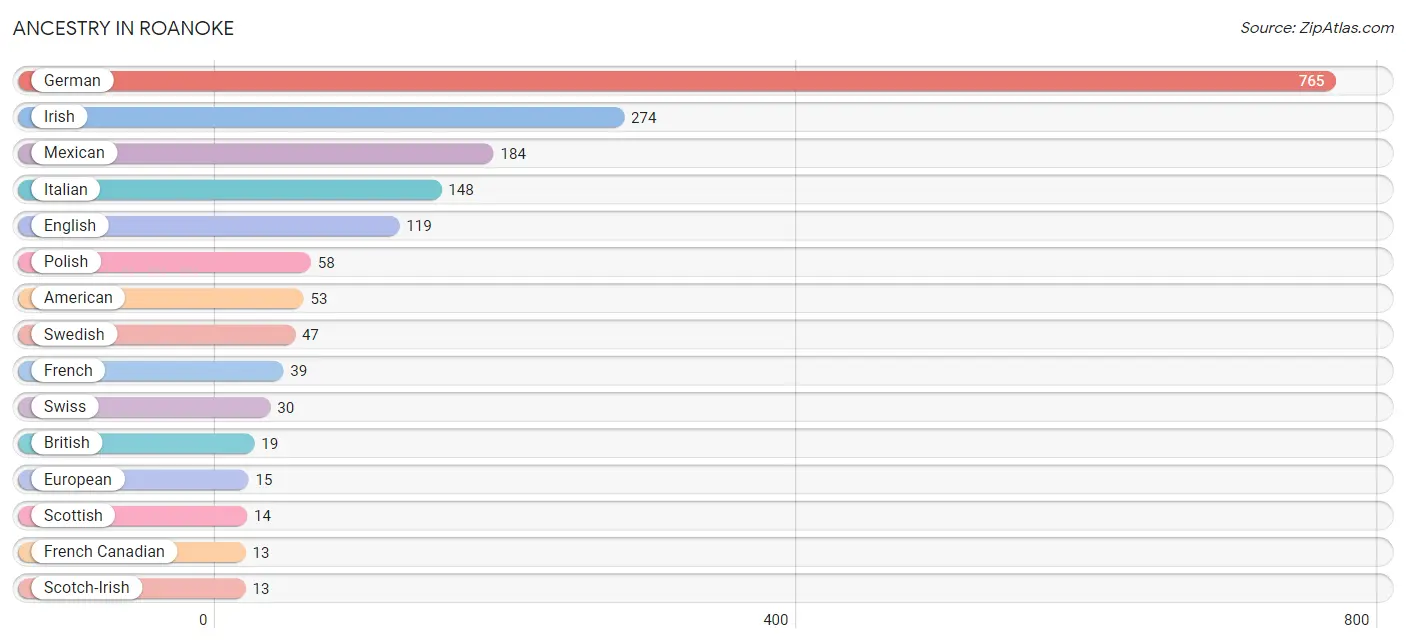
| Ancestry | # Population | % Population |
| American | 53 | 2.6% |
| Austrian | 4 | 0.2% |
| Blackfeet | 3 | 0.2% |
| British | 19 | 0.9% |
| Cherokee | 3 | 0.2% |
| Dutch | 3 | 0.2% |
| English | 119 | 5.9% |
| European | 15 | 0.7% |
| French | 39 | 1.9% |
| French Canadian | 13 | 0.6% |
| German | 765 | 38.0% |
| Hungarian | 3 | 0.2% |
| Irish | 274 | 13.6% |
| Italian | 148 | 7.4% |
| Mexican | 184 | 9.1% |
| Norwegian | 5 | 0.3% |
| Polish | 58 | 2.9% |
| Scandinavian | 3 | 0.2% |
| Scotch-Irish | 13 | 0.6% |
| Scottish | 14 | 0.7% |
| Slovak | 12 | 0.6% |
| Swedish | 47 | 2.3% |
| Swiss | 30 | 1.5% |
| Welsh | 3 | 0.2% | View All 24 Rows |
Immigrants in Roanoke

| Immigration Origin | # Population | % Population | View All 0 Rows |
Sex and Age in Roanoke
Sex and Age in Roanoke
The most populous age groups in Roanoke are 10 to 14 Years (127 | 12.3%) for men and 15 to 19 Years (99 | 10.1%) for women.
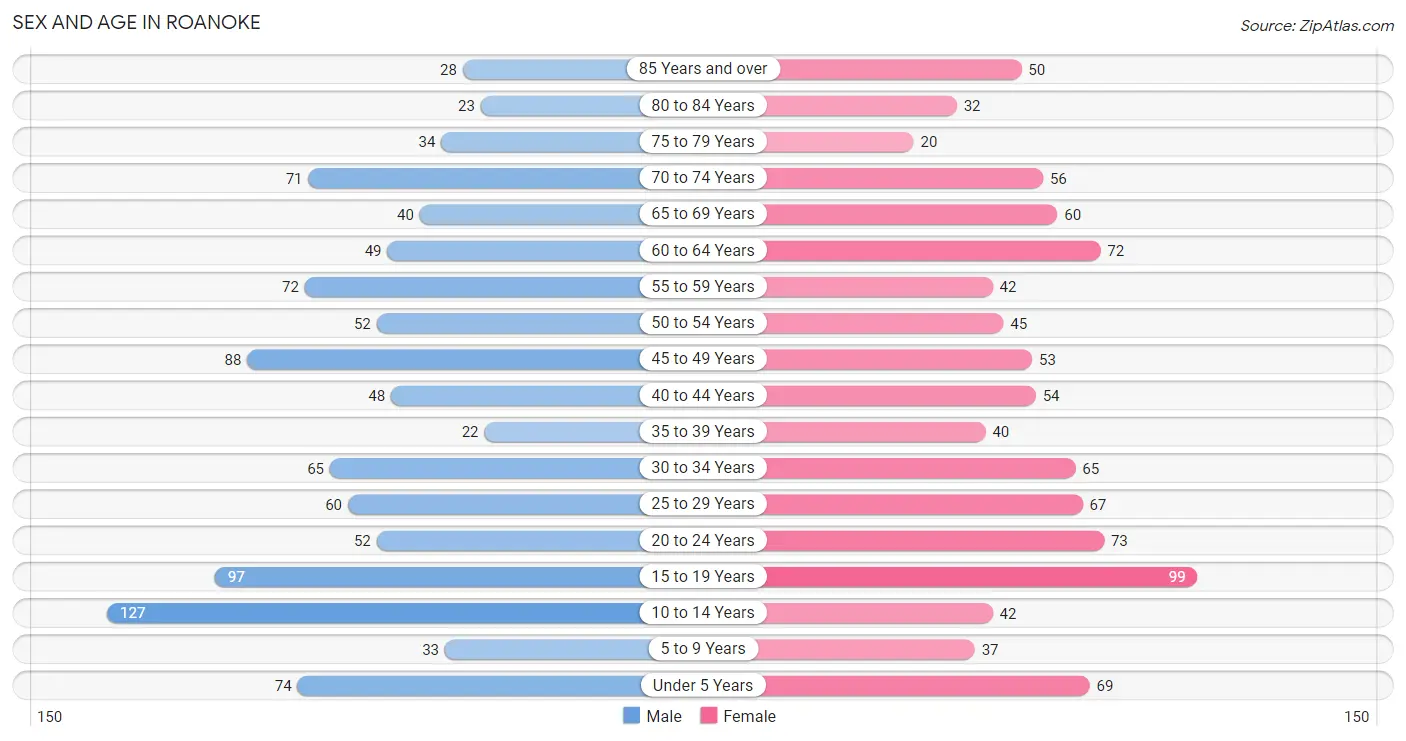
| Age Bracket | Male | Female |
| Under 5 Years | 74 (7.1%) | 69 (7.1%) |
| 5 to 9 Years | 33 (3.2%) | 37 (3.8%) |
| 10 to 14 Years | 127 (12.3%) | 42 (4.3%) |
| 15 to 19 Years | 97 (9.4%) | 99 (10.1%) |
| 20 to 24 Years | 52 (5.0%) | 73 (7.5%) |
| 25 to 29 Years | 60 (5.8%) | 67 (6.9%) |
| 30 to 34 Years | 65 (6.3%) | 65 (6.7%) |
| 35 to 39 Years | 22 (2.1%) | 40 (4.1%) |
| 40 to 44 Years | 48 (4.6%) | 54 (5.5%) |
| 45 to 49 Years | 88 (8.5%) | 53 (5.4%) |
| 50 to 54 Years | 52 (5.0%) | 45 (4.6%) |
| 55 to 59 Years | 72 (7.0%) | 42 (4.3%) |
| 60 to 64 Years | 49 (4.7%) | 72 (7.4%) |
| 65 to 69 Years | 40 (3.9%) | 60 (6.1%) |
| 70 to 74 Years | 71 (6.9%) | 56 (5.7%) |
| 75 to 79 Years | 34 (3.3%) | 20 (2.1%) |
| 80 to 84 Years | 23 (2.2%) | 32 (3.3%) |
| 85 Years and over | 28 (2.7%) | 50 (5.1%) |
| Total | 1,035 (100.0%) | 976 (100.0%) |
Families and Households in Roanoke
Median Family Size in Roanoke
The median family size in Roanoke is 3.19 persons per family, with single male/father families (30 | 5.6%) accounting for the largest median family size of 3.47 persons per family. On the other hand, married-couple families (443 | 82.7%) represent the smallest median family size with 3.16 persons per family.
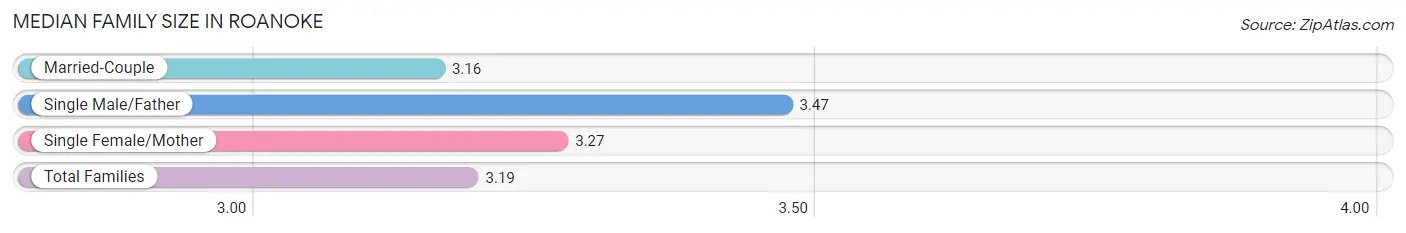
| Family Type | # Families | Family Size |
| Married-Couple | 443 (82.7%) | 3.16 |
| Single Male/Father | 30 (5.6%) | 3.47 |
| Single Female/Mother | 63 (11.7%) | 3.27 |
| Total Families | 536 (100.0%) | 3.19 |
Median Household Size in Roanoke
The median household size in Roanoke is 2.63 persons per household, with single male/father households (30 | 4.0%) accounting for the largest median household size of 3.8 persons per household. non-family households (210 | 28.1%) represent the smallest median household size with 1.07 persons per household.
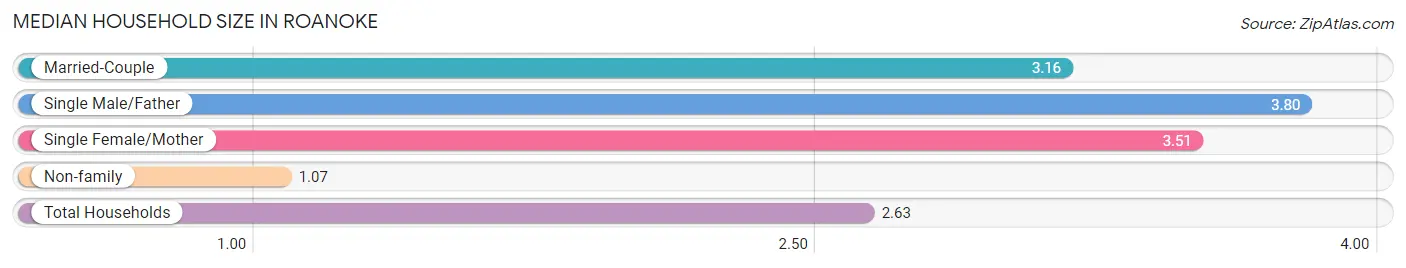
| Household Type | # Households | Household Size |
| Married-Couple | 443 (59.4%) | 3.16 |
| Single Male/Father | 30 (4.0%) | 3.80 |
| Single Female/Mother | 63 (8.5%) | 3.51 |
| Non-family | 210 (28.1%) | 1.07 |
| Total Households | 746 (100.0%) | 2.63 |
Household Size by Marriage Status in Roanoke
Out of a total of 746 households in Roanoke, 536 (71.9%) are family households, while 210 (28.1%) are nonfamily households. The most numerous type of family households are 2-person households, comprising 257, and the most common type of nonfamily households are 1-person households, comprising 197.
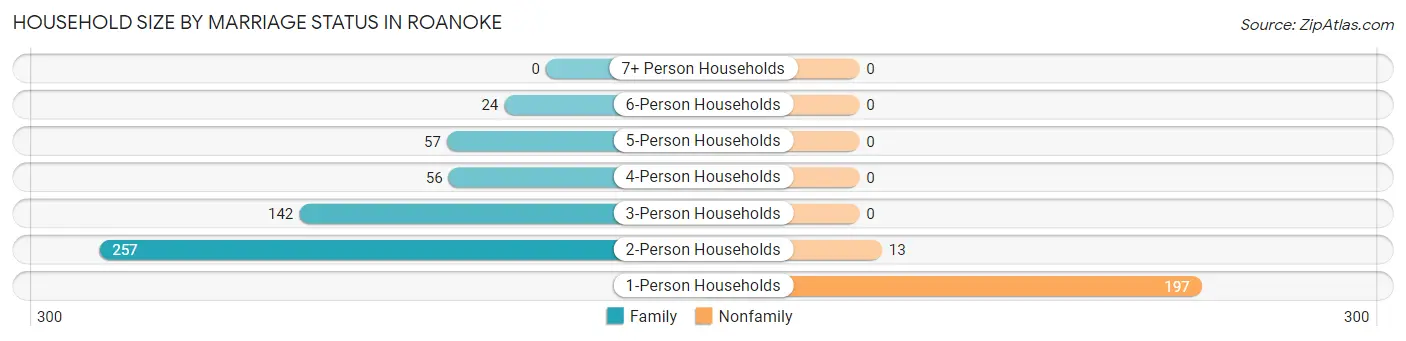
| Household Size | Family Households | Nonfamily Households |
| 1-Person Households | - | 197 (26.4%) |
| 2-Person Households | 257 (34.4%) | 13 (1.7%) |
| 3-Person Households | 142 (19.0%) | 0 (0.0%) |
| 4-Person Households | 56 (7.5%) | 0 (0.0%) |
| 5-Person Households | 57 (7.6%) | 0 (0.0%) |
| 6-Person Households | 24 (3.2%) | 0 (0.0%) |
| 7+ Person Households | 0 (0.0%) | 0 (0.0%) |
| Total | 536 (71.9%) | 210 (28.1%) |
Female Fertility in Roanoke
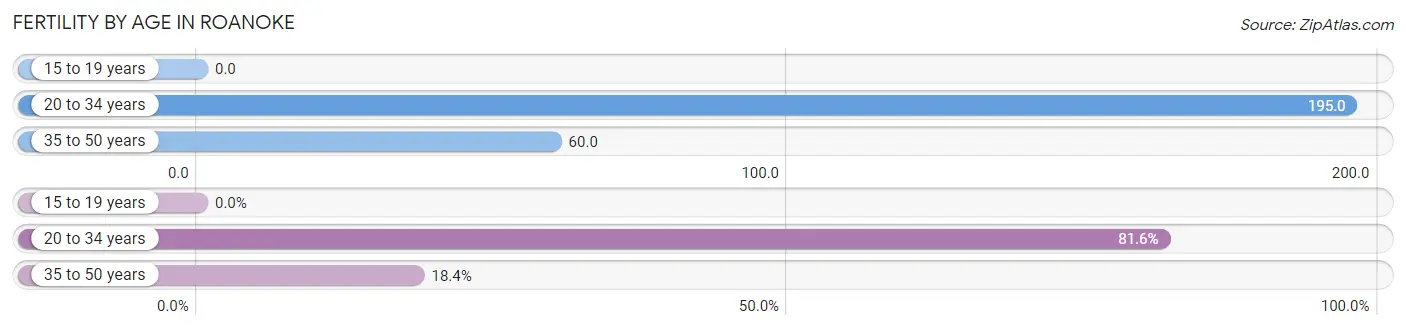
Fertility by Age in Roanoke
Average fertility rate in Roanoke is 108.0 births per 1,000 women. Women in the age bracket of 20 to 34 years have the highest fertility rate with 195.0 births per 1,000 women. Women in the age bracket of 20 to 34 years acount for 81.6% of all women with births.
| Age Bracket | Women with Births | Births / 1,000 Women |
| 15 to 19 years | 0 (0.0%) | 0.0 |
| 20 to 34 years | 40 (81.6%) | 195.0 |
| 35 to 50 years | 9 (18.4%) | 60.0 |
| Total | 49 (100.0%) | 108.0 |
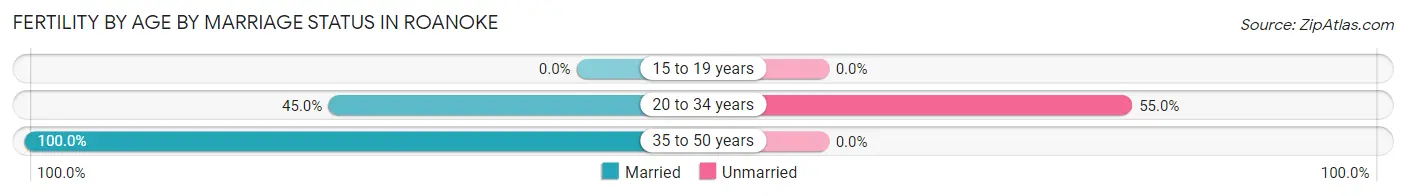
Fertility by Age by Marriage Status in Roanoke
55.1% of women with births (49) in Roanoke are married. The highest percentage of unmarried women with births falls into 20 to 34 years age bracket with 55.0% of them unmarried at the time of birth, while the lowest percentage of unmarried women with births belong to 35 to 50 years age bracket with 0.0% of them unmarried.
| Age Bracket | Married | Unmarried |
| 15 to 19 years | 0 (0.0%) | 0 (0.0%) |
| 20 to 34 years | 18 (45.0%) | 22 (55.0%) |
| 35 to 50 years | 9 (100.0%) | 0 (0.0%) |
| Total | 27 (55.1%) | 22 (44.9%) |
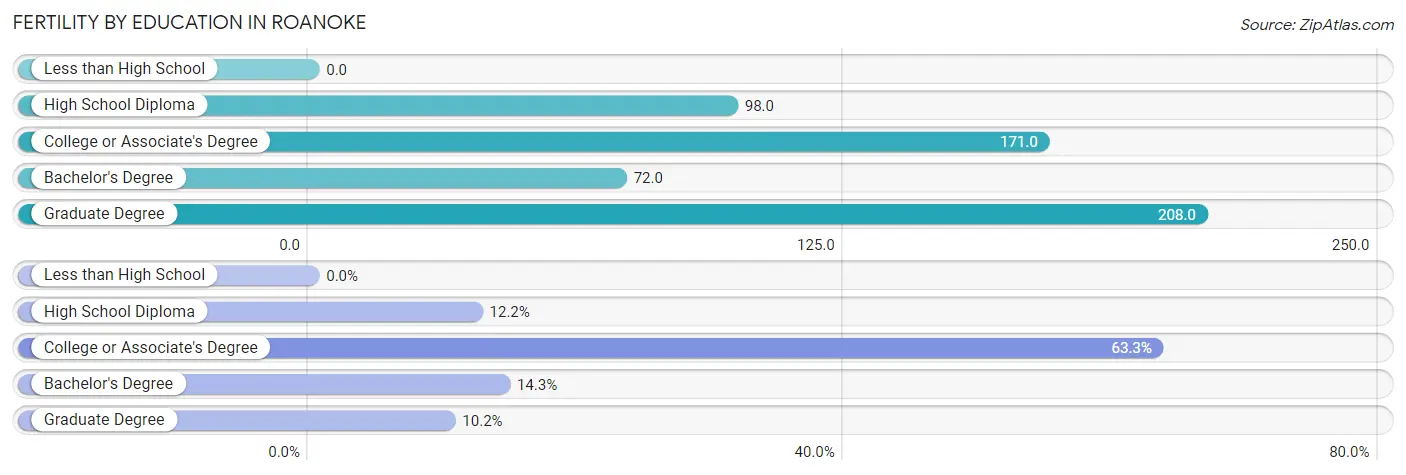
Fertility by Education in Roanoke
| Educational Attainment | Women with Births | Births / 1,000 Women |
| Less than High School | 0 (0.0%) | 0.0 |
| High School Diploma | 6 (12.2%) | 98.0 |
| College or Associate's Degree | 31 (63.3%) | 171.0 |
| Bachelor's Degree | 7 (14.3%) | 72.0 |
| Graduate Degree | 5 (10.2%) | 208.0 |
| Total | 49 (100.0%) | 108.0 |
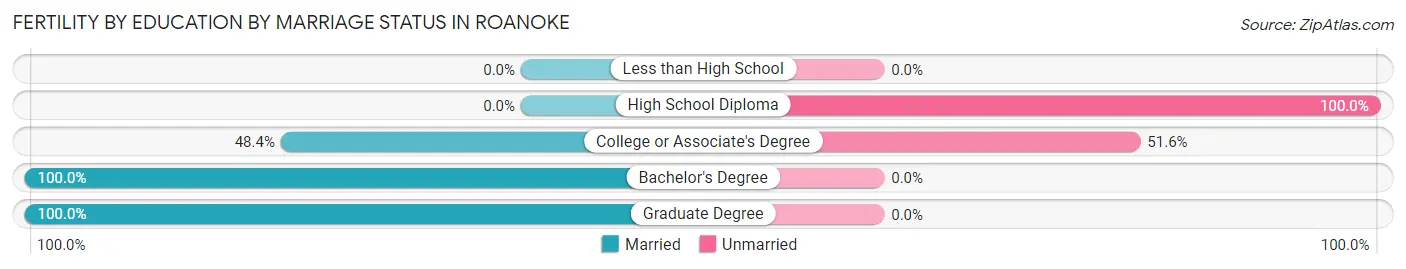
Fertility by Education by Marriage Status in Roanoke
44.9% of women with births in Roanoke are unmarried. Women with the educational attainment of bachelor's degree are most likely to be married with 100.0% of them married at childbirth, while women with the educational attainment of high school diploma are least likely to be married with 100.0% of them unmarried at childbirth.
| Educational Attainment | Married | Unmarried |
| Less than High School | 0 (0.0%) | 0 (0.0%) |
| High School Diploma | 0 (0.0%) | 6 (100.0%) |
| College or Associate's Degree | 15 (48.4%) | 16 (51.6%) |
| Bachelor's Degree | 7 (100.0%) | 0 (0.0%) |
| Graduate Degree | 5 (100.0%) | 0 (0.0%) |
| Total | 27 (55.1%) | 22 (44.9%) |
Employment Characteristics in Roanoke
Employment by Class of Employer in Roanoke
Among the 976 employed individuals in Roanoke, private company employees (635 | 65.1%), not-for-profit organizations (96 | 9.8%), and local government employees (89 | 9.1%) make up the most common classes of employment.
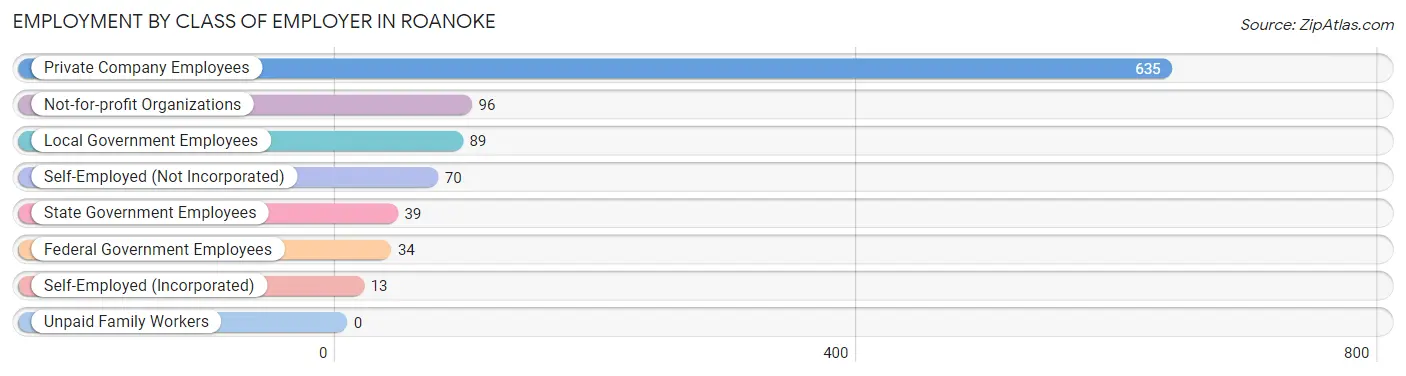
| Employer Class | # Employees | % Employees |
| Private Company Employees | 635 | 65.1% |
| Self-Employed (Incorporated) | 13 | 1.3% |
| Self-Employed (Not Incorporated) | 70 | 7.2% |
| Not-for-profit Organizations | 96 | 9.8% |
| Local Government Employees | 89 | 9.1% |
| State Government Employees | 39 | 4.0% |
| Federal Government Employees | 34 | 3.5% |
| Unpaid Family Workers | 0 | 0.0% |
| Total | 976 | 100.0% |
Employment Status by Age in Roanoke
According to the labor force statistics for Roanoke, out of the total population over 16 years of age (1,589), 64.1% or 1,019 individuals are in the labor force, with 1.6% or 16 of them unemployed. The age group with the highest labor force participation rate is 25 to 29 years, with 100.0% or 127 individuals in the labor force. Within the labor force, the 60 to 64 years age range has the highest percentage of unemployed individuals, with 6.8% or 5 of them being unemployed.
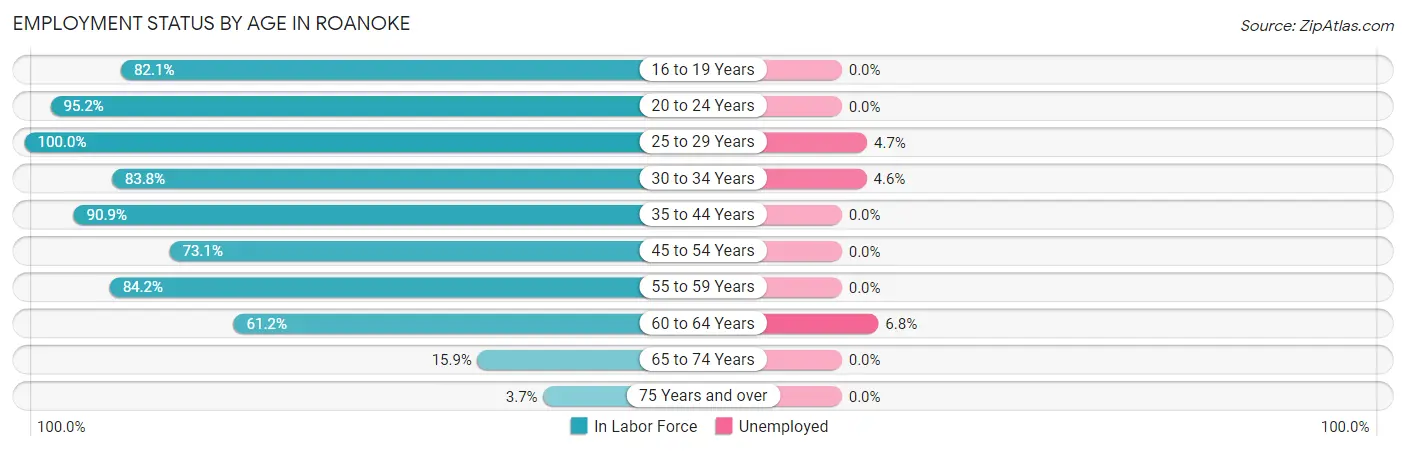
| Age Bracket | In Labor Force | Unemployed |
| 16 to 19 Years | 128 (82.1%) | 0 (0.0%) |
| 20 to 24 Years | 119 (95.2%) | 0 (0.0%) |
| 25 to 29 Years | 127 (100.0%) | 6 (4.7%) |
| 30 to 34 Years | 109 (83.8%) | 5 (4.6%) |
| 35 to 44 Years | 149 (90.9%) | 0 (0.0%) |
| 45 to 54 Years | 174 (73.1%) | 0 (0.0%) |
| 55 to 59 Years | 96 (84.2%) | 0 (0.0%) |
| 60 to 64 Years | 74 (61.2%) | 5 (6.8%) |
| 65 to 74 Years | 36 (15.9%) | 0 (0.0%) |
| 75 Years and over | 7 (3.7%) | 0 (0.0%) |
| Total | 1,019 (64.1%) | 16 (1.6%) |
Employment Status by Educational Attainment in Roanoke
According to labor force statistics for Roanoke, 81.5% of individuals (729) out of the total population between 25 and 64 years of age (894) are in the labor force, with 2.2% or 16 of them being unemployed. The group with the highest labor force participation rate are those with the educational attainment of college / associate degree, with 86.2% or 288 individuals in the labor force. Within the labor force, individuals with high school diploma education have the highest percentage of unemployment, with 5.8% or 11 of them being unemployed.
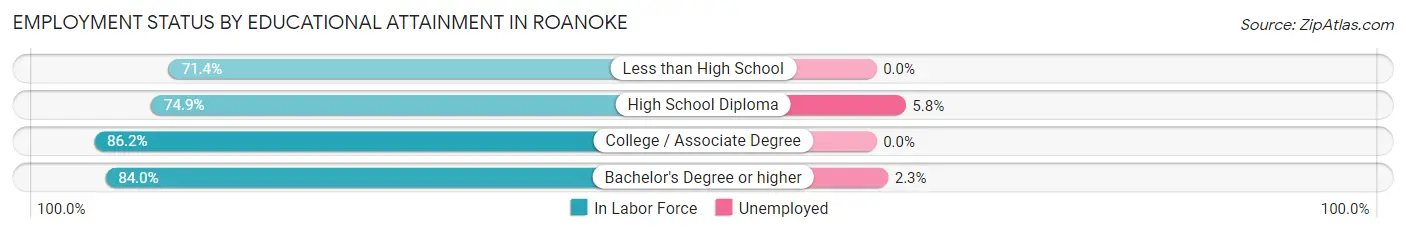
| Educational Attainment | In Labor Force | Unemployed |
| Less than High School | 35 (71.4%) | 0 (0.0%) |
| High School Diploma | 191 (74.9%) | 15 (5.8%) |
| College / Associate Degree | 288 (86.2%) | 0 (0.0%) |
| Bachelor's Degree or higher | 215 (84.0%) | 6 (2.3%) |
| Total | 729 (81.5%) | 20 (2.2%) |
Employment Occupations by Sex in Roanoke
Management, Business, Science and Arts Occupations
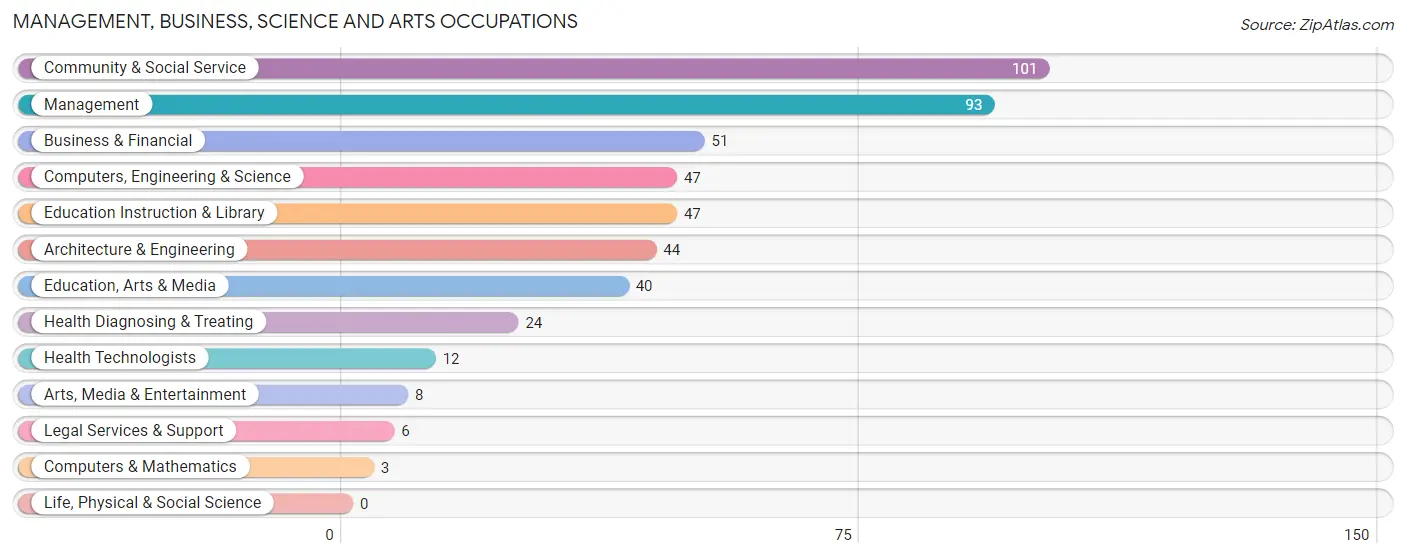
The most common Management, Business, Science and Arts occupations in Roanoke are Community & Social Service (101 | 10.1%), Management (93 | 9.3%), Business & Financial (51 | 5.1%), Computers, Engineering & Science (47 | 4.7%), and Education Instruction & Library (47 | 4.7%).
Management, Business, Science and Arts Occupations by Sex
Within the Management, Business, Science and Arts occupations in Roanoke, the most male-oriented occupations are Architecture & Engineering (100.0%), Computers, Engineering & Science (93.6%), and Management (72.0%), while the most female-oriented occupations are Computers & Mathematics (100.0%), Legal Services & Support (100.0%), and Arts, Media & Entertainment (100.0%).
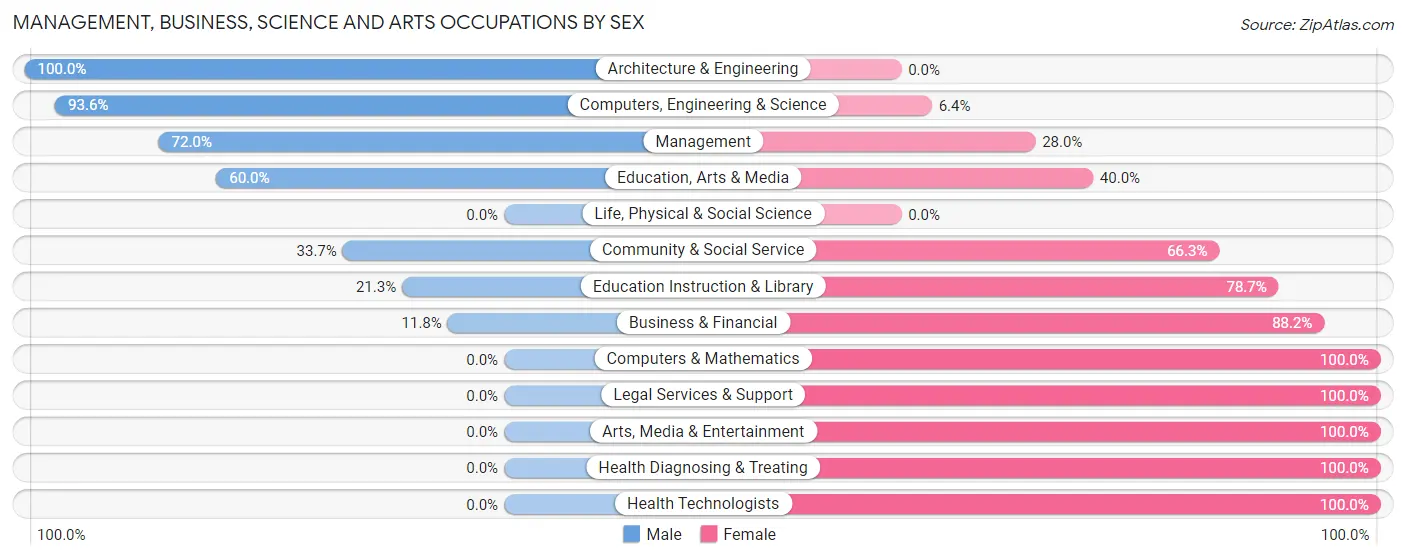
| Occupation | Male | Female |
| Management | 67 (72.0%) | 26 (28.0%) |
| Business & Financial | 6 (11.8%) | 45 (88.2%) |
| Computers, Engineering & Science | 44 (93.6%) | 3 (6.4%) |
| Computers & Mathematics | 0 (0.0%) | 3 (100.0%) |
| Architecture & Engineering | 44 (100.0%) | 0 (0.0%) |
| Life, Physical & Social Science | 0 (0.0%) | 0 (0.0%) |
| Community & Social Service | 34 (33.7%) | 67 (66.3%) |
| Education, Arts & Media | 24 (60.0%) | 16 (40.0%) |
| Legal Services & Support | 0 (0.0%) | 6 (100.0%) |
| Education Instruction & Library | 10 (21.3%) | 37 (78.7%) |
| Arts, Media & Entertainment | 0 (0.0%) | 8 (100.0%) |
| Health Diagnosing & Treating | 0 (0.0%) | 24 (100.0%) |
| Health Technologists | 0 (0.0%) | 12 (100.0%) |
| Total (Category) | 151 (47.8%) | 165 (52.2%) |
| Total (Overall) | 485 (48.3%) | 518 (51.6%) |
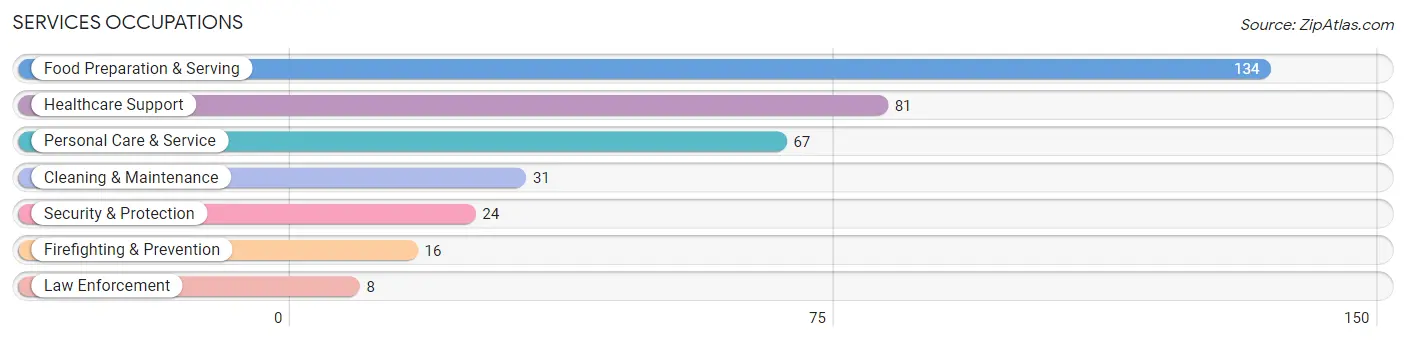
Services Occupations
The most common Services occupations in Roanoke are Food Preparation & Serving (134 | 13.4%), Healthcare Support (81 | 8.1%), Personal Care & Service (67 | 6.7%), Cleaning & Maintenance (31 | 3.1%), and Security & Protection (24 | 2.4%).
Services Occupations by Sex
Within the Services occupations in Roanoke, the most male-oriented occupations are Security & Protection (100.0%), Firefighting & Prevention (100.0%), and Law Enforcement (100.0%), while the most female-oriented occupations are Healthcare Support (100.0%), Personal Care & Service (71.6%), and Food Preparation & Serving (62.7%).
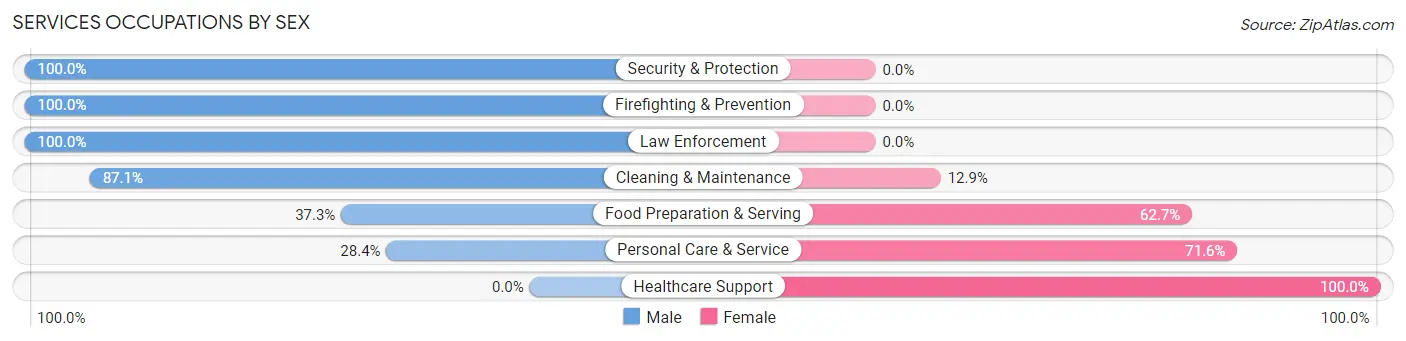
| Occupation | Male | Female |
| Healthcare Support | 0 (0.0%) | 81 (100.0%) |
| Security & Protection | 24 (100.0%) | 0 (0.0%) |
| Firefighting & Prevention | 16 (100.0%) | 0 (0.0%) |
| Law Enforcement | 8 (100.0%) | 0 (0.0%) |
| Food Preparation & Serving | 50 (37.3%) | 84 (62.7%) |
| Cleaning & Maintenance | 27 (87.1%) | 4 (12.9%) |
| Personal Care & Service | 19 (28.4%) | 48 (71.6%) |
| Total (Category) | 120 (35.6%) | 217 (64.4%) |
| Total (Overall) | 485 (48.3%) | 518 (51.6%) |
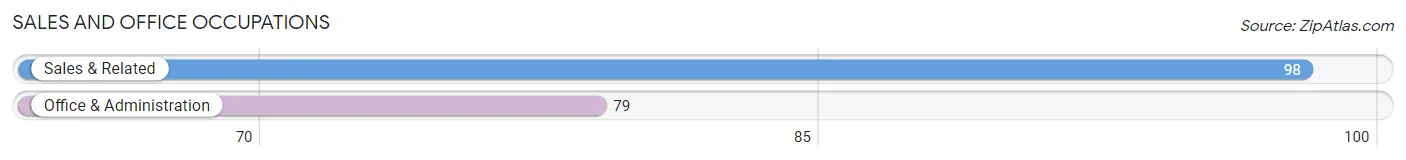
Sales and Office Occupations
The most common Sales and Office occupations in Roanoke are Sales & Related (98 | 9.8%), and Office & Administration (79 | 7.9%).
Sales and Office Occupations by Sex
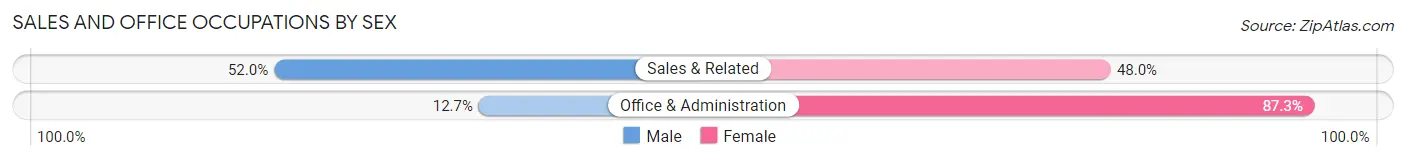
| Occupation | Male | Female |
| Sales & Related | 51 (52.0%) | 47 (48.0%) |
| Office & Administration | 10 (12.7%) | 69 (87.3%) |
| Total (Category) | 61 (34.5%) | 116 (65.5%) |
| Total (Overall) | 485 (48.3%) | 518 (51.6%) |
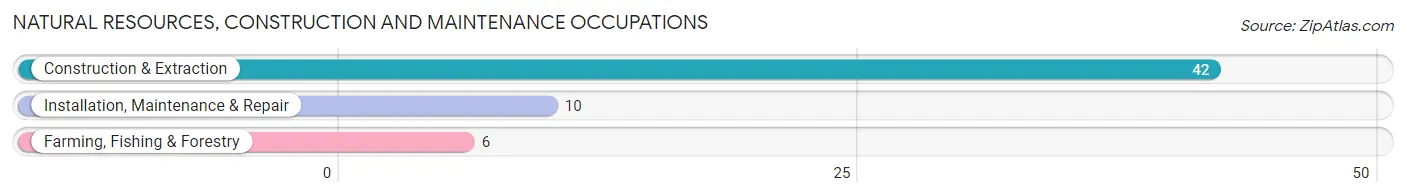
Natural Resources, Construction and Maintenance Occupations
The most common Natural Resources, Construction and Maintenance occupations in Roanoke are Construction & Extraction (42 | 4.2%), Installation, Maintenance & Repair (10 | 1.0%), and Farming, Fishing & Forestry (6 | 0.6%).
Natural Resources, Construction and Maintenance Occupations by Sex
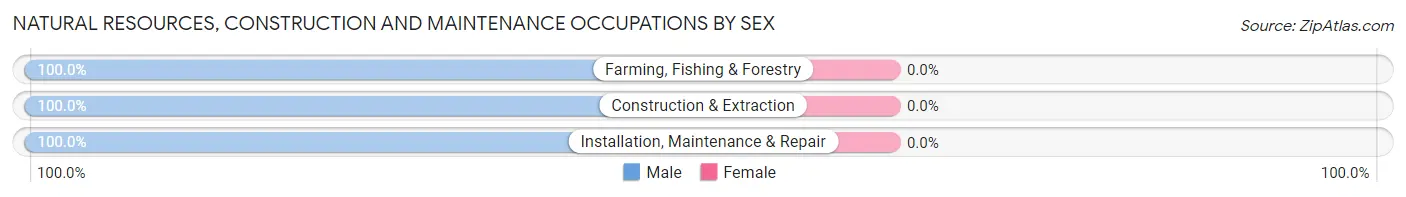
| Occupation | Male | Female |
| Farming, Fishing & Forestry | 6 (100.0%) | 0 (0.0%) |
| Construction & Extraction | 42 (100.0%) | 0 (0.0%) |
| Installation, Maintenance & Repair | 10 (100.0%) | 0 (0.0%) |
| Total (Category) | 58 (100.0%) | 0 (0.0%) |
| Total (Overall) | 485 (48.3%) | 518 (51.6%) |
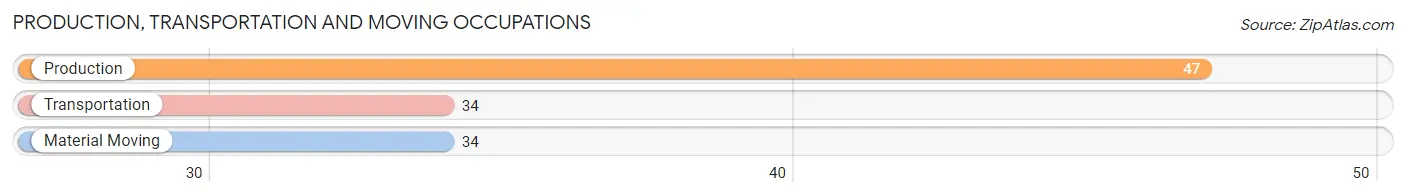
Production, Transportation and Moving Occupations
The most common Production, Transportation and Moving occupations in Roanoke are Production (47 | 4.7%), Transportation (34 | 3.4%), and Material Moving (34 | 3.4%).
Production, Transportation and Moving Occupations by Sex
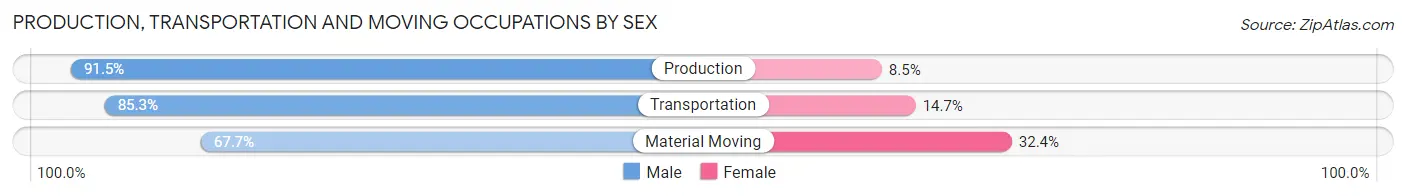
| Occupation | Male | Female |
| Production | 43 (91.5%) | 4 (8.5%) |
| Transportation | 29 (85.3%) | 5 (14.7%) |
| Material Moving | 23 (67.6%) | 11 (32.4%) |
| Total (Category) | 95 (82.6%) | 20 (17.4%) |
| Total (Overall) | 485 (48.3%) | 518 (51.6%) |
Employment Industries by Sex in Roanoke
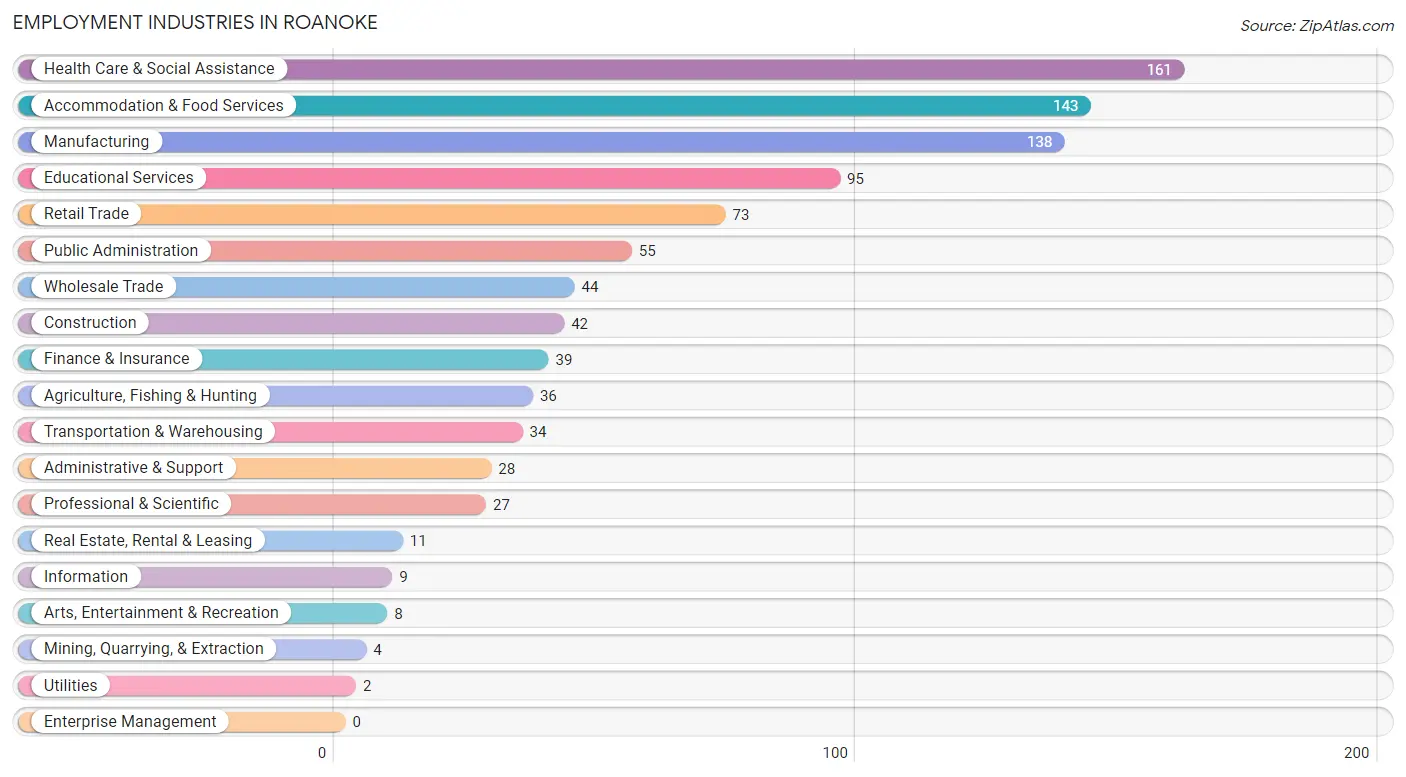
Employment Industries in Roanoke
The major employment industries in Roanoke include Health Care & Social Assistance (161 | 16.1%), Accommodation & Food Services (143 | 14.3%), Manufacturing (138 | 13.8%), Educational Services (95 | 9.5%), and Retail Trade (73 | 7.3%).
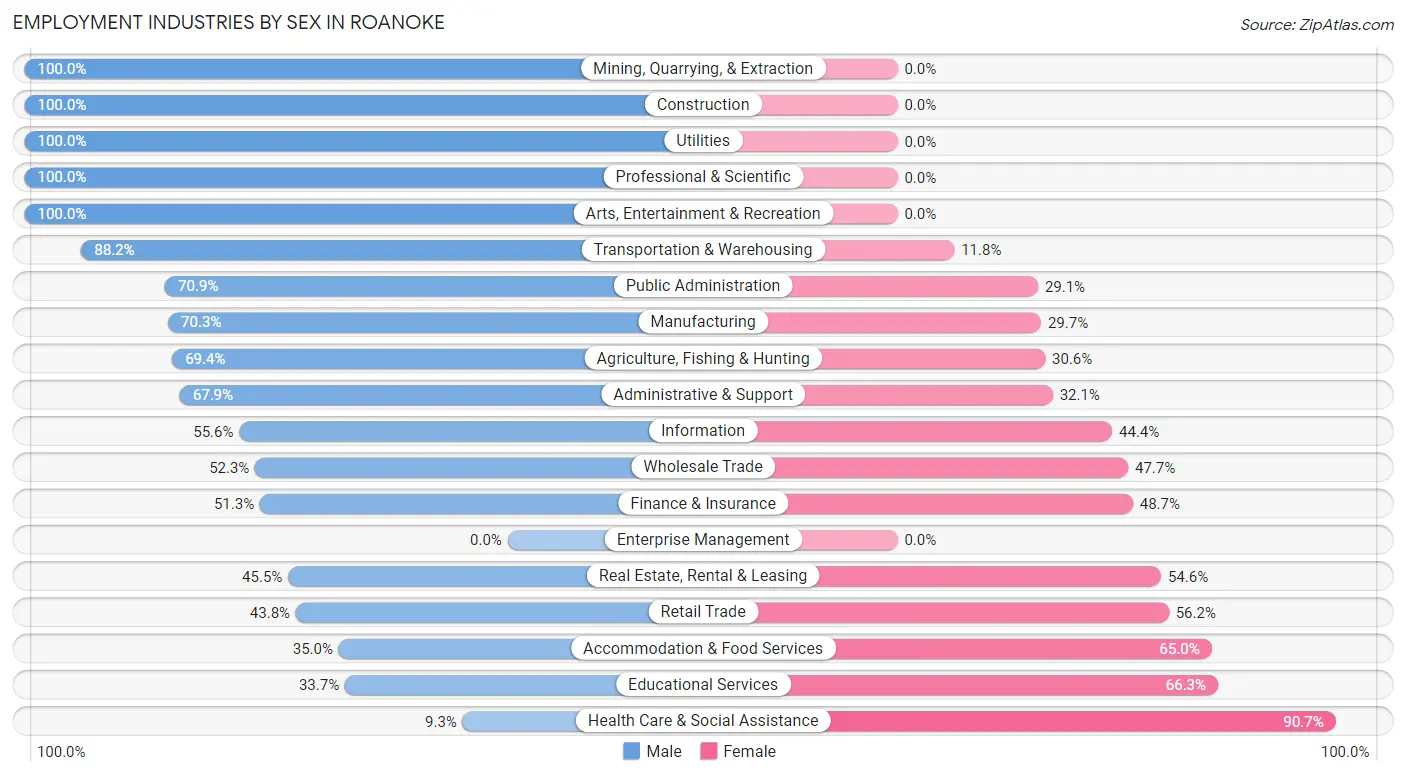
Employment Industries by Sex in Roanoke
The Roanoke industries that see more men than women are Mining, Quarrying, & Extraction (100.0%), Construction (100.0%), and Utilities (100.0%), whereas the industries that tend to have a higher number of women are Health Care & Social Assistance (90.7%), Educational Services (66.3%), and Accommodation & Food Services (65.0%).
| Industry | Male | Female |
| Agriculture, Fishing & Hunting | 25 (69.4%) | 11 (30.6%) |
| Mining, Quarrying, & Extraction | 4 (100.0%) | 0 (0.0%) |
| Construction | 42 (100.0%) | 0 (0.0%) |
| Manufacturing | 97 (70.3%) | 41 (29.7%) |
| Wholesale Trade | 23 (52.3%) | 21 (47.7%) |
| Retail Trade | 32 (43.8%) | 41 (56.2%) |
| Transportation & Warehousing | 30 (88.2%) | 4 (11.8%) |
| Utilities | 2 (100.0%) | 0 (0.0%) |
| Information | 5 (55.6%) | 4 (44.4%) |
| Finance & Insurance | 20 (51.3%) | 19 (48.7%) |
| Real Estate, Rental & Leasing | 5 (45.5%) | 6 (54.5%) |
| Professional & Scientific | 27 (100.0%) | 0 (0.0%) |
| Enterprise Management | 0 (0.0%) | 0 (0.0%) |
| Administrative & Support | 19 (67.9%) | 9 (32.1%) |
| Educational Services | 32 (33.7%) | 63 (66.3%) |
| Health Care & Social Assistance | 15 (9.3%) | 146 (90.7%) |
| Arts, Entertainment & Recreation | 8 (100.0%) | 0 (0.0%) |
| Accommodation & Food Services | 50 (35.0%) | 93 (65.0%) |
| Public Administration | 39 (70.9%) | 16 (29.1%) |
| Total | 485 (48.3%) | 518 (51.6%) |
Education in Roanoke
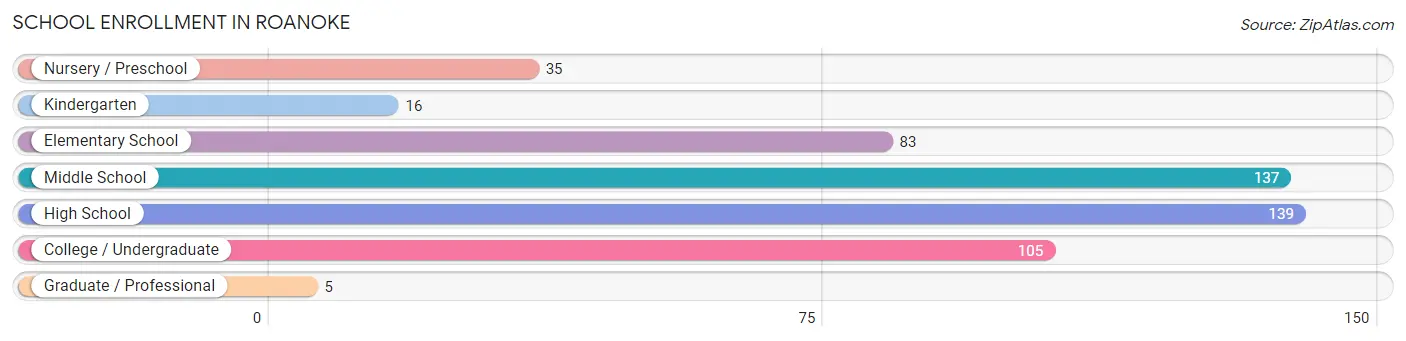
School Enrollment in Roanoke
The most common levels of schooling among the 520 students in Roanoke are high school (139 | 26.7%), middle school (137 | 26.4%), and college / undergraduate (105 | 20.2%).
| School Level | # Students | % Students |
| Nursery / Preschool | 35 | 6.7% |
| Kindergarten | 16 | 3.1% |
| Elementary School | 83 | 16.0% |
| Middle School | 137 | 26.4% |
| High School | 139 | 26.7% |
| College / Undergraduate | 105 | 20.2% |
| Graduate / Professional | 5 | 1.0% |
| Total | 520 | 100.0% |
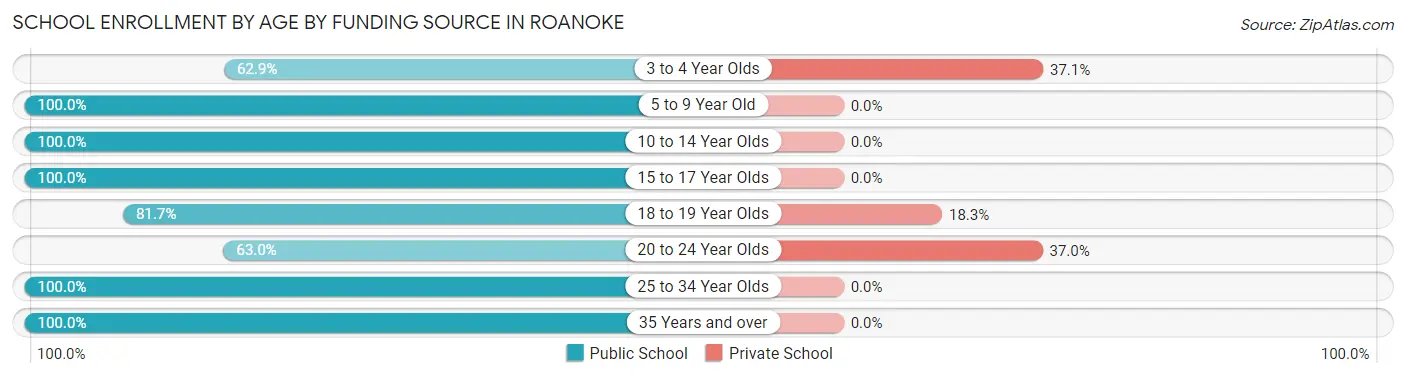
School Enrollment by Age by Funding Source in Roanoke
Out of a total of 520 students who are enrolled in schools in Roanoke, 34 (6.5%) attend a private institution, while the remaining 486 (93.5%) are enrolled in public schools. The age group of 3 to 4 year olds has the highest likelihood of being enrolled in private schools, with 13 (37.1% in the age bracket) enrolled. Conversely, the age group of 5 to 9 year old has the lowest likelihood of being enrolled in a private school, with 70 (100.0% in the age bracket) attending a public institution.
| Age Bracket | Public School | Private School |
| 3 to 4 Year Olds | 22 (62.9%) | 13 (37.1%) |
| 5 to 9 Year Old | 70 (100.0%) | 0 (0.0%) |
| 10 to 14 Year Olds | 169 (100.0%) | 0 (0.0%) |
| 15 to 17 Year Olds | 136 (100.0%) | 0 (0.0%) |
| 18 to 19 Year Olds | 49 (81.7%) | 11 (18.3%) |
| 20 to 24 Year Olds | 17 (63.0%) | 10 (37.0%) |
| 25 to 34 Year Olds | 18 (100.0%) | 0 (0.0%) |
| 35 Years and over | 5 (100.0%) | 0 (0.0%) |
| Total | 486 (93.5%) | 34 (6.5%) |
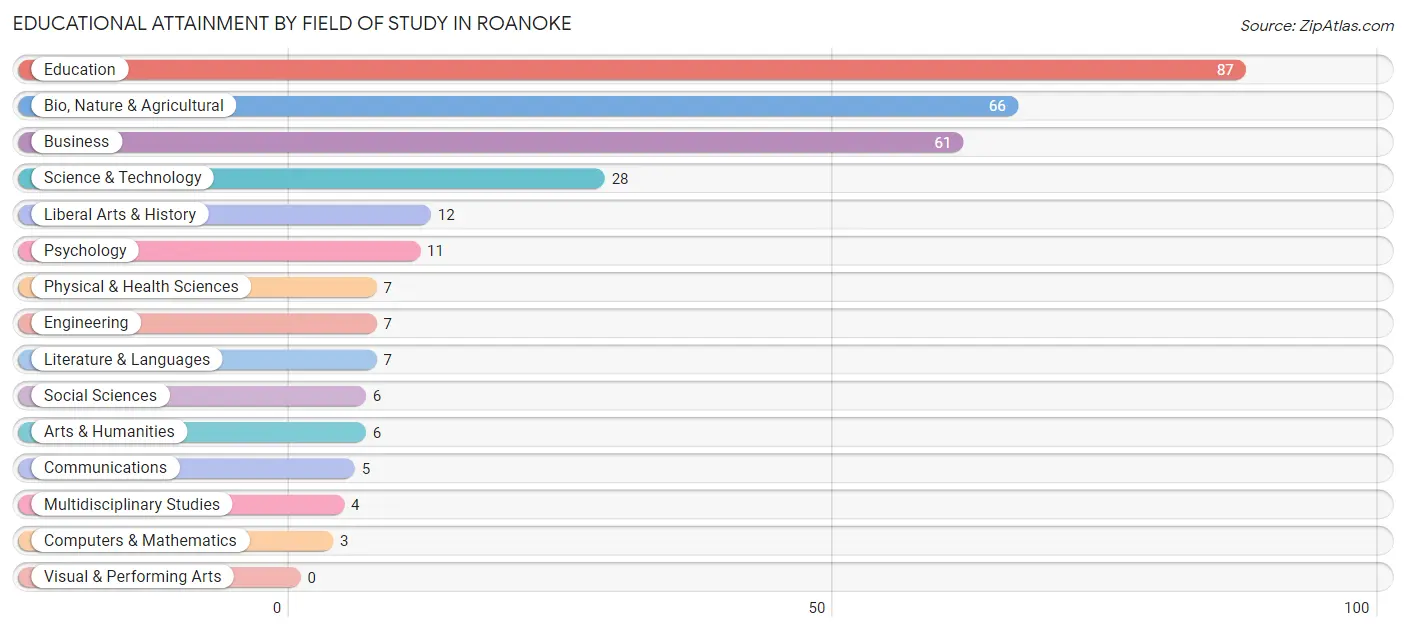
Educational Attainment by Field of Study in Roanoke
Education (87 | 28.1%), bio, nature & agricultural (66 | 21.3%), business (61 | 19.7%), science & technology (28 | 9.0%), and liberal arts & history (12 | 3.9%) are the most common fields of study among 310 individuals in Roanoke who have obtained a bachelor's degree or higher.
| Field of Study | # Graduates | % Graduates |
| Computers & Mathematics | 3 | 1.0% |
| Bio, Nature & Agricultural | 66 | 21.3% |
| Physical & Health Sciences | 7 | 2.3% |
| Psychology | 11 | 3.5% |
| Social Sciences | 6 | 1.9% |
| Engineering | 7 | 2.3% |
| Multidisciplinary Studies | 4 | 1.3% |
| Science & Technology | 28 | 9.0% |
| Business | 61 | 19.7% |
| Education | 87 | 28.1% |
| Literature & Languages | 7 | 2.3% |
| Liberal Arts & History | 12 | 3.9% |
| Visual & Performing Arts | 0 | 0.0% |
| Communications | 5 | 1.6% |
| Arts & Humanities | 6 | 1.9% |
| Total | 310 | 100.0% |
Transportation & Commute in Roanoke
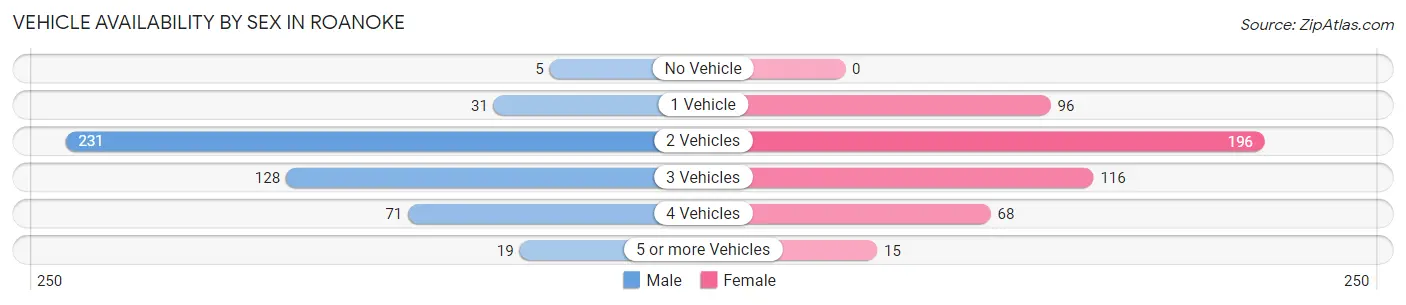
Vehicle Availability by Sex in Roanoke
The most prevalent vehicle ownership categories in Roanoke are males with 2 vehicles (231, accounting for 47.6%) and females with 2 vehicles (196, making up 47.0%).
| Vehicles Available | Male | Female |
| No Vehicle | 5 (1.0%) | 0 (0.0%) |
| 1 Vehicle | 31 (6.4%) | 96 (19.6%) |
| 2 Vehicles | 231 (47.6%) | 196 (39.9%) |
| 3 Vehicles | 128 (26.4%) | 116 (23.6%) |
| 4 Vehicles | 71 (14.6%) | 68 (13.9%) |
| 5 or more Vehicles | 19 (3.9%) | 15 (3.0%) |
| Total | 485 (100.0%) | 491 (100.0%) |
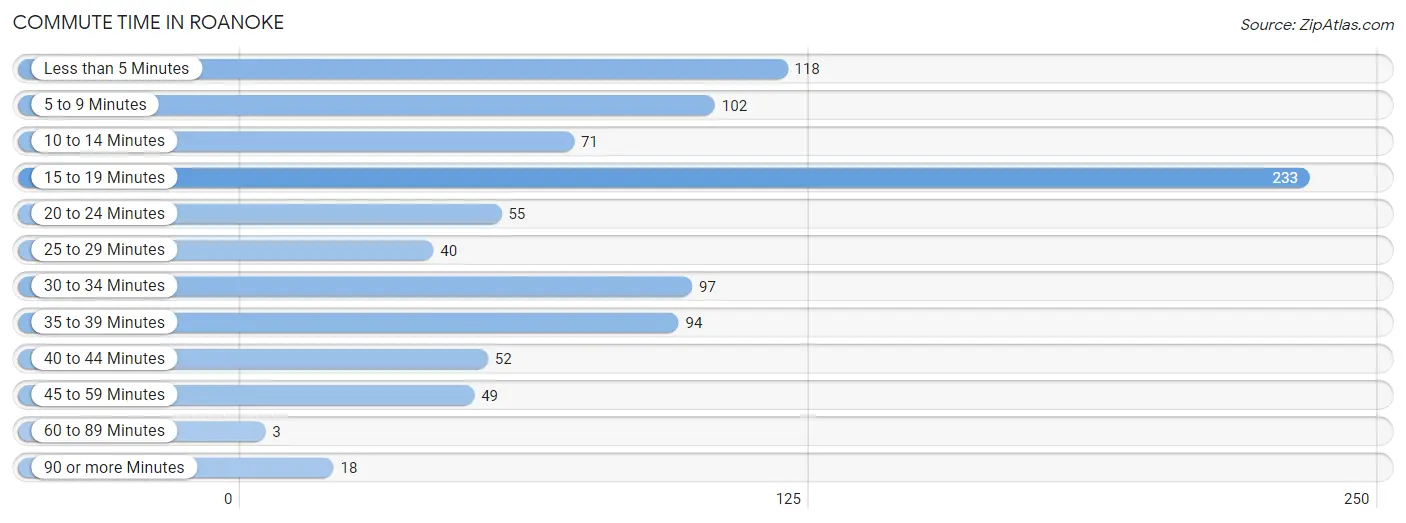
Commute Time in Roanoke
The most frequently occuring commute durations in Roanoke are 15 to 19 minutes (233 commuters, 25.0%), less than 5 minutes (118 commuters, 12.7%), and 5 to 9 minutes (102 commuters, 10.9%).
| Commute Time | # Commuters | % Commuters |
| Less than 5 Minutes | 118 | 12.7% |
| 5 to 9 Minutes | 102 | 10.9% |
| 10 to 14 Minutes | 71 | 7.6% |
| 15 to 19 Minutes | 233 | 25.0% |
| 20 to 24 Minutes | 55 | 5.9% |
| 25 to 29 Minutes | 40 | 4.3% |
| 30 to 34 Minutes | 97 | 10.4% |
| 35 to 39 Minutes | 94 | 10.1% |
| 40 to 44 Minutes | 52 | 5.6% |
| 45 to 59 Minutes | 49 | 5.3% |
| 60 to 89 Minutes | 3 | 0.3% |
| 90 or more Minutes | 18 | 1.9% |
Commute Time by Sex in Roanoke
The most common commute times in Roanoke are 15 to 19 minutes (131 commuters, 28.1%) for males and 15 to 19 minutes (102 commuters, 21.9%) for females.
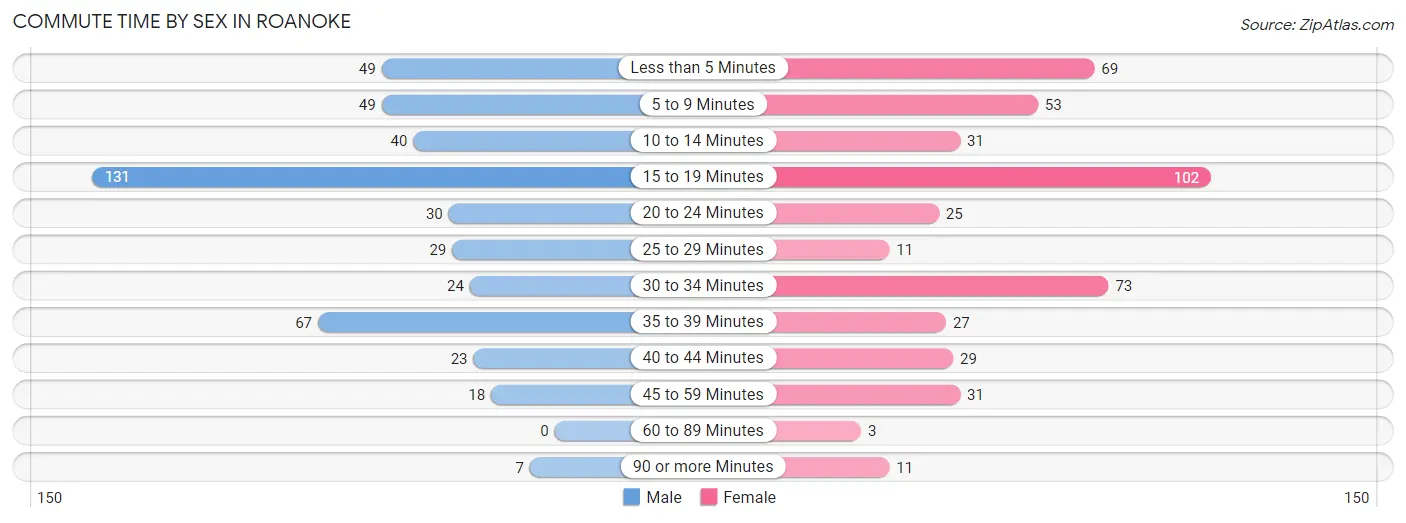
| Commute Time | Male | Female |
| Less than 5 Minutes | 49 (10.5%) | 69 (14.8%) |
| 5 to 9 Minutes | 49 (10.5%) | 53 (11.4%) |
| 10 to 14 Minutes | 40 (8.6%) | 31 (6.7%) |
| 15 to 19 Minutes | 131 (28.1%) | 102 (21.9%) |
| 20 to 24 Minutes | 30 (6.4%) | 25 (5.4%) |
| 25 to 29 Minutes | 29 (6.2%) | 11 (2.4%) |
| 30 to 34 Minutes | 24 (5.1%) | 73 (15.7%) |
| 35 to 39 Minutes | 67 (14.3%) | 27 (5.8%) |
| 40 to 44 Minutes | 23 (4.9%) | 29 (6.2%) |
| 45 to 59 Minutes | 18 (3.8%) | 31 (6.7%) |
| 60 to 89 Minutes | 0 (0.0%) | 3 (0.6%) |
| 90 or more Minutes | 7 (1.5%) | 11 (2.4%) |
Time of Departure to Work by Sex in Roanoke
The most frequent times of departure to work in Roanoke are 7:30 AM to 7:59 AM (109, 23.3%) for males and 7:30 AM to 7:59 AM (82, 17.6%) for females.
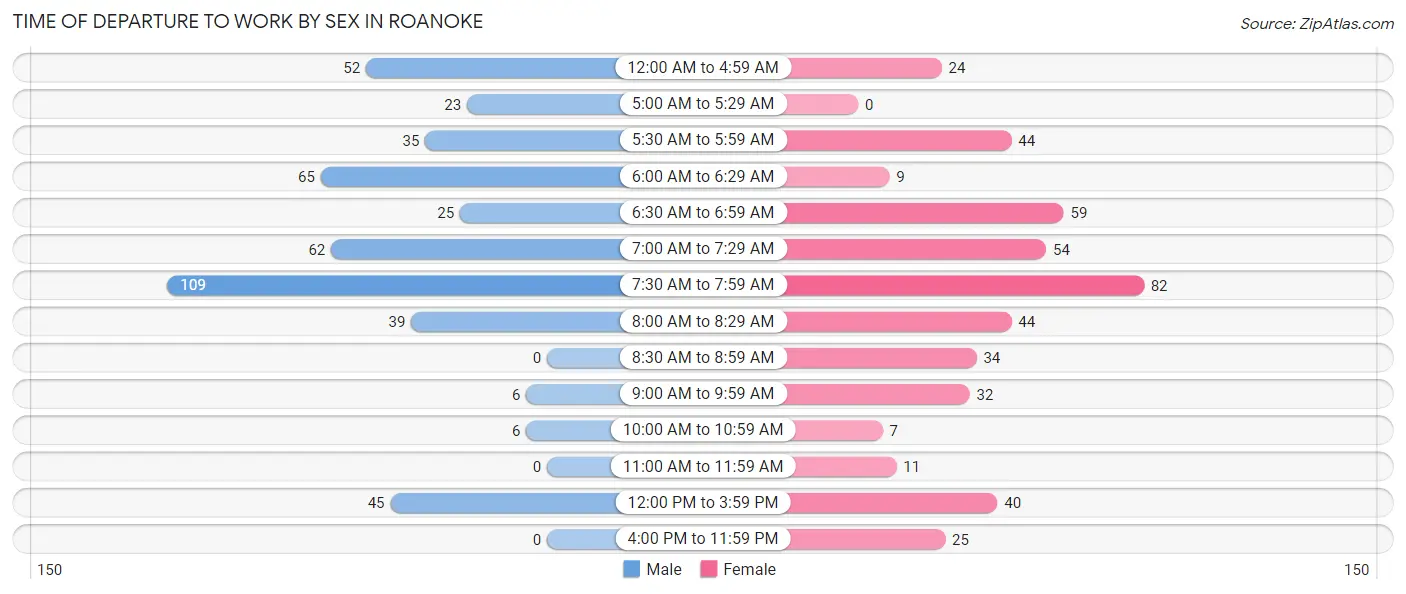
| Time of Departure | Male | Female |
| 12:00 AM to 4:59 AM | 52 (11.1%) | 24 (5.2%) |
| 5:00 AM to 5:29 AM | 23 (4.9%) | 0 (0.0%) |
| 5:30 AM to 5:59 AM | 35 (7.5%) | 44 (9.5%) |
| 6:00 AM to 6:29 AM | 65 (13.9%) | 9 (1.9%) |
| 6:30 AM to 6:59 AM | 25 (5.3%) | 59 (12.7%) |
| 7:00 AM to 7:29 AM | 62 (13.3%) | 54 (11.6%) |
| 7:30 AM to 7:59 AM | 109 (23.3%) | 82 (17.6%) |
| 8:00 AM to 8:29 AM | 39 (8.4%) | 44 (9.5%) |
| 8:30 AM to 8:59 AM | 0 (0.0%) | 34 (7.3%) |
| 9:00 AM to 9:59 AM | 6 (1.3%) | 32 (6.9%) |
| 10:00 AM to 10:59 AM | 6 (1.3%) | 7 (1.5%) |
| 11:00 AM to 11:59 AM | 0 (0.0%) | 11 (2.4%) |
| 12:00 PM to 3:59 PM | 45 (9.6%) | 40 (8.6%) |
| 4:00 PM to 11:59 PM | 0 (0.0%) | 25 (5.4%) |
| Total | 467 (100.0%) | 465 (100.0%) |
Housing Occupancy in Roanoke
Occupancy by Ownership in Roanoke
Of the total 746 dwellings in Roanoke, owner-occupied units account for 587 (78.7%), while renter-occupied units make up 159 (21.3%).
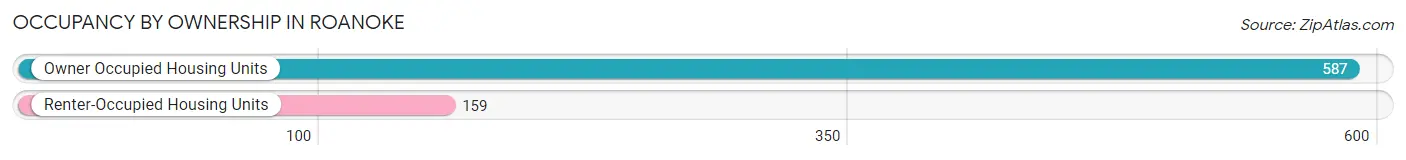
| Occupancy | # Housing Units | % Housing Units |
| Owner Occupied Housing Units | 587 | 78.7% |
| Renter-Occupied Housing Units | 159 | 21.3% |
| Total Occupied Housing Units | 746 | 100.0% |
Occupancy by Household Size in Roanoke
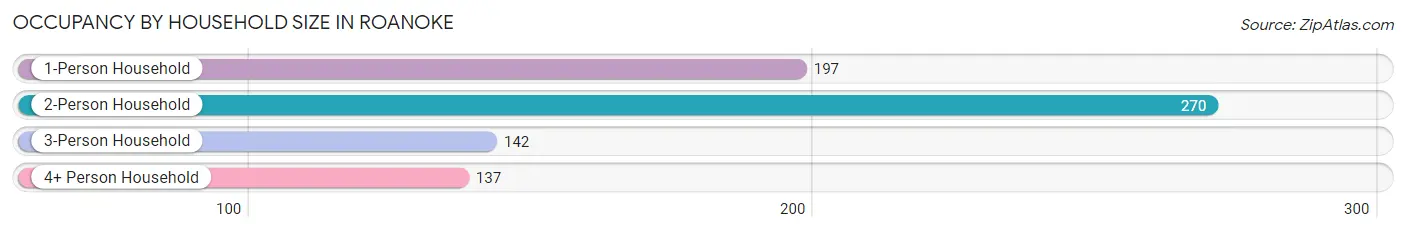
| Household Size | # Housing Units | % Housing Units |
| 1-Person Household | 197 | 26.4% |
| 2-Person Household | 270 | 36.2% |
| 3-Person Household | 142 | 19.0% |
| 4+ Person Household | 137 | 18.4% |
| Total Housing Units | 746 | 100.0% |
Occupancy by Ownership by Household Size in Roanoke
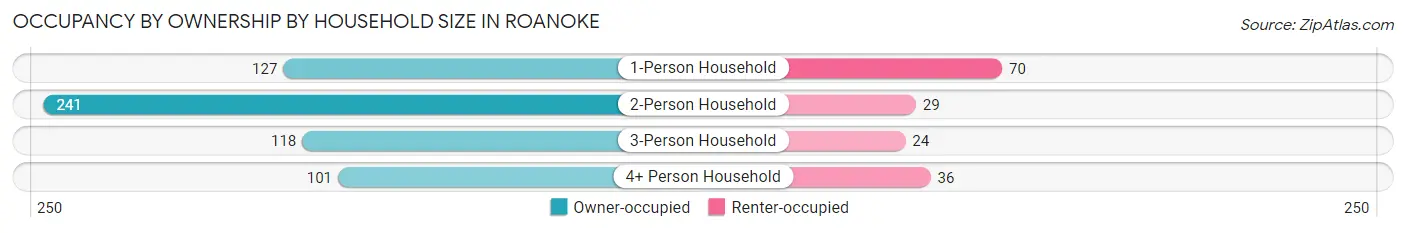
| Household Size | Owner-occupied | Renter-occupied |
| 1-Person Household | 127 (64.5%) | 70 (35.5%) |
| 2-Person Household | 241 (89.3%) | 29 (10.7%) |
| 3-Person Household | 118 (83.1%) | 24 (16.9%) |
| 4+ Person Household | 101 (73.7%) | 36 (26.3%) |
| Total Housing Units | 587 (78.7%) | 159 (21.3%) |
Occupancy by Educational Attainment in Roanoke
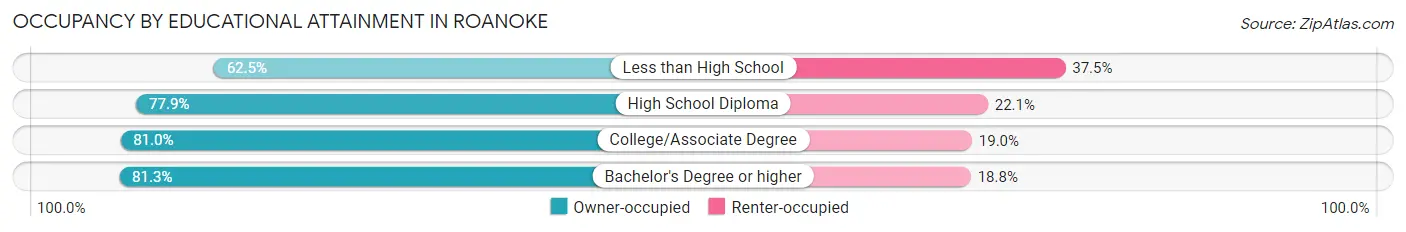
| Household Size | Owner-occupied | Renter-occupied |
| Less than High School | 35 (62.5%) | 21 (37.5%) |
| High School Diploma | 183 (77.9%) | 52 (22.1%) |
| College/Associate Degree | 252 (81.0%) | 59 (19.0%) |
| Bachelor's Degree or higher | 117 (81.2%) | 27 (18.8%) |
Occupancy by Age of Householder in Roanoke
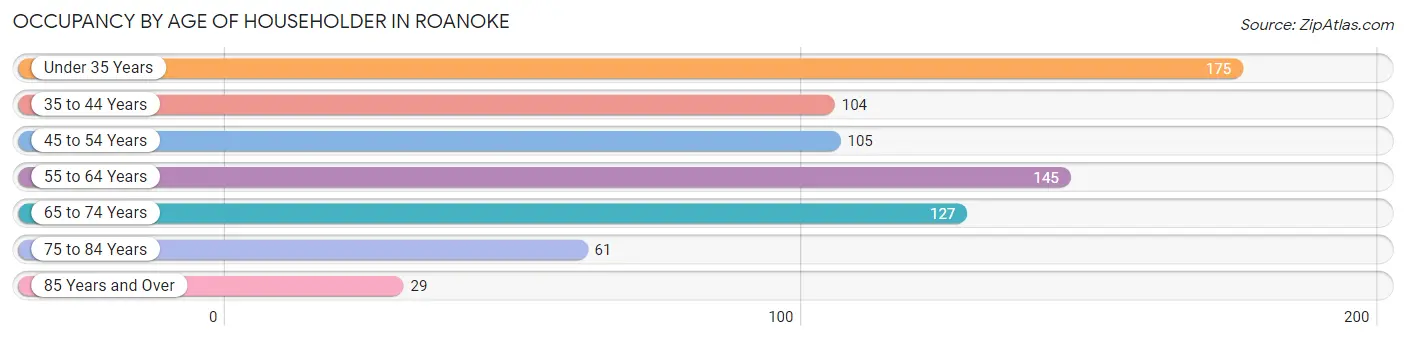
| Age Bracket | # Households | % Households |
| Under 35 Years | 175 | 23.5% |
| 35 to 44 Years | 104 | 13.9% |
| 45 to 54 Years | 105 | 14.1% |
| 55 to 64 Years | 145 | 19.4% |
| 65 to 74 Years | 127 | 17.0% |
| 75 to 84 Years | 61 | 8.2% |
| 85 Years and Over | 29 | 3.9% |
| Total | 746 | 100.0% |
Housing Finances in Roanoke
Median Income by Occupancy in Roanoke
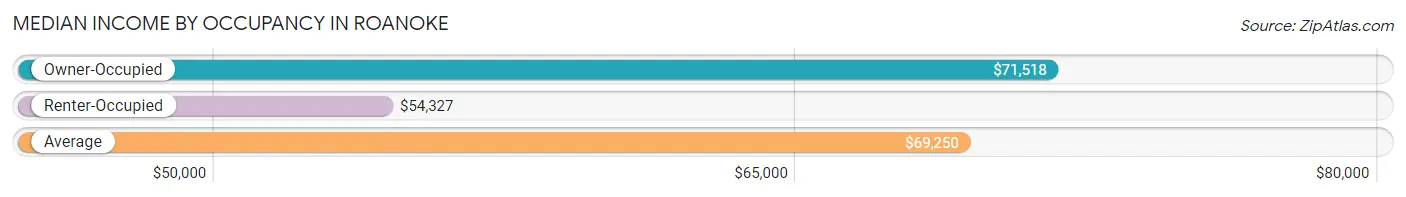
| Occupancy Type | # Households | Median Income |
| Owner-Occupied | 587 (78.7%) | $71,518 |
| Renter-Occupied | 159 (21.3%) | $54,327 |
| Average | 746 (100.0%) | $69,250 |
Occupancy by Householder Income Bracket in Roanoke
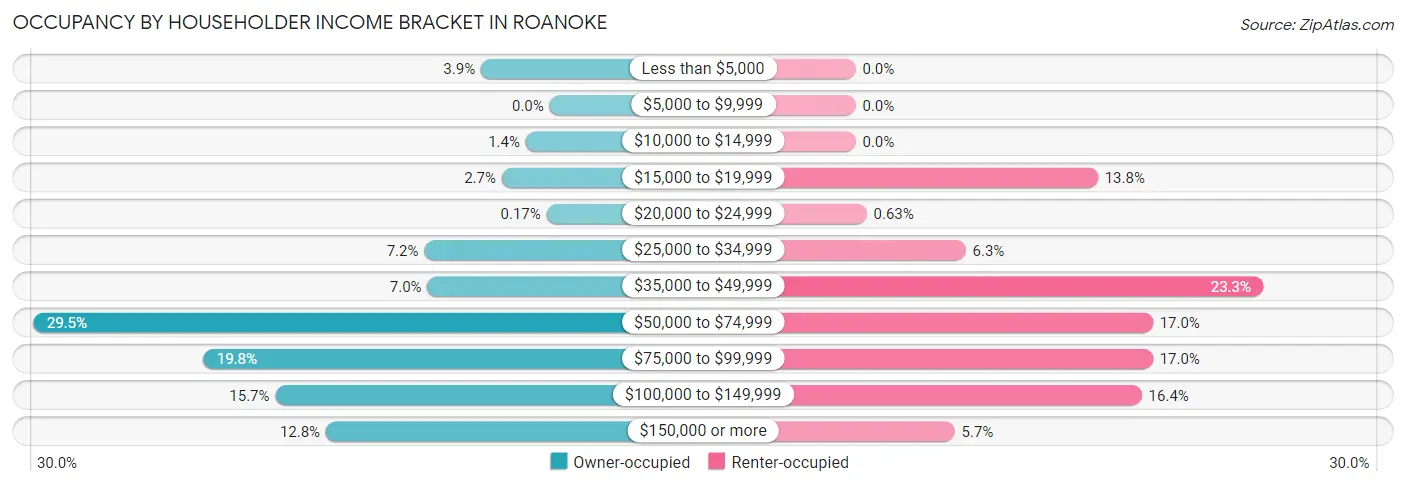
| Income Bracket | Owner-occupied | Renter-occupied |
| Less than $5,000 | 23 (3.9%) | 0 (0.0%) |
| $5,000 to $9,999 | 0 (0.0%) | 0 (0.0%) |
| $10,000 to $14,999 | 8 (1.4%) | 0 (0.0%) |
| $15,000 to $19,999 | 16 (2.7%) | 22 (13.8%) |
| $20,000 to $24,999 | 1 (0.2%) | 1 (0.6%) |
| $25,000 to $34,999 | 42 (7.2%) | 10 (6.3%) |
| $35,000 to $49,999 | 41 (7.0%) | 37 (23.3%) |
| $50,000 to $74,999 | 173 (29.5%) | 27 (17.0%) |
| $75,000 to $99,999 | 116 (19.8%) | 27 (17.0%) |
| $100,000 to $149,999 | 92 (15.7%) | 26 (16.4%) |
| $150,000 or more | 75 (12.8%) | 9 (5.7%) |
| Total | 587 (100.0%) | 159 (100.0%) |
Monthly Housing Cost Tiers in Roanoke
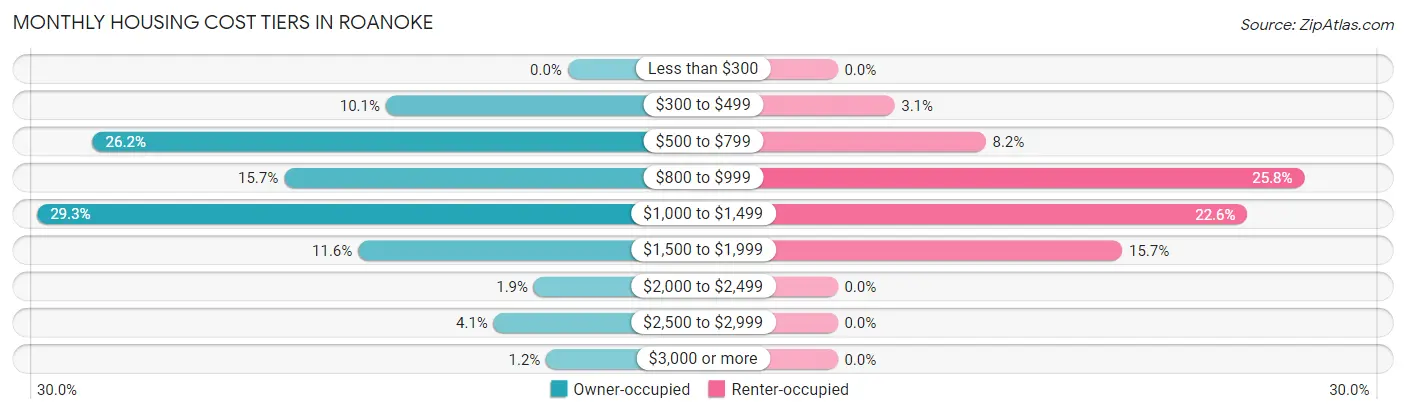
| Monthly Cost | Owner-occupied | Renter-occupied |
| Less than $300 | 0 (0.0%) | 0 (0.0%) |
| $300 to $499 | 59 (10.1%) | 5 (3.1%) |
| $500 to $799 | 154 (26.2%) | 13 (8.2%) |
| $800 to $999 | 92 (15.7%) | 41 (25.8%) |
| $1,000 to $1,499 | 172 (29.3%) | 36 (22.6%) |
| $1,500 to $1,999 | 68 (11.6%) | 25 (15.7%) |
| $2,000 to $2,499 | 11 (1.9%) | 0 (0.0%) |
| $2,500 to $2,999 | 24 (4.1%) | 0 (0.0%) |
| $3,000 or more | 7 (1.2%) | 0 (0.0%) |
| Total | 587 (100.0%) | 159 (100.0%) |
Physical Housing Characteristics in Roanoke
Housing Structures in Roanoke
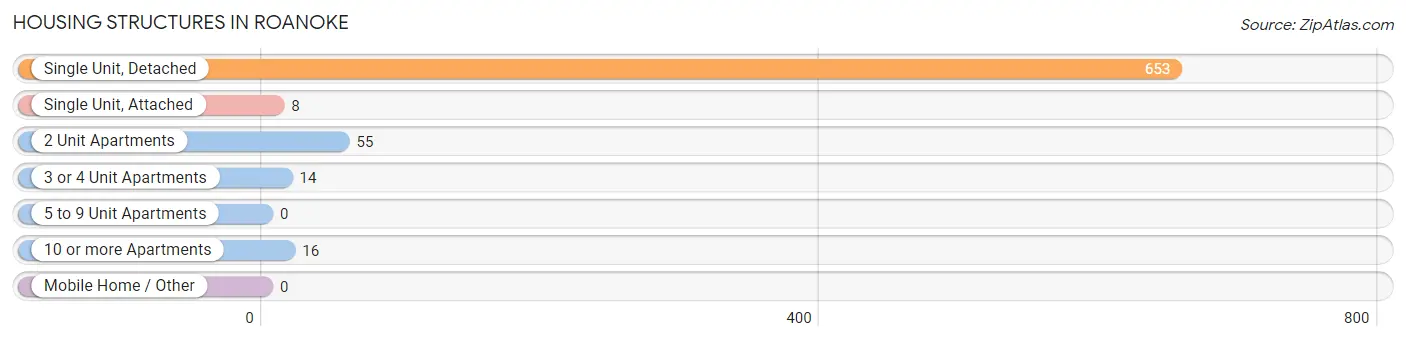
| Structure Type | # Housing Units | % Housing Units |
| Single Unit, Detached | 653 | 87.5% |
| Single Unit, Attached | 8 | 1.1% |
| 2 Unit Apartments | 55 | 7.4% |
| 3 or 4 Unit Apartments | 14 | 1.9% |
| 5 to 9 Unit Apartments | 0 | 0.0% |
| 10 or more Apartments | 16 | 2.1% |
| Mobile Home / Other | 0 | 0.0% |
| Total | 746 | 100.0% |
Housing Structures by Occupancy in Roanoke
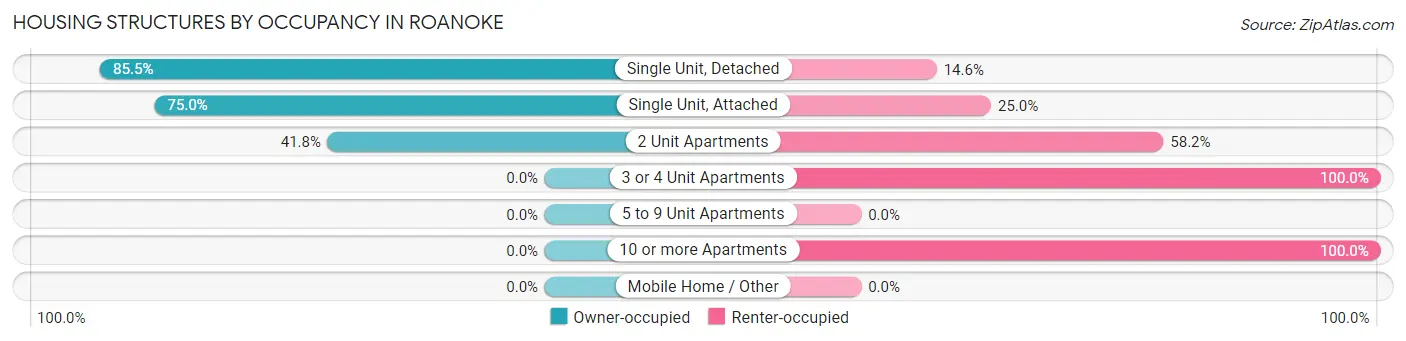
| Structure Type | Owner-occupied | Renter-occupied |
| Single Unit, Detached | 558 (85.5%) | 95 (14.5%) |
| Single Unit, Attached | 6 (75.0%) | 2 (25.0%) |
| 2 Unit Apartments | 23 (41.8%) | 32 (58.2%) |
| 3 or 4 Unit Apartments | 0 (0.0%) | 14 (100.0%) |
| 5 to 9 Unit Apartments | 0 (0.0%) | 0 (0.0%) |
| 10 or more Apartments | 0 (0.0%) | 16 (100.0%) |
| Mobile Home / Other | 0 (0.0%) | 0 (0.0%) |
| Total | 587 (78.7%) | 159 (21.3%) |
Housing Structures by Number of Rooms in Roanoke
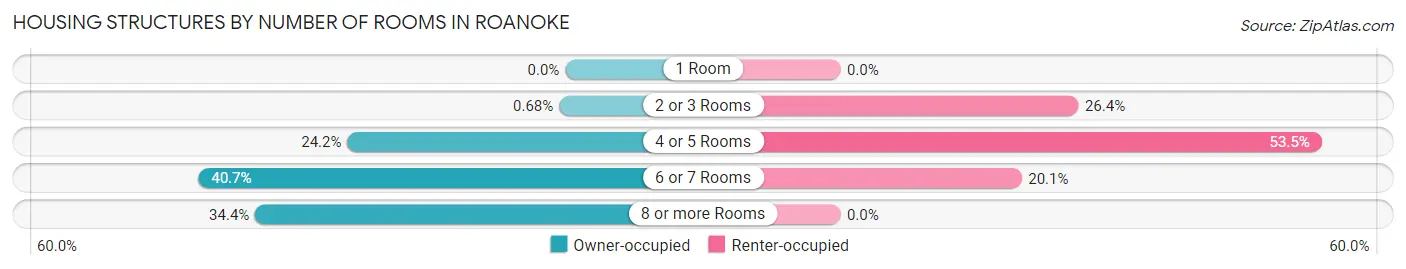
| Number of Rooms | Owner-occupied | Renter-occupied |
| 1 Room | 0 (0.0%) | 0 (0.0%) |
| 2 or 3 Rooms | 4 (0.7%) | 42 (26.4%) |
| 4 or 5 Rooms | 142 (24.2%) | 85 (53.5%) |
| 6 or 7 Rooms | 239 (40.7%) | 32 (20.1%) |
| 8 or more Rooms | 202 (34.4%) | 0 (0.0%) |
| Total | 587 (100.0%) | 159 (100.0%) |
Housing Structure by Heating Type in Roanoke
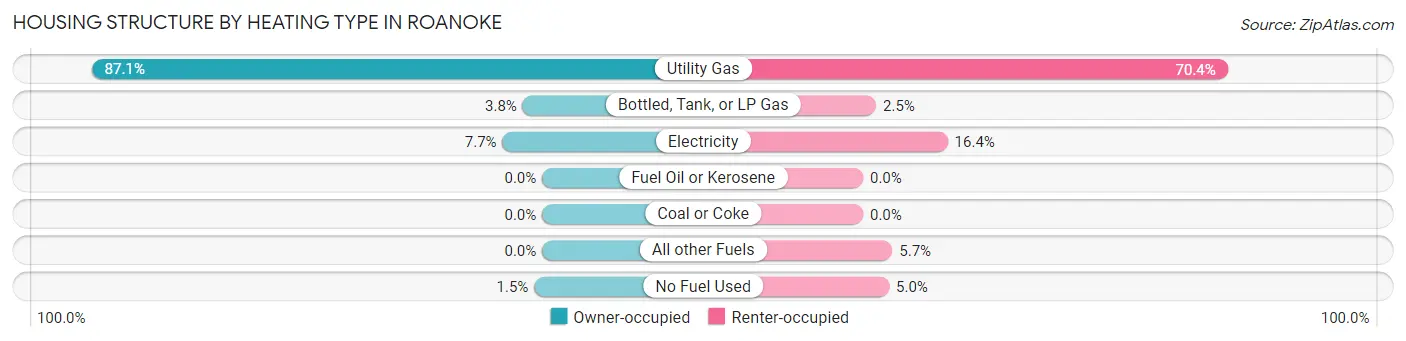
| Heating Type | Owner-occupied | Renter-occupied |
| Utility Gas | 511 (87.1%) | 112 (70.4%) |
| Bottled, Tank, or LP Gas | 22 (3.7%) | 4 (2.5%) |
| Electricity | 45 (7.7%) | 26 (16.4%) |
| Fuel Oil or Kerosene | 0 (0.0%) | 0 (0.0%) |
| Coal or Coke | 0 (0.0%) | 0 (0.0%) |
| All other Fuels | 0 (0.0%) | 9 (5.7%) |
| No Fuel Used | 9 (1.5%) | 8 (5.0%) |
| Total | 587 (100.0%) | 159 (100.0%) |
Household Vehicle Usage in Roanoke
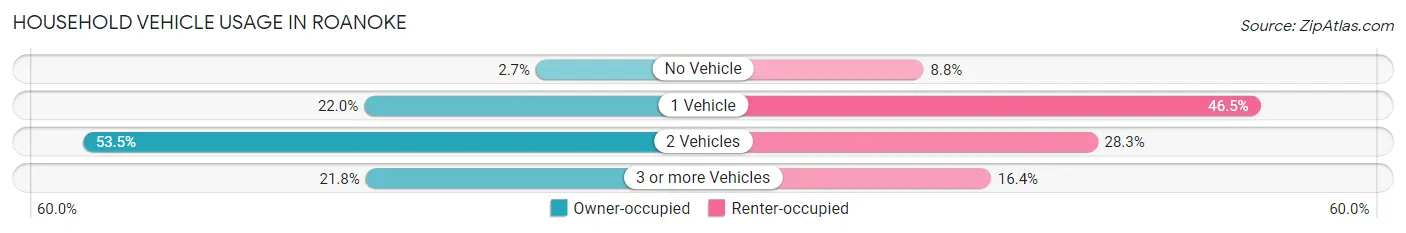
| Vehicles per Household | Owner-occupied | Renter-occupied |
| No Vehicle | 16 (2.7%) | 14 (8.8%) |
| 1 Vehicle | 129 (22.0%) | 74 (46.5%) |
| 2 Vehicles | 314 (53.5%) | 45 (28.3%) |
| 3 or more Vehicles | 128 (21.8%) | 26 (16.4%) |
| Total | 587 (100.0%) | 159 (100.0%) |
Real Estate & Mortgages in Roanoke
Real Estate and Mortgage Overview in Roanoke
| Characteristic | Without Mortgage | With Mortgage |
| Housing Units | 219 | 368 |
| Median Property Value | $146,300 | $138,400 |
| Median Household Income | $54,458 | $41 |
| Monthly Housing Costs | $609 | $7 |
| Real Estate Taxes | $2,959 | $14 |
Property Value by Mortgage Status in Roanoke
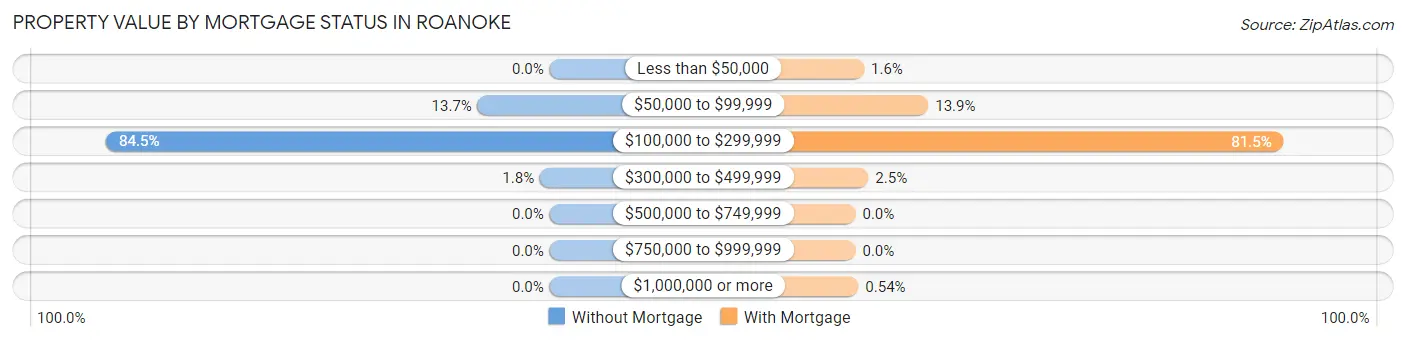
| Property Value | Without Mortgage | With Mortgage |
| Less than $50,000 | 0 (0.0%) | 6 (1.6%) |
| $50,000 to $99,999 | 30 (13.7%) | 51 (13.9%) |
| $100,000 to $299,999 | 185 (84.5%) | 300 (81.5%) |
| $300,000 to $499,999 | 4 (1.8%) | 9 (2.5%) |
| $500,000 to $749,999 | 0 (0.0%) | 0 (0.0%) |
| $750,000 to $999,999 | 0 (0.0%) | 0 (0.0%) |
| $1,000,000 or more | 0 (0.0%) | 2 (0.5%) |
| Total | 219 (100.0%) | 368 (100.0%) |
Household Income by Mortgage Status in Roanoke
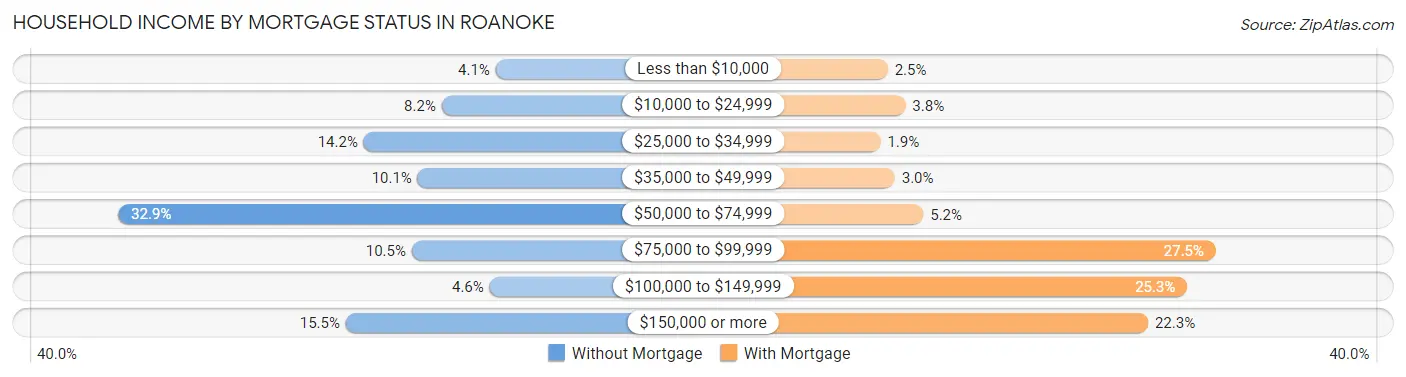
| Household Income | Without Mortgage | With Mortgage |
| Less than $10,000 | 9 (4.1%) | 9 (2.5%) |
| $10,000 to $24,999 | 18 (8.2%) | 14 (3.8%) |
| $25,000 to $34,999 | 31 (14.2%) | 7 (1.9%) |
| $35,000 to $49,999 | 22 (10.1%) | 11 (3.0%) |
| $50,000 to $74,999 | 72 (32.9%) | 19 (5.2%) |
| $75,000 to $99,999 | 23 (10.5%) | 101 (27.5%) |
| $100,000 to $149,999 | 10 (4.6%) | 93 (25.3%) |
| $150,000 or more | 34 (15.5%) | 82 (22.3%) |
| Total | 219 (100.0%) | 368 (100.0%) |
Property Value to Household Income Ratio in Roanoke
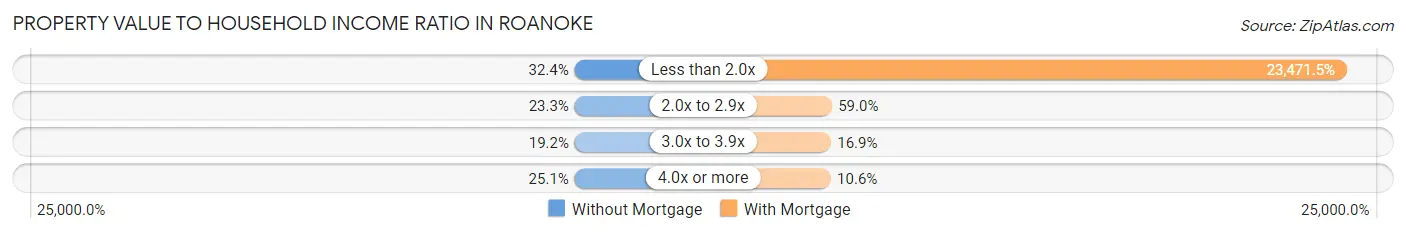
| Value-to-Income Ratio | Without Mortgage | With Mortgage |
| Less than 2.0x | 71 (32.4%) | 86,375 (23,471.5%) |
| 2.0x to 2.9x | 51 (23.3%) | 217 (59.0%) |
| 3.0x to 3.9x | 42 (19.2%) | 62 (16.9%) |
| 4.0x or more | 55 (25.1%) | 39 (10.6%) |
| Total | 219 (100.0%) | 368 (100.0%) |
Real Estate Taxes by Mortgage Status in Roanoke
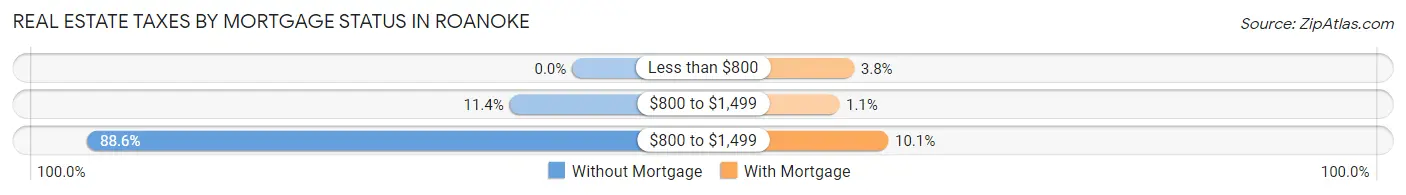
| Property Taxes | Without Mortgage | With Mortgage |
| Less than $800 | 0 (0.0%) | 14 (3.8%) |
| $800 to $1,499 | 25 (11.4%) | 4 (1.1%) |
| $800 to $1,499 | 194 (88.6%) | 37 (10.1%) |
| Total | 219 (100.0%) | 368 (100.0%) |
Health & Disability in Roanoke
Health Insurance Coverage by Age in Roanoke
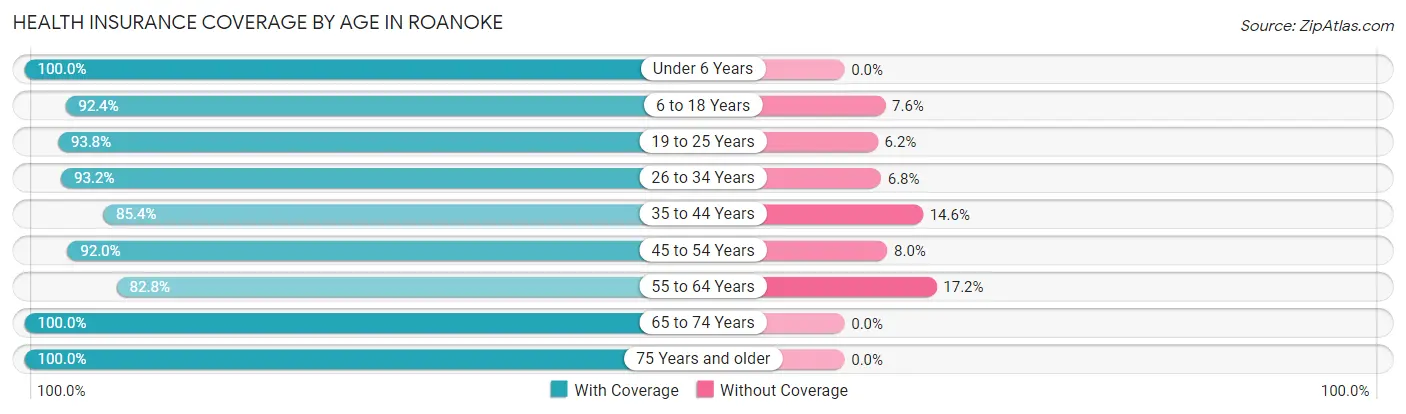
| Age Bracket | With Coverage | Without Coverage |
| Under 6 Years | 152 (100.0%) | 0 (0.0%) |
| 6 to 18 Years | 352 (92.4%) | 29 (7.6%) |
| 19 to 25 Years | 166 (93.8%) | 11 (6.2%) |
| 26 to 34 Years | 233 (93.2%) | 17 (6.8%) |
| 35 to 44 Years | 140 (85.4%) | 24 (14.6%) |
| 45 to 54 Years | 219 (92.0%) | 19 (8.0%) |
| 55 to 64 Years | 193 (82.8%) | 40 (17.2%) |
| 65 to 74 Years | 220 (100.0%) | 0 (0.0%) |
| 75 Years and older | 144 (100.0%) | 0 (0.0%) |
| Total | 1,819 (92.8%) | 140 (7.1%) |
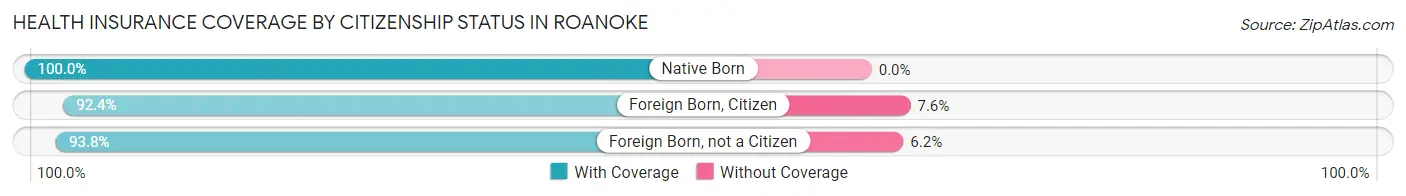
Health Insurance Coverage by Citizenship Status in Roanoke
| Citizenship Status | With Coverage | Without Coverage |
| Native Born | 152 (100.0%) | 0 (0.0%) |
| Foreign Born, Citizen | 352 (92.4%) | 29 (7.6%) |
| Foreign Born, not a Citizen | 166 (93.8%) | 11 (6.2%) |
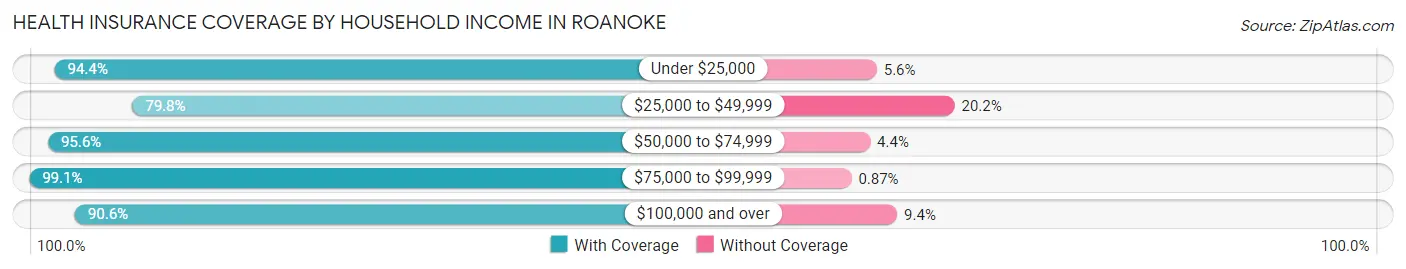
Health Insurance Coverage by Household Income in Roanoke
| Household Income | With Coverage | Without Coverage |
| Under $25,000 | 84 (94.4%) | 5 (5.6%) |
| $25,000 to $49,999 | 166 (79.8%) | 42 (20.2%) |
| $50,000 to $74,999 | 458 (95.6%) | 21 (4.4%) |
| $75,000 to $99,999 | 458 (99.1%) | 4 (0.9%) |
| $100,000 and over | 653 (90.6%) | 68 (9.4%) |
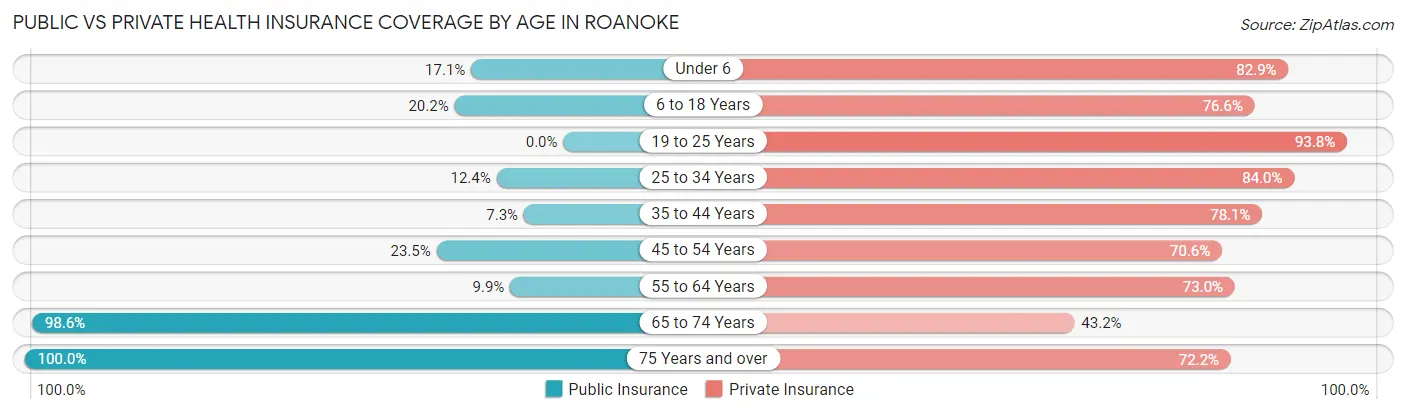
Public vs Private Health Insurance Coverage by Age in Roanoke
| Age Bracket | Public Insurance | Private Insurance |
| Under 6 | 26 (17.1%) | 126 (82.9%) |
| 6 to 18 Years | 77 (20.2%) | 292 (76.6%) |
| 19 to 25 Years | 0 (0.0%) | 166 (93.8%) |
| 25 to 34 Years | 31 (12.4%) | 210 (84.0%) |
| 35 to 44 Years | 12 (7.3%) | 128 (78.0%) |
| 45 to 54 Years | 56 (23.5%) | 168 (70.6%) |
| 55 to 64 Years | 23 (9.9%) | 170 (73.0%) |
| 65 to 74 Years | 217 (98.6%) | 95 (43.2%) |
| 75 Years and over | 144 (100.0%) | 104 (72.2%) |
| Total | 586 (29.9%) | 1,459 (74.5%) |
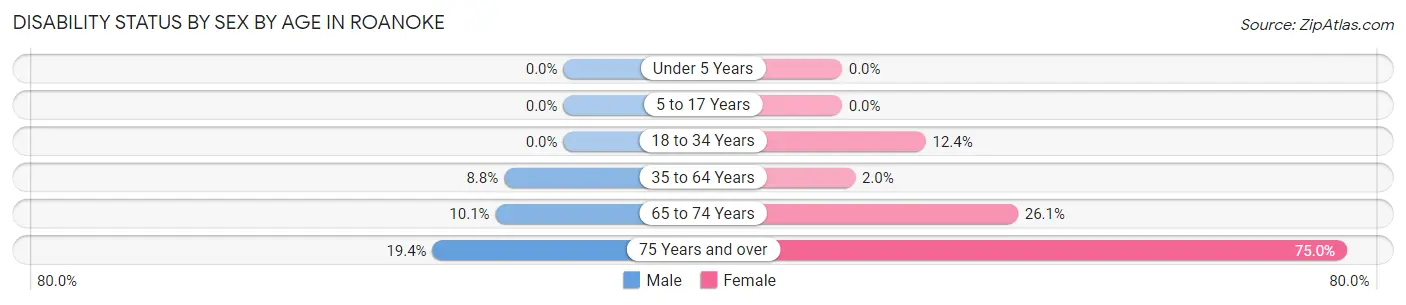
Disability Status by Sex by Age in Roanoke
| Age Bracket | Male | Female |
| Under 5 Years | 0 (0.0%) | 0 (0.0%) |
| 5 to 17 Years | 0 (0.0%) | 0 (0.0%) |
| 18 to 34 Years | 0 (0.0%) | 26 (12.4%) |
| 35 to 64 Years | 29 (8.8%) | 6 (2.0%) |
| 65 to 74 Years | 11 (10.1%) | 29 (26.1%) |
| 75 Years and over | 14 (19.4%) | 54 (75.0%) |
Disability Class by Sex by Age in Roanoke
Disability Class: Hearing Difficulty
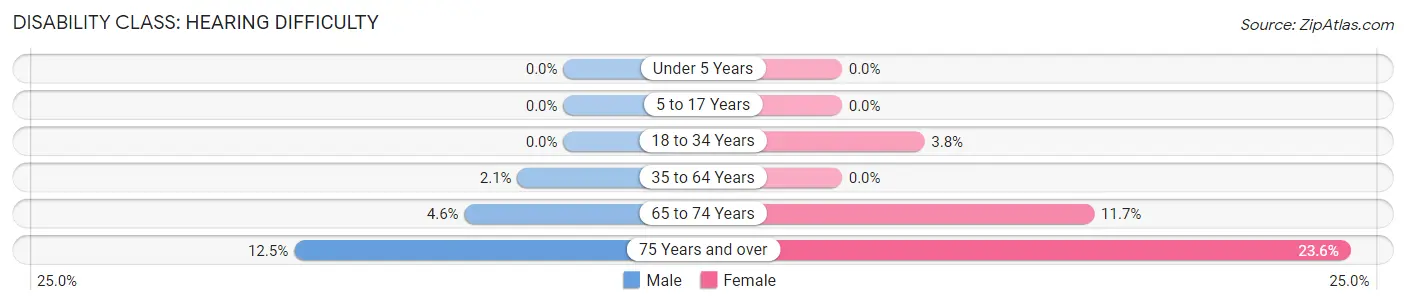
| Age Bracket | Male | Female |
| Under 5 Years | 0 (0.0%) | 0 (0.0%) |
| 5 to 17 Years | 0 (0.0%) | 0 (0.0%) |
| 18 to 34 Years | 0 (0.0%) | 8 (3.8%) |
| 35 to 64 Years | 7 (2.1%) | 0 (0.0%) |
| 65 to 74 Years | 5 (4.6%) | 13 (11.7%) |
| 75 Years and over | 9 (12.5%) | 17 (23.6%) |
Disability Class: Vision Difficulty
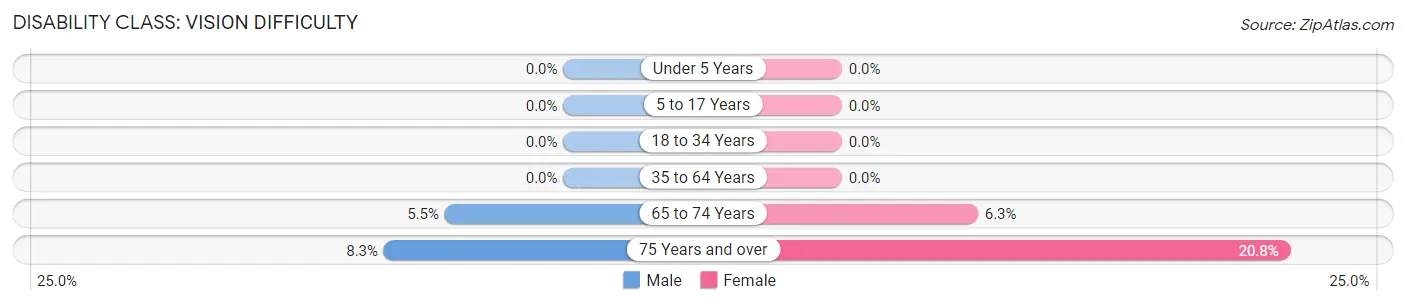
| Age Bracket | Male | Female |
| Under 5 Years | 0 (0.0%) | 0 (0.0%) |
| 5 to 17 Years | 0 (0.0%) | 0 (0.0%) |
| 18 to 34 Years | 0 (0.0%) | 0 (0.0%) |
| 35 to 64 Years | 0 (0.0%) | 0 (0.0%) |
| 65 to 74 Years | 6 (5.5%) | 7 (6.3%) |
| 75 Years and over | 6 (8.3%) | 15 (20.8%) |
Disability Class: Cognitive Difficulty
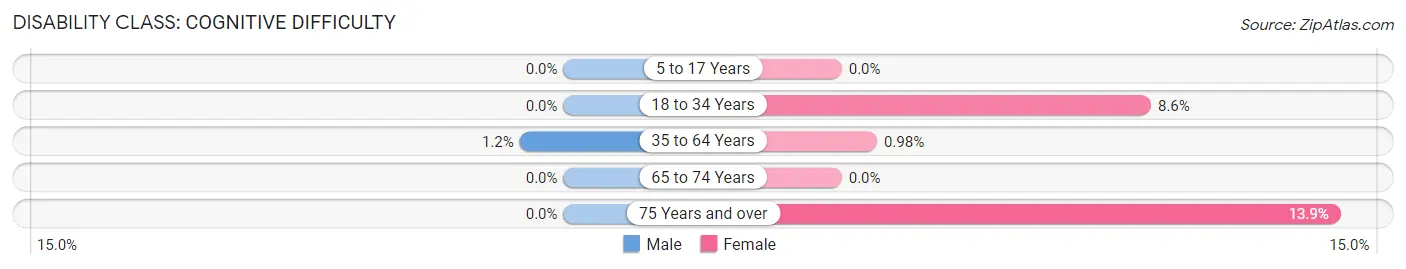
| Age Bracket | Male | Female |
| 5 to 17 Years | 0 (0.0%) | 0 (0.0%) |
| 18 to 34 Years | 0 (0.0%) | 18 (8.6%) |
| 35 to 64 Years | 4 (1.2%) | 3 (1.0%) |
| 65 to 74 Years | 0 (0.0%) | 0 (0.0%) |
| 75 Years and over | 0 (0.0%) | 10 (13.9%) |
Disability Class: Ambulatory Difficulty
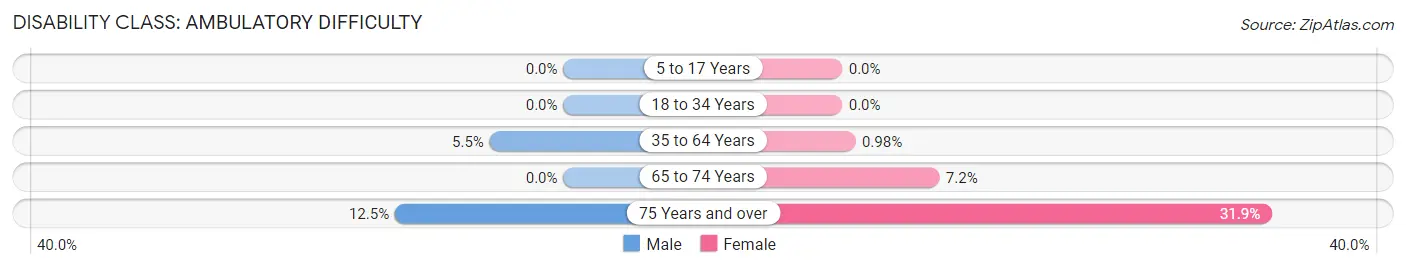
| Age Bracket | Male | Female |
| 5 to 17 Years | 0 (0.0%) | 0 (0.0%) |
| 18 to 34 Years | 0 (0.0%) | 0 (0.0%) |
| 35 to 64 Years | 18 (5.5%) | 3 (1.0%) |
| 65 to 74 Years | 0 (0.0%) | 8 (7.2%) |
| 75 Years and over | 9 (12.5%) | 23 (31.9%) |
Disability Class: Self-Care Difficulty
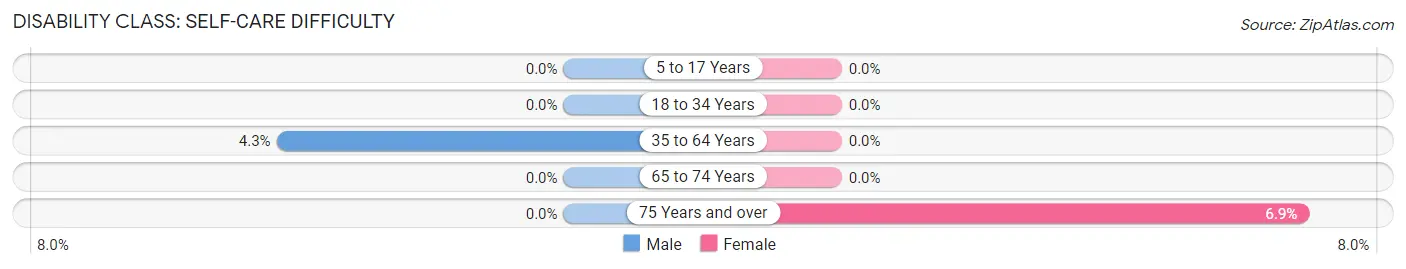
| Age Bracket | Male | Female |
| 5 to 17 Years | 0 (0.0%) | 0 (0.0%) |
| 18 to 34 Years | 0 (0.0%) | 0 (0.0%) |
| 35 to 64 Years | 14 (4.3%) | 0 (0.0%) |
| 65 to 74 Years | 0 (0.0%) | 0 (0.0%) |
| 75 Years and over | 0 (0.0%) | 5 (6.9%) |
Technology Access in Roanoke
Computing Device Access in Roanoke
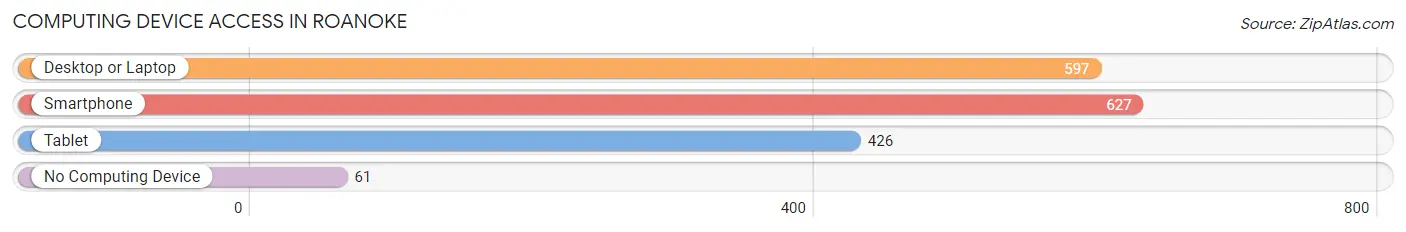
| Device Type | # Households | % Households |
| Desktop or Laptop | 597 | 80.0% |
| Smartphone | 627 | 84.1% |
| Tablet | 426 | 57.1% |
| No Computing Device | 61 | 8.2% |
| Total | 746 | 100.0% |
Internet Access in Roanoke
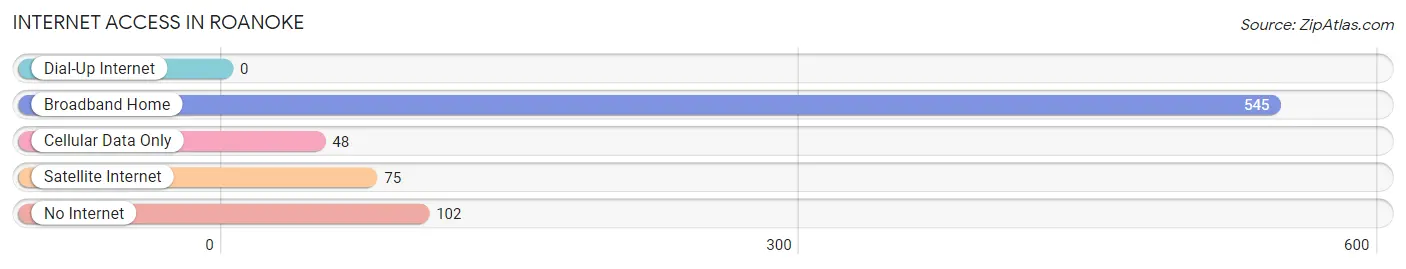
| Internet Type | # Households | % Households |
| Dial-Up Internet | 0 | 0.0% |
| Broadband Home | 545 | 73.1% |
| Cellular Data Only | 48 | 6.4% |
| Satellite Internet | 75 | 10.1% |
| No Internet | 102 | 13.7% |
| Total | 746 | 100.0% |
Roanoke Summary
Roanoke, Illinois is a small village located in Woodford County, Illinois. It is situated in the heart of the Midwest, approximately halfway between Chicago and St. Louis. The village has a population of 1,845 people, according to the 2010 census.
History
The area that is now Roanoke was first settled in 1835 by a group of settlers from Kentucky. The village was originally known as “Kentucky Settlement” and was later renamed “Roanoke” after the nearby Roanoke River. The village was officially incorporated in 1867.
In the late 19th century, Roanoke was a thriving agricultural community. The village was home to several grain elevators, a flour mill, and a creamery. The village also had a railroad station, which connected it to the larger cities of Chicago and St. Louis.
In the early 20th century, Roanoke experienced a period of growth and prosperity. The village was home to several businesses, including a bank, a hotel, a movie theater, and a variety of stores.
Geography
Roanoke is located in the heart of the Midwest, approximately halfway between Chicago and St. Louis. The village is situated in Woodford County, Illinois, and is bordered by the towns of Metamora, Germantown Hills, and Eureka.
The village is situated on the banks of the Roanoke River, which flows through the village and is a popular spot for fishing and canoeing. The village is also home to several parks, including Roanoke Park, which features a playground, picnic areas, and a walking path.
Economy
The economy of Roanoke is largely based on agriculture. The village is home to several farms, which produce a variety of crops, including corn, soybeans, and wheat. The village is also home to several businesses, including a bank, a hotel, a movie theater, and a variety of stores.
Demographics
According to the 2010 census, the population of Roanoke is 1,845 people. The village is predominantly white, with a population that is 97.3% white and 0.7% African American. The median household income is $50,972, and the median age is 43.7 years.
Roanoke is a small village with a rich history and a vibrant economy. The village is home to a variety of businesses, parks, and recreational activities, making it an ideal place to live and work.
Common Questions
What is Per Capita Income in Roanoke?
Per Capita income in Roanoke is $33,146.
What is the Median Family Income in Roanoke?
Median Family Income in Roanoke is $82,917.
What is the Median Household income in Roanoke?
Median Household Income in Roanoke is $69,250.
What is Income or Wage Gap in Roanoke?
Income or Wage Gap in Roanoke is 42.3%.
Women in Roanoke earn 57.7 cents for every dollar earned by a man.
What is Inequality or Gini Index in Roanoke?
Inequality or Gini Index in Roanoke is 0.37.
What is the Total Population of Roanoke?
Total Population of Roanoke is 2,011.
What is the Total Male Population of Roanoke?
Total Male Population of Roanoke is 1,035.
What is the Total Female Population of Roanoke?
Total Female Population of Roanoke is 976.
What is the Ratio of Males per 100 Females in Roanoke?
There are 106.05 Males per 100 Females in Roanoke.
What is the Ratio of Females per 100 Males in Roanoke?
There are 94.30 Females per 100 Males in Roanoke.
What is the Median Population Age in Roanoke?
Median Population Age in Roanoke is 39.1 Years.
What is the Average Family Size in Roanoke
Average Family Size in Roanoke is 3.2 People.
What is the Average Household Size in Roanoke
Average Household Size in Roanoke is 2.6 People.
How Large is the Labor Force in Roanoke?
There are 1,019 People in the Labor Forcein in Roanoke.
What is the Percentage of People in the Labor Force in Roanoke?
64.1% of People are in the Labor Force in Roanoke.
What is the Unemployment Rate in Roanoke?
Unemployment Rate in Roanoke is 1.6%.