Pinckneyville, IL Map & Demographics
Pinckneyville Map
Pinckneyville Overview
$18,953
PER CAPITA INCOME
$63,926
AVG FAMILY INCOME
$36,893
AVG HOUSEHOLD INCOME
6.6%
WAGE / INCOME GAP [ % ]
93.4¢/ $1
WAGE / INCOME GAP [ $ ]
$13,690
FAMILY INCOME DEFICIT
0.47
INEQUALITY / GINI INDEX
5,104
TOTAL POPULATION
3,316
MALE POPULATION
1,788
FEMALE POPULATION
185.46
MALES / 100 FEMALES
53.92
FEMALES / 100 MALES
39.2
MEDIAN AGE
2.6
AVG FAMILY SIZE
1.9
AVG HOUSEHOLD SIZE
1,499
LABOR FORCE [ PEOPLE ]
33.0%
PERCENT IN LABOR FORCE
1.8%
UNEMPLOYMENT RATE
Pinckneyville Zip Codes
Pinckneyville Area Codes
Income in Pinckneyville
Income Overview in Pinckneyville
Per Capita Income in Pinckneyville is $18,953, while median incomes of families and households are $63,926 and $36,893 respectively.
| Characteristic | Number | Measure |
| Per Capita Income | 5,104 | $18,953 |
| Median Family Income | 859 | $63,926 |
| Mean Family Income | 859 | $62,640 |
| Median Household Income | 1,583 | $36,893 |
| Mean Household Income | 1,583 | $55,503 |
| Income Deficit | 859 | $13,690 |
| Wage / Income Gap (%) | 5,104 | 6.63% |
| Wage / Income Gap ($) | 5,104 | 93.37¢ per $1 |
| Gini / Inequality Index | 5,104 | 0.47 |
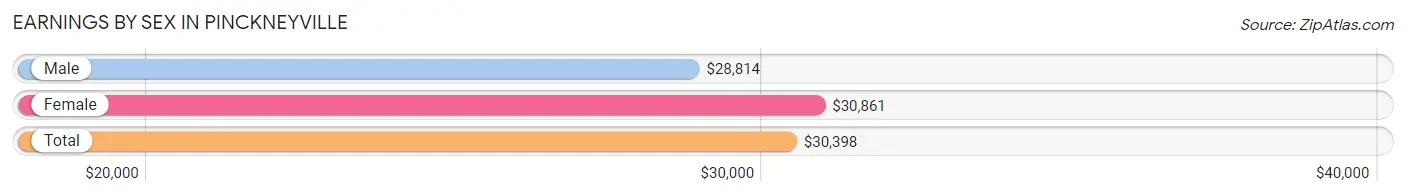
Earnings by Sex in Pinckneyville
Average Earnings in Pinckneyville are $30,398, $28,814 for men and $30,861 for women, a difference of 6.6%.
| Sex | Number | Average Earnings |
| Male | 1,047 (55.8%) | $28,814 |
| Female | 829 (44.2%) | $30,861 |
| Total | 1,876 (100.0%) | $30,398 |
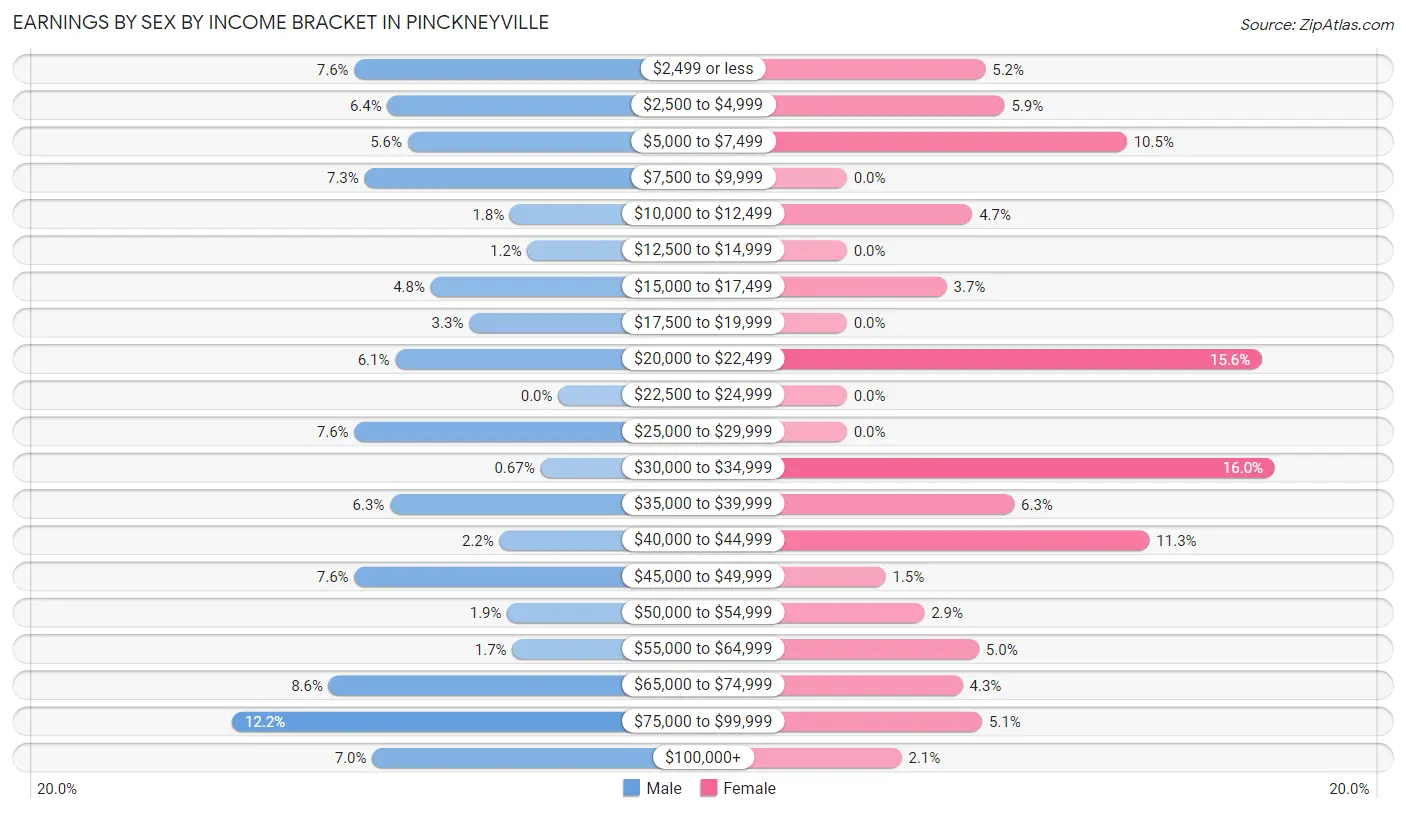
Earnings by Sex by Income Bracket in Pinckneyville
The most common earnings brackets in Pinckneyville are $75,000 to $99,999 for men (128 | 12.2%) and $30,000 to $34,999 for women (133 | 16.0%).
| Income | Male | Female |
| $2,499 or less | 80 (7.6%) | 43 (5.2%) |
| $2,500 to $4,999 | 67 (6.4%) | 49 (5.9%) |
| $5,000 to $7,499 | 59 (5.6%) | 87 (10.5%) |
| $7,500 to $9,999 | 76 (7.3%) | 0 (0.0%) |
| $10,000 to $12,499 | 19 (1.8%) | 39 (4.7%) |
| $12,500 to $14,999 | 12 (1.1%) | 0 (0.0%) |
| $15,000 to $17,499 | 50 (4.8%) | 31 (3.7%) |
| $17,500 to $19,999 | 35 (3.3%) | 0 (0.0%) |
| $20,000 to $22,499 | 64 (6.1%) | 129 (15.6%) |
| $22,500 to $24,999 | 0 (0.0%) | 0 (0.0%) |
| $25,000 to $29,999 | 80 (7.6%) | 0 (0.0%) |
| $30,000 to $34,999 | 7 (0.7%) | 133 (16.0%) |
| $35,000 to $39,999 | 66 (6.3%) | 52 (6.3%) |
| $40,000 to $44,999 | 23 (2.2%) | 94 (11.3%) |
| $45,000 to $49,999 | 80 (7.6%) | 12 (1.5%) |
| $50,000 to $54,999 | 20 (1.9%) | 24 (2.9%) |
| $55,000 to $64,999 | 18 (1.7%) | 41 (5.0%) |
| $65,000 to $74,999 | 90 (8.6%) | 36 (4.3%) |
| $75,000 to $99,999 | 128 (12.2%) | 42 (5.1%) |
| $100,000+ | 73 (7.0%) | 17 (2.1%) |
| Total | 1,047 (100.0%) | 829 (100.0%) |
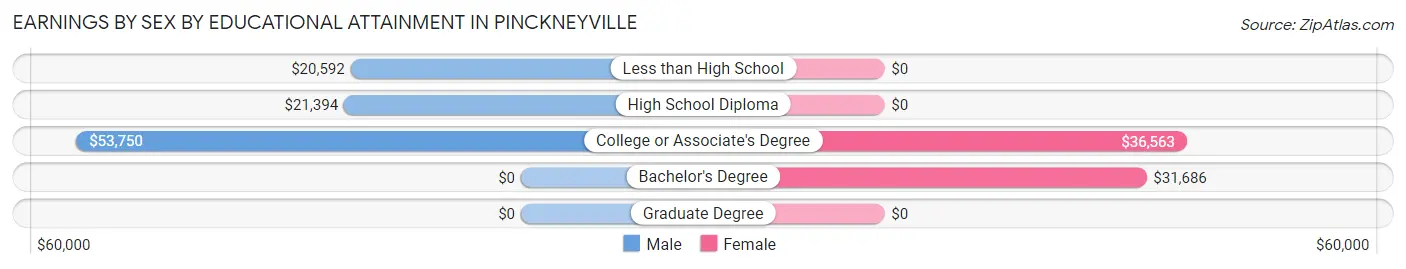
Earnings by Sex by Educational Attainment in Pinckneyville
Average earnings in Pinckneyville are $35,852 for men and $32,123 for women, a difference of 10.4%. Men with an educational attainment of college or associate's degree enjoy the highest average annual earnings of $53,750, while those with less than high school education earn the least with $20,592. Women with an educational attainment of college or associate's degree earn the most with the average annual earnings of $36,563, while those with bachelor's degree education have the smallest earnings of $31,686.
| Educational Attainment | Male Income | Female Income |
| Less than High School | $20,592 | $0 |
| High School Diploma | $21,394 | $0 |
| College or Associate's Degree | $53,750 | $36,563 |
| Bachelor's Degree | - | - |
| Graduate Degree | - | - |
| Total | $35,852 | $32,123 |
Family Income in Pinckneyville
Family Income Brackets in Pinckneyville
According to the Pinckneyville family income data, there are 273 families falling into the $50,000 to $74,999 income range, which is the most common income bracket and makes up 31.8% of all families.
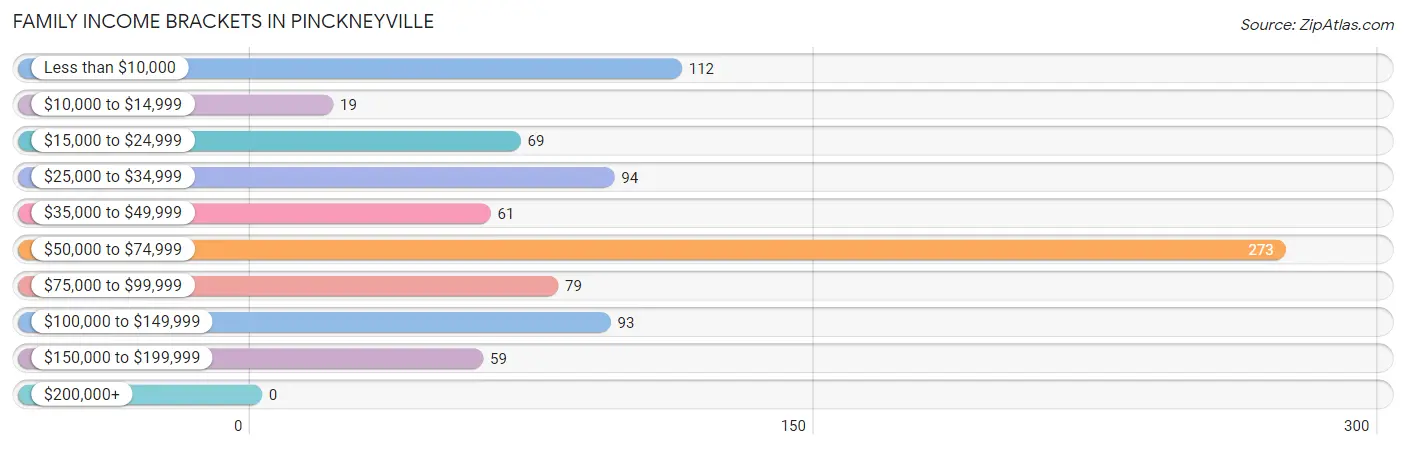
| Income Bracket | # Families | % Families |
| Less than $10,000 | 112 | 13.0% |
| $10,000 to $14,999 | 19 | 2.2% |
| $15,000 to $24,999 | 69 | 8.0% |
| $25,000 to $34,999 | 94 | 10.9% |
| $35,000 to $49,999 | 61 | 7.1% |
| $50,000 to $74,999 | 273 | 31.8% |
| $75,000 to $99,999 | 79 | 9.2% |
| $100,000 to $149,999 | 93 | 10.8% |
| $150,000 to $199,999 | 59 | 6.9% |
| $200,000+ | 0 | 0.0% |
Family Income by Famaliy Size in Pinckneyville
4-person families (100 | 11.6%) account for the highest median family income in Pinckneyville with $75,270 per family, while 2-person families (459 | 53.4%) have the highest median income of $24,818 per family member.
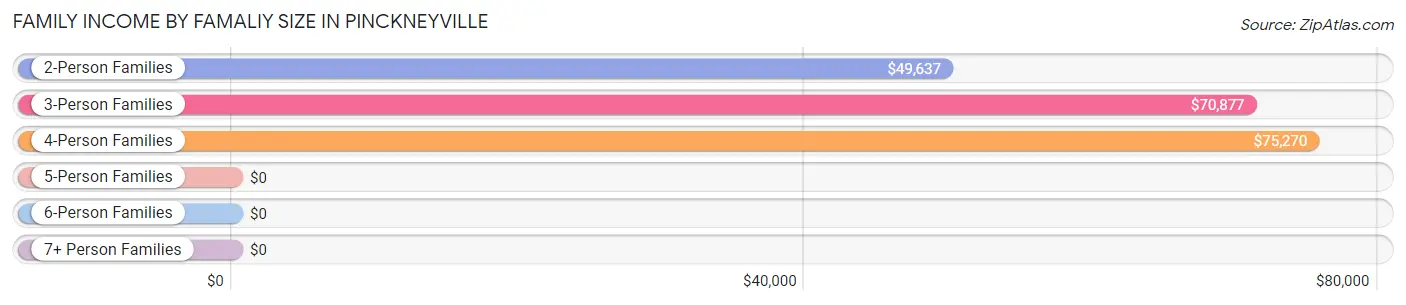
| Income Bracket | # Families | Median Income |
| 2-Person Families | 459 (53.4%) | $49,637 |
| 3-Person Families | 283 (33.0%) | $70,877 |
| 4-Person Families | 100 (11.6%) | $75,270 |
| 5-Person Families | 17 (2.0%) | $0 |
| 6-Person Families | 0 (0.0%) | $0 |
| 7+ Person Families | 0 (0.0%) | $0 |
| Total | 859 (100.0%) | $63,926 |
Family Income by Number of Earners in Pinckneyville
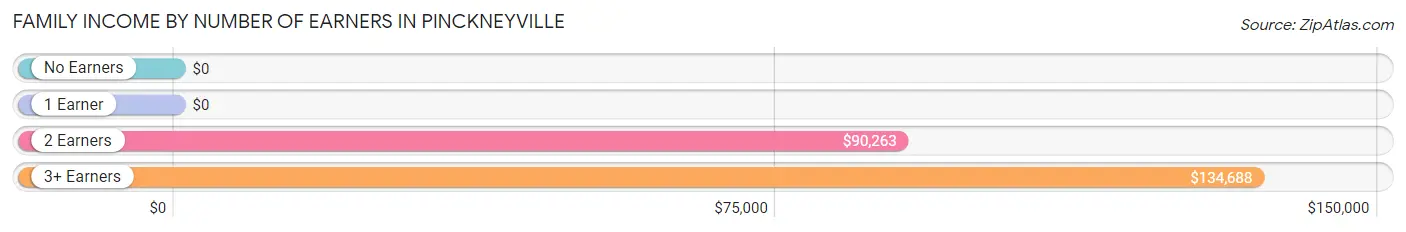
| Number of Earners | # Families | Median Income |
| No Earners | 293 (34.1%) | $0 |
| 1 Earner | 282 (32.8%) | $0 |
| 2 Earners | 134 (15.6%) | $90,263 |
| 3+ Earners | 150 (17.5%) | $134,688 |
| Total | 859 (100.0%) | $63,926 |
Household Income in Pinckneyville
Household Income Brackets in Pinckneyville
With 375 households falling in the category, the $50,000 to $74,999 income range is the most frequent in Pinckneyville, accounting for 23.7% of all households. In contrast, only 59 households (3.7%) fall into the $150,000 to $199,999 income bracket, making it the least populous group.
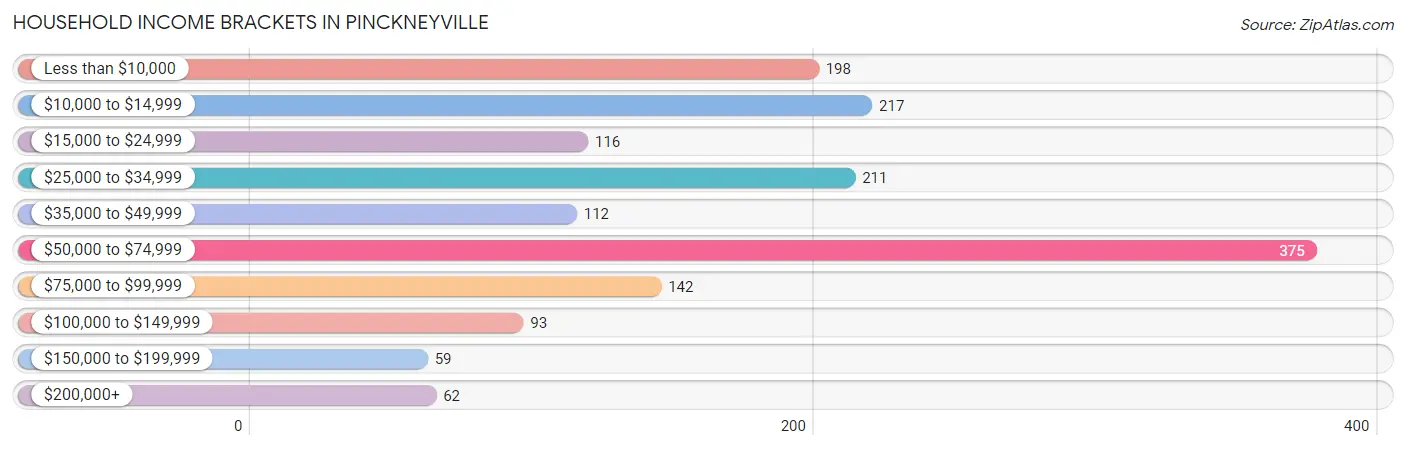
| Income Bracket | # Households | % Households |
| Less than $10,000 | 198 | 12.5% |
| $10,000 to $14,999 | 217 | 13.7% |
| $15,000 to $24,999 | 116 | 7.3% |
| $25,000 to $34,999 | 211 | 13.3% |
| $35,000 to $49,999 | 112 | 7.1% |
| $50,000 to $74,999 | 375 | 23.7% |
| $75,000 to $99,999 | 142 | 9.0% |
| $100,000 to $149,999 | 93 | 5.9% |
| $150,000 to $199,999 | 59 | 3.7% |
| $200,000+ | 62 | 3.9% |
Household Income by Householder Age in Pinckneyville
The median household income in Pinckneyville is $36,893, with the highest median household income of $65,370 found in the 25 to 44 years age bracket for the primary householder. A total of 548 households (34.6%) fall into this category. Meanwhile, the 15 to 24 years age bracket for the primary householder has the lowest median household income of $0, with 23 households (1.5%) in this group.
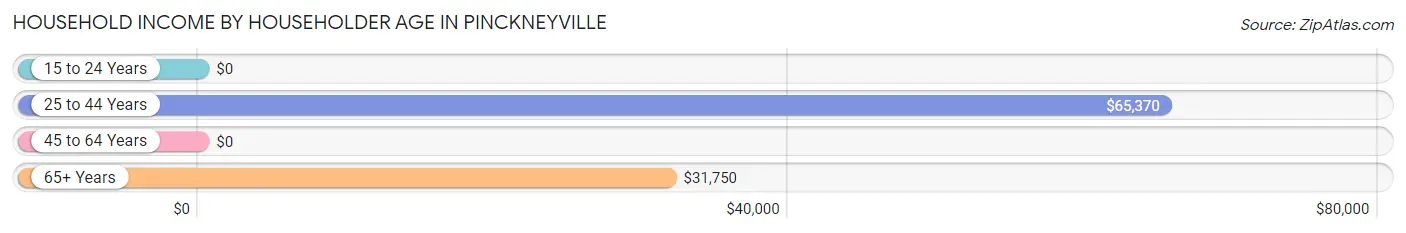
| Income Bracket | # Households | Median Income |
| 15 to 24 Years | 23 (1.5%) | $0 |
| 25 to 44 Years | 548 (34.6%) | $65,370 |
| 45 to 64 Years | 594 (37.5%) | $0 |
| 65+ Years | 418 (26.4%) | $31,750 |
| Total | 1,583 (100.0%) | $36,893 |
Poverty in Pinckneyville
Income Below Poverty by Sex and Age in Pinckneyville
With 20.6% poverty level for males and 20.1% for females among the residents of Pinckneyville, under 5 year old males and under 5 year old females are the most vulnerable to poverty, with 79 males (63.2%) and 15 females (51.7%) in their respective age groups living below the poverty level.
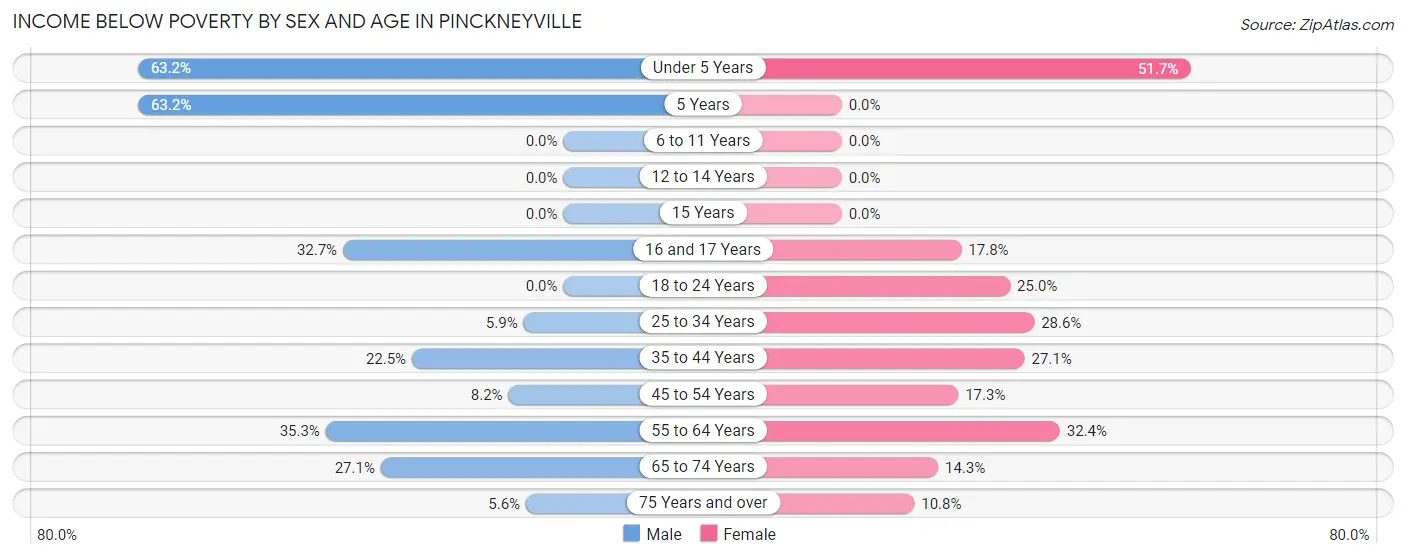
| Age Bracket | Male | Female |
| Under 5 Years | 79 (63.2%) | 15 (51.7%) |
| 5 Years | 36 (63.2%) | 0 (0.0%) |
| 6 to 11 Years | 0 (0.0%) | 0 (0.0%) |
| 12 to 14 Years | 0 (0.0%) | 0 (0.0%) |
| 15 Years | 0 (0.0%) | 0 (0.0%) |
| 16 and 17 Years | 18 (32.7%) | 19 (17.8%) |
| 18 to 24 Years | 0 (0.0%) | 30 (25.0%) |
| 25 to 34 Years | 17 (5.9%) | 50 (28.6%) |
| 35 to 44 Years | 29 (22.5%) | 54 (27.1%) |
| 45 to 54 Years | 20 (8.2%) | 37 (17.3%) |
| 55 to 64 Years | 18 (35.3%) | 91 (32.4%) |
| 65 to 74 Years | 64 (27.1%) | 29 (14.3%) |
| 75 Years and over | 2 (5.6%) | 17 (10.8%) |
| Total | 283 (20.6%) | 342 (20.1%) |
Income Above Poverty by Sex and Age in Pinckneyville
According to the poverty statistics in Pinckneyville, males aged 6 to 11 years and females aged 5 years are the age groups that are most secure financially, with 100.0% of males and 100.0% of females in these age groups living above the poverty line.
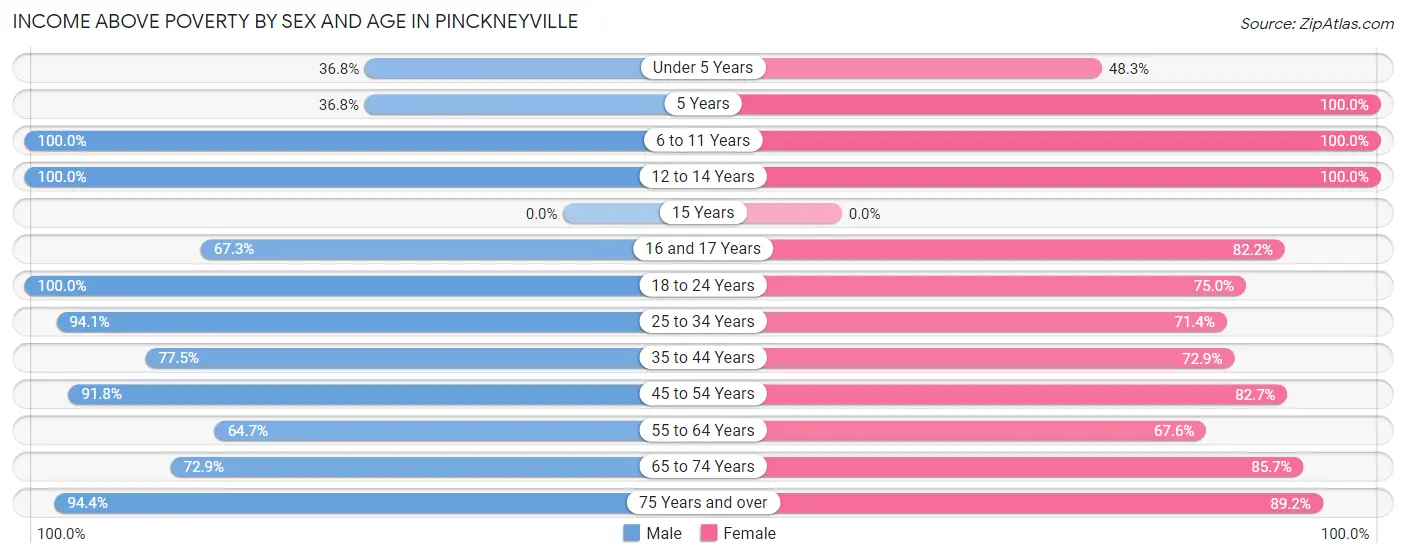
| Age Bracket | Male | Female |
| Under 5 Years | 46 (36.8%) | 14 (48.3%) |
| 5 Years | 21 (36.8%) | 27 (100.0%) |
| 6 to 11 Years | 91 (100.0%) | 142 (100.0%) |
| 12 to 14 Years | 43 (100.0%) | 47 (100.0%) |
| 15 Years | 0 (0.0%) | 0 (0.0%) |
| 16 and 17 Years | 37 (67.3%) | 88 (82.2%) |
| 18 to 24 Years | 21 (100.0%) | 90 (75.0%) |
| 25 to 34 Years | 270 (94.1%) | 125 (71.4%) |
| 35 to 44 Years | 100 (77.5%) | 145 (72.9%) |
| 45 to 54 Years | 225 (91.8%) | 177 (82.7%) |
| 55 to 64 Years | 33 (64.7%) | 190 (67.6%) |
| 65 to 74 Years | 172 (72.9%) | 174 (85.7%) |
| 75 Years and over | 34 (94.4%) | 141 (89.2%) |
| Total | 1,093 (79.4%) | 1,360 (79.9%) |
Income Below Poverty Among Married-Couple Families in Pinckneyville
The poverty statistics for married-couple families in Pinckneyville show that 7.1% or 39 of the total 546 families live below the poverty line. Families with no children have the highest poverty rate of 12.1%, comprising of 39 families. On the other hand, families with 1 or 2 children have the lowest poverty rate of 0.0%, which includes 0 families.
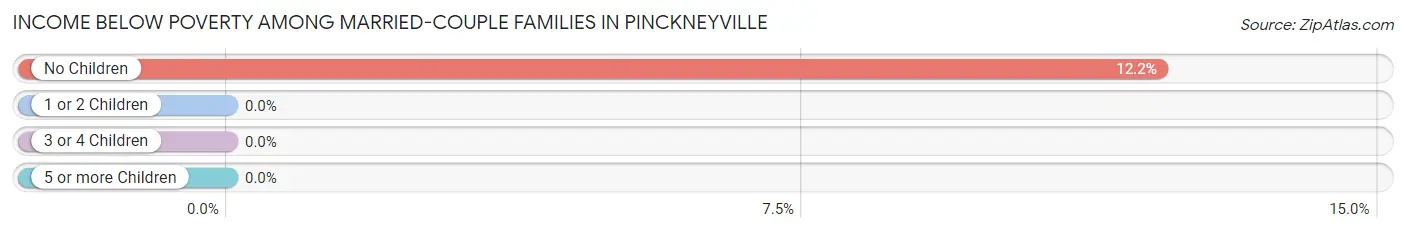
| Children | Above Poverty | Below Poverty |
| No Children | 282 (87.8%) | 39 (12.1%) |
| 1 or 2 Children | 208 (100.0%) | 0 (0.0%) |
| 3 or 4 Children | 17 (100.0%) | 0 (0.0%) |
| 5 or more Children | 0 (0.0%) | 0 (0.0%) |
| Total | 507 (92.9%) | 39 (7.1%) |
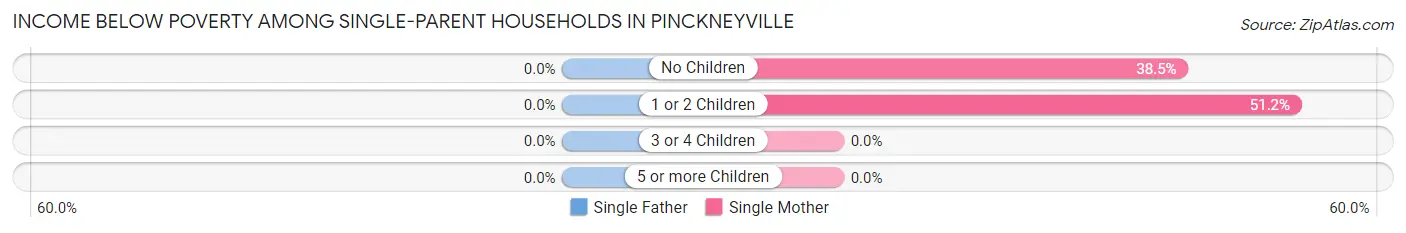
Income Below Poverty Among Single-Parent Households in Pinckneyville
| Children | Single Father | Single Mother |
| No Children | 0 (0.0%) | 42 (38.5%) |
| 1 or 2 Children | 0 (0.0%) | 64 (51.2%) |
| 3 or 4 Children | 0 (0.0%) | 0 (0.0%) |
| 5 or more Children | 0 (0.0%) | 0 (0.0%) |
| Total | 0 (0.0%) | 106 (45.3%) |
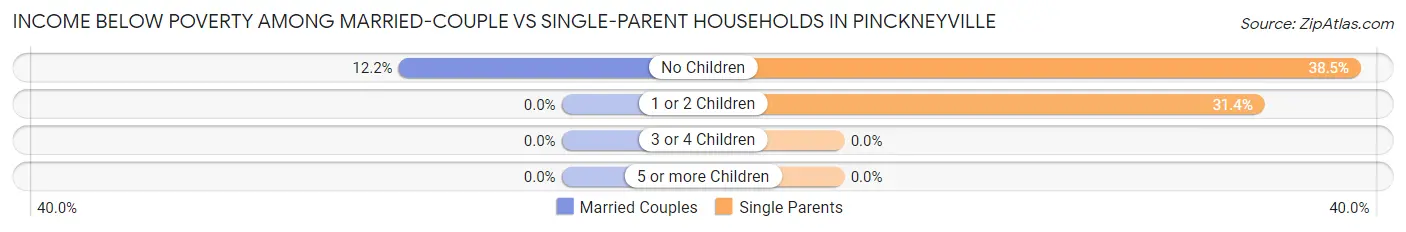
Income Below Poverty Among Married-Couple vs Single-Parent Households in Pinckneyville
The poverty data for Pinckneyville shows that 39 of the married-couple family households (7.1%) and 106 of the single-parent households (33.9%) are living below the poverty level. Within the married-couple family households, those with no children have the highest poverty rate, with 39 households (12.1%) falling below the poverty line. Among the single-parent households, those with no children have the highest poverty rate, with 42 household (38.5%) living below poverty.
| Children | Married-Couple Families | Single-Parent Households |
| No Children | 39 (12.1%) | 42 (38.5%) |
| 1 or 2 Children | 0 (0.0%) | 64 (31.4%) |
| 3 or 4 Children | 0 (0.0%) | 0 (0.0%) |
| 5 or more Children | 0 (0.0%) | 0 (0.0%) |
| Total | 39 (7.1%) | 106 (33.9%) |
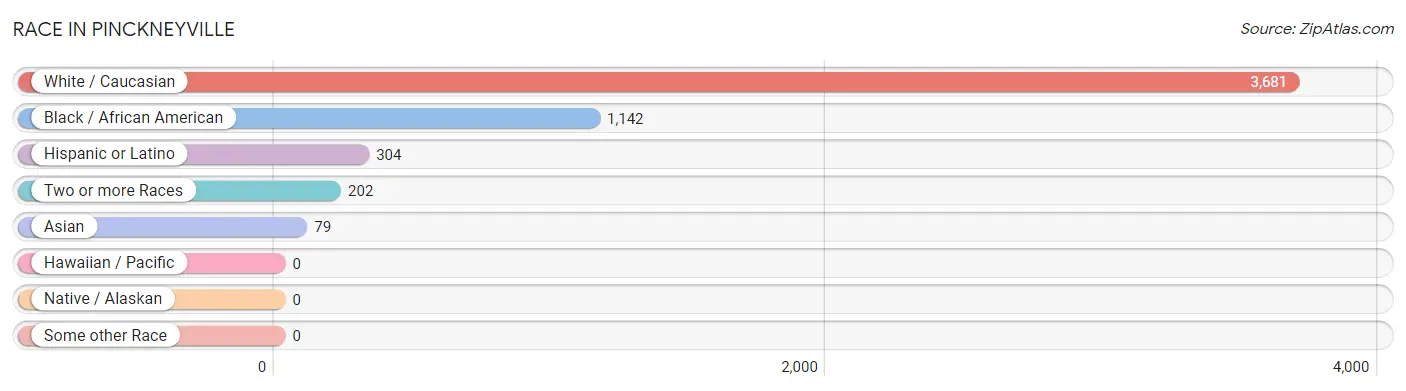
Race in Pinckneyville
The most populous races in Pinckneyville are White / Caucasian (3,681 | 72.1%), Black / African American (1,142 | 22.4%), and Hispanic or Latino (304 | 6.0%).
| Race | # Population | % Population |
| Asian | 79 | 1.5% |
| Black / African American | 1,142 | 22.4% |
| Hawaiian / Pacific | 0 | 0.0% |
| Hispanic or Latino | 304 | 6.0% |
| Native / Alaskan | 0 | 0.0% |
| White / Caucasian | 3,681 | 72.1% |
| Two or more Races | 202 | 4.0% |
| Some other Race | 0 | 0.0% |
| Total | 5,104 | 100.0% |
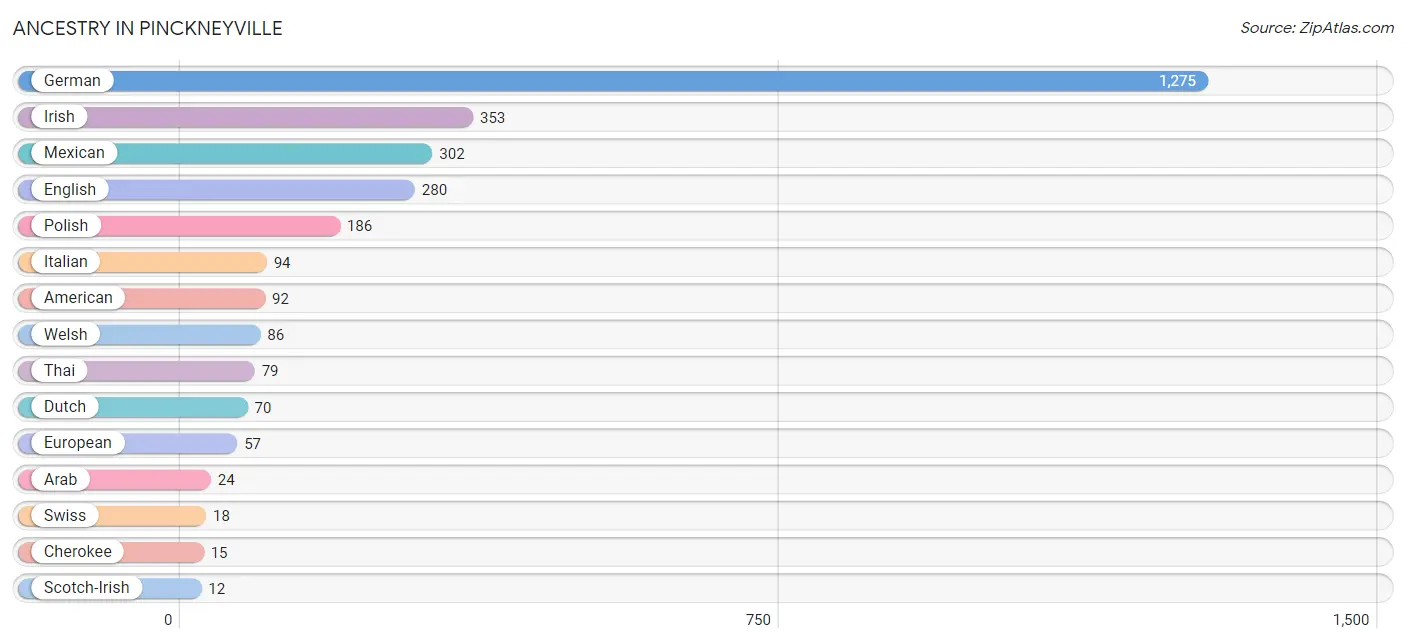
Ancestry in Pinckneyville
The most populous ancestries reported in Pinckneyville are German (1,275 | 25.0%), Irish (353 | 6.9%), Mexican (302 | 5.9%), English (280 | 5.5%), and Polish (186 | 3.6%), together accounting for 46.9% of all Pinckneyville residents.
| Ancestry | # Population | % Population |
| American | 92 | 1.8% |
| Arab | 24 | 0.5% |
| Cherokee | 15 | 0.3% |
| Dutch | 70 | 1.4% |
| English | 280 | 5.5% |
| European | 57 | 1.1% |
| German | 1,275 | 25.0% |
| Greek | 3 | 0.1% |
| Irish | 353 | 6.9% |
| Italian | 94 | 1.8% |
| Mexican | 302 | 5.9% |
| Polish | 186 | 3.6% |
| Puerto Rican | 2 | 0.0% |
| Scotch-Irish | 12 | 0.2% |
| Swiss | 18 | 0.4% |
| Thai | 79 | 1.5% |
| Welsh | 86 | 1.7% | View All 17 Rows |
Immigrants in Pinckneyville
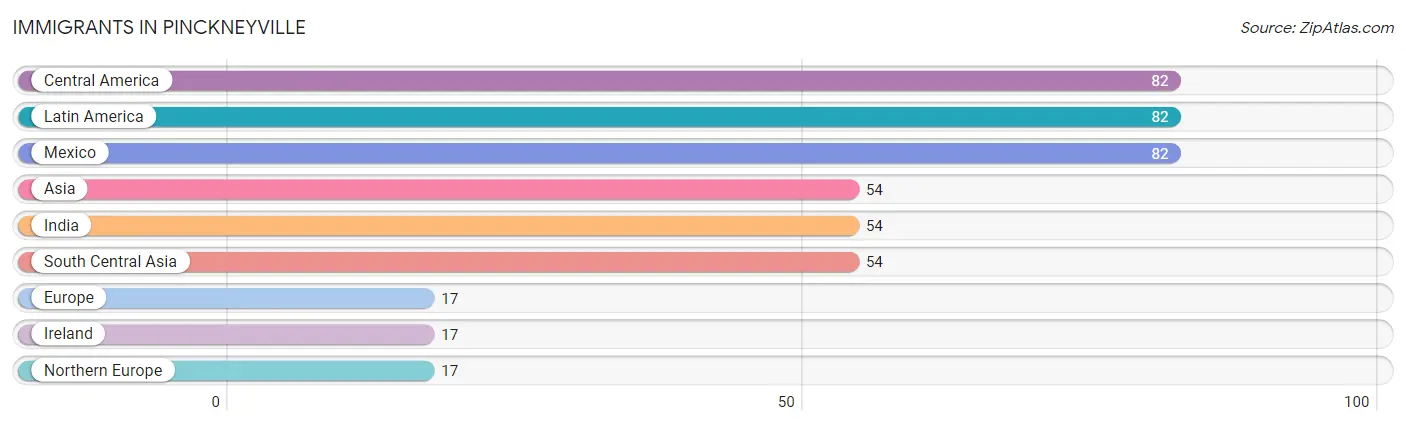
The most numerous immigrant groups reported in Pinckneyville came from Central America (82 | 1.6%), Latin America (82 | 1.6%), Mexico (82 | 1.6%), Asia (54 | 1.1%), and India (54 | 1.1%), together accounting for 6.9% of all Pinckneyville residents.
| Immigration Origin | # Population | % Population |
| Asia | 54 | 1.1% |
| Central America | 82 | 1.6% |
| Europe | 17 | 0.3% |
| India | 54 | 1.1% |
| Ireland | 17 | 0.3% |
| Latin America | 82 | 1.6% |
| Mexico | 82 | 1.6% |
| Northern Europe | 17 | 0.3% |
| South Central Asia | 54 | 1.1% | View All 9 Rows |
Sex and Age in Pinckneyville
Sex and Age in Pinckneyville
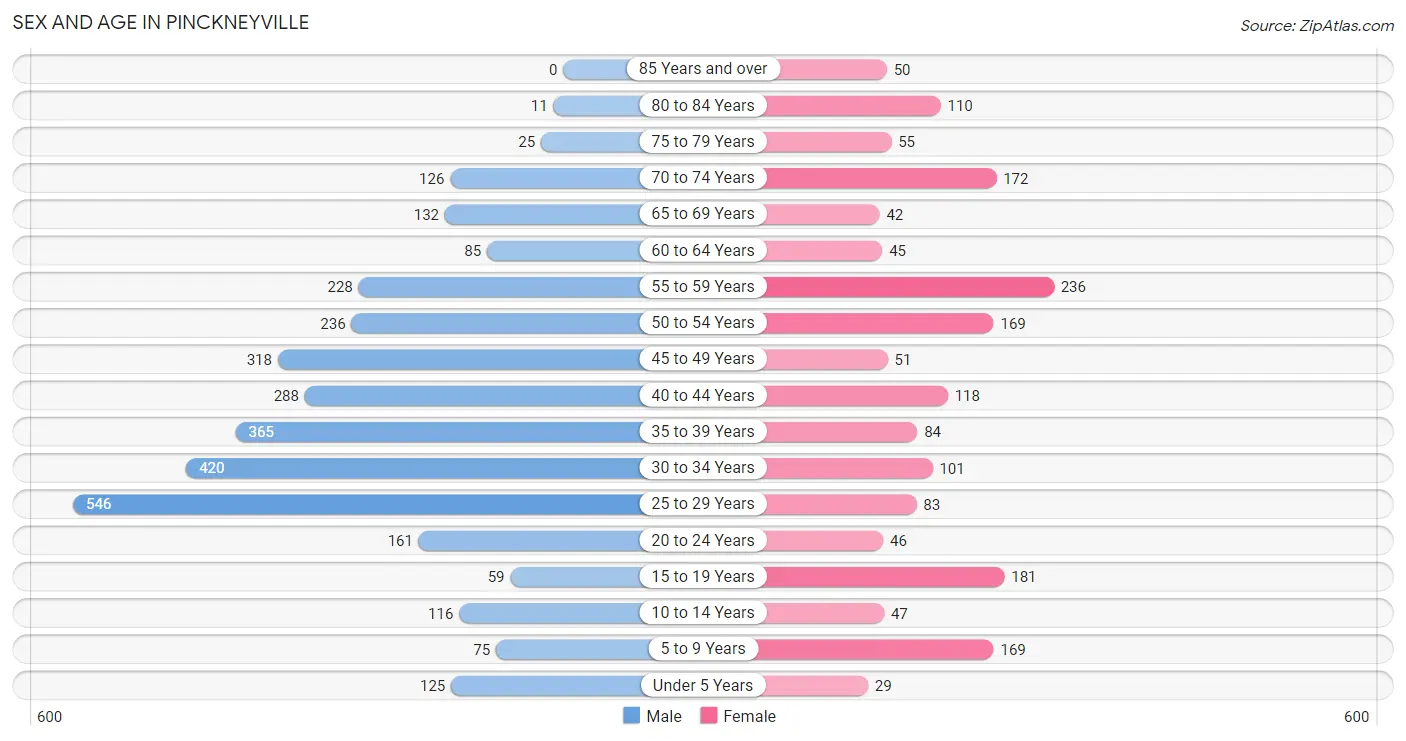
The most populous age groups in Pinckneyville are 25 to 29 Years (546 | 16.5%) for men and 55 to 59 Years (236 | 13.2%) for women.
| Age Bracket | Male | Female |
| Under 5 Years | 125 (3.8%) | 29 (1.6%) |
| 5 to 9 Years | 75 (2.3%) | 169 (9.5%) |
| 10 to 14 Years | 116 (3.5%) | 47 (2.6%) |
| 15 to 19 Years | 59 (1.8%) | 181 (10.1%) |
| 20 to 24 Years | 161 (4.9%) | 46 (2.6%) |
| 25 to 29 Years | 546 (16.5%) | 83 (4.6%) |
| 30 to 34 Years | 420 (12.7%) | 101 (5.7%) |
| 35 to 39 Years | 365 (11.0%) | 84 (4.7%) |
| 40 to 44 Years | 288 (8.7%) | 118 (6.6%) |
| 45 to 49 Years | 318 (9.6%) | 51 (2.9%) |
| 50 to 54 Years | 236 (7.1%) | 169 (9.5%) |
| 55 to 59 Years | 228 (6.9%) | 236 (13.2%) |
| 60 to 64 Years | 85 (2.6%) | 45 (2.5%) |
| 65 to 69 Years | 132 (4.0%) | 42 (2.4%) |
| 70 to 74 Years | 126 (3.8%) | 172 (9.6%) |
| 75 to 79 Years | 25 (0.7%) | 55 (3.1%) |
| 80 to 84 Years | 11 (0.3%) | 110 (6.1%) |
| 85 Years and over | 0 (0.0%) | 50 (2.8%) |
| Total | 3,316 (100.0%) | 1,788 (100.0%) |
Families and Households in Pinckneyville
Median Family Size in Pinckneyville
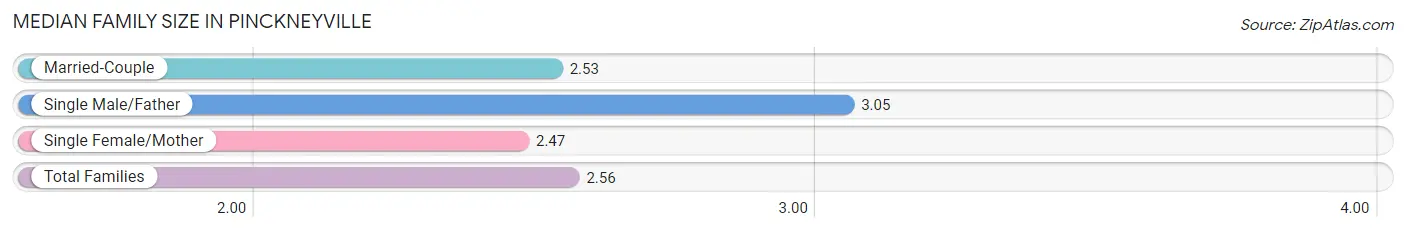
The median family size in Pinckneyville is 2.56 persons per family, with single male/father families (79 | 9.2%) accounting for the largest median family size of 3.05 persons per family. On the other hand, single female/mother families (234 | 27.2%) represent the smallest median family size with 2.47 persons per family.
| Family Type | # Families | Family Size |
| Married-Couple | 546 (63.6%) | 2.53 |
| Single Male/Father | 79 (9.2%) | 3.05 |
| Single Female/Mother | 234 (27.2%) | 2.47 |
| Total Families | 859 (100.0%) | 2.56 |
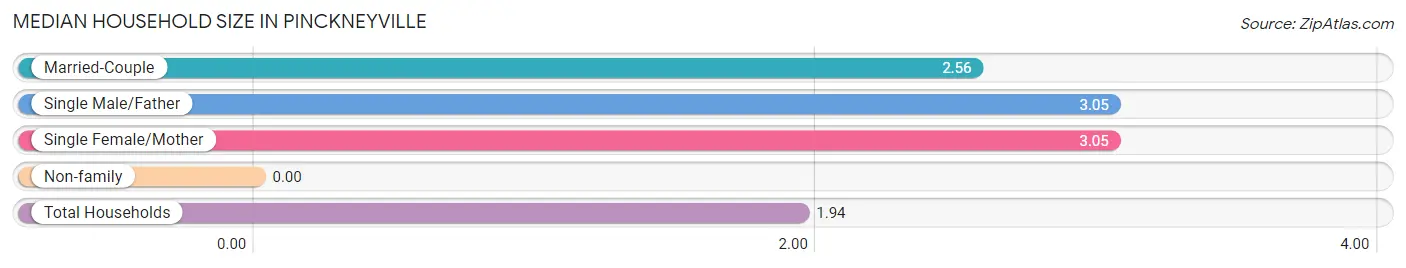
Median Household Size in Pinckneyville
| Household Type | # Households | Household Size |
| Married-Couple | 546 (34.5%) | 2.56 |
| Single Male/Father | 79 (5.0%) | 3.05 |
| Single Female/Mother | 234 (14.8%) | 3.05 |
| Non-family | 724 (45.7%) | - |
| Total Households | 1,583 (100.0%) | 1.94 |
Household Size by Marriage Status in Pinckneyville
Out of a total of 1,583 households in Pinckneyville, 859 (54.3%) are family households, while 724 (45.7%) are nonfamily households. The most numerous type of family households are 2-person households, comprising 387, and the most common type of nonfamily households are 1-person households, comprising 724.
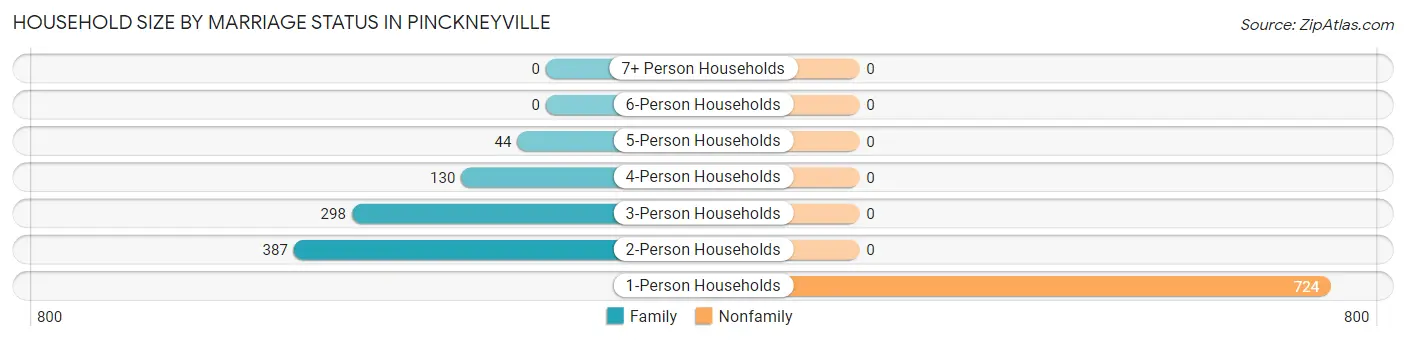
| Household Size | Family Households | Nonfamily Households |
| 1-Person Households | - | 724 (45.7%) |
| 2-Person Households | 387 (24.4%) | 0 (0.0%) |
| 3-Person Households | 298 (18.8%) | 0 (0.0%) |
| 4-Person Households | 130 (8.2%) | 0 (0.0%) |
| 5-Person Households | 44 (2.8%) | 0 (0.0%) |
| 6-Person Households | 0 (0.0%) | 0 (0.0%) |
| 7+ Person Households | 0 (0.0%) | 0 (0.0%) |
| Total | 859 (54.3%) | 724 (45.7%) |
Female Fertility in Pinckneyville
Fertility by Age in Pinckneyville
Average fertility rate in Pinckneyville is 146.0 births per 1,000 women. Women in the age bracket of 20 to 34 years have the highest fertility rate with 335.0 births per 1,000 women. Women in the age bracket of 20 to 34 years acount for 79.4% of all women with births.
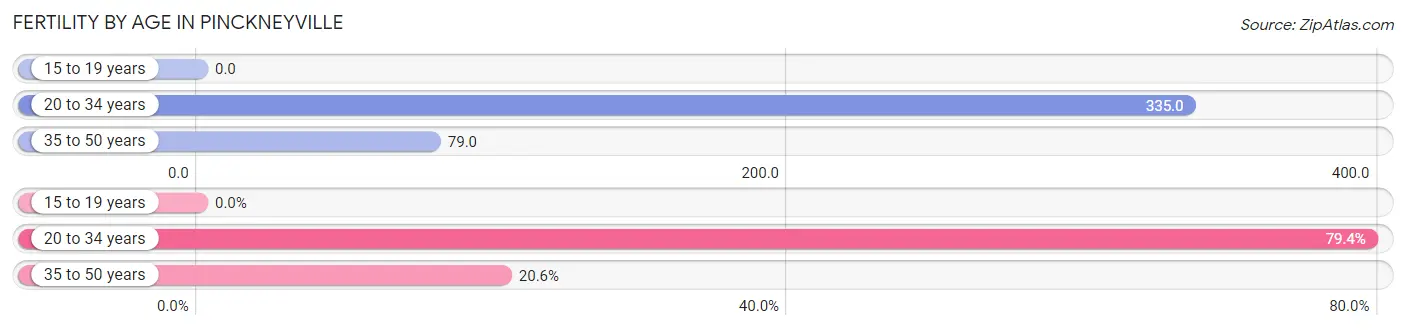
| Age Bracket | Women with Births | Births / 1,000 Women |
| 15 to 19 years | 0 (0.0%) | 0.0 |
| 20 to 34 years | 77 (79.4%) | 335.0 |
| 35 to 50 years | 20 (20.6%) | 79.0 |
| Total | 97 (100.0%) | 146.0 |
Fertility by Age by Marriage Status in Pinckneyville
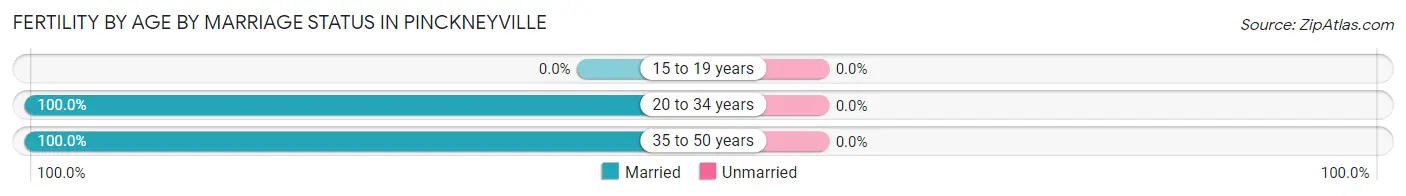
| Age Bracket | Married | Unmarried |
| 15 to 19 years | 0 (0.0%) | 0 (0.0%) |
| 20 to 34 years | 77 (100.0%) | 0 (0.0%) |
| 35 to 50 years | 20 (100.0%) | 0 (0.0%) |
| Total | 97 (100.0%) | 0 (0.0%) |
Fertility by Education in Pinckneyville
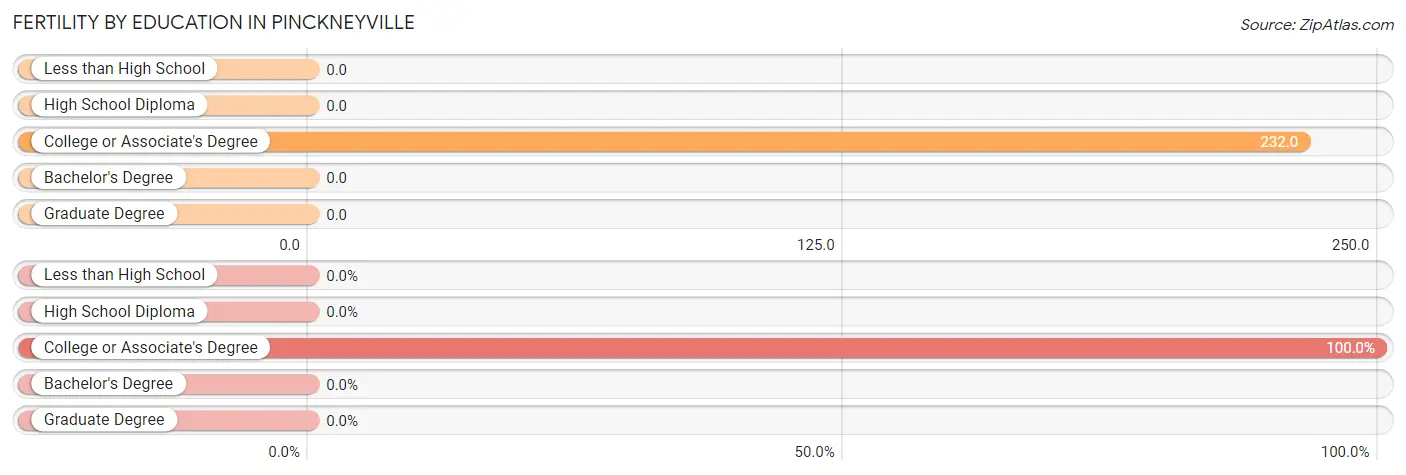
| Educational Attainment | Women with Births | Births / 1,000 Women |
| Less than High School | 0 (0.0%) | 0.0 |
| High School Diploma | 0 (0.0%) | 0.0 |
| College or Associate's Degree | 97 (100.0%) | 232.0 |
| Bachelor's Degree | 0 (0.0%) | 0.0 |
| Graduate Degree | 0 (0.0%) | 0.0 |
| Total | 97 (100.0%) | 146.0 |
Fertility by Education by Marriage Status in Pinckneyville
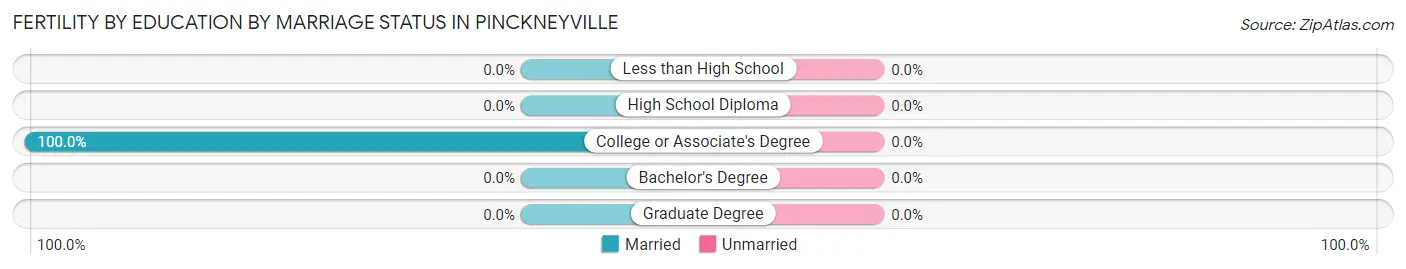
| Educational Attainment | Married | Unmarried |
| Less than High School | 0 (0.0%) | 0 (0.0%) |
| High School Diploma | 0 (0.0%) | 0 (0.0%) |
| College or Associate's Degree | 97 (100.0%) | 0 (0.0%) |
| Bachelor's Degree | 0 (0.0%) | 0 (0.0%) |
| Graduate Degree | 0 (0.0%) | 0 (0.0%) |
| Total | 97 (100.0%) | 0 (0.0%) |
Employment Characteristics in Pinckneyville
Employment by Class of Employer in Pinckneyville
Among the 1,474 employed individuals in Pinckneyville, private company employees (725 | 49.2%), not-for-profit organizations (278 | 18.9%), and local government employees (139 | 9.4%) make up the most common classes of employment.
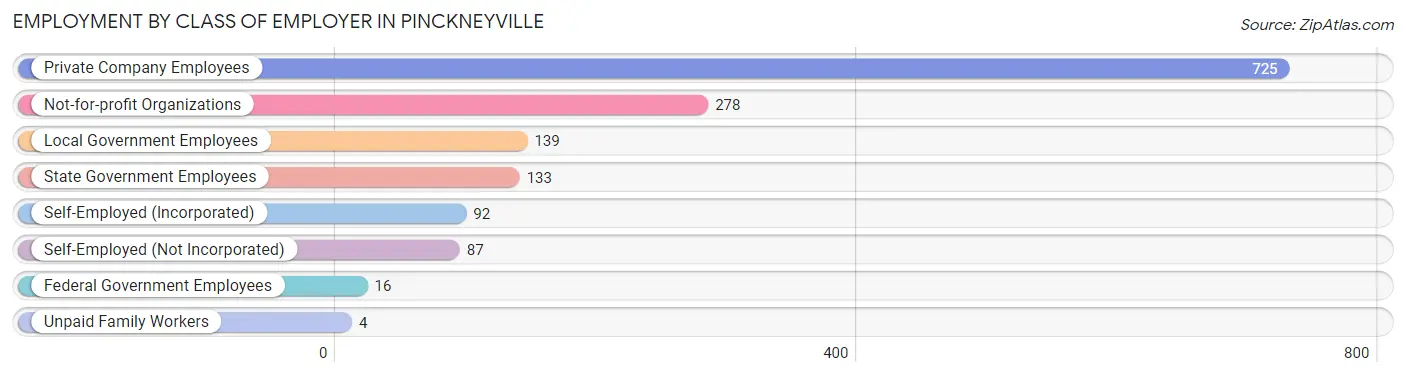
| Employer Class | # Employees | % Employees |
| Private Company Employees | 725 | 49.2% |
| Self-Employed (Incorporated) | 92 | 6.2% |
| Self-Employed (Not Incorporated) | 87 | 5.9% |
| Not-for-profit Organizations | 278 | 18.9% |
| Local Government Employees | 139 | 9.4% |
| State Government Employees | 133 | 9.0% |
| Federal Government Employees | 16 | 1.1% |
| Unpaid Family Workers | 4 | 0.3% |
| Total | 1,474 | 100.0% |
Employment Status by Age in Pinckneyville
According to the labor force statistics for Pinckneyville, out of the total population over 16 years of age (4,543), 33.0% or 1,499 individuals are in the labor force, with 1.8% or 27 of them unemployed. The age group with the highest labor force participation rate is 45 to 54 years, with 54.5% or 422 individuals in the labor force. Within the labor force, the 35 to 44 years age range has the highest percentage of unemployed individuals, with 11.8% or 27 of them being unemployed.
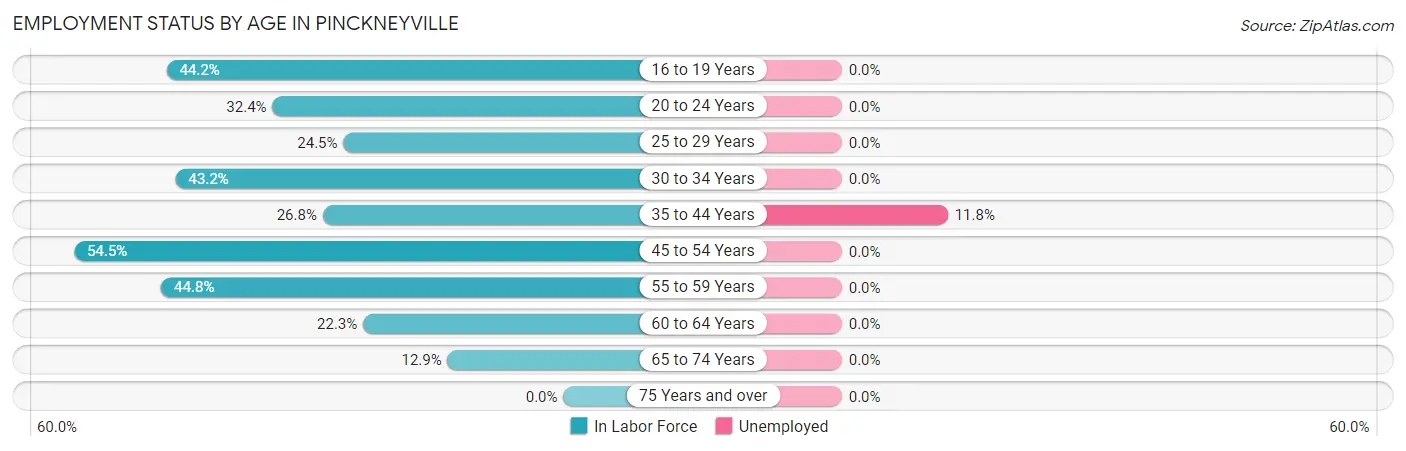
| Age Bracket | In Labor Force | Unemployed |
| 16 to 19 Years | 106 (44.2%) | 0 (0.0%) |
| 20 to 24 Years | 67 (32.4%) | 0 (0.0%) |
| 25 to 29 Years | 154 (24.5%) | 0 (0.0%) |
| 30 to 34 Years | 225 (43.2%) | 0 (0.0%) |
| 35 to 44 Years | 229 (26.8%) | 27 (11.8%) |
| 45 to 54 Years | 422 (54.5%) | 0 (0.0%) |
| 55 to 59 Years | 208 (44.8%) | 0 (0.0%) |
| 60 to 64 Years | 29 (22.3%) | 0 (0.0%) |
| 65 to 74 Years | 61 (12.9%) | 0 (0.0%) |
| 75 Years and over | 0 (0.0%) | 0 (0.0%) |
| Total | 1,499 (33.0%) | 27 (1.8%) |
Employment Status by Educational Attainment in Pinckneyville
According to labor force statistics for Pinckneyville, 37.6% of individuals (1,268) out of the total population between 25 and 64 years of age (3,373) are in the labor force, with 2.1% or 27 of them being unemployed. The group with the highest labor force participation rate are those with the educational attainment of bachelor's degree or higher, with 100.0% or 353 individuals in the labor force. Within the labor force, individuals with bachelor's degree or higher education have the highest percentage of unemployment, with 7.6% or 27 of them being unemployed.
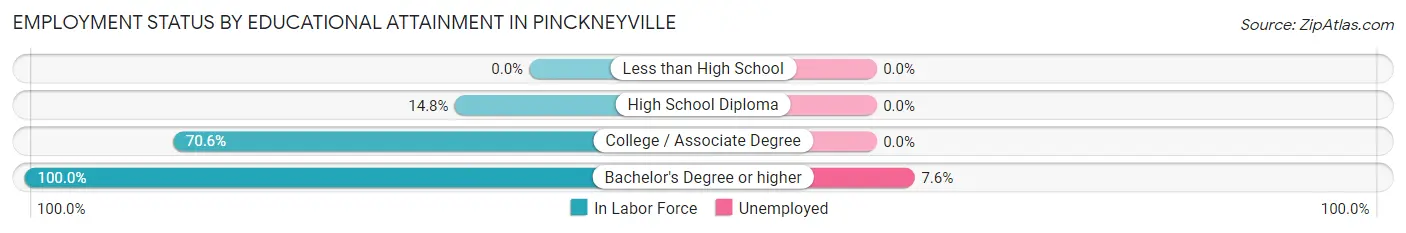
| Educational Attainment | In Labor Force | Unemployed |
| Less than High School | 0 (0.0%) | 0 (0.0%) |
| High School Diploma | 134 (14.8%) | 0 (0.0%) |
| College / Associate Degree | 780 (70.6%) | 0 (0.0%) |
| Bachelor's Degree or higher | 353 (100.0%) | 27 (7.6%) |
| Total | 1,268 (37.6%) | 71 (2.1%) |
Employment Occupations by Sex in Pinckneyville
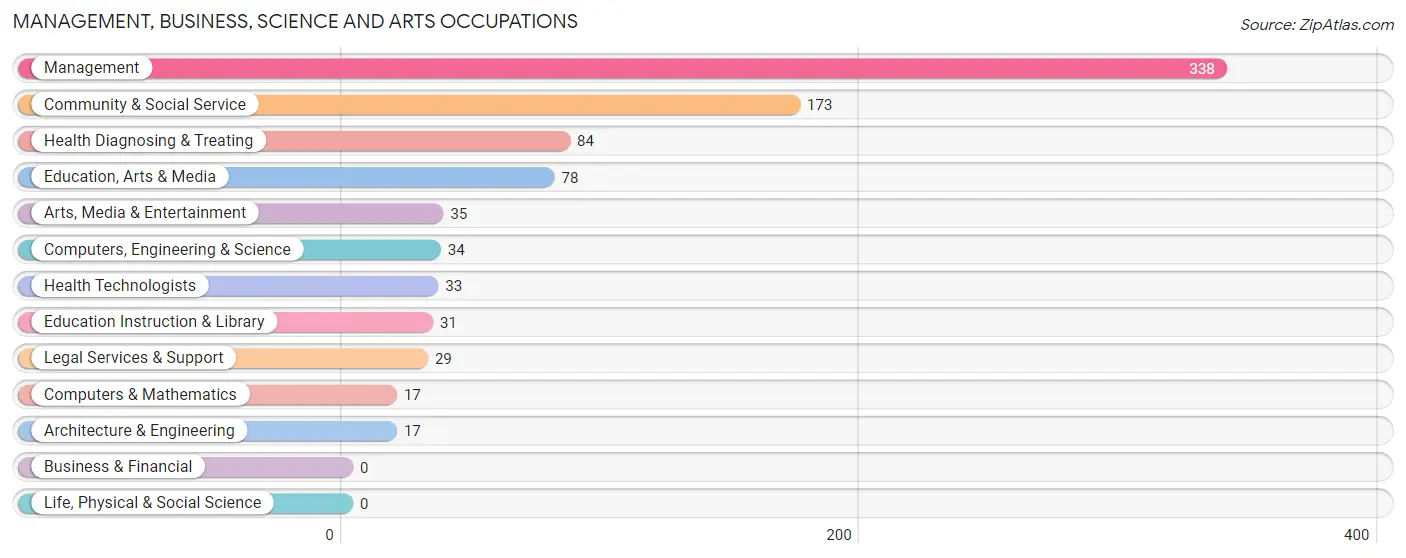
Management, Business, Science and Arts Occupations
The most common Management, Business, Science and Arts occupations in Pinckneyville are Management (338 | 22.9%), Community & Social Service (173 | 11.7%), Health Diagnosing & Treating (84 | 5.7%), Education, Arts & Media (78 | 5.3%), and Arts, Media & Entertainment (35 | 2.4%).
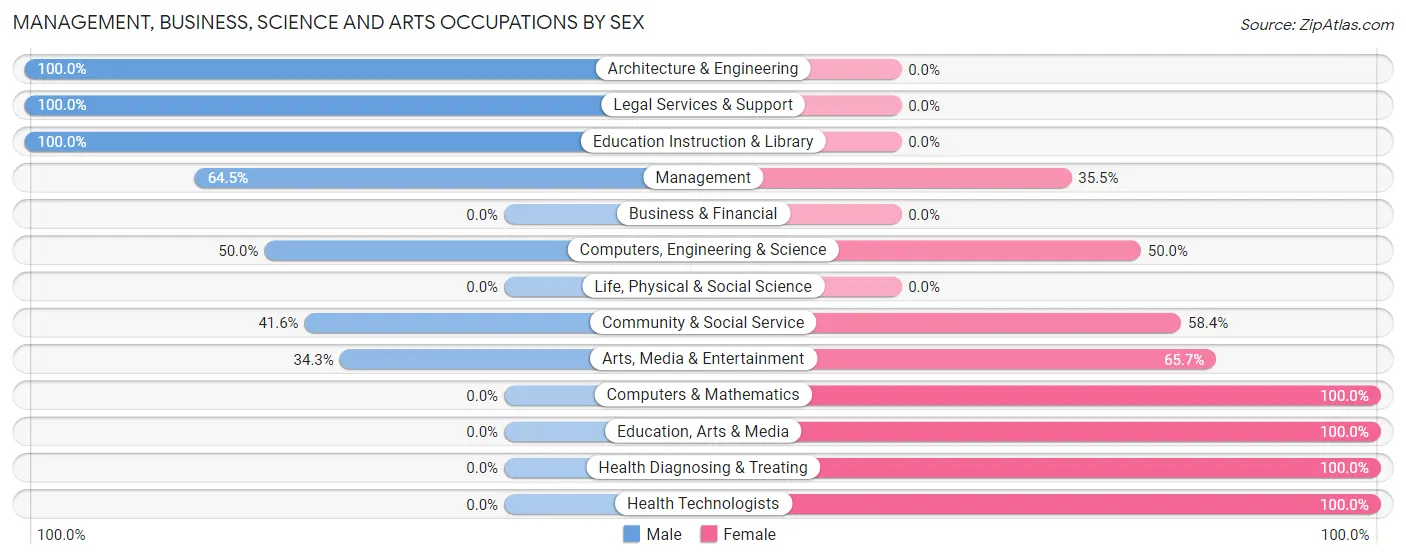
Management, Business, Science and Arts Occupations by Sex
Within the Management, Business, Science and Arts occupations in Pinckneyville, the most male-oriented occupations are Architecture & Engineering (100.0%), Legal Services & Support (100.0%), and Education Instruction & Library (100.0%), while the most female-oriented occupations are Computers & Mathematics (100.0%), Education, Arts & Media (100.0%), and Health Diagnosing & Treating (100.0%).
| Occupation | Male | Female |
| Management | 218 (64.5%) | 120 (35.5%) |
| Business & Financial | 0 (0.0%) | 0 (0.0%) |
| Computers, Engineering & Science | 17 (50.0%) | 17 (50.0%) |
| Computers & Mathematics | 0 (0.0%) | 17 (100.0%) |
| Architecture & Engineering | 17 (100.0%) | 0 (0.0%) |
| Life, Physical & Social Science | 0 (0.0%) | 0 (0.0%) |
| Community & Social Service | 72 (41.6%) | 101 (58.4%) |
| Education, Arts & Media | 0 (0.0%) | 78 (100.0%) |
| Legal Services & Support | 29 (100.0%) | 0 (0.0%) |
| Education Instruction & Library | 31 (100.0%) | 0 (0.0%) |
| Arts, Media & Entertainment | 12 (34.3%) | 23 (65.7%) |
| Health Diagnosing & Treating | 0 (0.0%) | 84 (100.0%) |
| Health Technologists | 0 (0.0%) | 33 (100.0%) |
| Total (Category) | 307 (48.8%) | 322 (51.2%) |
| Total (Overall) | 664 (45.1%) | 810 (54.9%) |
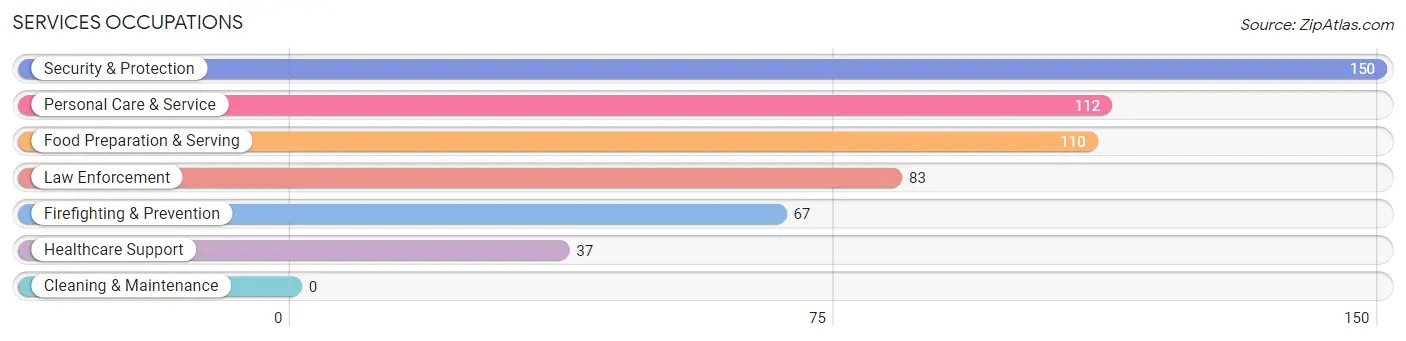
Services Occupations
The most common Services occupations in Pinckneyville are Security & Protection (150 | 10.2%), Personal Care & Service (112 | 7.6%), Food Preparation & Serving (110 | 7.5%), Law Enforcement (83 | 5.6%), and Firefighting & Prevention (67 | 4.5%).
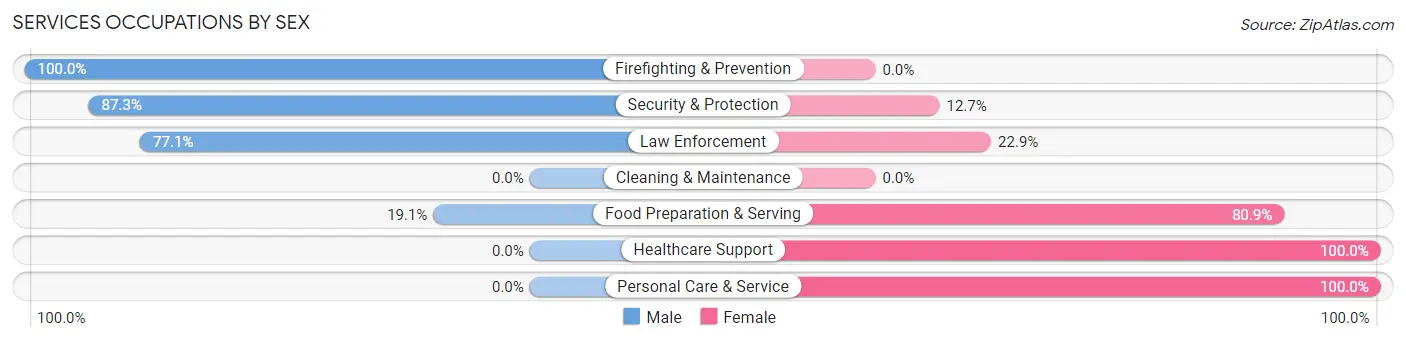
Services Occupations by Sex
Within the Services occupations in Pinckneyville, the most male-oriented occupations are Firefighting & Prevention (100.0%), Security & Protection (87.3%), and Law Enforcement (77.1%), while the most female-oriented occupations are Healthcare Support (100.0%), Personal Care & Service (100.0%), and Food Preparation & Serving (80.9%).
| Occupation | Male | Female |
| Healthcare Support | 0 (0.0%) | 37 (100.0%) |
| Security & Protection | 131 (87.3%) | 19 (12.7%) |
| Firefighting & Prevention | 67 (100.0%) | 0 (0.0%) |
| Law Enforcement | 64 (77.1%) | 19 (22.9%) |
| Food Preparation & Serving | 21 (19.1%) | 89 (80.9%) |
| Cleaning & Maintenance | 0 (0.0%) | 0 (0.0%) |
| Personal Care & Service | 0 (0.0%) | 112 (100.0%) |
| Total (Category) | 152 (37.2%) | 257 (62.8%) |
| Total (Overall) | 664 (45.1%) | 810 (54.9%) |
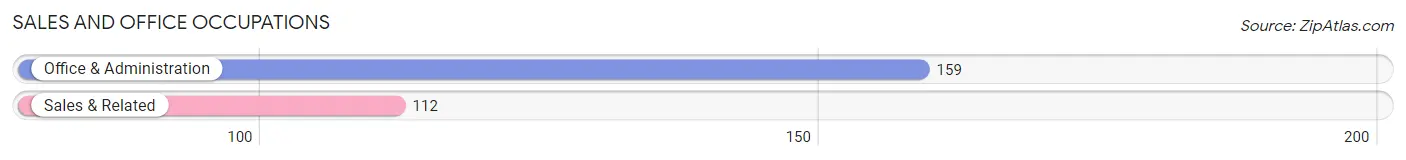
Sales and Office Occupations
The most common Sales and Office occupations in Pinckneyville are Office & Administration (159 | 10.8%), and Sales & Related (112 | 7.6%).
Sales and Office Occupations by Sex
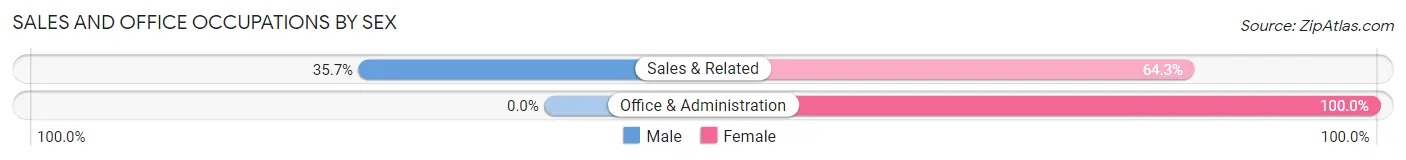
| Occupation | Male | Female |
| Sales & Related | 40 (35.7%) | 72 (64.3%) |
| Office & Administration | 0 (0.0%) | 159 (100.0%) |
| Total (Category) | 40 (14.8%) | 231 (85.2%) |
| Total (Overall) | 664 (45.1%) | 810 (54.9%) |
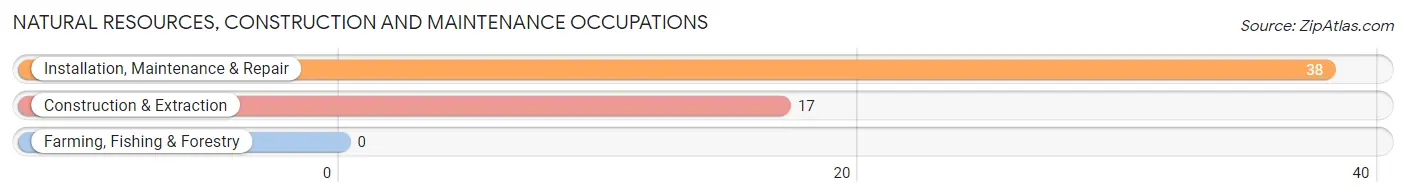
Natural Resources, Construction and Maintenance Occupations
The most common Natural Resources, Construction and Maintenance occupations in Pinckneyville are Installation, Maintenance & Repair (38 | 2.6%), and Construction & Extraction (17 | 1.1%).
Natural Resources, Construction and Maintenance Occupations by Sex
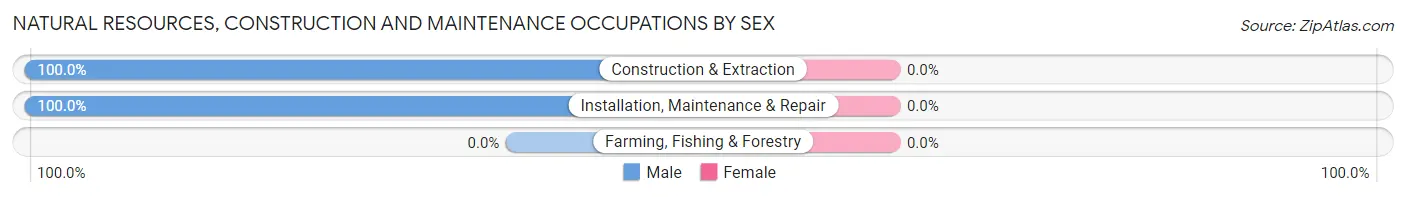
| Occupation | Male | Female |
| Farming, Fishing & Forestry | 0 (0.0%) | 0 (0.0%) |
| Construction & Extraction | 17 (100.0%) | 0 (0.0%) |
| Installation, Maintenance & Repair | 38 (100.0%) | 0 (0.0%) |
| Total (Category) | 55 (100.0%) | 0 (0.0%) |
| Total (Overall) | 664 (45.1%) | 810 (54.9%) |
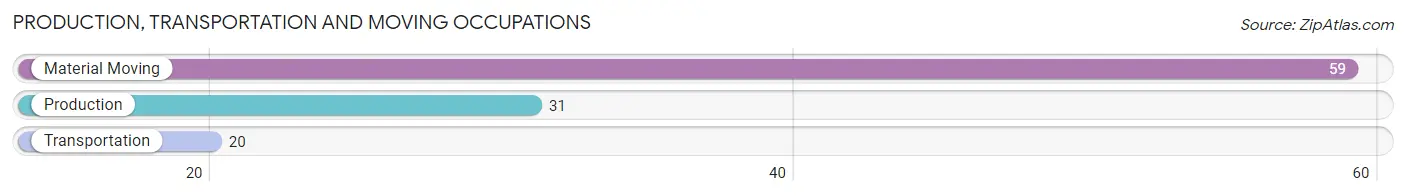
Production, Transportation and Moving Occupations
The most common Production, Transportation and Moving occupations in Pinckneyville are Material Moving (59 | 4.0%), Production (31 | 2.1%), and Transportation (20 | 1.4%).
Production, Transportation and Moving Occupations by Sex
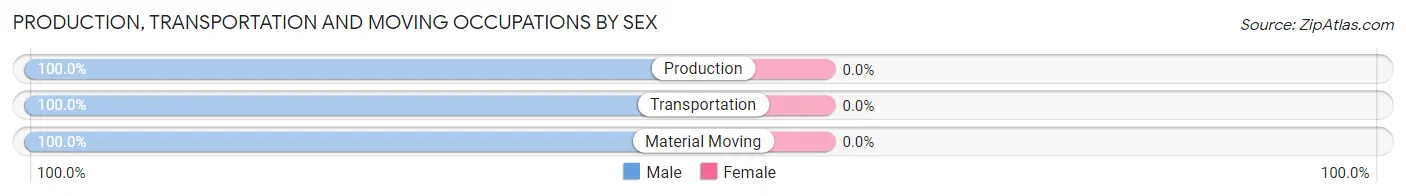
| Occupation | Male | Female |
| Production | 31 (100.0%) | 0 (0.0%) |
| Transportation | 20 (100.0%) | 0 (0.0%) |
| Material Moving | 59 (100.0%) | 0 (0.0%) |
| Total (Category) | 110 (100.0%) | 0 (0.0%) |
| Total (Overall) | 664 (45.1%) | 810 (54.9%) |
Employment Industries by Sex in Pinckneyville
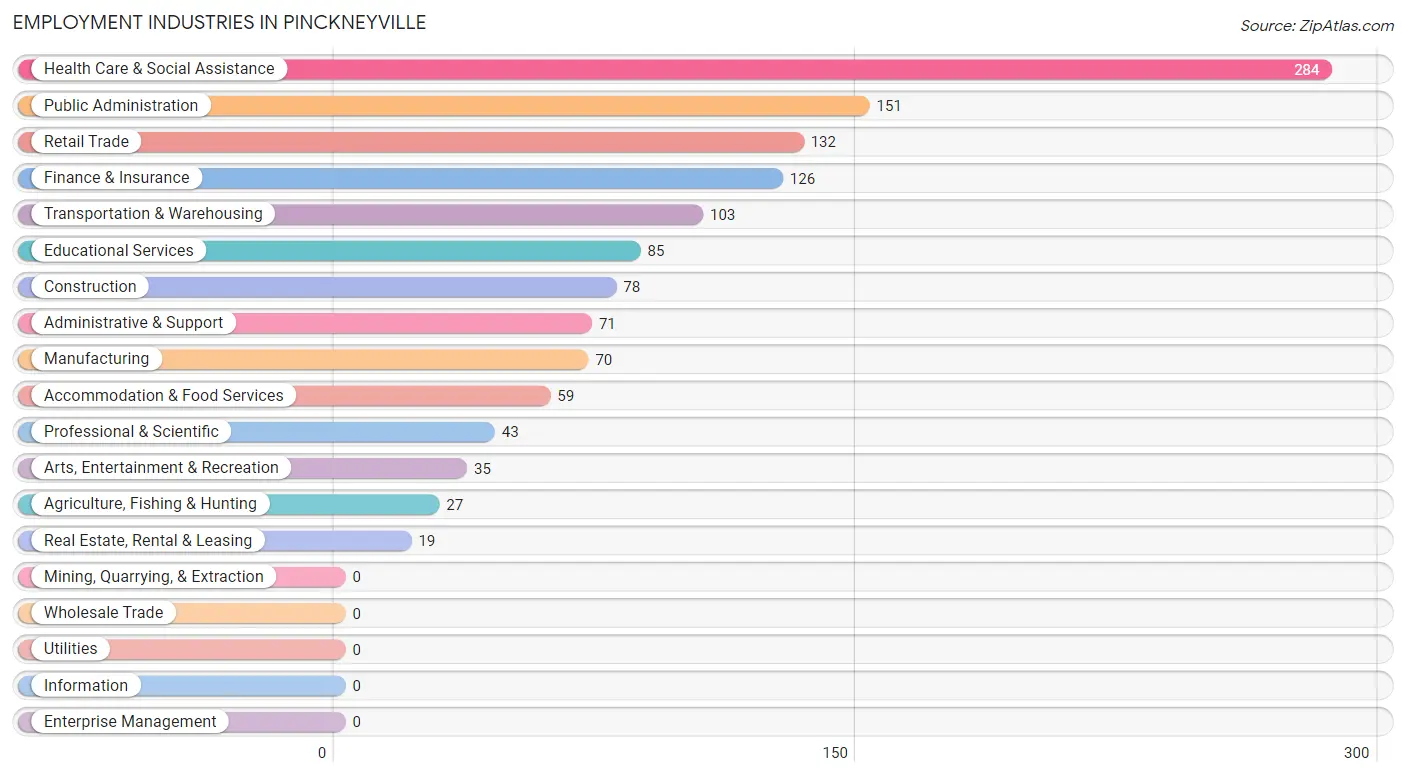
Employment Industries in Pinckneyville
The major employment industries in Pinckneyville include Health Care & Social Assistance (284 | 19.3%), Public Administration (151 | 10.2%), Retail Trade (132 | 9.0%), Finance & Insurance (126 | 8.6%), and Transportation & Warehousing (103 | 7.0%).
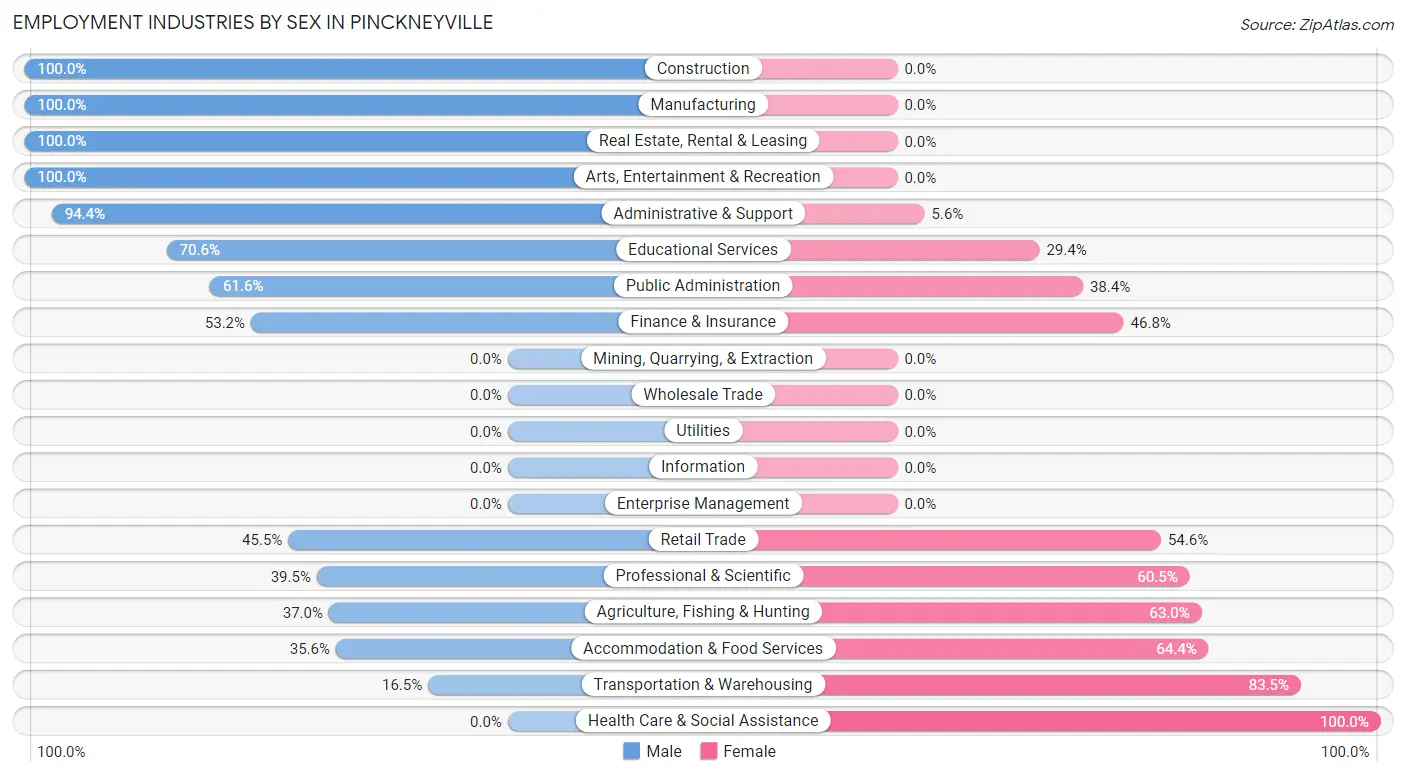
Employment Industries by Sex in Pinckneyville
The Pinckneyville industries that see more men than women are Construction (100.0%), Manufacturing (100.0%), and Real Estate, Rental & Leasing (100.0%), whereas the industries that tend to have a higher number of women are Health Care & Social Assistance (100.0%), Transportation & Warehousing (83.5%), and Accommodation & Food Services (64.4%).
| Industry | Male | Female |
| Agriculture, Fishing & Hunting | 10 (37.0%) | 17 (63.0%) |
| Mining, Quarrying, & Extraction | 0 (0.0%) | 0 (0.0%) |
| Construction | 78 (100.0%) | 0 (0.0%) |
| Manufacturing | 70 (100.0%) | 0 (0.0%) |
| Wholesale Trade | 0 (0.0%) | 0 (0.0%) |
| Retail Trade | 60 (45.5%) | 72 (54.5%) |
| Transportation & Warehousing | 17 (16.5%) | 86 (83.5%) |
| Utilities | 0 (0.0%) | 0 (0.0%) |
| Information | 0 (0.0%) | 0 (0.0%) |
| Finance & Insurance | 67 (53.2%) | 59 (46.8%) |
| Real Estate, Rental & Leasing | 19 (100.0%) | 0 (0.0%) |
| Professional & Scientific | 17 (39.5%) | 26 (60.5%) |
| Enterprise Management | 0 (0.0%) | 0 (0.0%) |
| Administrative & Support | 67 (94.4%) | 4 (5.6%) |
| Educational Services | 60 (70.6%) | 25 (29.4%) |
| Health Care & Social Assistance | 0 (0.0%) | 284 (100.0%) |
| Arts, Entertainment & Recreation | 35 (100.0%) | 0 (0.0%) |
| Accommodation & Food Services | 21 (35.6%) | 38 (64.4%) |
| Public Administration | 93 (61.6%) | 58 (38.4%) |
| Total | 664 (45.1%) | 810 (54.9%) |
Education in Pinckneyville
School Enrollment in Pinckneyville
The most common levels of schooling among the 728 students in Pinckneyville are college / undergraduate (177 | 24.3%), middle school (163 | 22.4%), and elementary school (160 | 22.0%).
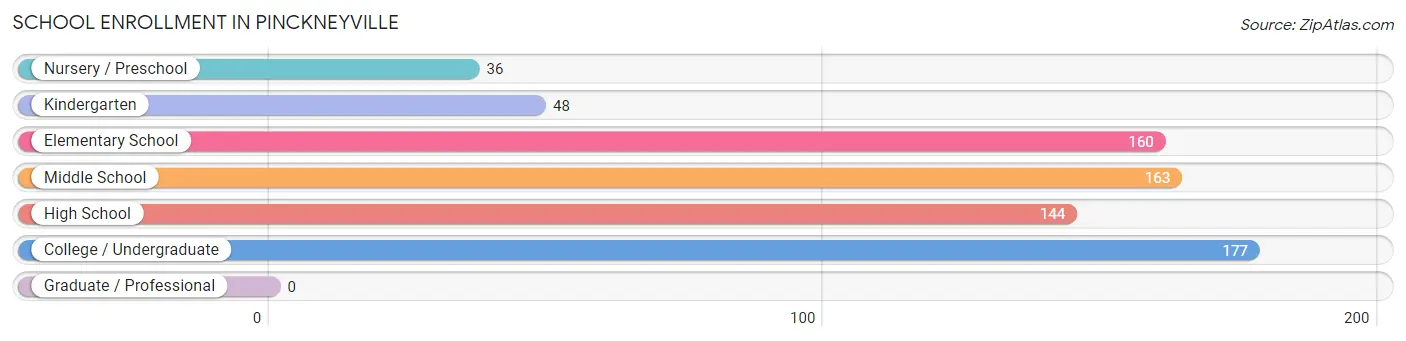
| School Level | # Students | % Students |
| Nursery / Preschool | 36 | 5.0% |
| Kindergarten | 48 | 6.6% |
| Elementary School | 160 | 22.0% |
| Middle School | 163 | 22.4% |
| High School | 144 | 19.8% |
| College / Undergraduate | 177 | 24.3% |
| Graduate / Professional | 0 | 0.0% |
| Total | 728 | 100.0% |
School Enrollment by Age by Funding Source in Pinckneyville
Out of a total of 728 students who are enrolled in schools in Pinckneyville, 140 (19.2%) attend a private institution, while the remaining 588 (80.8%) are enrolled in public schools. The age group of 5 to 9 year old has the highest likelihood of being enrolled in private schools, with 85 (34.8% in the age bracket) enrolled. Conversely, the age group of 15 to 17 year olds has the lowest likelihood of being enrolled in a private school, with 144 (100.0% in the age bracket) attending a public institution.
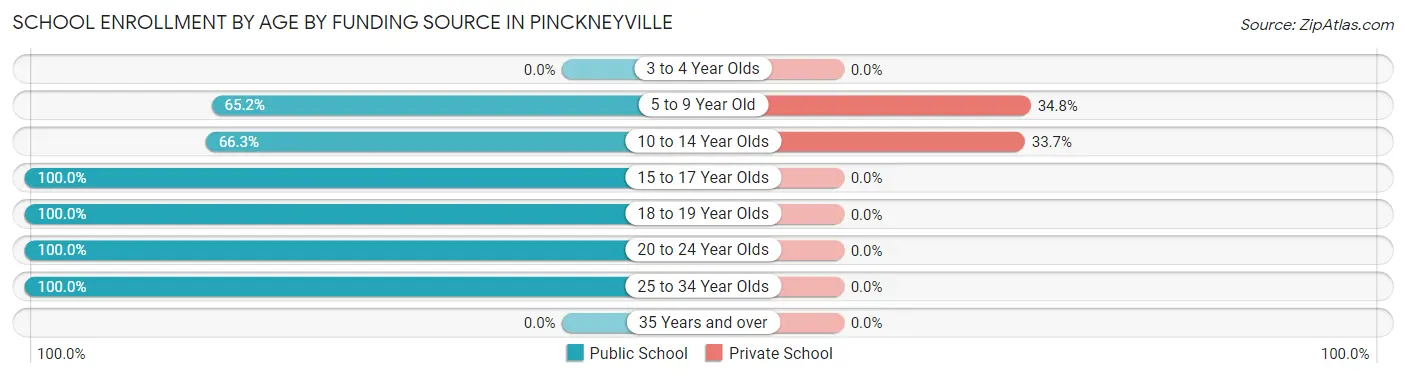
| Age Bracket | Public School | Private School |
| 3 to 4 Year Olds | 0 (0.0%) | 0 (0.0%) |
| 5 to 9 Year Old | 159 (65.2%) | 85 (34.8%) |
| 10 to 14 Year Olds | 108 (66.3%) | 55 (33.7%) |
| 15 to 17 Year Olds | 144 (100.0%) | 0 (0.0%) |
| 18 to 19 Year Olds | 74 (100.0%) | 0 (0.0%) |
| 20 to 24 Year Olds | 23 (100.0%) | 0 (0.0%) |
| 25 to 34 Year Olds | 80 (100.0%) | 0 (0.0%) |
| 35 Years and over | 0 (0.0%) | 0 (0.0%) |
| Total | 588 (80.8%) | 140 (19.2%) |
Educational Attainment by Field of Study in Pinckneyville
Business (150 | 34.8%), education (117 | 27.2%), bio, nature & agricultural (44 | 10.2%), science & technology (44 | 10.2%), and visual & performing arts (30 | 7.0%) are the most common fields of study among 431 individuals in Pinckneyville who have obtained a bachelor's degree or higher.
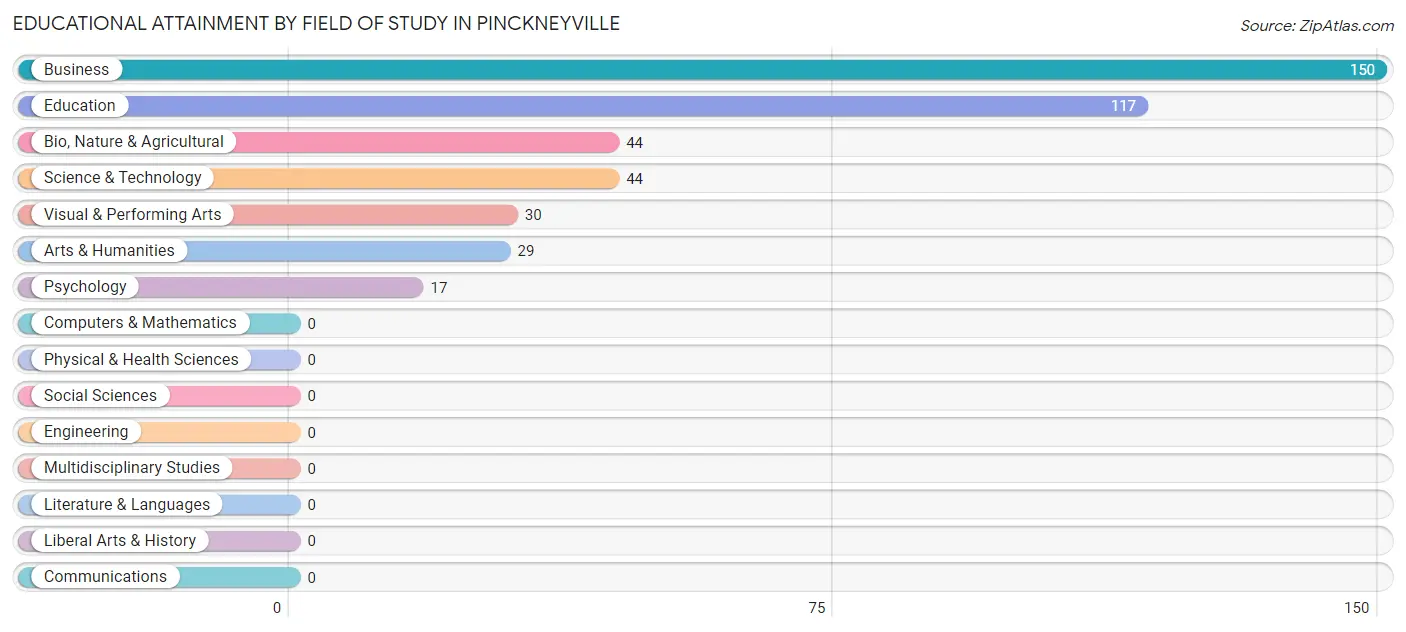
| Field of Study | # Graduates | % Graduates |
| Computers & Mathematics | 0 | 0.0% |
| Bio, Nature & Agricultural | 44 | 10.2% |
| Physical & Health Sciences | 0 | 0.0% |
| Psychology | 17 | 3.9% |
| Social Sciences | 0 | 0.0% |
| Engineering | 0 | 0.0% |
| Multidisciplinary Studies | 0 | 0.0% |
| Science & Technology | 44 | 10.2% |
| Business | 150 | 34.8% |
| Education | 117 | 27.2% |
| Literature & Languages | 0 | 0.0% |
| Liberal Arts & History | 0 | 0.0% |
| Visual & Performing Arts | 30 | 7.0% |
| Communications | 0 | 0.0% |
| Arts & Humanities | 29 | 6.7% |
| Total | 431 | 100.0% |
Transportation & Commute in Pinckneyville
Vehicle Availability by Sex in Pinckneyville
The most prevalent vehicle ownership categories in Pinckneyville are males with 2 vehicles (219, accounting for 33.0%) and females with 2 vehicles (274, making up 27.0%).
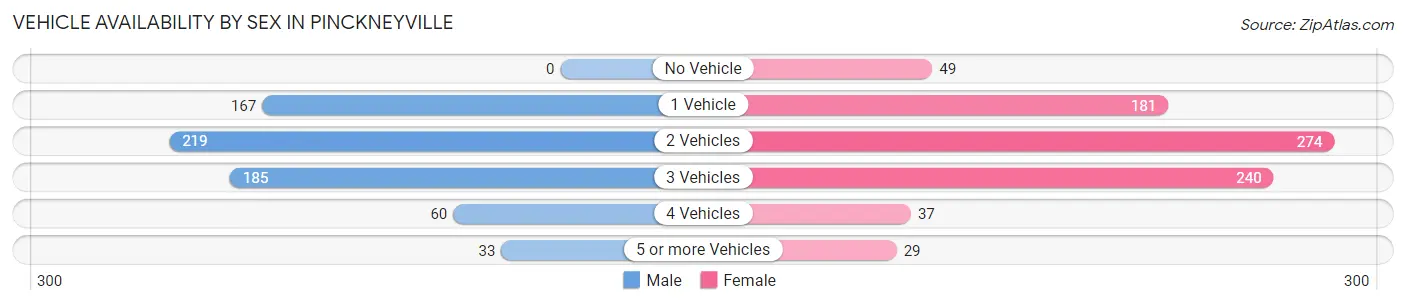
| Vehicles Available | Male | Female |
| No Vehicle | 0 (0.0%) | 49 (6.0%) |
| 1 Vehicle | 167 (25.2%) | 181 (22.4%) |
| 2 Vehicles | 219 (33.0%) | 274 (33.8%) |
| 3 Vehicles | 185 (27.9%) | 240 (29.6%) |
| 4 Vehicles | 60 (9.0%) | 37 (4.6%) |
| 5 or more Vehicles | 33 (5.0%) | 29 (3.6%) |
| Total | 664 (100.0%) | 810 (100.0%) |
Commute Time in Pinckneyville
The most frequently occuring commute durations in Pinckneyville are 5 to 9 minutes (391 commuters, 27.4%), less than 5 minutes (325 commuters, 22.8%), and 10 to 14 minutes (168 commuters, 11.8%).
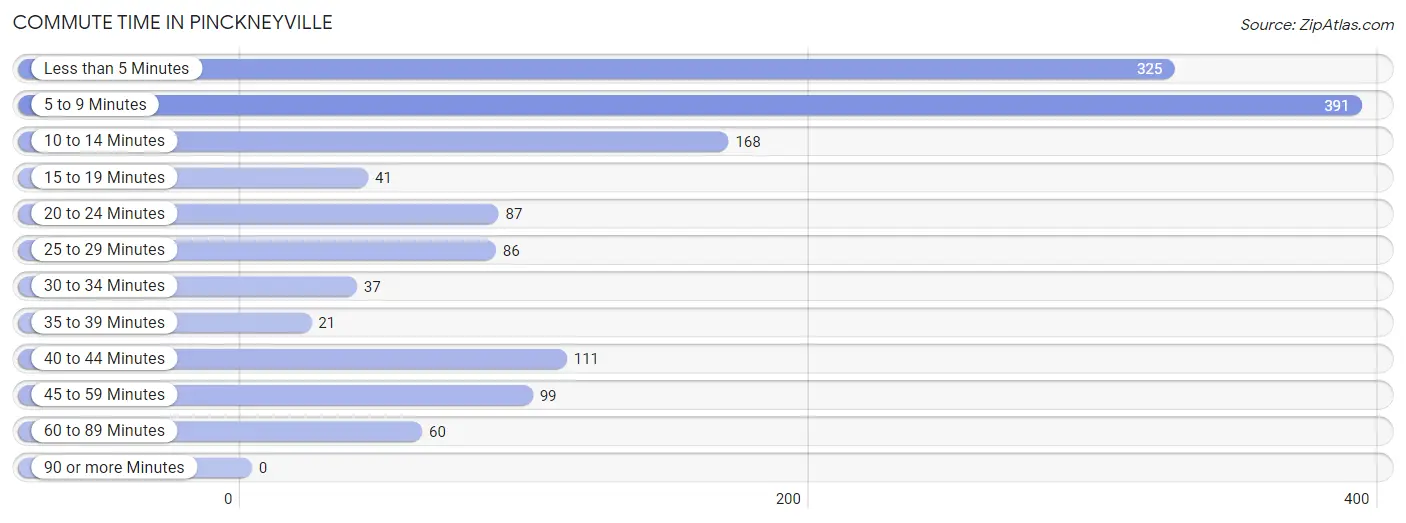
| Commute Time | # Commuters | % Commuters |
| Less than 5 Minutes | 325 | 22.8% |
| 5 to 9 Minutes | 391 | 27.4% |
| 10 to 14 Minutes | 168 | 11.8% |
| 15 to 19 Minutes | 41 | 2.9% |
| 20 to 24 Minutes | 87 | 6.1% |
| 25 to 29 Minutes | 86 | 6.0% |
| 30 to 34 Minutes | 37 | 2.6% |
| 35 to 39 Minutes | 21 | 1.5% |
| 40 to 44 Minutes | 111 | 7.8% |
| 45 to 59 Minutes | 99 | 6.9% |
| 60 to 89 Minutes | 60 | 4.2% |
| 90 or more Minutes | 0 | 0.0% |
Commute Time by Sex in Pinckneyville
The most common commute times in Pinckneyville are less than 5 minutes (166 commuters, 25.8%) for males and 5 to 9 minutes (242 commuters, 30.9%) for females.
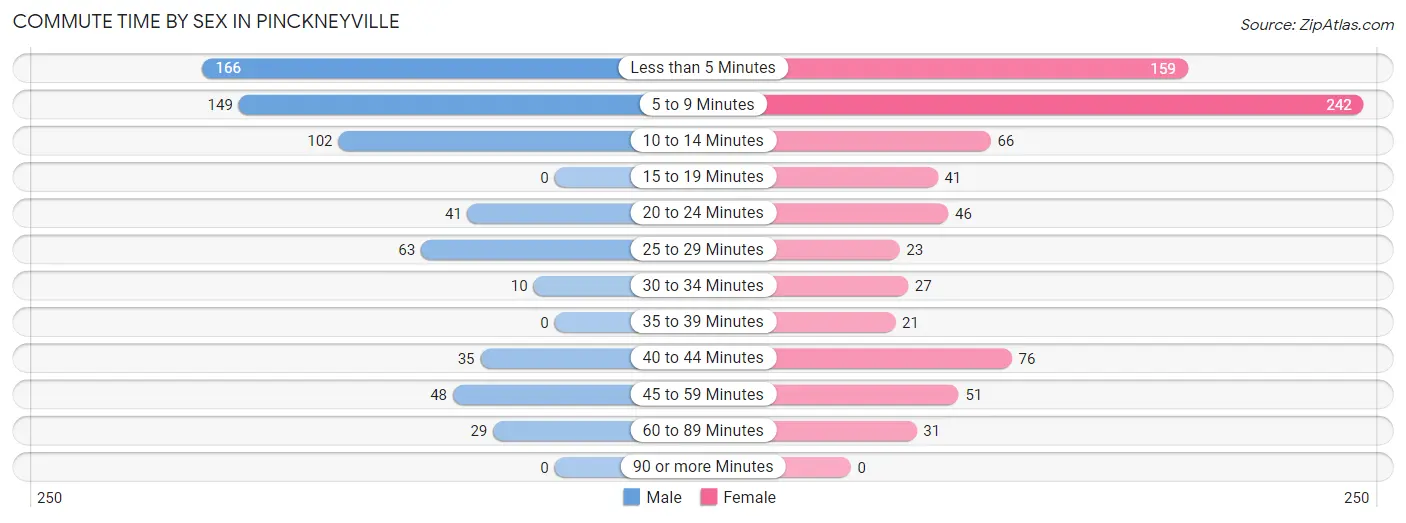
| Commute Time | Male | Female |
| Less than 5 Minutes | 166 (25.8%) | 159 (20.3%) |
| 5 to 9 Minutes | 149 (23.2%) | 242 (30.9%) |
| 10 to 14 Minutes | 102 (15.9%) | 66 (8.4%) |
| 15 to 19 Minutes | 0 (0.0%) | 41 (5.2%) |
| 20 to 24 Minutes | 41 (6.4%) | 46 (5.9%) |
| 25 to 29 Minutes | 63 (9.8%) | 23 (2.9%) |
| 30 to 34 Minutes | 10 (1.6%) | 27 (3.5%) |
| 35 to 39 Minutes | 0 (0.0%) | 21 (2.7%) |
| 40 to 44 Minutes | 35 (5.4%) | 76 (9.7%) |
| 45 to 59 Minutes | 48 (7.5%) | 51 (6.5%) |
| 60 to 89 Minutes | 29 (4.5%) | 31 (4.0%) |
| 90 or more Minutes | 0 (0.0%) | 0 (0.0%) |
Time of Departure to Work by Sex in Pinckneyville
The most frequent times of departure to work in Pinckneyville are 7:30 AM to 7:59 AM (179, 27.8%) for males and 7:30 AM to 7:59 AM (154, 19.7%) for females.
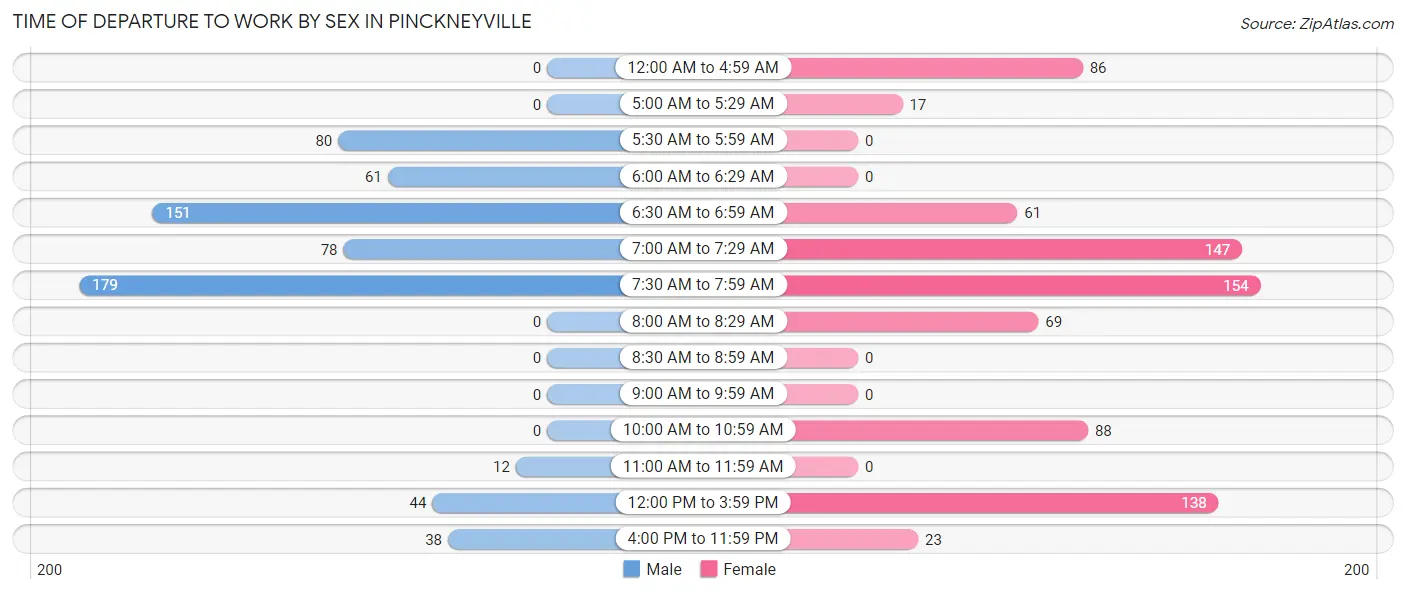
| Time of Departure | Male | Female |
| 12:00 AM to 4:59 AM | 0 (0.0%) | 86 (11.0%) |
| 5:00 AM to 5:29 AM | 0 (0.0%) | 17 (2.2%) |
| 5:30 AM to 5:59 AM | 80 (12.4%) | 0 (0.0%) |
| 6:00 AM to 6:29 AM | 61 (9.5%) | 0 (0.0%) |
| 6:30 AM to 6:59 AM | 151 (23.5%) | 61 (7.8%) |
| 7:00 AM to 7:29 AM | 78 (12.1%) | 147 (18.8%) |
| 7:30 AM to 7:59 AM | 179 (27.8%) | 154 (19.7%) |
| 8:00 AM to 8:29 AM | 0 (0.0%) | 69 (8.8%) |
| 8:30 AM to 8:59 AM | 0 (0.0%) | 0 (0.0%) |
| 9:00 AM to 9:59 AM | 0 (0.0%) | 0 (0.0%) |
| 10:00 AM to 10:59 AM | 0 (0.0%) | 88 (11.2%) |
| 11:00 AM to 11:59 AM | 12 (1.9%) | 0 (0.0%) |
| 12:00 PM to 3:59 PM | 44 (6.8%) | 138 (17.6%) |
| 4:00 PM to 11:59 PM | 38 (5.9%) | 23 (2.9%) |
| Total | 643 (100.0%) | 783 (100.0%) |
Housing Occupancy in Pinckneyville
Occupancy by Ownership in Pinckneyville
Of the total 1,583 dwellings in Pinckneyville, owner-occupied units account for 1,139 (72.0%), while renter-occupied units make up 444 (28.1%).
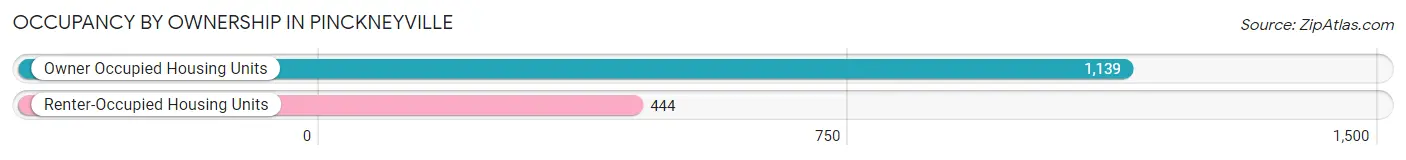
| Occupancy | # Housing Units | % Housing Units |
| Owner Occupied Housing Units | 1,139 | 72.0% |
| Renter-Occupied Housing Units | 444 | 28.1% |
| Total Occupied Housing Units | 1,583 | 100.0% |
Occupancy by Household Size in Pinckneyville
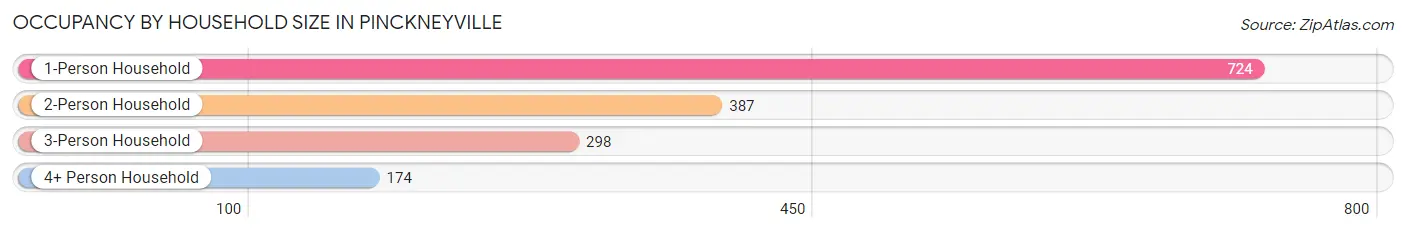
| Household Size | # Housing Units | % Housing Units |
| 1-Person Household | 724 | 45.7% |
| 2-Person Household | 387 | 24.4% |
| 3-Person Household | 298 | 18.8% |
| 4+ Person Household | 174 | 11.0% |
| Total Housing Units | 1,583 | 100.0% |
Occupancy by Ownership by Household Size in Pinckneyville
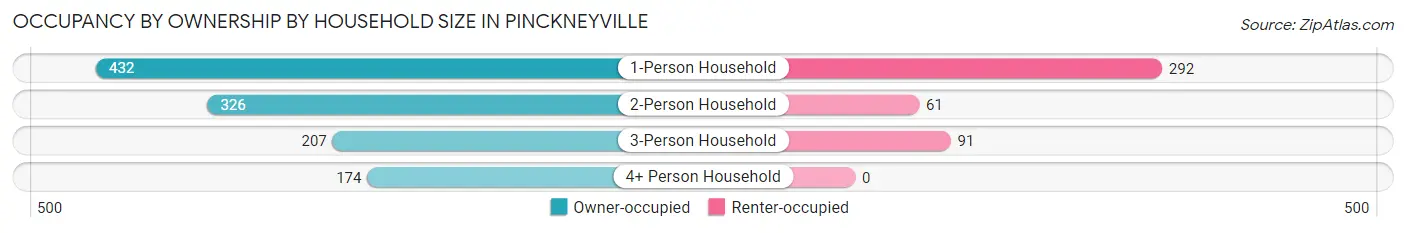
| Household Size | Owner-occupied | Renter-occupied |
| 1-Person Household | 432 (59.7%) | 292 (40.3%) |
| 2-Person Household | 326 (84.2%) | 61 (15.8%) |
| 3-Person Household | 207 (69.5%) | 91 (30.5%) |
| 4+ Person Household | 174 (100.0%) | 0 (0.0%) |
| Total Housing Units | 1,139 (72.0%) | 444 (28.1%) |
Occupancy by Educational Attainment in Pinckneyville
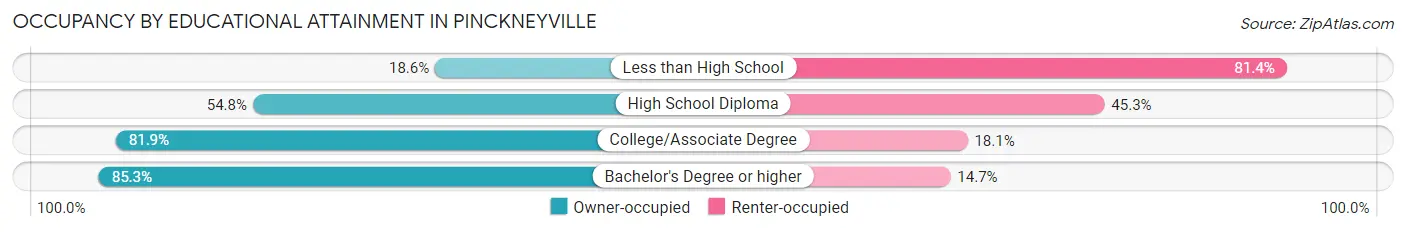
| Household Size | Owner-occupied | Renter-occupied |
| Less than High School | 35 (18.6%) | 153 (81.4%) |
| High School Diploma | 98 (54.7%) | 81 (45.3%) |
| College/Associate Degree | 751 (81.9%) | 166 (18.1%) |
| Bachelor's Degree or higher | 255 (85.3%) | 44 (14.7%) |
Occupancy by Age of Householder in Pinckneyville
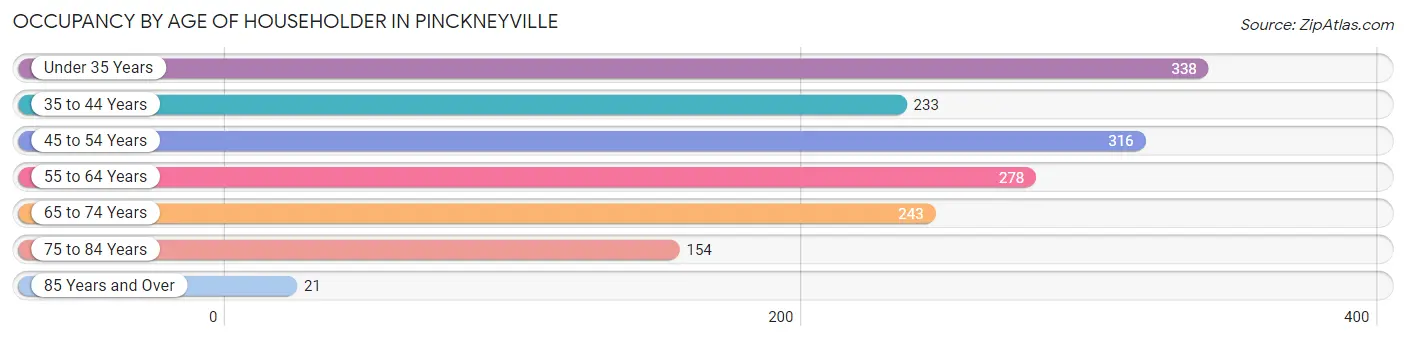
| Age Bracket | # Households | % Households |
| Under 35 Years | 338 | 21.3% |
| 35 to 44 Years | 233 | 14.7% |
| 45 to 54 Years | 316 | 20.0% |
| 55 to 64 Years | 278 | 17.6% |
| 65 to 74 Years | 243 | 15.3% |
| 75 to 84 Years | 154 | 9.7% |
| 85 Years and Over | 21 | 1.3% |
| Total | 1,583 | 100.0% |
Housing Finances in Pinckneyville
Median Income by Occupancy in Pinckneyville
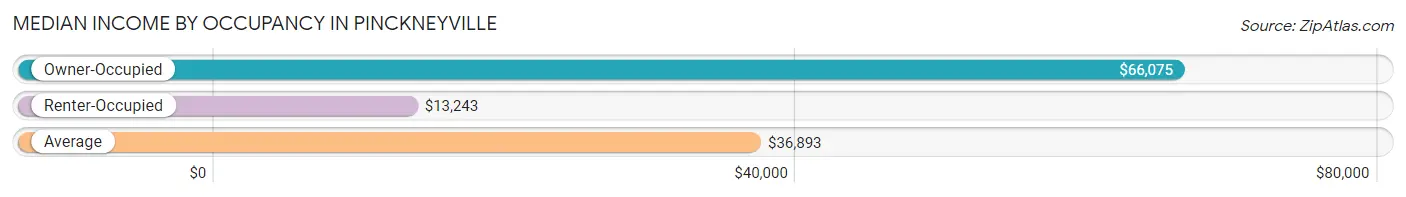
| Occupancy Type | # Households | Median Income |
| Owner-Occupied | 1,139 (72.0%) | $66,075 |
| Renter-Occupied | 444 (28.1%) | $13,243 |
| Average | 1,583 (100.0%) | $36,893 |
Occupancy by Householder Income Bracket in Pinckneyville
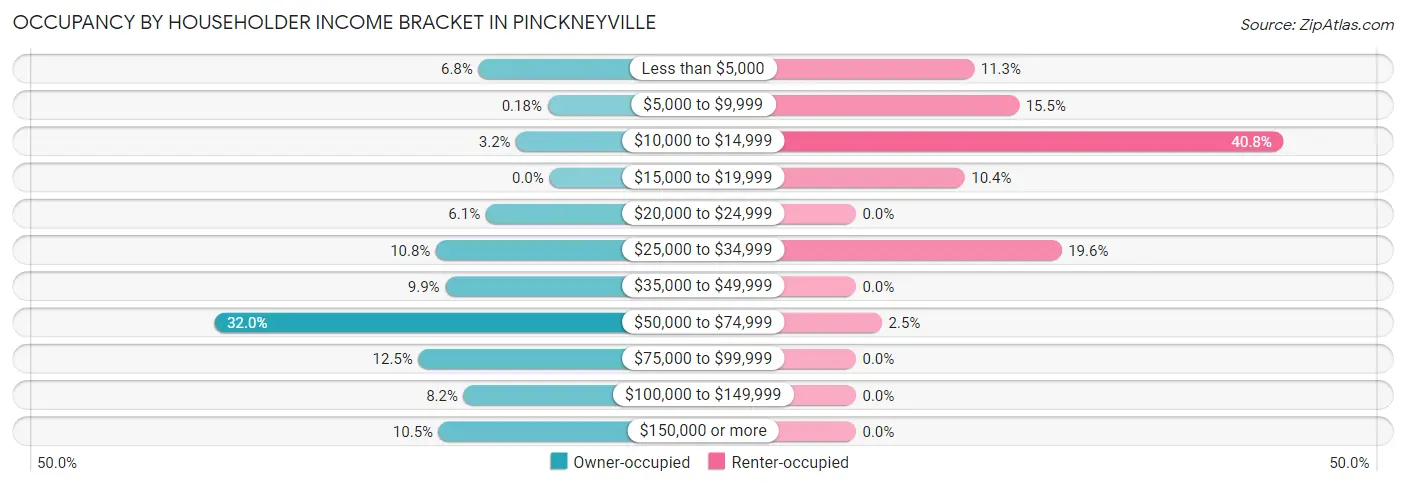
| Income Bracket | Owner-occupied | Renter-occupied |
| Less than $5,000 | 77 (6.8%) | 50 (11.3%) |
| $5,000 to $9,999 | 2 (0.2%) | 69 (15.5%) |
| $10,000 to $14,999 | 36 (3.2%) | 181 (40.8%) |
| $15,000 to $19,999 | 0 (0.0%) | 46 (10.4%) |
| $20,000 to $24,999 | 69 (6.1%) | 0 (0.0%) |
| $25,000 to $34,999 | 123 (10.8%) | 87 (19.6%) |
| $35,000 to $49,999 | 113 (9.9%) | 0 (0.0%) |
| $50,000 to $74,999 | 364 (32.0%) | 11 (2.5%) |
| $75,000 to $99,999 | 142 (12.5%) | 0 (0.0%) |
| $100,000 to $149,999 | 93 (8.2%) | 0 (0.0%) |
| $150,000 or more | 120 (10.5%) | 0 (0.0%) |
| Total | 1,139 (100.0%) | 444 (100.0%) |
Monthly Housing Cost Tiers in Pinckneyville
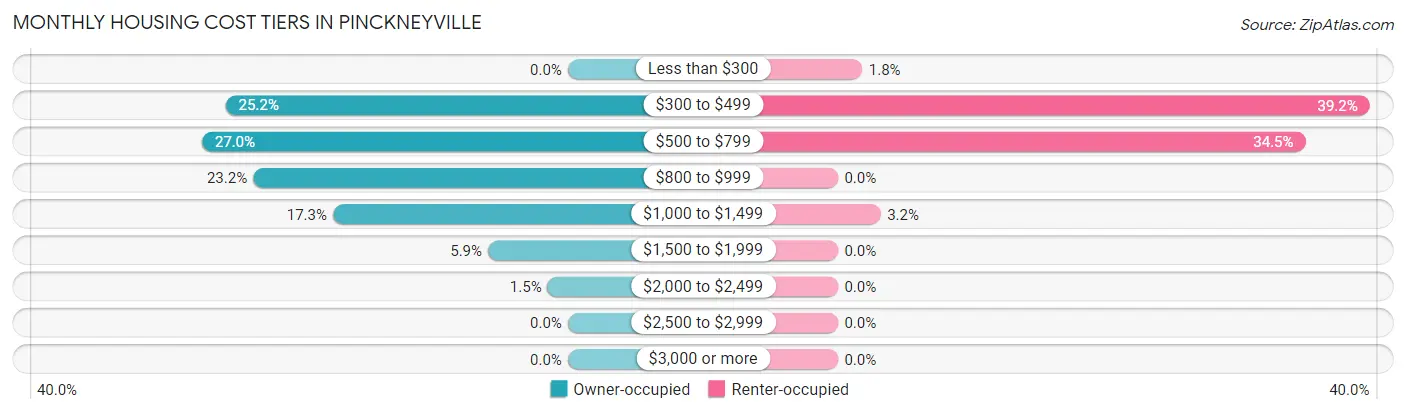
| Monthly Cost | Owner-occupied | Renter-occupied |
| Less than $300 | 0 (0.0%) | 8 (1.8%) |
| $300 to $499 | 287 (25.2%) | 174 (39.2%) |
| $500 to $799 | 307 (27.0%) | 153 (34.5%) |
| $800 to $999 | 264 (23.2%) | 0 (0.0%) |
| $1,000 to $1,499 | 197 (17.3%) | 14 (3.2%) |
| $1,500 to $1,999 | 67 (5.9%) | 0 (0.0%) |
| $2,000 to $2,499 | 17 (1.5%) | 0 (0.0%) |
| $2,500 to $2,999 | 0 (0.0%) | 0 (0.0%) |
| $3,000 or more | 0 (0.0%) | 0 (0.0%) |
| Total | 1,139 (100.0%) | 444 (100.0%) |
Physical Housing Characteristics in Pinckneyville
Housing Structures in Pinckneyville
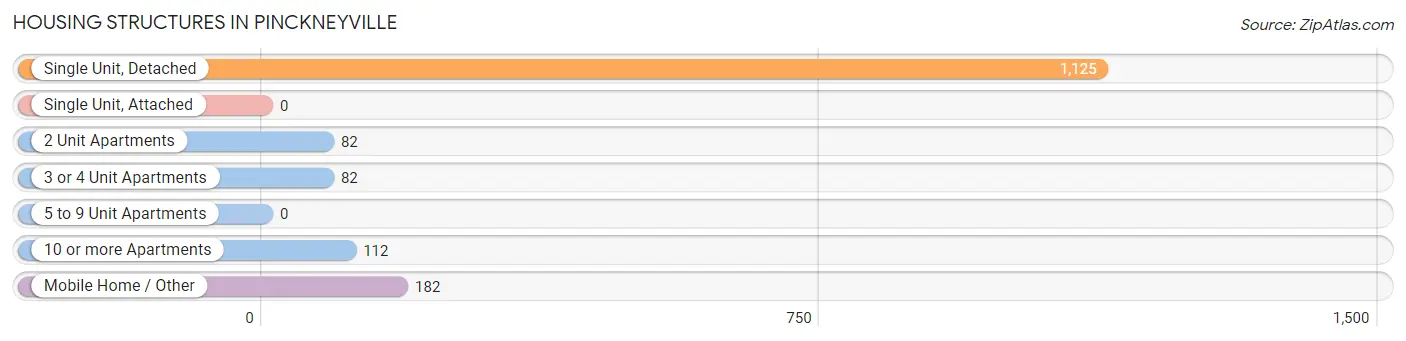
| Structure Type | # Housing Units | % Housing Units |
| Single Unit, Detached | 1,125 | 71.1% |
| Single Unit, Attached | 0 | 0.0% |
| 2 Unit Apartments | 82 | 5.2% |
| 3 or 4 Unit Apartments | 82 | 5.2% |
| 5 to 9 Unit Apartments | 0 | 0.0% |
| 10 or more Apartments | 112 | 7.1% |
| Mobile Home / Other | 182 | 11.5% |
| Total | 1,583 | 100.0% |
Housing Structures by Occupancy in Pinckneyville
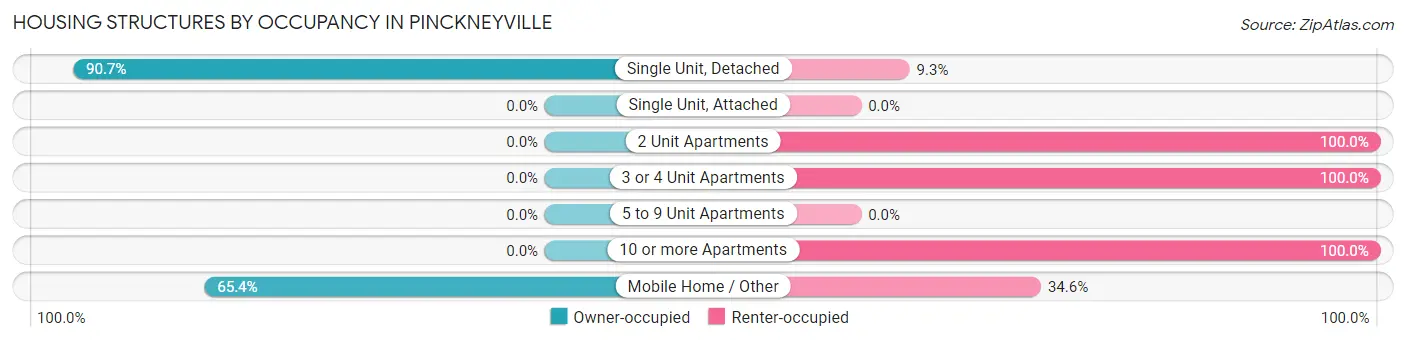
| Structure Type | Owner-occupied | Renter-occupied |
| Single Unit, Detached | 1,020 (90.7%) | 105 (9.3%) |
| Single Unit, Attached | 0 (0.0%) | 0 (0.0%) |
| 2 Unit Apartments | 0 (0.0%) | 82 (100.0%) |
| 3 or 4 Unit Apartments | 0 (0.0%) | 82 (100.0%) |
| 5 to 9 Unit Apartments | 0 (0.0%) | 0 (0.0%) |
| 10 or more Apartments | 0 (0.0%) | 112 (100.0%) |
| Mobile Home / Other | 119 (65.4%) | 63 (34.6%) |
| Total | 1,139 (72.0%) | 444 (28.1%) |
Housing Structures by Number of Rooms in Pinckneyville
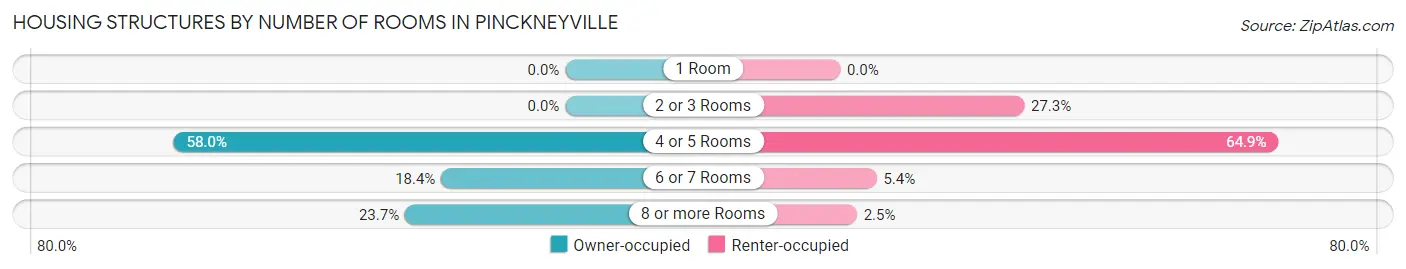
| Number of Rooms | Owner-occupied | Renter-occupied |
| 1 Room | 0 (0.0%) | 0 (0.0%) |
| 2 or 3 Rooms | 0 (0.0%) | 121 (27.3%) |
| 4 or 5 Rooms | 660 (58.0%) | 288 (64.9%) |
| 6 or 7 Rooms | 209 (18.3%) | 24 (5.4%) |
| 8 or more Rooms | 270 (23.7%) | 11 (2.5%) |
| Total | 1,139 (100.0%) | 444 (100.0%) |
Housing Structure by Heating Type in Pinckneyville
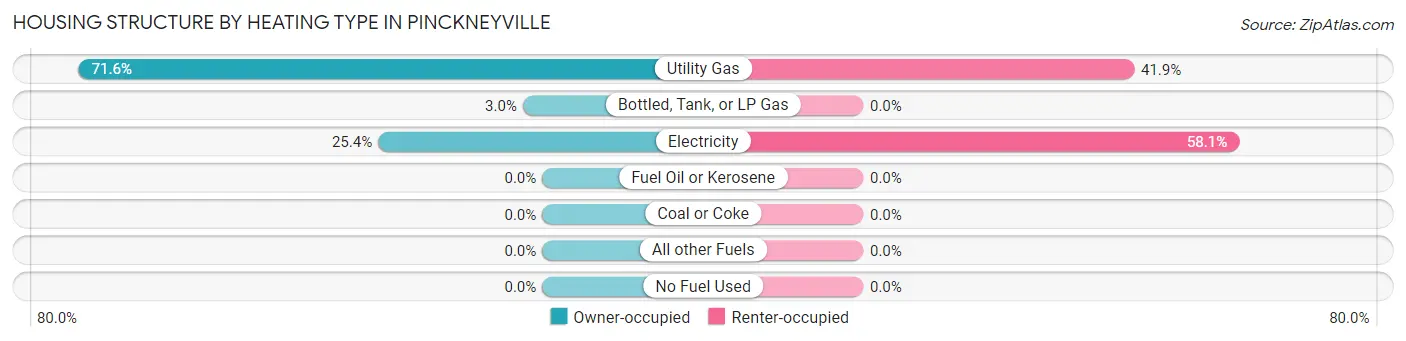
| Heating Type | Owner-occupied | Renter-occupied |
| Utility Gas | 816 (71.6%) | 186 (41.9%) |
| Bottled, Tank, or LP Gas | 34 (3.0%) | 0 (0.0%) |
| Electricity | 289 (25.4%) | 258 (58.1%) |
| Fuel Oil or Kerosene | 0 (0.0%) | 0 (0.0%) |
| Coal or Coke | 0 (0.0%) | 0 (0.0%) |
| All other Fuels | 0 (0.0%) | 0 (0.0%) |
| No Fuel Used | 0 (0.0%) | 0 (0.0%) |
| Total | 1,139 (100.0%) | 444 (100.0%) |
Household Vehicle Usage in Pinckneyville
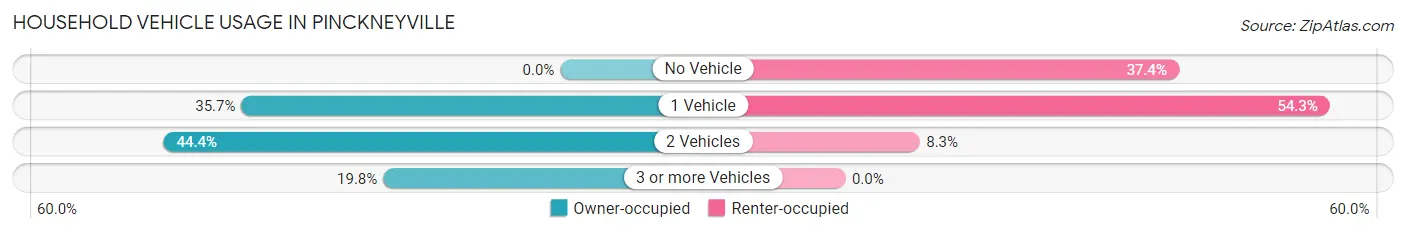
| Vehicles per Household | Owner-occupied | Renter-occupied |
| No Vehicle | 0 (0.0%) | 166 (37.4%) |
| 1 Vehicle | 407 (35.7%) | 241 (54.3%) |
| 2 Vehicles | 506 (44.4%) | 37 (8.3%) |
| 3 or more Vehicles | 226 (19.8%) | 0 (0.0%) |
| Total | 1,139 (100.0%) | 444 (100.0%) |
Real Estate & Mortgages in Pinckneyville
Real Estate and Mortgage Overview in Pinckneyville
| Characteristic | Without Mortgage | With Mortgage |
| Housing Units | 491 | 648 |
| Median Property Value | $147,800 | $104,800 |
| Median Household Income | $54,441 | $116 |
| Monthly Housing Costs | $526 | $0 |
| Real Estate Taxes | $1,754 | $70 |
Property Value by Mortgage Status in Pinckneyville
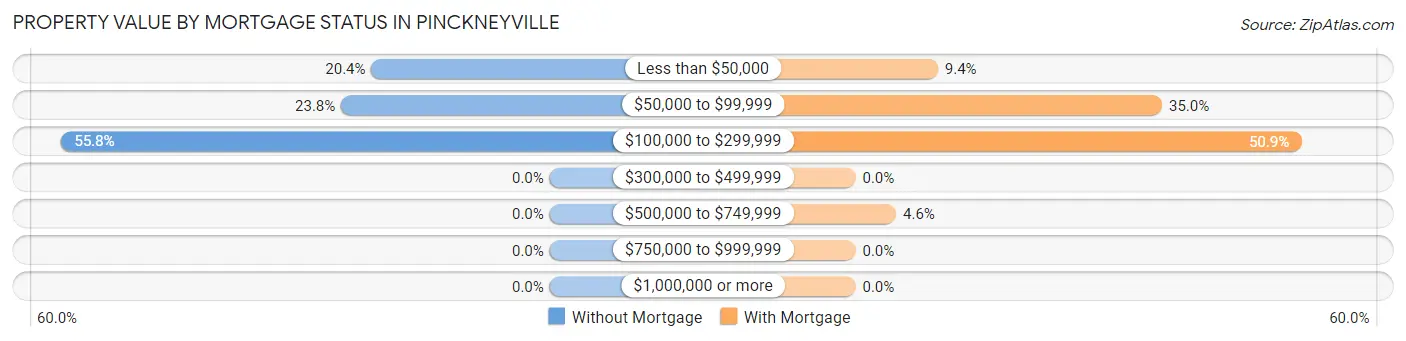
| Property Value | Without Mortgage | With Mortgage |
| Less than $50,000 | 100 (20.4%) | 61 (9.4%) |
| $50,000 to $99,999 | 117 (23.8%) | 227 (35.0%) |
| $100,000 to $299,999 | 274 (55.8%) | 330 (50.9%) |
| $300,000 to $499,999 | 0 (0.0%) | 0 (0.0%) |
| $500,000 to $749,999 | 0 (0.0%) | 30 (4.6%) |
| $750,000 to $999,999 | 0 (0.0%) | 0 (0.0%) |
| $1,000,000 or more | 0 (0.0%) | 0 (0.0%) |
| Total | 491 (100.0%) | 648 (100.0%) |
Household Income by Mortgage Status in Pinckneyville
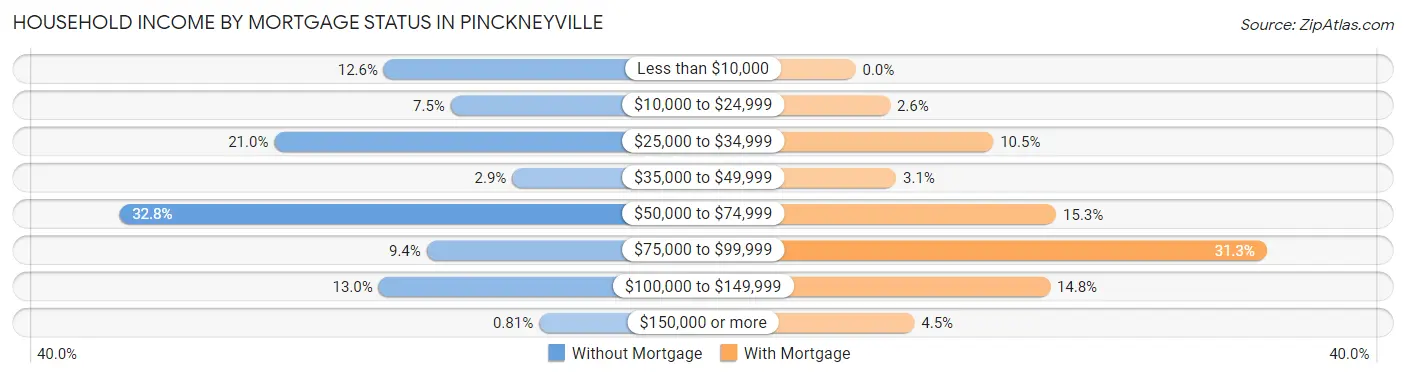
| Household Income | Without Mortgage | With Mortgage |
| Less than $10,000 | 62 (12.6%) | 0 (0.0%) |
| $10,000 to $24,999 | 37 (7.5%) | 17 (2.6%) |
| $25,000 to $34,999 | 103 (21.0%) | 68 (10.5%) |
| $35,000 to $49,999 | 14 (2.9%) | 20 (3.1%) |
| $50,000 to $74,999 | 161 (32.8%) | 99 (15.3%) |
| $75,000 to $99,999 | 46 (9.4%) | 203 (31.3%) |
| $100,000 to $149,999 | 64 (13.0%) | 96 (14.8%) |
| $150,000 or more | 4 (0.8%) | 29 (4.5%) |
| Total | 491 (100.0%) | 648 (100.0%) |
Property Value to Household Income Ratio in Pinckneyville
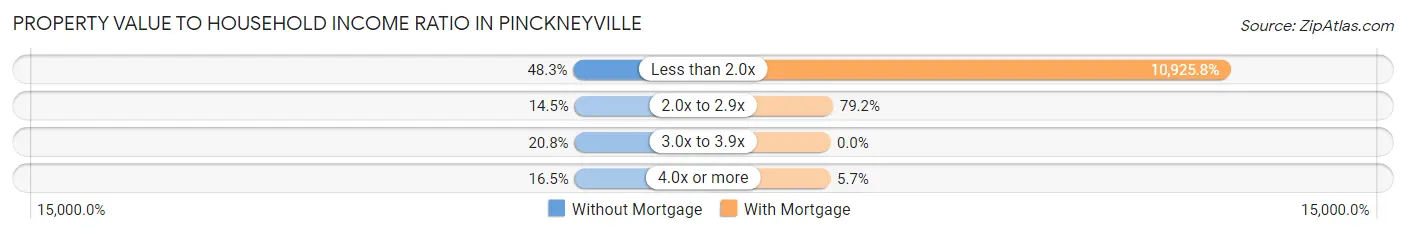
| Value-to-Income Ratio | Without Mortgage | With Mortgage |
| Less than 2.0x | 237 (48.3%) | 70,799 (10,925.8%) |
| 2.0x to 2.9x | 71 (14.5%) | 513 (79.2%) |
| 3.0x to 3.9x | 102 (20.8%) | 0 (0.0%) |
| 4.0x or more | 81 (16.5%) | 37 (5.7%) |
| Total | 491 (100.0%) | 648 (100.0%) |
Real Estate Taxes by Mortgage Status in Pinckneyville
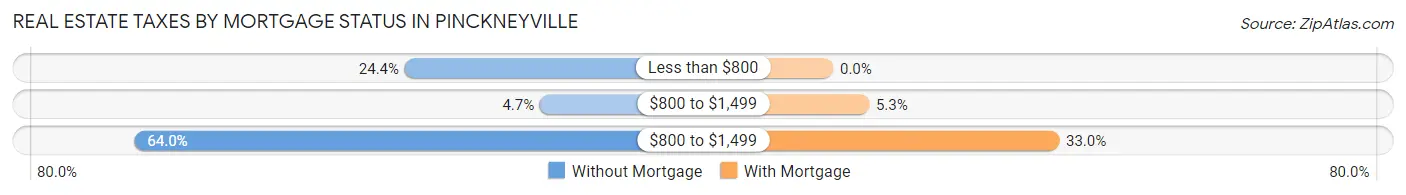
| Property Taxes | Without Mortgage | With Mortgage |
| Less than $800 | 120 (24.4%) | 0 (0.0%) |
| $800 to $1,499 | 23 (4.7%) | 34 (5.2%) |
| $800 to $1,499 | 314 (63.9%) | 214 (33.0%) |
| Total | 491 (100.0%) | 648 (100.0%) |
Health & Disability in Pinckneyville
Health Insurance Coverage by Age in Pinckneyville
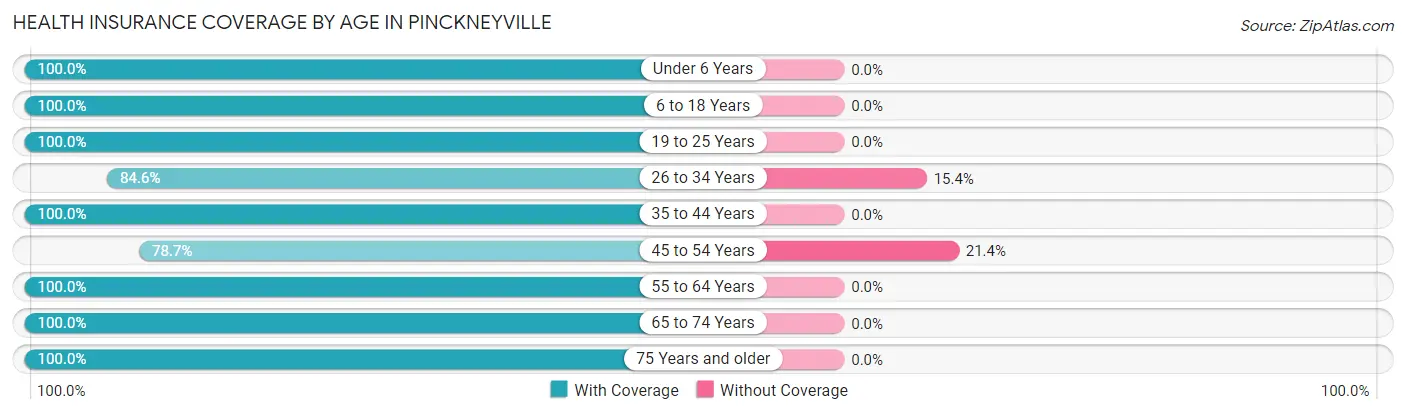
| Age Bracket | With Coverage | Without Coverage |
| Under 6 Years | 238 (100.0%) | 0 (0.0%) |
| 6 to 18 Years | 485 (100.0%) | 0 (0.0%) |
| 19 to 25 Years | 180 (100.0%) | 0 (0.0%) |
| 26 to 34 Years | 358 (84.6%) | 65 (15.4%) |
| 35 to 44 Years | 328 (100.0%) | 0 (0.0%) |
| 45 to 54 Years | 361 (78.6%) | 98 (21.3%) |
| 55 to 64 Years | 332 (100.0%) | 0 (0.0%) |
| 65 to 74 Years | 439 (100.0%) | 0 (0.0%) |
| 75 Years and older | 194 (100.0%) | 0 (0.0%) |
| Total | 2,915 (94.7%) | 163 (5.3%) |
Health Insurance Coverage by Citizenship Status in Pinckneyville
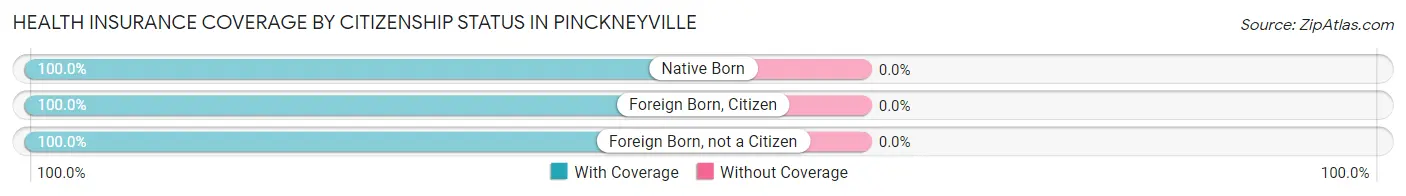
| Citizenship Status | With Coverage | Without Coverage |
| Native Born | 238 (100.0%) | 0 (0.0%) |
| Foreign Born, Citizen | 485 (100.0%) | 0 (0.0%) |
| Foreign Born, not a Citizen | 180 (100.0%) | 0 (0.0%) |
Health Insurance Coverage by Household Income in Pinckneyville
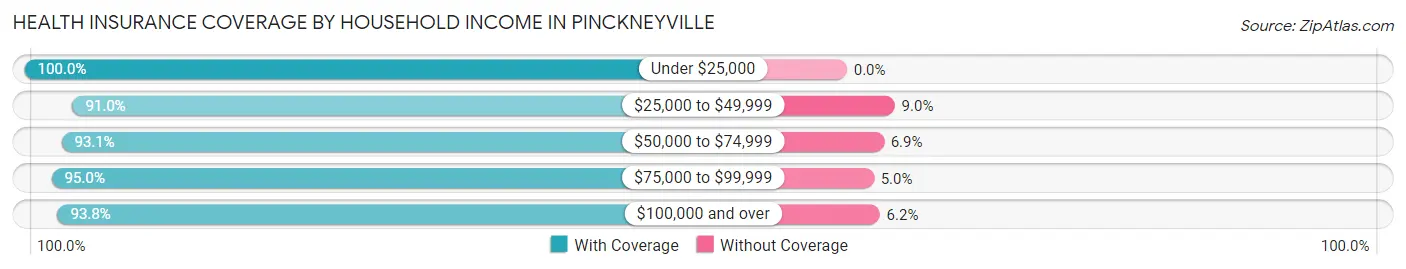
| Household Income | With Coverage | Without Coverage |
| Under $25,000 | 726 (100.0%) | 0 (0.0%) |
| $25,000 to $49,999 | 487 (91.0%) | 48 (9.0%) |
| $50,000 to $74,999 | 849 (93.1%) | 63 (6.9%) |
| $75,000 to $99,999 | 320 (95.0%) | 17 (5.0%) |
| $100,000 and over | 533 (93.8%) | 35 (6.2%) |
Public vs Private Health Insurance Coverage by Age in Pinckneyville
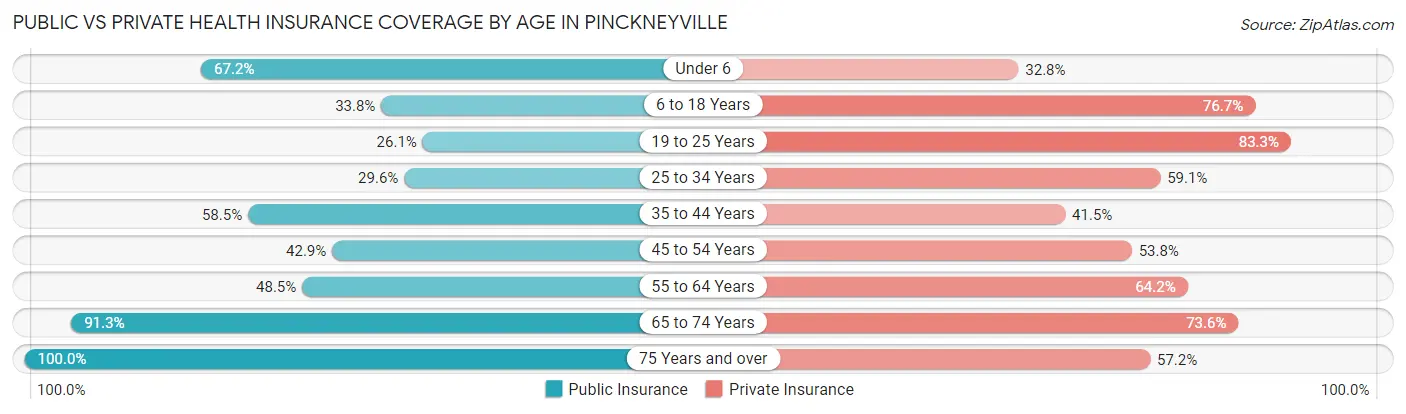
| Age Bracket | Public Insurance | Private Insurance |
| Under 6 | 160 (67.2%) | 78 (32.8%) |
| 6 to 18 Years | 164 (33.8%) | 372 (76.7%) |
| 19 to 25 Years | 47 (26.1%) | 150 (83.3%) |
| 25 to 34 Years | 125 (29.5%) | 250 (59.1%) |
| 35 to 44 Years | 192 (58.5%) | 136 (41.5%) |
| 45 to 54 Years | 197 (42.9%) | 247 (53.8%) |
| 55 to 64 Years | 161 (48.5%) | 213 (64.2%) |
| 65 to 74 Years | 401 (91.3%) | 323 (73.6%) |
| 75 Years and over | 194 (100.0%) | 111 (57.2%) |
| Total | 1,641 (53.3%) | 1,880 (61.1%) |
Disability Status by Sex by Age in Pinckneyville
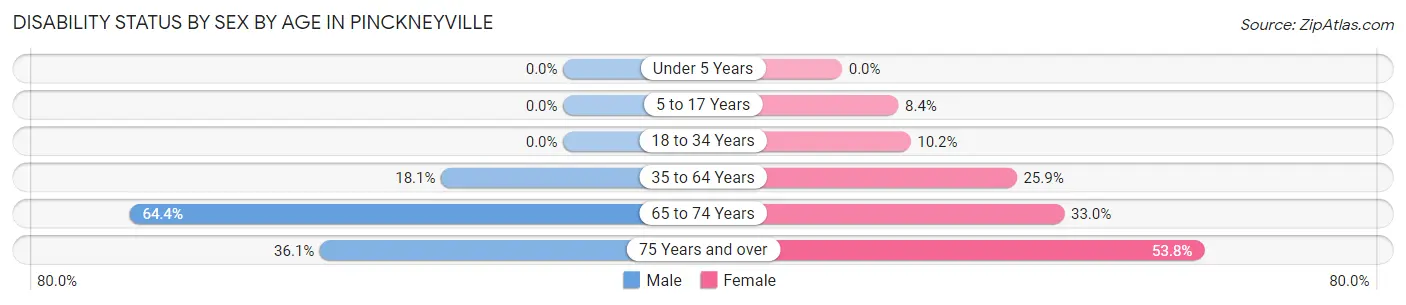
| Age Bracket | Male | Female |
| Under 5 Years | 0 (0.0%) | 0 (0.0%) |
| 5 to 17 Years | 0 (0.0%) | 27 (8.4%) |
| 18 to 34 Years | 0 (0.0%) | 30 (10.2%) |
| 35 to 64 Years | 77 (18.1%) | 180 (25.9%) |
| 65 to 74 Years | 152 (64.4%) | 67 (33.0%) |
| 75 Years and over | 13 (36.1%) | 85 (53.8%) |
Disability Class by Sex by Age in Pinckneyville
Disability Class: Hearing Difficulty
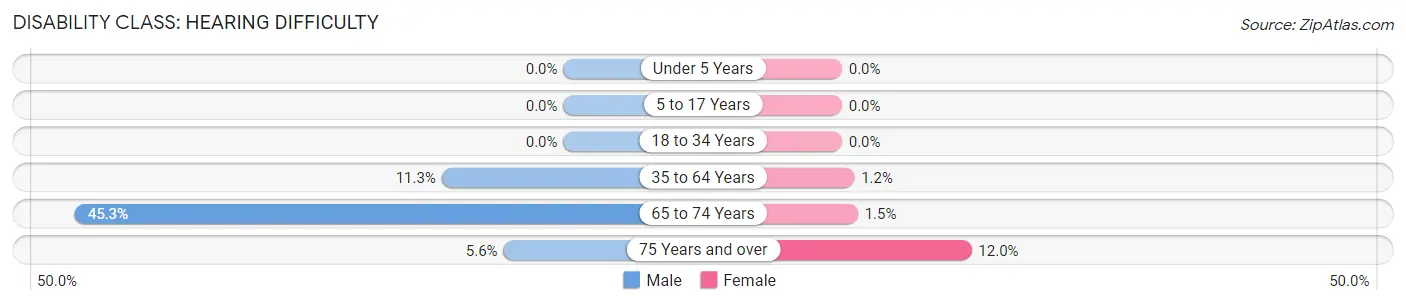
| Age Bracket | Male | Female |
| Under 5 Years | 0 (0.0%) | 0 (0.0%) |
| 5 to 17 Years | 0 (0.0%) | 0 (0.0%) |
| 18 to 34 Years | 0 (0.0%) | 0 (0.0%) |
| 35 to 64 Years | 48 (11.3%) | 8 (1.1%) |
| 65 to 74 Years | 107 (45.3%) | 3 (1.5%) |
| 75 Years and over | 2 (5.6%) | 19 (12.0%) |
Disability Class: Vision Difficulty
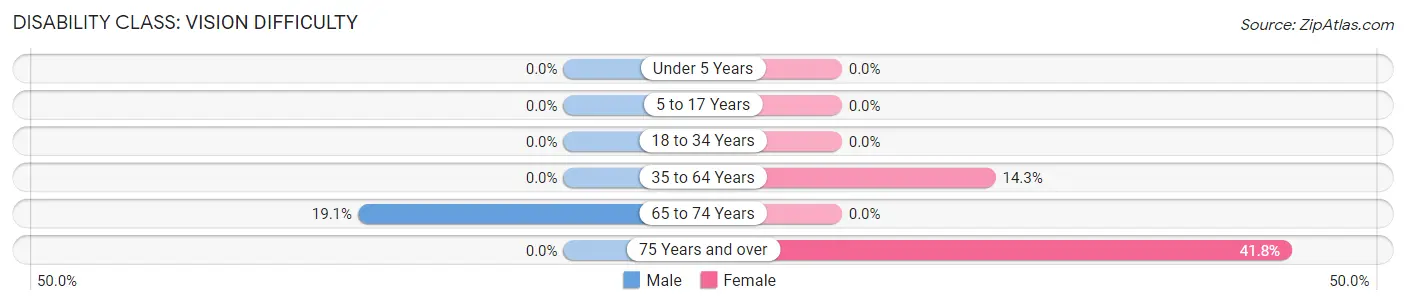
| Age Bracket | Male | Female |
| Under 5 Years | 0 (0.0%) | 0 (0.0%) |
| 5 to 17 Years | 0 (0.0%) | 0 (0.0%) |
| 18 to 34 Years | 0 (0.0%) | 0 (0.0%) |
| 35 to 64 Years | 0 (0.0%) | 99 (14.3%) |
| 65 to 74 Years | 45 (19.1%) | 0 (0.0%) |
| 75 Years and over | 0 (0.0%) | 66 (41.8%) |
Disability Class: Cognitive Difficulty
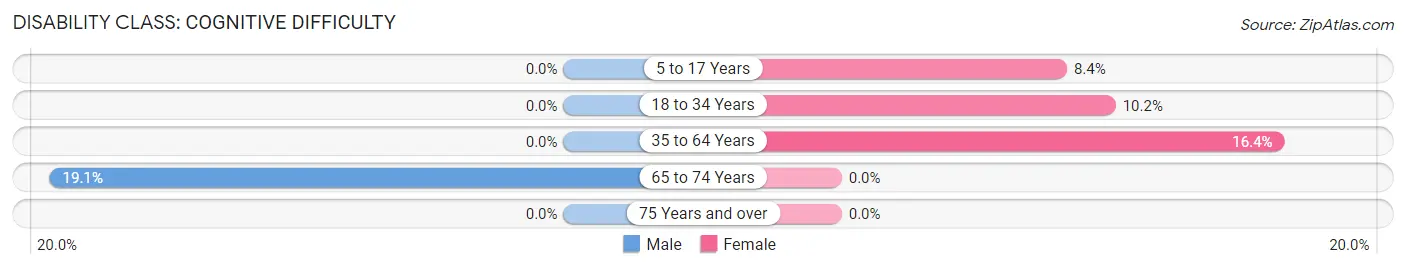
| Age Bracket | Male | Female |
| 5 to 17 Years | 0 (0.0%) | 27 (8.4%) |
| 18 to 34 Years | 0 (0.0%) | 30 (10.2%) |
| 35 to 64 Years | 0 (0.0%) | 114 (16.4%) |
| 65 to 74 Years | 45 (19.1%) | 0 (0.0%) |
| 75 Years and over | 0 (0.0%) | 0 (0.0%) |
Disability Class: Ambulatory Difficulty
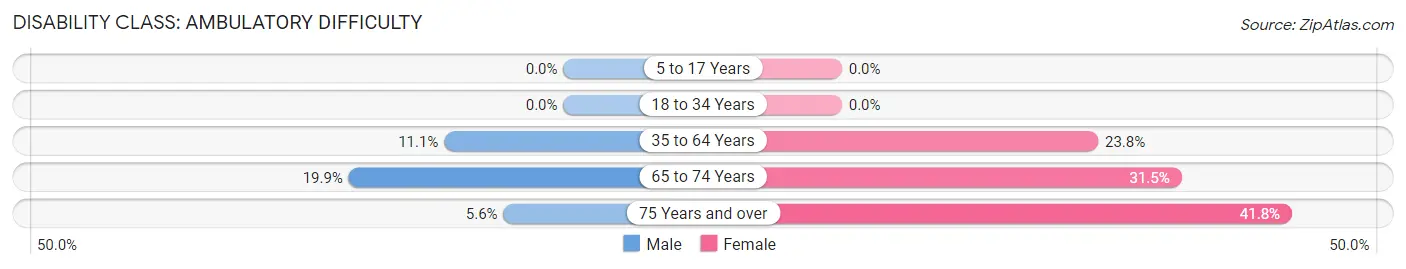
| Age Bracket | Male | Female |
| 5 to 17 Years | 0 (0.0%) | 0 (0.0%) |
| 18 to 34 Years | 0 (0.0%) | 0 (0.0%) |
| 35 to 64 Years | 47 (11.1%) | 165 (23.8%) |
| 65 to 74 Years | 47 (19.9%) | 64 (31.5%) |
| 75 Years and over | 2 (5.6%) | 66 (41.8%) |
Disability Class: Self-Care Difficulty
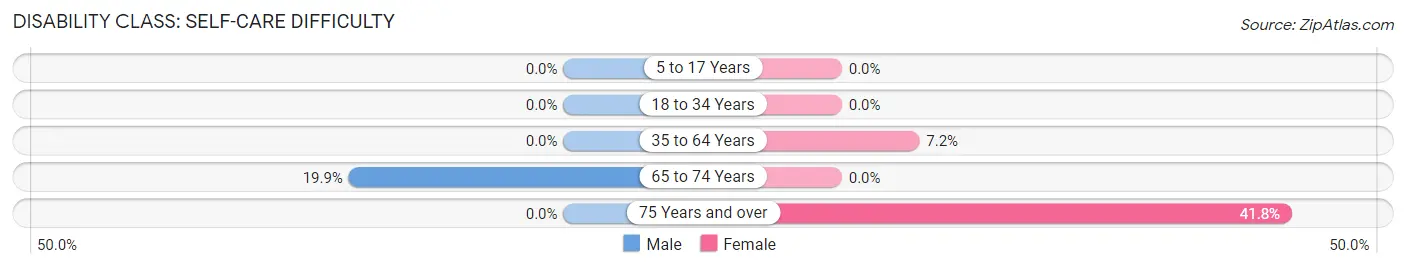
| Age Bracket | Male | Female |
| 5 to 17 Years | 0 (0.0%) | 0 (0.0%) |
| 18 to 34 Years | 0 (0.0%) | 0 (0.0%) |
| 35 to 64 Years | 0 (0.0%) | 50 (7.2%) |
| 65 to 74 Years | 47 (19.9%) | 0 (0.0%) |
| 75 Years and over | 0 (0.0%) | 66 (41.8%) |
Technology Access in Pinckneyville
Computing Device Access in Pinckneyville
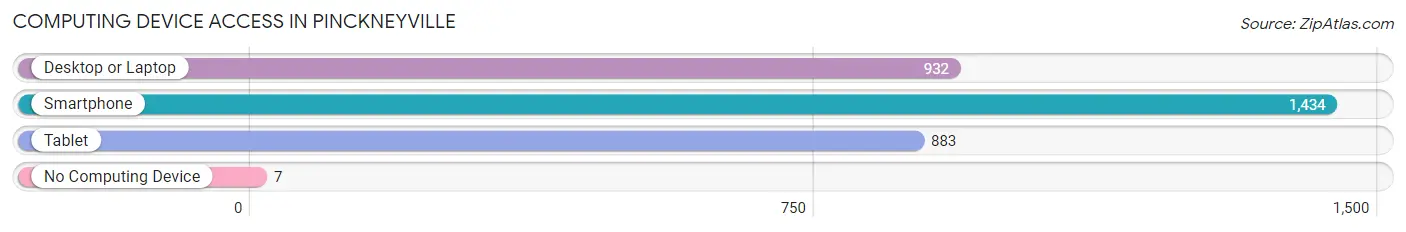
| Device Type | # Households | % Households |
| Desktop or Laptop | 932 | 58.9% |
| Smartphone | 1,434 | 90.6% |
| Tablet | 883 | 55.8% |
| No Computing Device | 7 | 0.4% |
| Total | 1,583 | 100.0% |
Internet Access in Pinckneyville
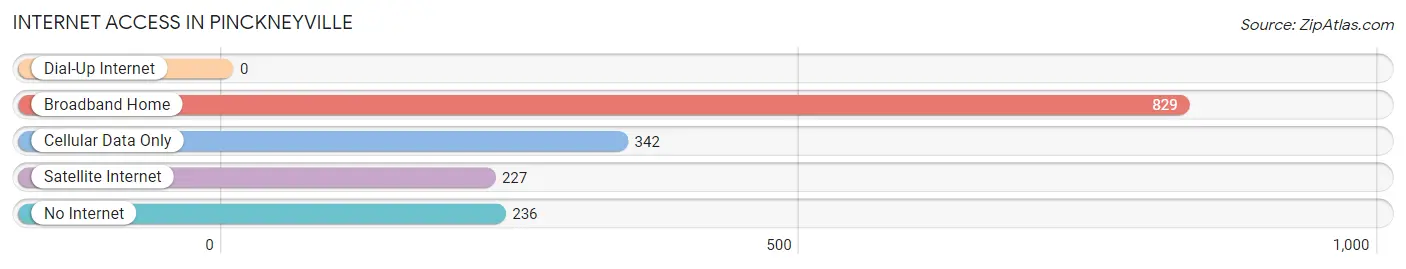
| Internet Type | # Households | % Households |
| Dial-Up Internet | 0 | 0.0% |
| Broadband Home | 829 | 52.4% |
| Cellular Data Only | 342 | 21.6% |
| Satellite Internet | 227 | 14.3% |
| No Internet | 236 | 14.9% |
| Total | 1,583 | 100.0% |
Pinckneyville Summary
Pinckneyville is a small city located in Perry County, Illinois, United States. It is the county seat of Perry County and is located about 50 miles southeast of St. Louis, Missouri. The population of Pinckneyville was 5,464 at the 2010 census.
History
Pinckneyville was founded in 1814 by William Pinckney, a Revolutionary War veteran. The town was named after him and was incorporated in 1817. Pinckneyville was the first county seat of Perry County and was the site of the first courthouse. The town was an important stop on the Vandalia Trail, which was a major route for settlers heading west.
In the late 19th century, Pinckneyville was a major coal mining center. The coal industry was the main source of employment for the town until the 1950s. The town also had a thriving brick-making industry, which produced bricks for many of the buildings in the area.
Geography
Pinckneyville is located at 38°2′17″N 89°25′17″W (38.038, -89.421). According to the 2010 census, the city has a total area of 2.3 square miles (6.0 km2), all land.
Economy
Pinckneyville’s economy is largely based on agriculture and manufacturing. The town is home to several large farms, which produce corn, soybeans, and wheat. The town also has several manufacturing plants, including a paper mill, a plastics plant, and a metal fabrication plant.
The town is also home to several small businesses, including restaurants, retail stores, and service providers. The town also has a small airport, which is used for private and commercial flights.
Demographics
As of the 2010 census, there were 5,464 people, 2,093 households, and 1,372 families residing in the city. The population density was 2,364.2 people per square mile (912.2/km2). There were 2,309 housing units at an average density of 990.3 per square mile (382.2/km2). The racial makeup of the city was 97.2% White, 0.7% African American, 0.2% Native American, 0.3% Asian, 0.2% from other races, and 1.4% from two or more races. Hispanic or Latino of any race were 1.2% of the population.
There were 2,093 households, out of which 30.2% had children under the age of 18 living with them, 48.2% were married couples living together, 12.2% had a female householder with no husband present, and 35.2% were non-families. 30.7% of all households were made up of individuals, and 15.2% had someone living alone who was 65 years of age or older. The average household size was 2.45 and the average family size was 3.05.
In the city, the population was spread out, with 24.7% under the age of 18, 8.2% from 18 to 24, 27.2% from 25 to 44, 22.2% from 45 to 64, and 17.7% who were 65 years of age or older. The median age was 38 years. For every 100 females, there were 91.2 males. For every 100 females age 18 and over, there were 87.2 males.
The median income for a household in the city was $35,938, and the median income for a family was $44,938. Males had a median income of $35,000 versus $21,250 for females. The per capita income for the city was $17,845. About 8.2% of families and 11.2% of the population were below the poverty line, including 15.2% of those under age 18 and 8.2% of those age 65 or over.
Common Questions
What is Per Capita Income in Pinckneyville?
Per Capita income in Pinckneyville is $18,953.
What is the Median Family Income in Pinckneyville?
Median Family Income in Pinckneyville is $63,926.
What is the Median Household income in Pinckneyville?
Median Household Income in Pinckneyville is $36,893.
What is Income or Wage Gap in Pinckneyville?
Income or Wage Gap in Pinckneyville is 6.6%.
Women in Pinckneyville earn 93.4 cents for every dollar earned by a man.
What is Family Income Deficit in Pinckneyville?
Family Income Deficit in Pinckneyville is $13,690.
Families that are below poverty line in Pinckneyville earn $13,690 less on average than the poverty threshold level.
What is Inequality or Gini Index in Pinckneyville?
Inequality or Gini Index in Pinckneyville is 0.47.
What is the Total Population of Pinckneyville?
Total Population of Pinckneyville is 5,104.
What is the Total Male Population of Pinckneyville?
Total Male Population of Pinckneyville is 3,316.
What is the Total Female Population of Pinckneyville?
Total Female Population of Pinckneyville is 1,788.
What is the Ratio of Males per 100 Females in Pinckneyville?
There are 185.46 Males per 100 Females in Pinckneyville.
What is the Ratio of Females per 100 Males in Pinckneyville?
There are 53.92 Females per 100 Males in Pinckneyville.
What is the Median Population Age in Pinckneyville?
Median Population Age in Pinckneyville is 39.2 Years.
What is the Average Family Size in Pinckneyville
Average Family Size in Pinckneyville is 2.6 People.
What is the Average Household Size in Pinckneyville
Average Household Size in Pinckneyville is 1.9 People.
How Large is the Labor Force in Pinckneyville?
There are 1,499 People in the Labor Forcein in Pinckneyville.
What is the Percentage of People in the Labor Force in Pinckneyville?
33.0% of People are in the Labor Force in Pinckneyville.
What is the Unemployment Rate in Pinckneyville?
Unemployment Rate in Pinckneyville is 1.8%.