Oneida, IL Map & Demographics
Oneida Map
Oneida Overview
$26,815
PER CAPITA INCOME
$68,750
AVG FAMILY INCOME
$62,700
AVG HOUSEHOLD INCOME
20.2%
WAGE / INCOME GAP [ % ]
79.8¢/ $1
WAGE / INCOME GAP [ $ ]
0.37
INEQUALITY / GINI INDEX
732
TOTAL POPULATION
318
MALE POPULATION
414
FEMALE POPULATION
76.81
MALES / 100 FEMALES
130.19
FEMALES / 100 MALES
41.5
MEDIAN AGE
3.6
AVG FAMILY SIZE
2.6
AVG HOUSEHOLD SIZE
295
LABOR FORCE [ PEOPLE ]
48.8%
PERCENT IN LABOR FORCE
3.7%
UNEMPLOYMENT RATE
Oneida Zip Codes
Oneida Area Codes
Income in Oneida
Income Overview in Oneida
Per Capita Income in Oneida is $26,815, while median incomes of families and households are $68,750 and $62,700 respectively.
| Characteristic | Number | Measure |
| Per Capita Income | 732 | $26,815 |
| Median Family Income | 169 | $68,750 |
| Mean Family Income | 169 | $82,744 |
| Median Household Income | 280 | $62,700 |
| Mean Household Income | 280 | $70,313 |
| Income Deficit | 169 | $0 |
| Wage / Income Gap (%) | 732 | 20.19% |
| Wage / Income Gap ($) | 732 | 79.81¢ per $1 |
| Gini / Inequality Index | 732 | 0.37 |
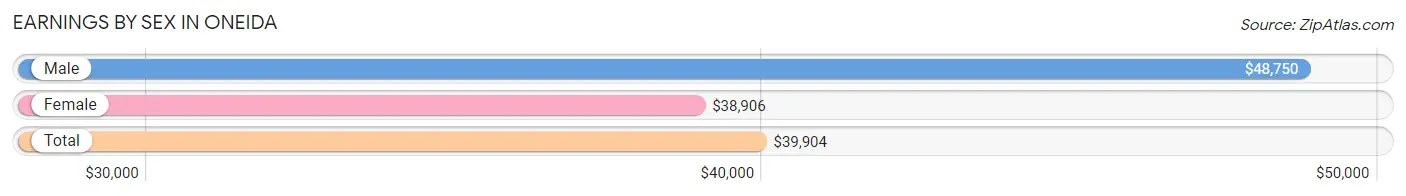
Earnings by Sex in Oneida
Average Earnings in Oneida are $39,904, $48,750 for men and $38,906 for women, a difference of 20.2%.
| Sex | Number | Average Earnings |
| Male | 154 (52.0%) | $48,750 |
| Female | 142 (48.0%) | $38,906 |
| Total | 296 (100.0%) | $39,904 |
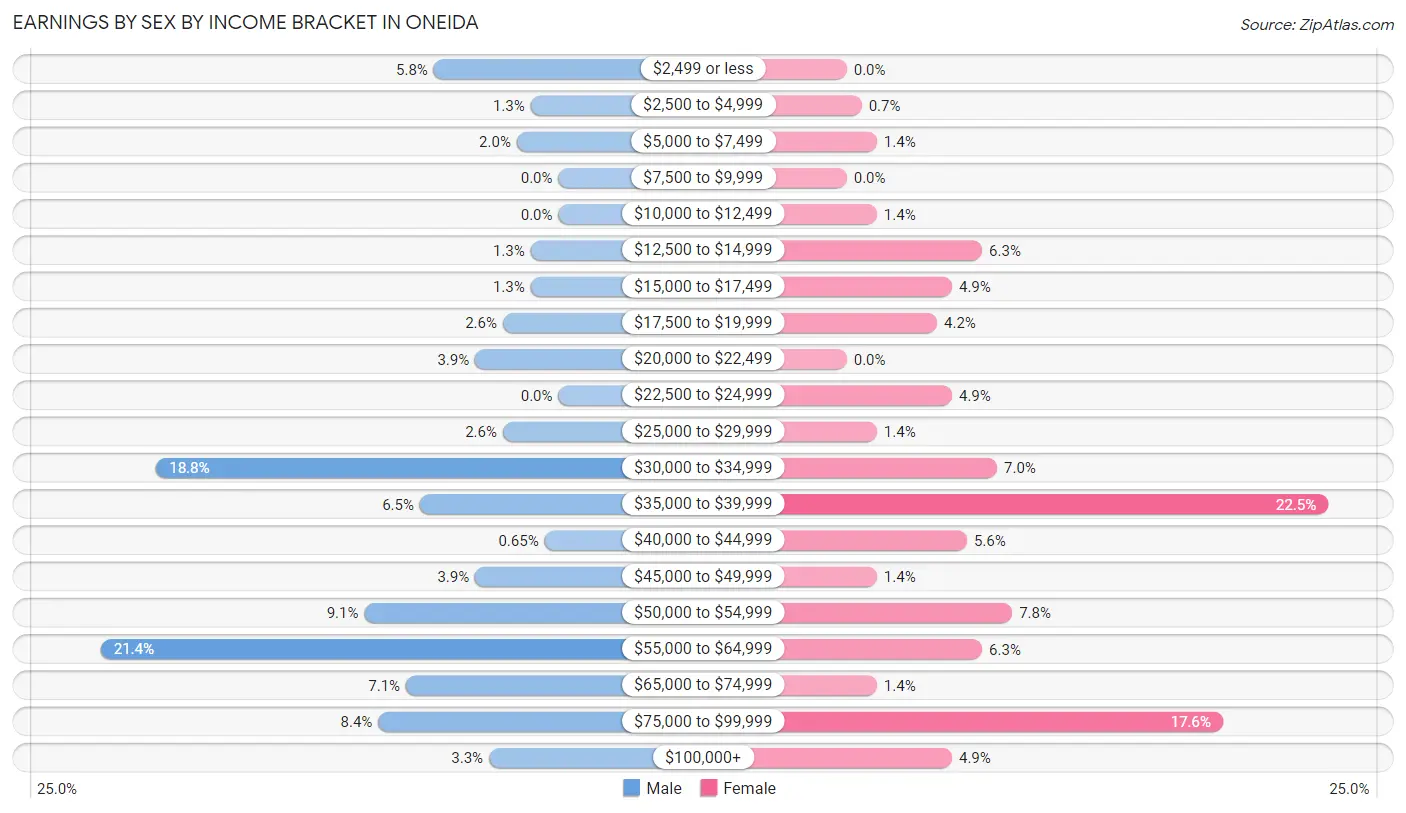
Earnings by Sex by Income Bracket in Oneida
The most common earnings brackets in Oneida are $55,000 to $64,999 for men (33 | 21.4%) and $35,000 to $39,999 for women (32 | 22.5%).
| Income | Male | Female |
| $2,499 or less | 9 (5.8%) | 0 (0.0%) |
| $2,500 to $4,999 | 2 (1.3%) | 1 (0.7%) |
| $5,000 to $7,499 | 3 (1.9%) | 2 (1.4%) |
| $7,500 to $9,999 | 0 (0.0%) | 0 (0.0%) |
| $10,000 to $12,499 | 0 (0.0%) | 2 (1.4%) |
| $12,500 to $14,999 | 2 (1.3%) | 9 (6.3%) |
| $15,000 to $17,499 | 2 (1.3%) | 7 (4.9%) |
| $17,500 to $19,999 | 4 (2.6%) | 6 (4.2%) |
| $20,000 to $22,499 | 6 (3.9%) | 0 (0.0%) |
| $22,500 to $24,999 | 0 (0.0%) | 7 (4.9%) |
| $25,000 to $29,999 | 4 (2.6%) | 2 (1.4%) |
| $30,000 to $34,999 | 29 (18.8%) | 10 (7.0%) |
| $35,000 to $39,999 | 10 (6.5%) | 32 (22.5%) |
| $40,000 to $44,999 | 1 (0.6%) | 8 (5.6%) |
| $45,000 to $49,999 | 6 (3.9%) | 2 (1.4%) |
| $50,000 to $54,999 | 14 (9.1%) | 11 (7.7%) |
| $55,000 to $64,999 | 33 (21.4%) | 9 (6.3%) |
| $65,000 to $74,999 | 11 (7.1%) | 2 (1.4%) |
| $75,000 to $99,999 | 13 (8.4%) | 25 (17.6%) |
| $100,000+ | 5 (3.3%) | 7 (4.9%) |
| Total | 154 (100.0%) | 142 (100.0%) |
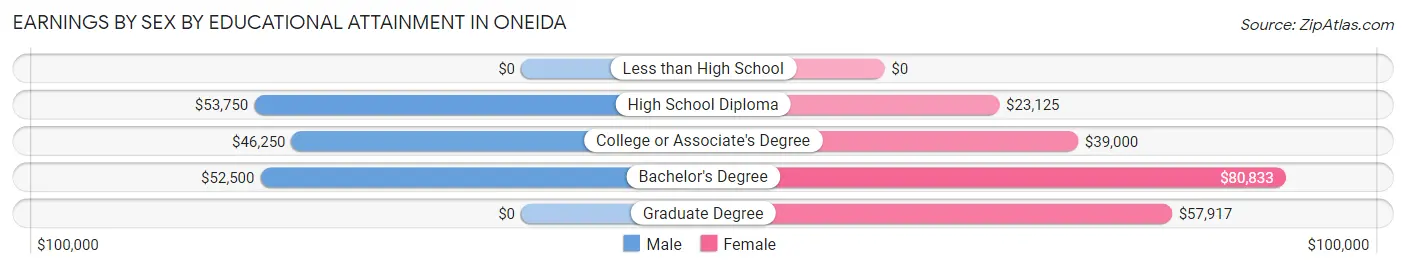
Earnings by Sex by Educational Attainment in Oneida
Average earnings in Oneida are $53,438 for men and $40,000 for women, a difference of 25.2%. Men with an educational attainment of high school diploma enjoy the highest average annual earnings of $53,750, while those with college or associate's degree education earn the least with $46,250. Women with an educational attainment of bachelor's degree earn the most with the average annual earnings of $80,833, while those with high school diploma education have the smallest earnings of $23,125.
| Educational Attainment | Male Income | Female Income |
| Less than High School | - | - |
| High School Diploma | $53,750 | $23,125 |
| College or Associate's Degree | $46,250 | $39,000 |
| Bachelor's Degree | $52,500 | $80,833 |
| Graduate Degree | - | - |
| Total | $53,438 | $40,000 |
Family Income in Oneida
Family Income Brackets in Oneida
According to the Oneida family income data, there are 51 families falling into the $50,000 to $74,999 income range, which is the most common income bracket and makes up 30.2% of all families.
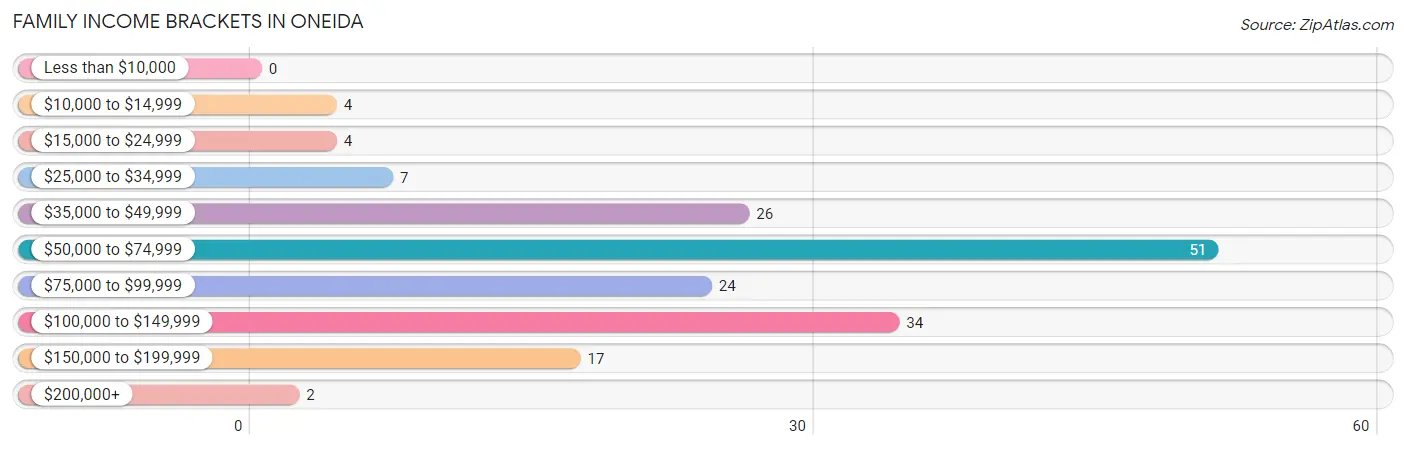
| Income Bracket | # Families | % Families |
| Less than $10,000 | 0 | 0.0% |
| $10,000 to $14,999 | 4 | 2.4% |
| $15,000 to $24,999 | 4 | 2.4% |
| $25,000 to $34,999 | 7 | 4.1% |
| $35,000 to $49,999 | 26 | 15.4% |
| $50,000 to $74,999 | 51 | 30.2% |
| $75,000 to $99,999 | 24 | 14.2% |
| $100,000 to $149,999 | 34 | 20.1% |
| $150,000 to $199,999 | 17 | 10.1% |
| $200,000+ | 2 | 1.2% |
Family Income by Famaliy Size in Oneida
4-person families (20 | 11.8%) account for the highest median family income in Oneida with $91,389 per family, while 2-person families (65 | 38.5%) have the highest median income of $38,438 per family member.
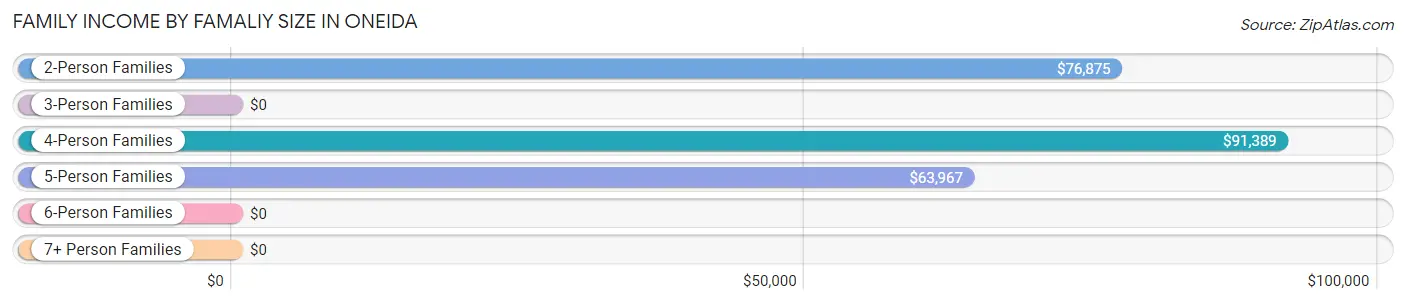
| Income Bracket | # Families | Median Income |
| 2-Person Families | 65 (38.5%) | $76,875 |
| 3-Person Families | 45 (26.6%) | $0 |
| 4-Person Families | 20 (11.8%) | $91,389 |
| 5-Person Families | 37 (21.9%) | $63,967 |
| 6-Person Families | 2 (1.2%) | $0 |
| 7+ Person Families | 0 (0.0%) | $0 |
| Total | 169 (100.0%) | $68,750 |
Family Income by Number of Earners in Oneida
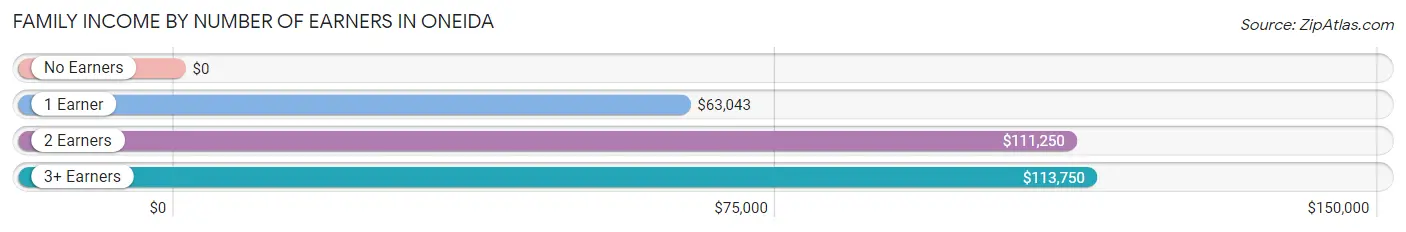
| Number of Earners | # Families | Median Income |
| No Earners | 23 (13.6%) | $0 |
| 1 Earner | 84 (49.7%) | $63,043 |
| 2 Earners | 45 (26.6%) | $111,250 |
| 3+ Earners | 17 (10.1%) | $113,750 |
| Total | 169 (100.0%) | $68,750 |
Household Income in Oneida
Household Income Brackets in Oneida
With 56 households falling in the category, the $35,000 to $49,999 income range is the most frequent in Oneida, accounting for 20.0% of all households. In contrast, only 1 households (0.4%) fall into the $10,000 to $14,999 income bracket, making it the least populous group.
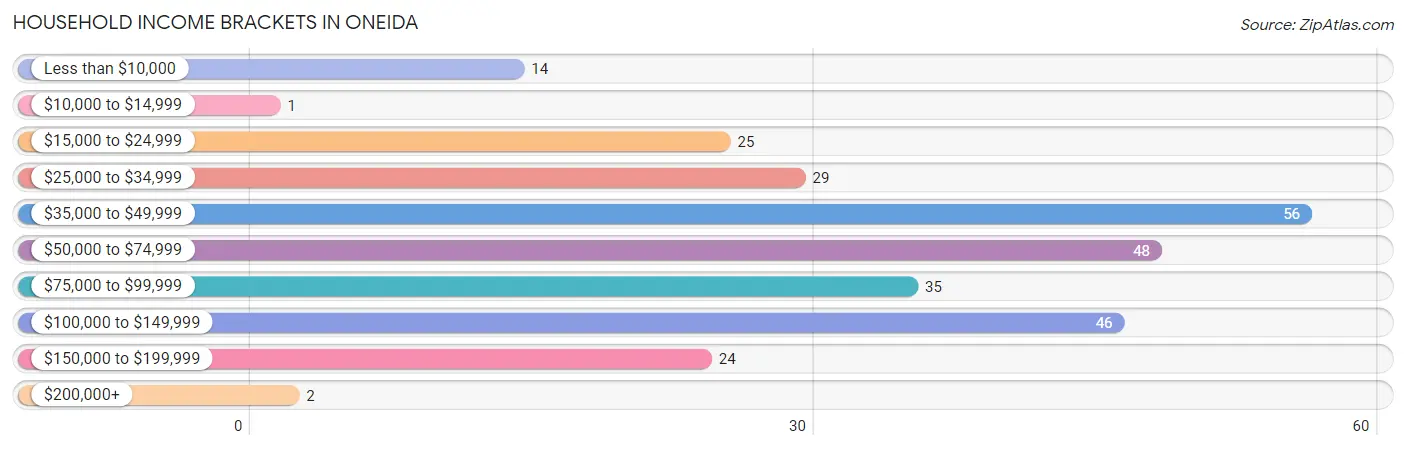
| Income Bracket | # Households | % Households |
| Less than $10,000 | 14 | 5.0% |
| $10,000 to $14,999 | 1 | 0.4% |
| $15,000 to $24,999 | 25 | 8.9% |
| $25,000 to $34,999 | 29 | 10.4% |
| $35,000 to $49,999 | 56 | 20.0% |
| $50,000 to $74,999 | 48 | 17.1% |
| $75,000 to $99,999 | 35 | 12.5% |
| $100,000 to $149,999 | 46 | 16.4% |
| $150,000 to $199,999 | 24 | 8.6% |
| $200,000+ | 2 | 0.7% |
Household Income by Householder Age in Oneida
The median household income in Oneida is $62,700, with the highest median household income of $68,125 found in the 25 to 44 years age bracket for the primary householder. A total of 71 households (25.4%) fall into this category. Meanwhile, the 15 to 24 years age bracket for the primary householder has the lowest median household income of $0, with 4 households (1.4%) in this group.
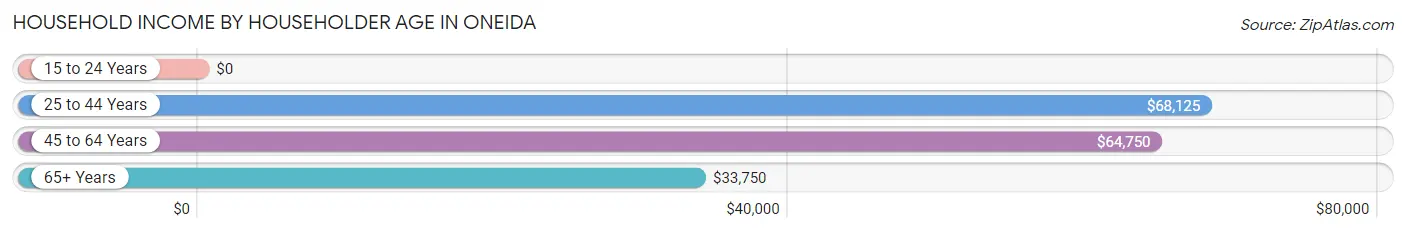
| Income Bracket | # Households | Median Income |
| 15 to 24 Years | 4 (1.4%) | $0 |
| 25 to 44 Years | 71 (25.4%) | $68,125 |
| 45 to 64 Years | 117 (41.8%) | $64,750 |
| 65+ Years | 88 (31.4%) | $33,750 |
| Total | 280 (100.0%) | $62,700 |
Poverty in Oneida
Income Below Poverty by Sex and Age in Oneida
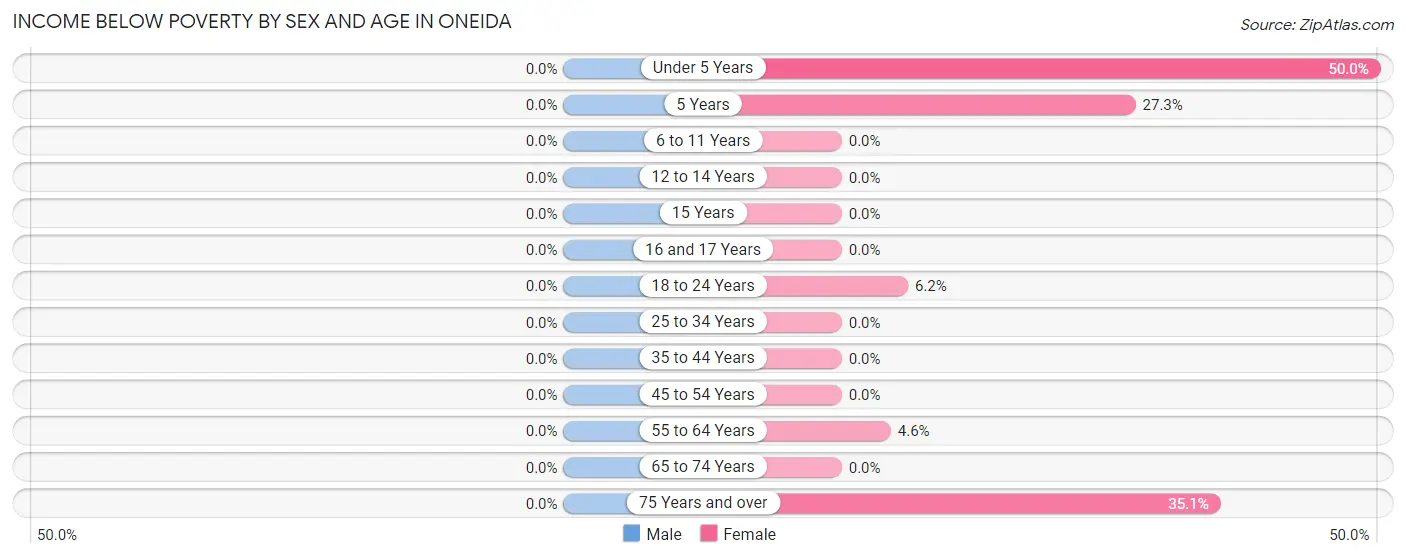
| Age Bracket | Male | Female |
| Under 5 Years | 0 (0.0%) | 4 (50.0%) |
| 5 Years | 0 (0.0%) | 3 (27.3%) |
| 6 to 11 Years | 0 (0.0%) | 0 (0.0%) |
| 12 to 14 Years | 0 (0.0%) | 0 (0.0%) |
| 15 Years | 0 (0.0%) | 0 (0.0%) |
| 16 and 17 Years | 0 (0.0%) | 0 (0.0%) |
| 18 to 24 Years | 0 (0.0%) | 4 (6.1%) |
| 25 to 34 Years | 0 (0.0%) | 0 (0.0%) |
| 35 to 44 Years | 0 (0.0%) | 0 (0.0%) |
| 45 to 54 Years | 0 (0.0%) | 0 (0.0%) |
| 55 to 64 Years | 0 (0.0%) | 2 (4.5%) |
| 65 to 74 Years | 0 (0.0%) | 0 (0.0%) |
| 75 Years and over | 0 (0.0%) | 13 (35.1%) |
| Total | 0 (0.0%) | 26 (6.3%) |
Income Above Poverty by Sex and Age in Oneida
According to the poverty statistics in Oneida, males aged under 5 years and females aged 6 to 11 years are the age groups that are most secure financially, with 100.0% of males and 100.0% of females in these age groups living above the poverty line.
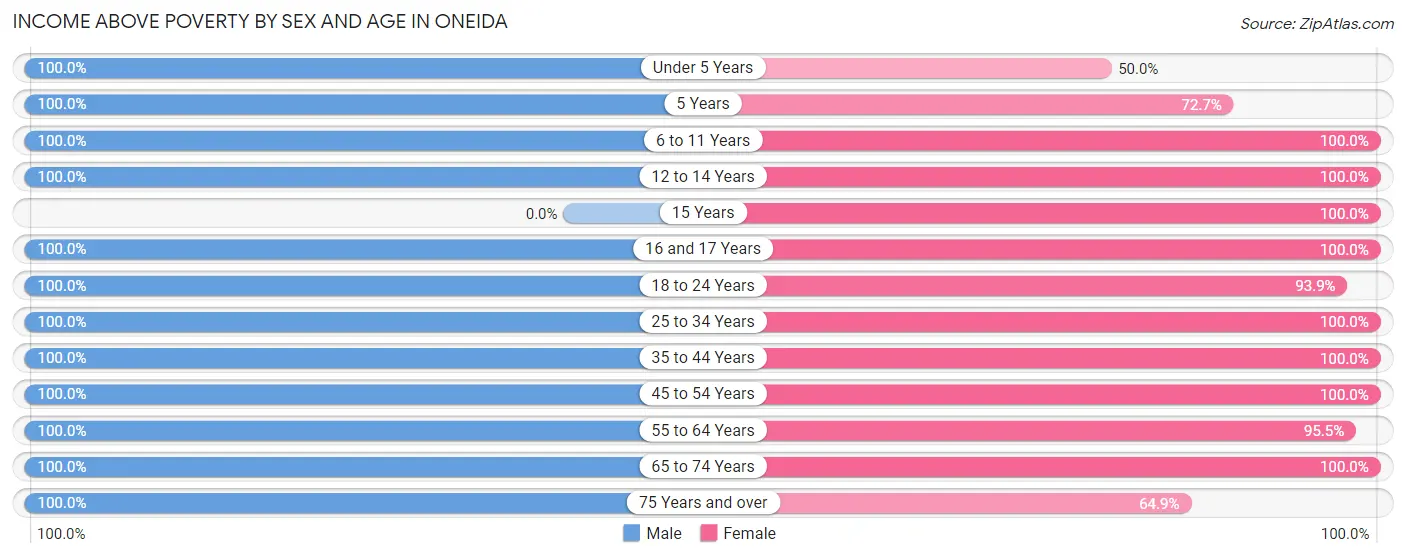
| Age Bracket | Male | Female |
| Under 5 Years | 33 (100.0%) | 4 (50.0%) |
| 5 Years | 5 (100.0%) | 8 (72.7%) |
| 6 to 11 Years | 23 (100.0%) | 20 (100.0%) |
| 12 to 14 Years | 10 (100.0%) | 10 (100.0%) |
| 15 Years | 0 (0.0%) | 7 (100.0%) |
| 16 and 17 Years | 36 (100.0%) | 31 (100.0%) |
| 18 to 24 Years | 16 (100.0%) | 61 (93.9%) |
| 25 to 34 Years | 22 (100.0%) | 25 (100.0%) |
| 35 to 44 Years | 36 (100.0%) | 31 (100.0%) |
| 45 to 54 Years | 57 (100.0%) | 91 (100.0%) |
| 55 to 64 Years | 32 (100.0%) | 42 (95.5%) |
| 65 to 74 Years | 33 (100.0%) | 34 (100.0%) |
| 75 Years and over | 15 (100.0%) | 24 (64.9%) |
| Total | 318 (100.0%) | 388 (93.7%) |
Income Below Poverty Among Married-Couple Families in Oneida
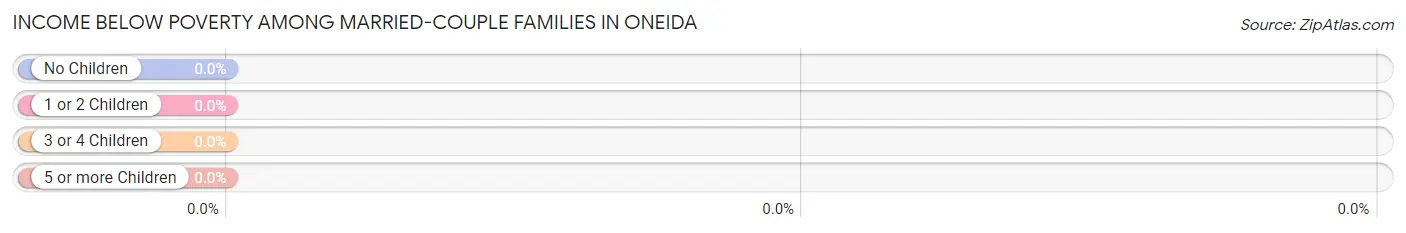
| Children | Above Poverty | Below Poverty |
| No Children | 65 (100.0%) | 0 (0.0%) |
| 1 or 2 Children | 56 (100.0%) | 0 (0.0%) |
| 3 or 4 Children | 8 (100.0%) | 0 (0.0%) |
| 5 or more Children | 0 (0.0%) | 0 (0.0%) |
| Total | 129 (100.0%) | 0 (0.0%) |
Income Below Poverty Among Single-Parent Households in Oneida
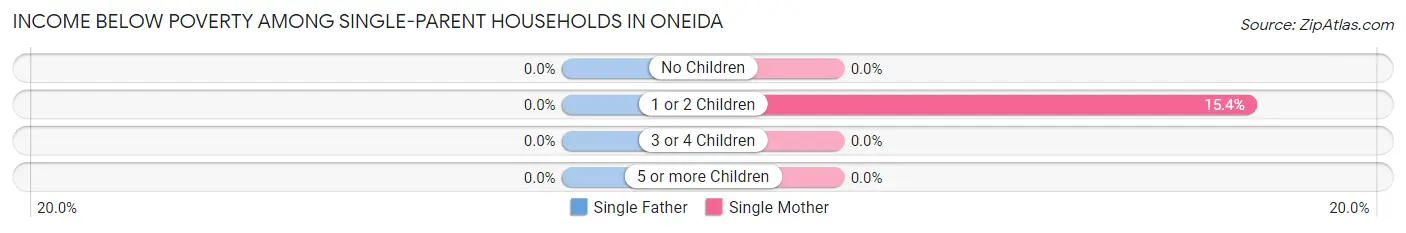
| Children | Single Father | Single Mother |
| No Children | 0 (0.0%) | 0 (0.0%) |
| 1 or 2 Children | 0 (0.0%) | 4 (15.4%) |
| 3 or 4 Children | 0 (0.0%) | 0 (0.0%) |
| 5 or more Children | 0 (0.0%) | 0 (0.0%) |
| Total | 0 (0.0%) | 4 (12.5%) |
Income Below Poverty Among Married-Couple vs Single-Parent Households in Oneida
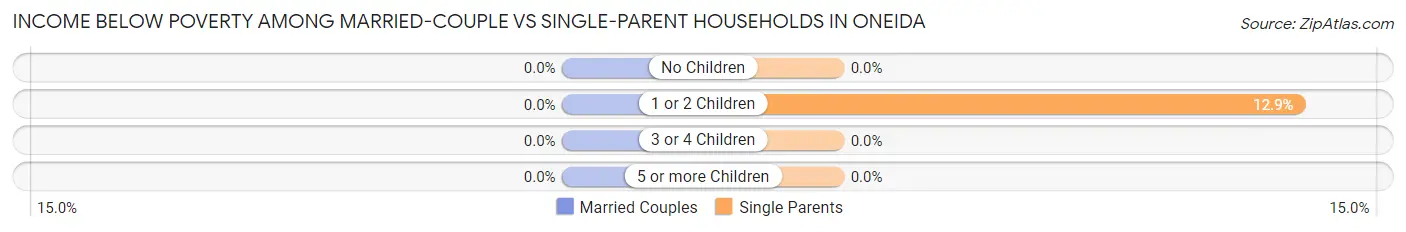
| Children | Married-Couple Families | Single-Parent Households |
| No Children | 0 (0.0%) | 0 (0.0%) |
| 1 or 2 Children | 0 (0.0%) | 4 (12.9%) |
| 3 or 4 Children | 0 (0.0%) | 0 (0.0%) |
| 5 or more Children | 0 (0.0%) | 0 (0.0%) |
| Total | 0 (0.0%) | 4 (10.0%) |
Race in Oneida
The most populous races in Oneida are White / Caucasian (722 | 98.6%), Hispanic or Latino (5 | 0.7%), and Some other Race (5 | 0.7%).
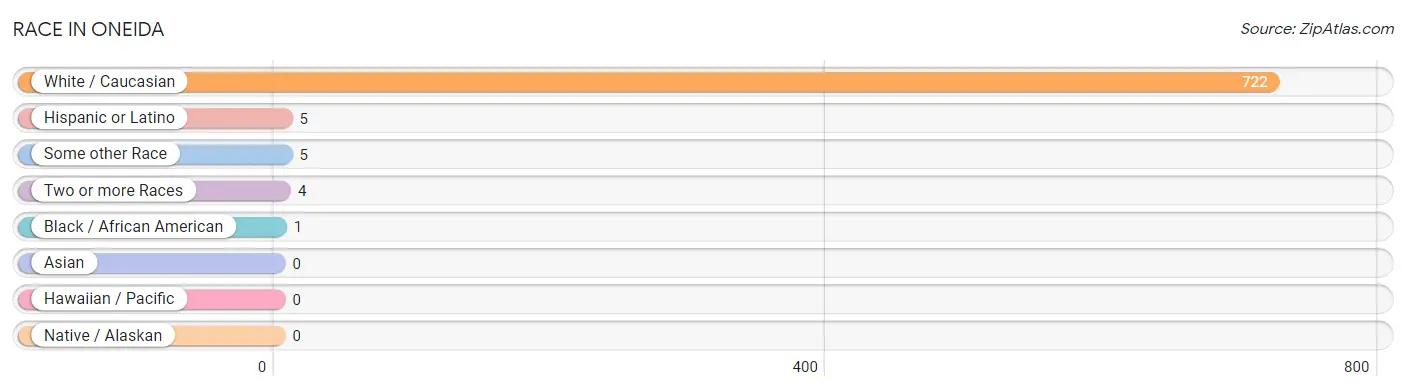
| Race | # Population | % Population |
| Asian | 0 | 0.0% |
| Black / African American | 1 | 0.1% |
| Hawaiian / Pacific | 0 | 0.0% |
| Hispanic or Latino | 5 | 0.7% |
| Native / Alaskan | 0 | 0.0% |
| White / Caucasian | 722 | 98.6% |
| Two or more Races | 4 | 0.5% |
| Some other Race | 5 | 0.7% |
| Total | 732 | 100.0% |
Ancestry in Oneida
The most populous ancestries reported in Oneida are German (275 | 37.6%), Swedish (209 | 28.5%), Irish (149 | 20.4%), English (62 | 8.5%), and American (17 | 2.3%), together accounting for 97.3% of all Oneida residents.
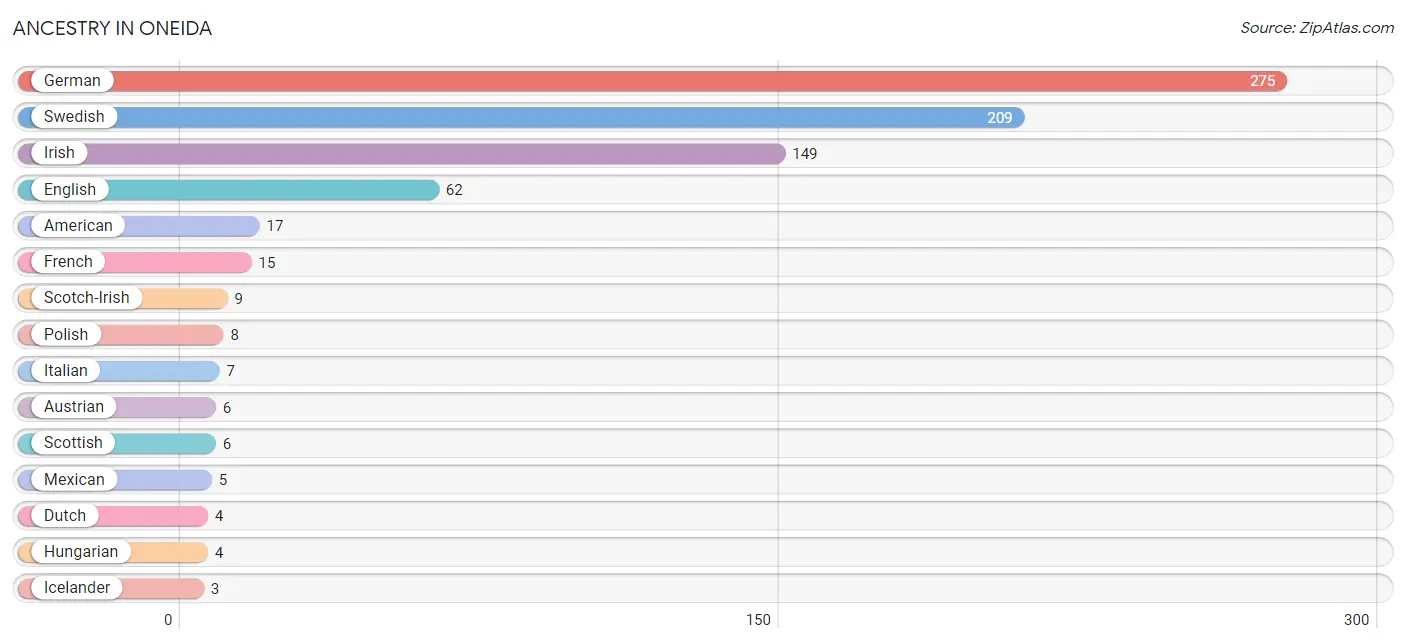
| Ancestry | # Population | % Population |
| American | 17 | 2.3% |
| Austrian | 6 | 0.8% |
| Bhutanese | 1 | 0.1% |
| Danish | 2 | 0.3% |
| Dutch | 4 | 0.5% |
| English | 62 | 8.5% |
| French | 15 | 2.1% |
| German | 275 | 37.6% |
| Hungarian | 4 | 0.5% |
| Icelander | 3 | 0.4% |
| Irish | 149 | 20.4% |
| Italian | 7 | 1.0% |
| Mexican | 5 | 0.7% |
| Native Hawaiian | 1 | 0.1% |
| Norwegian | 3 | 0.4% |
| Polish | 8 | 1.1% |
| Scotch-Irish | 9 | 1.2% |
| Scottish | 6 | 0.8% |
| Slovak | 2 | 0.3% |
| Swedish | 209 | 28.5% |
| Yugoslavian | 3 | 0.4% | View All 21 Rows |
Immigrants in Oneida

| Immigration Origin | # Population | % Population | View All 0 Rows |
Sex and Age in Oneida
Sex and Age in Oneida
The most populous age groups in Oneida are 15 to 19 Years (47 | 14.8%) for men and 45 to 49 Years (66 | 15.9%) for women.
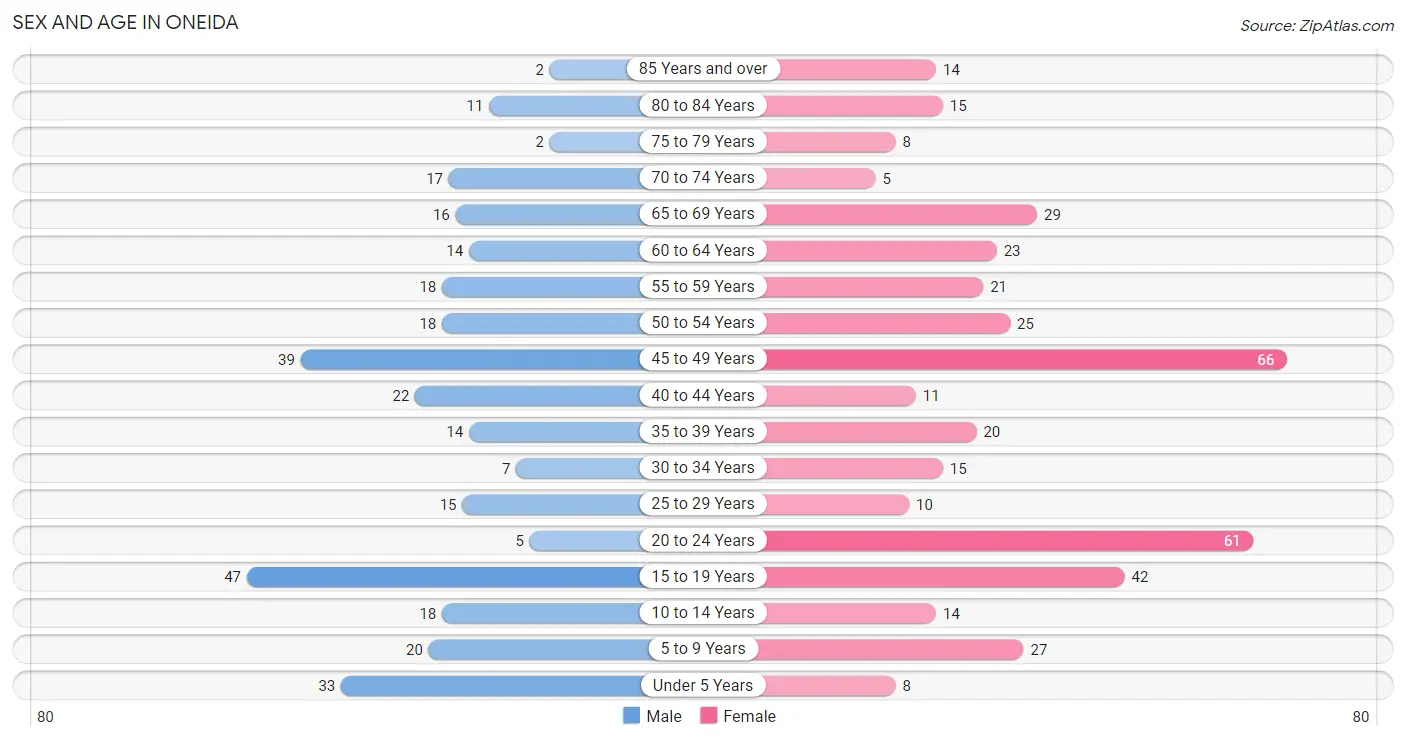
| Age Bracket | Male | Female |
| Under 5 Years | 33 (10.4%) | 8 (1.9%) |
| 5 to 9 Years | 20 (6.3%) | 27 (6.5%) |
| 10 to 14 Years | 18 (5.7%) | 14 (3.4%) |
| 15 to 19 Years | 47 (14.8%) | 42 (10.1%) |
| 20 to 24 Years | 5 (1.6%) | 61 (14.7%) |
| 25 to 29 Years | 15 (4.7%) | 10 (2.4%) |
| 30 to 34 Years | 7 (2.2%) | 15 (3.6%) |
| 35 to 39 Years | 14 (4.4%) | 20 (4.8%) |
| 40 to 44 Years | 22 (6.9%) | 11 (2.7%) |
| 45 to 49 Years | 39 (12.3%) | 66 (15.9%) |
| 50 to 54 Years | 18 (5.7%) | 25 (6.0%) |
| 55 to 59 Years | 18 (5.7%) | 21 (5.1%) |
| 60 to 64 Years | 14 (4.4%) | 23 (5.6%) |
| 65 to 69 Years | 16 (5.0%) | 29 (7.0%) |
| 70 to 74 Years | 17 (5.3%) | 5 (1.2%) |
| 75 to 79 Years | 2 (0.6%) | 8 (1.9%) |
| 80 to 84 Years | 11 (3.5%) | 15 (3.6%) |
| 85 Years and over | 2 (0.6%) | 14 (3.4%) |
| Total | 318 (100.0%) | 414 (100.0%) |
Families and Households in Oneida
Median Family Size in Oneida
The median family size in Oneida is 3.58 persons per family, with married-couple families (129 | 76.3%) accounting for the largest median family size of 3.88 persons per family. On the other hand, single female/mother families (32 | 18.9%) represent the smallest median family size with 2.59 persons per family.
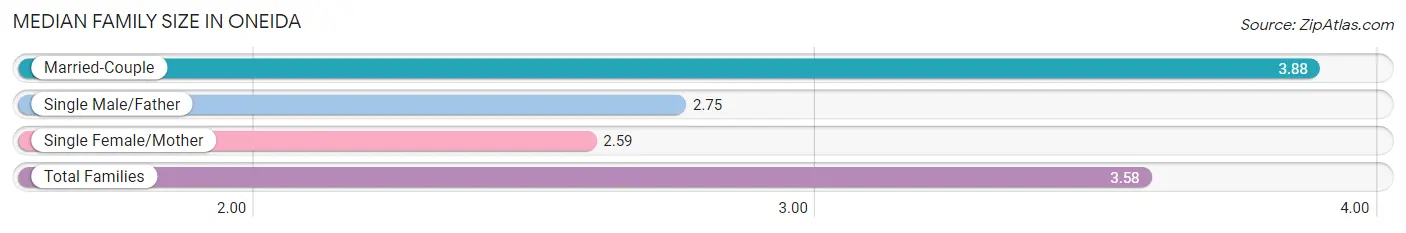
| Family Type | # Families | Family Size |
| Married-Couple | 129 (76.3%) | 3.88 |
| Single Male/Father | 8 (4.7%) | 2.75 |
| Single Female/Mother | 32 (18.9%) | 2.59 |
| Total Families | 169 (100.0%) | 3.58 |
Median Household Size in Oneida
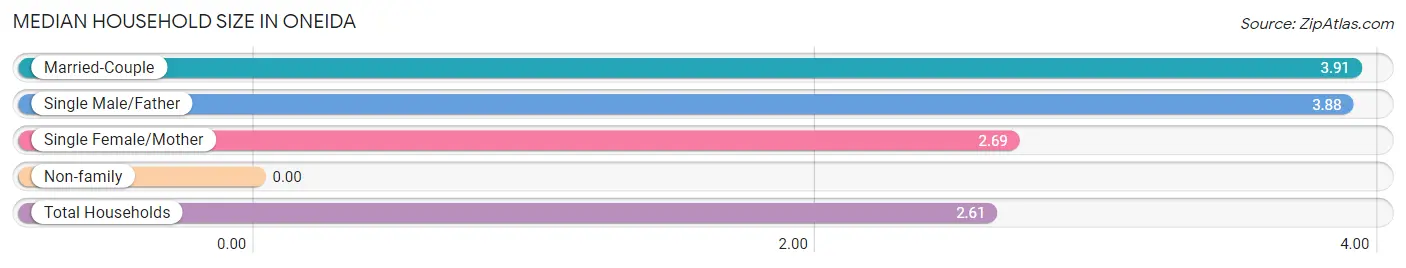
| Household Type | # Households | Household Size |
| Married-Couple | 129 (46.1%) | 3.91 |
| Single Male/Father | 8 (2.9%) | 3.88 |
| Single Female/Mother | 32 (11.4%) | 2.69 |
| Non-family | 111 (39.6%) | - |
| Total Households | 280 (100.0%) | 2.61 |
Household Size by Marriage Status in Oneida
Out of a total of 280 households in Oneida, 169 (60.4%) are family households, while 111 (39.6%) are nonfamily households. The most numerous type of family households are 2-person households, comprising 62, and the most common type of nonfamily households are 1-person households, comprising 111.
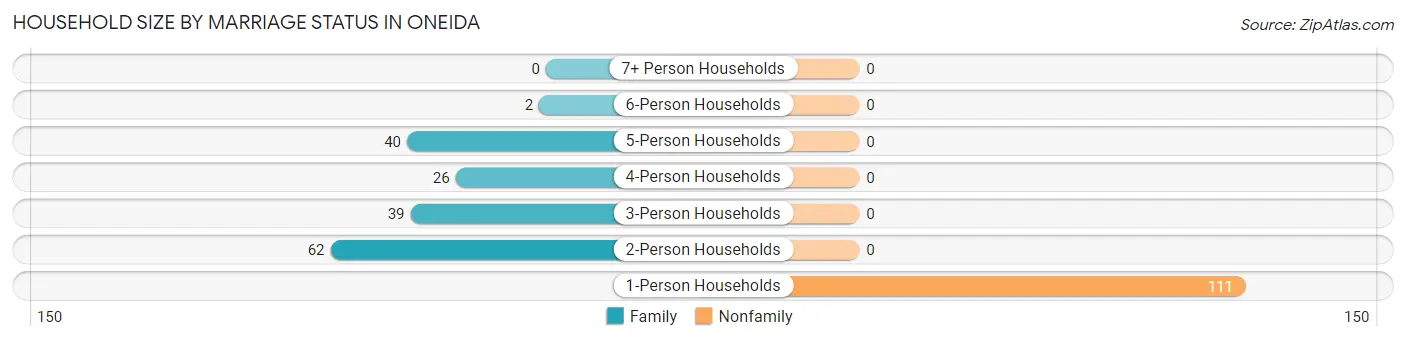
| Household Size | Family Households | Nonfamily Households |
| 1-Person Households | - | 111 (39.6%) |
| 2-Person Households | 62 (22.1%) | 0 (0.0%) |
| 3-Person Households | 39 (13.9%) | 0 (0.0%) |
| 4-Person Households | 26 (9.3%) | 0 (0.0%) |
| 5-Person Households | 40 (14.3%) | 0 (0.0%) |
| 6-Person Households | 2 (0.7%) | 0 (0.0%) |
| 7+ Person Households | 0 (0.0%) | 0 (0.0%) |
| Total | 169 (60.4%) | 111 (39.6%) |
Female Fertility in Oneida
Fertility by Age in Oneida
Average fertility rate in Oneida is 17.0 births per 1,000 women. Women in the age bracket of 20 to 34 years have the highest fertility rate with 47.0 births per 1,000 women. Women in the age bracket of 20 to 34 years acount for 100.0% of all women with births.
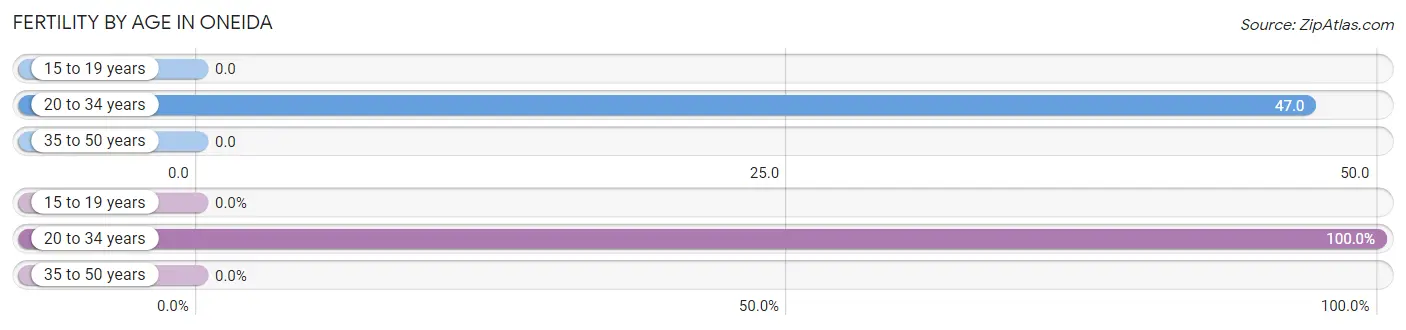
| Age Bracket | Women with Births | Births / 1,000 Women |
| 15 to 19 years | 0 (0.0%) | 0.0 |
| 20 to 34 years | 4 (100.0%) | 47.0 |
| 35 to 50 years | 0 (0.0%) | 0.0 |
| Total | 4 (100.0%) | 17.0 |
Fertility by Age by Marriage Status in Oneida
50.0% of women with births (4) in Oneida are married. The highest percentage of unmarried women with births falls into 20 to 34 years age bracket with 50.0% of them unmarried at the time of birth, while the lowest percentage of unmarried women with births belong to 20 to 34 years age bracket with 50.0% of them unmarried.
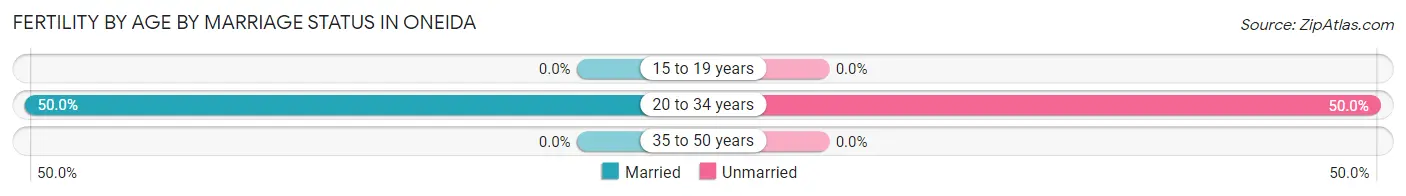
| Age Bracket | Married | Unmarried |
| 15 to 19 years | 0 (0.0%) | 0 (0.0%) |
| 20 to 34 years | 2 (50.0%) | 2 (50.0%) |
| 35 to 50 years | 0 (0.0%) | 0 (0.0%) |
| Total | 2 (50.0%) | 2 (50.0%) |
Fertility by Education in Oneida
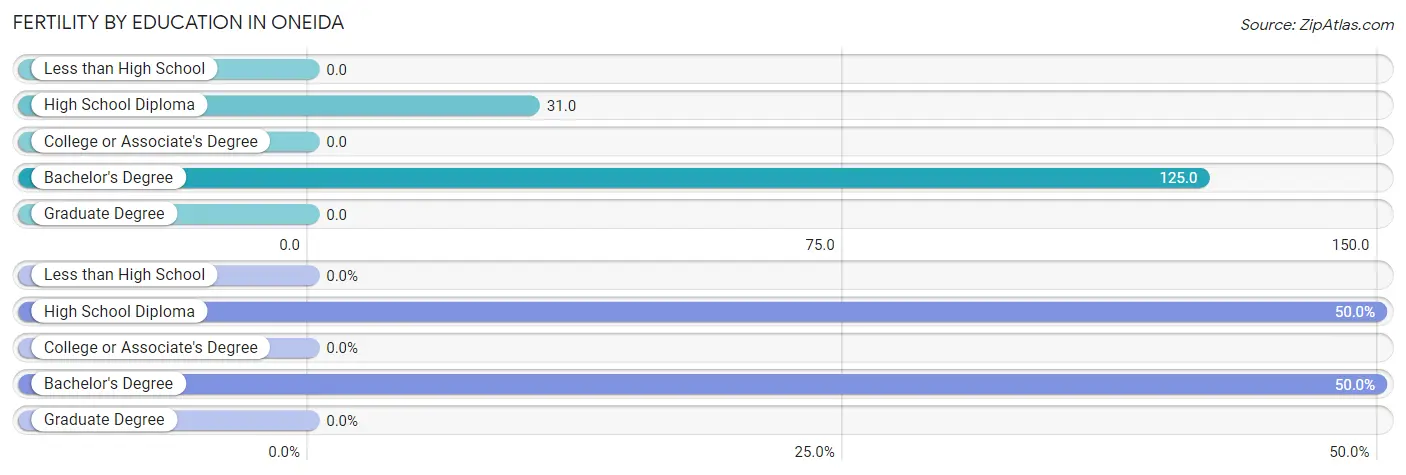
| Educational Attainment | Women with Births | Births / 1,000 Women |
| Less than High School | 0 (0.0%) | 0.0 |
| High School Diploma | 2 (50.0%) | 31.0 |
| College or Associate's Degree | 0 (0.0%) | 0.0 |
| Bachelor's Degree | 2 (50.0%) | 125.0 |
| Graduate Degree | 0 (0.0%) | 0.0 |
| Total | 4 (100.0%) | 17.0 |
Fertility by Education by Marriage Status in Oneida
50.0% of women with births in Oneida are unmarried. Women with the educational attainment of bachelor's degree are most likely to be married with 100.0% of them married at childbirth, while women with the educational attainment of high school diploma are least likely to be married with 100.0% of them unmarried at childbirth.
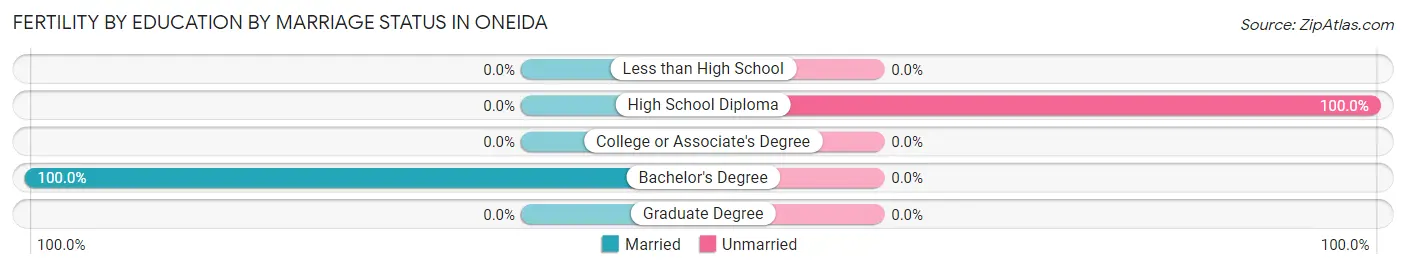
| Educational Attainment | Married | Unmarried |
| Less than High School | 0 (0.0%) | 0 (0.0%) |
| High School Diploma | 0 (0.0%) | 2 (100.0%) |
| College or Associate's Degree | 0 (0.0%) | 0 (0.0%) |
| Bachelor's Degree | 2 (100.0%) | 0 (0.0%) |
| Graduate Degree | 0 (0.0%) | 0 (0.0%) |
| Total | 2 (50.0%) | 2 (50.0%) |
Employment Characteristics in Oneida
Employment by Class of Employer in Oneida
Among the 284 employed individuals in Oneida, private company employees (189 | 66.5%), local government employees (34 | 12.0%), and not-for-profit organizations (18 | 6.3%) make up the most common classes of employment.
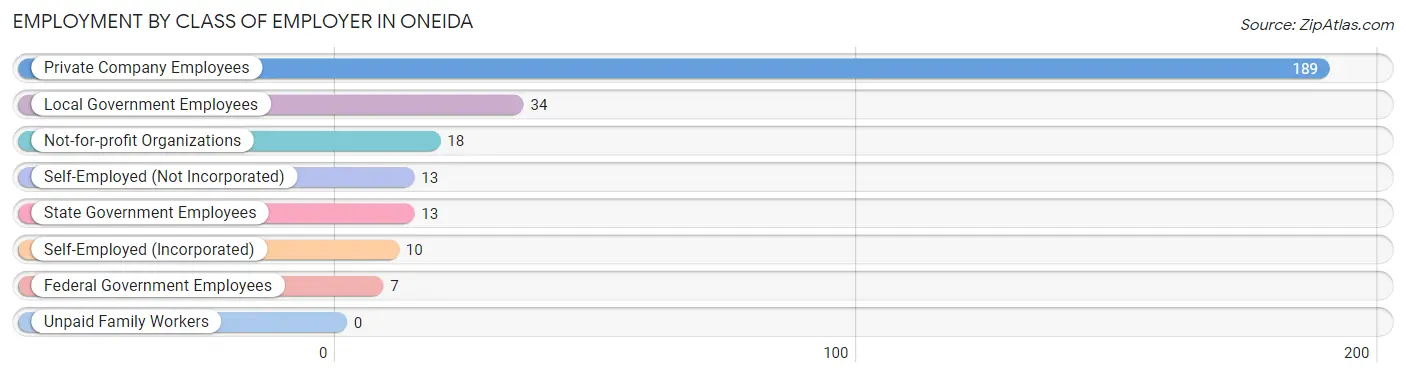
| Employer Class | # Employees | % Employees |
| Private Company Employees | 189 | 66.5% |
| Self-Employed (Incorporated) | 10 | 3.5% |
| Self-Employed (Not Incorporated) | 13 | 4.6% |
| Not-for-profit Organizations | 18 | 6.3% |
| Local Government Employees | 34 | 12.0% |
| State Government Employees | 13 | 4.6% |
| Federal Government Employees | 7 | 2.5% |
| Unpaid Family Workers | 0 | 0.0% |
| Total | 284 | 100.0% |
Employment Status by Age in Oneida
According to the labor force statistics for Oneida, out of the total population over 16 years of age (605), 48.8% or 295 individuals are in the labor force, with 3.7% or 11 of them unemployed. The age group with the highest labor force participation rate is 25 to 29 years, with 96.0% or 24 individuals in the labor force. Within the labor force, the 16 to 19 years age range has the highest percentage of unemployed individuals, with 21.4% or 3 of them being unemployed.
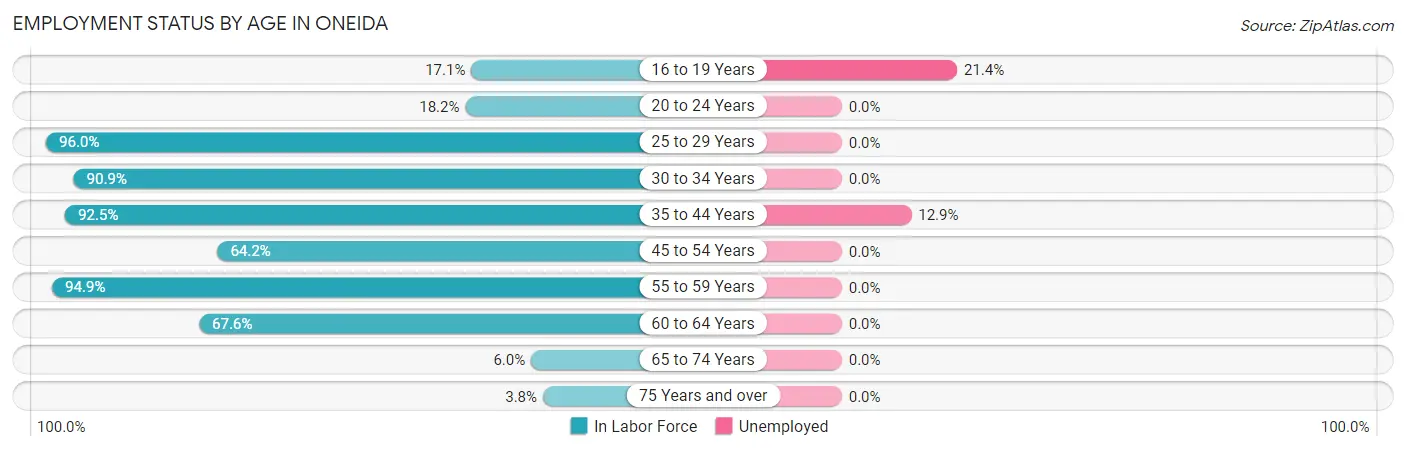
| Age Bracket | In Labor Force | Unemployed |
| 16 to 19 Years | 14 (17.1%) | 3 (21.4%) |
| 20 to 24 Years | 12 (18.2%) | 0 (0.0%) |
| 25 to 29 Years | 24 (96.0%) | 0 (0.0%) |
| 30 to 34 Years | 20 (90.9%) | 0 (0.0%) |
| 35 to 44 Years | 62 (92.5%) | 8 (12.9%) |
| 45 to 54 Years | 95 (64.2%) | 0 (0.0%) |
| 55 to 59 Years | 37 (94.9%) | 0 (0.0%) |
| 60 to 64 Years | 25 (67.6%) | 0 (0.0%) |
| 65 to 74 Years | 4 (6.0%) | 0 (0.0%) |
| 75 Years and over | 2 (3.8%) | 0 (0.0%) |
| Total | 295 (48.8%) | 11 (3.7%) |
Employment Status by Educational Attainment in Oneida
According to labor force statistics for Oneida, 77.8% of individuals (263) out of the total population between 25 and 64 years of age (338) are in the labor force, with 3.0% or 8 of them being unemployed. The group with the highest labor force participation rate are those with the educational attainment of bachelor's degree or higher, with 92.4% or 73 individuals in the labor force. Within the labor force, individuals with college / associate degree education have the highest percentage of unemployment, with 8.3% or 8 of them being unemployed.
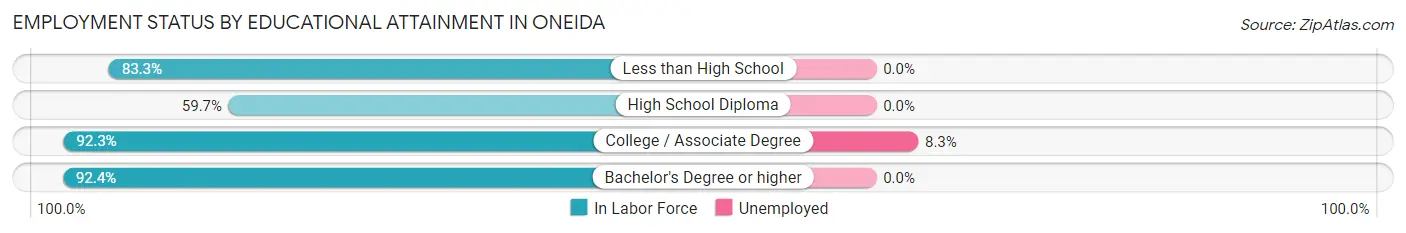
| Educational Attainment | In Labor Force | Unemployed |
| Less than High School | 5 (83.3%) | 0 (0.0%) |
| High School Diploma | 89 (59.7%) | 0 (0.0%) |
| College / Associate Degree | 96 (92.3%) | 9 (8.3%) |
| Bachelor's Degree or higher | 73 (92.4%) | 0 (0.0%) |
| Total | 263 (77.8%) | 10 (3.0%) |
Employment Occupations by Sex in Oneida
Management, Business, Science and Arts Occupations
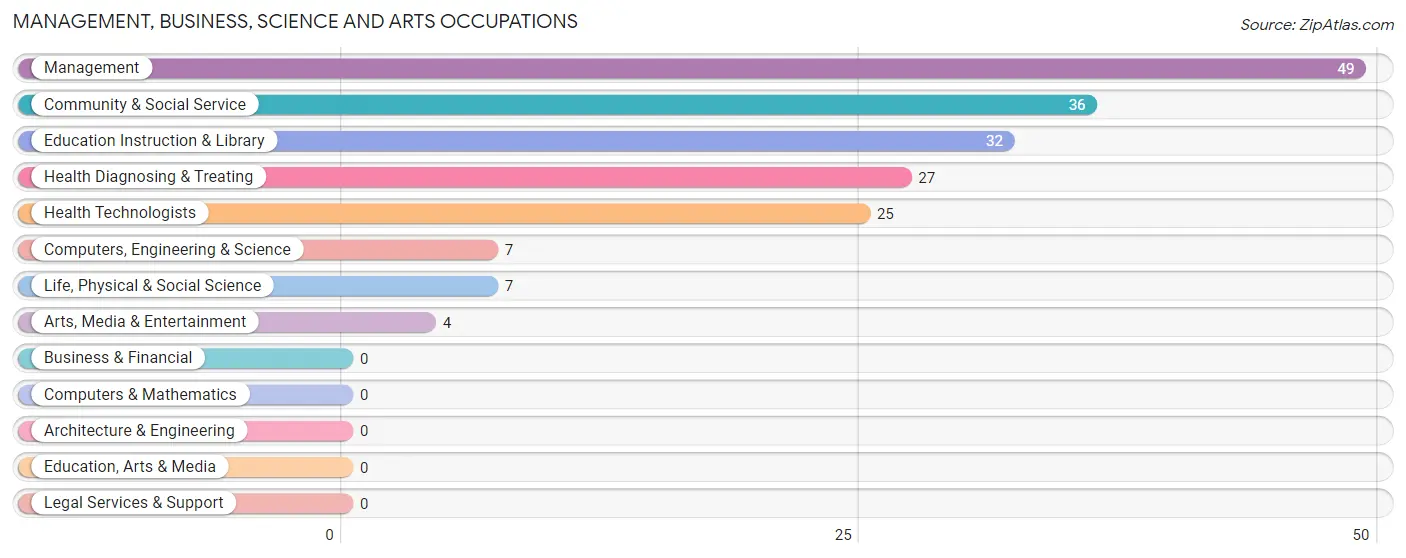
The most common Management, Business, Science and Arts occupations in Oneida are Management (49 | 17.2%), Community & Social Service (36 | 12.7%), Education Instruction & Library (32 | 11.3%), Health Diagnosing & Treating (27 | 9.5%), and Health Technologists (25 | 8.8%).
Management, Business, Science and Arts Occupations by Sex
Within the Management, Business, Science and Arts occupations in Oneida, the most male-oriented occupations are Arts, Media & Entertainment (100.0%), Community & Social Service (33.3%), and Management (32.7%), while the most female-oriented occupations are Health Diagnosing & Treating (100.0%), Health Technologists (100.0%), and Education Instruction & Library (75.0%).
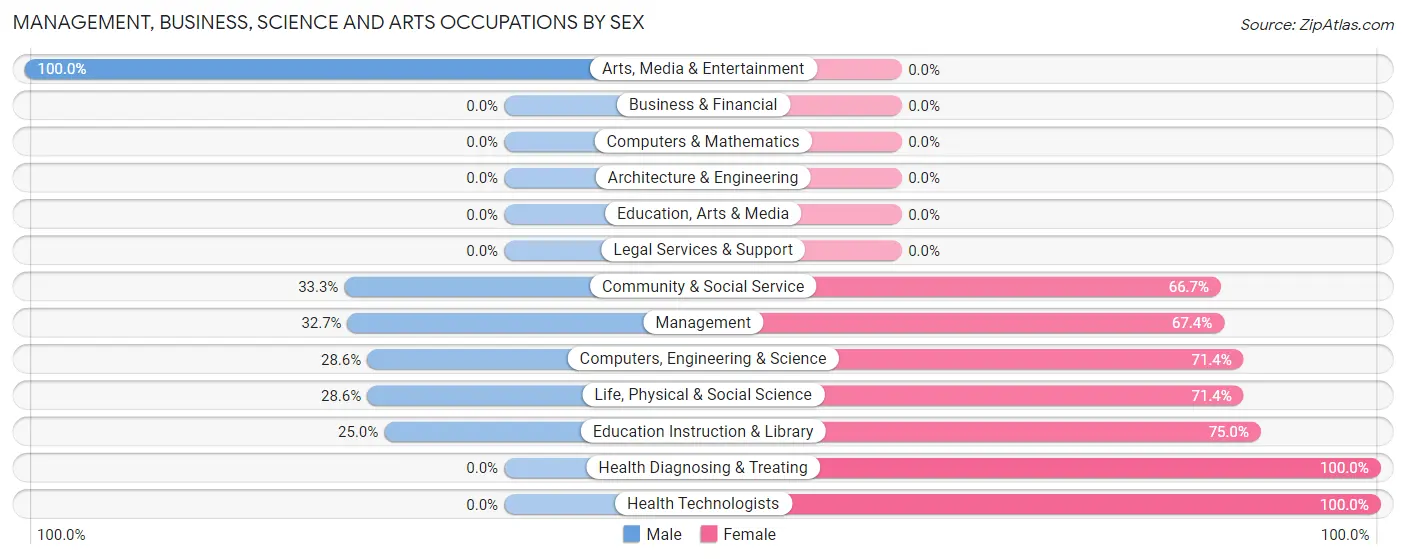
| Occupation | Male | Female |
| Management | 16 (32.7%) | 33 (67.3%) |
| Business & Financial | 0 (0.0%) | 0 (0.0%) |
| Computers, Engineering & Science | 2 (28.6%) | 5 (71.4%) |
| Computers & Mathematics | 0 (0.0%) | 0 (0.0%) |
| Architecture & Engineering | 0 (0.0%) | 0 (0.0%) |
| Life, Physical & Social Science | 2 (28.6%) | 5 (71.4%) |
| Community & Social Service | 12 (33.3%) | 24 (66.7%) |
| Education, Arts & Media | 0 (0.0%) | 0 (0.0%) |
| Legal Services & Support | 0 (0.0%) | 0 (0.0%) |
| Education Instruction & Library | 8 (25.0%) | 24 (75.0%) |
| Arts, Media & Entertainment | 4 (100.0%) | 0 (0.0%) |
| Health Diagnosing & Treating | 0 (0.0%) | 27 (100.0%) |
| Health Technologists | 0 (0.0%) | 25 (100.0%) |
| Total (Category) | 30 (25.2%) | 89 (74.8%) |
| Total (Overall) | 144 (50.7%) | 140 (49.3%) |
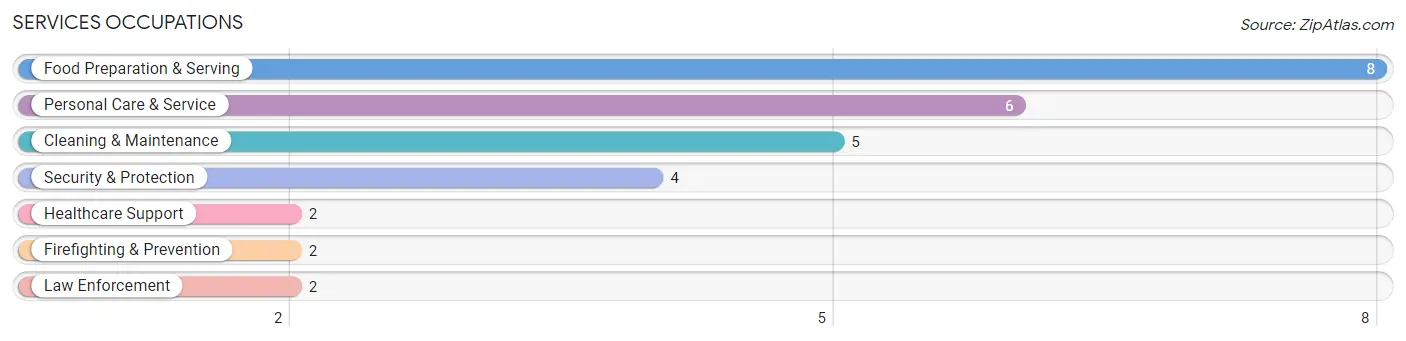
Services Occupations
The most common Services occupations in Oneida are Food Preparation & Serving (8 | 2.8%), Personal Care & Service (6 | 2.1%), Cleaning & Maintenance (5 | 1.8%), Security & Protection (4 | 1.4%), and Healthcare Support (2 | 0.7%).
Services Occupations by Sex
Within the Services occupations in Oneida, the most male-oriented occupations are Security & Protection (100.0%), Firefighting & Prevention (100.0%), and Law Enforcement (100.0%), while the most female-oriented occupations are Healthcare Support (100.0%), Food Preparation & Serving (75.0%), and Personal Care & Service (66.7%).
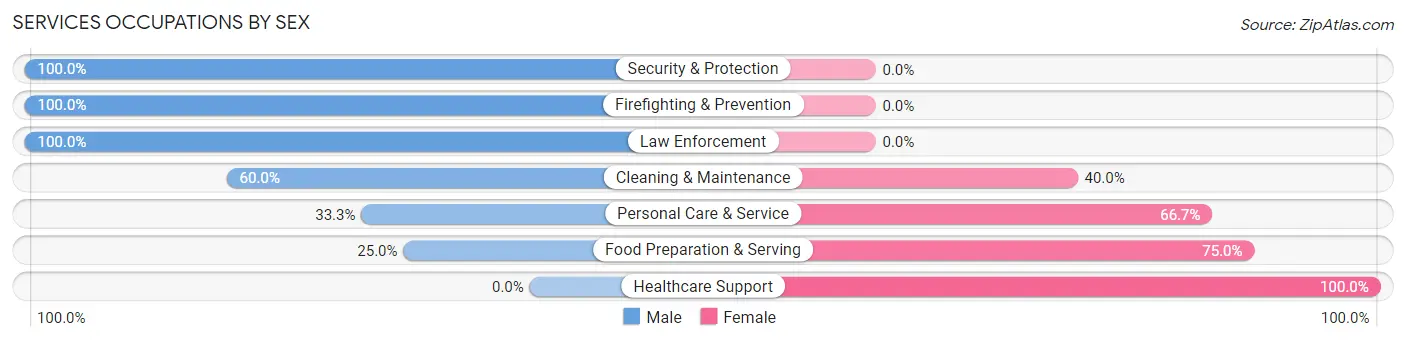
| Occupation | Male | Female |
| Healthcare Support | 0 (0.0%) | 2 (100.0%) |
| Security & Protection | 4 (100.0%) | 0 (0.0%) |
| Firefighting & Prevention | 2 (100.0%) | 0 (0.0%) |
| Law Enforcement | 2 (100.0%) | 0 (0.0%) |
| Food Preparation & Serving | 2 (25.0%) | 6 (75.0%) |
| Cleaning & Maintenance | 3 (60.0%) | 2 (40.0%) |
| Personal Care & Service | 2 (33.3%) | 4 (66.7%) |
| Total (Category) | 11 (44.0%) | 14 (56.0%) |
| Total (Overall) | 144 (50.7%) | 140 (49.3%) |
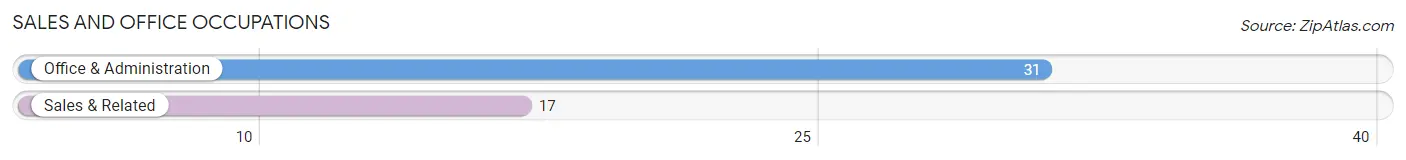
Sales and Office Occupations
The most common Sales and Office occupations in Oneida are Office & Administration (31 | 10.9%), and Sales & Related (17 | 6.0%).
Sales and Office Occupations by Sex
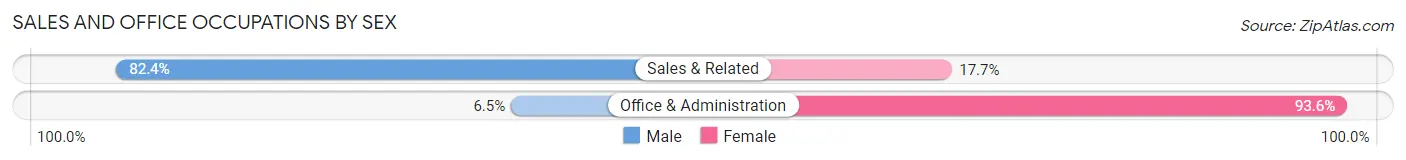
| Occupation | Male | Female |
| Sales & Related | 14 (82.4%) | 3 (17.6%) |
| Office & Administration | 2 (6.5%) | 29 (93.5%) |
| Total (Category) | 16 (33.3%) | 32 (66.7%) |
| Total (Overall) | 144 (50.7%) | 140 (49.3%) |
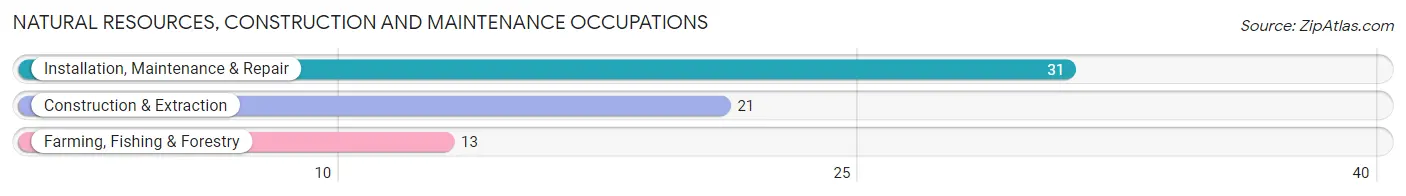
Natural Resources, Construction and Maintenance Occupations
The most common Natural Resources, Construction and Maintenance occupations in Oneida are Installation, Maintenance & Repair (31 | 10.9%), Construction & Extraction (21 | 7.4%), and Farming, Fishing & Forestry (13 | 4.6%).
Natural Resources, Construction and Maintenance Occupations by Sex
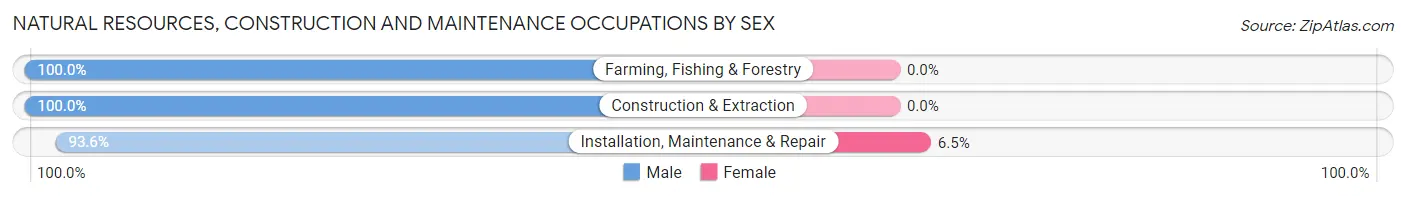
| Occupation | Male | Female |
| Farming, Fishing & Forestry | 13 (100.0%) | 0 (0.0%) |
| Construction & Extraction | 21 (100.0%) | 0 (0.0%) |
| Installation, Maintenance & Repair | 29 (93.5%) | 2 (6.5%) |
| Total (Category) | 63 (96.9%) | 2 (3.1%) |
| Total (Overall) | 144 (50.7%) | 140 (49.3%) |
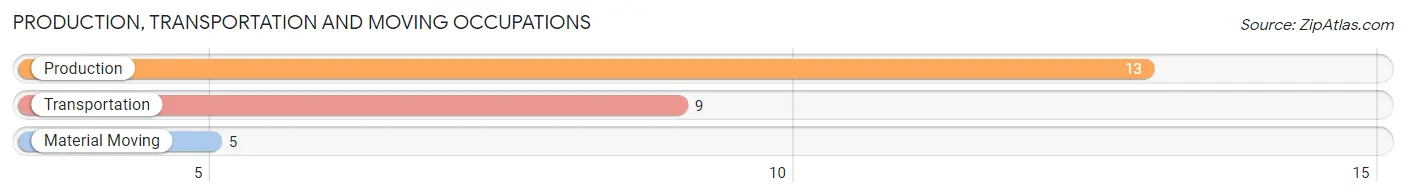
Production, Transportation and Moving Occupations
The most common Production, Transportation and Moving occupations in Oneida are Production (13 | 4.6%), Transportation (9 | 3.2%), and Material Moving (5 | 1.8%).
Production, Transportation and Moving Occupations by Sex
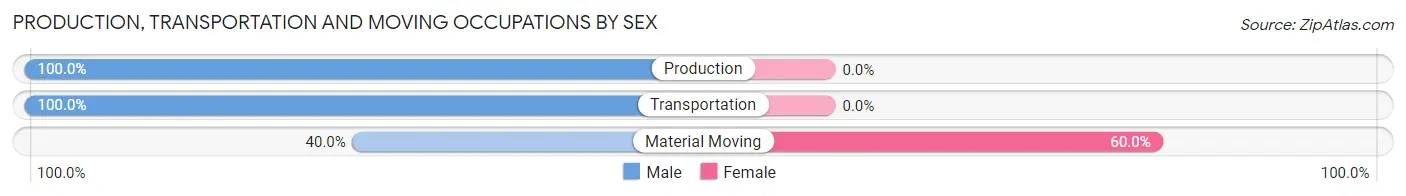
| Occupation | Male | Female |
| Production | 13 (100.0%) | 0 (0.0%) |
| Transportation | 9 (100.0%) | 0 (0.0%) |
| Material Moving | 2 (40.0%) | 3 (60.0%) |
| Total (Category) | 24 (88.9%) | 3 (11.1%) |
| Total (Overall) | 144 (50.7%) | 140 (49.3%) |
Employment Industries by Sex in Oneida
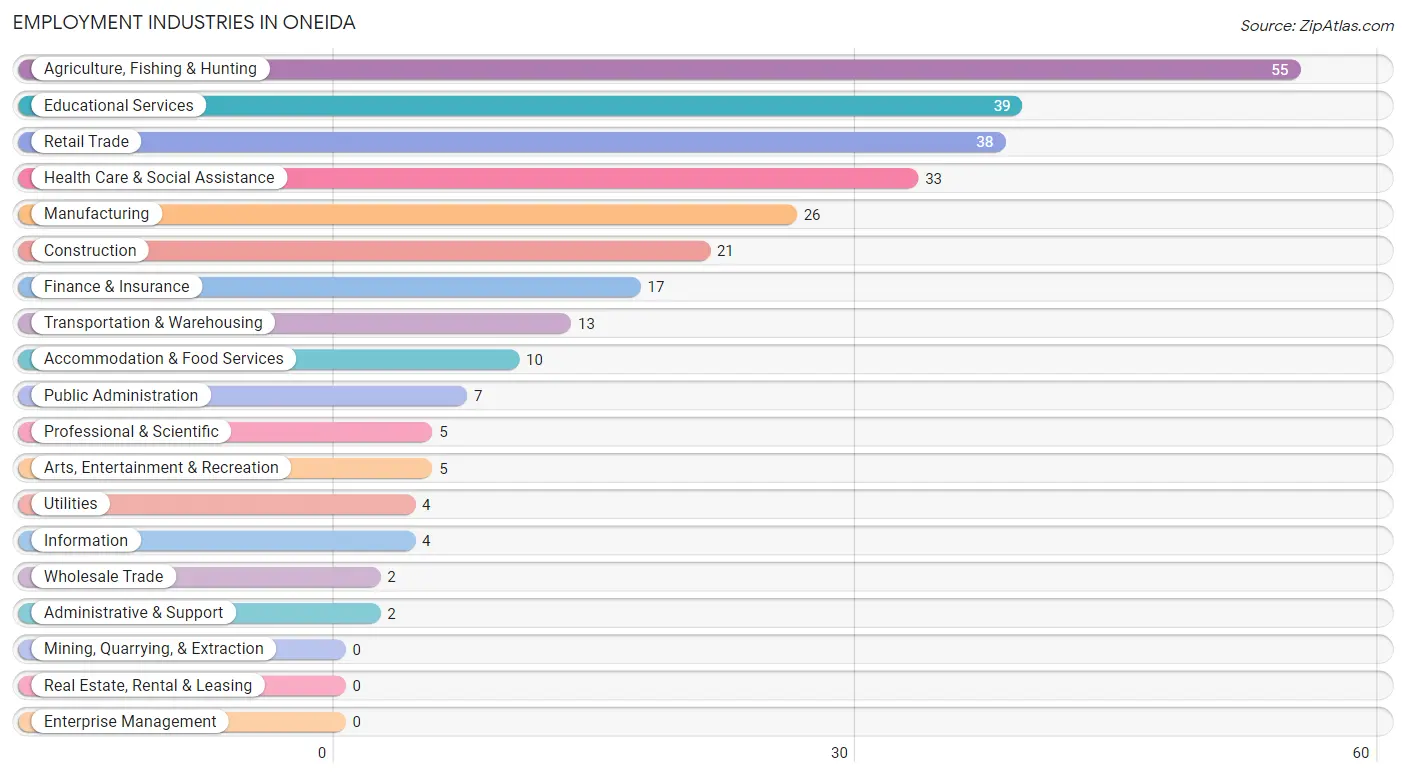
Employment Industries in Oneida
The major employment industries in Oneida include Agriculture, Fishing & Hunting (55 | 19.4%), Educational Services (39 | 13.7%), Retail Trade (38 | 13.4%), Health Care & Social Assistance (33 | 11.6%), and Manufacturing (26 | 9.1%).
Employment Industries by Sex in Oneida
The Oneida industries that see more men than women are Construction (100.0%), Professional & Scientific (100.0%), and Administrative & Support (100.0%), whereas the industries that tend to have a higher number of women are Wholesale Trade (100.0%), Finance & Insurance (100.0%), and Health Care & Social Assistance (100.0%).
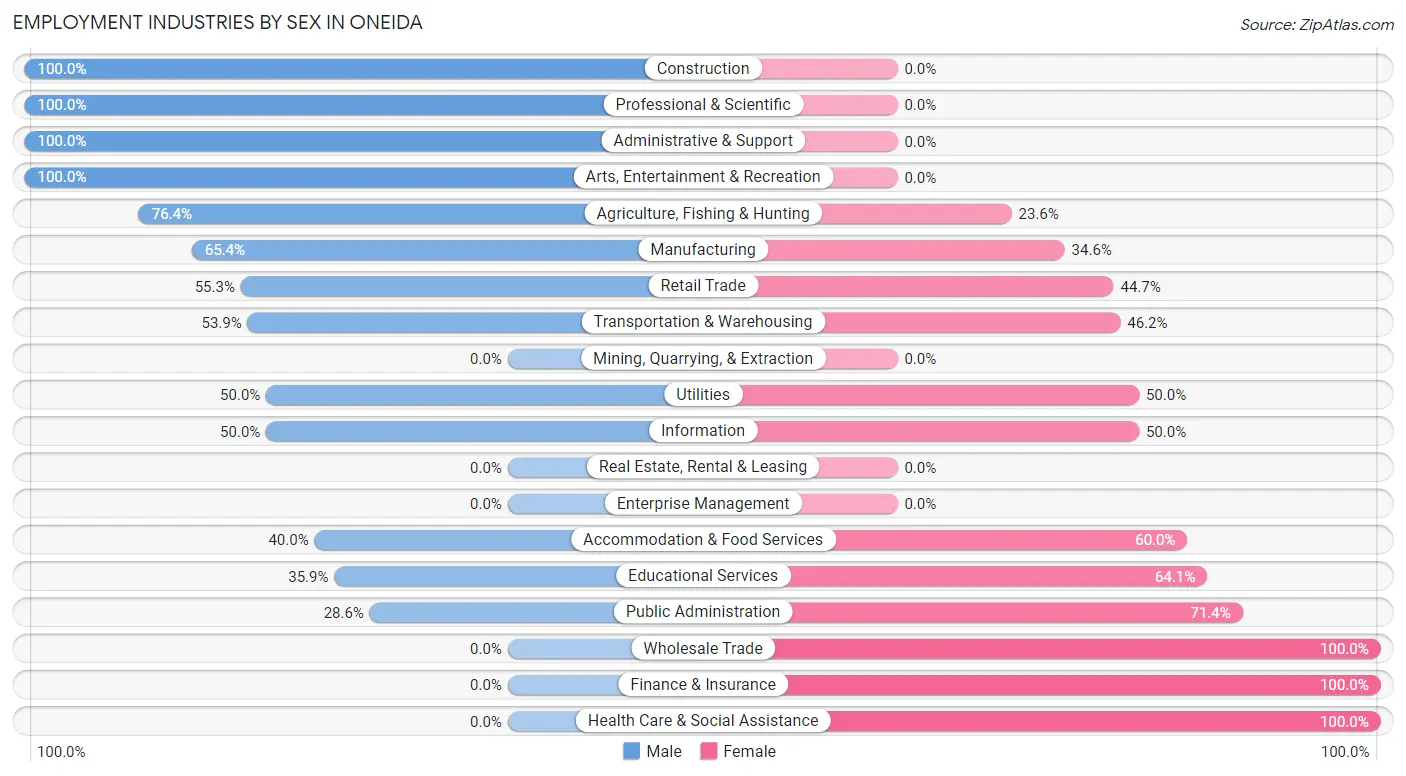
| Industry | Male | Female |
| Agriculture, Fishing & Hunting | 42 (76.4%) | 13 (23.6%) |
| Mining, Quarrying, & Extraction | 0 (0.0%) | 0 (0.0%) |
| Construction | 21 (100.0%) | 0 (0.0%) |
| Manufacturing | 17 (65.4%) | 9 (34.6%) |
| Wholesale Trade | 0 (0.0%) | 2 (100.0%) |
| Retail Trade | 21 (55.3%) | 17 (44.7%) |
| Transportation & Warehousing | 7 (53.8%) | 6 (46.2%) |
| Utilities | 2 (50.0%) | 2 (50.0%) |
| Information | 2 (50.0%) | 2 (50.0%) |
| Finance & Insurance | 0 (0.0%) | 17 (100.0%) |
| Real Estate, Rental & Leasing | 0 (0.0%) | 0 (0.0%) |
| Professional & Scientific | 5 (100.0%) | 0 (0.0%) |
| Enterprise Management | 0 (0.0%) | 0 (0.0%) |
| Administrative & Support | 2 (100.0%) | 0 (0.0%) |
| Educational Services | 14 (35.9%) | 25 (64.1%) |
| Health Care & Social Assistance | 0 (0.0%) | 33 (100.0%) |
| Arts, Entertainment & Recreation | 5 (100.0%) | 0 (0.0%) |
| Accommodation & Food Services | 4 (40.0%) | 6 (60.0%) |
| Public Administration | 2 (28.6%) | 5 (71.4%) |
| Total | 144 (50.7%) | 140 (49.3%) |
Education in Oneida
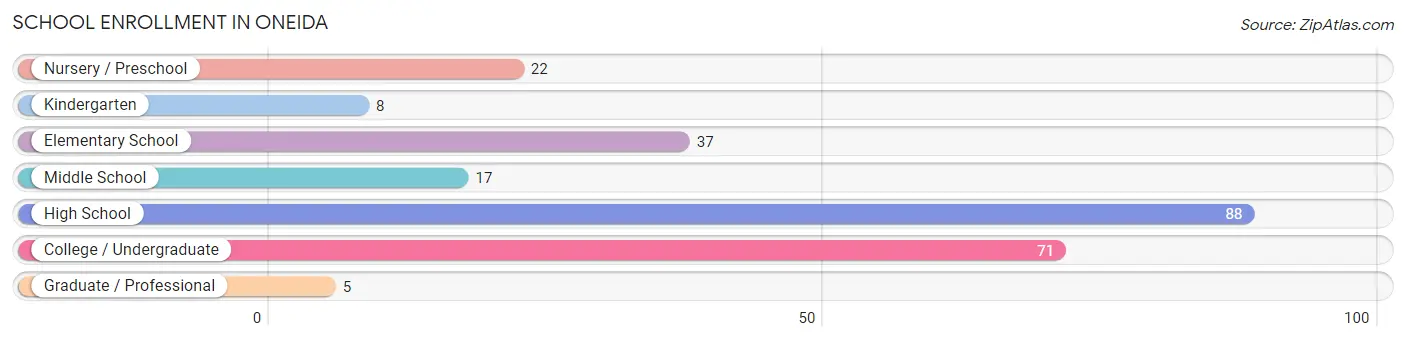
School Enrollment in Oneida
The most common levels of schooling among the 248 students in Oneida are high school (88 | 35.5%), college / undergraduate (71 | 28.6%), and elementary school (37 | 14.9%).
| School Level | # Students | % Students |
| Nursery / Preschool | 22 | 8.9% |
| Kindergarten | 8 | 3.2% |
| Elementary School | 37 | 14.9% |
| Middle School | 17 | 6.9% |
| High School | 88 | 35.5% |
| College / Undergraduate | 71 | 28.6% |
| Graduate / Professional | 5 | 2.0% |
| Total | 248 | 100.0% |
School Enrollment by Age by Funding Source in Oneida
Out of a total of 248 students who are enrolled in schools in Oneida, 14 (5.6%) attend a private institution, while the remaining 234 (94.4%) are enrolled in public schools. The age group of 18 to 19 year olds has the highest likelihood of being enrolled in private schools, with 2 (16.7% in the age bracket) enrolled. Conversely, the age group of 20 to 24 year olds has the lowest likelihood of being enrolled in a private school, with 55 (100.0% in the age bracket) attending a public institution.
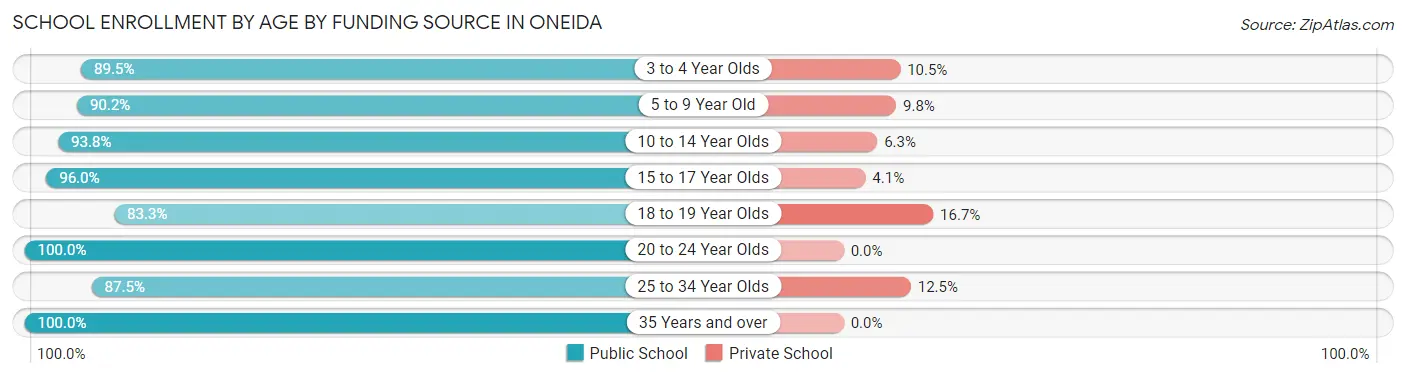
| Age Bracket | Public School | Private School |
| 3 to 4 Year Olds | 17 (89.5%) | 2 (10.5%) |
| 5 to 9 Year Old | 37 (90.2%) | 4 (9.8%) |
| 10 to 14 Year Olds | 30 (93.8%) | 2 (6.2%) |
| 15 to 17 Year Olds | 71 (96.0%) | 3 (4.1%) |
| 18 to 19 Year Olds | 10 (83.3%) | 2 (16.7%) |
| 20 to 24 Year Olds | 55 (100.0%) | 0 (0.0%) |
| 25 to 34 Year Olds | 7 (87.5%) | 1 (12.5%) |
| 35 Years and over | 7 (100.0%) | 0 (0.0%) |
| Total | 234 (94.4%) | 14 (5.6%) |
Educational Attainment by Field of Study in Oneida
Education (34 | 27.9%), liberal arts & history (15 | 12.3%), bio, nature & agricultural (11 | 9.0%), literature & languages (10 | 8.2%), and psychology (9 | 7.4%) are the most common fields of study among 122 individuals in Oneida who have obtained a bachelor's degree or higher.
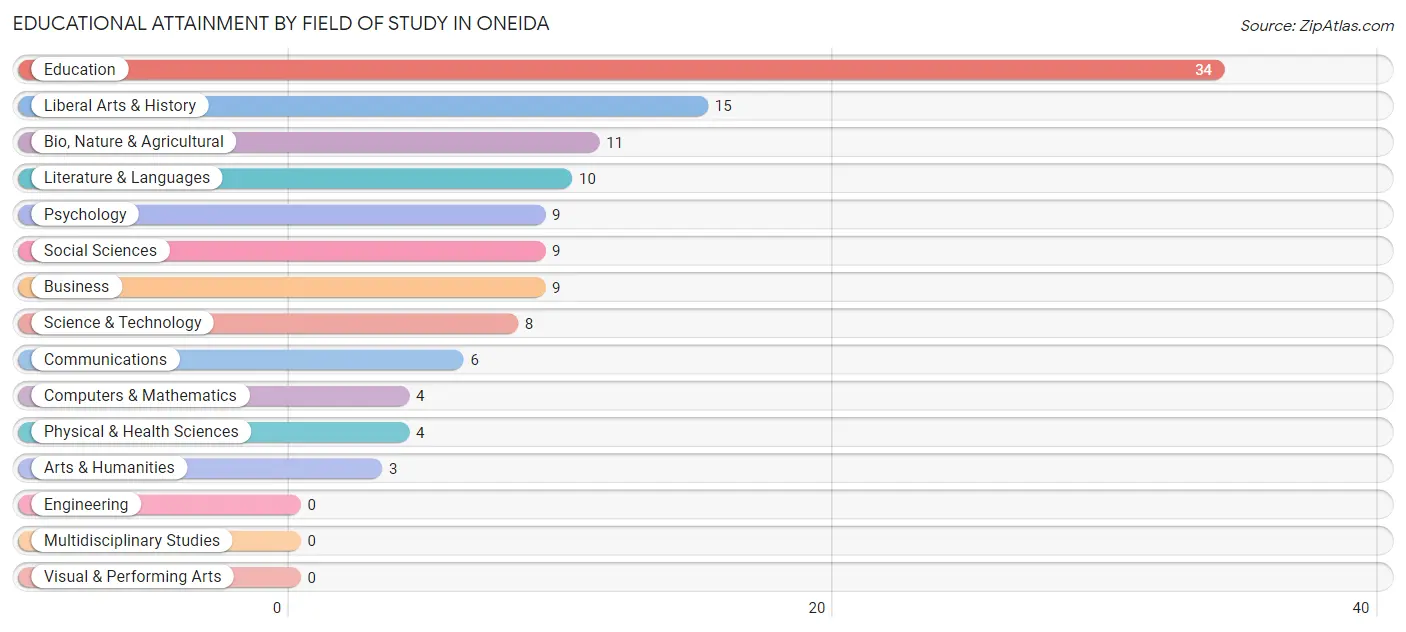
| Field of Study | # Graduates | % Graduates |
| Computers & Mathematics | 4 | 3.3% |
| Bio, Nature & Agricultural | 11 | 9.0% |
| Physical & Health Sciences | 4 | 3.3% |
| Psychology | 9 | 7.4% |
| Social Sciences | 9 | 7.4% |
| Engineering | 0 | 0.0% |
| Multidisciplinary Studies | 0 | 0.0% |
| Science & Technology | 8 | 6.6% |
| Business | 9 | 7.4% |
| Education | 34 | 27.9% |
| Literature & Languages | 10 | 8.2% |
| Liberal Arts & History | 15 | 12.3% |
| Visual & Performing Arts | 0 | 0.0% |
| Communications | 6 | 4.9% |
| Arts & Humanities | 3 | 2.5% |
| Total | 122 | 100.0% |
Transportation & Commute in Oneida
Vehicle Availability by Sex in Oneida
The most prevalent vehicle ownership categories in Oneida are males with 2 vehicles (66, accounting for 45.8%) and females with 2 vehicles (60, making up 47.1%).
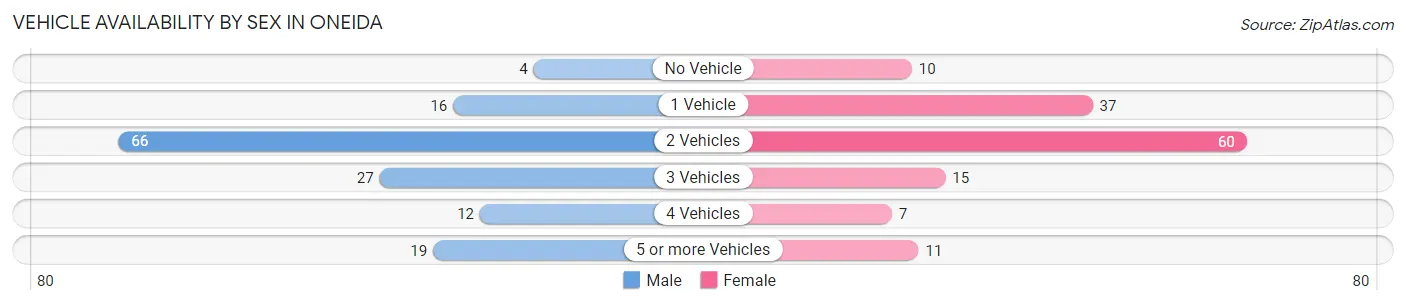
| Vehicles Available | Male | Female |
| No Vehicle | 4 (2.8%) | 10 (7.1%) |
| 1 Vehicle | 16 (11.1%) | 37 (26.4%) |
| 2 Vehicles | 66 (45.8%) | 60 (42.9%) |
| 3 Vehicles | 27 (18.8%) | 15 (10.7%) |
| 4 Vehicles | 12 (8.3%) | 7 (5.0%) |
| 5 or more Vehicles | 19 (13.2%) | 11 (7.9%) |
| Total | 144 (100.0%) | 140 (100.0%) |
Commute Time in Oneida
The most frequently occuring commute durations in Oneida are 15 to 19 minutes (74 commuters, 27.6%), 20 to 24 minutes (50 commuters, 18.7%), and 60 to 89 minutes (35 commuters, 13.1%).
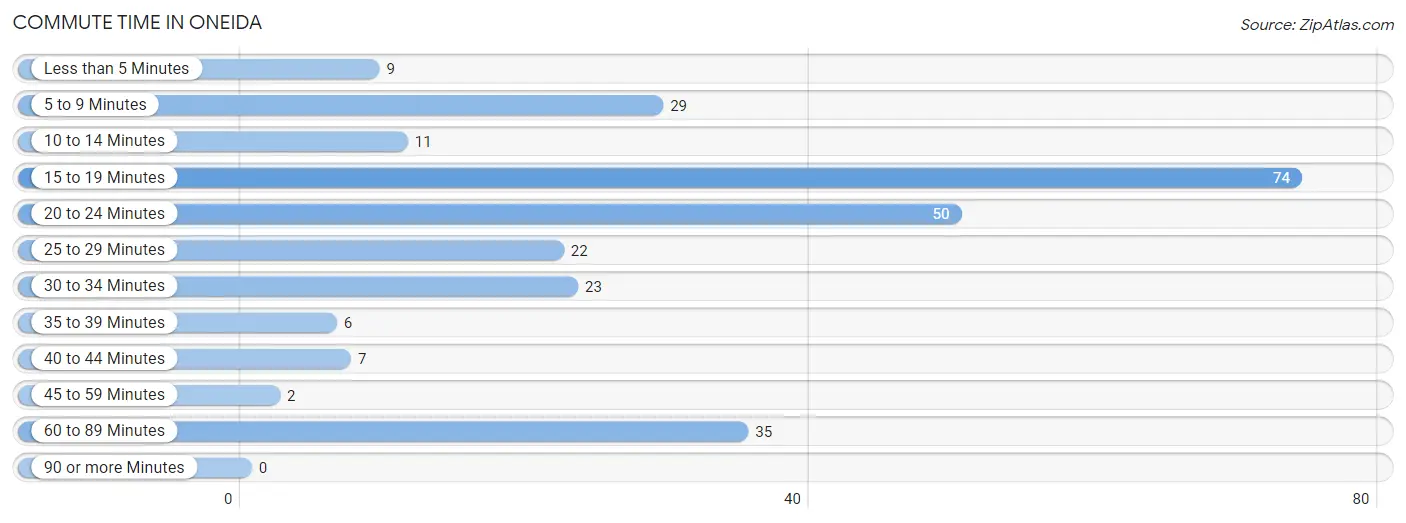
| Commute Time | # Commuters | % Commuters |
| Less than 5 Minutes | 9 | 3.4% |
| 5 to 9 Minutes | 29 | 10.8% |
| 10 to 14 Minutes | 11 | 4.1% |
| 15 to 19 Minutes | 74 | 27.6% |
| 20 to 24 Minutes | 50 | 18.7% |
| 25 to 29 Minutes | 22 | 8.2% |
| 30 to 34 Minutes | 23 | 8.6% |
| 35 to 39 Minutes | 6 | 2.2% |
| 40 to 44 Minutes | 7 | 2.6% |
| 45 to 59 Minutes | 2 | 0.7% |
| 60 to 89 Minutes | 35 | 13.1% |
| 90 or more Minutes | 0 | 0.0% |
Commute Time by Sex in Oneida
The most common commute times in Oneida are 15 to 19 minutes (49 commuters, 35.0%) for males and 20 to 24 minutes (26 commuters, 20.3%) for females.
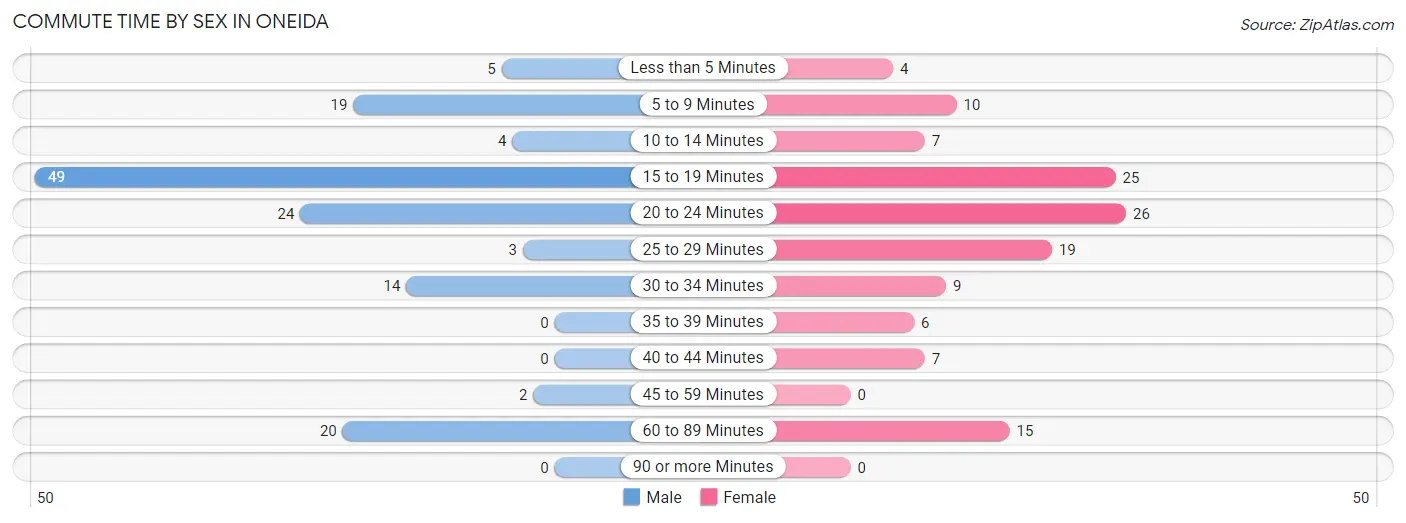
| Commute Time | Male | Female |
| Less than 5 Minutes | 5 (3.6%) | 4 (3.1%) |
| 5 to 9 Minutes | 19 (13.6%) | 10 (7.8%) |
| 10 to 14 Minutes | 4 (2.9%) | 7 (5.5%) |
| 15 to 19 Minutes | 49 (35.0%) | 25 (19.5%) |
| 20 to 24 Minutes | 24 (17.1%) | 26 (20.3%) |
| 25 to 29 Minutes | 3 (2.1%) | 19 (14.8%) |
| 30 to 34 Minutes | 14 (10.0%) | 9 (7.0%) |
| 35 to 39 Minutes | 0 (0.0%) | 6 (4.7%) |
| 40 to 44 Minutes | 0 (0.0%) | 7 (5.5%) |
| 45 to 59 Minutes | 2 (1.4%) | 0 (0.0%) |
| 60 to 89 Minutes | 20 (14.3%) | 15 (11.7%) |
| 90 or more Minutes | 0 (0.0%) | 0 (0.0%) |
Time of Departure to Work by Sex in Oneida
The most frequent times of departure to work in Oneida are 5:30 AM to 5:59 AM (61, 43.6%) for males and 7:30 AM to 7:59 AM (30, 23.4%) for females.
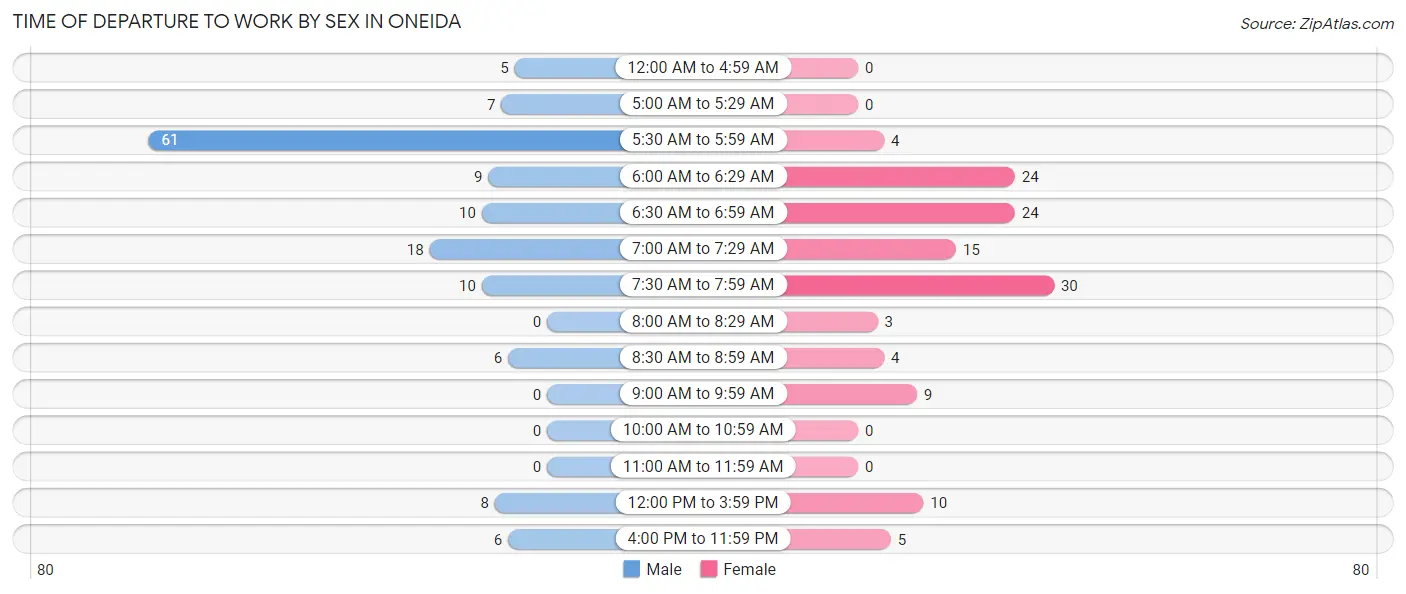
| Time of Departure | Male | Female |
| 12:00 AM to 4:59 AM | 5 (3.6%) | 0 (0.0%) |
| 5:00 AM to 5:29 AM | 7 (5.0%) | 0 (0.0%) |
| 5:30 AM to 5:59 AM | 61 (43.6%) | 4 (3.1%) |
| 6:00 AM to 6:29 AM | 9 (6.4%) | 24 (18.8%) |
| 6:30 AM to 6:59 AM | 10 (7.1%) | 24 (18.8%) |
| 7:00 AM to 7:29 AM | 18 (12.9%) | 15 (11.7%) |
| 7:30 AM to 7:59 AM | 10 (7.1%) | 30 (23.4%) |
| 8:00 AM to 8:29 AM | 0 (0.0%) | 3 (2.3%) |
| 8:30 AM to 8:59 AM | 6 (4.3%) | 4 (3.1%) |
| 9:00 AM to 9:59 AM | 0 (0.0%) | 9 (7.0%) |
| 10:00 AM to 10:59 AM | 0 (0.0%) | 0 (0.0%) |
| 11:00 AM to 11:59 AM | 0 (0.0%) | 0 (0.0%) |
| 12:00 PM to 3:59 PM | 8 (5.7%) | 10 (7.8%) |
| 4:00 PM to 11:59 PM | 6 (4.3%) | 5 (3.9%) |
| Total | 140 (100.0%) | 128 (100.0%) |
Housing Occupancy in Oneida
Occupancy by Ownership in Oneida
Of the total 280 dwellings in Oneida, owner-occupied units account for 203 (72.5%), while renter-occupied units make up 77 (27.5%).
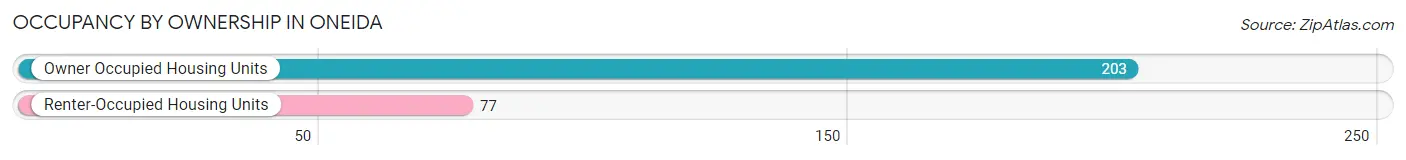
| Occupancy | # Housing Units | % Housing Units |
| Owner Occupied Housing Units | 203 | 72.5% |
| Renter-Occupied Housing Units | 77 | 27.5% |
| Total Occupied Housing Units | 280 | 100.0% |
Occupancy by Household Size in Oneida
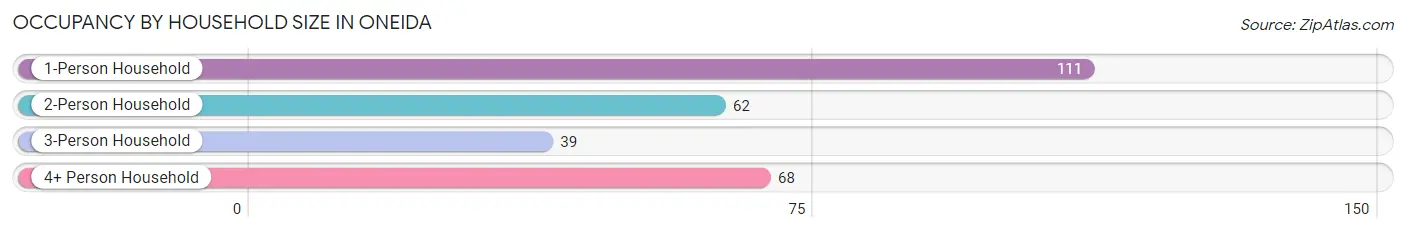
| Household Size | # Housing Units | % Housing Units |
| 1-Person Household | 111 | 39.6% |
| 2-Person Household | 62 | 22.1% |
| 3-Person Household | 39 | 13.9% |
| 4+ Person Household | 68 | 24.3% |
| Total Housing Units | 280 | 100.0% |
Occupancy by Ownership by Household Size in Oneida
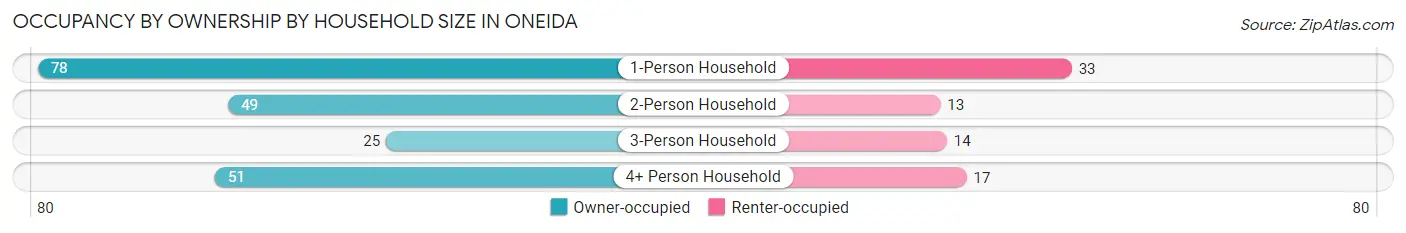
| Household Size | Owner-occupied | Renter-occupied |
| 1-Person Household | 78 (70.3%) | 33 (29.7%) |
| 2-Person Household | 49 (79.0%) | 13 (21.0%) |
| 3-Person Household | 25 (64.1%) | 14 (35.9%) |
| 4+ Person Household | 51 (75.0%) | 17 (25.0%) |
| Total Housing Units | 203 (72.5%) | 77 (27.5%) |
Occupancy by Educational Attainment in Oneida
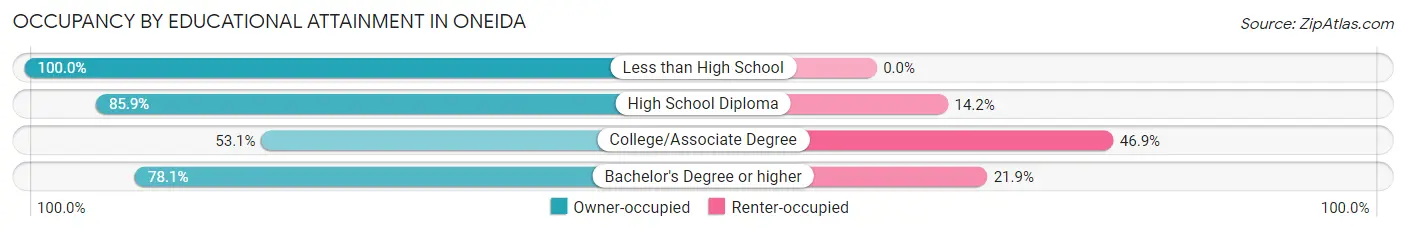
| Household Size | Owner-occupied | Renter-occupied |
| Less than High School | 3 (100.0%) | 0 (0.0%) |
| High School Diploma | 91 (85.9%) | 15 (14.1%) |
| College/Associate Degree | 52 (53.1%) | 46 (46.9%) |
| Bachelor's Degree or higher | 57 (78.1%) | 16 (21.9%) |
Occupancy by Age of Householder in Oneida
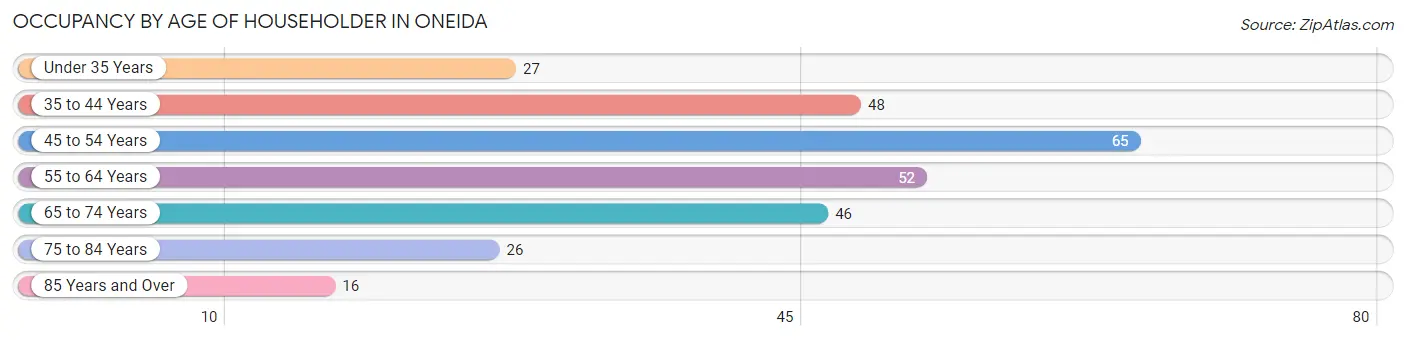
| Age Bracket | # Households | % Households |
| Under 35 Years | 27 | 9.6% |
| 35 to 44 Years | 48 | 17.1% |
| 45 to 54 Years | 65 | 23.2% |
| 55 to 64 Years | 52 | 18.6% |
| 65 to 74 Years | 46 | 16.4% |
| 75 to 84 Years | 26 | 9.3% |
| 85 Years and Over | 16 | 5.7% |
| Total | 280 | 100.0% |
Housing Finances in Oneida
Median Income by Occupancy in Oneida
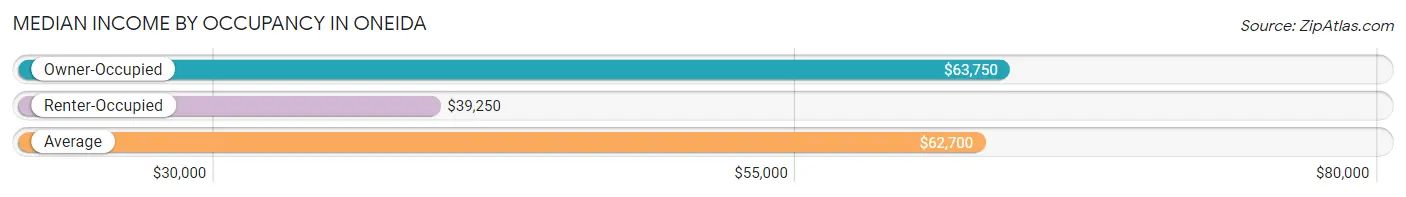
| Occupancy Type | # Households | Median Income |
| Owner-Occupied | 203 (72.5%) | $63,750 |
| Renter-Occupied | 77 (27.5%) | $39,250 |
| Average | 280 (100.0%) | $62,700 |
Occupancy by Householder Income Bracket in Oneida
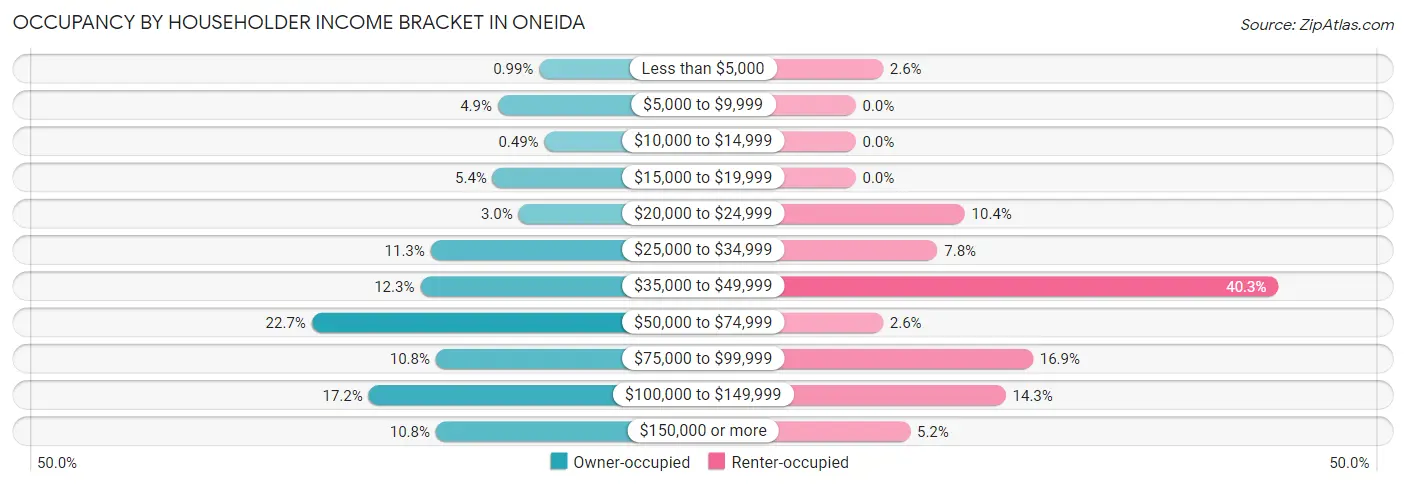
| Income Bracket | Owner-occupied | Renter-occupied |
| Less than $5,000 | 2 (1.0%) | 2 (2.6%) |
| $5,000 to $9,999 | 10 (4.9%) | 0 (0.0%) |
| $10,000 to $14,999 | 1 (0.5%) | 0 (0.0%) |
| $15,000 to $19,999 | 11 (5.4%) | 0 (0.0%) |
| $20,000 to $24,999 | 6 (3.0%) | 8 (10.4%) |
| $25,000 to $34,999 | 23 (11.3%) | 6 (7.8%) |
| $35,000 to $49,999 | 25 (12.3%) | 31 (40.3%) |
| $50,000 to $74,999 | 46 (22.7%) | 2 (2.6%) |
| $75,000 to $99,999 | 22 (10.8%) | 13 (16.9%) |
| $100,000 to $149,999 | 35 (17.2%) | 11 (14.3%) |
| $150,000 or more | 22 (10.8%) | 4 (5.2%) |
| Total | 203 (100.0%) | 77 (100.0%) |
Monthly Housing Cost Tiers in Oneida
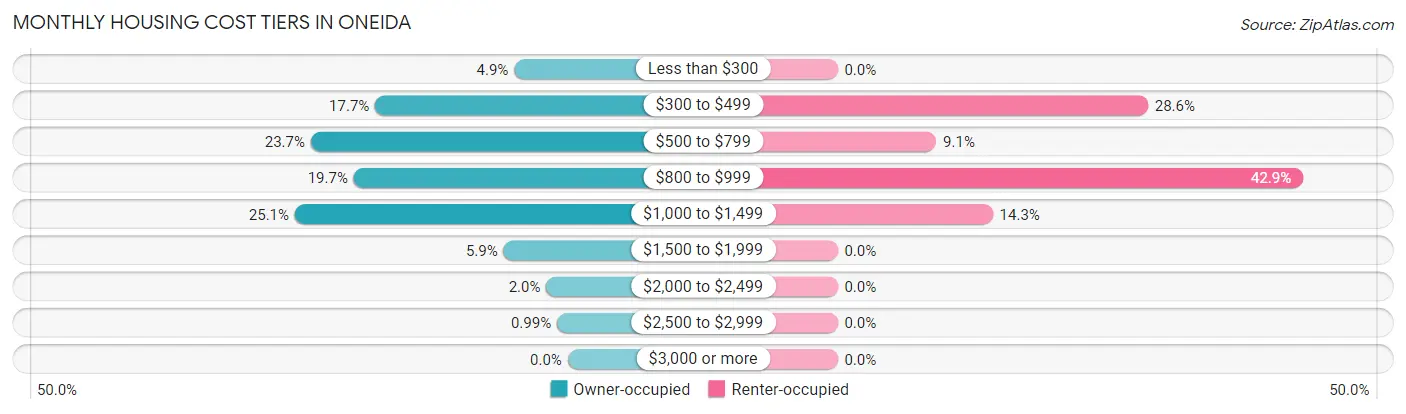
| Monthly Cost | Owner-occupied | Renter-occupied |
| Less than $300 | 10 (4.9%) | 0 (0.0%) |
| $300 to $499 | 36 (17.7%) | 22 (28.6%) |
| $500 to $799 | 48 (23.6%) | 7 (9.1%) |
| $800 to $999 | 40 (19.7%) | 33 (42.9%) |
| $1,000 to $1,499 | 51 (25.1%) | 11 (14.3%) |
| $1,500 to $1,999 | 12 (5.9%) | 0 (0.0%) |
| $2,000 to $2,499 | 4 (2.0%) | 0 (0.0%) |
| $2,500 to $2,999 | 2 (1.0%) | 0 (0.0%) |
| $3,000 or more | 0 (0.0%) | 0 (0.0%) |
| Total | 203 (100.0%) | 77 (100.0%) |
Physical Housing Characteristics in Oneida
Housing Structures in Oneida
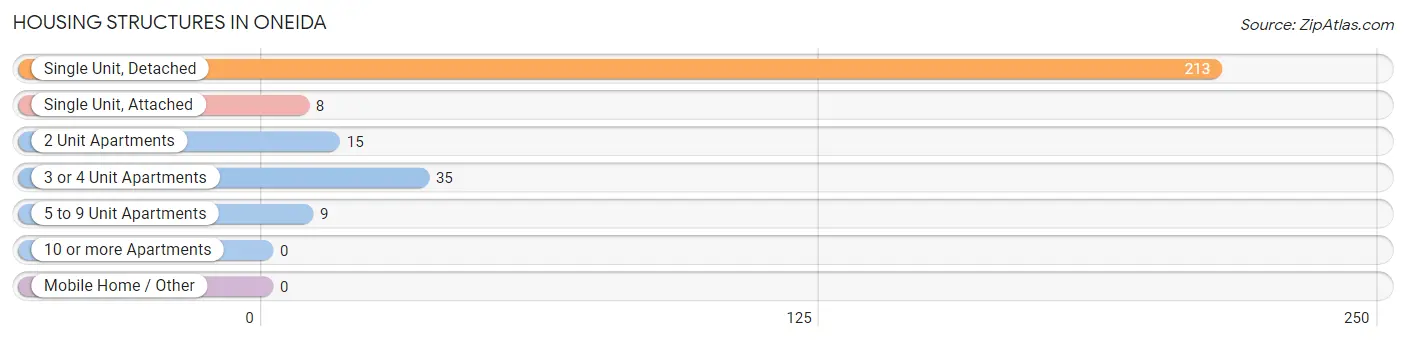
| Structure Type | # Housing Units | % Housing Units |
| Single Unit, Detached | 213 | 76.1% |
| Single Unit, Attached | 8 | 2.9% |
| 2 Unit Apartments | 15 | 5.4% |
| 3 or 4 Unit Apartments | 35 | 12.5% |
| 5 to 9 Unit Apartments | 9 | 3.2% |
| 10 or more Apartments | 0 | 0.0% |
| Mobile Home / Other | 0 | 0.0% |
| Total | 280 | 100.0% |
Housing Structures by Occupancy in Oneida
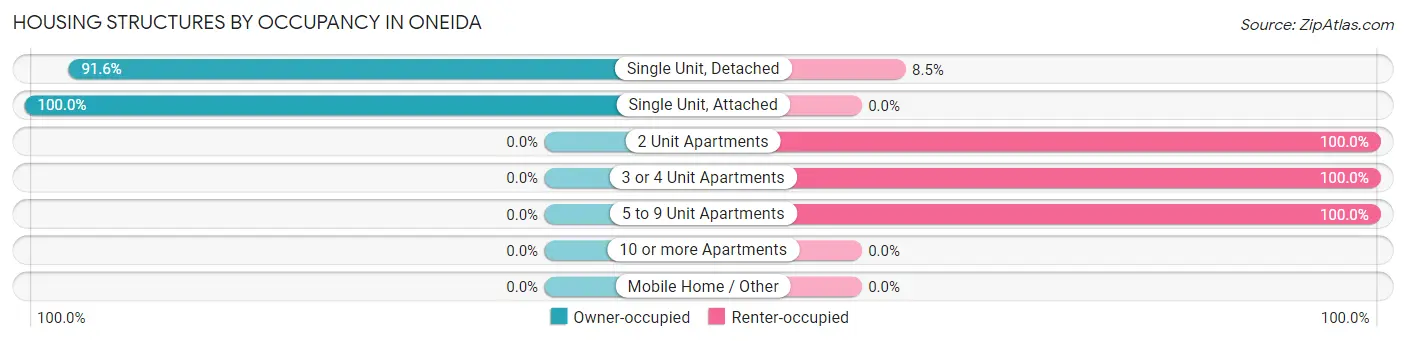
| Structure Type | Owner-occupied | Renter-occupied |
| Single Unit, Detached | 195 (91.5%) | 18 (8.5%) |
| Single Unit, Attached | 8 (100.0%) | 0 (0.0%) |
| 2 Unit Apartments | 0 (0.0%) | 15 (100.0%) |
| 3 or 4 Unit Apartments | 0 (0.0%) | 35 (100.0%) |
| 5 to 9 Unit Apartments | 0 (0.0%) | 9 (100.0%) |
| 10 or more Apartments | 0 (0.0%) | 0 (0.0%) |
| Mobile Home / Other | 0 (0.0%) | 0 (0.0%) |
| Total | 203 (72.5%) | 77 (27.5%) |
Housing Structures by Number of Rooms in Oneida
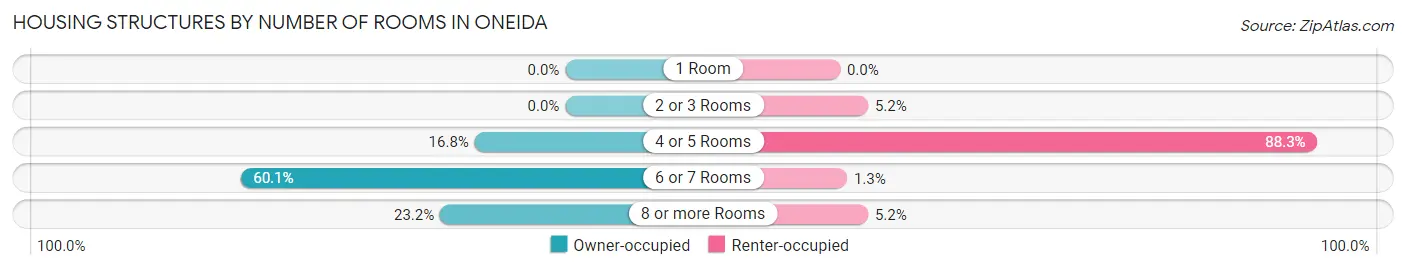
| Number of Rooms | Owner-occupied | Renter-occupied |
| 1 Room | 0 (0.0%) | 0 (0.0%) |
| 2 or 3 Rooms | 0 (0.0%) | 4 (5.2%) |
| 4 or 5 Rooms | 34 (16.8%) | 68 (88.3%) |
| 6 or 7 Rooms | 122 (60.1%) | 1 (1.3%) |
| 8 or more Rooms | 47 (23.2%) | 4 (5.2%) |
| Total | 203 (100.0%) | 77 (100.0%) |
Housing Structure by Heating Type in Oneida
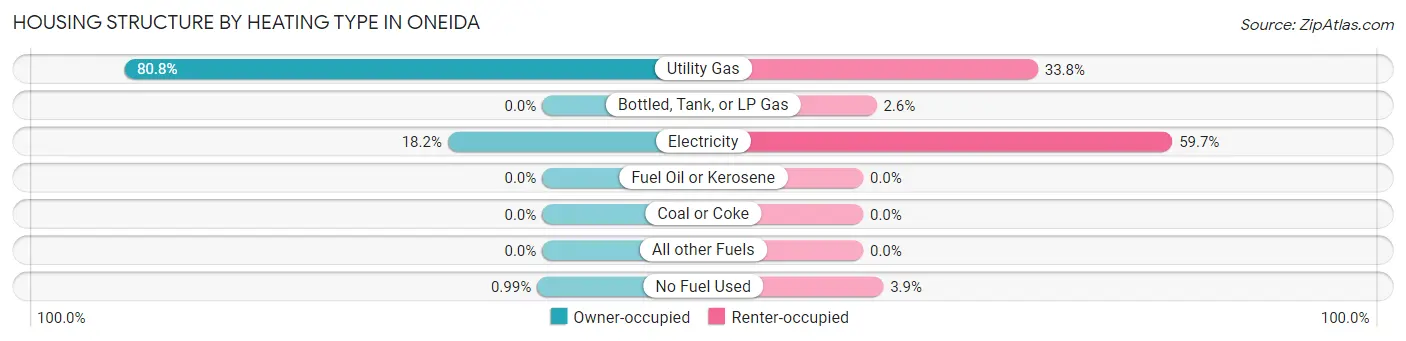
| Heating Type | Owner-occupied | Renter-occupied |
| Utility Gas | 164 (80.8%) | 26 (33.8%) |
| Bottled, Tank, or LP Gas | 0 (0.0%) | 2 (2.6%) |
| Electricity | 37 (18.2%) | 46 (59.7%) |
| Fuel Oil or Kerosene | 0 (0.0%) | 0 (0.0%) |
| Coal or Coke | 0 (0.0%) | 0 (0.0%) |
| All other Fuels | 0 (0.0%) | 0 (0.0%) |
| No Fuel Used | 2 (1.0%) | 3 (3.9%) |
| Total | 203 (100.0%) | 77 (100.0%) |
Household Vehicle Usage in Oneida
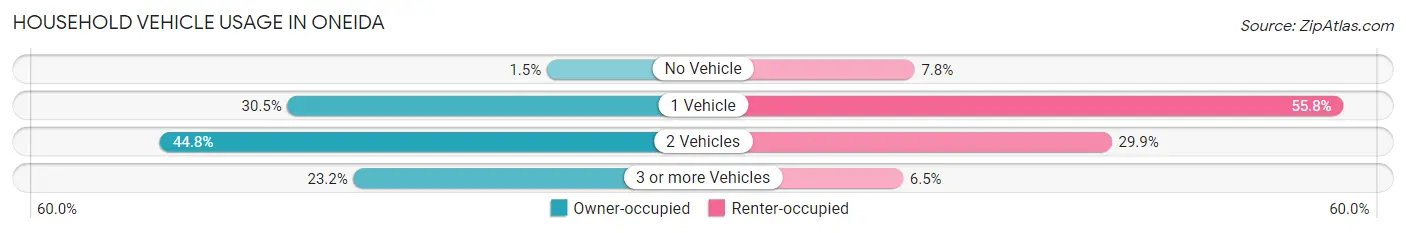
| Vehicles per Household | Owner-occupied | Renter-occupied |
| No Vehicle | 3 (1.5%) | 6 (7.8%) |
| 1 Vehicle | 62 (30.5%) | 43 (55.8%) |
| 2 Vehicles | 91 (44.8%) | 23 (29.9%) |
| 3 or more Vehicles | 47 (23.2%) | 5 (6.5%) |
| Total | 203 (100.0%) | 77 (100.0%) |
Real Estate & Mortgages in Oneida
Real Estate and Mortgage Overview in Oneida
| Characteristic | Without Mortgage | With Mortgage |
| Housing Units | 77 | 126 |
| Median Property Value | $101,900 | $95,500 |
| Median Household Income | - | - |
| Monthly Housing Costs | $466 | $0 |
| Real Estate Taxes | $1,707 | $1 |
Property Value by Mortgage Status in Oneida
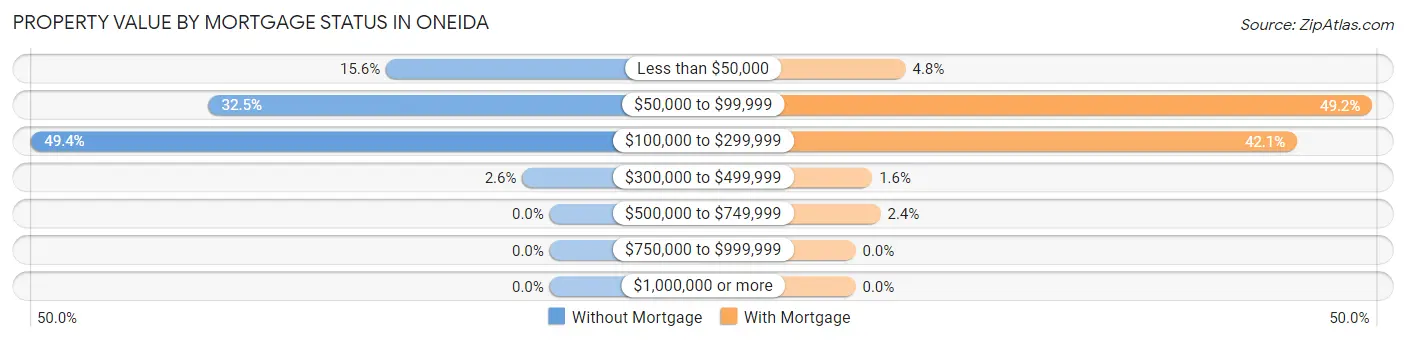
| Property Value | Without Mortgage | With Mortgage |
| Less than $50,000 | 12 (15.6%) | 6 (4.8%) |
| $50,000 to $99,999 | 25 (32.5%) | 62 (49.2%) |
| $100,000 to $299,999 | 38 (49.3%) | 53 (42.1%) |
| $300,000 to $499,999 | 2 (2.6%) | 2 (1.6%) |
| $500,000 to $749,999 | 0 (0.0%) | 3 (2.4%) |
| $750,000 to $999,999 | 0 (0.0%) | 0 (0.0%) |
| $1,000,000 or more | 0 (0.0%) | 0 (0.0%) |
| Total | 77 (100.0%) | 126 (100.0%) |
Household Income by Mortgage Status in Oneida
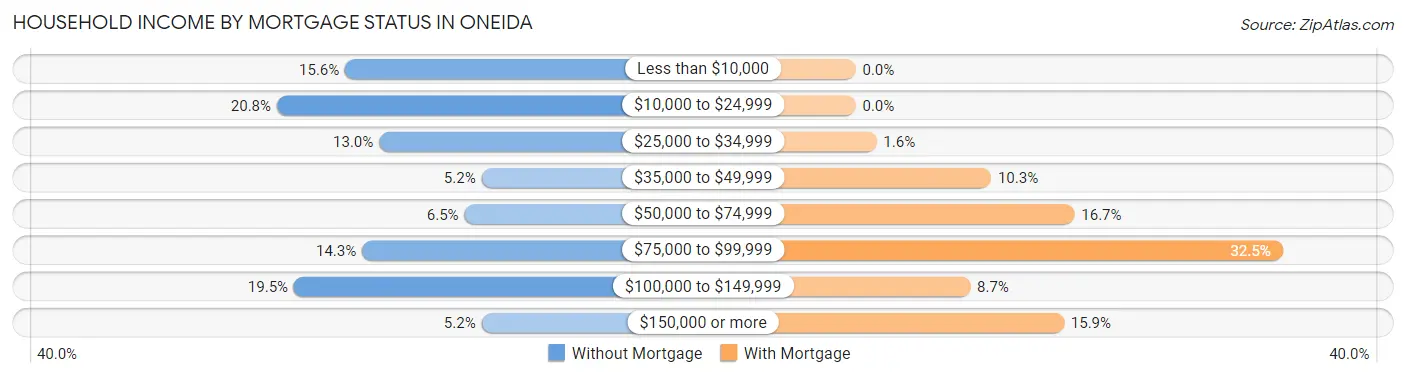
| Household Income | Without Mortgage | With Mortgage |
| Less than $10,000 | 12 (15.6%) | 0 (0.0%) |
| $10,000 to $24,999 | 16 (20.8%) | 0 (0.0%) |
| $25,000 to $34,999 | 10 (13.0%) | 2 (1.6%) |
| $35,000 to $49,999 | 4 (5.2%) | 13 (10.3%) |
| $50,000 to $74,999 | 5 (6.5%) | 21 (16.7%) |
| $75,000 to $99,999 | 11 (14.3%) | 41 (32.5%) |
| $100,000 to $149,999 | 15 (19.5%) | 11 (8.7%) |
| $150,000 or more | 4 (5.2%) | 20 (15.9%) |
| Total | 77 (100.0%) | 126 (100.0%) |
Property Value to Household Income Ratio in Oneida
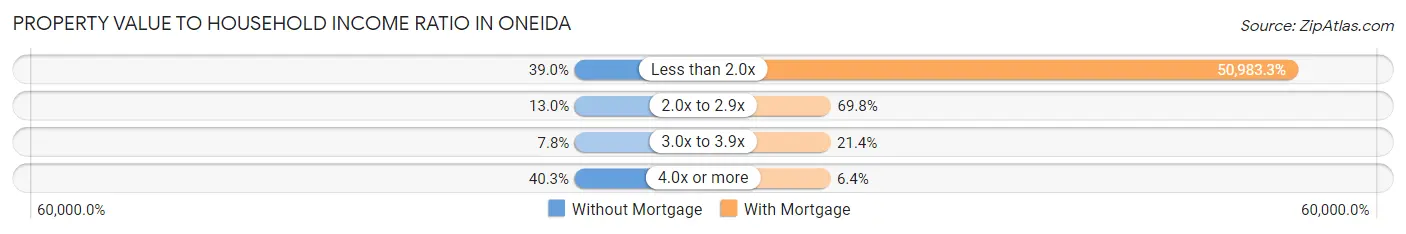
| Value-to-Income Ratio | Without Mortgage | With Mortgage |
| Less than 2.0x | 30 (39.0%) | 64,239 (50,983.3%) |
| 2.0x to 2.9x | 10 (13.0%) | 88 (69.8%) |
| 3.0x to 3.9x | 6 (7.8%) | 27 (21.4%) |
| 4.0x or more | 31 (40.3%) | 8 (6.4%) |
| Total | 77 (100.0%) | 126 (100.0%) |
Real Estate Taxes by Mortgage Status in Oneida
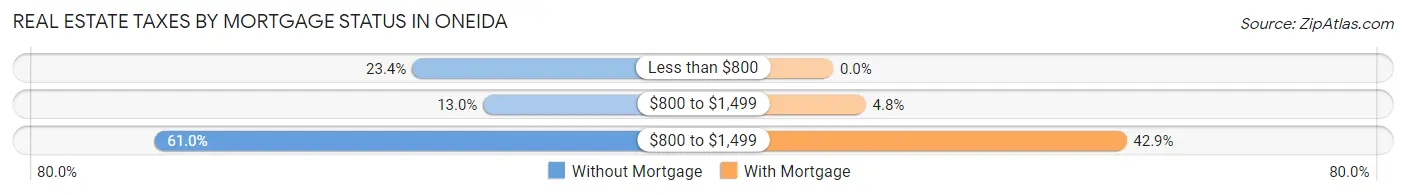
| Property Taxes | Without Mortgage | With Mortgage |
| Less than $800 | 18 (23.4%) | 0 (0.0%) |
| $800 to $1,499 | 10 (13.0%) | 6 (4.8%) |
| $800 to $1,499 | 47 (61.0%) | 54 (42.9%) |
| Total | 77 (100.0%) | 126 (100.0%) |
Health & Disability in Oneida
Health Insurance Coverage by Age in Oneida
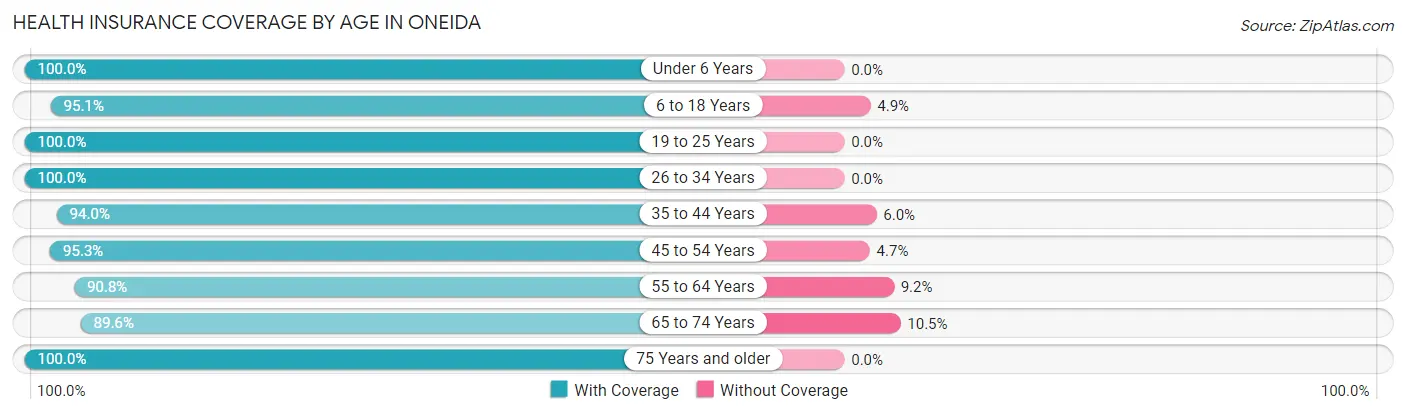
| Age Bracket | With Coverage | Without Coverage |
| Under 6 Years | 57 (100.0%) | 0 (0.0%) |
| 6 to 18 Years | 137 (95.1%) | 7 (4.9%) |
| 19 to 25 Years | 83 (100.0%) | 0 (0.0%) |
| 26 to 34 Years | 38 (100.0%) | 0 (0.0%) |
| 35 to 44 Years | 63 (94.0%) | 4 (6.0%) |
| 45 to 54 Years | 141 (95.3%) | 7 (4.7%) |
| 55 to 64 Years | 69 (90.8%) | 7 (9.2%) |
| 65 to 74 Years | 60 (89.5%) | 7 (10.4%) |
| 75 Years and older | 52 (100.0%) | 0 (0.0%) |
| Total | 700 (95.6%) | 32 (4.4%) |
Health Insurance Coverage by Citizenship Status in Oneida
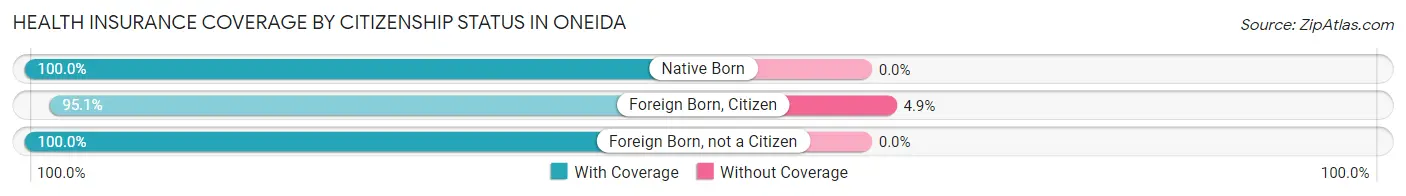
| Citizenship Status | With Coverage | Without Coverage |
| Native Born | 57 (100.0%) | 0 (0.0%) |
| Foreign Born, Citizen | 137 (95.1%) | 7 (4.9%) |
| Foreign Born, not a Citizen | 83 (100.0%) | 0 (0.0%) |
Health Insurance Coverage by Household Income in Oneida
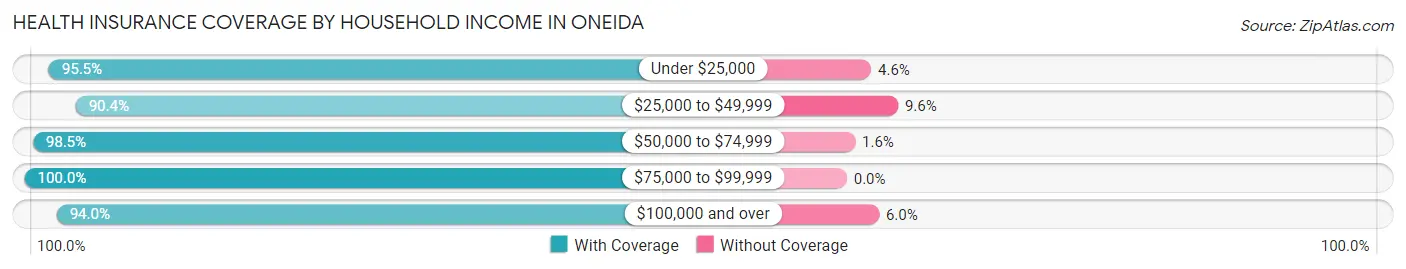
| Household Income | With Coverage | Without Coverage |
| Under $25,000 | 42 (95.5%) | 2 (4.5%) |
| $25,000 to $49,999 | 132 (90.4%) | 14 (9.6%) |
| $50,000 to $74,999 | 254 (98.5%) | 4 (1.5%) |
| $75,000 to $99,999 | 85 (100.0%) | 0 (0.0%) |
| $100,000 and over | 187 (94.0%) | 12 (6.0%) |
Public vs Private Health Insurance Coverage by Age in Oneida
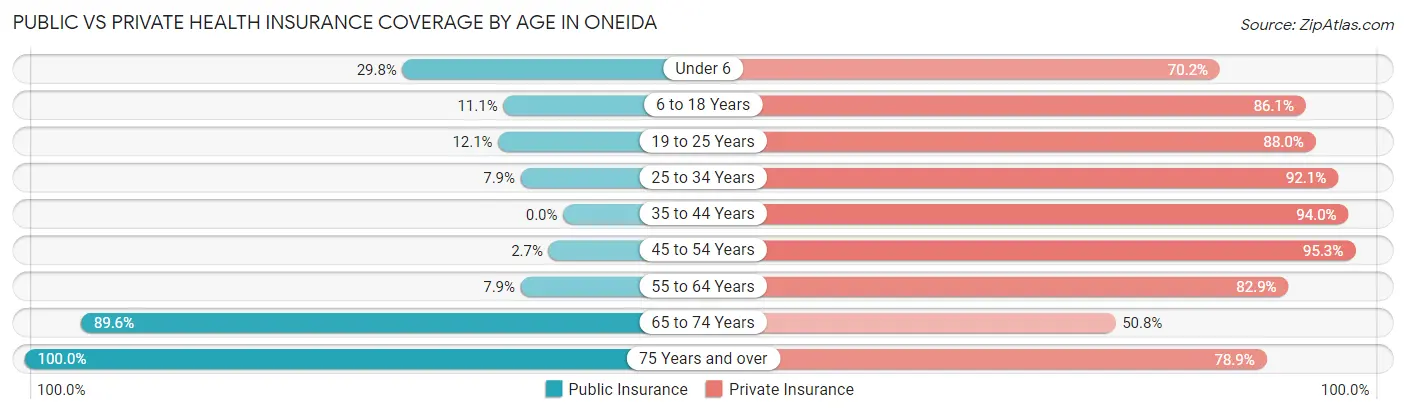
| Age Bracket | Public Insurance | Private Insurance |
| Under 6 | 17 (29.8%) | 40 (70.2%) |
| 6 to 18 Years | 16 (11.1%) | 124 (86.1%) |
| 19 to 25 Years | 10 (12.0%) | 73 (87.9%) |
| 25 to 34 Years | 3 (7.9%) | 35 (92.1%) |
| 35 to 44 Years | 0 (0.0%) | 63 (94.0%) |
| 45 to 54 Years | 4 (2.7%) | 141 (95.3%) |
| 55 to 64 Years | 6 (7.9%) | 63 (82.9%) |
| 65 to 74 Years | 60 (89.5%) | 34 (50.7%) |
| 75 Years and over | 52 (100.0%) | 41 (78.8%) |
| Total | 168 (23.0%) | 614 (83.9%) |
Disability Status by Sex by Age in Oneida
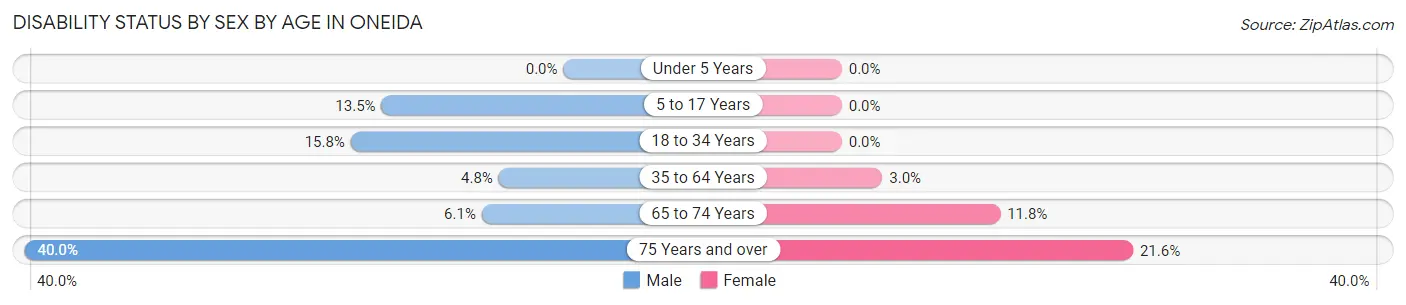
| Age Bracket | Male | Female |
| Under 5 Years | 0 (0.0%) | 0 (0.0%) |
| 5 to 17 Years | 10 (13.5%) | 0 (0.0%) |
| 18 to 34 Years | 6 (15.8%) | 0 (0.0%) |
| 35 to 64 Years | 6 (4.8%) | 5 (3.0%) |
| 65 to 74 Years | 2 (6.1%) | 4 (11.8%) |
| 75 Years and over | 6 (40.0%) | 8 (21.6%) |
Disability Class by Sex by Age in Oneida
Disability Class: Hearing Difficulty
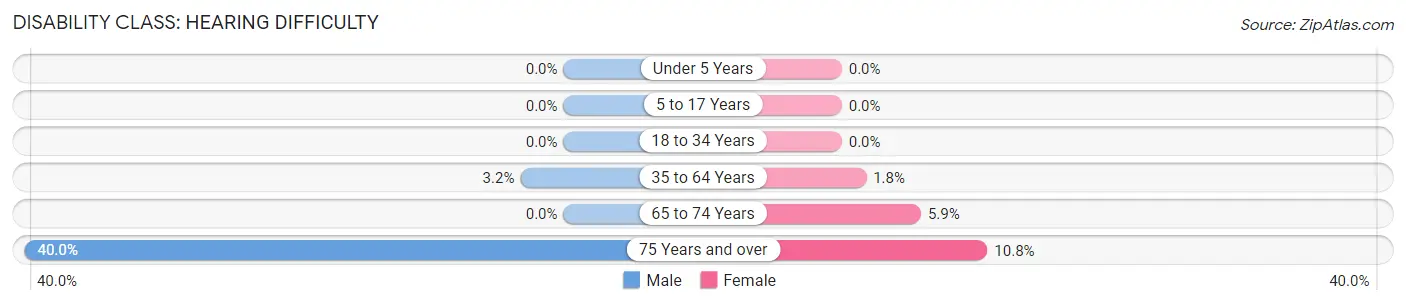
| Age Bracket | Male | Female |
| Under 5 Years | 0 (0.0%) | 0 (0.0%) |
| 5 to 17 Years | 0 (0.0%) | 0 (0.0%) |
| 18 to 34 Years | 0 (0.0%) | 0 (0.0%) |
| 35 to 64 Years | 4 (3.2%) | 3 (1.8%) |
| 65 to 74 Years | 0 (0.0%) | 2 (5.9%) |
| 75 Years and over | 6 (40.0%) | 4 (10.8%) |
Disability Class: Vision Difficulty
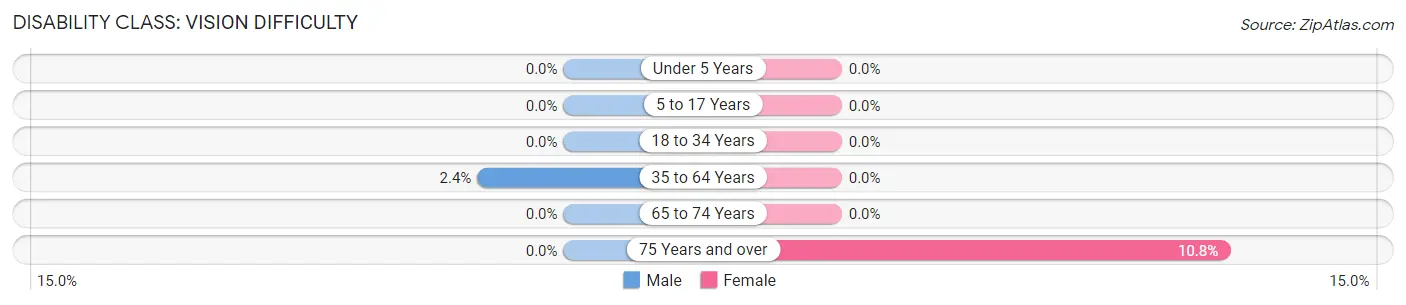
| Age Bracket | Male | Female |
| Under 5 Years | 0 (0.0%) | 0 (0.0%) |
| 5 to 17 Years | 0 (0.0%) | 0 (0.0%) |
| 18 to 34 Years | 0 (0.0%) | 0 (0.0%) |
| 35 to 64 Years | 3 (2.4%) | 0 (0.0%) |
| 65 to 74 Years | 0 (0.0%) | 0 (0.0%) |
| 75 Years and over | 0 (0.0%) | 4 (10.8%) |
Disability Class: Cognitive Difficulty
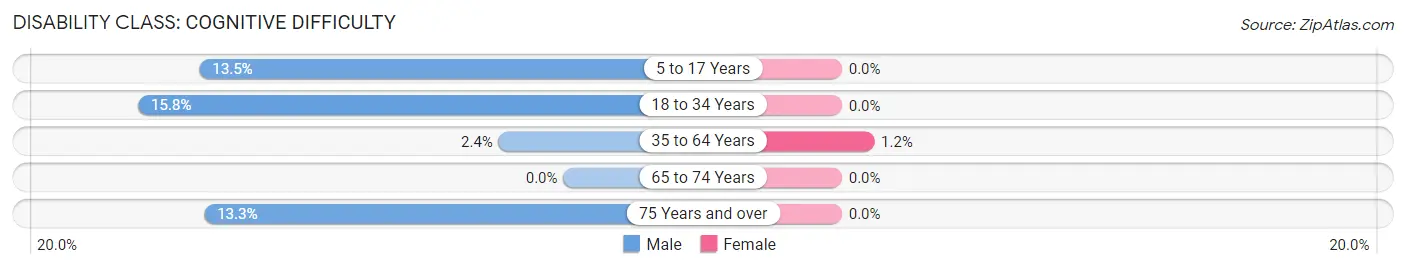
| Age Bracket | Male | Female |
| 5 to 17 Years | 10 (13.5%) | 0 (0.0%) |
| 18 to 34 Years | 6 (15.8%) | 0 (0.0%) |
| 35 to 64 Years | 3 (2.4%) | 2 (1.2%) |
| 65 to 74 Years | 0 (0.0%) | 0 (0.0%) |
| 75 Years and over | 2 (13.3%) | 0 (0.0%) |
Disability Class: Ambulatory Difficulty
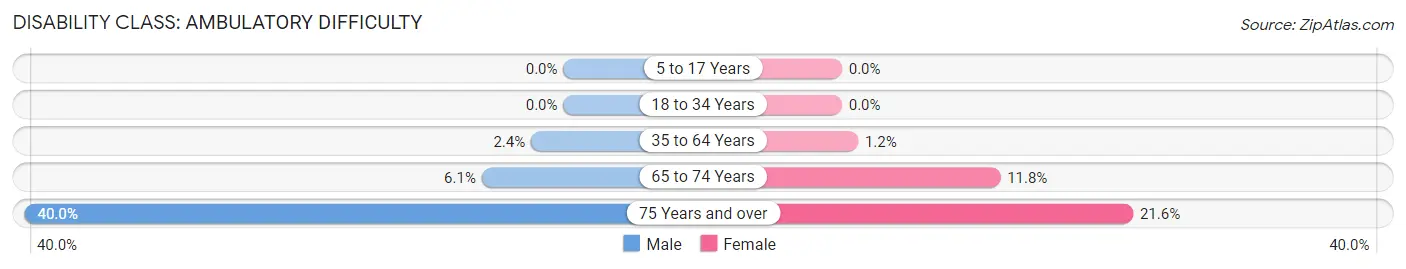
| Age Bracket | Male | Female |
| 5 to 17 Years | 0 (0.0%) | 0 (0.0%) |
| 18 to 34 Years | 0 (0.0%) | 0 (0.0%) |
| 35 to 64 Years | 3 (2.4%) | 2 (1.2%) |
| 65 to 74 Years | 2 (6.1%) | 4 (11.8%) |
| 75 Years and over | 6 (40.0%) | 8 (21.6%) |
Disability Class: Self-Care Difficulty
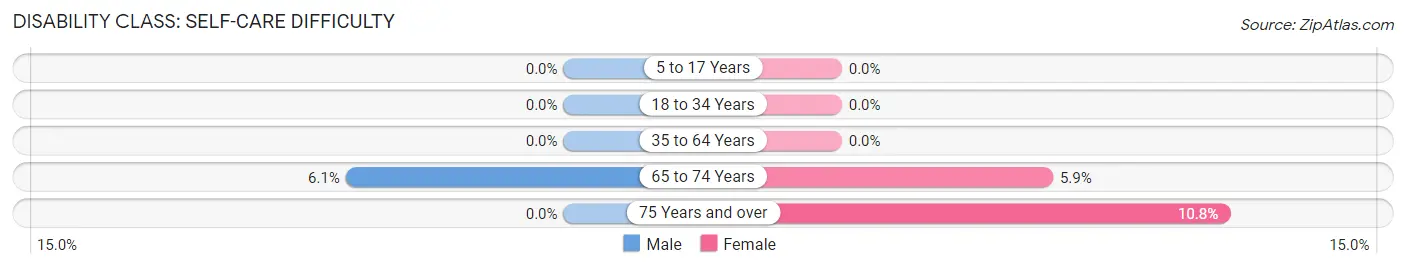
| Age Bracket | Male | Female |
| 5 to 17 Years | 0 (0.0%) | 0 (0.0%) |
| 18 to 34 Years | 0 (0.0%) | 0 (0.0%) |
| 35 to 64 Years | 0 (0.0%) | 0 (0.0%) |
| 65 to 74 Years | 2 (6.1%) | 2 (5.9%) |
| 75 Years and over | 0 (0.0%) | 4 (10.8%) |
Technology Access in Oneida
Computing Device Access in Oneida
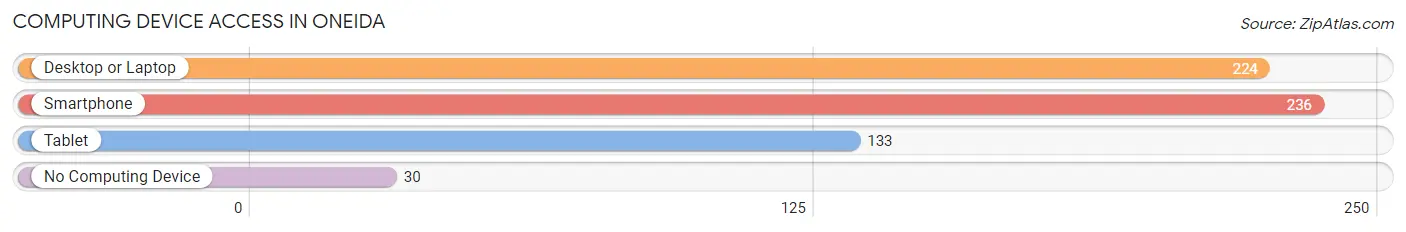
| Device Type | # Households | % Households |
| Desktop or Laptop | 224 | 80.0% |
| Smartphone | 236 | 84.3% |
| Tablet | 133 | 47.5% |
| No Computing Device | 30 | 10.7% |
| Total | 280 | 100.0% |
Internet Access in Oneida
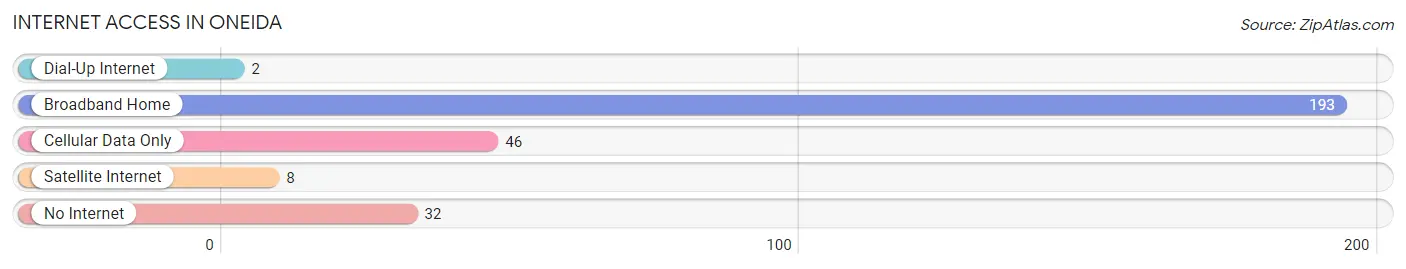
| Internet Type | # Households | % Households |
| Dial-Up Internet | 2 | 0.7% |
| Broadband Home | 193 | 68.9% |
| Cellular Data Only | 46 | 16.4% |
| Satellite Internet | 8 | 2.9% |
| No Internet | 32 | 11.4% |
| Total | 280 | 100.0% |
Oneida Summary
Oneida, Illinois is a small village located in LaSalle County, Illinois. It is situated on the banks of the Vermilion River, about 25 miles southwest of the city of Ottawa. The village has a population of approximately 1,000 people and is part of the Ottawa-Streator Micropolitan Statistical Area.
History
Oneida was founded in 1836 by a group of settlers from Oneida County, New York. The village was named after the Oneida people, a Native American tribe that had lived in the area prior to the arrival of the settlers. The first settlers were mostly farmers, and the village quickly grew to become a thriving agricultural community.
In 1854, the Illinois Central Railroad was built through the village, connecting it to the larger cities of Ottawa and Streator. This allowed for the growth of the village, as it became a popular stop for travelers and freight.
In the late 19th century, Oneida became a popular destination for tourists, as it was located near several popular attractions, such as Starved Rock State Park and Matthiessen State Park. The village also became a popular destination for hunters, as it was located near several hunting grounds.
Geography
Oneida is located in LaSalle County, Illinois, about 25 miles southwest of the city of Ottawa. The village is situated on the banks of the Vermilion River, and is surrounded by rolling hills and farmland. The village is located in the Ottawa-Streator Micropolitan Statistical Area.
The climate in Oneida is typical of the Midwest, with hot summers and cold winters. The average temperature in the summer is around 75 degrees Fahrenheit, and the average temperature in the winter is around 25 degrees Fahrenheit.
Economy
The economy of Oneida is largely based on agriculture. The village is home to several farms, which produce a variety of crops, including corn, soybeans, and wheat. The village also has several businesses, including a grocery store, a hardware store, and a restaurant.
The village is also home to several manufacturing companies, which produce a variety of products, including furniture, automotive parts, and medical supplies.
Demographics
As of the 2010 census, the population of Oneida was 1,000 people. The racial makeup of the village was 97.2% White, 0.7% African American, 0.3% Native American, 0.2% Asian, and 1.6% from other races.
The median household income in Oneida was $45,000, and the median family income was $50,000. The per capita income in the village was $20,000. The poverty rate in Oneida was 8.3%.
Conclusion
Oneida, Illinois is a small village located in LaSalle County, Illinois. It is situated on the banks of the Vermilion River, about 25 miles southwest of the city of Ottawa. The village has a population of approximately 1,000 people and is part of the Ottawa-Streator Micropolitan Statistical Area. The economy of Oneida is largely based on agriculture, and the village is home to several businesses and manufacturing companies. The racial makeup of the village is mostly White, with a small percentage of African American, Native American, and Asian residents. The median household income in Oneida is $45,000, and the poverty rate is 8.3%.
Common Questions
What is Per Capita Income in Oneida?
Per Capita income in Oneida is $26,815.
What is the Median Family Income in Oneida?
Median Family Income in Oneida is $68,750.
What is the Median Household income in Oneida?
Median Household Income in Oneida is $62,700.
What is Income or Wage Gap in Oneida?
Income or Wage Gap in Oneida is 20.2%.
Women in Oneida earn 79.8 cents for every dollar earned by a man.
What is Inequality or Gini Index in Oneida?
Inequality or Gini Index in Oneida is 0.37.
What is the Total Population of Oneida?
Total Population of Oneida is 732.
What is the Total Male Population of Oneida?
Total Male Population of Oneida is 318.
What is the Total Female Population of Oneida?
Total Female Population of Oneida is 414.
What is the Ratio of Males per 100 Females in Oneida?
There are 76.81 Males per 100 Females in Oneida.
What is the Ratio of Females per 100 Males in Oneida?
There are 130.19 Females per 100 Males in Oneida.
What is the Median Population Age in Oneida?
Median Population Age in Oneida is 41.5 Years.
What is the Average Family Size in Oneida
Average Family Size in Oneida is 3.6 People.
What is the Average Household Size in Oneida
Average Household Size in Oneida is 2.6 People.
How Large is the Labor Force in Oneida?
There are 295 People in the Labor Forcein in Oneida.
What is the Percentage of People in the Labor Force in Oneida?
48.8% of People are in the Labor Force in Oneida.
What is the Unemployment Rate in Oneida?
Unemployment Rate in Oneida is 3.7%.