Newton, IL Map & Demographics
Newton Map
Newton Overview
$29,298
PER CAPITA INCOME
$64,792
AVG FAMILY INCOME
$55,109
AVG HOUSEHOLD INCOME
53.8%
WAGE / INCOME GAP [ % ]
46.2¢/ $1
WAGE / INCOME GAP [ $ ]
0.36
INEQUALITY / GINI INDEX
2,957
TOTAL POPULATION
1,507
MALE POPULATION
1,450
FEMALE POPULATION
103.93
MALES / 100 FEMALES
96.22
FEMALES / 100 MALES
46.4
MEDIAN AGE
2.6
AVG FAMILY SIZE
2.1
AVG HOUSEHOLD SIZE
1,471
LABOR FORCE [ PEOPLE ]
58.5%
PERCENT IN LABOR FORCE
5.1%
UNEMPLOYMENT RATE
Newton Zip Codes
Newton Area Codes
Income in Newton
Income Overview in Newton
Per Capita Income in Newton is $29,298, while median incomes of families and households are $64,792 and $55,109 respectively.
| Characteristic | Number | Measure |
| Per Capita Income | 2,957 | $29,298 |
| Median Family Income | 871 | $64,792 |
| Mean Family Income | 871 | $76,286 |
| Median Household Income | 1,374 | $55,109 |
| Mean Household Income | 1,374 | $64,305 |
| Income Deficit | 871 | $0 |
| Wage / Income Gap (%) | 2,957 | 53.82% |
| Wage / Income Gap ($) | 2,957 | 46.18¢ per $1 |
| Gini / Inequality Index | 2,957 | 0.36 |
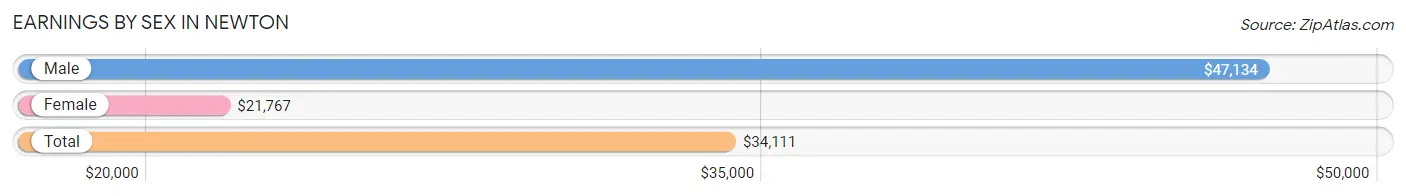
Earnings by Sex in Newton
Average Earnings in Newton are $34,111, $47,134 for men and $21,767 for women, a difference of 53.8%.
| Sex | Number | Average Earnings |
| Male | 813 (53.2%) | $47,134 |
| Female | 715 (46.8%) | $21,767 |
| Total | 1,528 (100.0%) | $34,111 |
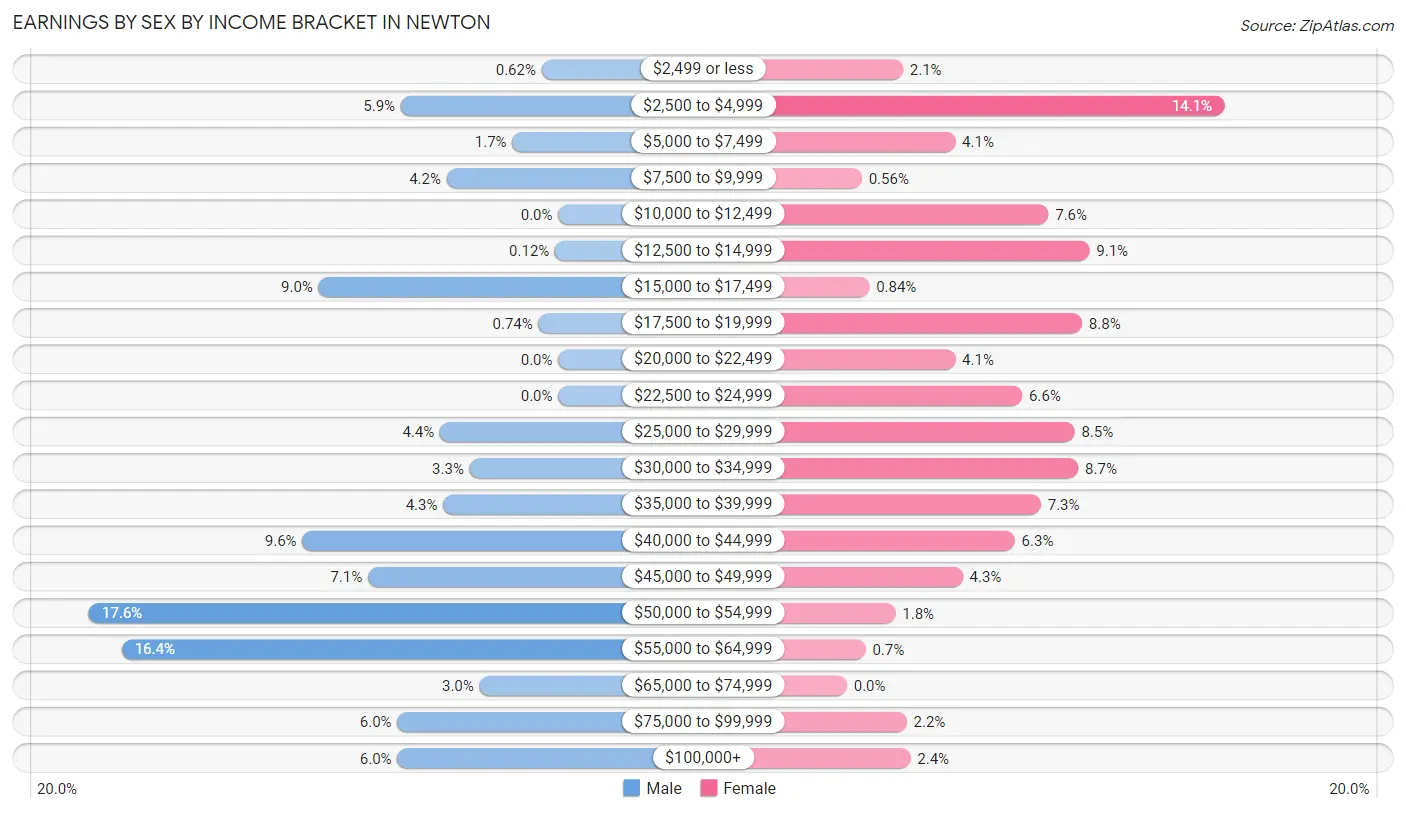
Earnings by Sex by Income Bracket in Newton
The most common earnings brackets in Newton are $50,000 to $54,999 for men (143 | 17.6%) and $2,500 to $4,999 for women (101 | 14.1%).
| Income | Male | Female |
| $2,499 or less | 5 (0.6%) | 15 (2.1%) |
| $2,500 to $4,999 | 48 (5.9%) | 101 (14.1%) |
| $5,000 to $7,499 | 14 (1.7%) | 29 (4.1%) |
| $7,500 to $9,999 | 34 (4.2%) | 4 (0.6%) |
| $10,000 to $12,499 | 0 (0.0%) | 54 (7.5%) |
| $12,500 to $14,999 | 1 (0.1%) | 65 (9.1%) |
| $15,000 to $17,499 | 73 (9.0%) | 6 (0.8%) |
| $17,500 to $19,999 | 6 (0.7%) | 63 (8.8%) |
| $20,000 to $22,499 | 0 (0.0%) | 29 (4.1%) |
| $22,500 to $24,999 | 0 (0.0%) | 47 (6.6%) |
| $25,000 to $29,999 | 36 (4.4%) | 61 (8.5%) |
| $30,000 to $34,999 | 27 (3.3%) | 62 (8.7%) |
| $35,000 to $39,999 | 35 (4.3%) | 52 (7.3%) |
| $40,000 to $44,999 | 78 (9.6%) | 45 (6.3%) |
| $45,000 to $49,999 | 58 (7.1%) | 31 (4.3%) |
| $50,000 to $54,999 | 143 (17.6%) | 13 (1.8%) |
| $55,000 to $64,999 | 133 (16.4%) | 5 (0.7%) |
| $65,000 to $74,999 | 24 (2.9%) | 0 (0.0%) |
| $75,000 to $99,999 | 49 (6.0%) | 16 (2.2%) |
| $100,000+ | 49 (6.0%) | 17 (2.4%) |
| Total | 813 (100.0%) | 715 (100.0%) |
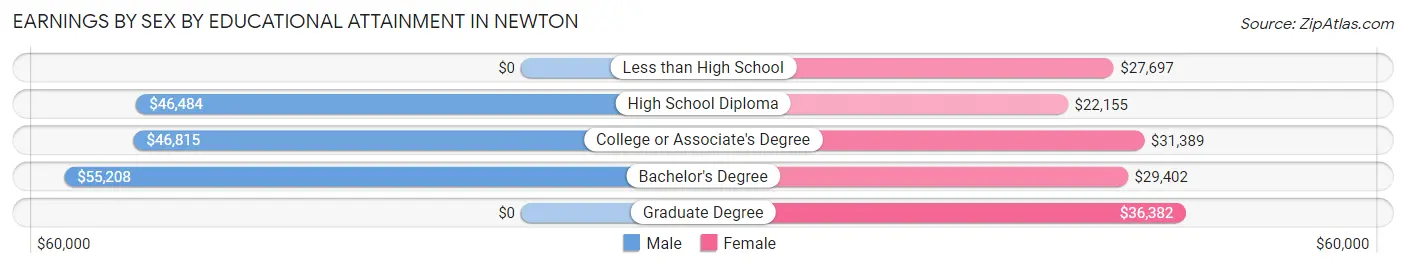
Earnings by Sex by Educational Attainment in Newton
Average earnings in Newton are $47,371 for men and $24,707 for women, a difference of 47.8%. Men with an educational attainment of bachelor's degree enjoy the highest average annual earnings of $55,208, while those with high school diploma education earn the least with $46,484. Women with an educational attainment of graduate degree earn the most with the average annual earnings of $36,382, while those with high school diploma education have the smallest earnings of $22,155.
| Educational Attainment | Male Income | Female Income |
| Less than High School | - | - |
| High School Diploma | $46,484 | $22,155 |
| College or Associate's Degree | $46,815 | $31,389 |
| Bachelor's Degree | $55,208 | $29,402 |
| Graduate Degree | - | - |
| Total | $47,371 | $24,707 |
Family Income in Newton
Family Income Brackets in Newton
According to the Newton family income data, there are 256 families falling into the $50,000 to $74,999 income range, which is the most common income bracket and makes up 29.4% of all families. Conversely, the $200,000+ income bracket is the least frequent group with only 12 families (1.4%) belonging to this category.
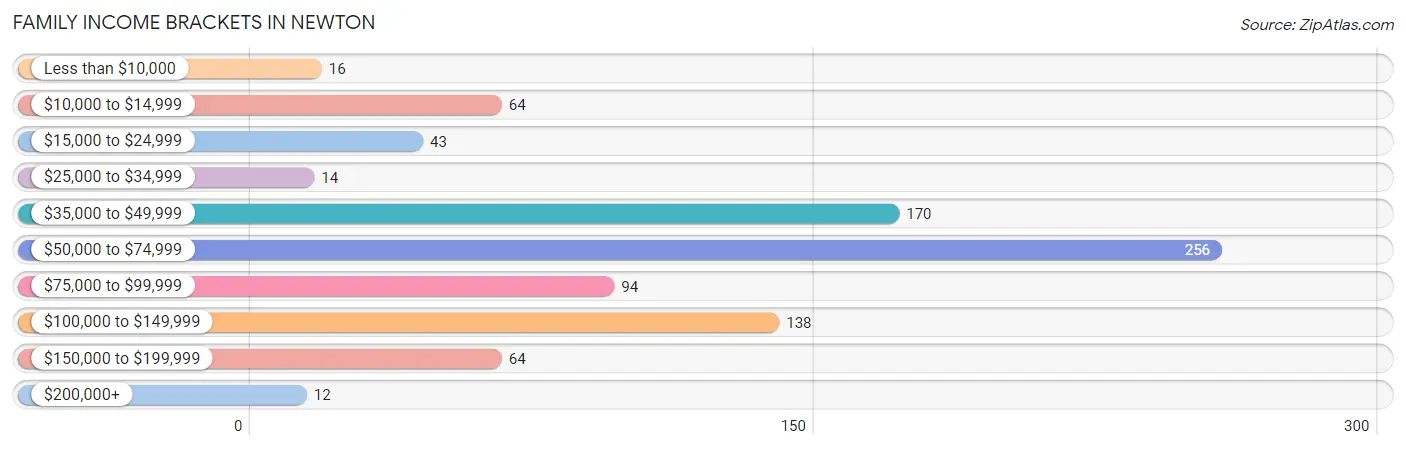
| Income Bracket | # Families | % Families |
| Less than $10,000 | 16 | 1.8% |
| $10,000 to $14,999 | 64 | 7.3% |
| $15,000 to $24,999 | 43 | 4.9% |
| $25,000 to $34,999 | 14 | 1.6% |
| $35,000 to $49,999 | 170 | 19.5% |
| $50,000 to $74,999 | 256 | 29.4% |
| $75,000 to $99,999 | 94 | 10.8% |
| $100,000 to $149,999 | 138 | 15.8% |
| $150,000 to $199,999 | 64 | 7.3% |
| $200,000+ | 12 | 1.4% |
Family Income by Famaliy Size in Newton
3-person families (223 | 25.6%) account for the highest median family income in Newton with $65,707 per family, while 2-person families (436 | 50.1%) have the highest median income of $28,214 per family member.
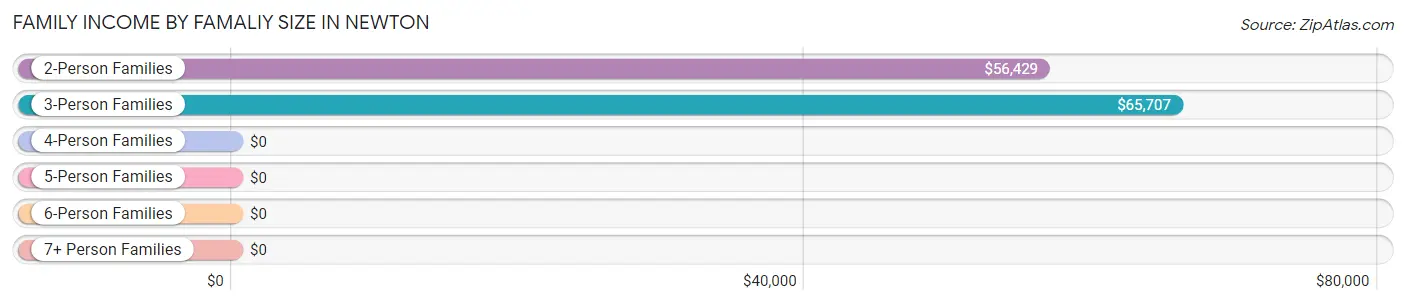
| Income Bracket | # Families | Median Income |
| 2-Person Families | 436 (50.1%) | $56,429 |
| 3-Person Families | 223 (25.6%) | $65,707 |
| 4-Person Families | 154 (17.7%) | $0 |
| 5-Person Families | 32 (3.7%) | $0 |
| 6-Person Families | 0 (0.0%) | $0 |
| 7+ Person Families | 26 (3.0%) | $0 |
| Total | 871 (100.0%) | $64,792 |
Family Income by Number of Earners in Newton
The median family income in Newton is $64,792, with families comprising 2 earners (308) having the highest median family income of $70,192, while families with 1 earner (219) have the lowest median family income of $45,750, accounting for 35.4% and 25.1% of families, respectively.
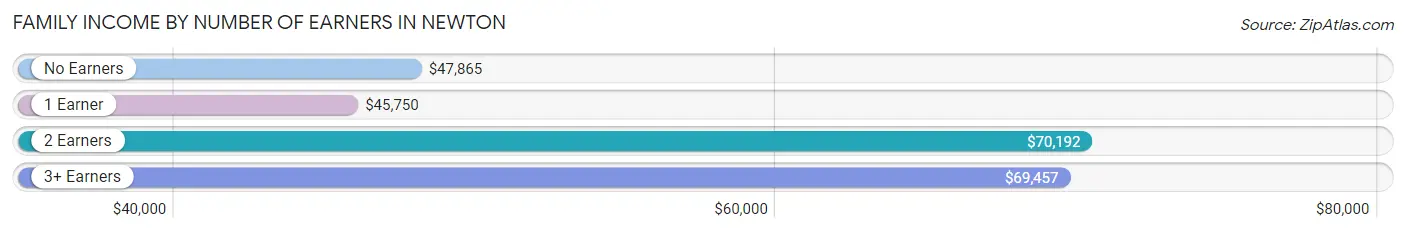
| Number of Earners | # Families | Median Income |
| No Earners | 145 (16.7%) | $47,865 |
| 1 Earner | 219 (25.1%) | $45,750 |
| 2 Earners | 308 (35.4%) | $70,192 |
| 3+ Earners | 199 (22.9%) | $69,457 |
| Total | 871 (100.0%) | $64,792 |
Household Income in Newton
Household Income Brackets in Newton
With 382 households falling in the category, the $50,000 to $74,999 income range is the most frequent in Newton, accounting for 27.8% of all households. In contrast, only 12 households (0.9%) fall into the $200,000+ income bracket, making it the least populous group.
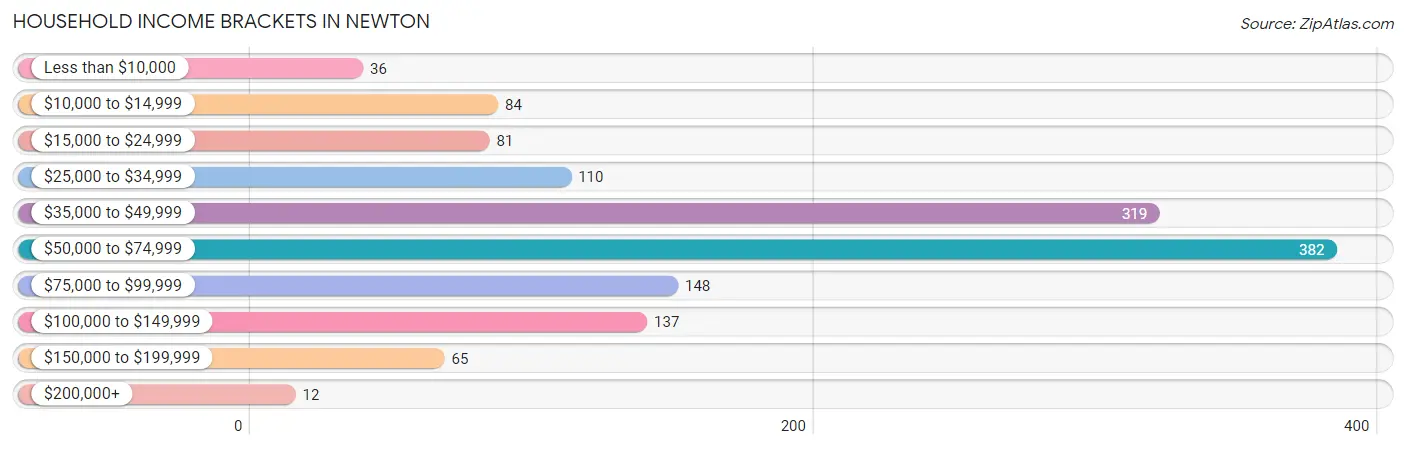
| Income Bracket | # Households | % Households |
| Less than $10,000 | 36 | 2.6% |
| $10,000 to $14,999 | 84 | 6.1% |
| $15,000 to $24,999 | 81 | 5.9% |
| $25,000 to $34,999 | 110 | 8.0% |
| $35,000 to $49,999 | 319 | 23.2% |
| $50,000 to $74,999 | 382 | 27.8% |
| $75,000 to $99,999 | 148 | 10.8% |
| $100,000 to $149,999 | 137 | 10.0% |
| $150,000 to $199,999 | 65 | 4.7% |
| $200,000+ | 12 | 0.9% |
Household Income by Householder Age in Newton
The median household income in Newton is $55,109, with the highest median household income of $75,568 found in the 15 to 24 years age bracket for the primary householder. A total of 51 households (3.7%) fall into this category. Meanwhile, the 65+ years age bracket for the primary householder has the lowest median household income of $47,500, with 440 households (32.0%) in this group.
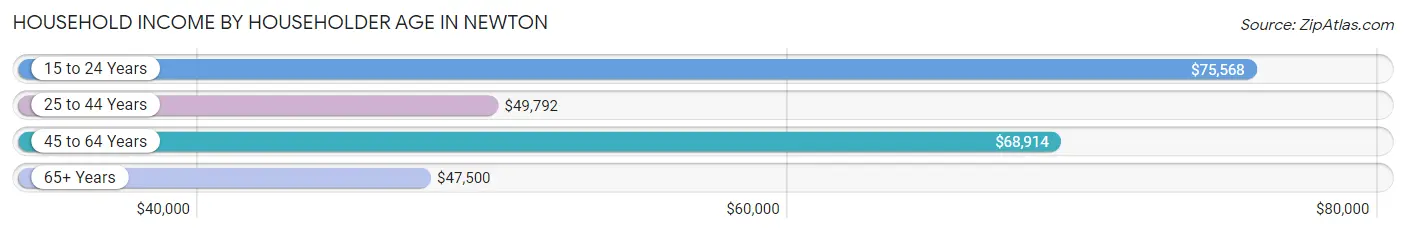
| Income Bracket | # Households | Median Income |
| 15 to 24 Years | 51 (3.7%) | $75,568 |
| 25 to 44 Years | 383 (27.9%) | $49,792 |
| 45 to 64 Years | 500 (36.4%) | $68,914 |
| 65+ Years | 440 (32.0%) | $47,500 |
| Total | 1,374 (100.0%) | $55,109 |
Poverty in Newton
Income Below Poverty by Sex and Age in Newton
With 10.4% poverty level for males and 13.0% for females among the residents of Newton, 6 to 11 year old males and 18 to 24 year old females are the most vulnerable to poverty, with 35 males (51.5%) and 53 females (45.3%) in their respective age groups living below the poverty level.
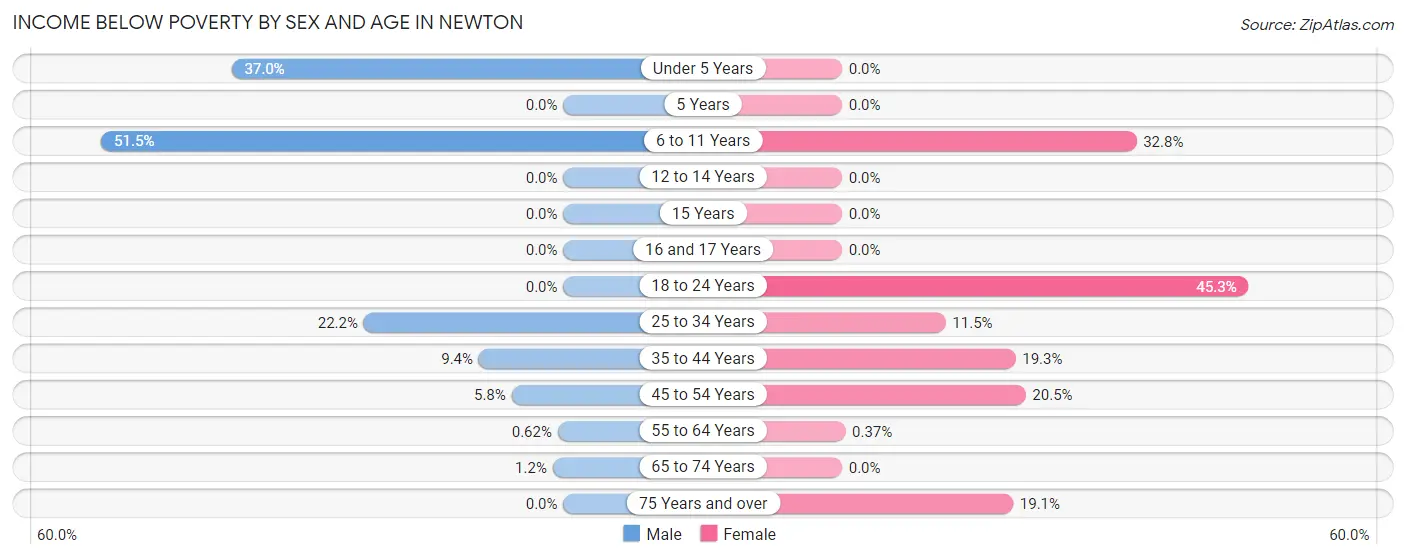
| Age Bracket | Male | Female |
| Under 5 Years | 34 (37.0%) | 0 (0.0%) |
| 5 Years | 0 (0.0%) | 0 (0.0%) |
| 6 to 11 Years | 35 (51.5%) | 20 (32.8%) |
| 12 to 14 Years | 0 (0.0%) | 0 (0.0%) |
| 15 Years | 0 (0.0%) | 0 (0.0%) |
| 16 and 17 Years | 0 (0.0%) | 0 (0.0%) |
| 18 to 24 Years | 0 (0.0%) | 53 (45.3%) |
| 25 to 34 Years | 52 (22.2%) | 24 (11.5%) |
| 35 to 44 Years | 16 (9.4%) | 17 (19.3%) |
| 45 to 54 Years | 11 (5.8%) | 36 (20.4%) |
| 55 to 64 Years | 1 (0.6%) | 1 (0.4%) |
| 65 to 74 Years | 2 (1.2%) | 0 (0.0%) |
| 75 Years and over | 0 (0.0%) | 32 (19.1%) |
| Total | 151 (10.4%) | 183 (13.0%) |
Income Above Poverty by Sex and Age in Newton
According to the poverty statistics in Newton, males aged 5 years and females aged under 5 years are the age groups that are most secure financially, with 100.0% of males and 100.0% of females in these age groups living above the poverty line.
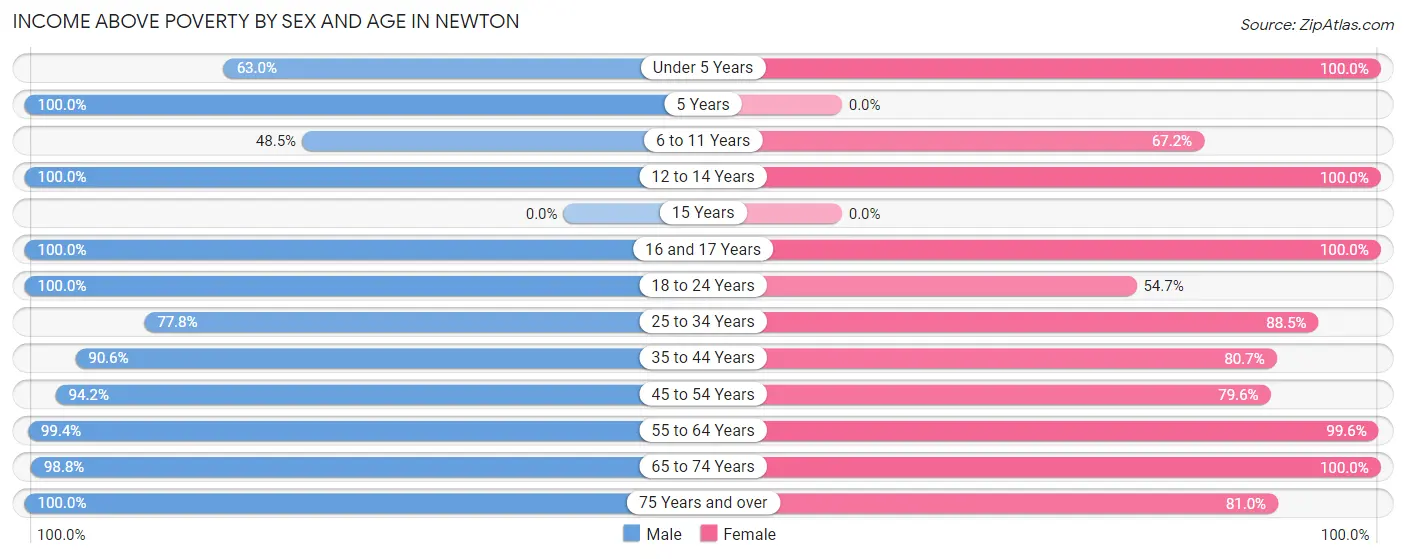
| Age Bracket | Male | Female |
| Under 5 Years | 58 (63.0%) | 76 (100.0%) |
| 5 Years | 31 (100.0%) | 0 (0.0%) |
| 6 to 11 Years | 33 (48.5%) | 41 (67.2%) |
| 12 to 14 Years | 84 (100.0%) | 8 (100.0%) |
| 15 Years | 0 (0.0%) | 0 (0.0%) |
| 16 and 17 Years | 29 (100.0%) | 34 (100.0%) |
| 18 to 24 Years | 119 (100.0%) | 64 (54.7%) |
| 25 to 34 Years | 182 (77.8%) | 184 (88.5%) |
| 35 to 44 Years | 154 (90.6%) | 71 (80.7%) |
| 45 to 54 Years | 180 (94.2%) | 140 (79.5%) |
| 55 to 64 Years | 159 (99.4%) | 271 (99.6%) |
| 65 to 74 Years | 168 (98.8%) | 204 (100.0%) |
| 75 Years and over | 103 (100.0%) | 136 (80.9%) |
| Total | 1,300 (89.6%) | 1,229 (87.0%) |
Income Below Poverty Among Married-Couple Families in Newton
The poverty statistics for married-couple families in Newton show that 1.8% or 11 of the total 601 families live below the poverty line. Families with no children have the highest poverty rate of 2.9%, comprising of 11 families. On the other hand, families with 1 or 2 children have the lowest poverty rate of 0.0%, which includes 0 families.
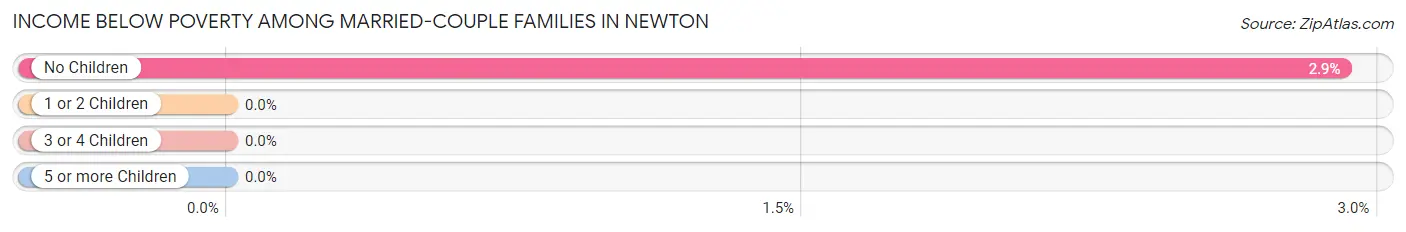
| Children | Above Poverty | Below Poverty |
| No Children | 367 (97.1%) | 11 (2.9%) |
| 1 or 2 Children | 165 (100.0%) | 0 (0.0%) |
| 3 or 4 Children | 58 (100.0%) | 0 (0.0%) |
| 5 or more Children | 0 (0.0%) | 0 (0.0%) |
| Total | 590 (98.2%) | 11 (1.8%) |
Income Below Poverty Among Single-Parent Households in Newton
According to the poverty data in Newton, 14.0% or 16 single-father households and 34.0% or 53 single-mother households are living below the poverty line. Among single-father households, those with 1 or 2 children have the highest poverty rate, with 16 households (72.7%) experiencing poverty. Likewise, among single-mother households, those with 1 or 2 children have the highest poverty rate, with 29 households (39.7%) falling below the poverty line.
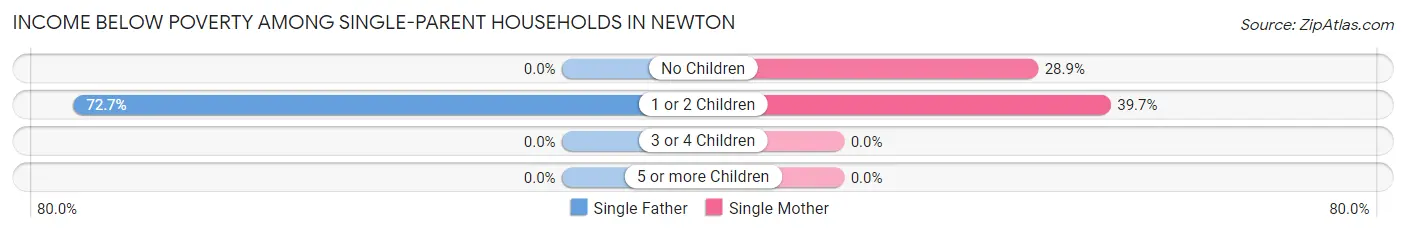
| Children | Single Father | Single Mother |
| No Children | 0 (0.0%) | 24 (28.9%) |
| 1 or 2 Children | 16 (72.7%) | 29 (39.7%) |
| 3 or 4 Children | 0 (0.0%) | 0 (0.0%) |
| 5 or more Children | 0 (0.0%) | 0 (0.0%) |
| Total | 16 (14.0%) | 53 (34.0%) |
Income Below Poverty Among Married-Couple vs Single-Parent Households in Newton
The poverty data for Newton shows that 11 of the married-couple family households (1.8%) and 69 of the single-parent households (25.6%) are living below the poverty level. Within the married-couple family households, those with no children have the highest poverty rate, with 11 households (2.9%) falling below the poverty line. Among the single-parent households, those with 1 or 2 children have the highest poverty rate, with 45 household (47.4%) living below poverty.
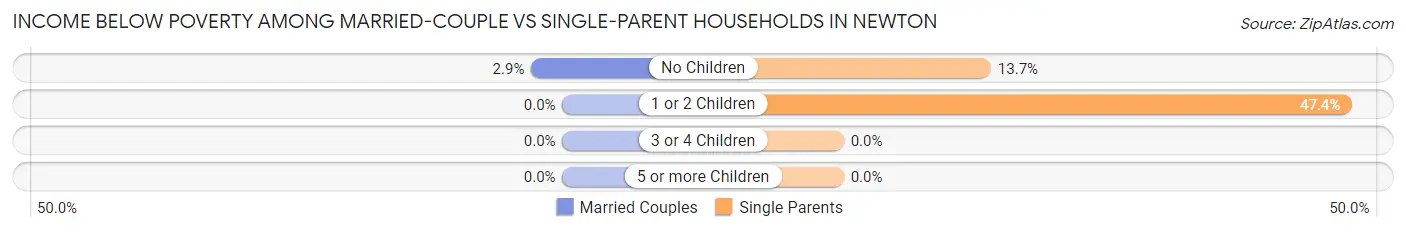
| Children | Married-Couple Families | Single-Parent Households |
| No Children | 11 (2.9%) | 24 (13.7%) |
| 1 or 2 Children | 0 (0.0%) | 45 (47.4%) |
| 3 or 4 Children | 0 (0.0%) | 0 (0.0%) |
| 5 or more Children | 0 (0.0%) | 0 (0.0%) |
| Total | 11 (1.8%) | 69 (25.6%) |
Race in Newton
The most populous races in Newton are White / Caucasian (2,873 | 97.2%), Two or more Races (63 | 2.1%), and Hispanic or Latino (32 | 1.1%).
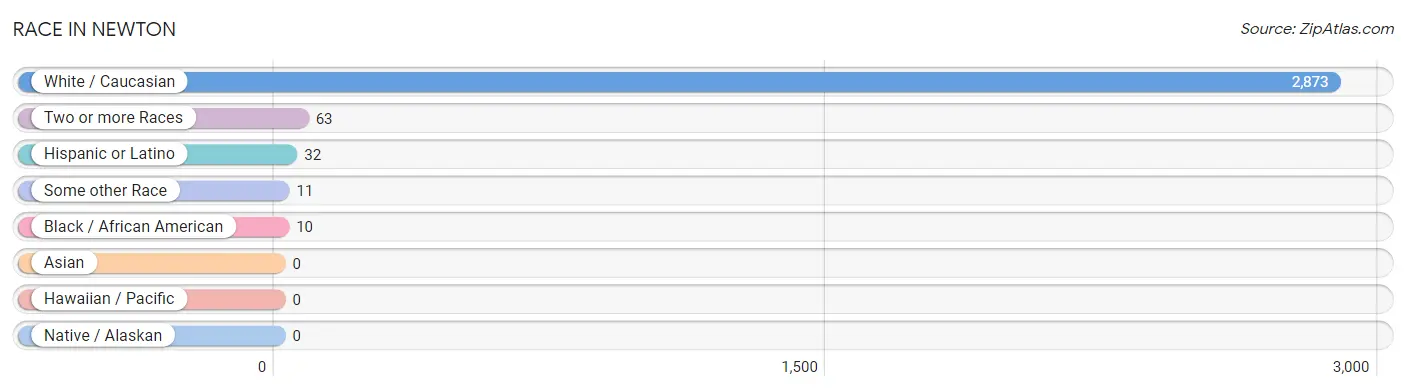
| Race | # Population | % Population |
| Asian | 0 | 0.0% |
| Black / African American | 10 | 0.3% |
| Hawaiian / Pacific | 0 | 0.0% |
| Hispanic or Latino | 32 | 1.1% |
| Native / Alaskan | 0 | 0.0% |
| White / Caucasian | 2,873 | 97.2% |
| Two or more Races | 63 | 2.1% |
| Some other Race | 11 | 0.4% |
| Total | 2,957 | 100.0% |
Ancestry in Newton
The most populous ancestries reported in Newton are German (1,090 | 36.9%), Irish (340 | 11.5%), English (267 | 9.0%), American (209 | 7.1%), and Dutch (117 | 4.0%), together accounting for 68.4% of all Newton residents.
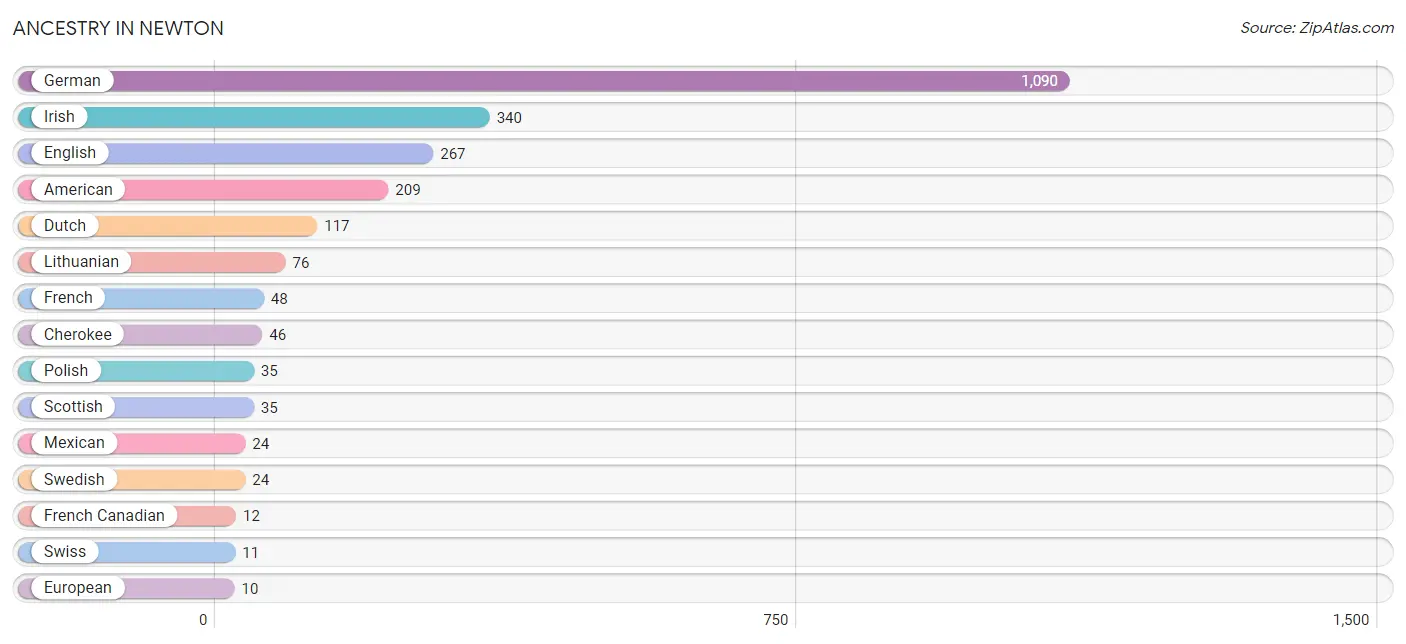
| Ancestry | # Population | % Population |
| American | 209 | 7.1% |
| Cherokee | 46 | 1.6% |
| Dutch | 117 | 4.0% |
| English | 267 | 9.0% |
| European | 10 | 0.3% |
| French | 48 | 1.6% |
| French Canadian | 12 | 0.4% |
| German | 1,090 | 36.9% |
| Hungarian | 8 | 0.3% |
| Irish | 340 | 11.5% |
| Lithuanian | 76 | 2.6% |
| Mexican | 24 | 0.8% |
| Polish | 35 | 1.2% |
| Scandinavian | 2 | 0.1% |
| Scotch-Irish | 6 | 0.2% |
| Scottish | 35 | 1.2% |
| Swedish | 24 | 0.8% |
| Swiss | 11 | 0.4% |
| Ukrainian | 2 | 0.1% | View All 19 Rows |
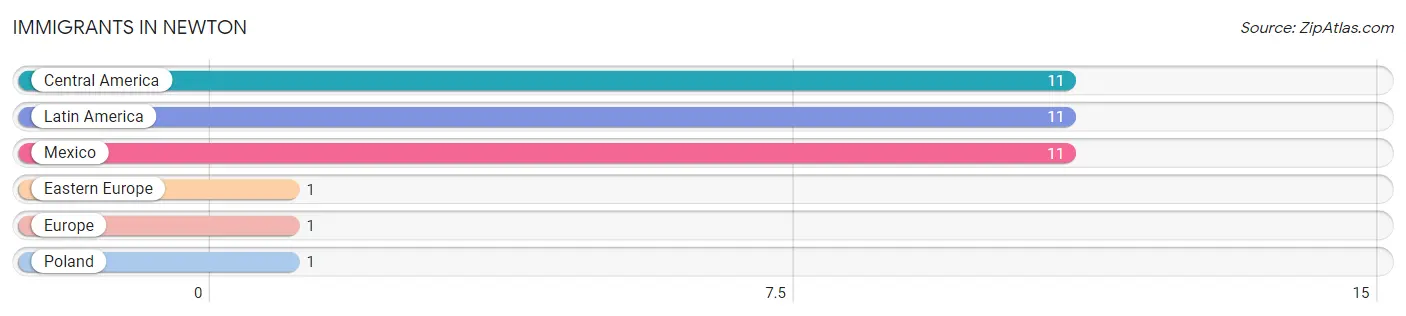
Immigrants in Newton
The most numerous immigrant groups reported in Newton came from Central America (11 | 0.4%), Latin America (11 | 0.4%), Mexico (11 | 0.4%), Eastern Europe (1 | 0.0%), and Europe (1 | 0.0%), together accounting for 1.2% of all Newton residents.
| Immigration Origin | # Population | % Population |
| Central America | 11 | 0.4% |
| Eastern Europe | 1 | 0.0% |
| Europe | 1 | 0.0% |
| Latin America | 11 | 0.4% |
| Mexico | 11 | 0.4% |
| Poland | 1 | 0.0% | View All 6 Rows |
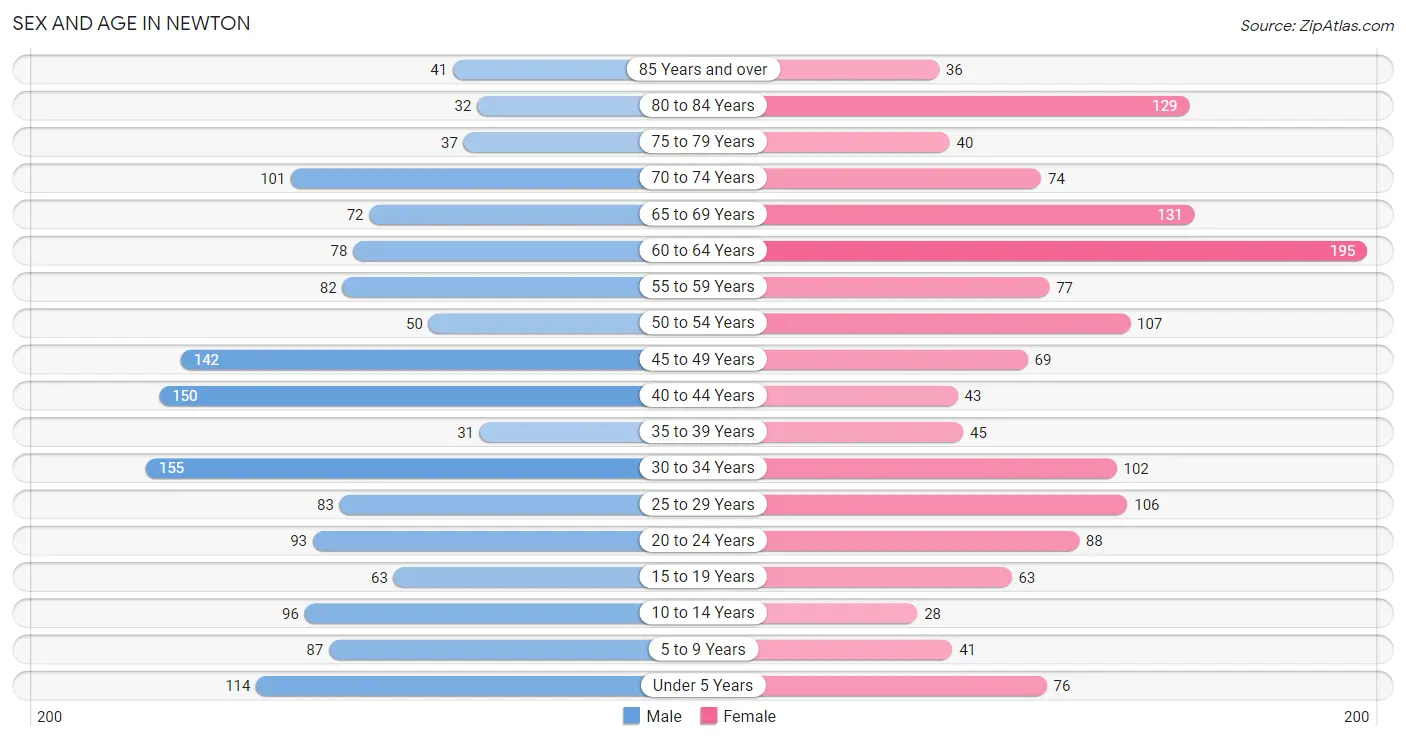
Sex and Age in Newton
Sex and Age in Newton
The most populous age groups in Newton are 30 to 34 Years (155 | 10.3%) for men and 60 to 64 Years (195 | 13.5%) for women.
| Age Bracket | Male | Female |
| Under 5 Years | 114 (7.6%) | 76 (5.2%) |
| 5 to 9 Years | 87 (5.8%) | 41 (2.8%) |
| 10 to 14 Years | 96 (6.4%) | 28 (1.9%) |
| 15 to 19 Years | 63 (4.2%) | 63 (4.3%) |
| 20 to 24 Years | 93 (6.2%) | 88 (6.1%) |
| 25 to 29 Years | 83 (5.5%) | 106 (7.3%) |
| 30 to 34 Years | 155 (10.3%) | 102 (7.0%) |
| 35 to 39 Years | 31 (2.1%) | 45 (3.1%) |
| 40 to 44 Years | 150 (10.0%) | 43 (3.0%) |
| 45 to 49 Years | 142 (9.4%) | 69 (4.8%) |
| 50 to 54 Years | 50 (3.3%) | 107 (7.4%) |
| 55 to 59 Years | 82 (5.4%) | 77 (5.3%) |
| 60 to 64 Years | 78 (5.2%) | 195 (13.5%) |
| 65 to 69 Years | 72 (4.8%) | 131 (9.0%) |
| 70 to 74 Years | 101 (6.7%) | 74 (5.1%) |
| 75 to 79 Years | 37 (2.5%) | 40 (2.8%) |
| 80 to 84 Years | 32 (2.1%) | 129 (8.9%) |
| 85 Years and over | 41 (2.7%) | 36 (2.5%) |
| Total | 1,507 (100.0%) | 1,450 (100.0%) |
Families and Households in Newton
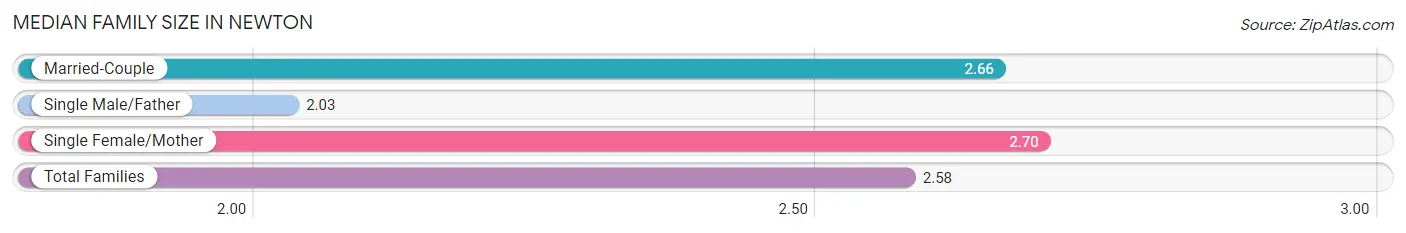
Median Family Size in Newton
The median family size in Newton is 2.58 persons per family, with single female/mother families (156 | 17.9%) accounting for the largest median family size of 2.7 persons per family. On the other hand, single male/father families (114 | 13.1%) represent the smallest median family size with 2.03 persons per family.
| Family Type | # Families | Family Size |
| Married-Couple | 601 (69.0%) | 2.66 |
| Single Male/Father | 114 (13.1%) | 2.03 |
| Single Female/Mother | 156 (17.9%) | 2.70 |
| Total Families | 871 (100.0%) | 2.58 |
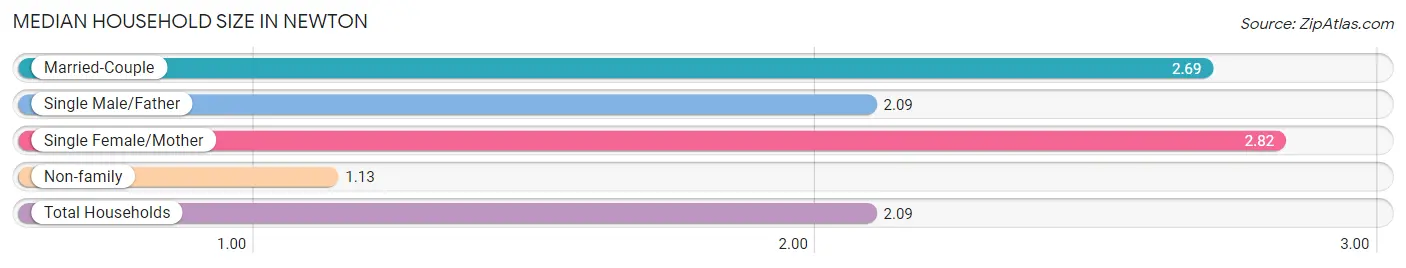
Median Household Size in Newton
The median household size in Newton is 2.09 persons per household, with single female/mother households (156 | 11.4%) accounting for the largest median household size of 2.82 persons per household. non-family households (503 | 36.6%) represent the smallest median household size with 1.13 persons per household.
| Household Type | # Households | Household Size |
| Married-Couple | 601 (43.7%) | 2.69 |
| Single Male/Father | 114 (8.3%) | 2.09 |
| Single Female/Mother | 156 (11.4%) | 2.82 |
| Non-family | 503 (36.6%) | 1.13 |
| Total Households | 1,374 (100.0%) | 2.09 |
Household Size by Marriage Status in Newton
Out of a total of 1,374 households in Newton, 871 (63.4%) are family households, while 503 (36.6%) are nonfamily households. The most numerous type of family households are 2-person households, comprising 424, and the most common type of nonfamily households are 1-person households, comprising 447.
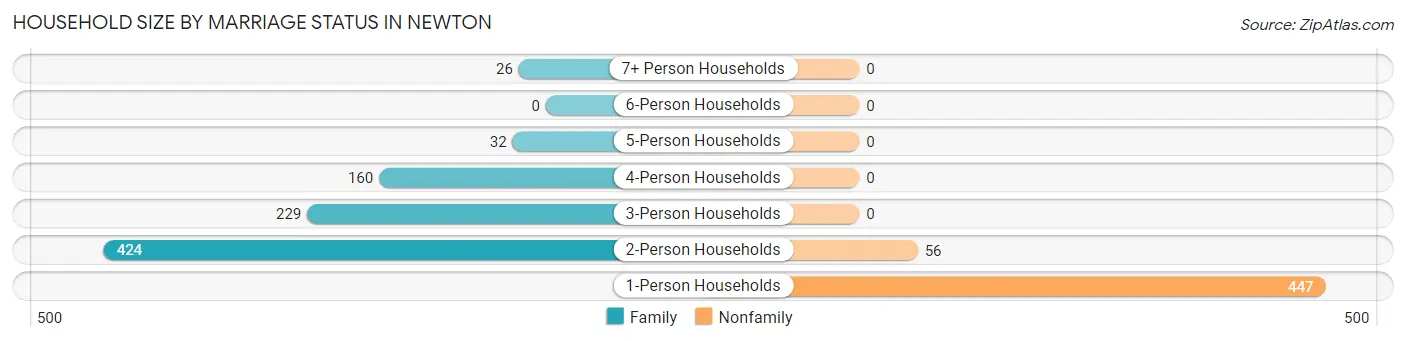
| Household Size | Family Households | Nonfamily Households |
| 1-Person Households | - | 447 (32.5%) |
| 2-Person Households | 424 (30.9%) | 56 (4.1%) |
| 3-Person Households | 229 (16.7%) | 0 (0.0%) |
| 4-Person Households | 160 (11.6%) | 0 (0.0%) |
| 5-Person Households | 32 (2.3%) | 0 (0.0%) |
| 6-Person Households | 0 (0.0%) | 0 (0.0%) |
| 7+ Person Households | 26 (1.9%) | 0 (0.0%) |
| Total | 871 (63.4%) | 503 (36.6%) |
Female Fertility in Newton
Fertility by Age in Newton
Average fertility rate in Newton is 119.0 births per 1,000 women. Women in the age bracket of 35 to 50 years have the highest fertility rate with 160.0 births per 1,000 women. Women in the age bracket of 20 to 34 years acount for 53.0% of all women with births.
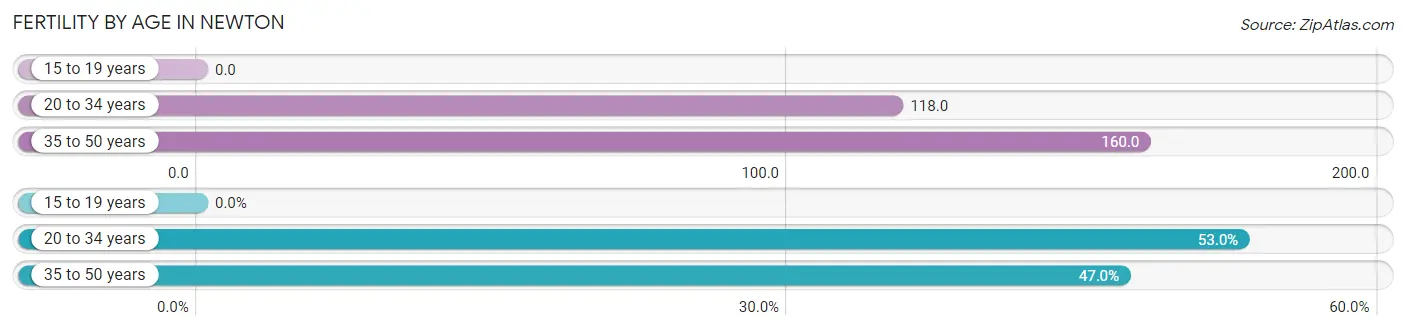
| Age Bracket | Women with Births | Births / 1,000 Women |
| 15 to 19 years | 0 (0.0%) | 0.0 |
| 20 to 34 years | 35 (53.0%) | 118.0 |
| 35 to 50 years | 31 (47.0%) | 160.0 |
| Total | 66 (100.0%) | 119.0 |
Fertility by Age by Marriage Status in Newton
81.8% of women with births (66) in Newton are married. The highest percentage of unmarried women with births falls into 20 to 34 years age bracket with 34.3% of them unmarried at the time of birth, while the lowest percentage of unmarried women with births belong to 35 to 50 years age bracket with 0.0% of them unmarried.
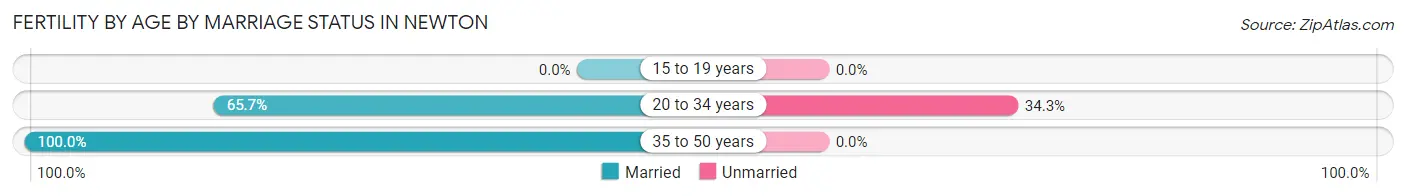
| Age Bracket | Married | Unmarried |
| 15 to 19 years | 0 (0.0%) | 0 (0.0%) |
| 20 to 34 years | 23 (65.7%) | 12 (34.3%) |
| 35 to 50 years | 31 (100.0%) | 0 (0.0%) |
| Total | 54 (81.8%) | 12 (18.2%) |
Fertility by Education in Newton
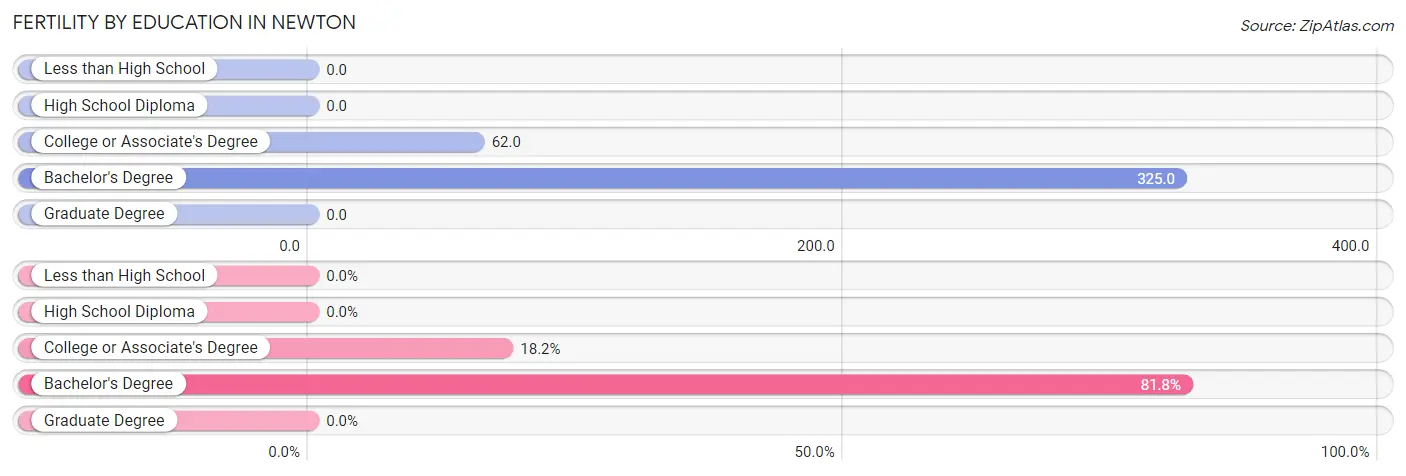
| Educational Attainment | Women with Births | Births / 1,000 Women |
| Less than High School | 0 (0.0%) | 0.0 |
| High School Diploma | 0 (0.0%) | 0.0 |
| College or Associate's Degree | 12 (18.2%) | 62.0 |
| Bachelor's Degree | 54 (81.8%) | 325.0 |
| Graduate Degree | 0 (0.0%) | 0.0 |
| Total | 66 (100.0%) | 119.0 |
Fertility by Education by Marriage Status in Newton
18.2% of women with births in Newton are unmarried. Women with the educational attainment of bachelor's degree are most likely to be married with 100.0% of them married at childbirth, while women with the educational attainment of college or associate's degree are least likely to be married with 100.0% of them unmarried at childbirth.
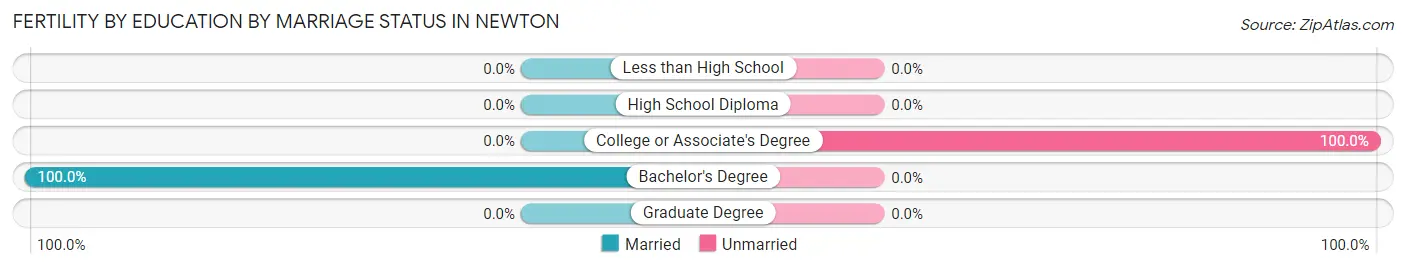
| Educational Attainment | Married | Unmarried |
| Less than High School | 0 (0.0%) | 0 (0.0%) |
| High School Diploma | 0 (0.0%) | 0 (0.0%) |
| College or Associate's Degree | 0 (0.0%) | 12 (100.0%) |
| Bachelor's Degree | 54 (100.0%) | 0 (0.0%) |
| Graduate Degree | 0 (0.0%) | 0 (0.0%) |
| Total | 54 (81.8%) | 12 (18.2%) |
Employment Characteristics in Newton
Employment by Class of Employer in Newton
Among the 1,390 employed individuals in Newton, private company employees (1,110 | 79.9%), not-for-profit organizations (104 | 7.5%), and self-employed (not incorporated) (91 | 6.6%) make up the most common classes of employment.
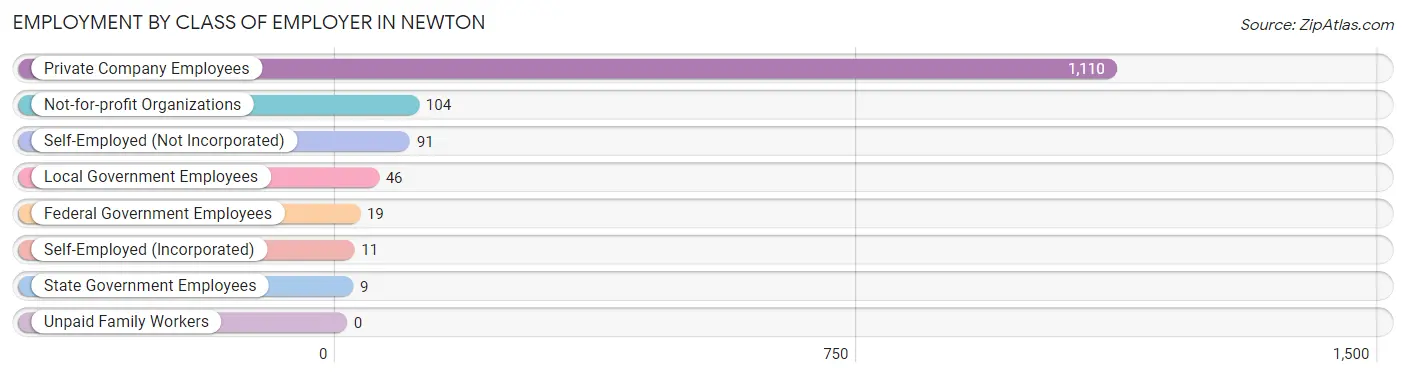
| Employer Class | # Employees | % Employees |
| Private Company Employees | 1,110 | 79.9% |
| Self-Employed (Incorporated) | 11 | 0.8% |
| Self-Employed (Not Incorporated) | 91 | 6.6% |
| Not-for-profit Organizations | 104 | 7.5% |
| Local Government Employees | 46 | 3.3% |
| State Government Employees | 9 | 0.6% |
| Federal Government Employees | 19 | 1.4% |
| Unpaid Family Workers | 0 | 0.0% |
| Total | 1,390 | 100.0% |
Employment Status by Age in Newton
According to the labor force statistics for Newton, out of the total population over 16 years of age (2,515), 58.5% or 1,471 individuals are in the labor force, with 5.1% or 75 of them unemployed. The age group with the highest labor force participation rate is 45 to 54 years, with 93.2% or 343 individuals in the labor force. Within the labor force, the 20 to 24 years age range has the highest percentage of unemployed individuals, with 19.9% or 33 of them being unemployed.
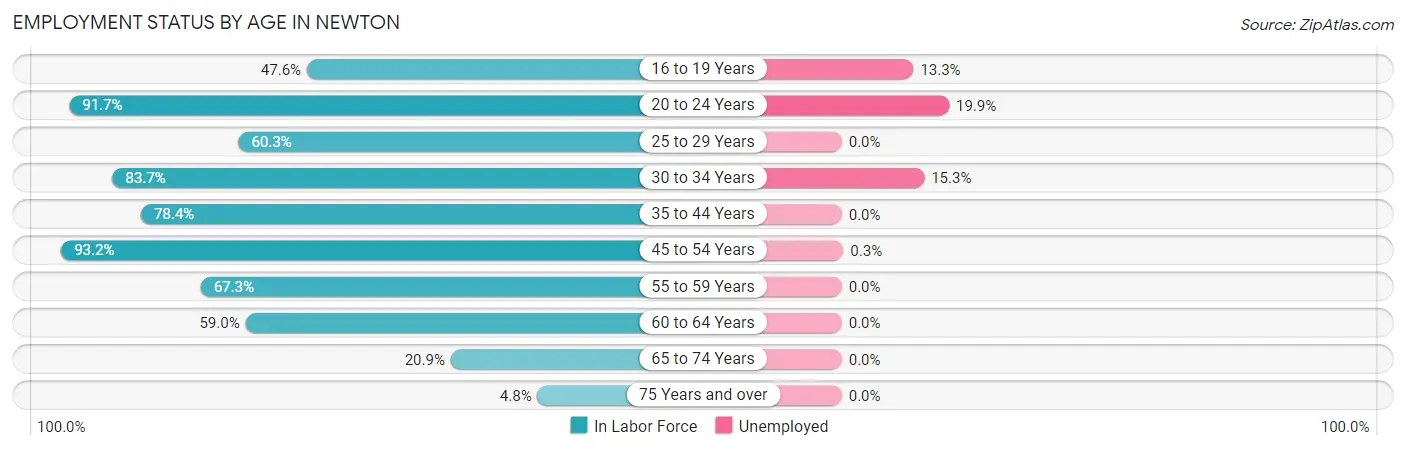
| Age Bracket | In Labor Force | Unemployed |
| 16 to 19 Years | 60 (47.6%) | 8 (13.3%) |
| 20 to 24 Years | 166 (91.7%) | 33 (19.9%) |
| 25 to 29 Years | 114 (60.3%) | 0 (0.0%) |
| 30 to 34 Years | 215 (83.7%) | 33 (15.3%) |
| 35 to 44 Years | 211 (78.4%) | 0 (0.0%) |
| 45 to 54 Years | 343 (93.2%) | 1 (0.3%) |
| 55 to 59 Years | 107 (67.3%) | 0 (0.0%) |
| 60 to 64 Years | 161 (59.0%) | 0 (0.0%) |
| 65 to 74 Years | 79 (20.9%) | 0 (0.0%) |
| 75 Years and over | 15 (4.8%) | 0 (0.0%) |
| Total | 1,471 (58.5%) | 75 (5.1%) |
Employment Status by Educational Attainment in Newton
According to labor force statistics for Newton, 76.0% of individuals (1,151) out of the total population between 25 and 64 years of age (1,515) are in the labor force, with 3.0% or 35 of them being unemployed. The group with the highest labor force participation rate are those with the educational attainment of less than high school, with 93.5% or 187 individuals in the labor force. Within the labor force, individuals with college / associate degree education have the highest percentage of unemployment, with 5.5% or 23 of them being unemployed.
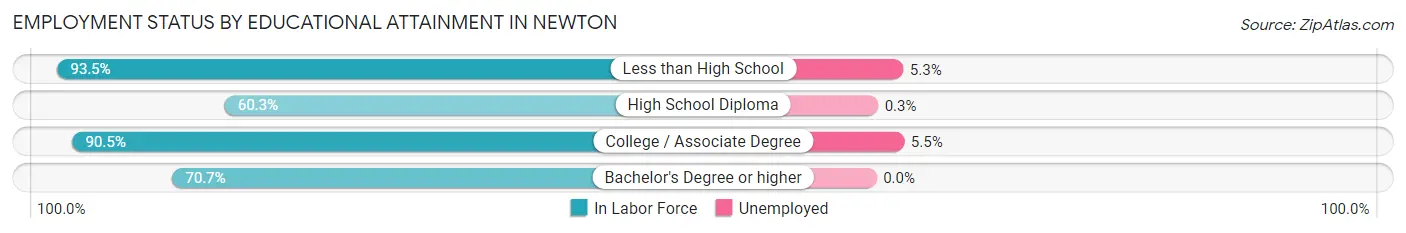
| Educational Attainment | In Labor Force | Unemployed |
| Less than High School | 187 (93.5%) | 11 (5.3%) |
| High School Diploma | 329 (60.3%) | 2 (0.3%) |
| College / Associate Degree | 418 (90.5%) | 25 (5.5%) |
| Bachelor's Degree or higher | 217 (70.7%) | 0 (0.0%) |
| Total | 1,151 (76.0%) | 45 (3.0%) |
Employment Occupations by Sex in Newton
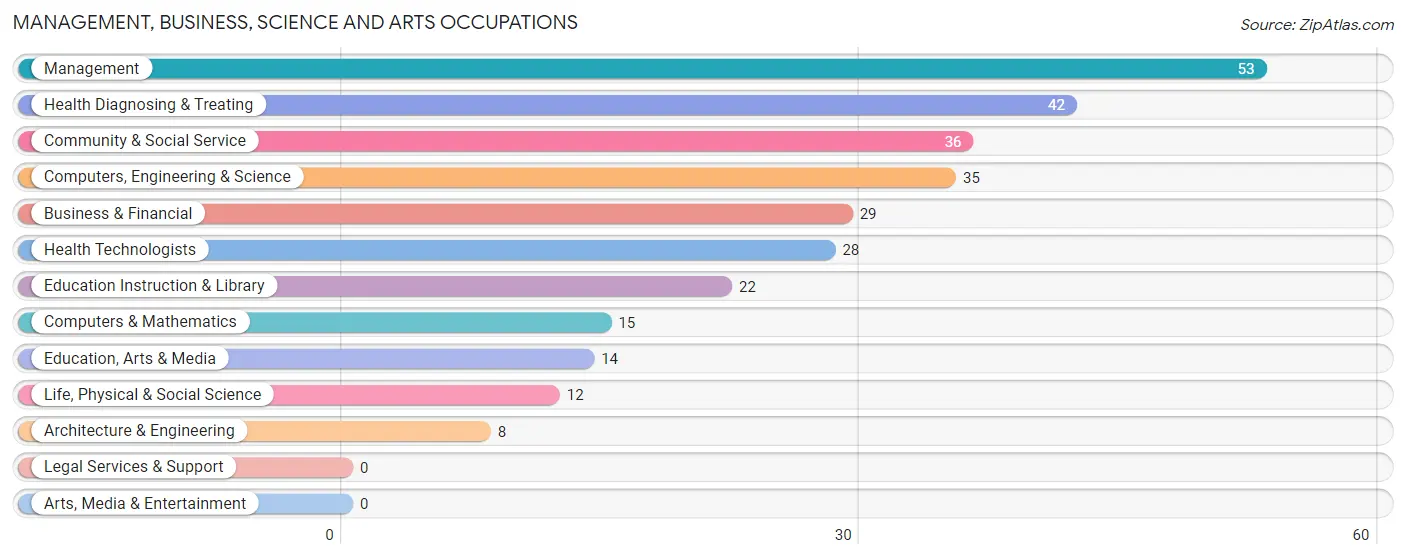
Management, Business, Science and Arts Occupations
The most common Management, Business, Science and Arts occupations in Newton are Management (53 | 3.8%), Health Diagnosing & Treating (42 | 3.0%), Community & Social Service (36 | 2.6%), Computers, Engineering & Science (35 | 2.5%), and Business & Financial (29 | 2.1%).
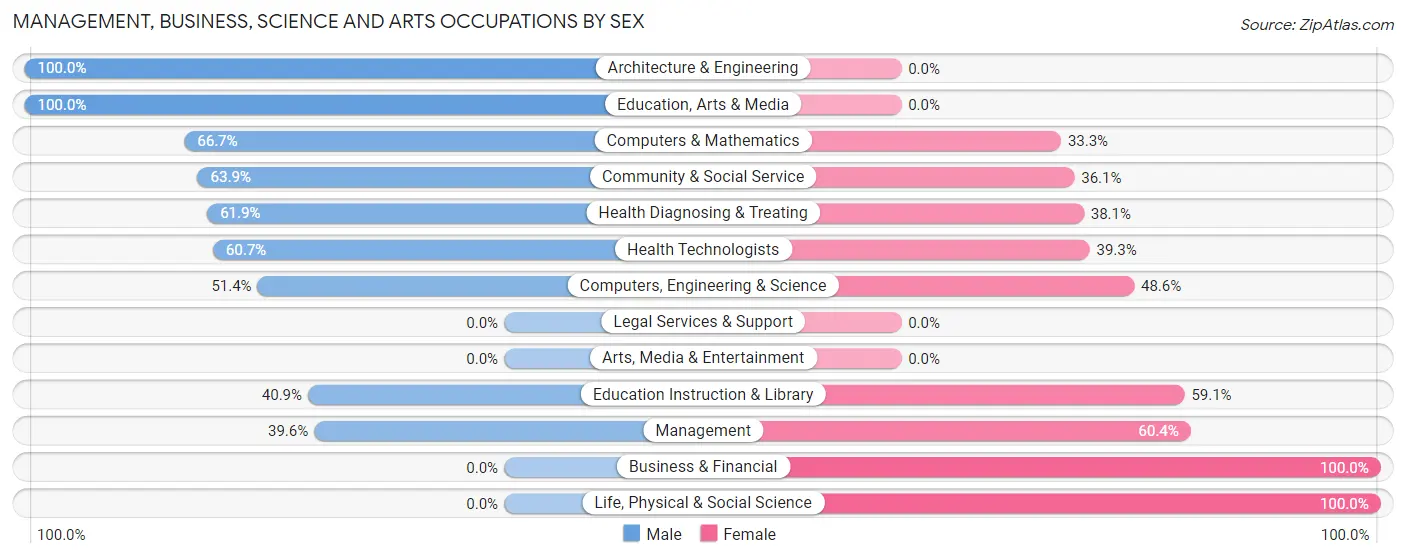
Management, Business, Science and Arts Occupations by Sex
Within the Management, Business, Science and Arts occupations in Newton, the most male-oriented occupations are Architecture & Engineering (100.0%), Education, Arts & Media (100.0%), and Computers & Mathematics (66.7%), while the most female-oriented occupations are Business & Financial (100.0%), Life, Physical & Social Science (100.0%), and Management (60.4%).
| Occupation | Male | Female |
| Management | 21 (39.6%) | 32 (60.4%) |
| Business & Financial | 0 (0.0%) | 29 (100.0%) |
| Computers, Engineering & Science | 18 (51.4%) | 17 (48.6%) |
| Computers & Mathematics | 10 (66.7%) | 5 (33.3%) |
| Architecture & Engineering | 8 (100.0%) | 0 (0.0%) |
| Life, Physical & Social Science | 0 (0.0%) | 12 (100.0%) |
| Community & Social Service | 23 (63.9%) | 13 (36.1%) |
| Education, Arts & Media | 14 (100.0%) | 0 (0.0%) |
| Legal Services & Support | 0 (0.0%) | 0 (0.0%) |
| Education Instruction & Library | 9 (40.9%) | 13 (59.1%) |
| Arts, Media & Entertainment | 0 (0.0%) | 0 (0.0%) |
| Health Diagnosing & Treating | 26 (61.9%) | 16 (38.1%) |
| Health Technologists | 17 (60.7%) | 11 (39.3%) |
| Total (Category) | 88 (45.1%) | 107 (54.9%) |
| Total (Overall) | 747 (53.5%) | 649 (46.5%) |
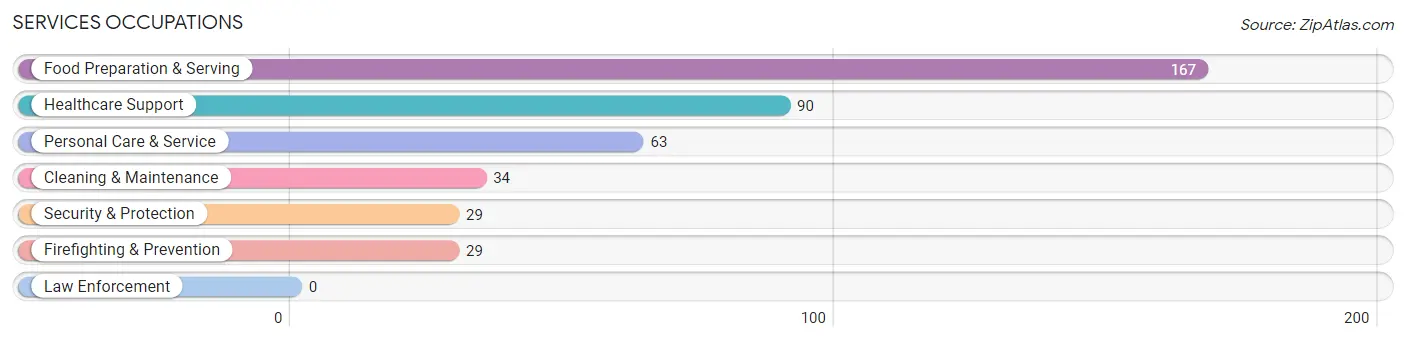
Services Occupations
The most common Services occupations in Newton are Food Preparation & Serving (167 | 12.0%), Healthcare Support (90 | 6.5%), Personal Care & Service (63 | 4.5%), Cleaning & Maintenance (34 | 2.4%), and Security & Protection (29 | 2.1%).
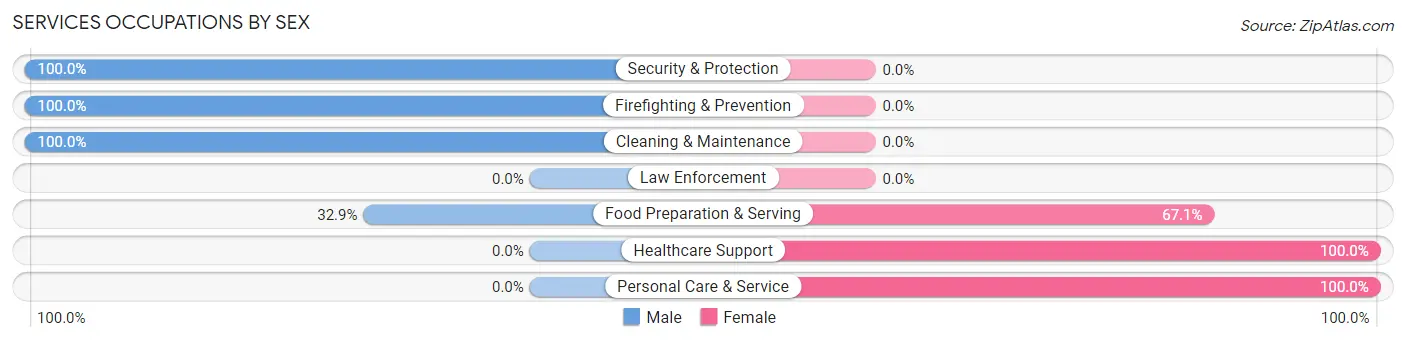
Services Occupations by Sex
Within the Services occupations in Newton, the most male-oriented occupations are Security & Protection (100.0%), Firefighting & Prevention (100.0%), and Cleaning & Maintenance (100.0%), while the most female-oriented occupations are Healthcare Support (100.0%), Personal Care & Service (100.0%), and Food Preparation & Serving (67.1%).
| Occupation | Male | Female |
| Healthcare Support | 0 (0.0%) | 90 (100.0%) |
| Security & Protection | 29 (100.0%) | 0 (0.0%) |
| Firefighting & Prevention | 29 (100.0%) | 0 (0.0%) |
| Law Enforcement | 0 (0.0%) | 0 (0.0%) |
| Food Preparation & Serving | 55 (32.9%) | 112 (67.1%) |
| Cleaning & Maintenance | 34 (100.0%) | 0 (0.0%) |
| Personal Care & Service | 0 (0.0%) | 63 (100.0%) |
| Total (Category) | 118 (30.8%) | 265 (69.2%) |
| Total (Overall) | 747 (53.5%) | 649 (46.5%) |
Sales and Office Occupations
The most common Sales and Office occupations in Newton are Office & Administration (194 | 13.9%), and Sales & Related (89 | 6.4%).
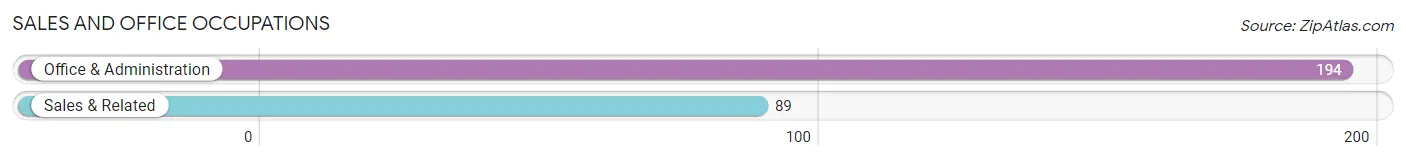
Sales and Office Occupations by Sex
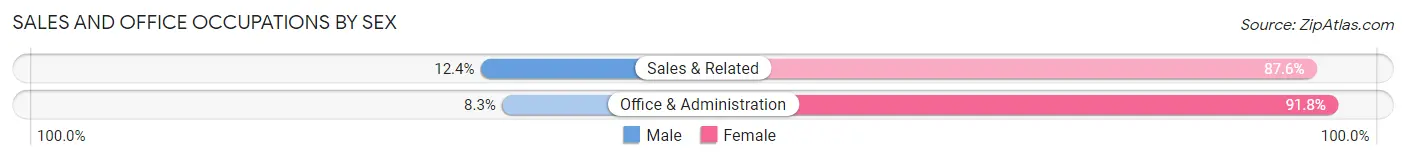
| Occupation | Male | Female |
| Sales & Related | 11 (12.4%) | 78 (87.6%) |
| Office & Administration | 16 (8.3%) | 178 (91.7%) |
| Total (Category) | 27 (9.5%) | 256 (90.5%) |
| Total (Overall) | 747 (53.5%) | 649 (46.5%) |
Natural Resources, Construction and Maintenance Occupations
The most common Natural Resources, Construction and Maintenance occupations in Newton are Installation, Maintenance & Repair (152 | 10.9%), Construction & Extraction (39 | 2.8%), and Farming, Fishing & Forestry (8 | 0.6%).
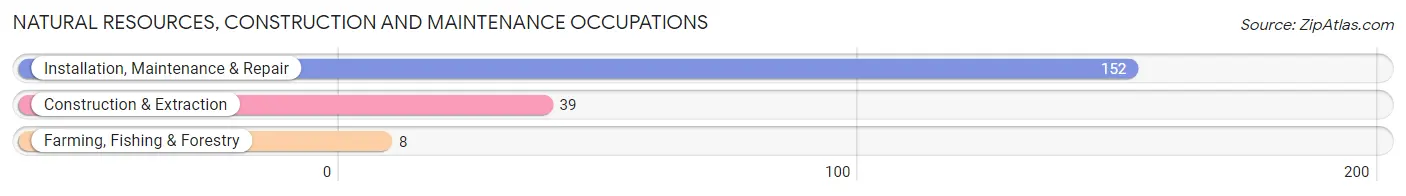
Natural Resources, Construction and Maintenance Occupations by Sex
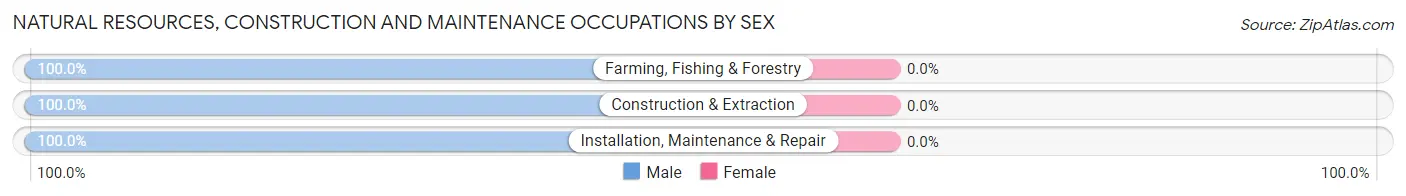
| Occupation | Male | Female |
| Farming, Fishing & Forestry | 8 (100.0%) | 0 (0.0%) |
| Construction & Extraction | 39 (100.0%) | 0 (0.0%) |
| Installation, Maintenance & Repair | 152 (100.0%) | 0 (0.0%) |
| Total (Category) | 199 (100.0%) | 0 (0.0%) |
| Total (Overall) | 747 (53.5%) | 649 (46.5%) |
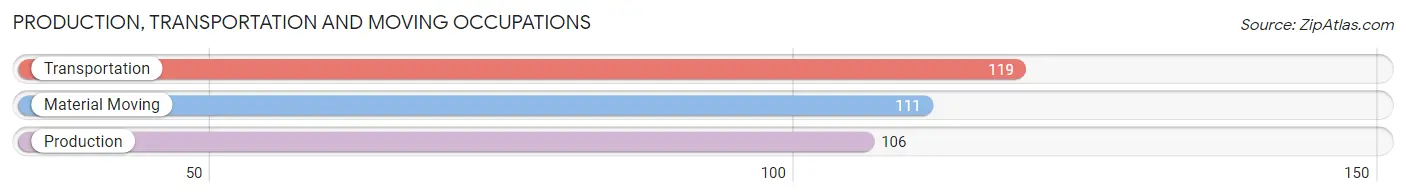
Production, Transportation and Moving Occupations
The most common Production, Transportation and Moving occupations in Newton are Transportation (119 | 8.5%), Material Moving (111 | 8.0%), and Production (106 | 7.6%).
Production, Transportation and Moving Occupations by Sex
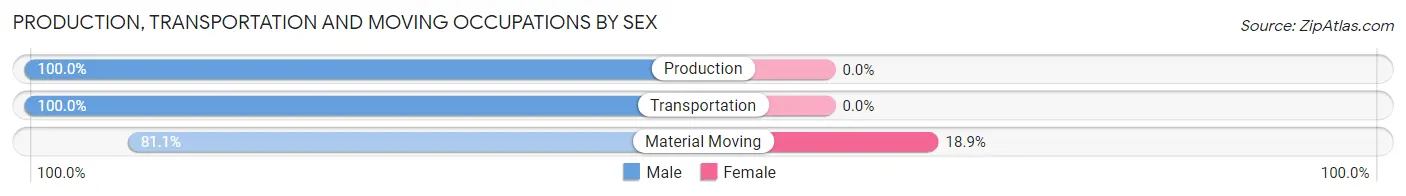
| Occupation | Male | Female |
| Production | 106 (100.0%) | 0 (0.0%) |
| Transportation | 119 (100.0%) | 0 (0.0%) |
| Material Moving | 90 (81.1%) | 21 (18.9%) |
| Total (Category) | 315 (93.8%) | 21 (6.2%) |
| Total (Overall) | 747 (53.5%) | 649 (46.5%) |
Employment Industries by Sex in Newton
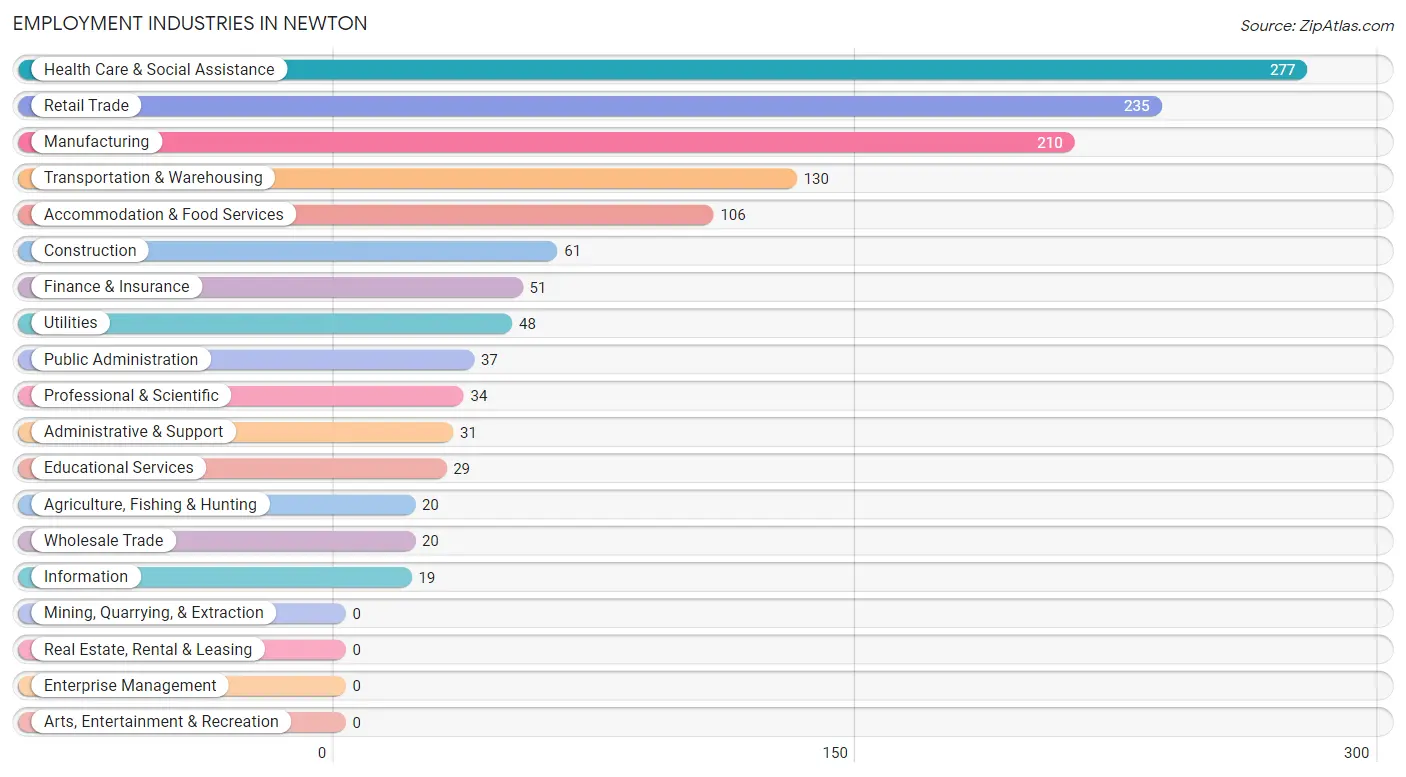
Employment Industries in Newton
The major employment industries in Newton include Health Care & Social Assistance (277 | 19.8%), Retail Trade (235 | 16.8%), Manufacturing (210 | 15.0%), Transportation & Warehousing (130 | 9.3%), and Accommodation & Food Services (106 | 7.6%).
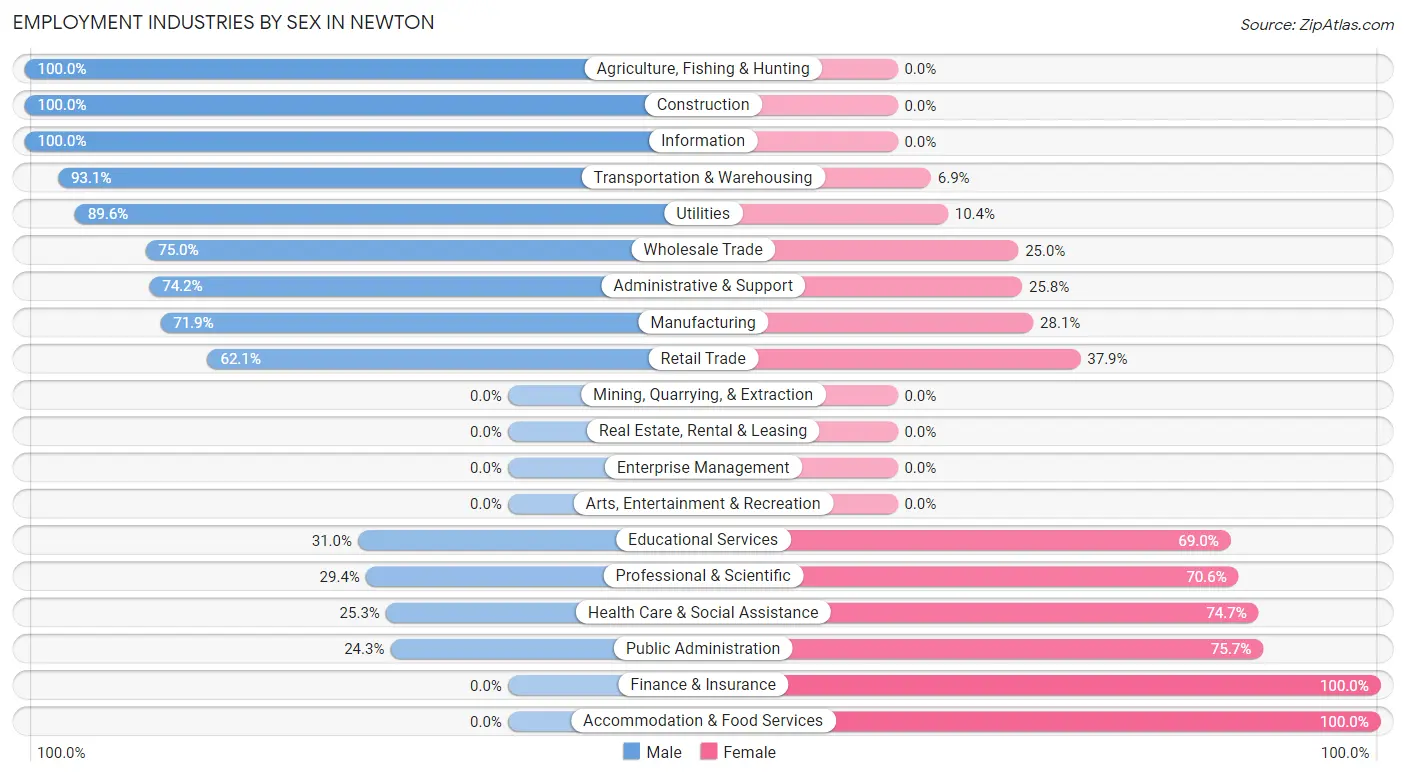
Employment Industries by Sex in Newton
The Newton industries that see more men than women are Agriculture, Fishing & Hunting (100.0%), Construction (100.0%), and Information (100.0%), whereas the industries that tend to have a higher number of women are Finance & Insurance (100.0%), Accommodation & Food Services (100.0%), and Public Administration (75.7%).
| Industry | Male | Female |
| Agriculture, Fishing & Hunting | 20 (100.0%) | 0 (0.0%) |
| Mining, Quarrying, & Extraction | 0 (0.0%) | 0 (0.0%) |
| Construction | 61 (100.0%) | 0 (0.0%) |
| Manufacturing | 151 (71.9%) | 59 (28.1%) |
| Wholesale Trade | 15 (75.0%) | 5 (25.0%) |
| Retail Trade | 146 (62.1%) | 89 (37.9%) |
| Transportation & Warehousing | 121 (93.1%) | 9 (6.9%) |
| Utilities | 43 (89.6%) | 5 (10.4%) |
| Information | 19 (100.0%) | 0 (0.0%) |
| Finance & Insurance | 0 (0.0%) | 51 (100.0%) |
| Real Estate, Rental & Leasing | 0 (0.0%) | 0 (0.0%) |
| Professional & Scientific | 10 (29.4%) | 24 (70.6%) |
| Enterprise Management | 0 (0.0%) | 0 (0.0%) |
| Administrative & Support | 23 (74.2%) | 8 (25.8%) |
| Educational Services | 9 (31.0%) | 20 (69.0%) |
| Health Care & Social Assistance | 70 (25.3%) | 207 (74.7%) |
| Arts, Entertainment & Recreation | 0 (0.0%) | 0 (0.0%) |
| Accommodation & Food Services | 0 (0.0%) | 106 (100.0%) |
| Public Administration | 9 (24.3%) | 28 (75.7%) |
| Total | 747 (53.5%) | 649 (46.5%) |
Education in Newton
School Enrollment in Newton
The most common levels of schooling among the 388 students in Newton are elementary school (109 | 28.1%), middle school (104 | 26.8%), and high school (81 | 20.9%).
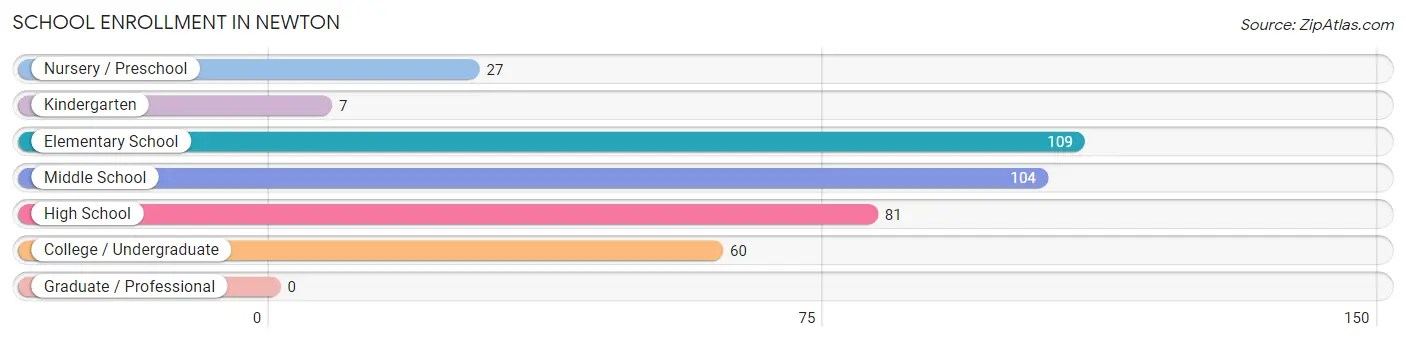
| School Level | # Students | % Students |
| Nursery / Preschool | 27 | 7.0% |
| Kindergarten | 7 | 1.8% |
| Elementary School | 109 | 28.1% |
| Middle School | 104 | 26.8% |
| High School | 81 | 20.9% |
| College / Undergraduate | 60 | 15.5% |
| Graduate / Professional | 0 | 0.0% |
| Total | 388 | 100.0% |
School Enrollment by Age by Funding Source in Newton
Out of a total of 388 students who are enrolled in schools in Newton, 46 (11.9%) attend a private institution, while the remaining 342 (88.1%) are enrolled in public schools. The age group of 35 years and over has the highest likelihood of being enrolled in private schools, with 5 (55.6% in the age bracket) enrolled. Conversely, the age group of 3 to 4 year olds has the lowest likelihood of being enrolled in a private school, with 27 (100.0% in the age bracket) attending a public institution.
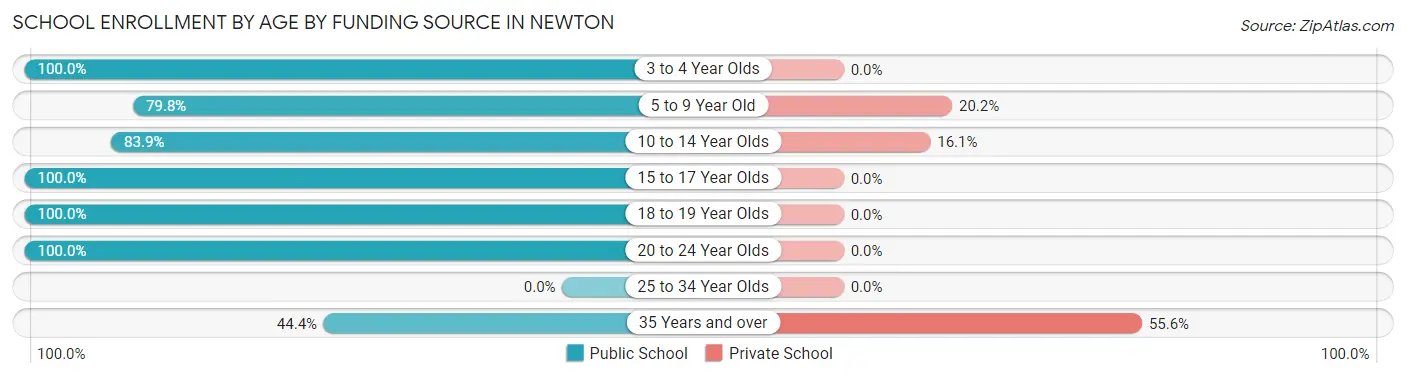
| Age Bracket | Public School | Private School |
| 3 to 4 Year Olds | 27 (100.0%) | 0 (0.0%) |
| 5 to 9 Year Old | 83 (79.8%) | 21 (20.2%) |
| 10 to 14 Year Olds | 104 (83.9%) | 20 (16.1%) |
| 15 to 17 Year Olds | 63 (100.0%) | 0 (0.0%) |
| 18 to 19 Year Olds | 32 (100.0%) | 0 (0.0%) |
| 20 to 24 Year Olds | 29 (100.0%) | 0 (0.0%) |
| 25 to 34 Year Olds | 0 (0.0%) | 0 (0.0%) |
| 35 Years and over | 4 (44.4%) | 5 (55.6%) |
| Total | 342 (88.1%) | 46 (11.9%) |
Educational Attainment by Field of Study in Newton
Education (134 | 30.9%), business (89 | 20.5%), bio, nature & agricultural (62 | 14.3%), liberal arts & history (42 | 9.7%), and arts & humanities (26 | 6.0%) are the most common fields of study among 434 individuals in Newton who have obtained a bachelor's degree or higher.
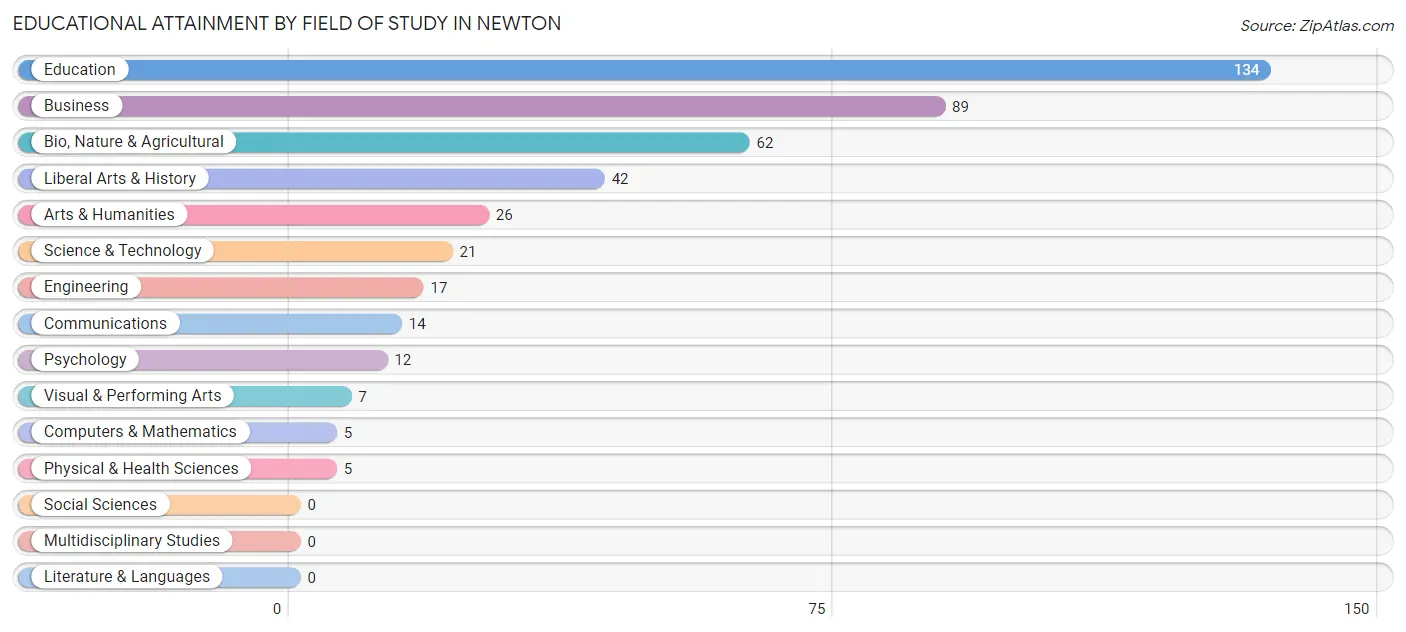
| Field of Study | # Graduates | % Graduates |
| Computers & Mathematics | 5 | 1.1% |
| Bio, Nature & Agricultural | 62 | 14.3% |
| Physical & Health Sciences | 5 | 1.1% |
| Psychology | 12 | 2.8% |
| Social Sciences | 0 | 0.0% |
| Engineering | 17 | 3.9% |
| Multidisciplinary Studies | 0 | 0.0% |
| Science & Technology | 21 | 4.8% |
| Business | 89 | 20.5% |
| Education | 134 | 30.9% |
| Literature & Languages | 0 | 0.0% |
| Liberal Arts & History | 42 | 9.7% |
| Visual & Performing Arts | 7 | 1.6% |
| Communications | 14 | 3.2% |
| Arts & Humanities | 26 | 6.0% |
| Total | 434 | 100.0% |
Transportation & Commute in Newton
Vehicle Availability by Sex in Newton
The most prevalent vehicle ownership categories in Newton are males with 2 vehicles (315, accounting for 42.6%) and females with 2 vehicles (199, making up 49.3%).
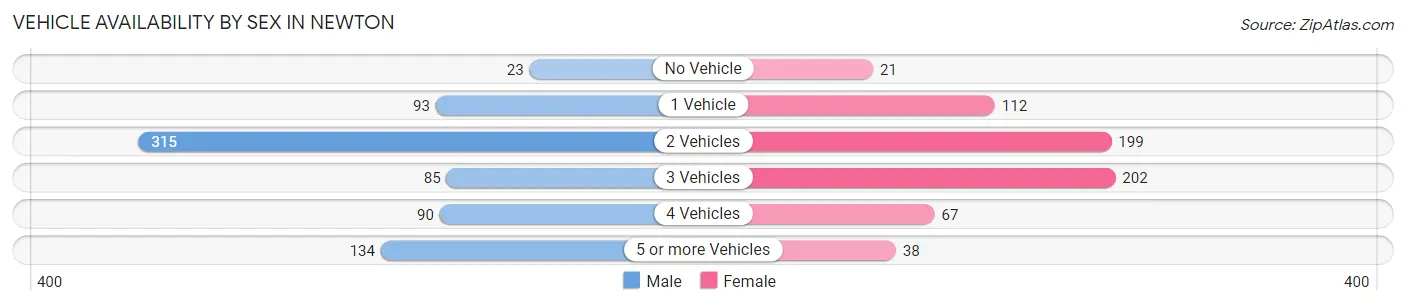
| Vehicles Available | Male | Female |
| No Vehicle | 23 (3.1%) | 21 (3.3%) |
| 1 Vehicle | 93 (12.6%) | 112 (17.5%) |
| 2 Vehicles | 315 (42.6%) | 199 (31.1%) |
| 3 Vehicles | 85 (11.5%) | 202 (31.6%) |
| 4 Vehicles | 90 (12.2%) | 67 (10.5%) |
| 5 or more Vehicles | 134 (18.1%) | 38 (5.9%) |
| Total | 740 (100.0%) | 639 (100.0%) |
Commute Time in Newton
The most frequently occuring commute durations in Newton are 5 to 9 minutes (342 commuters, 27.0%), 30 to 34 minutes (228 commuters, 18.0%), and less than 5 minutes (170 commuters, 13.4%).
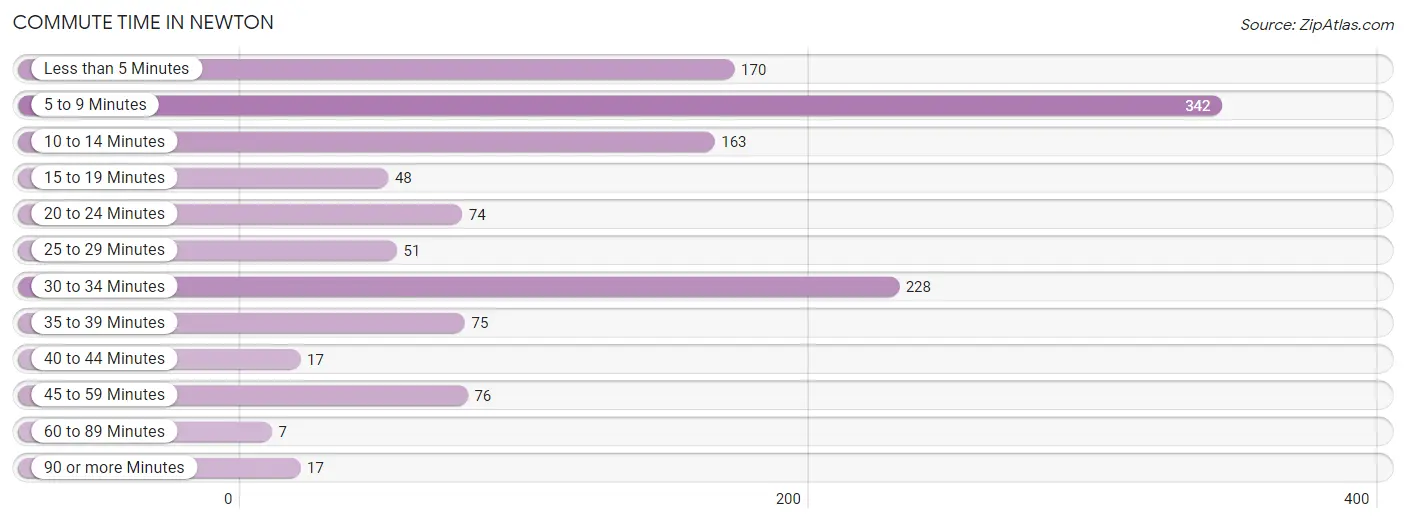
| Commute Time | # Commuters | % Commuters |
| Less than 5 Minutes | 170 | 13.4% |
| 5 to 9 Minutes | 342 | 27.0% |
| 10 to 14 Minutes | 163 | 12.9% |
| 15 to 19 Minutes | 48 | 3.8% |
| 20 to 24 Minutes | 74 | 5.8% |
| 25 to 29 Minutes | 51 | 4.0% |
| 30 to 34 Minutes | 228 | 18.0% |
| 35 to 39 Minutes | 75 | 5.9% |
| 40 to 44 Minutes | 17 | 1.3% |
| 45 to 59 Minutes | 76 | 6.0% |
| 60 to 89 Minutes | 7 | 0.5% |
| 90 or more Minutes | 17 | 1.3% |
Commute Time by Sex in Newton
The most common commute times in Newton are 30 to 34 minutes (168 commuters, 23.4%) for males and 5 to 9 minutes (179 commuters, 32.6%) for females.
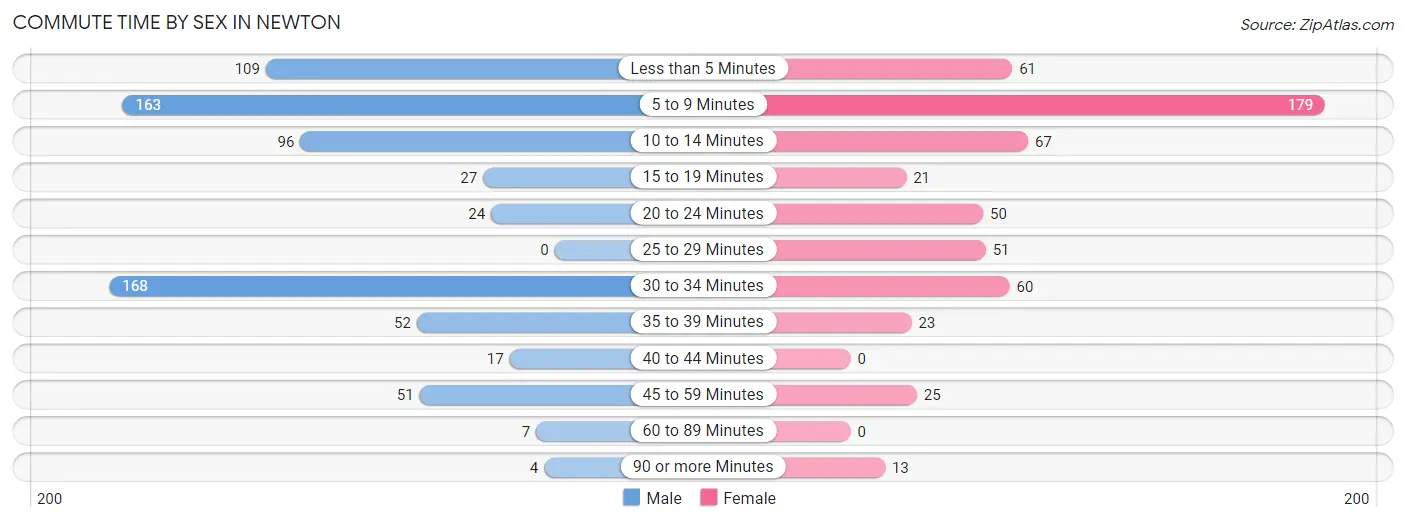
| Commute Time | Male | Female |
| Less than 5 Minutes | 109 (15.2%) | 61 (11.1%) |
| 5 to 9 Minutes | 163 (22.7%) | 179 (32.6%) |
| 10 to 14 Minutes | 96 (13.4%) | 67 (12.2%) |
| 15 to 19 Minutes | 27 (3.8%) | 21 (3.8%) |
| 20 to 24 Minutes | 24 (3.3%) | 50 (9.1%) |
| 25 to 29 Minutes | 0 (0.0%) | 51 (9.3%) |
| 30 to 34 Minutes | 168 (23.4%) | 60 (10.9%) |
| 35 to 39 Minutes | 52 (7.2%) | 23 (4.2%) |
| 40 to 44 Minutes | 17 (2.4%) | 0 (0.0%) |
| 45 to 59 Minutes | 51 (7.1%) | 25 (4.5%) |
| 60 to 89 Minutes | 7 (1.0%) | 0 (0.0%) |
| 90 or more Minutes | 4 (0.6%) | 13 (2.4%) |
Time of Departure to Work by Sex in Newton
The most frequent times of departure to work in Newton are 6:30 AM to 6:59 AM (257, 35.8%) for males and 7:00 AM to 7:29 AM (135, 24.5%) for females.
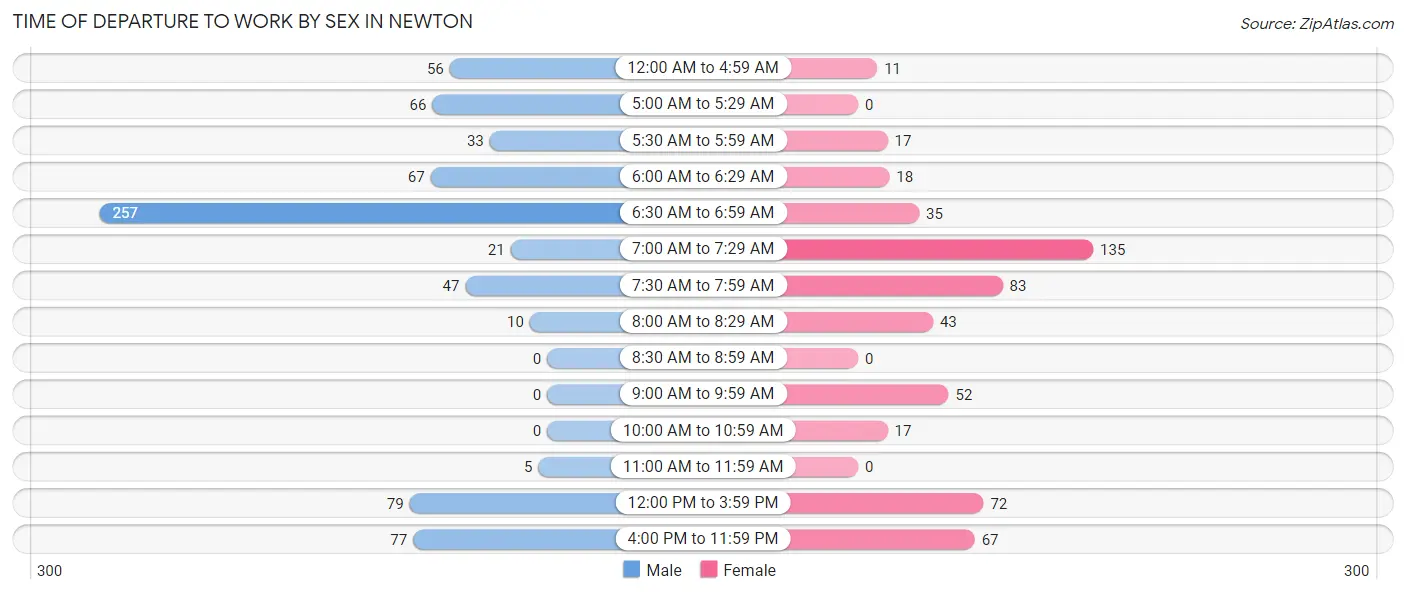
| Time of Departure | Male | Female |
| 12:00 AM to 4:59 AM | 56 (7.8%) | 11 (2.0%) |
| 5:00 AM to 5:29 AM | 66 (9.2%) | 0 (0.0%) |
| 5:30 AM to 5:59 AM | 33 (4.6%) | 17 (3.1%) |
| 6:00 AM to 6:29 AM | 67 (9.3%) | 18 (3.3%) |
| 6:30 AM to 6:59 AM | 257 (35.8%) | 35 (6.4%) |
| 7:00 AM to 7:29 AM | 21 (2.9%) | 135 (24.5%) |
| 7:30 AM to 7:59 AM | 47 (6.6%) | 83 (15.1%) |
| 8:00 AM to 8:29 AM | 10 (1.4%) | 43 (7.8%) |
| 8:30 AM to 8:59 AM | 0 (0.0%) | 0 (0.0%) |
| 9:00 AM to 9:59 AM | 0 (0.0%) | 52 (9.5%) |
| 10:00 AM to 10:59 AM | 0 (0.0%) | 17 (3.1%) |
| 11:00 AM to 11:59 AM | 5 (0.7%) | 0 (0.0%) |
| 12:00 PM to 3:59 PM | 79 (11.0%) | 72 (13.1%) |
| 4:00 PM to 11:59 PM | 77 (10.7%) | 67 (12.2%) |
| Total | 718 (100.0%) | 550 (100.0%) |
Housing Occupancy in Newton
Occupancy by Ownership in Newton
Of the total 1,374 dwellings in Newton, owner-occupied units account for 985 (71.7%), while renter-occupied units make up 389 (28.3%).
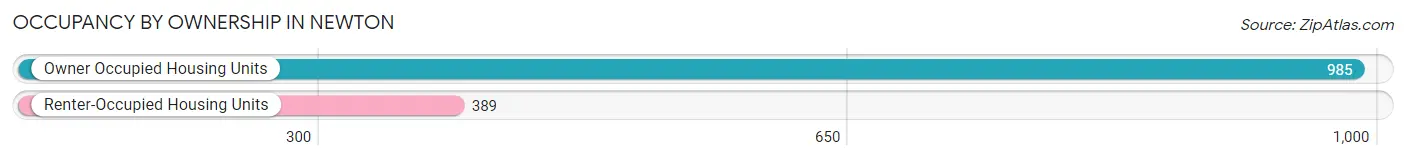
| Occupancy | # Housing Units | % Housing Units |
| Owner Occupied Housing Units | 985 | 71.7% |
| Renter-Occupied Housing Units | 389 | 28.3% |
| Total Occupied Housing Units | 1,374 | 100.0% |
Occupancy by Household Size in Newton
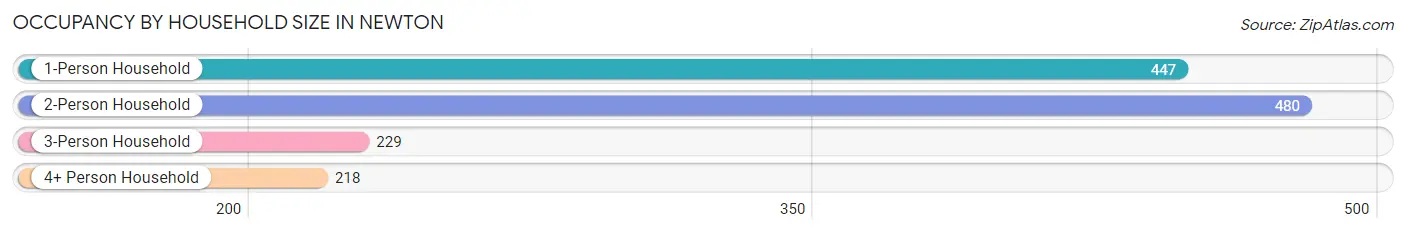
| Household Size | # Housing Units | % Housing Units |
| 1-Person Household | 447 | 32.5% |
| 2-Person Household | 480 | 34.9% |
| 3-Person Household | 229 | 16.7% |
| 4+ Person Household | 218 | 15.9% |
| Total Housing Units | 1,374 | 100.0% |
Occupancy by Ownership by Household Size in Newton
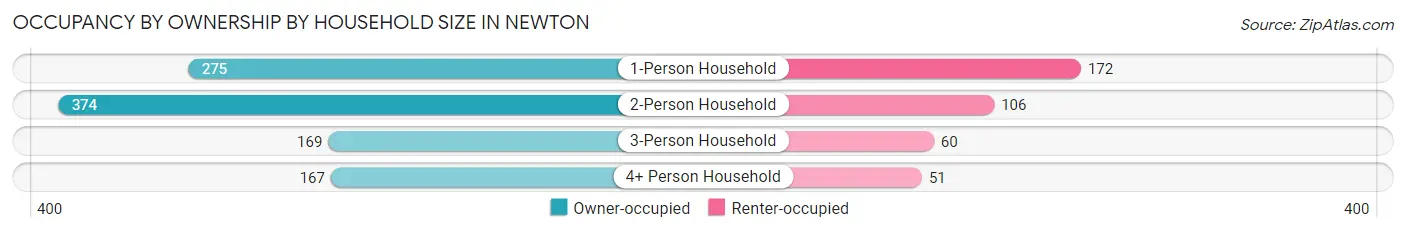
| Household Size | Owner-occupied | Renter-occupied |
| 1-Person Household | 275 (61.5%) | 172 (38.5%) |
| 2-Person Household | 374 (77.9%) | 106 (22.1%) |
| 3-Person Household | 169 (73.8%) | 60 (26.2%) |
| 4+ Person Household | 167 (76.6%) | 51 (23.4%) |
| Total Housing Units | 985 (71.7%) | 389 (28.3%) |
Occupancy by Educational Attainment in Newton
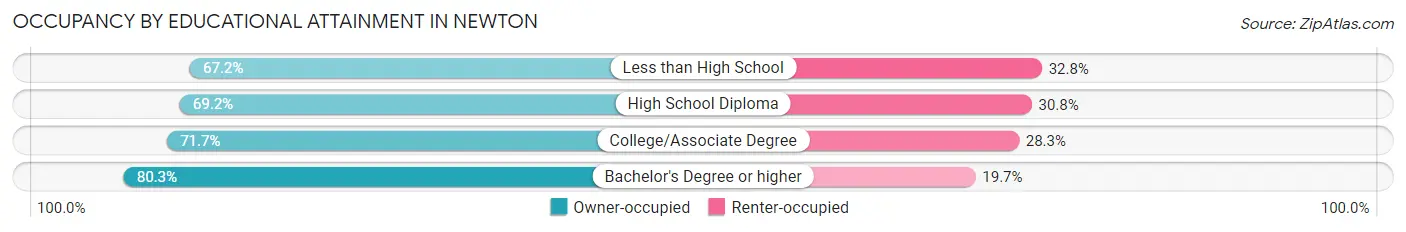
| Household Size | Owner-occupied | Renter-occupied |
| Less than High School | 131 (67.2%) | 64 (32.8%) |
| High School Diploma | 346 (69.2%) | 154 (30.8%) |
| College/Associate Degree | 312 (71.7%) | 123 (28.3%) |
| Bachelor's Degree or higher | 196 (80.3%) | 48 (19.7%) |
Occupancy by Age of Householder in Newton
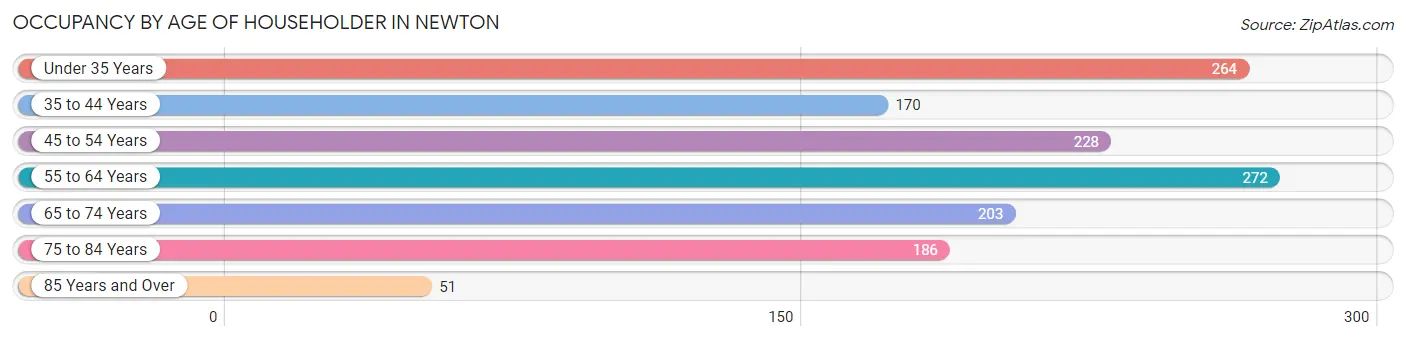
| Age Bracket | # Households | % Households |
| Under 35 Years | 264 | 19.2% |
| 35 to 44 Years | 170 | 12.4% |
| 45 to 54 Years | 228 | 16.6% |
| 55 to 64 Years | 272 | 19.8% |
| 65 to 74 Years | 203 | 14.8% |
| 75 to 84 Years | 186 | 13.5% |
| 85 Years and Over | 51 | 3.7% |
| Total | 1,374 | 100.0% |
Housing Finances in Newton
Median Income by Occupancy in Newton
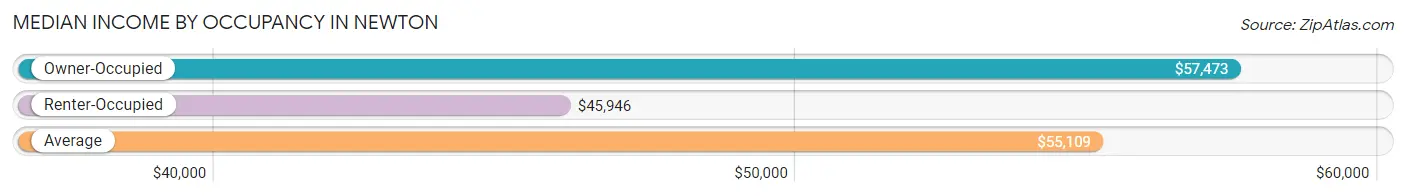
| Occupancy Type | # Households | Median Income |
| Owner-Occupied | 985 (71.7%) | $57,473 |
| Renter-Occupied | 389 (28.3%) | $45,946 |
| Average | 1,374 (100.0%) | $55,109 |
Occupancy by Householder Income Bracket in Newton
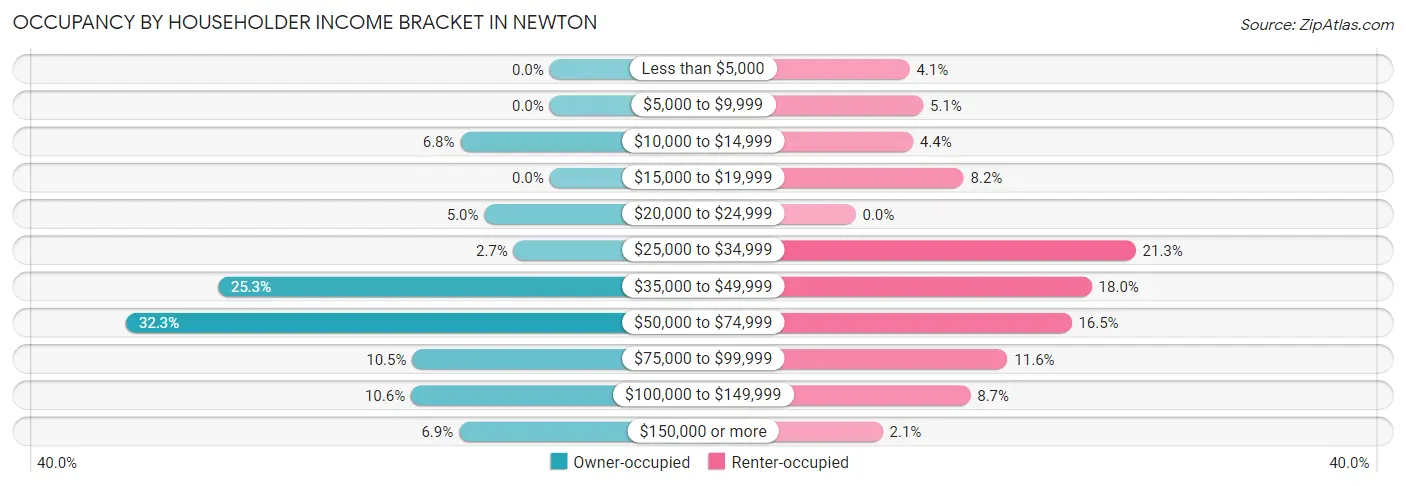
| Income Bracket | Owner-occupied | Renter-occupied |
| Less than $5,000 | 0 (0.0%) | 16 (4.1%) |
| $5,000 to $9,999 | 0 (0.0%) | 20 (5.1%) |
| $10,000 to $14,999 | 67 (6.8%) | 17 (4.4%) |
| $15,000 to $19,999 | 0 (0.0%) | 32 (8.2%) |
| $20,000 to $24,999 | 49 (5.0%) | 0 (0.0%) |
| $25,000 to $34,999 | 27 (2.7%) | 83 (21.3%) |
| $35,000 to $49,999 | 249 (25.3%) | 70 (18.0%) |
| $50,000 to $74,999 | 318 (32.3%) | 64 (16.5%) |
| $75,000 to $99,999 | 103 (10.5%) | 45 (11.6%) |
| $100,000 to $149,999 | 104 (10.6%) | 34 (8.7%) |
| $150,000 or more | 68 (6.9%) | 8 (2.1%) |
| Total | 985 (100.0%) | 389 (100.0%) |
Monthly Housing Cost Tiers in Newton
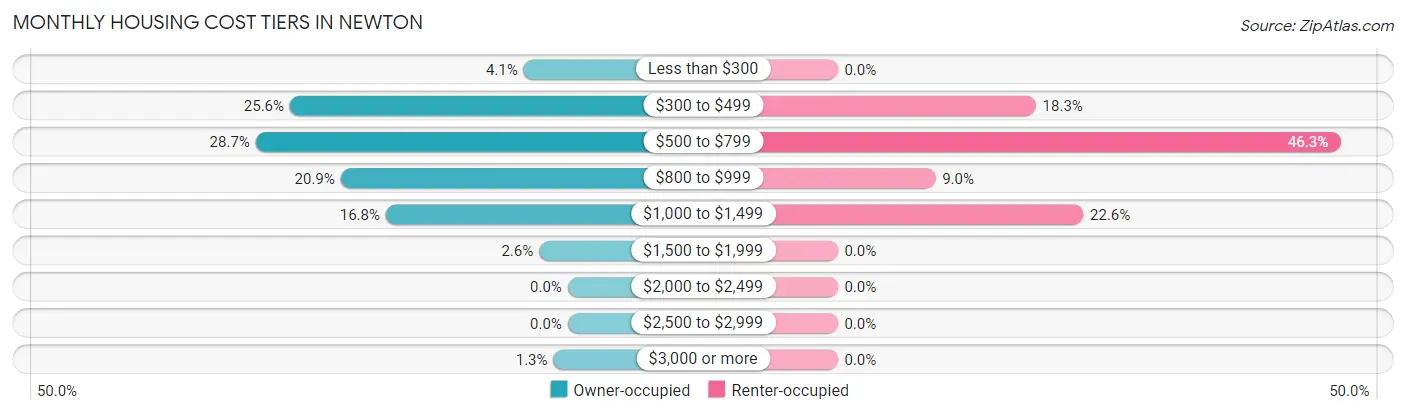
| Monthly Cost | Owner-occupied | Renter-occupied |
| Less than $300 | 40 (4.1%) | 0 (0.0%) |
| $300 to $499 | 252 (25.6%) | 71 (18.2%) |
| $500 to $799 | 283 (28.7%) | 180 (46.3%) |
| $800 to $999 | 206 (20.9%) | 35 (9.0%) |
| $1,000 to $1,499 | 165 (16.8%) | 88 (22.6%) |
| $1,500 to $1,999 | 26 (2.6%) | 0 (0.0%) |
| $2,000 to $2,499 | 0 (0.0%) | 0 (0.0%) |
| $2,500 to $2,999 | 0 (0.0%) | 0 (0.0%) |
| $3,000 or more | 13 (1.3%) | 0 (0.0%) |
| Total | 985 (100.0%) | 389 (100.0%) |
Physical Housing Characteristics in Newton
Housing Structures in Newton
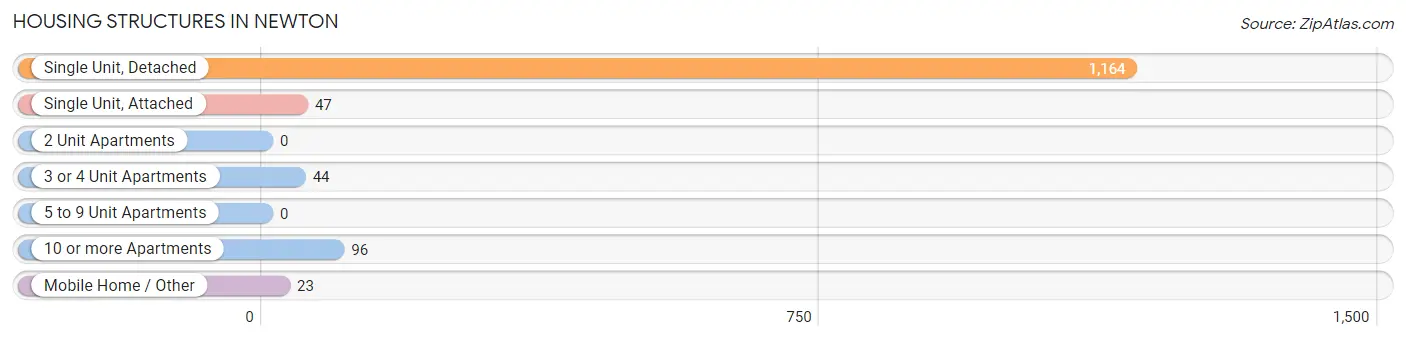
| Structure Type | # Housing Units | % Housing Units |
| Single Unit, Detached | 1,164 | 84.7% |
| Single Unit, Attached | 47 | 3.4% |
| 2 Unit Apartments | 0 | 0.0% |
| 3 or 4 Unit Apartments | 44 | 3.2% |
| 5 to 9 Unit Apartments | 0 | 0.0% |
| 10 or more Apartments | 96 | 7.0% |
| Mobile Home / Other | 23 | 1.7% |
| Total | 1,374 | 100.0% |
Housing Structures by Occupancy in Newton
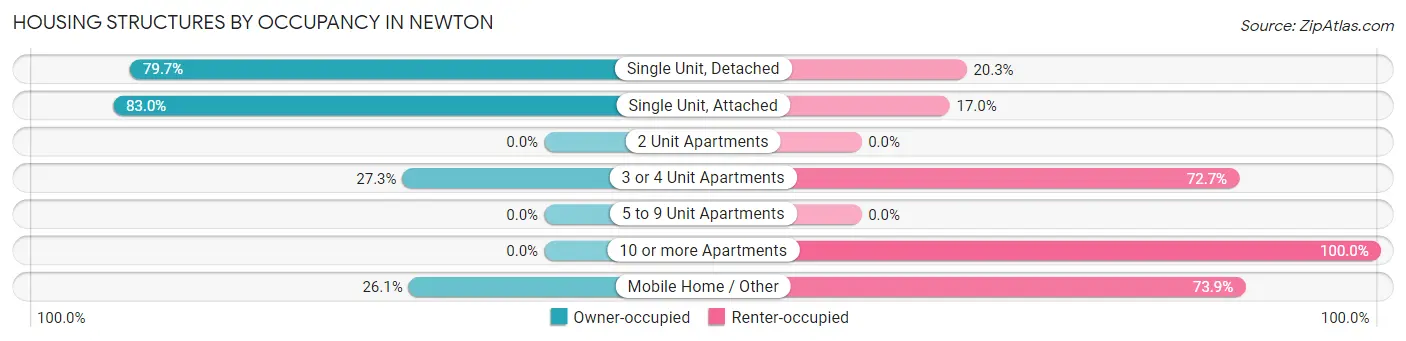
| Structure Type | Owner-occupied | Renter-occupied |
| Single Unit, Detached | 928 (79.7%) | 236 (20.3%) |
| Single Unit, Attached | 39 (83.0%) | 8 (17.0%) |
| 2 Unit Apartments | 0 (0.0%) | 0 (0.0%) |
| 3 or 4 Unit Apartments | 12 (27.3%) | 32 (72.7%) |
| 5 to 9 Unit Apartments | 0 (0.0%) | 0 (0.0%) |
| 10 or more Apartments | 0 (0.0%) | 96 (100.0%) |
| Mobile Home / Other | 6 (26.1%) | 17 (73.9%) |
| Total | 985 (71.7%) | 389 (28.3%) |
Housing Structures by Number of Rooms in Newton
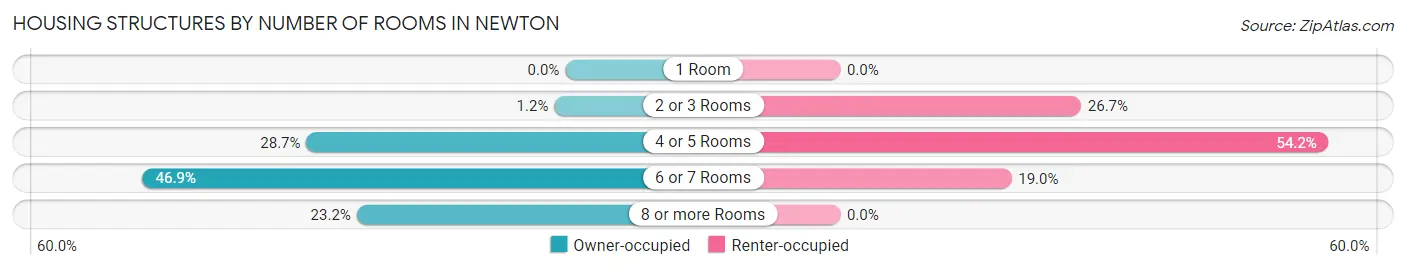
| Number of Rooms | Owner-occupied | Renter-occupied |
| 1 Room | 0 (0.0%) | 0 (0.0%) |
| 2 or 3 Rooms | 12 (1.2%) | 104 (26.7%) |
| 4 or 5 Rooms | 283 (28.7%) | 211 (54.2%) |
| 6 or 7 Rooms | 462 (46.9%) | 74 (19.0%) |
| 8 or more Rooms | 228 (23.2%) | 0 (0.0%) |
| Total | 985 (100.0%) | 389 (100.0%) |
Housing Structure by Heating Type in Newton
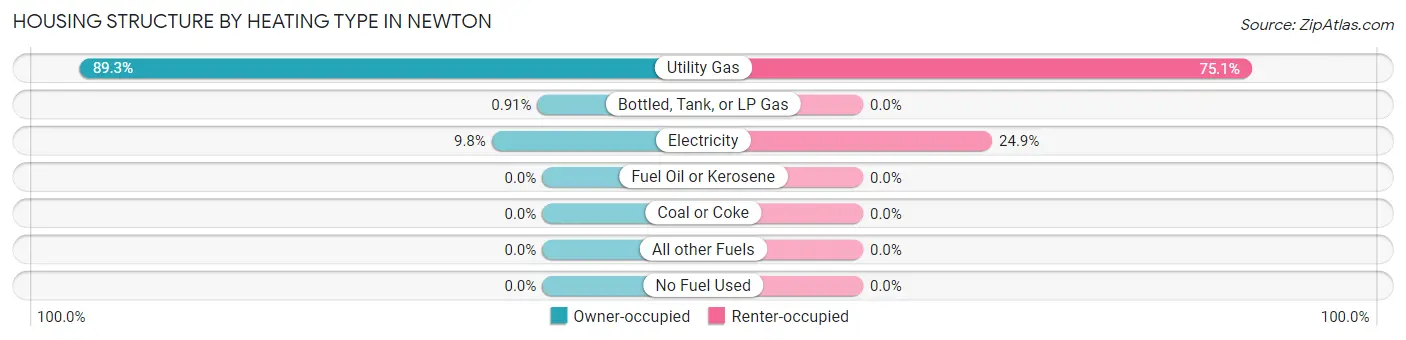
| Heating Type | Owner-occupied | Renter-occupied |
| Utility Gas | 880 (89.3%) | 292 (75.1%) |
| Bottled, Tank, or LP Gas | 9 (0.9%) | 0 (0.0%) |
| Electricity | 96 (9.8%) | 97 (24.9%) |
| Fuel Oil or Kerosene | 0 (0.0%) | 0 (0.0%) |
| Coal or Coke | 0 (0.0%) | 0 (0.0%) |
| All other Fuels | 0 (0.0%) | 0 (0.0%) |
| No Fuel Used | 0 (0.0%) | 0 (0.0%) |
| Total | 985 (100.0%) | 389 (100.0%) |
Household Vehicle Usage in Newton
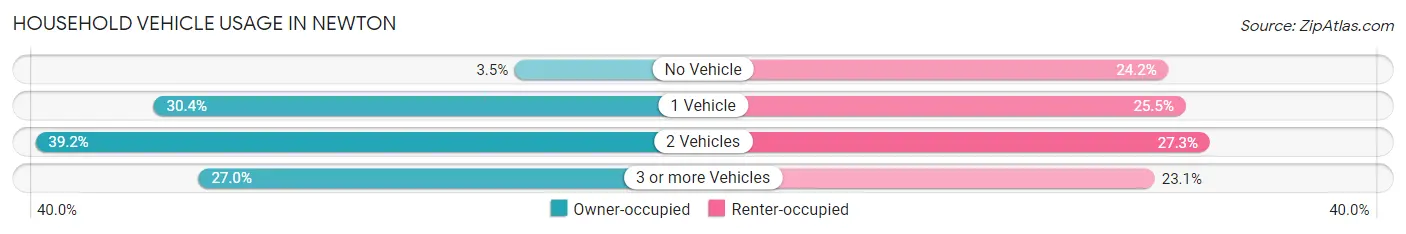
| Vehicles per Household | Owner-occupied | Renter-occupied |
| No Vehicle | 34 (3.5%) | 94 (24.2%) |
| 1 Vehicle | 299 (30.4%) | 99 (25.5%) |
| 2 Vehicles | 386 (39.2%) | 106 (27.3%) |
| 3 or more Vehicles | 266 (27.0%) | 90 (23.1%) |
| Total | 985 (100.0%) | 389 (100.0%) |
Real Estate & Mortgages in Newton
Real Estate and Mortgage Overview in Newton
| Characteristic | Without Mortgage | With Mortgage |
| Housing Units | 525 | 460 |
| Median Property Value | $90,600 | $91,100 |
| Median Household Income | $58,266 | $45 |
| Monthly Housing Costs | $488 | $0 |
| Real Estate Taxes | $1,625 | $16 |
Property Value by Mortgage Status in Newton
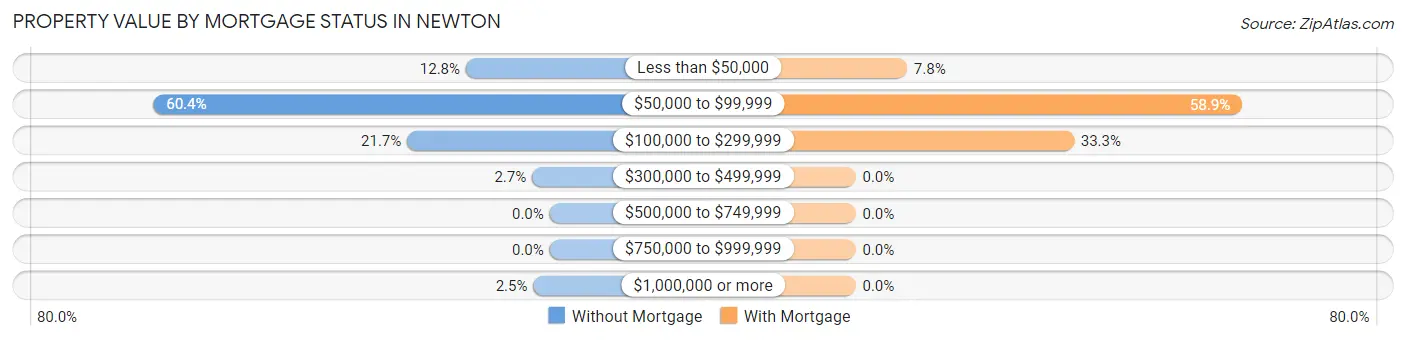
| Property Value | Without Mortgage | With Mortgage |
| Less than $50,000 | 67 (12.8%) | 36 (7.8%) |
| $50,000 to $99,999 | 317 (60.4%) | 271 (58.9%) |
| $100,000 to $299,999 | 114 (21.7%) | 153 (33.3%) |
| $300,000 to $499,999 | 14 (2.7%) | 0 (0.0%) |
| $500,000 to $749,999 | 0 (0.0%) | 0 (0.0%) |
| $750,000 to $999,999 | 0 (0.0%) | 0 (0.0%) |
| $1,000,000 or more | 13 (2.5%) | 0 (0.0%) |
| Total | 525 (100.0%) | 460 (100.0%) |
Household Income by Mortgage Status in Newton
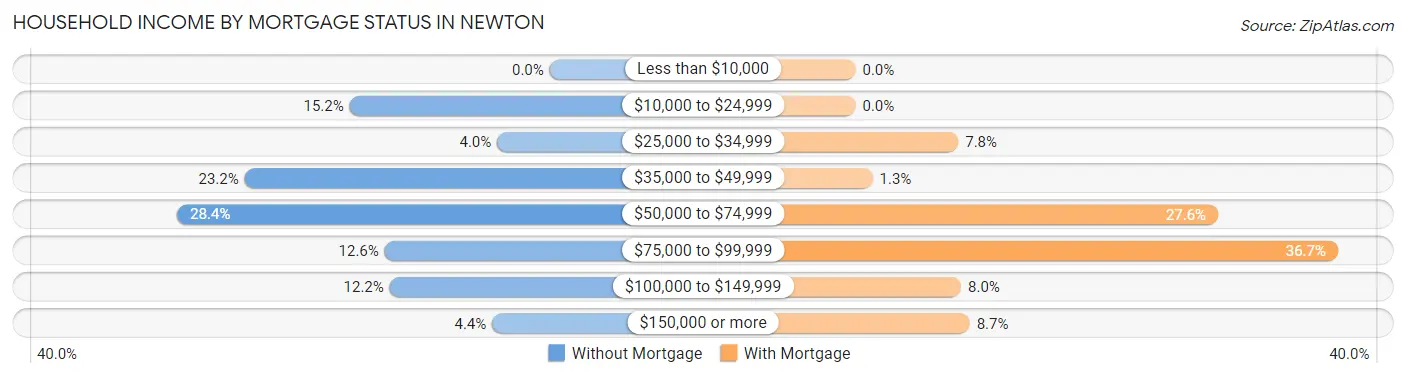
| Household Income | Without Mortgage | With Mortgage |
| Less than $10,000 | 0 (0.0%) | 0 (0.0%) |
| $10,000 to $24,999 | 80 (15.2%) | 0 (0.0%) |
| $25,000 to $34,999 | 21 (4.0%) | 36 (7.8%) |
| $35,000 to $49,999 | 122 (23.2%) | 6 (1.3%) |
| $50,000 to $74,999 | 149 (28.4%) | 127 (27.6%) |
| $75,000 to $99,999 | 66 (12.6%) | 169 (36.7%) |
| $100,000 to $149,999 | 64 (12.2%) | 37 (8.0%) |
| $150,000 or more | 23 (4.4%) | 40 (8.7%) |
| Total | 525 (100.0%) | 460 (100.0%) |
Property Value to Household Income Ratio in Newton
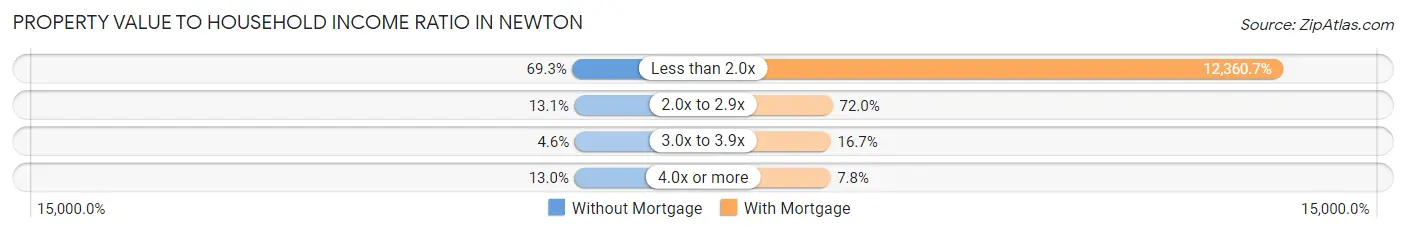
| Value-to-Income Ratio | Without Mortgage | With Mortgage |
| Less than 2.0x | 364 (69.3%) | 56,859 (12,360.6%) |
| 2.0x to 2.9x | 69 (13.1%) | 331 (72.0%) |
| 3.0x to 3.9x | 24 (4.6%) | 77 (16.7%) |
| 4.0x or more | 68 (13.0%) | 36 (7.8%) |
| Total | 525 (100.0%) | 460 (100.0%) |
Real Estate Taxes by Mortgage Status in Newton
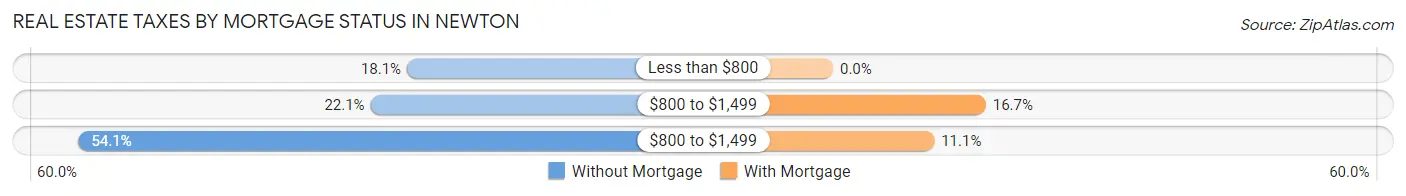
| Property Taxes | Without Mortgage | With Mortgage |
| Less than $800 | 95 (18.1%) | 0 (0.0%) |
| $800 to $1,499 | 116 (22.1%) | 77 (16.7%) |
| $800 to $1,499 | 284 (54.1%) | 51 (11.1%) |
| Total | 525 (100.0%) | 460 (100.0%) |
Health & Disability in Newton
Health Insurance Coverage by Age in Newton
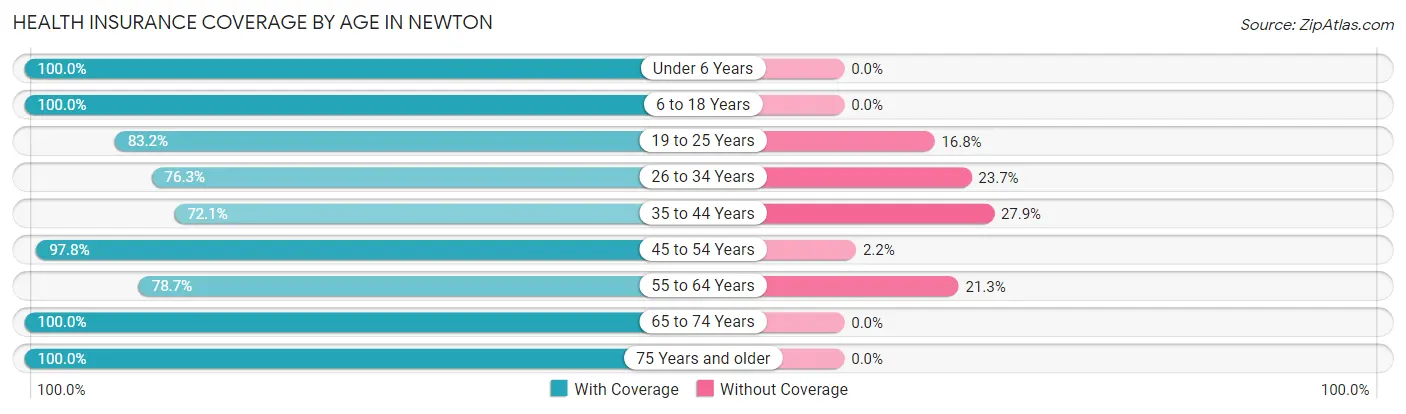
| Age Bracket | With Coverage | Without Coverage |
| Under 6 Years | 221 (100.0%) | 0 (0.0%) |
| 6 to 18 Years | 308 (100.0%) | 0 (0.0%) |
| 19 to 25 Years | 193 (83.2%) | 39 (16.8%) |
| 26 to 34 Years | 322 (76.3%) | 100 (23.7%) |
| 35 to 44 Years | 186 (72.1%) | 72 (27.9%) |
| 45 to 54 Years | 359 (97.8%) | 8 (2.2%) |
| 55 to 64 Years | 340 (78.7%) | 92 (21.3%) |
| 65 to 74 Years | 374 (100.0%) | 0 (0.0%) |
| 75 Years and older | 271 (100.0%) | 0 (0.0%) |
| Total | 2,574 (89.2%) | 311 (10.8%) |
Health Insurance Coverage by Citizenship Status in Newton
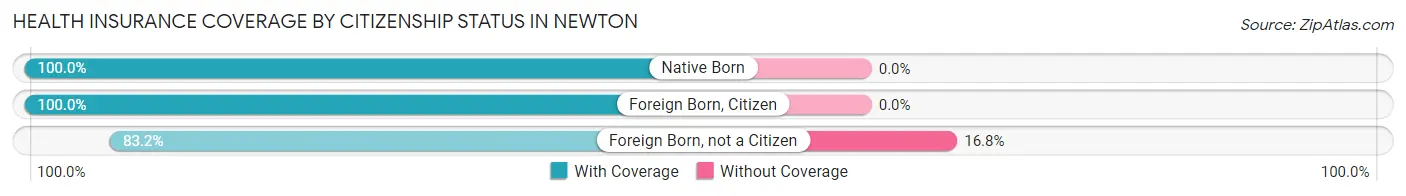
| Citizenship Status | With Coverage | Without Coverage |
| Native Born | 221 (100.0%) | 0 (0.0%) |
| Foreign Born, Citizen | 308 (100.0%) | 0 (0.0%) |
| Foreign Born, not a Citizen | 193 (83.2%) | 39 (16.8%) |
Health Insurance Coverage by Household Income in Newton
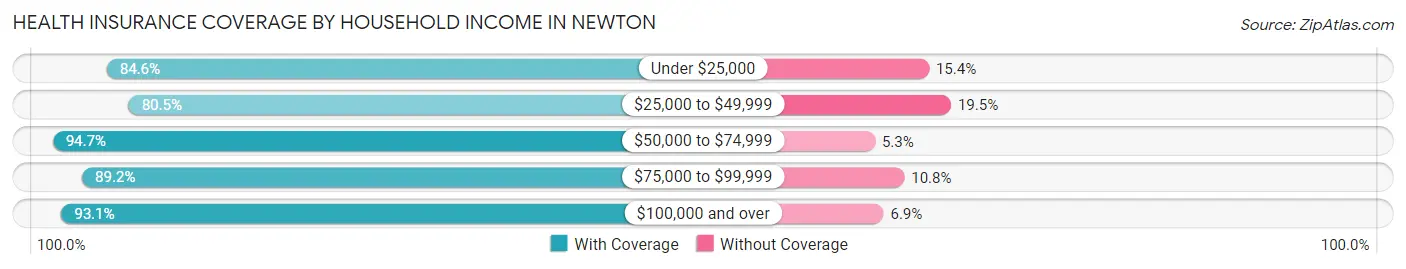
| Household Income | With Coverage | Without Coverage |
| Under $25,000 | 324 (84.6%) | 59 (15.4%) |
| $25,000 to $49,999 | 536 (80.5%) | 130 (19.5%) |
| $50,000 to $74,999 | 881 (94.7%) | 49 (5.3%) |
| $75,000 to $99,999 | 273 (89.2%) | 33 (10.8%) |
| $100,000 and over | 541 (93.1%) | 40 (6.9%) |
Public vs Private Health Insurance Coverage by Age in Newton
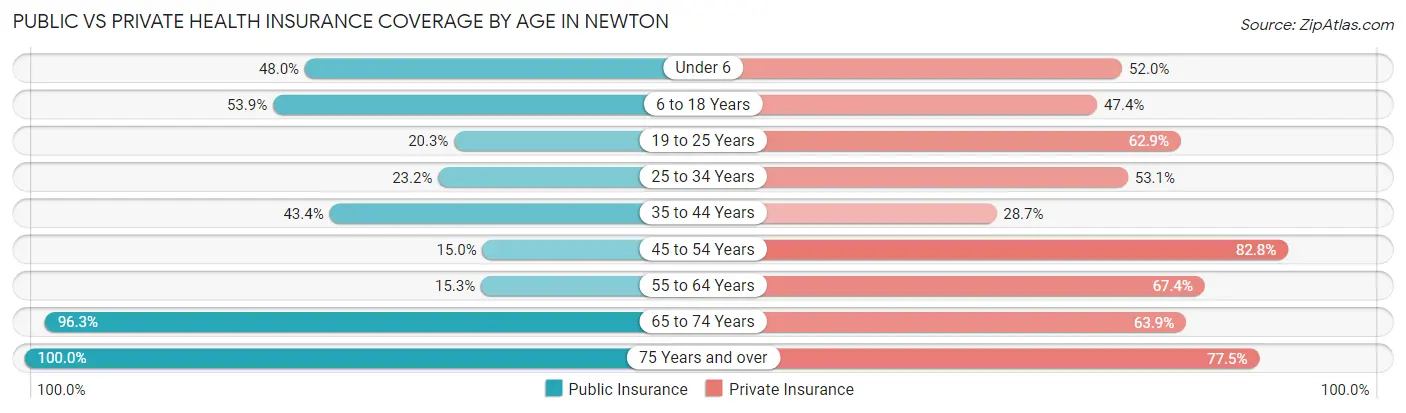
| Age Bracket | Public Insurance | Private Insurance |
| Under 6 | 106 (48.0%) | 115 (52.0%) |
| 6 to 18 Years | 166 (53.9%) | 146 (47.4%) |
| 19 to 25 Years | 47 (20.3%) | 146 (62.9%) |
| 25 to 34 Years | 98 (23.2%) | 224 (53.1%) |
| 35 to 44 Years | 112 (43.4%) | 74 (28.7%) |
| 45 to 54 Years | 55 (15.0%) | 304 (82.8%) |
| 55 to 64 Years | 66 (15.3%) | 291 (67.4%) |
| 65 to 74 Years | 360 (96.3%) | 239 (63.9%) |
| 75 Years and over | 271 (100.0%) | 210 (77.5%) |
| Total | 1,281 (44.4%) | 1,749 (60.6%) |
Disability Status by Sex by Age in Newton
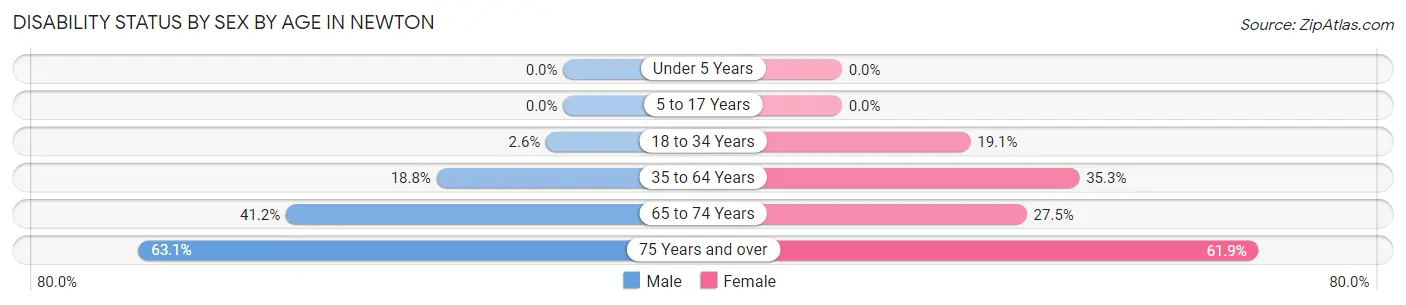
| Age Bracket | Male | Female |
| Under 5 Years | 0 (0.0%) | 0 (0.0%) |
| 5 to 17 Years | 0 (0.0%) | 0 (0.0%) |
| 18 to 34 Years | 9 (2.5%) | 62 (19.1%) |
| 35 to 64 Years | 98 (18.8%) | 189 (35.3%) |
| 65 to 74 Years | 70 (41.2%) | 56 (27.5%) |
| 75 Years and over | 65 (63.1%) | 104 (61.9%) |
Disability Class by Sex by Age in Newton
Disability Class: Hearing Difficulty
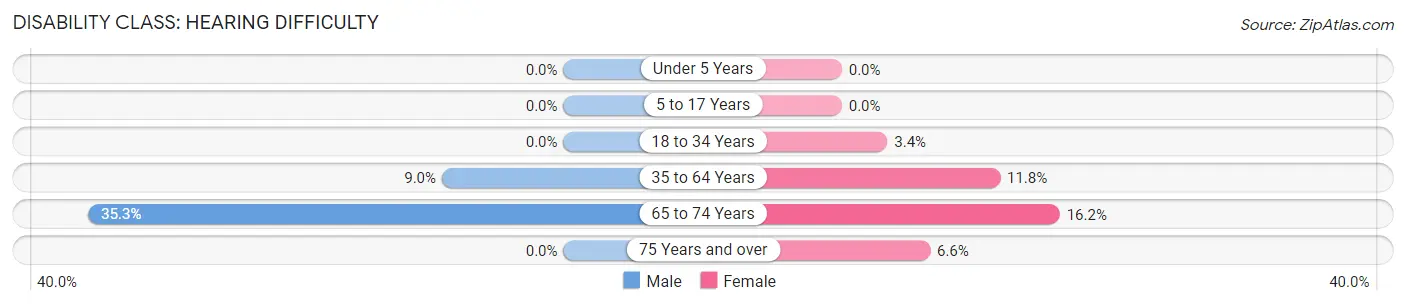
| Age Bracket | Male | Female |
| Under 5 Years | 0 (0.0%) | 0 (0.0%) |
| 5 to 17 Years | 0 (0.0%) | 0 (0.0%) |
| 18 to 34 Years | 0 (0.0%) | 11 (3.4%) |
| 35 to 64 Years | 47 (9.0%) | 63 (11.7%) |
| 65 to 74 Years | 60 (35.3%) | 33 (16.2%) |
| 75 Years and over | 0 (0.0%) | 11 (6.6%) |
Disability Class: Vision Difficulty
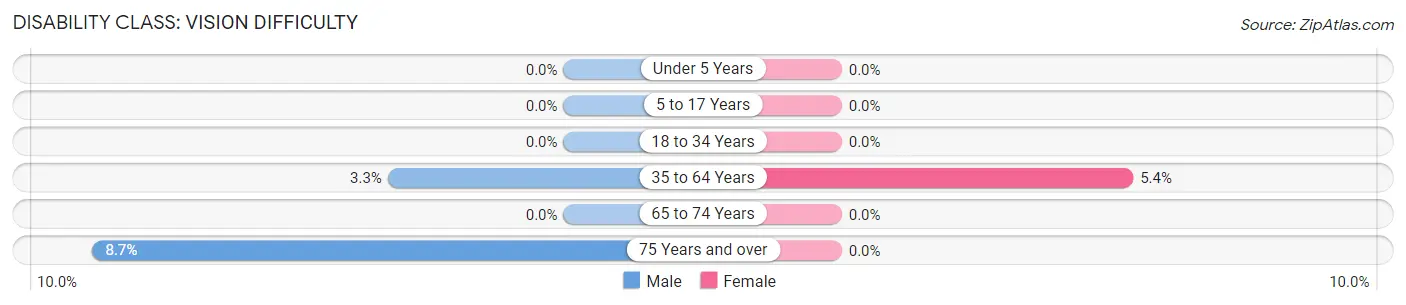
| Age Bracket | Male | Female |
| Under 5 Years | 0 (0.0%) | 0 (0.0%) |
| 5 to 17 Years | 0 (0.0%) | 0 (0.0%) |
| 18 to 34 Years | 0 (0.0%) | 0 (0.0%) |
| 35 to 64 Years | 17 (3.3%) | 29 (5.4%) |
| 65 to 74 Years | 0 (0.0%) | 0 (0.0%) |
| 75 Years and over | 9 (8.7%) | 0 (0.0%) |
Disability Class: Cognitive Difficulty
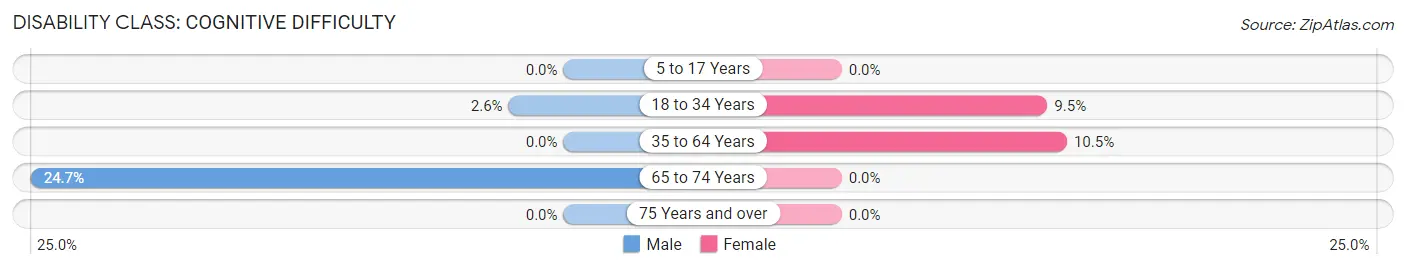
| Age Bracket | Male | Female |
| 5 to 17 Years | 0 (0.0%) | 0 (0.0%) |
| 18 to 34 Years | 9 (2.5%) | 31 (9.5%) |
| 35 to 64 Years | 0 (0.0%) | 56 (10.4%) |
| 65 to 74 Years | 42 (24.7%) | 0 (0.0%) |
| 75 Years and over | 0 (0.0%) | 0 (0.0%) |
Disability Class: Ambulatory Difficulty
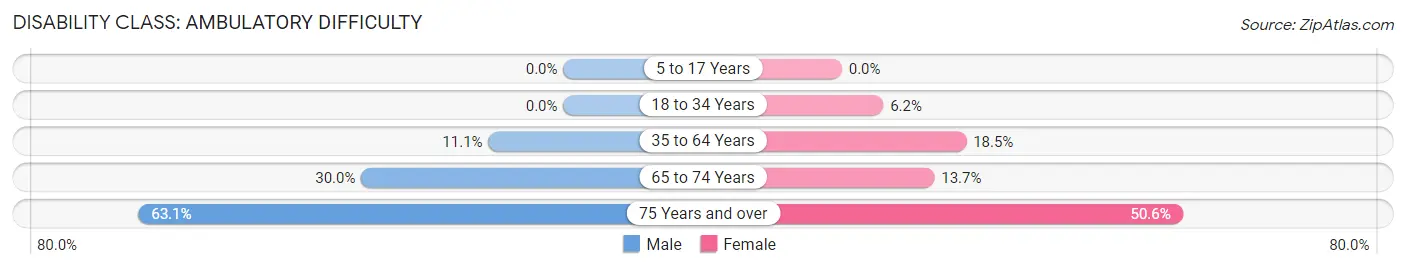
| Age Bracket | Male | Female |
| 5 to 17 Years | 0 (0.0%) | 0 (0.0%) |
| 18 to 34 Years | 0 (0.0%) | 20 (6.1%) |
| 35 to 64 Years | 58 (11.1%) | 99 (18.5%) |
| 65 to 74 Years | 51 (30.0%) | 28 (13.7%) |
| 75 Years and over | 65 (63.1%) | 85 (50.6%) |
Disability Class: Self-Care Difficulty
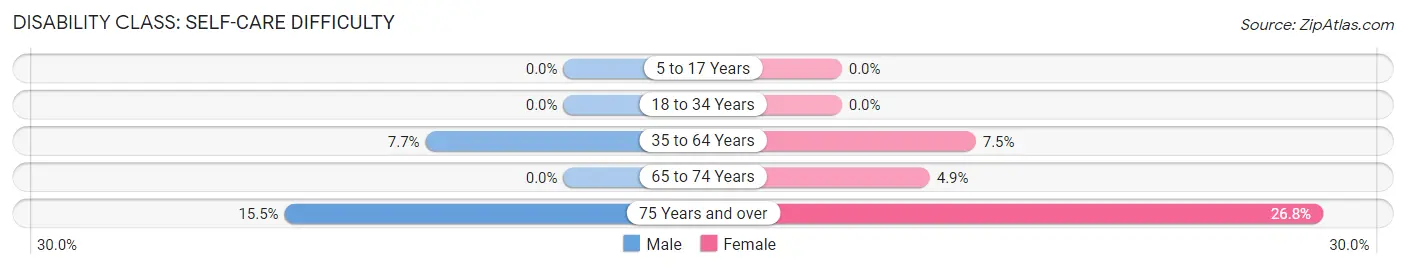
| Age Bracket | Male | Female |
| 5 to 17 Years | 0 (0.0%) | 0 (0.0%) |
| 18 to 34 Years | 0 (0.0%) | 0 (0.0%) |
| 35 to 64 Years | 40 (7.7%) | 40 (7.5%) |
| 65 to 74 Years | 0 (0.0%) | 10 (4.9%) |
| 75 Years and over | 16 (15.5%) | 45 (26.8%) |
Technology Access in Newton
Computing Device Access in Newton
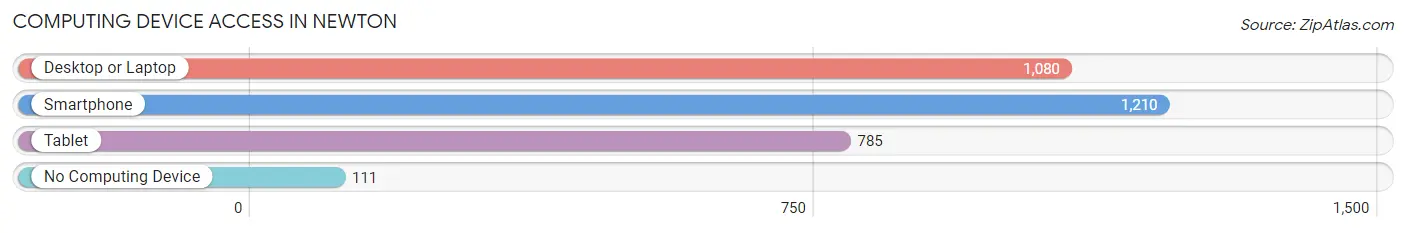
| Device Type | # Households | % Households |
| Desktop or Laptop | 1,080 | 78.6% |
| Smartphone | 1,210 | 88.1% |
| Tablet | 785 | 57.1% |
| No Computing Device | 111 | 8.1% |
| Total | 1,374 | 100.0% |
Internet Access in Newton
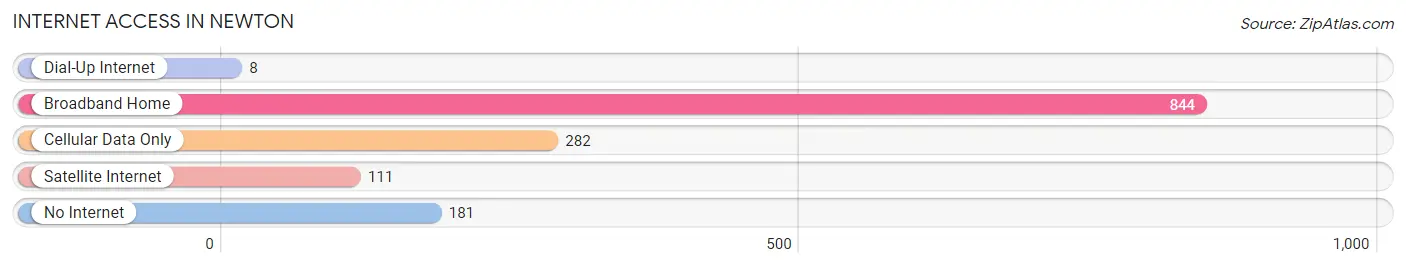
| Internet Type | # Households | % Households |
| Dial-Up Internet | 8 | 0.6% |
| Broadband Home | 844 | 61.4% |
| Cellular Data Only | 282 | 20.5% |
| Satellite Internet | 111 | 8.1% |
| No Internet | 181 | 13.2% |
| Total | 1,374 | 100.0% |
Newton Summary
Newton, Illinois is a small city located in Jasper County, in the southeastern part of the state. It is situated on the banks of the Embarras River, and is the county seat of Jasper County. The city has a population of approximately 5,000 people, and is part of the Effingham-Mattoon-Charleston Metropolitan Statistical Area.
History
The area that is now Newton was first settled in 1819 by a group of pioneers from North Carolina. The town was originally known as “New Town”, and was later changed to “Newton” in 1837. The town was officially incorporated in 1839, and was named after the town of Newton, Massachusetts.
In the late 19th century, Newton was a thriving agricultural center, with a variety of crops being grown in the area. The town was also home to several manufacturing businesses, including a flour mill, a sawmill, and a brickyard.
Geography
Newton is located in the southeastern part of Illinois, in Jasper County. It is situated on the banks of the Embarras River, and is approximately 40 miles south of Champaign, and 60 miles east of St. Louis. The city has a total area of 2.2 square miles, all of which is land.
The climate in Newton is classified as humid continental, with hot, humid summers and cold, snowy winters. The average annual temperature is around 50 degrees Fahrenheit, and the average annual precipitation is around 40 inches.
Economy
The economy of Newton is largely based on agriculture and manufacturing. The city is home to several large agricultural businesses, including a grain elevator, a feed mill, and a fertilizer plant. The city is also home to several manufacturing businesses, including a plastics factory, a metal fabrication plant, and a printing company.
In addition to these industries, Newton is also home to several retail businesses, including a grocery store, a hardware store, and a variety of restaurants. The city is also home to a number of small businesses, including a barber shop, a beauty salon, and a florist.
Demographics
As of the 2010 census, the population of Newton was 5,092. The racial makeup of the city was 95.3% White, 0.7% African American, 0.3% Native American, 0.4% Asian, 0.1% Pacific Islander, 1.2% from other races, and 2.1% from two or more races. Hispanic or Latino of any race were 3.2% of the population.
The median household income in Newton was $41,944, and the median family income was $50,917. The per capita income for the city was $20,845. About 11.2% of families and 14.2% of the population were below the poverty line, including 19.2% of those under age 18 and 8.2% of those age 65 or over.
Common Questions
What is Per Capita Income in Newton?
Per Capita income in Newton is $29,298.
What is the Median Family Income in Newton?
Median Family Income in Newton is $64,792.
What is the Median Household income in Newton?
Median Household Income in Newton is $55,109.
What is Income or Wage Gap in Newton?
Income or Wage Gap in Newton is 53.8%.
Women in Newton earn 46.2 cents for every dollar earned by a man.
What is Inequality or Gini Index in Newton?
Inequality or Gini Index in Newton is 0.36.
What is the Total Population of Newton?
Total Population of Newton is 2,957.
What is the Total Male Population of Newton?
Total Male Population of Newton is 1,507.
What is the Total Female Population of Newton?
Total Female Population of Newton is 1,450.
What is the Ratio of Males per 100 Females in Newton?
There are 103.93 Males per 100 Females in Newton.
What is the Ratio of Females per 100 Males in Newton?
There are 96.22 Females per 100 Males in Newton.
What is the Median Population Age in Newton?
Median Population Age in Newton is 46.4 Years.
What is the Average Family Size in Newton
Average Family Size in Newton is 2.6 People.
What is the Average Household Size in Newton
Average Household Size in Newton is 2.1 People.
How Large is the Labor Force in Newton?
There are 1,471 People in the Labor Forcein in Newton.
What is the Percentage of People in the Labor Force in Newton?
58.5% of People are in the Labor Force in Newton.
What is the Unemployment Rate in Newton?
Unemployment Rate in Newton is 5.1%.