New Haven, IL Map & Demographics
New Haven Map
New Haven Overview
$22,035
PER CAPITA INCOME
$75,417
AVG FAMILY INCOME
$34,432
AVG HOUSEHOLD INCOME
0.46
INEQUALITY / GINI INDEX
485
TOTAL POPULATION
209
MALE POPULATION
276
FEMALE POPULATION
75.72
MALES / 100 FEMALES
132.06
FEMALES / 100 MALES
41.9
MEDIAN AGE
3.4
AVG FAMILY SIZE
2.7
AVG HOUSEHOLD SIZE
274
LABOR FORCE [ PEOPLE ]
62.4%
PERCENT IN LABOR FORCE
39.4%
UNEMPLOYMENT RATE
New Haven Zip Codes
New Haven Area Codes
Income in New Haven
Income Overview in New Haven
Per Capita Income in New Haven is $22,035, while median incomes of families and households are $75,417 and $34,432 respectively.
| Characteristic | Number | Measure |
| Per Capita Income | 485 | $22,035 |
| Median Family Income | 106 | $75,417 |
| Mean Family Income | 106 | $74,393 |
| Median Household Income | 177 | $34,432 |
| Mean Household Income | 177 | $55,409 |
| Income Deficit | 106 | $0 |
| Wage / Income Gap (%) | 485 | 0.00% |
| Wage / Income Gap ($) | 485 | 100.00¢ per $1 |
| Gini / Inequality Index | 485 | 0.46 |
Earnings by Sex in New Haven
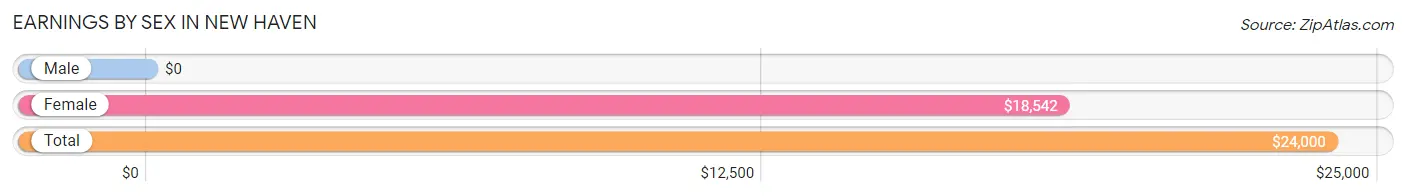
| Sex | Number | Average Earnings |
| Male | 109 (45.4%) | $0 |
| Female | 131 (54.6%) | $18,542 |
| Total | 240 (100.0%) | $24,000 |
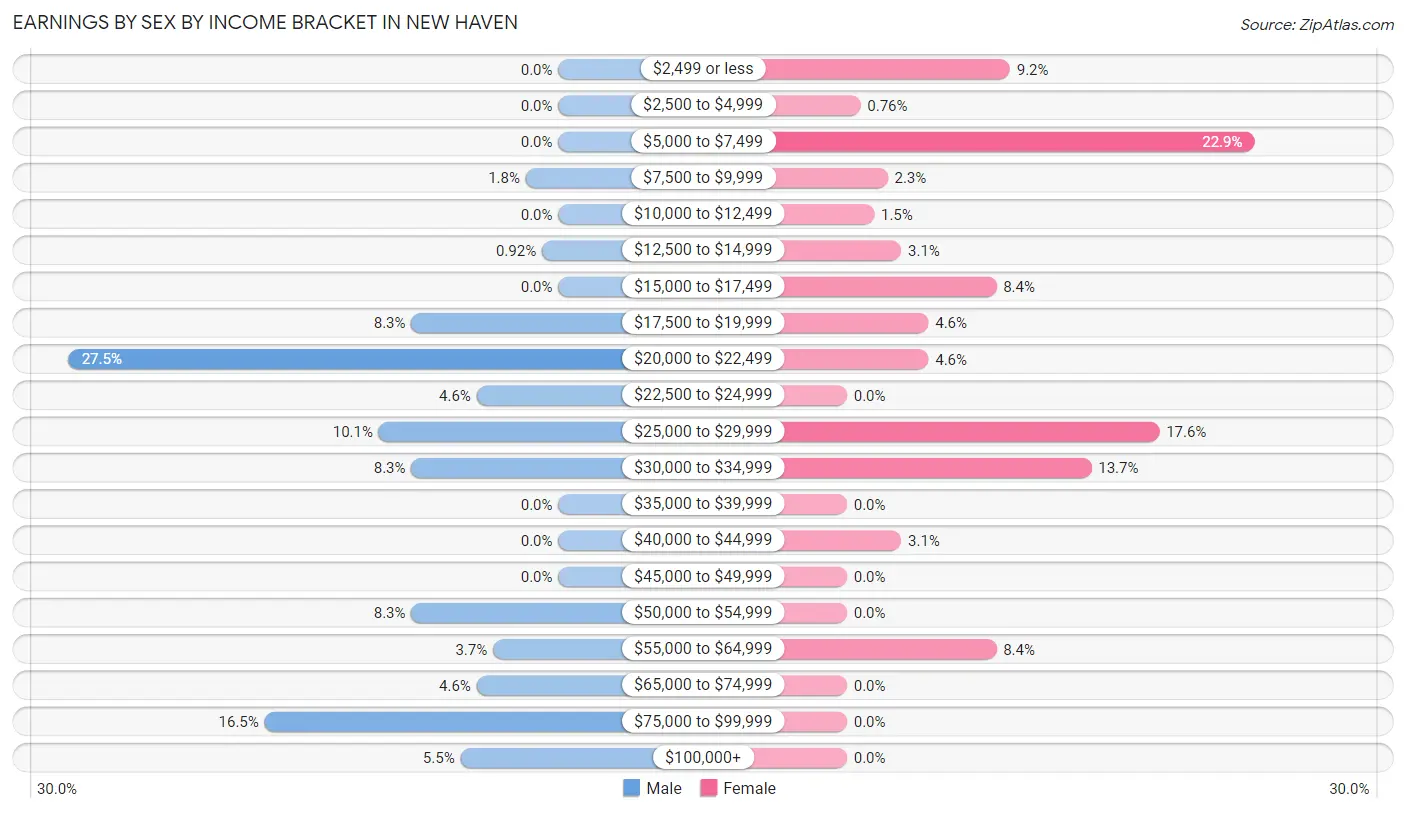
Earnings by Sex by Income Bracket in New Haven
The most common earnings brackets in New Haven are $20,000 to $22,499 for men (30 | 27.5%) and $5,000 to $7,499 for women (30 | 22.9%).
| Income | Male | Female |
| $2,499 or less | 0 (0.0%) | 12 (9.2%) |
| $2,500 to $4,999 | 0 (0.0%) | 1 (0.8%) |
| $5,000 to $7,499 | 0 (0.0%) | 30 (22.9%) |
| $7,500 to $9,999 | 2 (1.8%) | 3 (2.3%) |
| $10,000 to $12,499 | 0 (0.0%) | 2 (1.5%) |
| $12,500 to $14,999 | 1 (0.9%) | 4 (3.0%) |
| $15,000 to $17,499 | 0 (0.0%) | 11 (8.4%) |
| $17,500 to $19,999 | 9 (8.3%) | 6 (4.6%) |
| $20,000 to $22,499 | 30 (27.5%) | 6 (4.6%) |
| $22,500 to $24,999 | 5 (4.6%) | 0 (0.0%) |
| $25,000 to $29,999 | 11 (10.1%) | 23 (17.6%) |
| $30,000 to $34,999 | 9 (8.3%) | 18 (13.7%) |
| $35,000 to $39,999 | 0 (0.0%) | 0 (0.0%) |
| $40,000 to $44,999 | 0 (0.0%) | 4 (3.0%) |
| $45,000 to $49,999 | 0 (0.0%) | 0 (0.0%) |
| $50,000 to $54,999 | 9 (8.3%) | 0 (0.0%) |
| $55,000 to $64,999 | 4 (3.7%) | 11 (8.4%) |
| $65,000 to $74,999 | 5 (4.6%) | 0 (0.0%) |
| $75,000 to $99,999 | 18 (16.5%) | 0 (0.0%) |
| $100,000+ | 6 (5.5%) | 0 (0.0%) |
| Total | 109 (100.0%) | 131 (100.0%) |
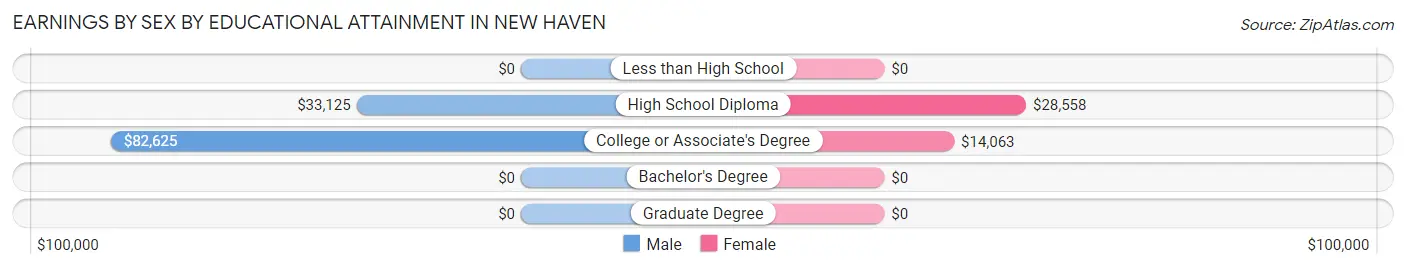
Earnings by Sex by Educational Attainment in New Haven
Average earnings in New Haven are $52,500 for men and $26,375 for women, a difference of 49.8%. Men with an educational attainment of college or associate's degree enjoy the highest average annual earnings of $82,625, while those with high school diploma education earn the least with $33,125. Women with an educational attainment of high school diploma earn the most with the average annual earnings of $28,558, while those with college or associate's degree education have the smallest earnings of $14,063.
| Educational Attainment | Male Income | Female Income |
| Less than High School | - | - |
| High School Diploma | $33,125 | $28,558 |
| College or Associate's Degree | $82,625 | $14,063 |
| Bachelor's Degree | - | - |
| Graduate Degree | - | - |
| Total | $52,500 | $26,375 |
Family Income in New Haven
Family Income Brackets in New Haven
According to the New Haven family income data, there are 26 families falling into the $75,000 to $99,999 income range, which is the most common income bracket and makes up 24.5% of all families. Conversely, the $10,000 to $14,999 income bracket is the least frequent group with only 3 families (2.8%) belonging to this category.
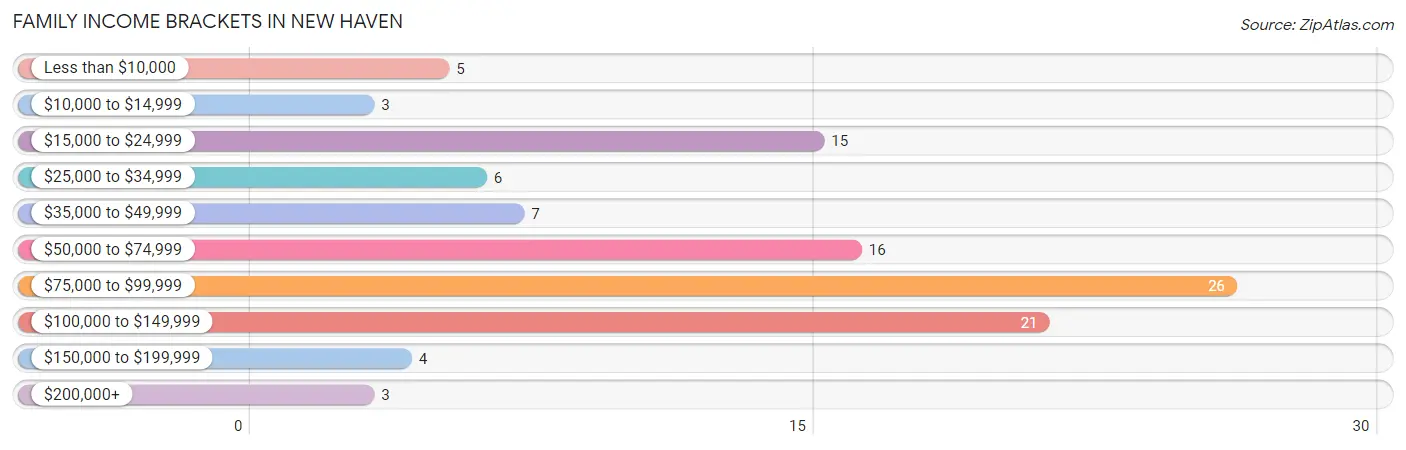
| Income Bracket | # Families | % Families |
| Less than $10,000 | 5 | 4.7% |
| $10,000 to $14,999 | 3 | 2.8% |
| $15,000 to $24,999 | 15 | 14.2% |
| $25,000 to $34,999 | 6 | 5.7% |
| $35,000 to $49,999 | 7 | 6.6% |
| $50,000 to $74,999 | 16 | 15.1% |
| $75,000 to $99,999 | 26 | 24.5% |
| $100,000 to $149,999 | 21 | 19.8% |
| $150,000 to $199,999 | 4 | 3.8% |
| $200,000+ | 3 | 2.8% |
Family Income by Famaliy Size in New Haven
5-person families (20 | 18.9%) account for the highest median family income in New Haven with $111,346 per family, while 3-person families (22 | 20.7%) have the highest median income of $31,250 per family member.
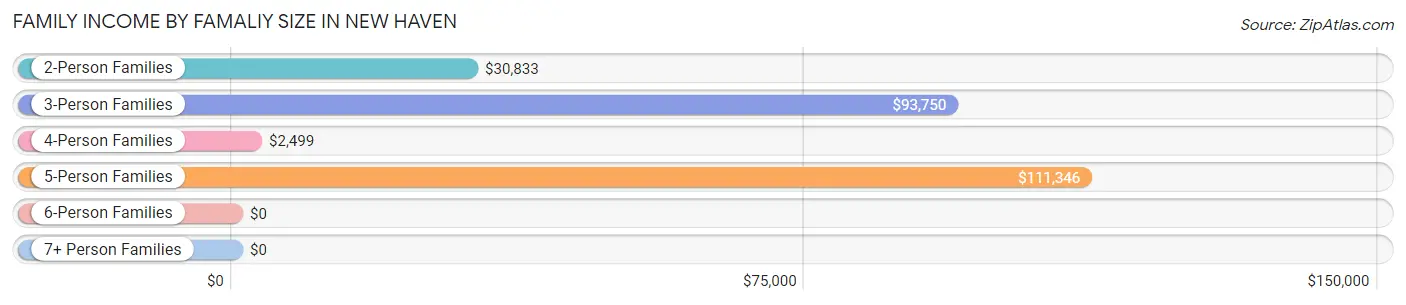
| Income Bracket | # Families | Median Income |
| 2-Person Families | 44 (41.5%) | $30,833 |
| 3-Person Families | 22 (20.7%) | $93,750 |
| 4-Person Families | 9 (8.5%) | $2,499 |
| 5-Person Families | 20 (18.9%) | $111,346 |
| 6-Person Families | 11 (10.4%) | $0 |
| 7+ Person Families | 0 (0.0%) | $0 |
| Total | 106 (100.0%) | $75,417 |
Family Income by Number of Earners in New Haven
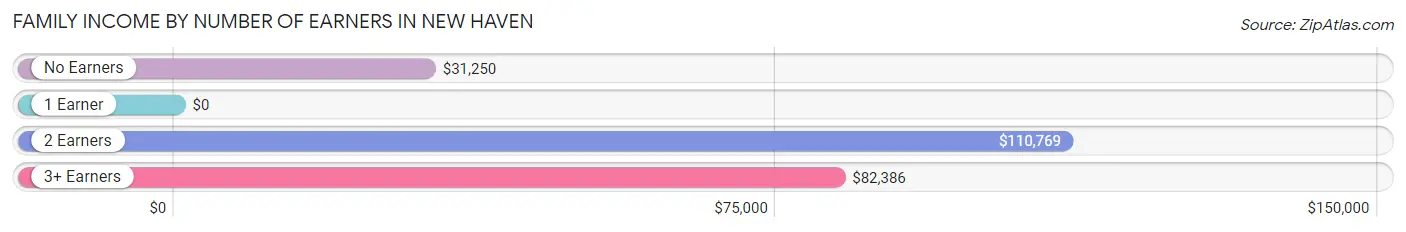
| Number of Earners | # Families | Median Income |
| No Earners | 35 (33.0%) | $31,250 |
| 1 Earner | 18 (17.0%) | $0 |
| 2 Earners | 24 (22.6%) | $110,769 |
| 3+ Earners | 29 (27.4%) | $82,386 |
| Total | 106 (100.0%) | $75,417 |
Household Income in New Haven
Household Income Brackets in New Haven
With 35 households falling in the category, the $25,000 to $34,999 income range is the most frequent in New Haven, accounting for 19.8% of all households. In contrast, only 3 households (1.7%) fall into the $200,000+ income bracket, making it the least populous group.
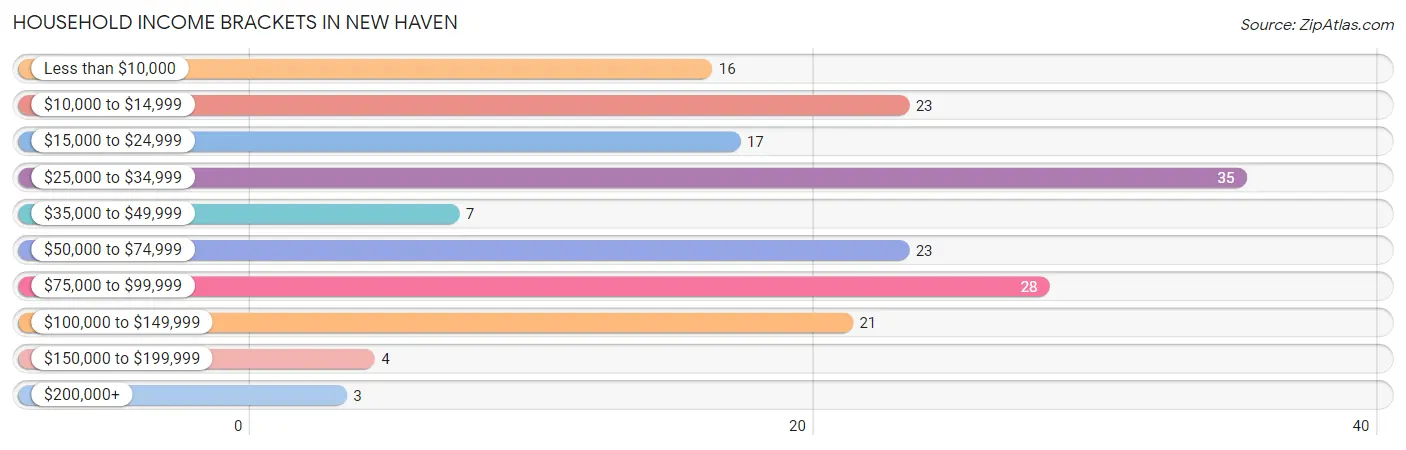
| Income Bracket | # Households | % Households |
| Less than $10,000 | 16 | 9.0% |
| $10,000 to $14,999 | 23 | 13.0% |
| $15,000 to $24,999 | 17 | 9.6% |
| $25,000 to $34,999 | 35 | 19.8% |
| $35,000 to $49,999 | 7 | 4.0% |
| $50,000 to $74,999 | 23 | 13.0% |
| $75,000 to $99,999 | 28 | 15.8% |
| $100,000 to $149,999 | 21 | 11.9% |
| $150,000 to $199,999 | 4 | 2.3% |
| $200,000+ | 3 | 1.7% |
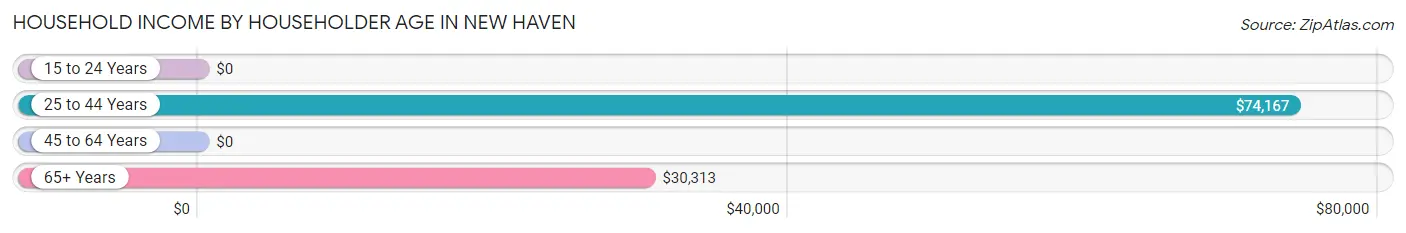
Household Income by Householder Age in New Haven
The median household income in New Haven is $34,432, with the highest median household income of $74,167 found in the 25 to 44 years age bracket for the primary householder. A total of 28 households (15.8%) fall into this category.
| Income Bracket | # Households | Median Income |
| 15 to 24 Years | 0 (0.0%) | $0 |
| 25 to 44 Years | 28 (15.8%) | $74,167 |
| 45 to 64 Years | 94 (53.1%) | $0 |
| 65+ Years | 55 (31.1%) | $30,313 |
| Total | 177 (100.0%) | $34,432 |
Poverty in New Haven
Income Below Poverty by Sex and Age in New Haven
With 19.6% poverty level for males and 27.2% for females among the residents of New Haven, 15 year old males and 6 to 11 year old females are the most vulnerable to poverty, with 7 males (100.0%) and 5 females (83.3%) in their respective age groups living below the poverty level.
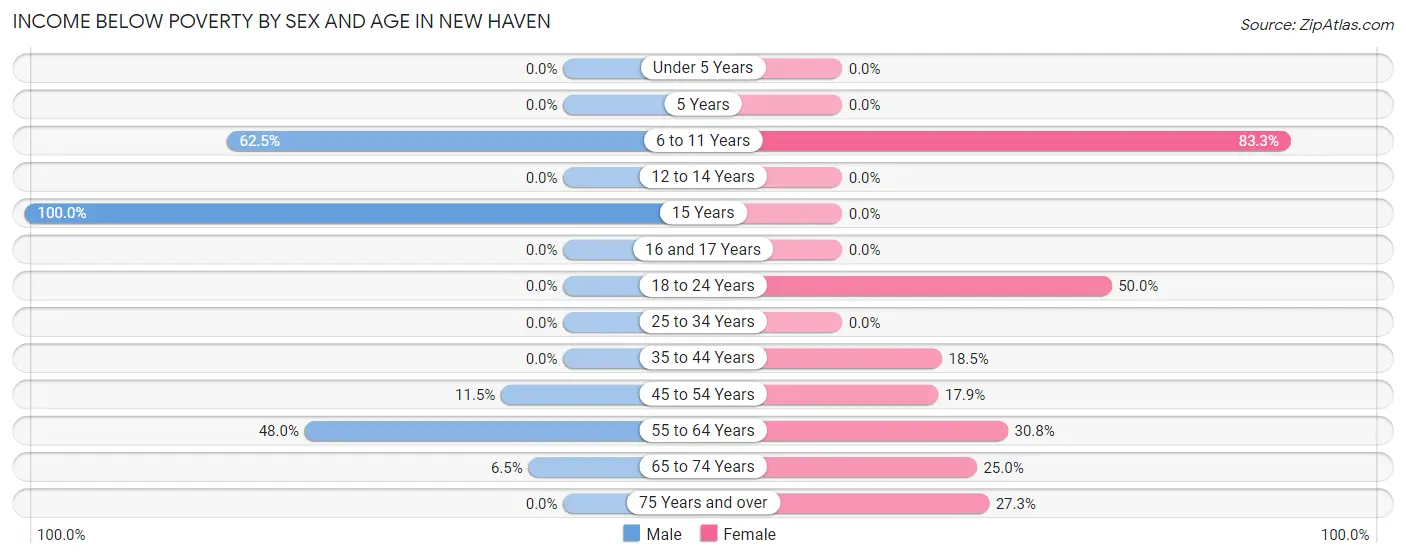
| Age Bracket | Male | Female |
| Under 5 Years | 0 (0.0%) | 0 (0.0%) |
| 5 Years | 0 (0.0%) | 0 (0.0%) |
| 6 to 11 Years | 5 (62.5%) | 5 (83.3%) |
| 12 to 14 Years | 0 (0.0%) | 0 (0.0%) |
| 15 Years | 7 (100.0%) | 0 (0.0%) |
| 16 and 17 Years | 0 (0.0%) | 0 (0.0%) |
| 18 to 24 Years | 0 (0.0%) | 33 (50.0%) |
| 25 to 34 Years | 0 (0.0%) | 0 (0.0%) |
| 35 to 44 Years | 0 (0.0%) | 5 (18.5%) |
| 45 to 54 Years | 3 (11.5%) | 5 (17.9%) |
| 55 to 64 Years | 24 (48.0%) | 16 (30.8%) |
| 65 to 74 Years | 2 (6.5%) | 8 (25.0%) |
| 75 Years and over | 0 (0.0%) | 3 (27.3%) |
| Total | 41 (19.6%) | 75 (27.2%) |
Income Above Poverty by Sex and Age in New Haven
According to the poverty statistics in New Haven, males aged under 5 years and females aged under 5 years are the age groups that are most secure financially, with 100.0% of males and 100.0% of females in these age groups living above the poverty line.
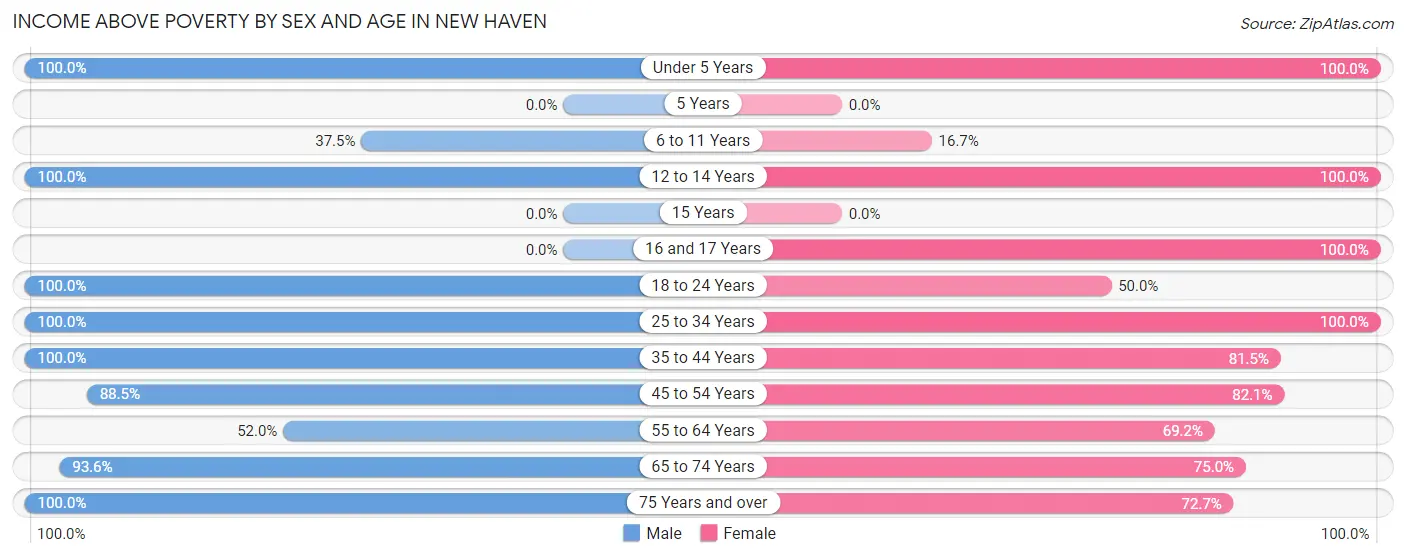
| Age Bracket | Male | Female |
| Under 5 Years | 8 (100.0%) | 7 (100.0%) |
| 5 Years | 0 (0.0%) | 0 (0.0%) |
| 6 to 11 Years | 3 (37.5%) | 1 (16.7%) |
| 12 to 14 Years | 4 (100.0%) | 6 (100.0%) |
| 15 Years | 0 (0.0%) | 0 (0.0%) |
| 16 and 17 Years | 0 (0.0%) | 15 (100.0%) |
| 18 to 24 Years | 36 (100.0%) | 33 (50.0%) |
| 25 to 34 Years | 9 (100.0%) | 26 (100.0%) |
| 35 to 44 Years | 22 (100.0%) | 22 (81.5%) |
| 45 to 54 Years | 23 (88.5%) | 23 (82.1%) |
| 55 to 64 Years | 26 (52.0%) | 36 (69.2%) |
| 65 to 74 Years | 29 (93.5%) | 24 (75.0%) |
| 75 Years and over | 8 (100.0%) | 8 (72.7%) |
| Total | 168 (80.4%) | 201 (72.8%) |
Income Below Poverty Among Married-Couple Families in New Haven
The poverty statistics for married-couple families in New Haven show that 8.3% or 8 of the total 96 families live below the poverty line. Families with no children have the highest poverty rate of 13.6%, comprising of 8 families. On the other hand, families with 1 or 2 children have the lowest poverty rate of 0.0%, which includes 0 families.
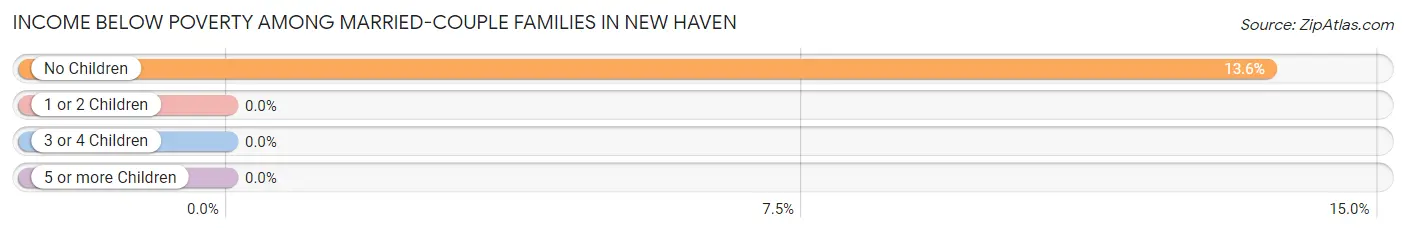
| Children | Above Poverty | Below Poverty |
| No Children | 51 (86.4%) | 8 (13.6%) |
| 1 or 2 Children | 34 (100.0%) | 0 (0.0%) |
| 3 or 4 Children | 3 (100.0%) | 0 (0.0%) |
| 5 or more Children | 0 (0.0%) | 0 (0.0%) |
| Total | 88 (91.7%) | 8 (8.3%) |
Income Below Poverty Among Single-Parent Households in New Haven
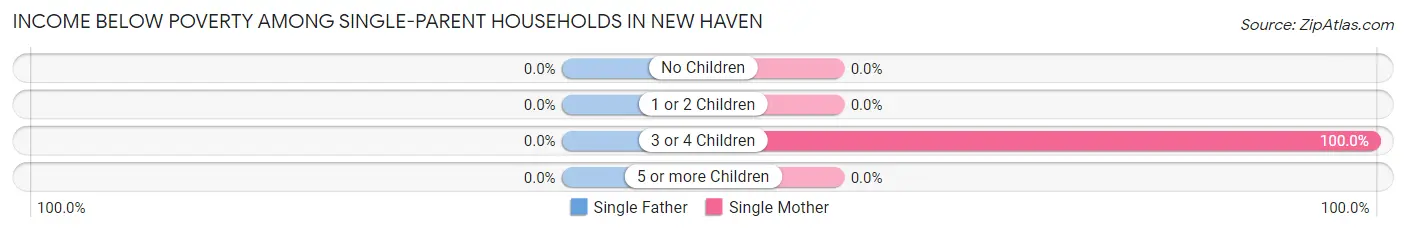
| Children | Single Father | Single Mother |
| No Children | 0 (0.0%) | 0 (0.0%) |
| 1 or 2 Children | 0 (0.0%) | 0 (0.0%) |
| 3 or 4 Children | 0 (0.0%) | 5 (100.0%) |
| 5 or more Children | 0 (0.0%) | 0 (0.0%) |
| Total | 0 (0.0%) | 5 (55.6%) |
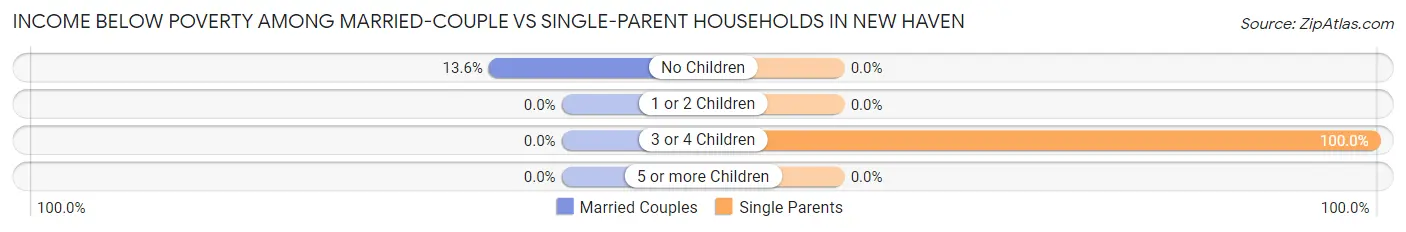
Income Below Poverty Among Married-Couple vs Single-Parent Households in New Haven
The poverty data for New Haven shows that 8 of the married-couple family households (8.3%) and 5 of the single-parent households (50.0%) are living below the poverty level. Within the married-couple family households, those with no children have the highest poverty rate, with 8 households (13.6%) falling below the poverty line. Among the single-parent households, those with 3 or 4 children have the highest poverty rate, with 5 household (100.0%) living below poverty.
| Children | Married-Couple Families | Single-Parent Households |
| No Children | 8 (13.6%) | 0 (0.0%) |
| 1 or 2 Children | 0 (0.0%) | 0 (0.0%) |
| 3 or 4 Children | 0 (0.0%) | 5 (100.0%) |
| 5 or more Children | 0 (0.0%) | 0 (0.0%) |
| Total | 8 (8.3%) | 5 (50.0%) |
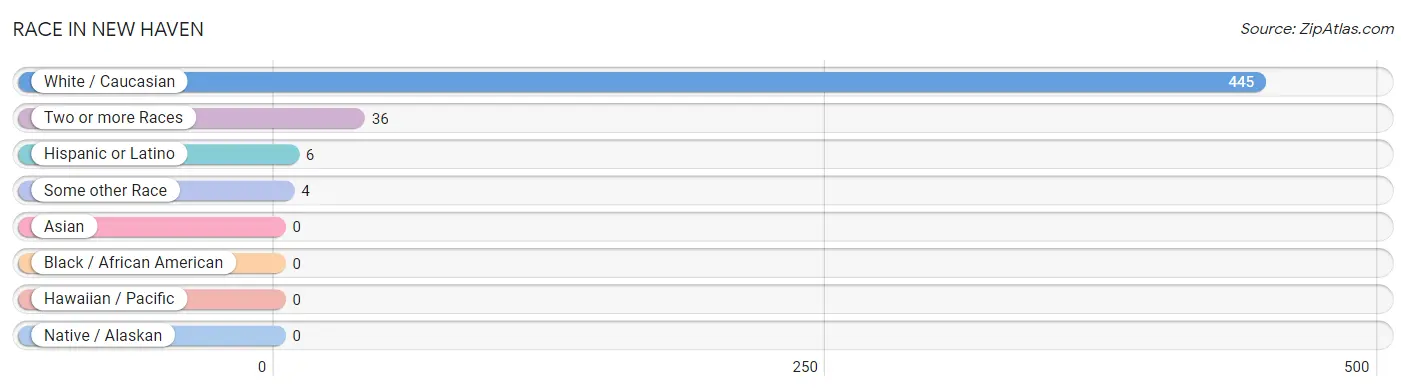
Race in New Haven
The most populous races in New Haven are White / Caucasian (445 | 91.7%), Two or more Races (36 | 7.4%), and Hispanic or Latino (6 | 1.2%).
| Race | # Population | % Population |
| Asian | 0 | 0.0% |
| Black / African American | 0 | 0.0% |
| Hawaiian / Pacific | 0 | 0.0% |
| Hispanic or Latino | 6 | 1.2% |
| Native / Alaskan | 0 | 0.0% |
| White / Caucasian | 445 | 91.7% |
| Two or more Races | 36 | 7.4% |
| Some other Race | 4 | 0.8% |
| Total | 485 | 100.0% |
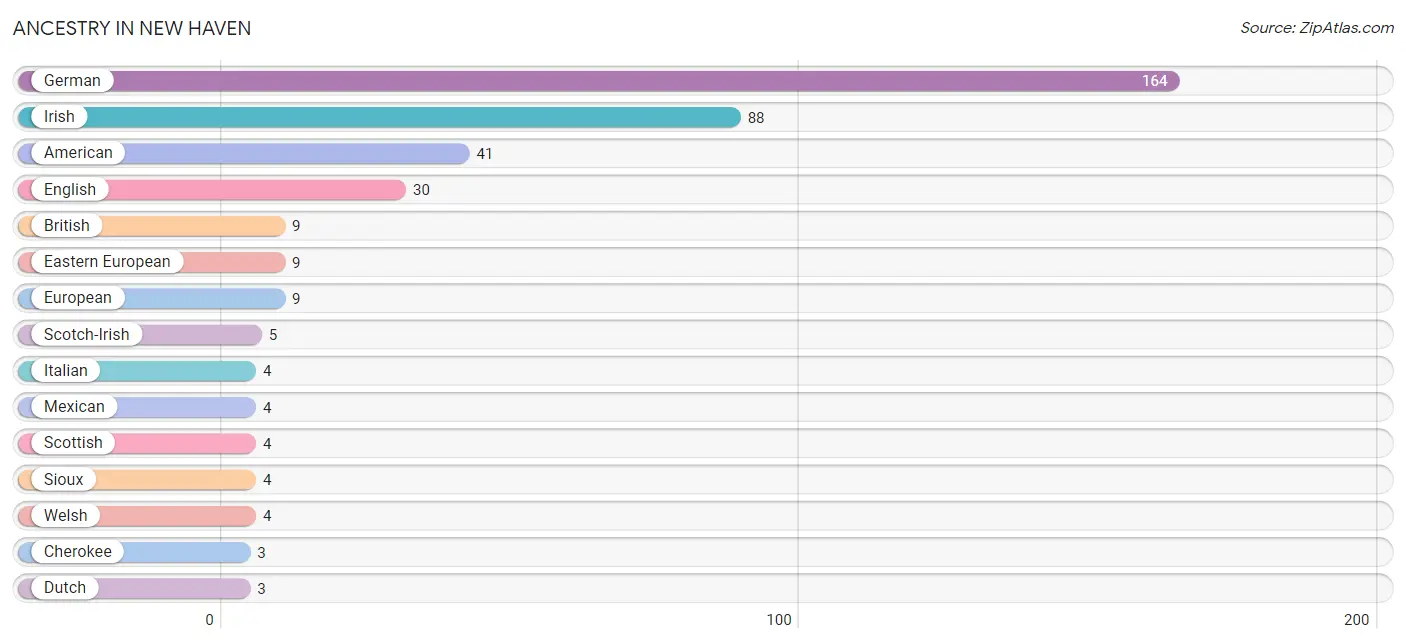
Ancestry in New Haven
The most populous ancestries reported in New Haven are German (164 | 33.8%), Irish (88 | 18.1%), American (41 | 8.5%), English (30 | 6.2%), and British (9 | 1.9%), together accounting for 68.4% of all New Haven residents.
| Ancestry | # Population | % Population |
| American | 41 | 8.5% |
| Austrian | 1 | 0.2% |
| British | 9 | 1.9% |
| Cherokee | 3 | 0.6% |
| Dutch | 3 | 0.6% |
| Eastern European | 9 | 1.9% |
| English | 30 | 6.2% |
| European | 9 | 1.9% |
| French | 2 | 0.4% |
| German | 164 | 33.8% |
| Irish | 88 | 18.1% |
| Italian | 4 | 0.8% |
| Mexican | 4 | 0.8% |
| Polish | 2 | 0.4% |
| Scotch-Irish | 5 | 1.0% |
| Scottish | 4 | 0.8% |
| Sioux | 4 | 0.8% |
| Welsh | 4 | 0.8% | View All 18 Rows |
Immigrants in New Haven

| Immigration Origin | # Population | % Population | View All 0 Rows |
Sex and Age in New Haven
Sex and Age in New Haven
The most populous age groups in New Haven are 20 to 24 Years (36 | 17.2%) for men and 20 to 24 Years (64 | 23.2%) for women.
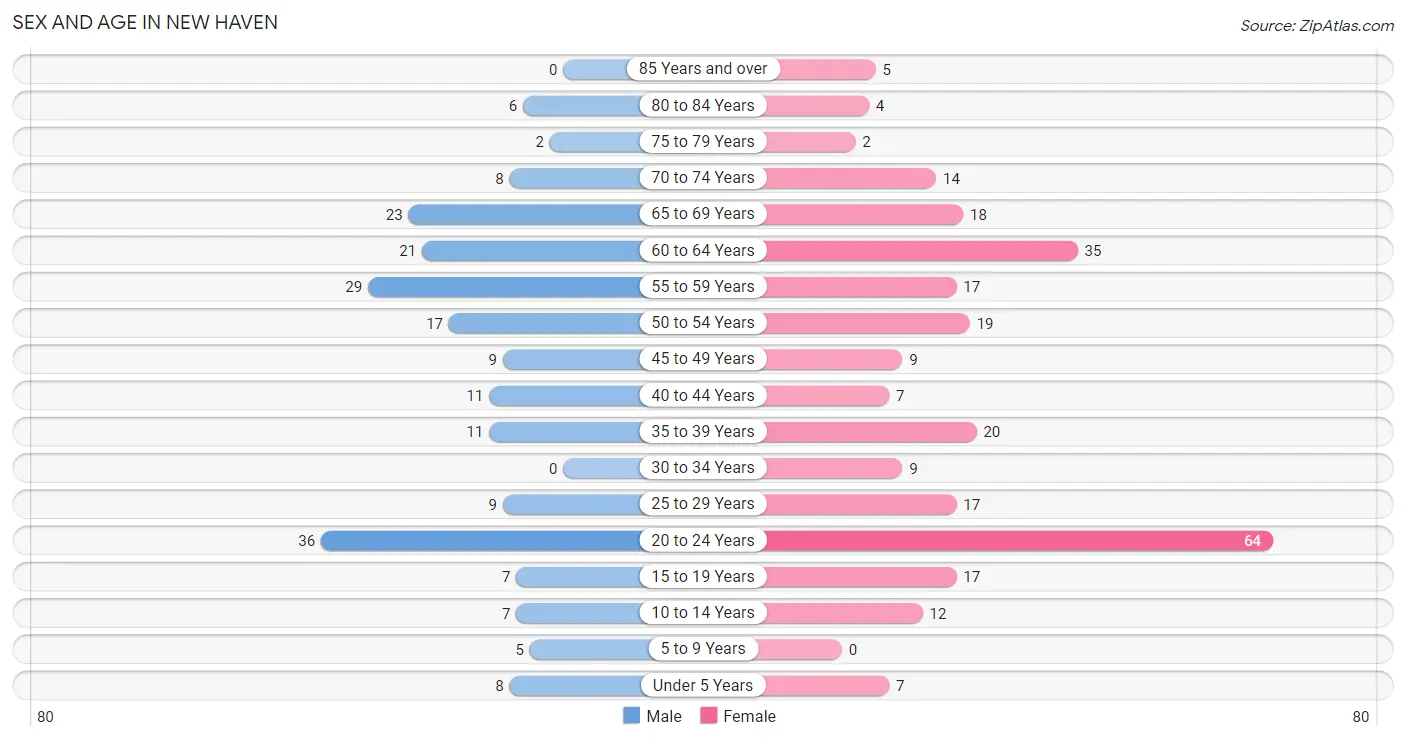
| Age Bracket | Male | Female |
| Under 5 Years | 8 (3.8%) | 7 (2.5%) |
| 5 to 9 Years | 5 (2.4%) | 0 (0.0%) |
| 10 to 14 Years | 7 (3.4%) | 12 (4.3%) |
| 15 to 19 Years | 7 (3.4%) | 17 (6.2%) |
| 20 to 24 Years | 36 (17.2%) | 64 (23.2%) |
| 25 to 29 Years | 9 (4.3%) | 17 (6.2%) |
| 30 to 34 Years | 0 (0.0%) | 9 (3.3%) |
| 35 to 39 Years | 11 (5.3%) | 20 (7.2%) |
| 40 to 44 Years | 11 (5.3%) | 7 (2.5%) |
| 45 to 49 Years | 9 (4.3%) | 9 (3.3%) |
| 50 to 54 Years | 17 (8.1%) | 19 (6.9%) |
| 55 to 59 Years | 29 (13.9%) | 17 (6.2%) |
| 60 to 64 Years | 21 (10.1%) | 35 (12.7%) |
| 65 to 69 Years | 23 (11.0%) | 18 (6.5%) |
| 70 to 74 Years | 8 (3.8%) | 14 (5.1%) |
| 75 to 79 Years | 2 (1.0%) | 2 (0.7%) |
| 80 to 84 Years | 6 (2.9%) | 4 (1.5%) |
| 85 Years and over | 0 (0.0%) | 5 (1.8%) |
| Total | 209 (100.0%) | 276 (100.0%) |
Families and Households in New Haven
Median Family Size in New Haven
The median family size in New Haven is 3.42 persons per family, with single female/mother families (9 | 8.5%) accounting for the largest median family size of 3.67 persons per family. On the other hand, single male/father families (1 | 0.9%) represent the smallest median family size with 2.00 persons per family.
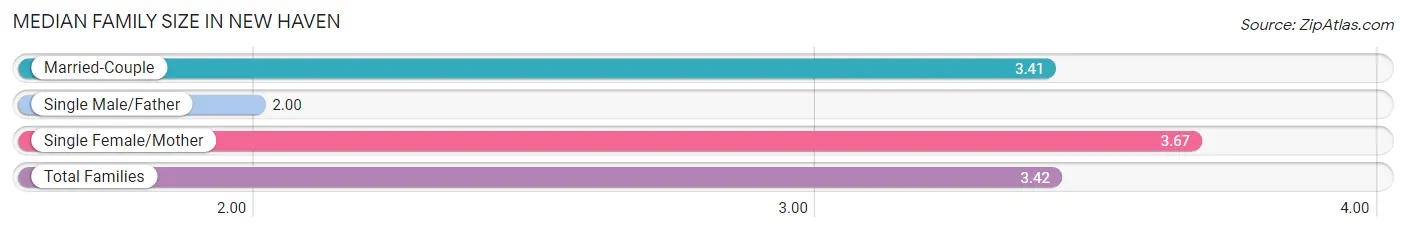
| Family Type | # Families | Family Size |
| Married-Couple | 96 (90.6%) | 3.41 |
| Single Male/Father | 1 (0.9%) | 2.00 |
| Single Female/Mother | 9 (8.5%) | 3.67 |
| Total Families | 106 (100.0%) | 3.42 |
Median Household Size in New Haven
The median household size in New Haven is 2.74 persons per household, with married-couple households (96 | 54.2%) accounting for the largest median household size of 3.75 persons per household. non-family households (71 | 40.1%) represent the smallest median household size with 1.27 persons per household.
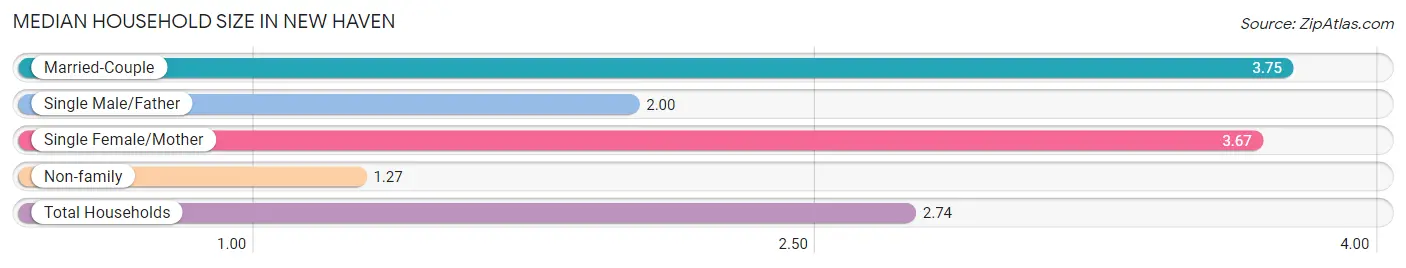
| Household Type | # Households | Household Size |
| Married-Couple | 96 (54.2%) | 3.75 |
| Single Male/Father | 1 (0.6%) | 2.00 |
| Single Female/Mother | 9 (5.1%) | 3.67 |
| Non-family | 71 (40.1%) | 1.27 |
| Total Households | 177 (100.0%) | 2.74 |
Household Size by Marriage Status in New Haven
Out of a total of 177 households in New Haven, 106 (59.9%) are family households, while 71 (40.1%) are nonfamily households. The most numerous type of family households are 2-person households, comprising 44, and the most common type of nonfamily households are 1-person households, comprising 50.
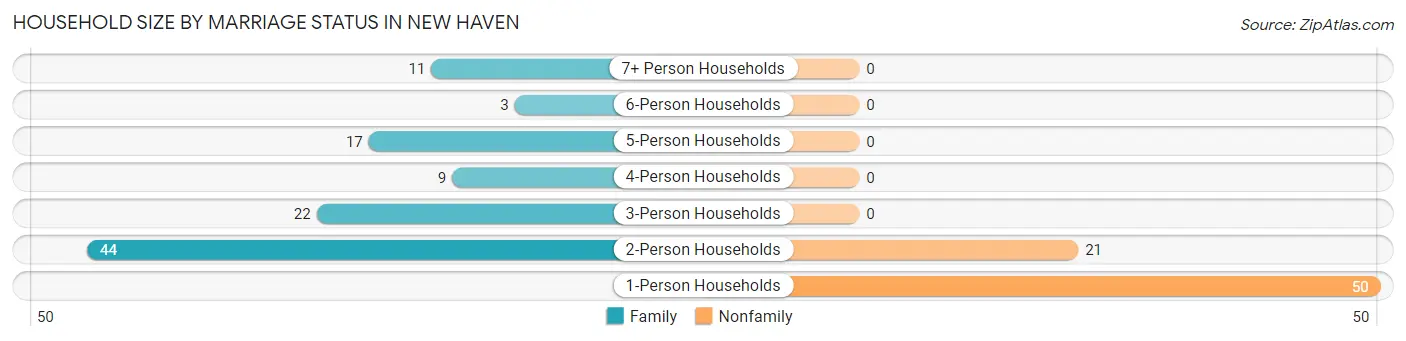
| Household Size | Family Households | Nonfamily Households |
| 1-Person Households | - | 50 (28.2%) |
| 2-Person Households | 44 (24.9%) | 21 (11.9%) |
| 3-Person Households | 22 (12.4%) | 0 (0.0%) |
| 4-Person Households | 9 (5.1%) | 0 (0.0%) |
| 5-Person Households | 17 (9.6%) | 0 (0.0%) |
| 6-Person Households | 3 (1.7%) | 0 (0.0%) |
| 7+ Person Households | 11 (6.2%) | 0 (0.0%) |
| Total | 106 (59.9%) | 71 (40.1%) |
Female Fertility in New Haven
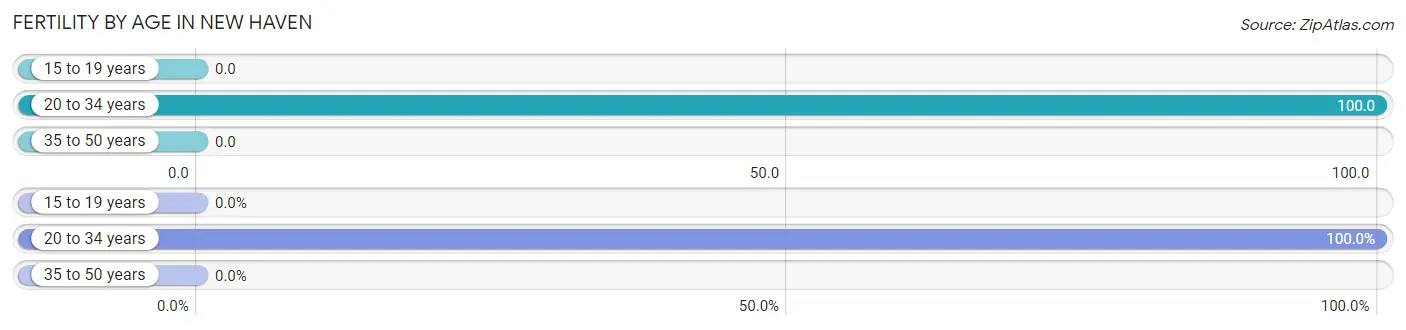
Fertility by Age in New Haven
Average fertility rate in New Haven is 63.0 births per 1,000 women. Women in the age bracket of 20 to 34 years have the highest fertility rate with 100.0 births per 1,000 women. Women in the age bracket of 20 to 34 years acount for 100.0% of all women with births.
| Age Bracket | Women with Births | Births / 1,000 Women |
| 15 to 19 years | 0 (0.0%) | 0.0 |
| 20 to 34 years | 9 (100.0%) | 100.0 |
| 35 to 50 years | 0 (0.0%) | 0.0 |
| Total | 9 (100.0%) | 63.0 |
Fertility by Age by Marriage Status in New Haven

| Age Bracket | Married | Unmarried |
| 15 to 19 years | 0 (0.0%) | 0 (0.0%) |
| 20 to 34 years | 0 (0.0%) | 9 (100.0%) |
| 35 to 50 years | 0 (0.0%) | 0 (0.0%) |
| Total | 0 (0.0%) | 9 (100.0%) |
Fertility by Education in New Haven
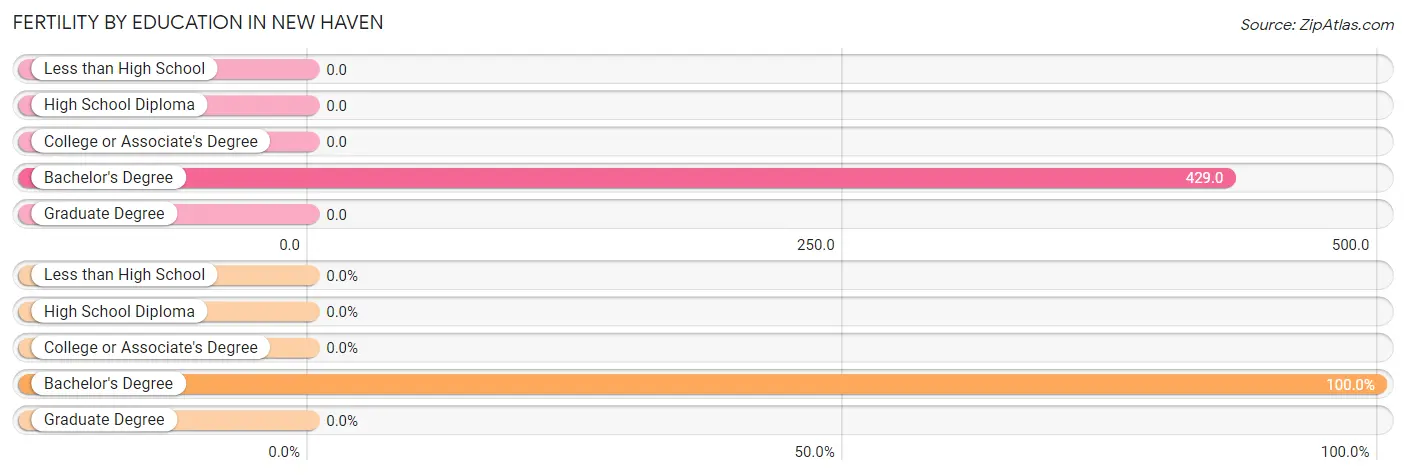
| Educational Attainment | Women with Births | Births / 1,000 Women |
| Less than High School | 0 (0.0%) | 0.0 |
| High School Diploma | 0 (0.0%) | 0.0 |
| College or Associate's Degree | 0 (0.0%) | 0.0 |
| Bachelor's Degree | 9 (100.0%) | 429.0 |
| Graduate Degree | 0 (0.0%) | 0.0 |
| Total | 9 (100.0%) | 63.0 |
Fertility by Education by Marriage Status in New Haven
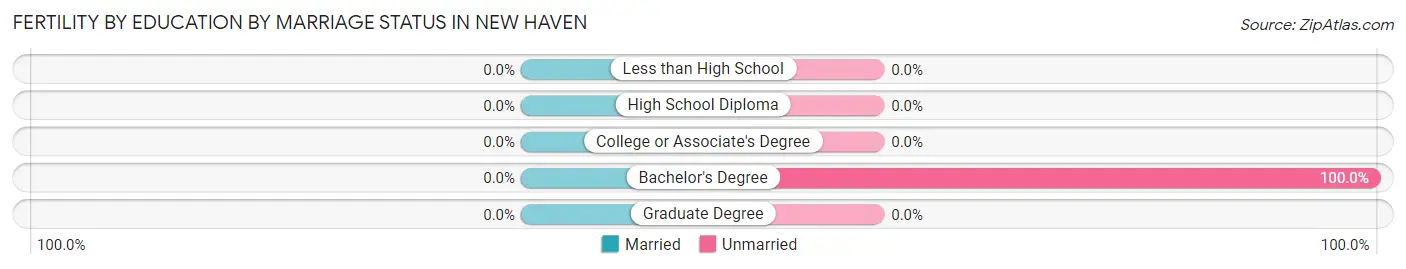
| Educational Attainment | Married | Unmarried |
| Less than High School | 0 (0.0%) | 0 (0.0%) |
| High School Diploma | 0 (0.0%) | 0 (0.0%) |
| College or Associate's Degree | 0 (0.0%) | 0 (0.0%) |
| Bachelor's Degree | 0 (0.0%) | 9 (100.0%) |
| Graduate Degree | 0 (0.0%) | 0 (0.0%) |
| Total | 0 (0.0%) | 9 (100.0%) |
Employment Characteristics in New Haven
Employment by Class of Employer in New Haven
Among the 155 employed individuals in New Haven, private company employees (108 | 69.7%), local government employees (16 | 10.3%), and state government employees (11 | 7.1%) make up the most common classes of employment.
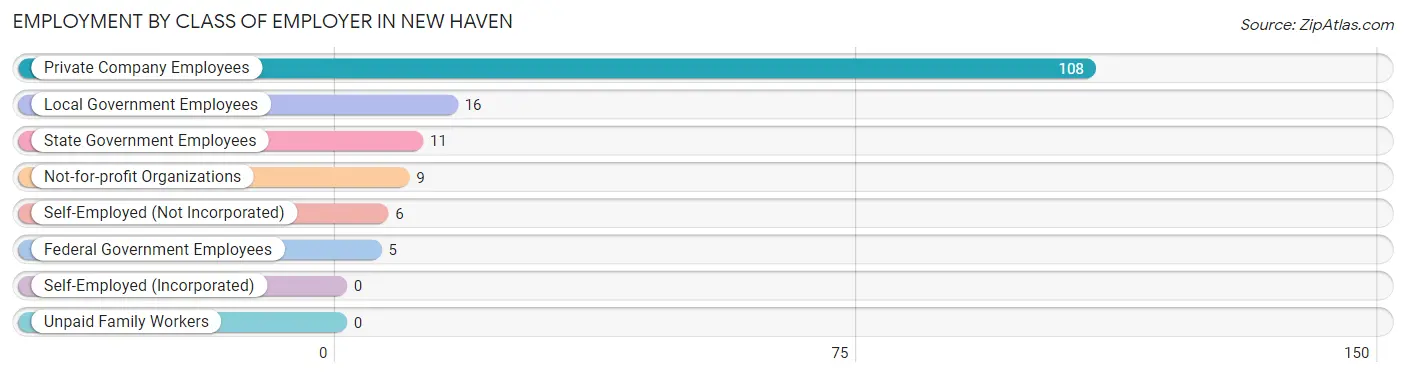
| Employer Class | # Employees | % Employees |
| Private Company Employees | 108 | 69.7% |
| Self-Employed (Incorporated) | 0 | 0.0% |
| Self-Employed (Not Incorporated) | 6 | 3.9% |
| Not-for-profit Organizations | 9 | 5.8% |
| Local Government Employees | 16 | 10.3% |
| State Government Employees | 11 | 7.1% |
| Federal Government Employees | 5 | 3.2% |
| Unpaid Family Workers | 0 | 0.0% |
| Total | 155 | 100.0% |
Employment Status by Age in New Haven
According to the labor force statistics for New Haven, out of the total population over 16 years of age (439), 62.4% or 274 individuals are in the labor force, with 39.4% or 108 of them unemployed. The age group with the highest labor force participation rate is 30 to 34 years, with 100.0% or 9 individuals in the labor force. Within the labor force, the 20 to 24 years age range has the highest percentage of unemployed individuals, with 95.7% or 88 of them being unemployed.
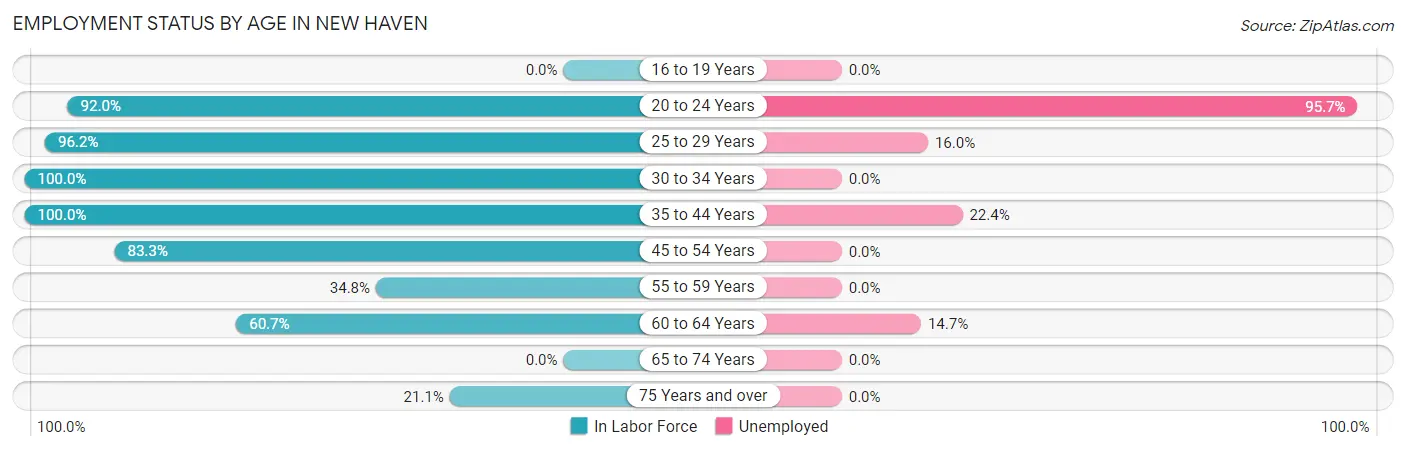
| Age Bracket | In Labor Force | Unemployed |
| 16 to 19 Years | 0 (0.0%) | 0 (0.0%) |
| 20 to 24 Years | 92 (92.0%) | 88 (95.7%) |
| 25 to 29 Years | 25 (96.2%) | 4 (16.0%) |
| 30 to 34 Years | 9 (100.0%) | 0 (0.0%) |
| 35 to 44 Years | 49 (100.0%) | 11 (22.4%) |
| 45 to 54 Years | 45 (83.3%) | 0 (0.0%) |
| 55 to 59 Years | 16 (34.8%) | 0 (0.0%) |
| 60 to 64 Years | 34 (60.7%) | 5 (14.7%) |
| 65 to 74 Years | 0 (0.0%) | 0 (0.0%) |
| 75 Years and over | 4 (21.1%) | 0 (0.0%) |
| Total | 274 (62.4%) | 108 (39.4%) |
Employment Status by Educational Attainment in New Haven
According to labor force statistics for New Haven, 74.2% of individuals (178) out of the total population between 25 and 64 years of age (240) are in the labor force, with 11.2% or 20 of them being unemployed. The group with the highest labor force participation rate are those with the educational attainment of bachelor's degree or higher, with 100.0% or 24 individuals in the labor force. Within the labor force, individuals with college / associate degree education have the highest percentage of unemployment, with 13.8% or 8 of them being unemployed.
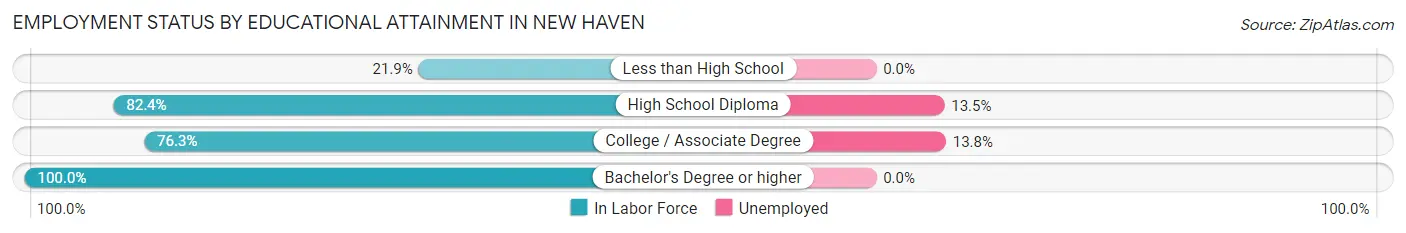
| Educational Attainment | In Labor Force | Unemployed |
| Less than High School | 7 (21.9%) | 0 (0.0%) |
| High School Diploma | 89 (82.4%) | 15 (13.5%) |
| College / Associate Degree | 58 (76.3%) | 10 (13.8%) |
| Bachelor's Degree or higher | 24 (100.0%) | 0 (0.0%) |
| Total | 178 (74.2%) | 27 (11.2%) |
Employment Occupations by Sex in New Haven
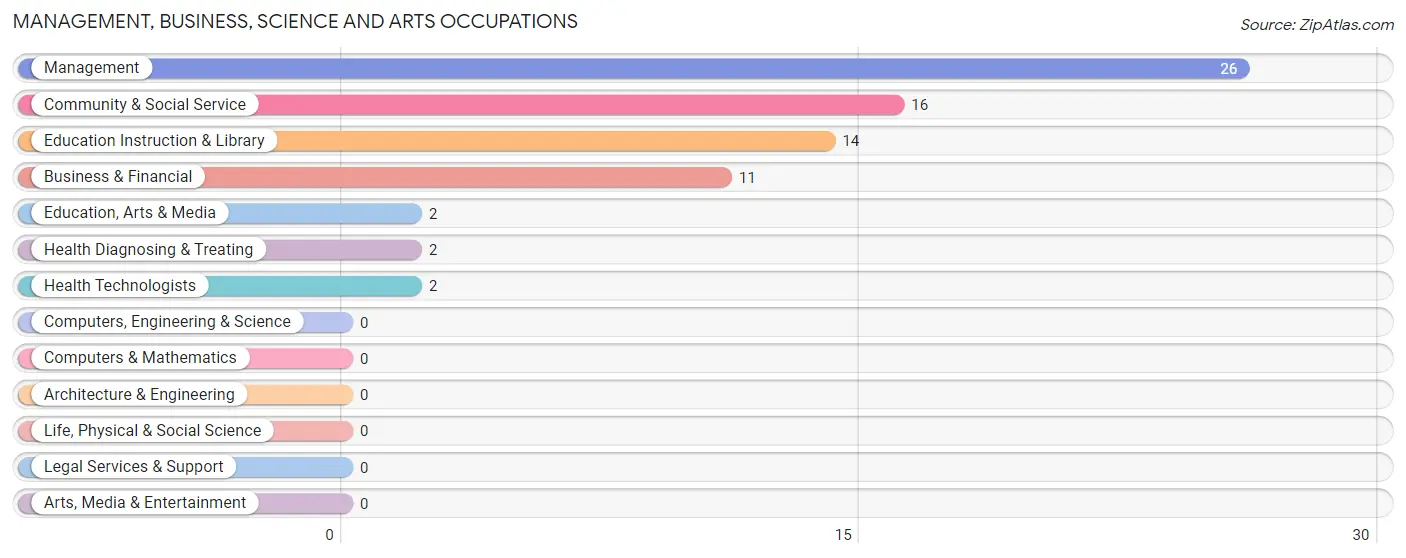
Management, Business, Science and Arts Occupations
The most common Management, Business, Science and Arts occupations in New Haven are Management (26 | 15.7%), Community & Social Service (16 | 9.6%), Education Instruction & Library (14 | 8.4%), Business & Financial (11 | 6.6%), and Education, Arts & Media (2 | 1.2%).
Management, Business, Science and Arts Occupations by Sex
Within the Management, Business, Science and Arts occupations in New Haven, the most male-oriented occupations are Education Instruction & Library (21.4%), Management (19.2%), and Community & Social Service (18.8%), while the most female-oriented occupations are Business & Financial (100.0%), Education, Arts & Media (100.0%), and Health Diagnosing & Treating (100.0%).
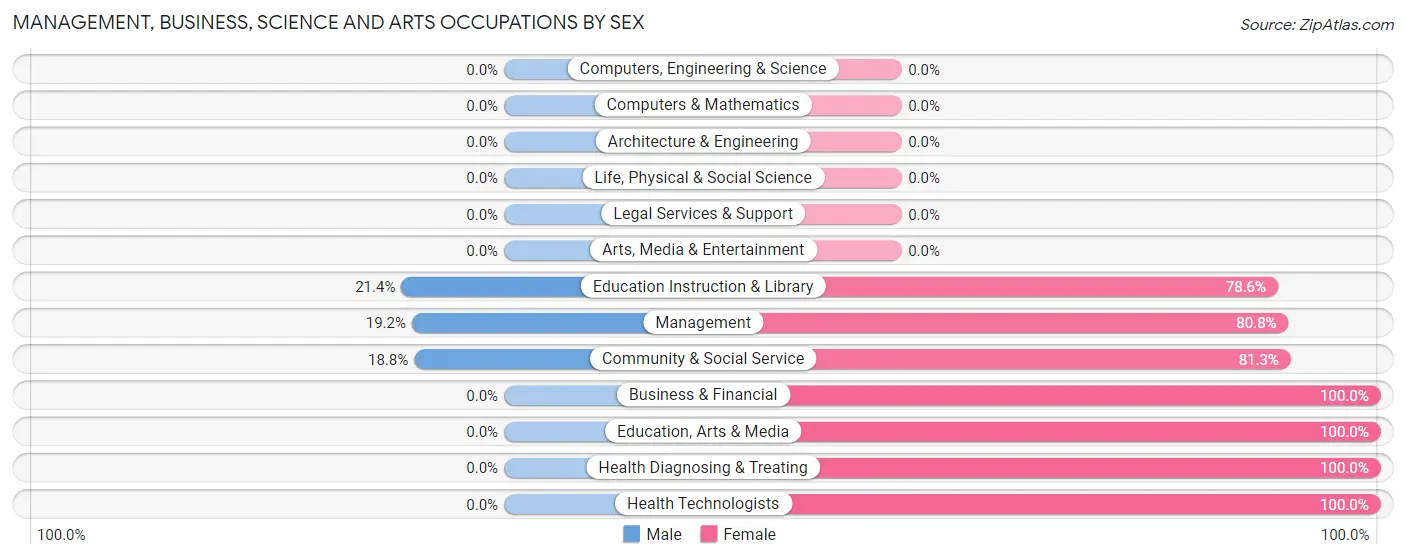
| Occupation | Male | Female |
| Management | 5 (19.2%) | 21 (80.8%) |
| Business & Financial | 0 (0.0%) | 11 (100.0%) |
| Computers, Engineering & Science | 0 (0.0%) | 0 (0.0%) |
| Computers & Mathematics | 0 (0.0%) | 0 (0.0%) |
| Architecture & Engineering | 0 (0.0%) | 0 (0.0%) |
| Life, Physical & Social Science | 0 (0.0%) | 0 (0.0%) |
| Community & Social Service | 3 (18.8%) | 13 (81.2%) |
| Education, Arts & Media | 0 (0.0%) | 2 (100.0%) |
| Legal Services & Support | 0 (0.0%) | 0 (0.0%) |
| Education Instruction & Library | 3 (21.4%) | 11 (78.6%) |
| Arts, Media & Entertainment | 0 (0.0%) | 0 (0.0%) |
| Health Diagnosing & Treating | 0 (0.0%) | 2 (100.0%) |
| Health Technologists | 0 (0.0%) | 2 (100.0%) |
| Total (Category) | 8 (14.5%) | 47 (85.5%) |
| Total (Overall) | 69 (41.6%) | 97 (58.4%) |
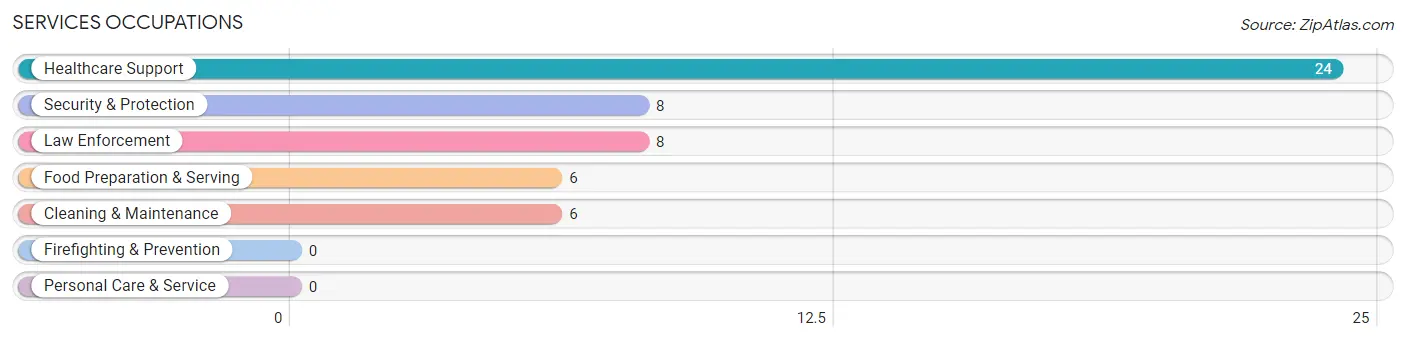
Services Occupations
The most common Services occupations in New Haven are Healthcare Support (24 | 14.5%), Security & Protection (8 | 4.8%), Law Enforcement (8 | 4.8%), Food Preparation & Serving (6 | 3.6%), and Cleaning & Maintenance (6 | 3.6%).
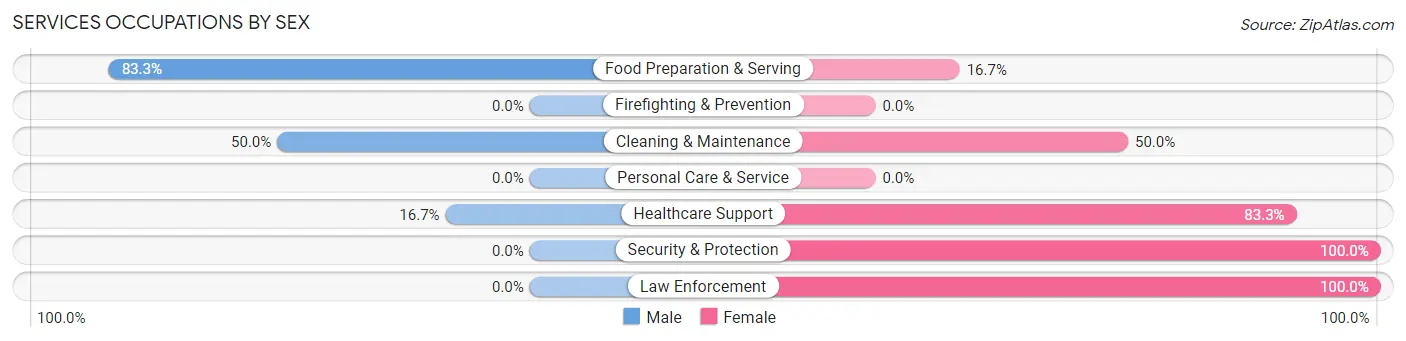
Services Occupations by Sex
Within the Services occupations in New Haven, the most male-oriented occupations are Food Preparation & Serving (83.3%), Cleaning & Maintenance (50.0%), and Healthcare Support (16.7%), while the most female-oriented occupations are Security & Protection (100.0%), Law Enforcement (100.0%), and Healthcare Support (83.3%).
| Occupation | Male | Female |
| Healthcare Support | 4 (16.7%) | 20 (83.3%) |
| Security & Protection | 0 (0.0%) | 8 (100.0%) |
| Firefighting & Prevention | 0 (0.0%) | 0 (0.0%) |
| Law Enforcement | 0 (0.0%) | 8 (100.0%) |
| Food Preparation & Serving | 5 (83.3%) | 1 (16.7%) |
| Cleaning & Maintenance | 3 (50.0%) | 3 (50.0%) |
| Personal Care & Service | 0 (0.0%) | 0 (0.0%) |
| Total (Category) | 12 (27.3%) | 32 (72.7%) |
| Total (Overall) | 69 (41.6%) | 97 (58.4%) |
Sales and Office Occupations
The most common Sales and Office occupations in New Haven are Office & Administration (17 | 10.2%), and Sales & Related (8 | 4.8%).

Sales and Office Occupations by Sex

| Occupation | Male | Female |
| Sales & Related | 0 (0.0%) | 8 (100.0%) |
| Office & Administration | 8 (47.1%) | 9 (52.9%) |
| Total (Category) | 8 (32.0%) | 17 (68.0%) |
| Total (Overall) | 69 (41.6%) | 97 (58.4%) |
Natural Resources, Construction and Maintenance Occupations
The most common Natural Resources, Construction and Maintenance occupations in New Haven are Installation, Maintenance & Repair (5 | 3.0%), and Farming, Fishing & Forestry (2 | 1.2%).

Natural Resources, Construction and Maintenance Occupations by Sex

| Occupation | Male | Female |
| Farming, Fishing & Forestry | 2 (100.0%) | 0 (0.0%) |
| Construction & Extraction | 0 (0.0%) | 0 (0.0%) |
| Installation, Maintenance & Repair | 5 (100.0%) | 0 (0.0%) |
| Total (Category) | 7 (100.0%) | 0 (0.0%) |
| Total (Overall) | 69 (41.6%) | 97 (58.4%) |
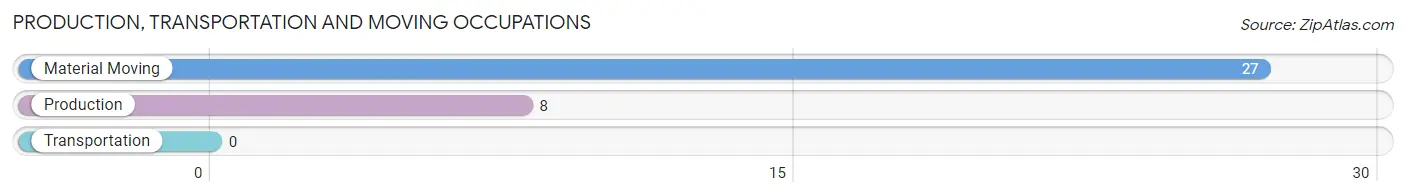
Production, Transportation and Moving Occupations
The most common Production, Transportation and Moving occupations in New Haven are Material Moving (27 | 16.3%), and Production (8 | 4.8%).
Production, Transportation and Moving Occupations by Sex
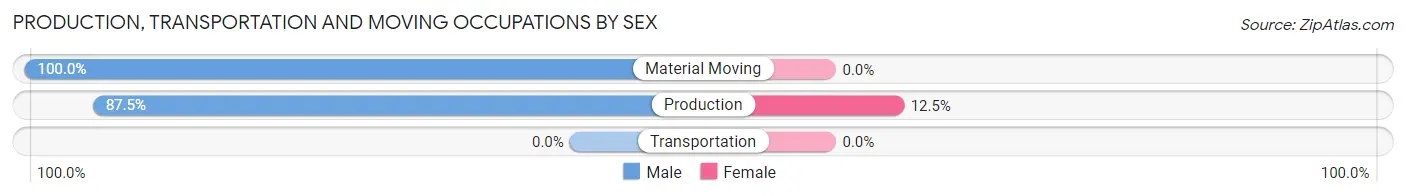
| Occupation | Male | Female |
| Production | 7 (87.5%) | 1 (12.5%) |
| Transportation | 0 (0.0%) | 0 (0.0%) |
| Material Moving | 27 (100.0%) | 0 (0.0%) |
| Total (Category) | 34 (97.1%) | 1 (2.9%) |
| Total (Overall) | 69 (41.6%) | 97 (58.4%) |
Employment Industries by Sex in New Haven
Employment Industries in New Haven
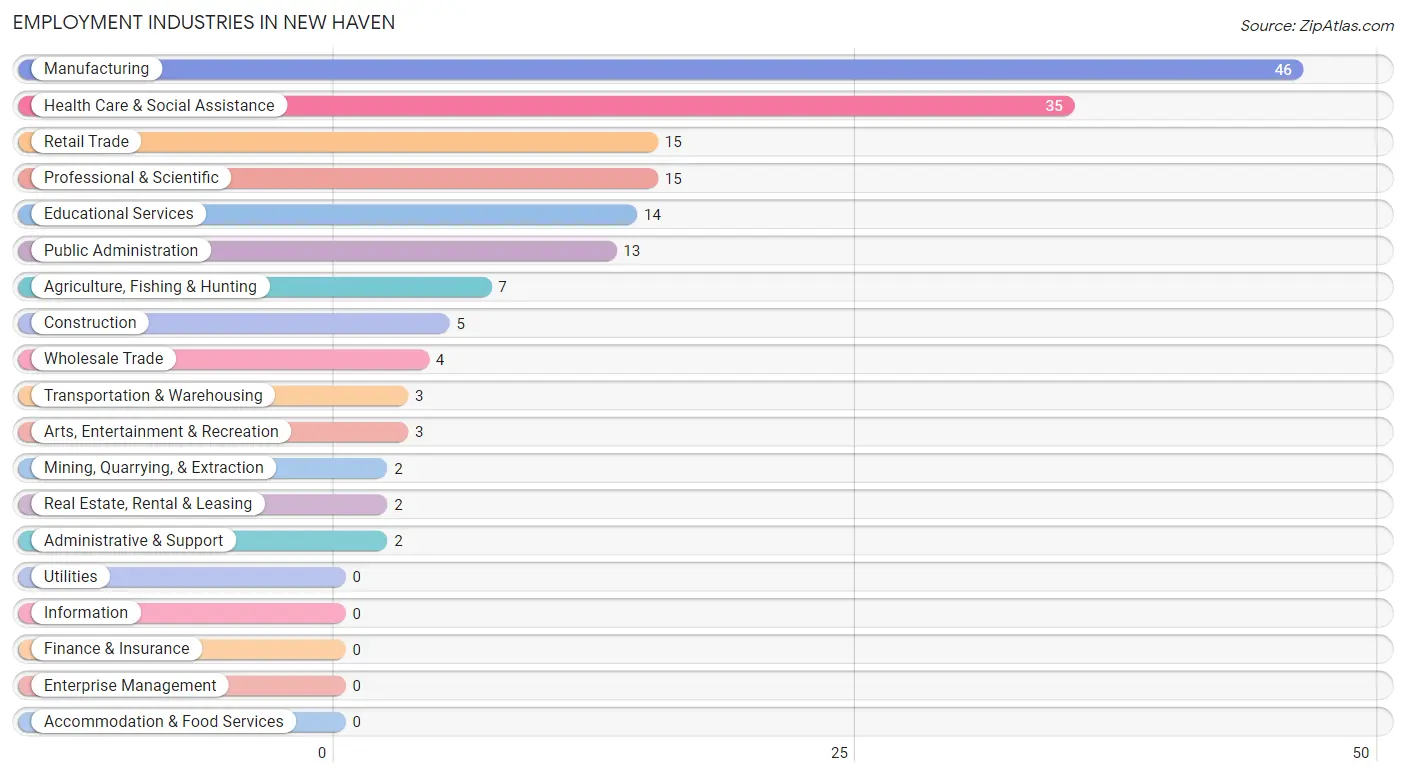
The major employment industries in New Haven include Manufacturing (46 | 27.7%), Health Care & Social Assistance (35 | 21.1%), Retail Trade (15 | 9.0%), Professional & Scientific (15 | 9.0%), and Educational Services (14 | 8.4%).
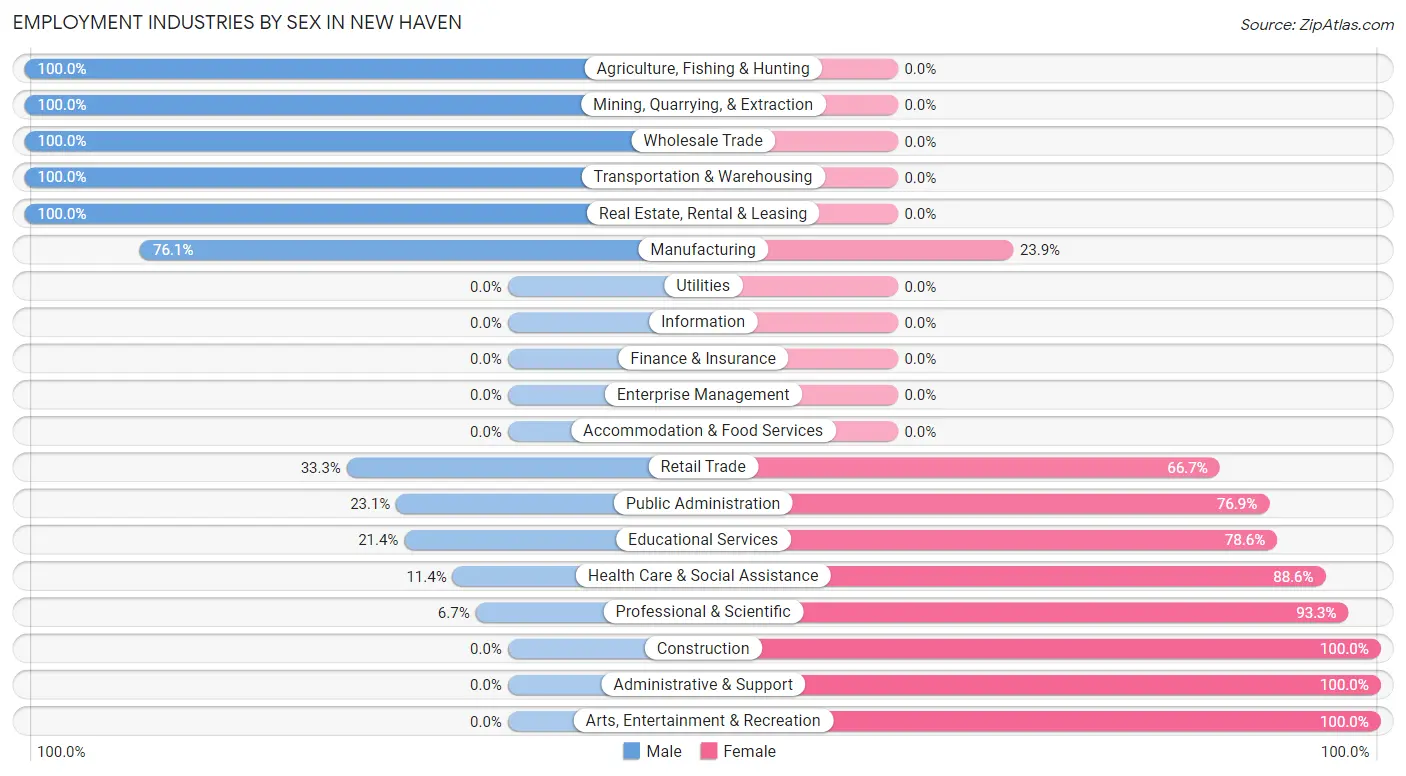
Employment Industries by Sex in New Haven
The New Haven industries that see more men than women are Agriculture, Fishing & Hunting (100.0%), Mining, Quarrying, & Extraction (100.0%), and Wholesale Trade (100.0%), whereas the industries that tend to have a higher number of women are Construction (100.0%), Administrative & Support (100.0%), and Arts, Entertainment & Recreation (100.0%).
| Industry | Male | Female |
| Agriculture, Fishing & Hunting | 7 (100.0%) | 0 (0.0%) |
| Mining, Quarrying, & Extraction | 2 (100.0%) | 0 (0.0%) |
| Construction | 0 (0.0%) | 5 (100.0%) |
| Manufacturing | 35 (76.1%) | 11 (23.9%) |
| Wholesale Trade | 4 (100.0%) | 0 (0.0%) |
| Retail Trade | 5 (33.3%) | 10 (66.7%) |
| Transportation & Warehousing | 3 (100.0%) | 0 (0.0%) |
| Utilities | 0 (0.0%) | 0 (0.0%) |
| Information | 0 (0.0%) | 0 (0.0%) |
| Finance & Insurance | 0 (0.0%) | 0 (0.0%) |
| Real Estate, Rental & Leasing | 2 (100.0%) | 0 (0.0%) |
| Professional & Scientific | 1 (6.7%) | 14 (93.3%) |
| Enterprise Management | 0 (0.0%) | 0 (0.0%) |
| Administrative & Support | 0 (0.0%) | 2 (100.0%) |
| Educational Services | 3 (21.4%) | 11 (78.6%) |
| Health Care & Social Assistance | 4 (11.4%) | 31 (88.6%) |
| Arts, Entertainment & Recreation | 0 (0.0%) | 3 (100.0%) |
| Accommodation & Food Services | 0 (0.0%) | 0 (0.0%) |
| Public Administration | 3 (23.1%) | 10 (76.9%) |
| Total | 69 (41.6%) | 97 (58.4%) |
Education in New Haven
School Enrollment in New Haven
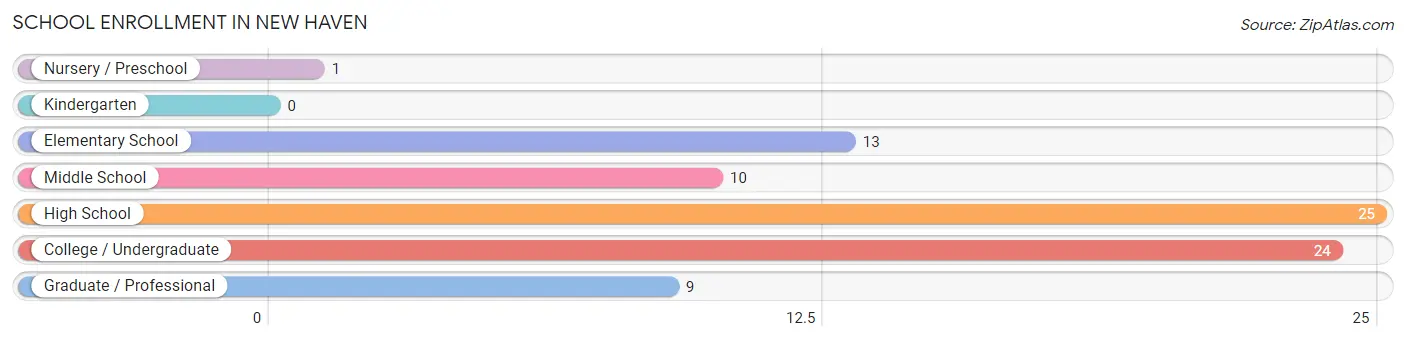
The most common levels of schooling among the 82 students in New Haven are high school (25 | 30.5%), college / undergraduate (24 | 29.3%), and elementary school (13 | 15.9%).
| School Level | # Students | % Students |
| Nursery / Preschool | 1 | 1.2% |
| Kindergarten | 0 | 0.0% |
| Elementary School | 13 | 15.9% |
| Middle School | 10 | 12.2% |
| High School | 25 | 30.5% |
| College / Undergraduate | 24 | 29.3% |
| Graduate / Professional | 9 | 11.0% |
| Total | 82 | 100.0% |
School Enrollment by Age by Funding Source in New Haven
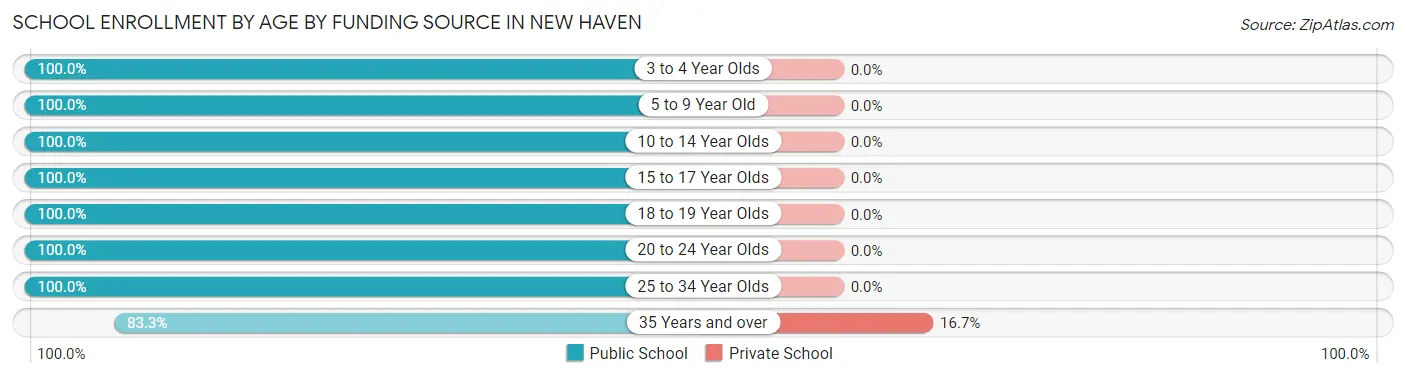
Out of a total of 82 students who are enrolled in schools in New Haven, 3 (3.7%) attend a private institution, while the remaining 79 (96.3%) are enrolled in public schools. The age group of 35 years and over has the highest likelihood of being enrolled in private schools, with 3 (16.7% in the age bracket) enrolled. Conversely, the age group of 3 to 4 year olds has the lowest likelihood of being enrolled in a private school, with 1 (100.0% in the age bracket) attending a public institution.
| Age Bracket | Public School | Private School |
| 3 to 4 Year Olds | 1 (100.0%) | 0 (0.0%) |
| 5 to 9 Year Old | 5 (100.0%) | 0 (0.0%) |
| 10 to 14 Year Olds | 19 (100.0%) | 0 (0.0%) |
| 15 to 17 Year Olds | 22 (100.0%) | 0 (0.0%) |
| 18 to 19 Year Olds | 2 (100.0%) | 0 (0.0%) |
| 20 to 24 Year Olds | 6 (100.0%) | 0 (0.0%) |
| 25 to 34 Year Olds | 9 (100.0%) | 0 (0.0%) |
| 35 Years and over | 15 (83.3%) | 3 (16.7%) |
| Total | 79 (96.3%) | 3 (3.7%) |
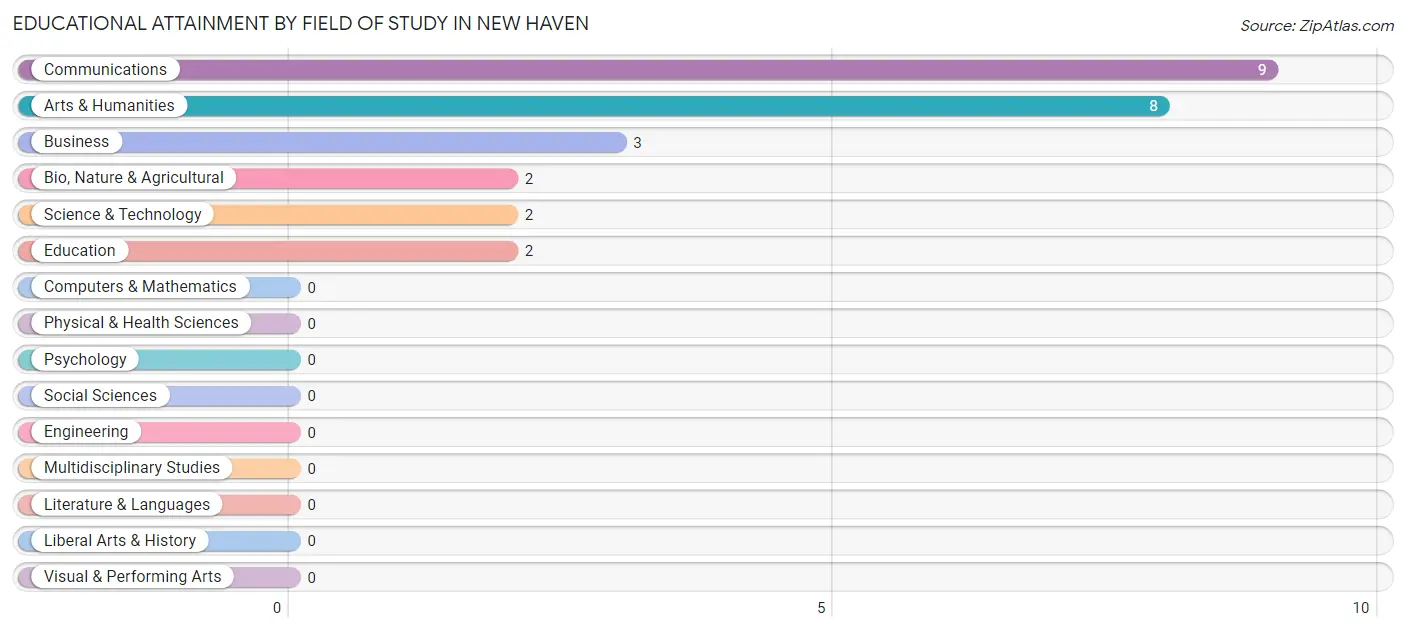
Educational Attainment by Field of Study in New Haven
Communications (9 | 34.6%), arts & humanities (8 | 30.8%), business (3 | 11.5%), bio, nature & agricultural (2 | 7.7%), and science & technology (2 | 7.7%) are the most common fields of study among 26 individuals in New Haven who have obtained a bachelor's degree or higher.
| Field of Study | # Graduates | % Graduates |
| Computers & Mathematics | 0 | 0.0% |
| Bio, Nature & Agricultural | 2 | 7.7% |
| Physical & Health Sciences | 0 | 0.0% |
| Psychology | 0 | 0.0% |
| Social Sciences | 0 | 0.0% |
| Engineering | 0 | 0.0% |
| Multidisciplinary Studies | 0 | 0.0% |
| Science & Technology | 2 | 7.7% |
| Business | 3 | 11.5% |
| Education | 2 | 7.7% |
| Literature & Languages | 0 | 0.0% |
| Liberal Arts & History | 0 | 0.0% |
| Visual & Performing Arts | 0 | 0.0% |
| Communications | 9 | 34.6% |
| Arts & Humanities | 8 | 30.8% |
| Total | 26 | 100.0% |
Transportation & Commute in New Haven
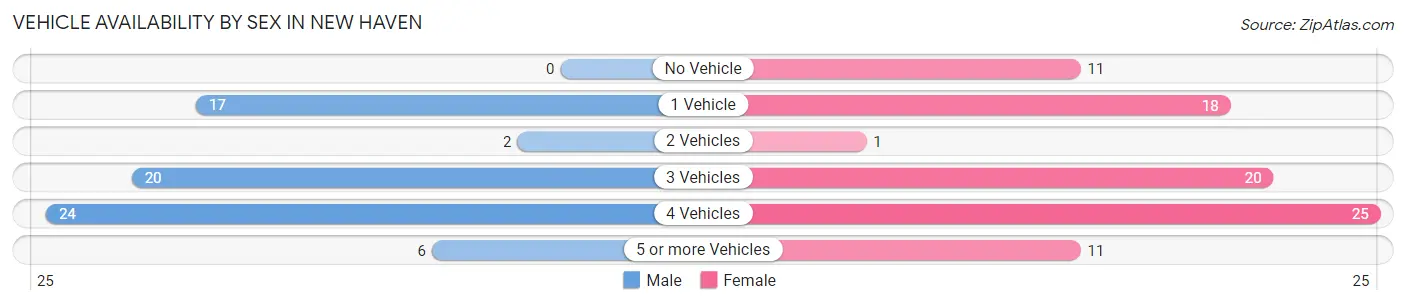
Vehicle Availability by Sex in New Haven
The most prevalent vehicle ownership categories in New Haven are males with 4 vehicles (24, accounting for 34.8%) and females with 4 vehicles (25, making up 27.9%).
| Vehicles Available | Male | Female |
| No Vehicle | 0 (0.0%) | 11 (12.8%) |
| 1 Vehicle | 17 (24.6%) | 18 (20.9%) |
| 2 Vehicles | 2 (2.9%) | 1 (1.2%) |
| 3 Vehicles | 20 (29.0%) | 20 (23.3%) |
| 4 Vehicles | 24 (34.8%) | 25 (29.1%) |
| 5 or more Vehicles | 6 (8.7%) | 11 (12.8%) |
| Total | 69 (100.0%) | 86 (100.0%) |
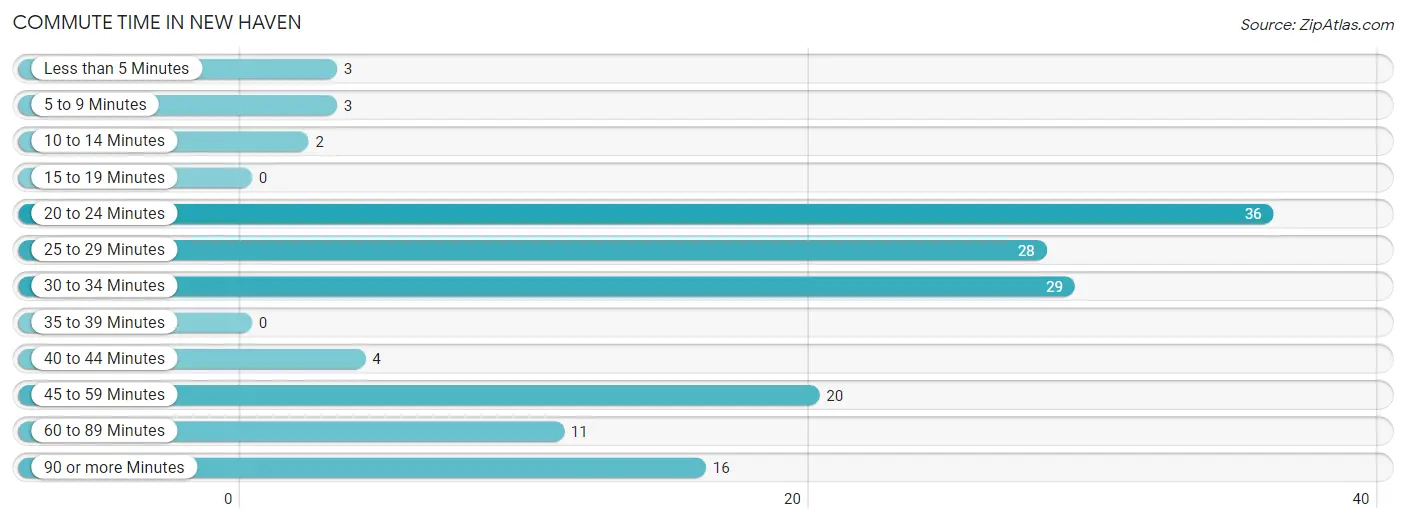
Commute Time in New Haven
The most frequently occuring commute durations in New Haven are 20 to 24 minutes (36 commuters, 23.7%), 30 to 34 minutes (29 commuters, 19.1%), and 25 to 29 minutes (28 commuters, 18.4%).
| Commute Time | # Commuters | % Commuters |
| Less than 5 Minutes | 3 | 2.0% |
| 5 to 9 Minutes | 3 | 2.0% |
| 10 to 14 Minutes | 2 | 1.3% |
| 15 to 19 Minutes | 0 | 0.0% |
| 20 to 24 Minutes | 36 | 23.7% |
| 25 to 29 Minutes | 28 | 18.4% |
| 30 to 34 Minutes | 29 | 19.1% |
| 35 to 39 Minutes | 0 | 0.0% |
| 40 to 44 Minutes | 4 | 2.6% |
| 45 to 59 Minutes | 20 | 13.2% |
| 60 to 89 Minutes | 11 | 7.2% |
| 90 or more Minutes | 16 | 10.5% |
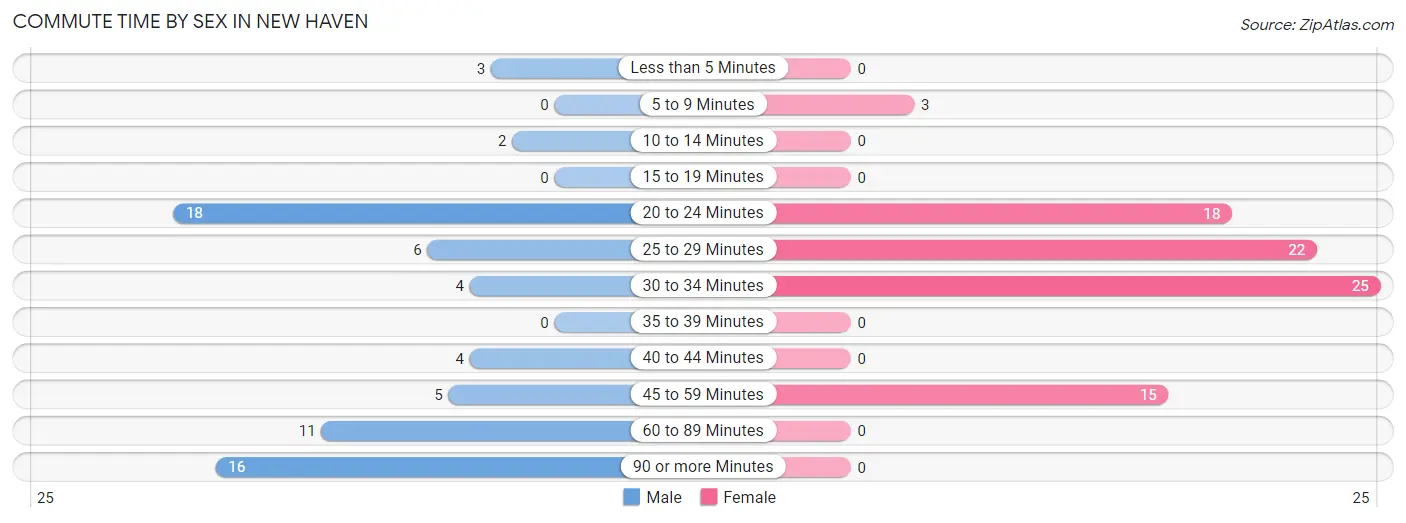
Commute Time by Sex in New Haven
The most common commute times in New Haven are 20 to 24 minutes (18 commuters, 26.1%) for males and 30 to 34 minutes (25 commuters, 30.1%) for females.
| Commute Time | Male | Female |
| Less than 5 Minutes | 3 (4.3%) | 0 (0.0%) |
| 5 to 9 Minutes | 0 (0.0%) | 3 (3.6%) |
| 10 to 14 Minutes | 2 (2.9%) | 0 (0.0%) |
| 15 to 19 Minutes | 0 (0.0%) | 0 (0.0%) |
| 20 to 24 Minutes | 18 (26.1%) | 18 (21.7%) |
| 25 to 29 Minutes | 6 (8.7%) | 22 (26.5%) |
| 30 to 34 Minutes | 4 (5.8%) | 25 (30.1%) |
| 35 to 39 Minutes | 0 (0.0%) | 0 (0.0%) |
| 40 to 44 Minutes | 4 (5.8%) | 0 (0.0%) |
| 45 to 59 Minutes | 5 (7.2%) | 15 (18.1%) |
| 60 to 89 Minutes | 11 (15.9%) | 0 (0.0%) |
| 90 or more Minutes | 16 (23.2%) | 0 (0.0%) |
Time of Departure to Work by Sex in New Haven
The most frequent times of departure to work in New Haven are 12:00 AM to 4:59 AM (25, 36.2%) for males and 12:00 PM to 3:59 PM (24, 28.9%) for females.
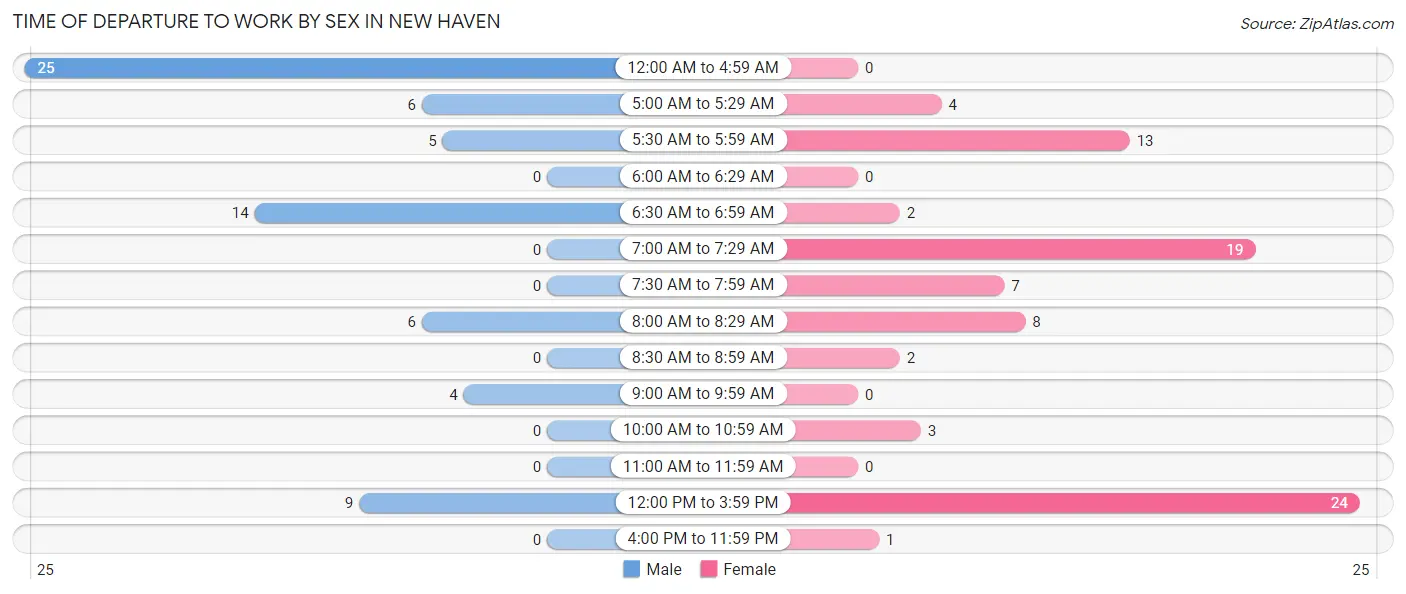
| Time of Departure | Male | Female |
| 12:00 AM to 4:59 AM | 25 (36.2%) | 0 (0.0%) |
| 5:00 AM to 5:29 AM | 6 (8.7%) | 4 (4.8%) |
| 5:30 AM to 5:59 AM | 5 (7.2%) | 13 (15.7%) |
| 6:00 AM to 6:29 AM | 0 (0.0%) | 0 (0.0%) |
| 6:30 AM to 6:59 AM | 14 (20.3%) | 2 (2.4%) |
| 7:00 AM to 7:29 AM | 0 (0.0%) | 19 (22.9%) |
| 7:30 AM to 7:59 AM | 0 (0.0%) | 7 (8.4%) |
| 8:00 AM to 8:29 AM | 6 (8.7%) | 8 (9.6%) |
| 8:30 AM to 8:59 AM | 0 (0.0%) | 2 (2.4%) |
| 9:00 AM to 9:59 AM | 4 (5.8%) | 0 (0.0%) |
| 10:00 AM to 10:59 AM | 0 (0.0%) | 3 (3.6%) |
| 11:00 AM to 11:59 AM | 0 (0.0%) | 0 (0.0%) |
| 12:00 PM to 3:59 PM | 9 (13.0%) | 24 (28.9%) |
| 4:00 PM to 11:59 PM | 0 (0.0%) | 1 (1.2%) |
| Total | 69 (100.0%) | 83 (100.0%) |
Housing Occupancy in New Haven
Occupancy by Ownership in New Haven
Of the total 177 dwellings in New Haven, owner-occupied units account for 120 (67.8%), while renter-occupied units make up 57 (32.2%).
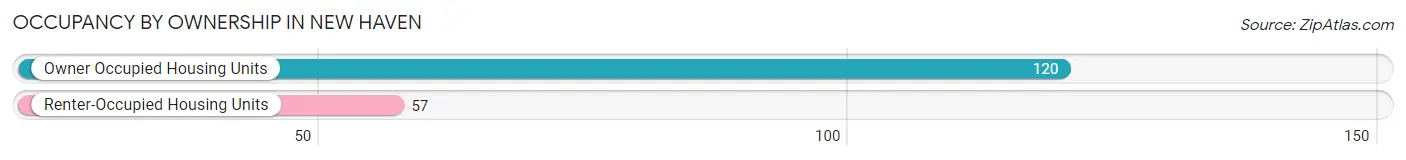
| Occupancy | # Housing Units | % Housing Units |
| Owner Occupied Housing Units | 120 | 67.8% |
| Renter-Occupied Housing Units | 57 | 32.2% |
| Total Occupied Housing Units | 177 | 100.0% |
Occupancy by Household Size in New Haven
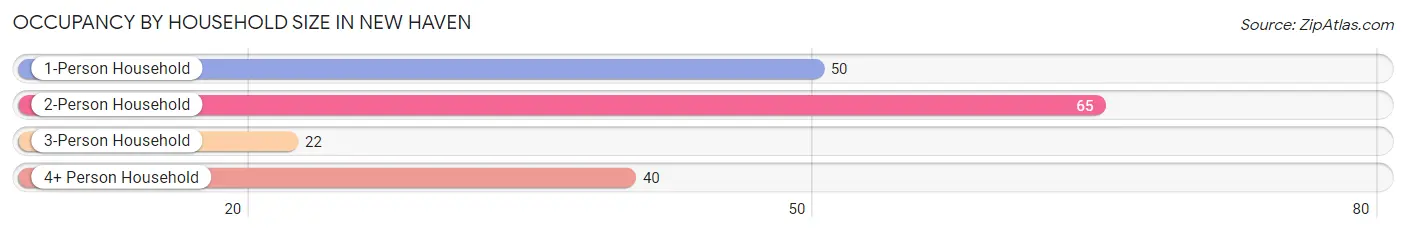
| Household Size | # Housing Units | % Housing Units |
| 1-Person Household | 50 | 28.2% |
| 2-Person Household | 65 | 36.7% |
| 3-Person Household | 22 | 12.4% |
| 4+ Person Household | 40 | 22.6% |
| Total Housing Units | 177 | 100.0% |
Occupancy by Ownership by Household Size in New Haven
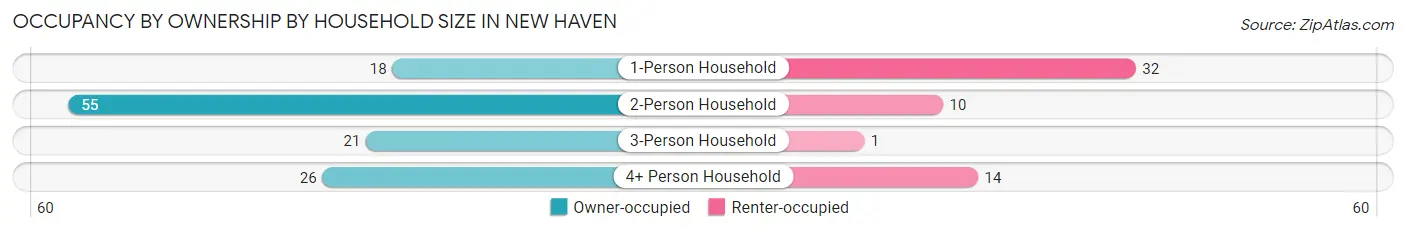
| Household Size | Owner-occupied | Renter-occupied |
| 1-Person Household | 18 (36.0%) | 32 (64.0%) |
| 2-Person Household | 55 (84.6%) | 10 (15.4%) |
| 3-Person Household | 21 (95.5%) | 1 (4.5%) |
| 4+ Person Household | 26 (65.0%) | 14 (35.0%) |
| Total Housing Units | 120 (67.8%) | 57 (32.2%) |
Occupancy by Educational Attainment in New Haven
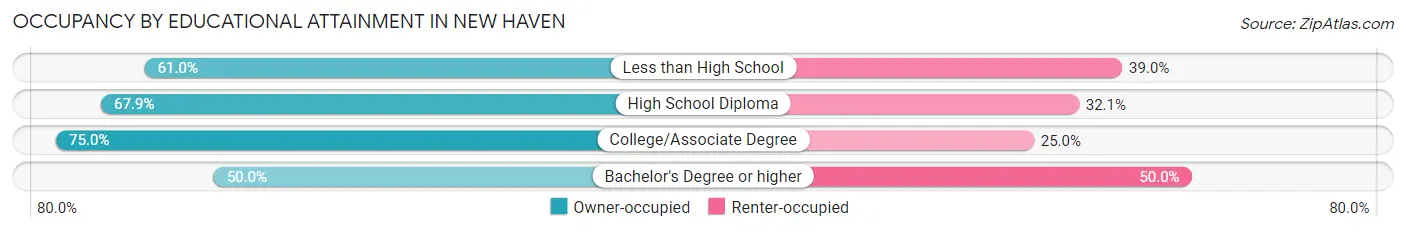
| Household Size | Owner-occupied | Renter-occupied |
| Less than High School | 25 (61.0%) | 16 (39.0%) |
| High School Diploma | 57 (67.9%) | 27 (32.1%) |
| College/Associate Degree | 36 (75.0%) | 12 (25.0%) |
| Bachelor's Degree or higher | 2 (50.0%) | 2 (50.0%) |
Occupancy by Age of Householder in New Haven
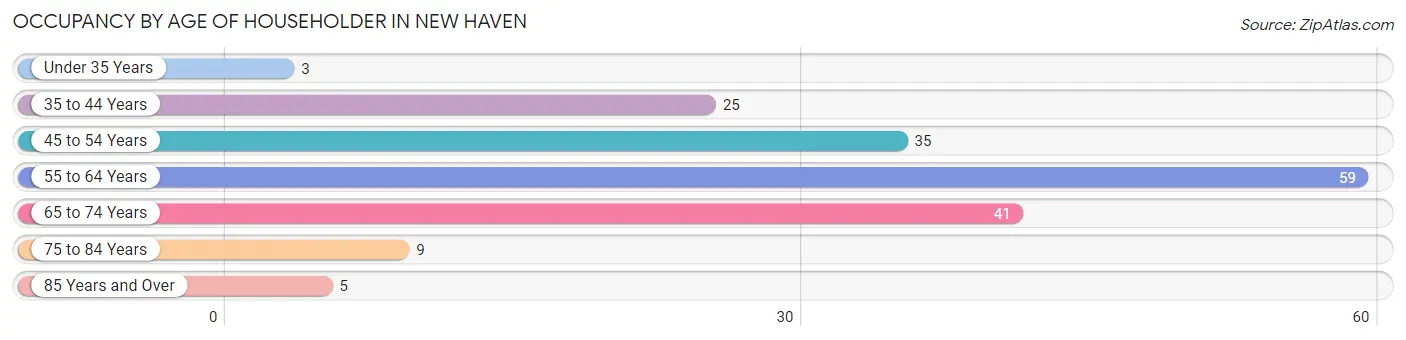
| Age Bracket | # Households | % Households |
| Under 35 Years | 3 | 1.7% |
| 35 to 44 Years | 25 | 14.1% |
| 45 to 54 Years | 35 | 19.8% |
| 55 to 64 Years | 59 | 33.3% |
| 65 to 74 Years | 41 | 23.2% |
| 75 to 84 Years | 9 | 5.1% |
| 85 Years and Over | 5 | 2.8% |
| Total | 177 | 100.0% |
Housing Finances in New Haven
Median Income by Occupancy in New Haven
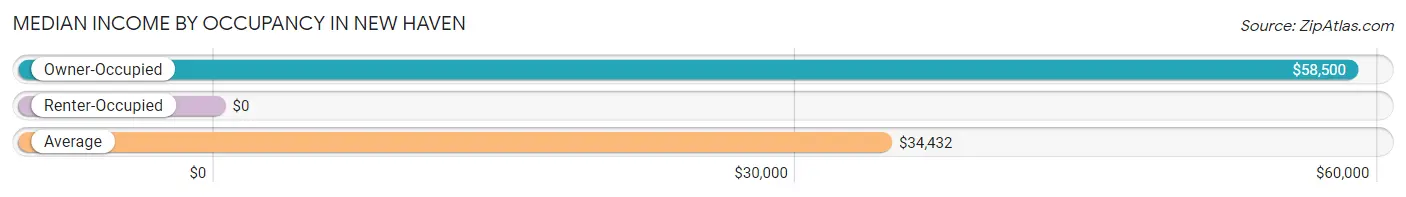
| Occupancy Type | # Households | Median Income |
| Owner-Occupied | 120 (67.8%) | $58,500 |
| Renter-Occupied | 57 (32.2%) | $0 |
| Average | 177 (100.0%) | $34,432 |
Occupancy by Householder Income Bracket in New Haven
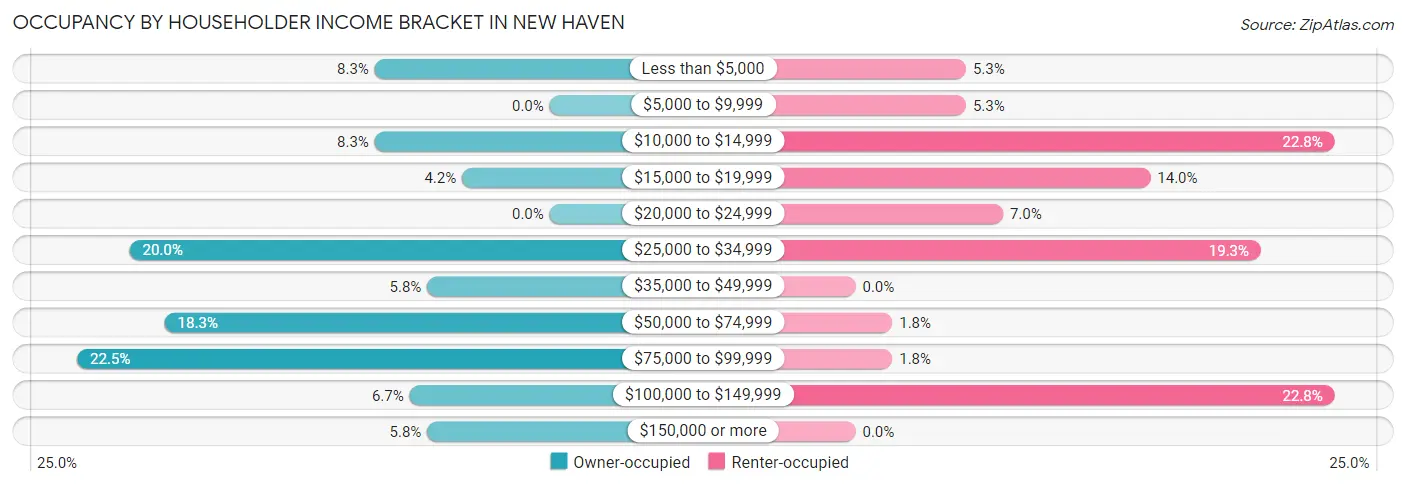
| Income Bracket | Owner-occupied | Renter-occupied |
| Less than $5,000 | 10 (8.3%) | 3 (5.3%) |
| $5,000 to $9,999 | 0 (0.0%) | 3 (5.3%) |
| $10,000 to $14,999 | 10 (8.3%) | 13 (22.8%) |
| $15,000 to $19,999 | 5 (4.2%) | 8 (14.0%) |
| $20,000 to $24,999 | 0 (0.0%) | 4 (7.0%) |
| $25,000 to $34,999 | 24 (20.0%) | 11 (19.3%) |
| $35,000 to $49,999 | 7 (5.8%) | 0 (0.0%) |
| $50,000 to $74,999 | 22 (18.3%) | 1 (1.8%) |
| $75,000 to $99,999 | 27 (22.5%) | 1 (1.8%) |
| $100,000 to $149,999 | 8 (6.7%) | 13 (22.8%) |
| $150,000 or more | 7 (5.8%) | 0 (0.0%) |
| Total | 120 (100.0%) | 57 (100.0%) |
Monthly Housing Cost Tiers in New Haven
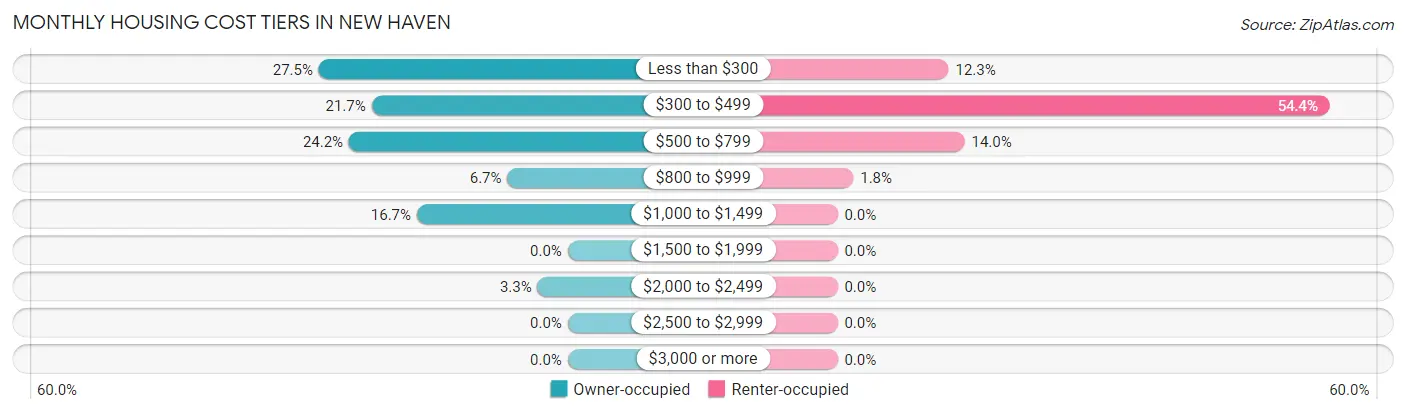
| Monthly Cost | Owner-occupied | Renter-occupied |
| Less than $300 | 33 (27.5%) | 7 (12.3%) |
| $300 to $499 | 26 (21.7%) | 31 (54.4%) |
| $500 to $799 | 29 (24.2%) | 8 (14.0%) |
| $800 to $999 | 8 (6.7%) | 1 (1.8%) |
| $1,000 to $1,499 | 20 (16.7%) | 0 (0.0%) |
| $1,500 to $1,999 | 0 (0.0%) | 0 (0.0%) |
| $2,000 to $2,499 | 4 (3.3%) | 0 (0.0%) |
| $2,500 to $2,999 | 0 (0.0%) | 0 (0.0%) |
| $3,000 or more | 0 (0.0%) | 0 (0.0%) |
| Total | 120 (100.0%) | 57 (100.0%) |
Physical Housing Characteristics in New Haven
Housing Structures in New Haven
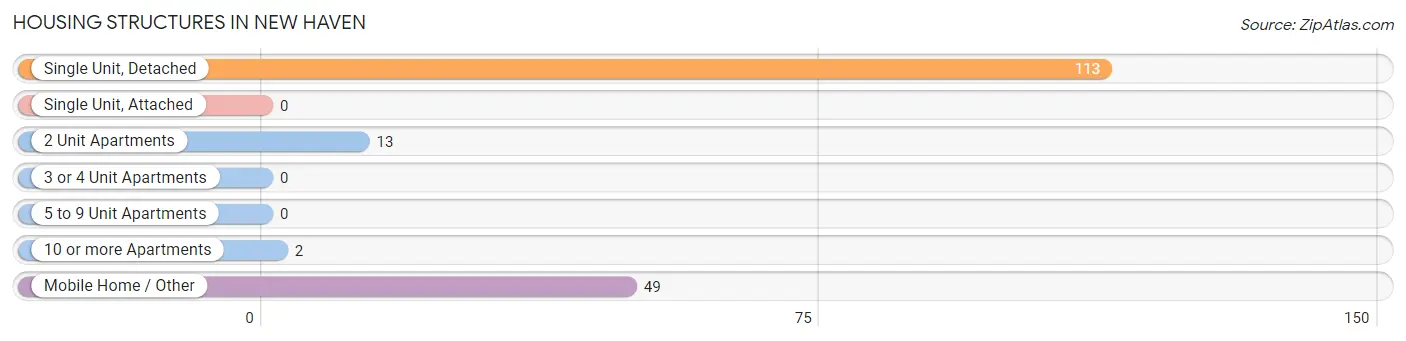
| Structure Type | # Housing Units | % Housing Units |
| Single Unit, Detached | 113 | 63.8% |
| Single Unit, Attached | 0 | 0.0% |
| 2 Unit Apartments | 13 | 7.3% |
| 3 or 4 Unit Apartments | 0 | 0.0% |
| 5 to 9 Unit Apartments | 0 | 0.0% |
| 10 or more Apartments | 2 | 1.1% |
| Mobile Home / Other | 49 | 27.7% |
| Total | 177 | 100.0% |
Housing Structures by Occupancy in New Haven
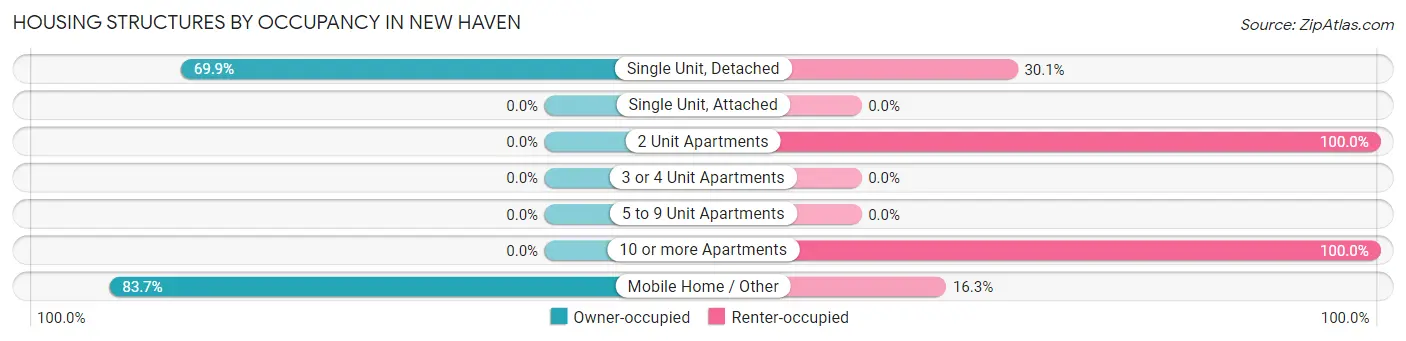
| Structure Type | Owner-occupied | Renter-occupied |
| Single Unit, Detached | 79 (69.9%) | 34 (30.1%) |
| Single Unit, Attached | 0 (0.0%) | 0 (0.0%) |
| 2 Unit Apartments | 0 (0.0%) | 13 (100.0%) |
| 3 or 4 Unit Apartments | 0 (0.0%) | 0 (0.0%) |
| 5 to 9 Unit Apartments | 0 (0.0%) | 0 (0.0%) |
| 10 or more Apartments | 0 (0.0%) | 2 (100.0%) |
| Mobile Home / Other | 41 (83.7%) | 8 (16.3%) |
| Total | 120 (67.8%) | 57 (32.2%) |
Housing Structures by Number of Rooms in New Haven
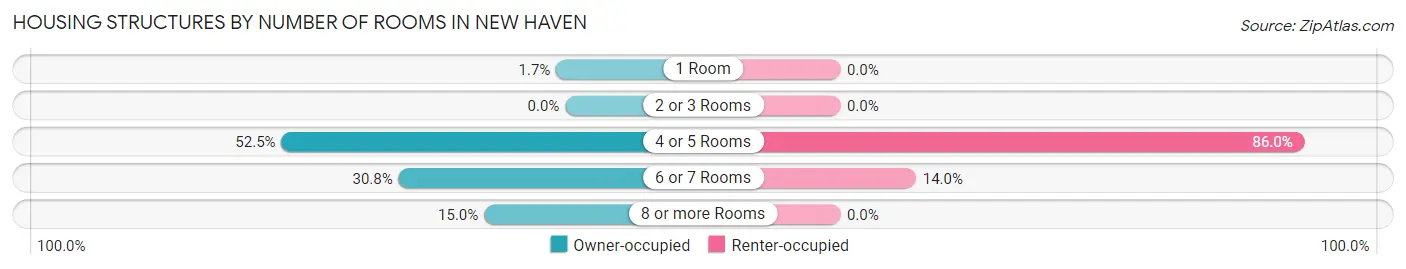
| Number of Rooms | Owner-occupied | Renter-occupied |
| 1 Room | 2 (1.7%) | 0 (0.0%) |
| 2 or 3 Rooms | 0 (0.0%) | 0 (0.0%) |
| 4 or 5 Rooms | 63 (52.5%) | 49 (86.0%) |
| 6 or 7 Rooms | 37 (30.8%) | 8 (14.0%) |
| 8 or more Rooms | 18 (15.0%) | 0 (0.0%) |
| Total | 120 (100.0%) | 57 (100.0%) |
Housing Structure by Heating Type in New Haven
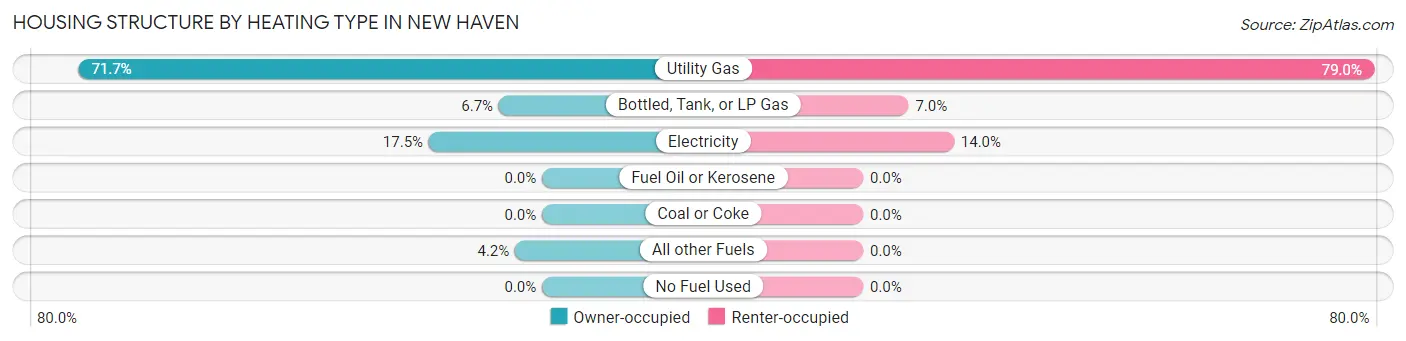
| Heating Type | Owner-occupied | Renter-occupied |
| Utility Gas | 86 (71.7%) | 45 (78.9%) |
| Bottled, Tank, or LP Gas | 8 (6.7%) | 4 (7.0%) |
| Electricity | 21 (17.5%) | 8 (14.0%) |
| Fuel Oil or Kerosene | 0 (0.0%) | 0 (0.0%) |
| Coal or Coke | 0 (0.0%) | 0 (0.0%) |
| All other Fuels | 5 (4.2%) | 0 (0.0%) |
| No Fuel Used | 0 (0.0%) | 0 (0.0%) |
| Total | 120 (100.0%) | 57 (100.0%) |
Household Vehicle Usage in New Haven
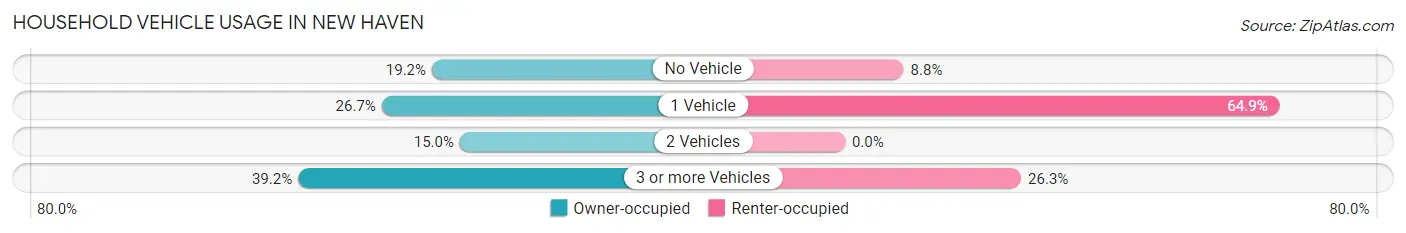
| Vehicles per Household | Owner-occupied | Renter-occupied |
| No Vehicle | 23 (19.2%) | 5 (8.8%) |
| 1 Vehicle | 32 (26.7%) | 37 (64.9%) |
| 2 Vehicles | 18 (15.0%) | 0 (0.0%) |
| 3 or more Vehicles | 47 (39.2%) | 15 (26.3%) |
| Total | 120 (100.0%) | 57 (100.0%) |
Real Estate & Mortgages in New Haven
Real Estate and Mortgage Overview in New Haven
| Characteristic | Without Mortgage | With Mortgage |
| Housing Units | 71 | 49 |
| Median Property Value | - | - |
| Median Household Income | $29,554 | $4 |
| Monthly Housing Costs | $314 | $0 |
| Real Estate Taxes | $463 | $5 |
Property Value by Mortgage Status in New Haven
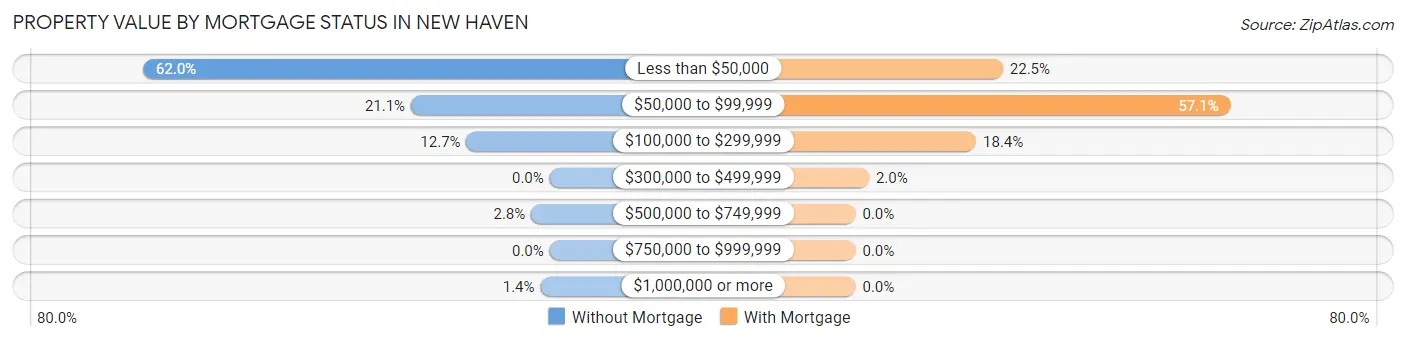
| Property Value | Without Mortgage | With Mortgage |
| Less than $50,000 | 44 (62.0%) | 11 (22.5%) |
| $50,000 to $99,999 | 15 (21.1%) | 28 (57.1%) |
| $100,000 to $299,999 | 9 (12.7%) | 9 (18.4%) |
| $300,000 to $499,999 | 0 (0.0%) | 1 (2.0%) |
| $500,000 to $749,999 | 2 (2.8%) | 0 (0.0%) |
| $750,000 to $999,999 | 0 (0.0%) | 0 (0.0%) |
| $1,000,000 or more | 1 (1.4%) | 0 (0.0%) |
| Total | 71 (100.0%) | 49 (100.0%) |
Household Income by Mortgage Status in New Haven
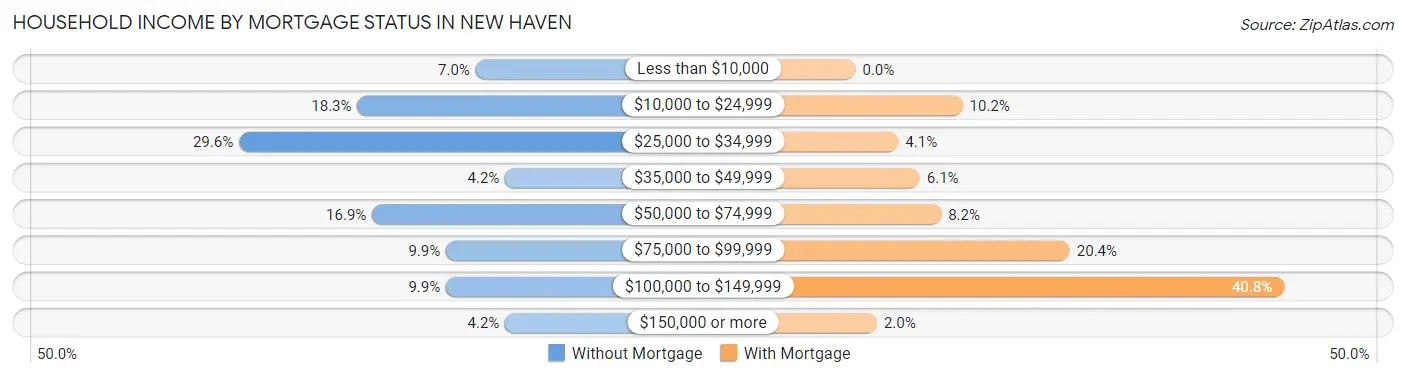
| Household Income | Without Mortgage | With Mortgage |
| Less than $10,000 | 5 (7.0%) | 0 (0.0%) |
| $10,000 to $24,999 | 13 (18.3%) | 5 (10.2%) |
| $25,000 to $34,999 | 21 (29.6%) | 2 (4.1%) |
| $35,000 to $49,999 | 3 (4.2%) | 3 (6.1%) |
| $50,000 to $74,999 | 12 (16.9%) | 4 (8.2%) |
| $75,000 to $99,999 | 7 (9.9%) | 10 (20.4%) |
| $100,000 to $149,999 | 7 (9.9%) | 20 (40.8%) |
| $150,000 or more | 3 (4.2%) | 1 (2.0%) |
| Total | 71 (100.0%) | 49 (100.0%) |
Property Value to Household Income Ratio in New Haven
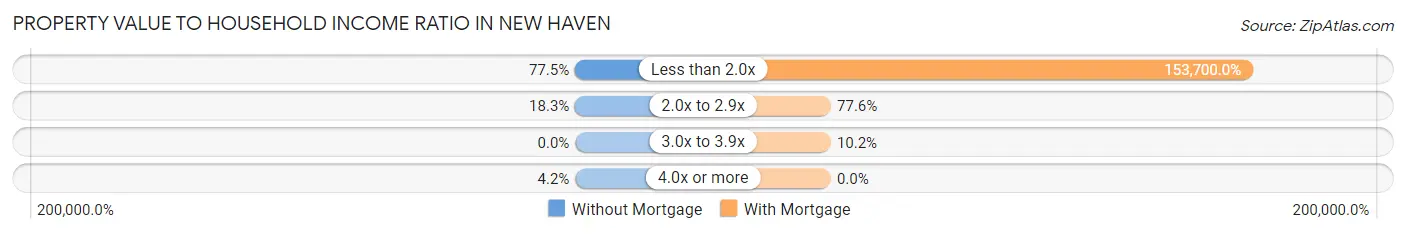
| Value-to-Income Ratio | Without Mortgage | With Mortgage |
| Less than 2.0x | 55 (77.5%) | 75,313 (153,700.0%) |
| 2.0x to 2.9x | 13 (18.3%) | 38 (77.5%) |
| 3.0x to 3.9x | 0 (0.0%) | 5 (10.2%) |
| 4.0x or more | 3 (4.2%) | 0 (0.0%) |
| Total | 71 (100.0%) | 49 (100.0%) |
Real Estate Taxes by Mortgage Status in New Haven
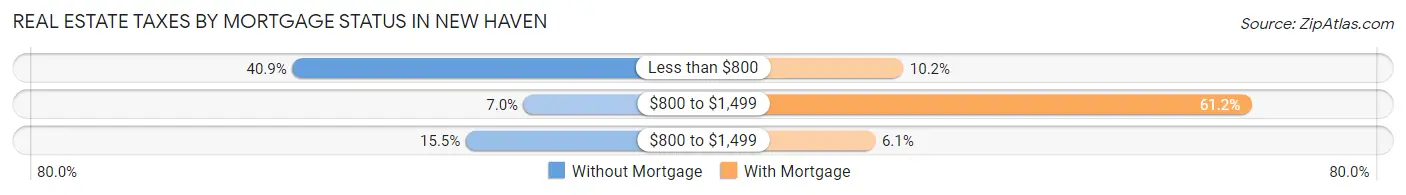
| Property Taxes | Without Mortgage | With Mortgage |
| Less than $800 | 29 (40.8%) | 5 (10.2%) |
| $800 to $1,499 | 5 (7.0%) | 30 (61.2%) |
| $800 to $1,499 | 11 (15.5%) | 3 (6.1%) |
| Total | 71 (100.0%) | 49 (100.0%) |
Health & Disability in New Haven
Health Insurance Coverage by Age in New Haven
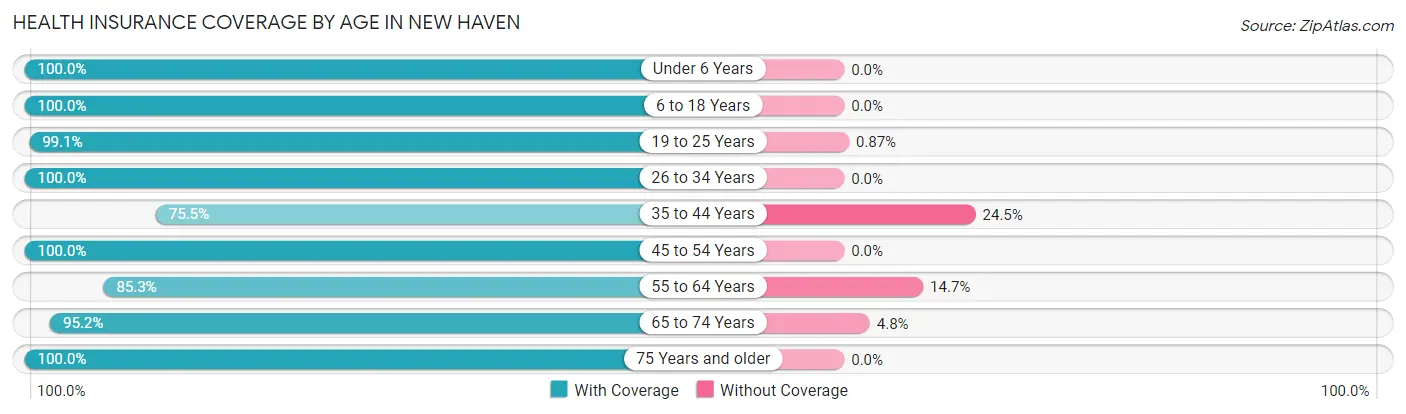
| Age Bracket | With Coverage | Without Coverage |
| Under 6 Years | 15 (100.0%) | 0 (0.0%) |
| 6 to 18 Years | 48 (100.0%) | 0 (0.0%) |
| 19 to 25 Years | 114 (99.1%) | 1 (0.9%) |
| 26 to 34 Years | 20 (100.0%) | 0 (0.0%) |
| 35 to 44 Years | 37 (75.5%) | 12 (24.5%) |
| 45 to 54 Years | 54 (100.0%) | 0 (0.0%) |
| 55 to 64 Years | 87 (85.3%) | 15 (14.7%) |
| 65 to 74 Years | 60 (95.2%) | 3 (4.8%) |
| 75 Years and older | 19 (100.0%) | 0 (0.0%) |
| Total | 454 (93.6%) | 31 (6.4%) |
Health Insurance Coverage by Citizenship Status in New Haven
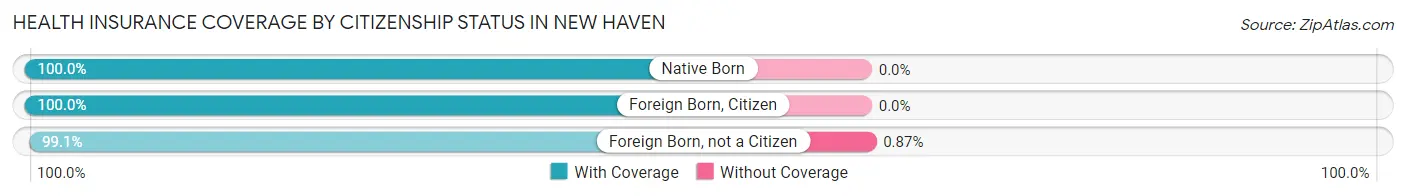
| Citizenship Status | With Coverage | Without Coverage |
| Native Born | 15 (100.0%) | 0 (0.0%) |
| Foreign Born, Citizen | 48 (100.0%) | 0 (0.0%) |
| Foreign Born, not a Citizen | 114 (99.1%) | 1 (0.9%) |
Health Insurance Coverage by Household Income in New Haven
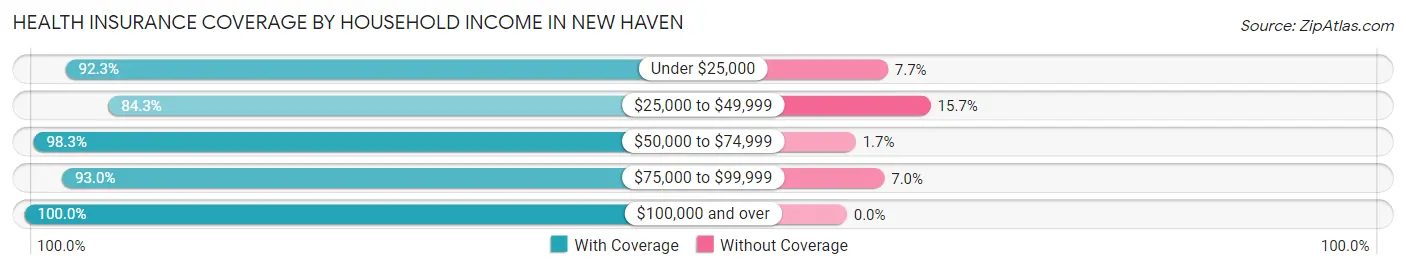
| Household Income | With Coverage | Without Coverage |
| Under $25,000 | 84 (92.3%) | 7 (7.7%) |
| $25,000 to $49,999 | 59 (84.3%) | 11 (15.7%) |
| $50,000 to $74,999 | 59 (98.3%) | 1 (1.7%) |
| $75,000 to $99,999 | 159 (93.0%) | 12 (7.0%) |
| $100,000 and over | 93 (100.0%) | 0 (0.0%) |
Public vs Private Health Insurance Coverage by Age in New Haven
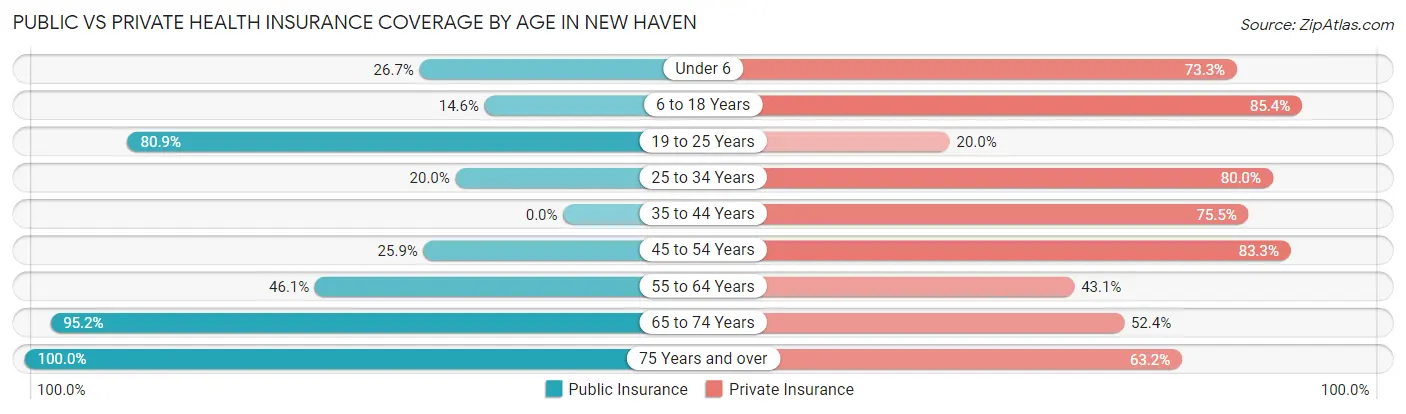
| Age Bracket | Public Insurance | Private Insurance |
| Under 6 | 4 (26.7%) | 11 (73.3%) |
| 6 to 18 Years | 7 (14.6%) | 41 (85.4%) |
| 19 to 25 Years | 93 (80.9%) | 23 (20.0%) |
| 25 to 34 Years | 4 (20.0%) | 16 (80.0%) |
| 35 to 44 Years | 0 (0.0%) | 37 (75.5%) |
| 45 to 54 Years | 14 (25.9%) | 45 (83.3%) |
| 55 to 64 Years | 47 (46.1%) | 44 (43.1%) |
| 65 to 74 Years | 60 (95.2%) | 33 (52.4%) |
| 75 Years and over | 19 (100.0%) | 12 (63.2%) |
| Total | 248 (51.1%) | 262 (54.0%) |
Disability Status by Sex by Age in New Haven
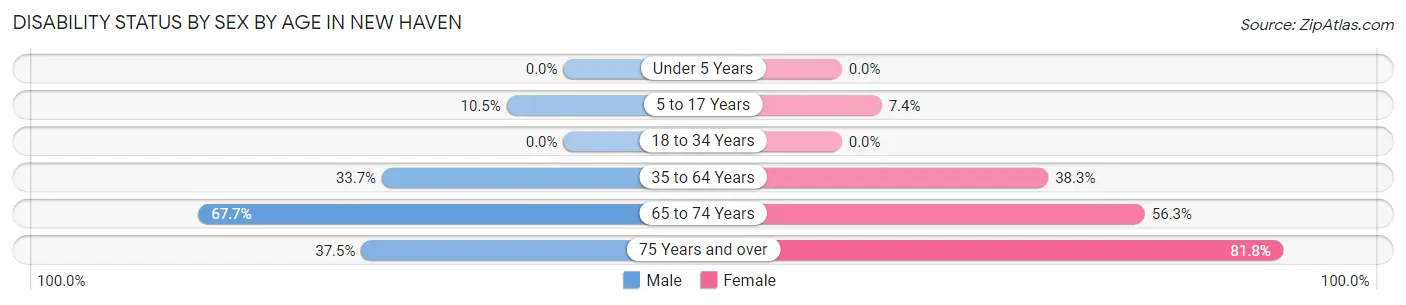
| Age Bracket | Male | Female |
| Under 5 Years | 0 (0.0%) | 0 (0.0%) |
| 5 to 17 Years | 2 (10.5%) | 2 (7.4%) |
| 18 to 34 Years | 0 (0.0%) | 0 (0.0%) |
| 35 to 64 Years | 33 (33.7%) | 41 (38.3%) |
| 65 to 74 Years | 21 (67.7%) | 18 (56.2%) |
| 75 Years and over | 3 (37.5%) | 9 (81.8%) |
Disability Class by Sex by Age in New Haven
Disability Class: Hearing Difficulty
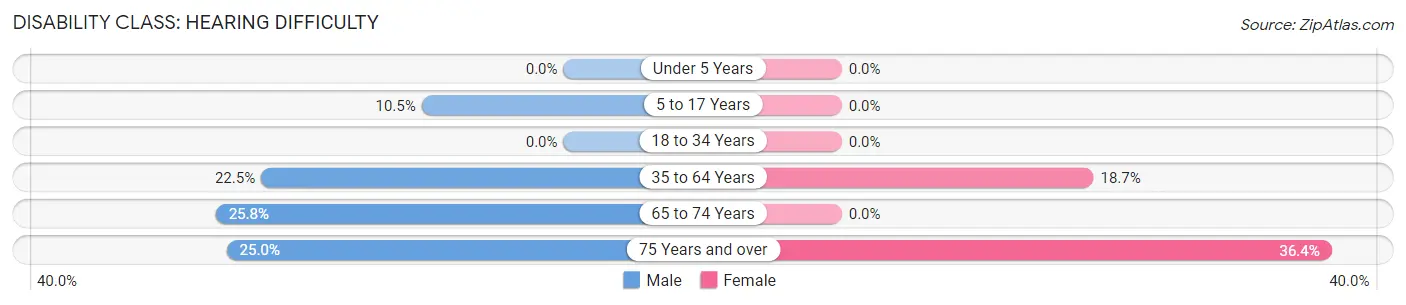
| Age Bracket | Male | Female |
| Under 5 Years | 0 (0.0%) | 0 (0.0%) |
| 5 to 17 Years | 2 (10.5%) | 0 (0.0%) |
| 18 to 34 Years | 0 (0.0%) | 0 (0.0%) |
| 35 to 64 Years | 22 (22.5%) | 20 (18.7%) |
| 65 to 74 Years | 8 (25.8%) | 0 (0.0%) |
| 75 Years and over | 2 (25.0%) | 4 (36.4%) |
Disability Class: Vision Difficulty
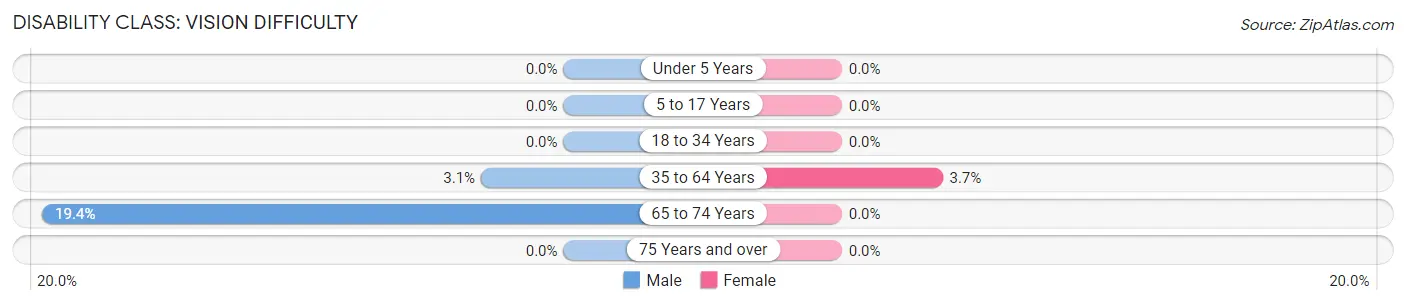
| Age Bracket | Male | Female |
| Under 5 Years | 0 (0.0%) | 0 (0.0%) |
| 5 to 17 Years | 0 (0.0%) | 0 (0.0%) |
| 18 to 34 Years | 0 (0.0%) | 0 (0.0%) |
| 35 to 64 Years | 3 (3.1%) | 4 (3.7%) |
| 65 to 74 Years | 6 (19.4%) | 0 (0.0%) |
| 75 Years and over | 0 (0.0%) | 0 (0.0%) |
Disability Class: Cognitive Difficulty
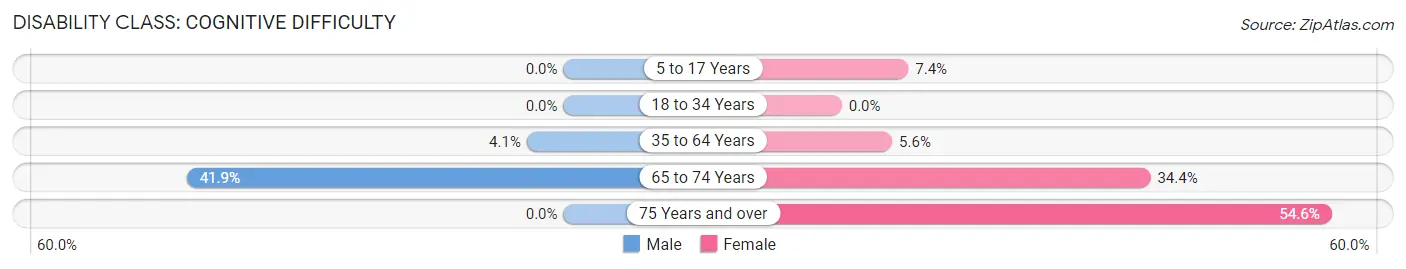
| Age Bracket | Male | Female |
| 5 to 17 Years | 0 (0.0%) | 2 (7.4%) |
| 18 to 34 Years | 0 (0.0%) | 0 (0.0%) |
| 35 to 64 Years | 4 (4.1%) | 6 (5.6%) |
| 65 to 74 Years | 13 (41.9%) | 11 (34.4%) |
| 75 Years and over | 0 (0.0%) | 6 (54.5%) |
Disability Class: Ambulatory Difficulty
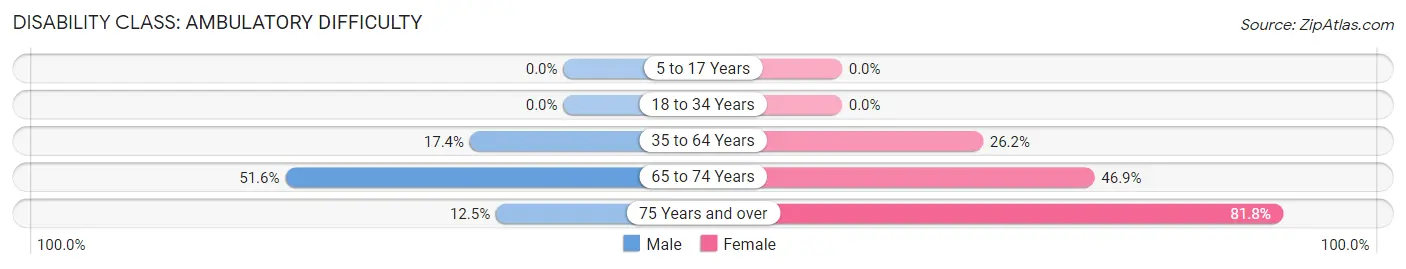
| Age Bracket | Male | Female |
| 5 to 17 Years | 0 (0.0%) | 0 (0.0%) |
| 18 to 34 Years | 0 (0.0%) | 0 (0.0%) |
| 35 to 64 Years | 17 (17.3%) | 28 (26.2%) |
| 65 to 74 Years | 16 (51.6%) | 15 (46.9%) |
| 75 Years and over | 1 (12.5%) | 9 (81.8%) |
Disability Class: Self-Care Difficulty
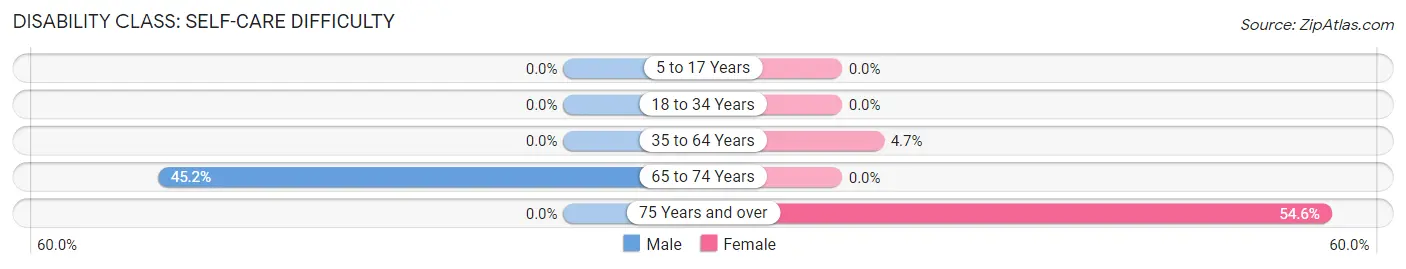
| Age Bracket | Male | Female |
| 5 to 17 Years | 0 (0.0%) | 0 (0.0%) |
| 18 to 34 Years | 0 (0.0%) | 0 (0.0%) |
| 35 to 64 Years | 0 (0.0%) | 5 (4.7%) |
| 65 to 74 Years | 14 (45.2%) | 0 (0.0%) |
| 75 Years and over | 0 (0.0%) | 6 (54.5%) |
Technology Access in New Haven
Computing Device Access in New Haven
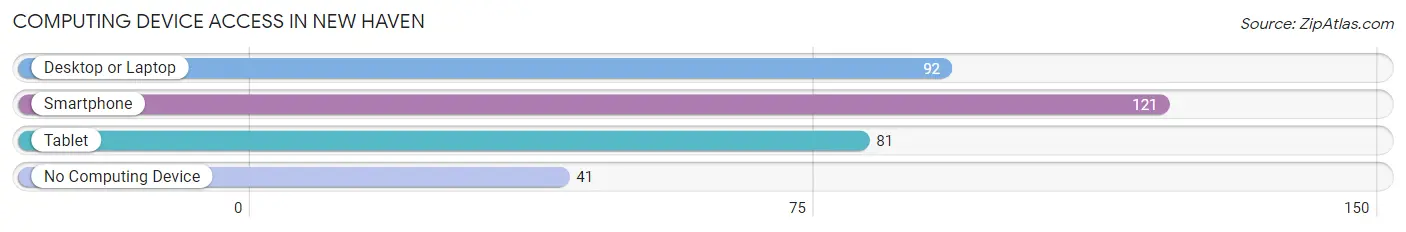
| Device Type | # Households | % Households |
| Desktop or Laptop | 92 | 52.0% |
| Smartphone | 121 | 68.4% |
| Tablet | 81 | 45.8% |
| No Computing Device | 41 | 23.2% |
| Total | 177 | 100.0% |
Internet Access in New Haven
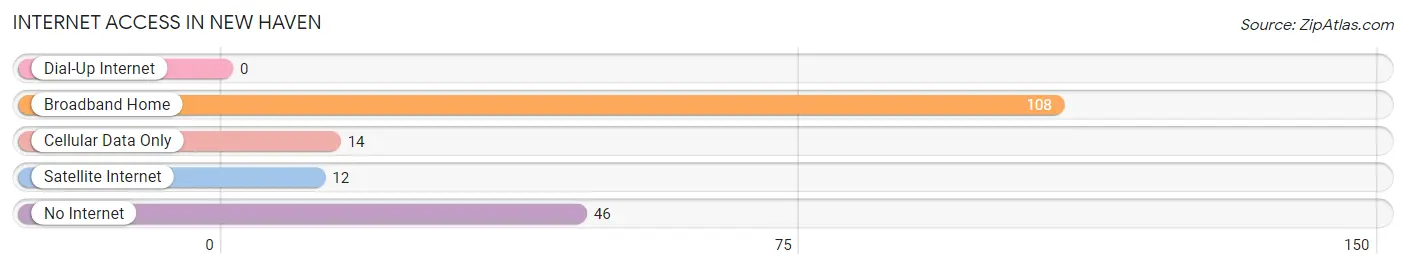
| Internet Type | # Households | % Households |
| Dial-Up Internet | 0 | 0.0% |
| Broadband Home | 108 | 61.0% |
| Cellular Data Only | 14 | 7.9% |
| Satellite Internet | 12 | 6.8% |
| No Internet | 46 | 26.0% |
| Total | 177 | 100.0% |
New Haven Summary
New Haven, Illinois is a small village located in Madison County, Illinois. It is situated on the banks of the Mississippi River, just north of St. Louis, Missouri. The village has a population of just over 1,000 people and is part of the Greater St. Louis metropolitan area.
History
New Haven was founded in 1818 by a group of settlers from Kentucky. The village was originally known as “New Haven Station” and was a stop on the St. Louis and Iron Mountain Railroad. The village was officially incorporated in 1872.
In the late 19th century, New Haven was a thriving agricultural community. The village was home to several grain elevators, a flour mill, and a brickyard. The village also had a number of stores, a hotel, and a post office.
In the early 20th century, the village began to decline. The railroad stopped running through the village and the brickyard closed. The population of the village began to decline as well.
Geography
New Haven is located in Madison County, Illinois. It is situated on the banks of the Mississippi River, just north of St. Louis, Missouri. The village is located in the American Bottom region of the Mississippi River Valley.
The village is located on the western edge of the American Bottom floodplain. The village is surrounded by agricultural fields and woodlands. The nearest major city is St. Louis, which is located about 25 miles to the south.
Economy
The economy of New Haven is largely based on agriculture. The village is home to several grain elevators and a flour mill. The village also has a number of small businesses, including a grocery store, a hardware store, and a restaurant.
The village is also home to a number of small manufacturing companies. These companies produce a variety of products, including furniture, clothing, and automotive parts.
Demographics
As of the 2010 census, the population of New Haven was 1,039. The racial makeup of the village was 97.3% White, 0.7% African American, 0.3% Native American, 0.2% Asian, and 1.5% from other races.
The median household income in New Haven was $45,625. The median age of the village was 40.7 years. The village had a poverty rate of 11.3%.
Conclusion
New Haven, Illinois is a small village located in Madison County, Illinois. It is situated on the banks of the Mississippi River, just north of St. Louis, Missouri. The village has a population of just over 1,000 people and is part of the Greater St. Louis metropolitan area. The economy of New Haven is largely based on agriculture and small businesses. The village is also home to a number of small manufacturing companies. The racial makeup of the village is predominantly White, with a small percentage of African American, Native American, and Asian residents. The median household income in New Haven is $45,625 and the poverty rate is 11.3%.
Common Questions
What is Per Capita Income in New Haven?
Per Capita income in New Haven is $22,035.
What is the Median Family Income in New Haven?
Median Family Income in New Haven is $75,417.
What is the Median Household income in New Haven?
Median Household Income in New Haven is $34,432.
What is Inequality or Gini Index in New Haven?
Inequality or Gini Index in New Haven is 0.46.
What is the Total Population of New Haven?
Total Population of New Haven is 485.
What is the Total Male Population of New Haven?
Total Male Population of New Haven is 209.
What is the Total Female Population of New Haven?
Total Female Population of New Haven is 276.
What is the Ratio of Males per 100 Females in New Haven?
There are 75.72 Males per 100 Females in New Haven.
What is the Ratio of Females per 100 Males in New Haven?
There are 132.06 Females per 100 Males in New Haven.
What is the Median Population Age in New Haven?
Median Population Age in New Haven is 41.9 Years.
What is the Average Family Size in New Haven
Average Family Size in New Haven is 3.4 People.
What is the Average Household Size in New Haven
Average Household Size in New Haven is 2.7 People.
How Large is the Labor Force in New Haven?
There are 274 People in the Labor Forcein in New Haven.
What is the Percentage of People in the Labor Force in New Haven?
62.4% of People are in the Labor Force in New Haven.
What is the Unemployment Rate in New Haven?
Unemployment Rate in New Haven is 39.4%.