Nashville, IL Map & Demographics
Nashville Map
Nashville Overview
$32,733
PER CAPITA INCOME
$81,554
AVG FAMILY INCOME
$65,719
AVG HOUSEHOLD INCOME
23.6%
WAGE / INCOME GAP [ % ]
76.4¢/ $1
WAGE / INCOME GAP [ $ ]
0.35
INEQUALITY / GINI INDEX
3,025
TOTAL POPULATION
1,359
MALE POPULATION
1,666
FEMALE POPULATION
81.57
MALES / 100 FEMALES
122.59
FEMALES / 100 MALES
43.9
MEDIAN AGE
2.6
AVG FAMILY SIZE
2.2
AVG HOUSEHOLD SIZE
1,540
LABOR FORCE [ PEOPLE ]
61.2%
PERCENT IN LABOR FORCE
7.6%
UNEMPLOYMENT RATE
Nashville Zip Codes
Nashville Area Codes
Income in Nashville
Income Overview in Nashville
Per Capita Income in Nashville is $32,733, while median incomes of families and households are $81,554 and $65,719 respectively.
| Characteristic | Number | Measure |
| Per Capita Income | 3,025 | $32,733 |
| Median Family Income | 846 | $81,554 |
| Mean Family Income | 846 | $84,310 |
| Median Household Income | 1,305 | $65,719 |
| Mean Household Income | 1,305 | $73,692 |
| Income Deficit | 846 | $0 |
| Wage / Income Gap (%) | 3,025 | 23.63% |
| Wage / Income Gap ($) | 3,025 | 76.37¢ per $1 |
| Gini / Inequality Index | 3,025 | 0.35 |
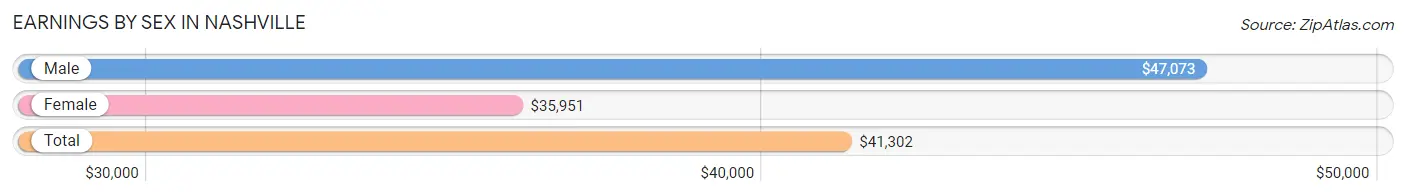
Earnings by Sex in Nashville
Average Earnings in Nashville are $41,302, $47,073 for men and $35,951 for women, a difference of 23.6%.
| Sex | Number | Average Earnings |
| Male | 780 (48.9%) | $47,073 |
| Female | 815 (51.1%) | $35,951 |
| Total | 1,595 (100.0%) | $41,302 |
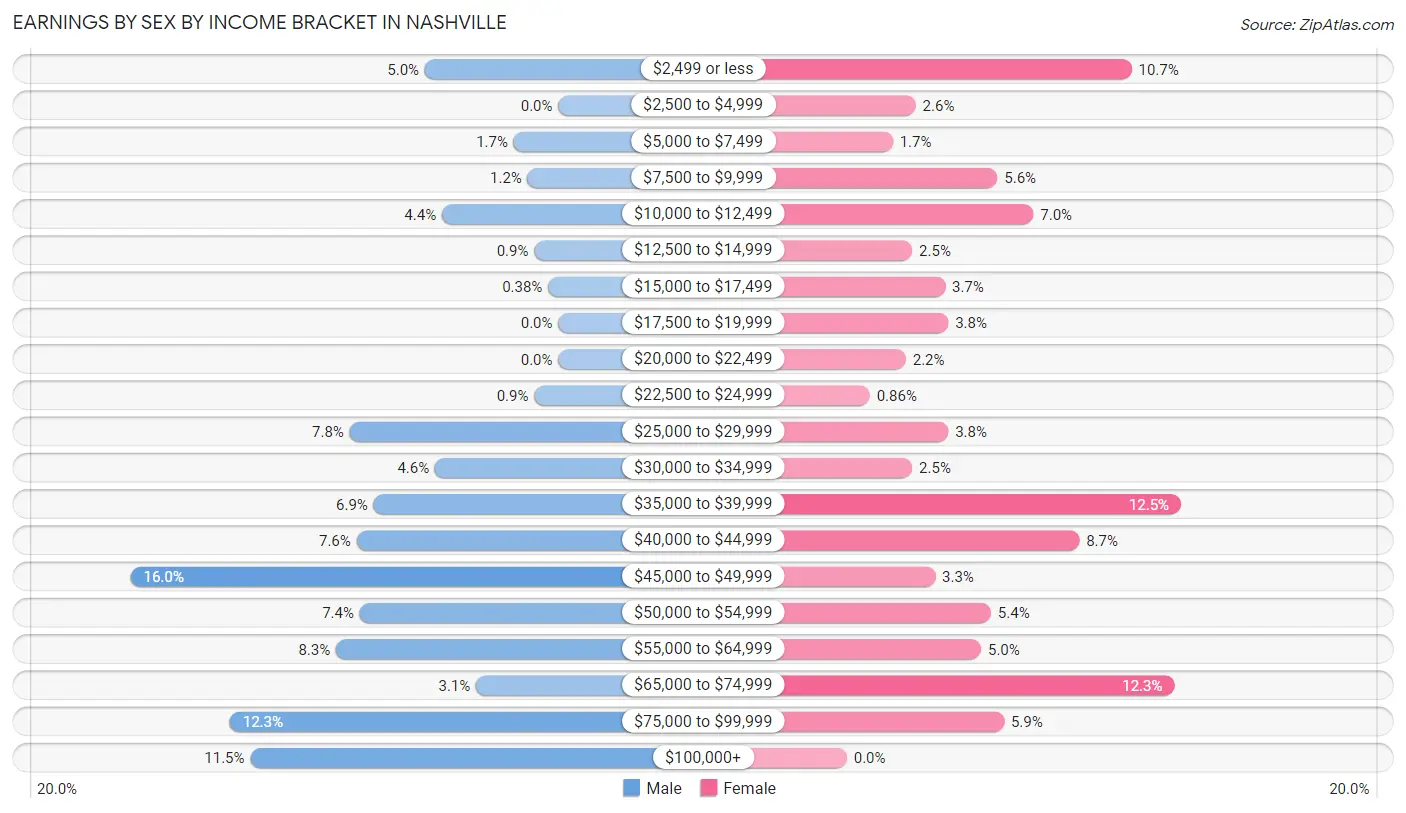
Earnings by Sex by Income Bracket in Nashville
The most common earnings brackets in Nashville are $45,000 to $49,999 for men (125 | 16.0%) and $35,000 to $39,999 for women (102 | 12.5%).
| Income | Male | Female |
| $2,499 or less | 39 (5.0%) | 87 (10.7%) |
| $2,500 to $4,999 | 0 (0.0%) | 21 (2.6%) |
| $5,000 to $7,499 | 13 (1.7%) | 14 (1.7%) |
| $7,500 to $9,999 | 9 (1.1%) | 46 (5.6%) |
| $10,000 to $12,499 | 34 (4.4%) | 57 (7.0%) |
| $12,500 to $14,999 | 7 (0.9%) | 20 (2.5%) |
| $15,000 to $17,499 | 3 (0.4%) | 30 (3.7%) |
| $17,500 to $19,999 | 0 (0.0%) | 31 (3.8%) |
| $20,000 to $22,499 | 0 (0.0%) | 18 (2.2%) |
| $22,500 to $24,999 | 7 (0.9%) | 7 (0.9%) |
| $25,000 to $29,999 | 61 (7.8%) | 31 (3.8%) |
| $30,000 to $34,999 | 36 (4.6%) | 20 (2.5%) |
| $35,000 to $39,999 | 54 (6.9%) | 102 (12.5%) |
| $40,000 to $44,999 | 59 (7.6%) | 71 (8.7%) |
| $45,000 to $49,999 | 125 (16.0%) | 27 (3.3%) |
| $50,000 to $54,999 | 58 (7.4%) | 44 (5.4%) |
| $55,000 to $64,999 | 65 (8.3%) | 41 (5.0%) |
| $65,000 to $74,999 | 24 (3.1%) | 100 (12.3%) |
| $75,000 to $99,999 | 96 (12.3%) | 48 (5.9%) |
| $100,000+ | 90 (11.5%) | 0 (0.0%) |
| Total | 780 (100.0%) | 815 (100.0%) |
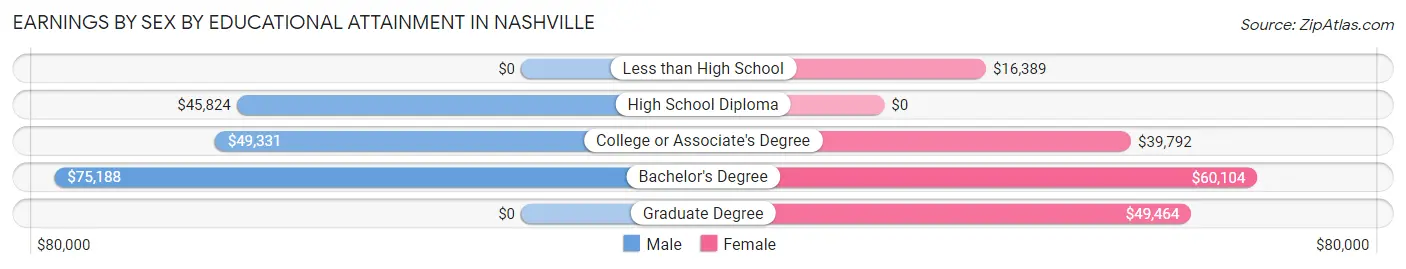
Earnings by Sex by Educational Attainment in Nashville
Average earnings in Nashville are $48,924 for men and $36,978 for women, a difference of 24.4%. Men with an educational attainment of bachelor's degree enjoy the highest average annual earnings of $75,188, while those with high school diploma education earn the least with $45,824. Women with an educational attainment of bachelor's degree earn the most with the average annual earnings of $60,104, while those with less than high school education have the smallest earnings of $16,389.
| Educational Attainment | Male Income | Female Income |
| Less than High School | - | - |
| High School Diploma | $45,824 | $0 |
| College or Associate's Degree | $49,331 | $39,792 |
| Bachelor's Degree | $75,188 | $60,104 |
| Graduate Degree | - | - |
| Total | $48,924 | $36,978 |
Family Income in Nashville
Family Income Brackets in Nashville
According to the Nashville family income data, there are 211 families falling into the $100,000 to $149,999 income range, which is the most common income bracket and makes up 24.9% of all families.
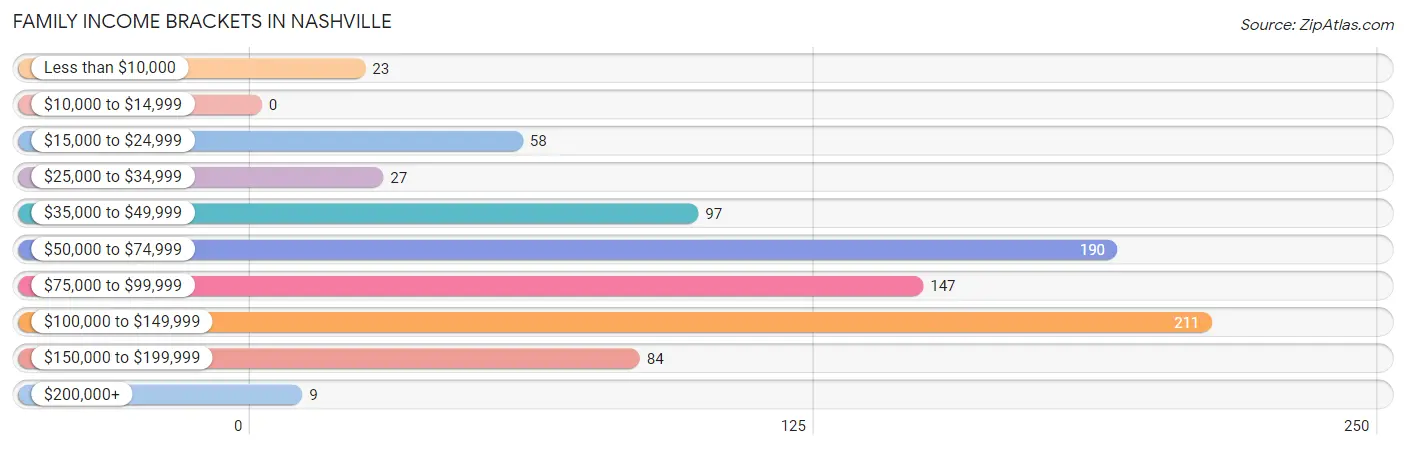
| Income Bracket | # Families | % Families |
| Less than $10,000 | 23 | 2.7% |
| $10,000 to $14,999 | 0 | 0.0% |
| $15,000 to $24,999 | 58 | 6.9% |
| $25,000 to $34,999 | 27 | 3.2% |
| $35,000 to $49,999 | 97 | 11.5% |
| $50,000 to $74,999 | 190 | 22.5% |
| $75,000 to $99,999 | 147 | 17.4% |
| $100,000 to $149,999 | 211 | 24.9% |
| $150,000 to $199,999 | 84 | 9.9% |
| $200,000+ | 9 | 1.1% |
Family Income by Famaliy Size in Nashville
4-person families (183 | 21.6%) account for the highest median family income in Nashville with $106,917 per family, while 2-person families (427 | 50.5%) have the highest median income of $31,016 per family member.
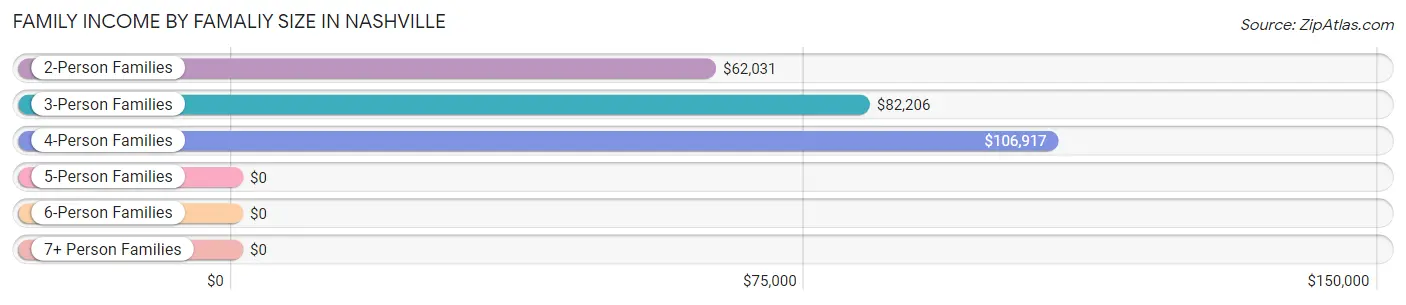
| Income Bracket | # Families | Median Income |
| 2-Person Families | 427 (50.5%) | $62,031 |
| 3-Person Families | 210 (24.8%) | $82,206 |
| 4-Person Families | 183 (21.6%) | $106,917 |
| 5-Person Families | 26 (3.1%) | $0 |
| 6-Person Families | 0 (0.0%) | $0 |
| 7+ Person Families | 0 (0.0%) | $0 |
| Total | 846 (100.0%) | $81,554 |
Family Income by Number of Earners in Nashville
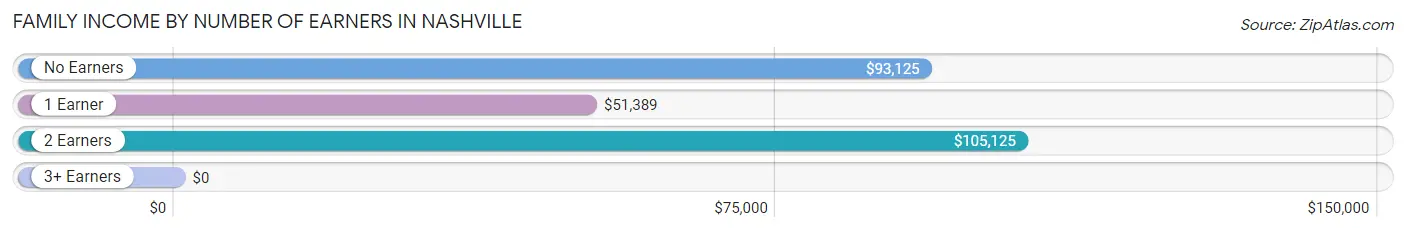
| Number of Earners | # Families | Median Income |
| No Earners | 68 (8.0%) | $93,125 |
| 1 Earner | 358 (42.3%) | $51,389 |
| 2 Earners | 383 (45.3%) | $105,125 |
| 3+ Earners | 37 (4.4%) | $0 |
| Total | 846 (100.0%) | $81,554 |
Household Income in Nashville
Household Income Brackets in Nashville
With 328 households falling in the category, the $50,000 to $74,999 income range is the most frequent in Nashville, accounting for 25.1% of all households. In contrast, only 9 households (0.7%) fall into the $200,000+ income bracket, making it the least populous group.
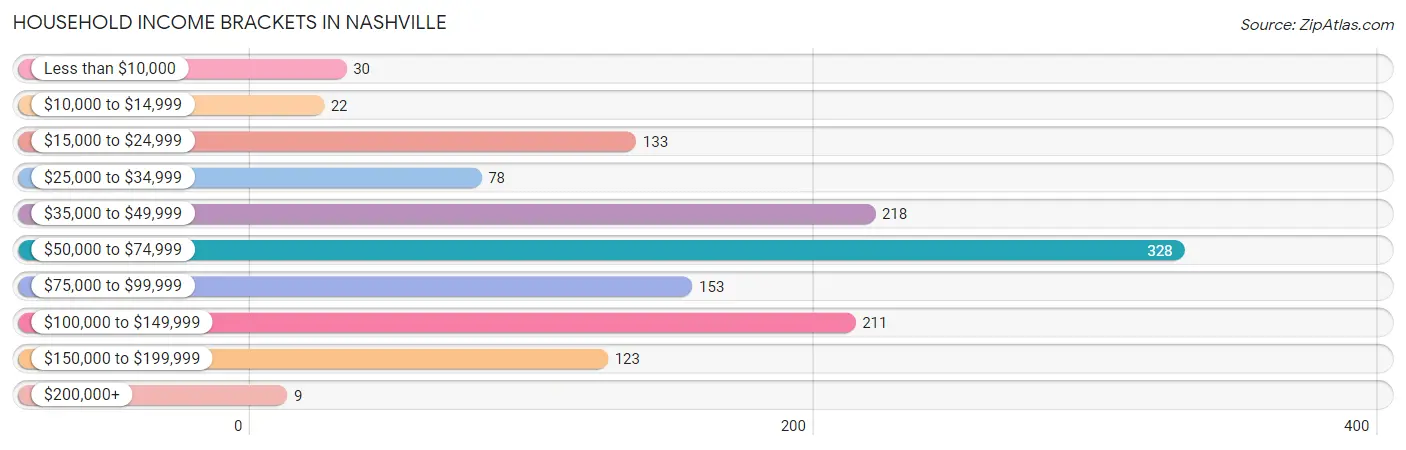
| Income Bracket | # Households | % Households |
| Less than $10,000 | 30 | 2.3% |
| $10,000 to $14,999 | 22 | 1.7% |
| $15,000 to $24,999 | 133 | 10.2% |
| $25,000 to $34,999 | 78 | 6.0% |
| $35,000 to $49,999 | 218 | 16.7% |
| $50,000 to $74,999 | 328 | 25.1% |
| $75,000 to $99,999 | 153 | 11.7% |
| $100,000 to $149,999 | 211 | 16.2% |
| $150,000 to $199,999 | 123 | 9.4% |
| $200,000+ | 9 | 0.7% |
Household Income by Householder Age in Nashville
The median household income in Nashville is $65,719, with the highest median household income of $72,759 found in the 15 to 24 years age bracket for the primary householder. A total of 52 households (4.0%) fall into this category. Meanwhile, the 65+ years age bracket for the primary householder has the lowest median household income of $41,658, with 379 households (29.0%) in this group.
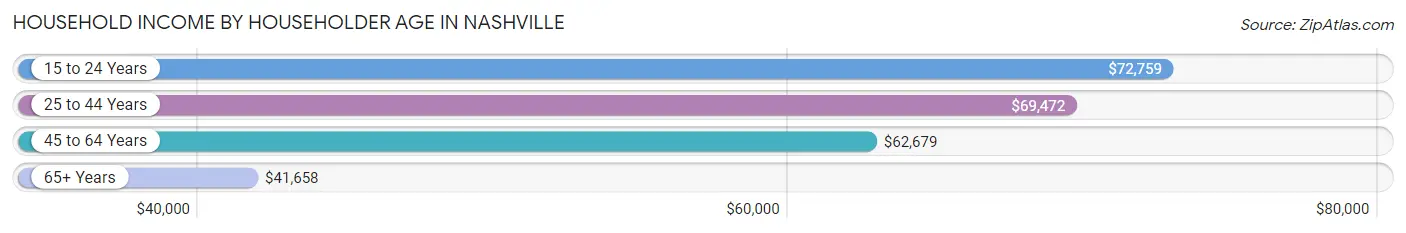
| Income Bracket | # Households | Median Income |
| 15 to 24 Years | 52 (4.0%) | $72,759 |
| 25 to 44 Years | 421 (32.3%) | $69,472 |
| 45 to 64 Years | 453 (34.7%) | $62,679 |
| 65+ Years | 379 (29.0%) | $41,658 |
| Total | 1,305 (100.0%) | $65,719 |
Poverty in Nashville
Income Below Poverty by Sex and Age in Nashville
With 6.5% poverty level for males and 6.9% for females among the residents of Nashville, under 5 year old males and 15 year old females are the most vulnerable to poverty, with 10 males (20.0%) and 9 females (45.0%) in their respective age groups living below the poverty level.
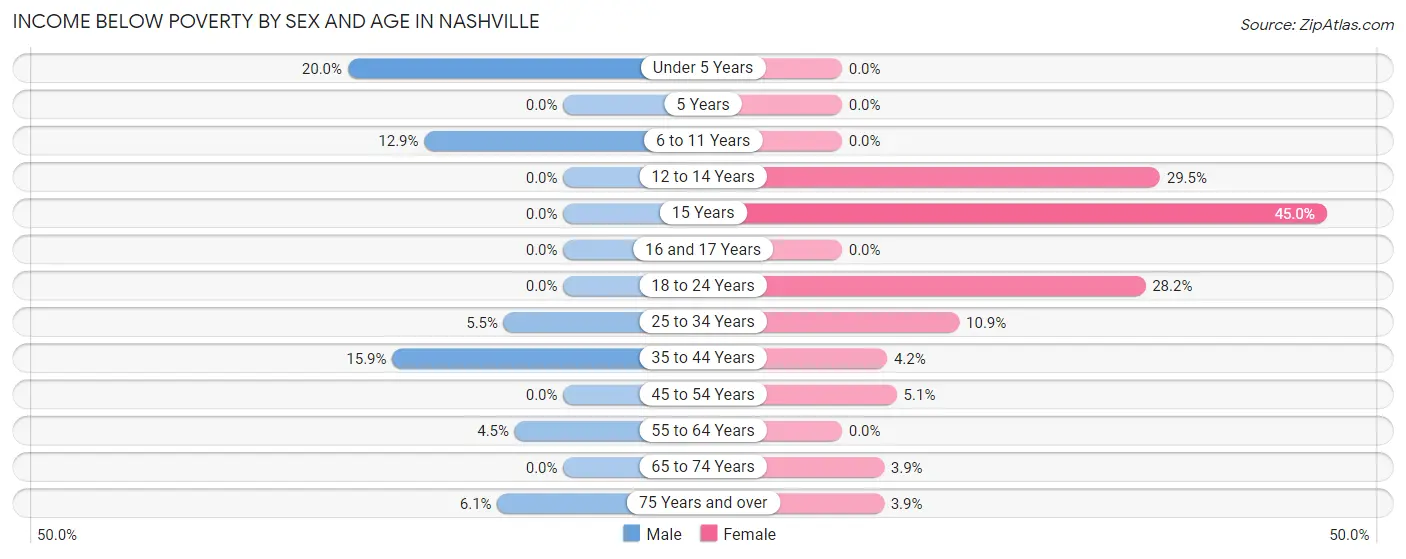
| Age Bracket | Male | Female |
| Under 5 Years | 10 (20.0%) | 0 (0.0%) |
| 5 Years | 0 (0.0%) | 0 (0.0%) |
| 6 to 11 Years | 16 (12.9%) | 0 (0.0%) |
| 12 to 14 Years | 0 (0.0%) | 18 (29.5%) |
| 15 Years | 0 (0.0%) | 9 (45.0%) |
| 16 and 17 Years | 0 (0.0%) | 0 (0.0%) |
| 18 to 24 Years | 0 (0.0%) | 29 (28.2%) |
| 25 to 34 Years | 10 (5.5%) | 22 (10.9%) |
| 35 to 44 Years | 33 (15.9%) | 8 (4.2%) |
| 45 to 54 Years | 0 (0.0%) | 11 (5.1%) |
| 55 to 64 Years | 9 (4.5%) | 0 (0.0%) |
| 65 to 74 Years | 0 (0.0%) | 6 (3.9%) |
| 75 Years and over | 6 (6.1%) | 7 (3.9%) |
| Total | 84 (6.5%) | 110 (6.9%) |
Income Above Poverty by Sex and Age in Nashville
According to the poverty statistics in Nashville, males aged 12 to 14 years and females aged under 5 years are the age groups that are most secure financially, with 100.0% of males and 100.0% of females in these age groups living above the poverty line.
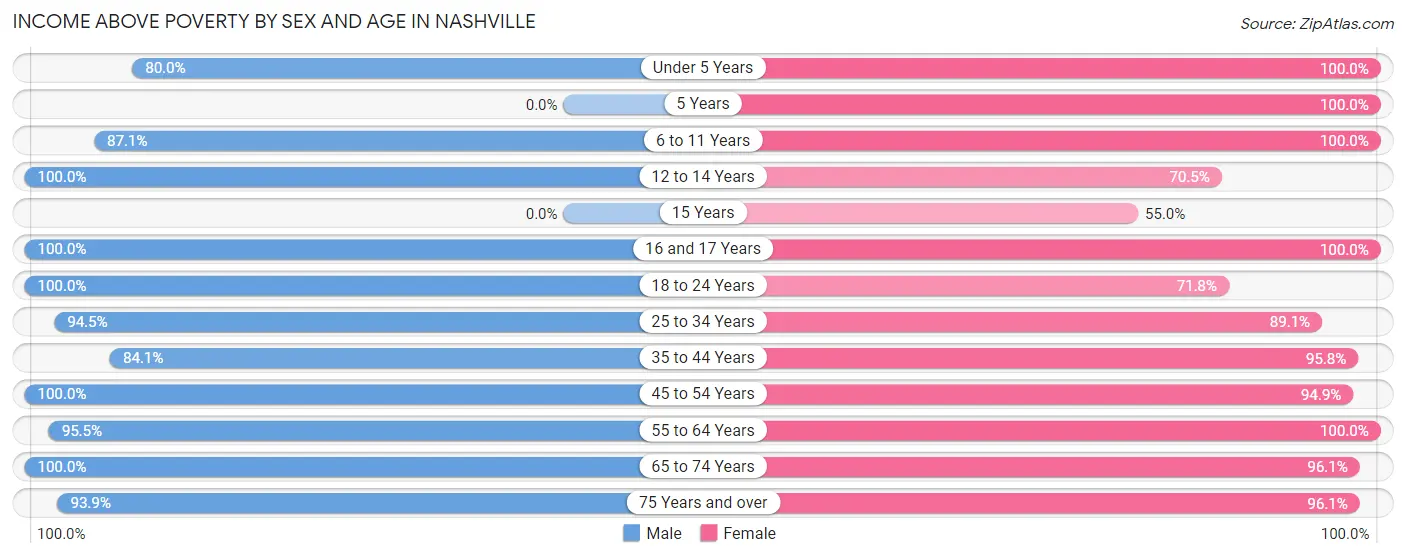
| Age Bracket | Male | Female |
| Under 5 Years | 40 (80.0%) | 52 (100.0%) |
| 5 Years | 0 (0.0%) | 59 (100.0%) |
| 6 to 11 Years | 108 (87.1%) | 110 (100.0%) |
| 12 to 14 Years | 26 (100.0%) | 43 (70.5%) |
| 15 Years | 0 (0.0%) | 11 (55.0%) |
| 16 and 17 Years | 45 (100.0%) | 47 (100.0%) |
| 18 to 24 Years | 94 (100.0%) | 74 (71.8%) |
| 25 to 34 Years | 171 (94.5%) | 180 (89.1%) |
| 35 to 44 Years | 175 (84.1%) | 183 (95.8%) |
| 45 to 54 Years | 154 (100.0%) | 205 (94.9%) |
| 55 to 64 Years | 191 (95.5%) | 200 (100.0%) |
| 65 to 74 Years | 104 (100.0%) | 148 (96.1%) |
| 75 Years and over | 92 (93.9%) | 173 (96.1%) |
| Total | 1,200 (93.5%) | 1,485 (93.1%) |
Income Below Poverty Among Married-Couple Families in Nashville
The poverty statistics for married-couple families in Nashville show that 2.4% or 13 of the total 535 families live below the poverty line. Families with 1 or 2 children have the highest poverty rate of 5.9%, comprising of 13 families. On the other hand, families with no children have the lowest poverty rate of 0.0%, which includes 0 families.
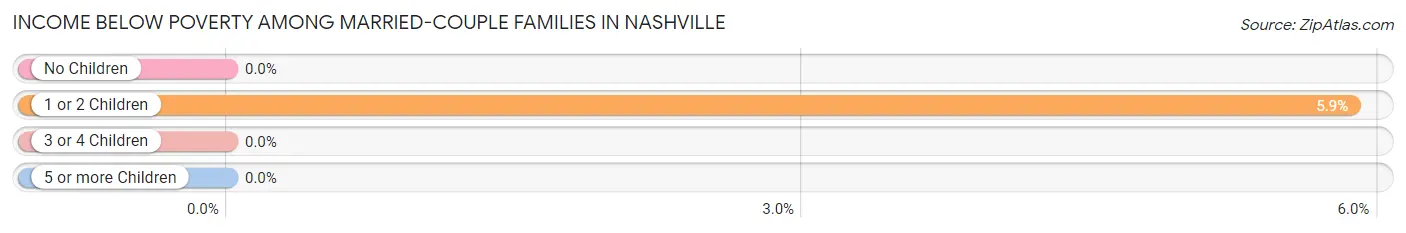
| Children | Above Poverty | Below Poverty |
| No Children | 287 (100.0%) | 0 (0.0%) |
| 1 or 2 Children | 209 (94.1%) | 13 (5.9%) |
| 3 or 4 Children | 26 (100.0%) | 0 (0.0%) |
| 5 or more Children | 0 (0.0%) | 0 (0.0%) |
| Total | 522 (97.6%) | 13 (2.4%) |
Income Below Poverty Among Single-Parent Households in Nashville
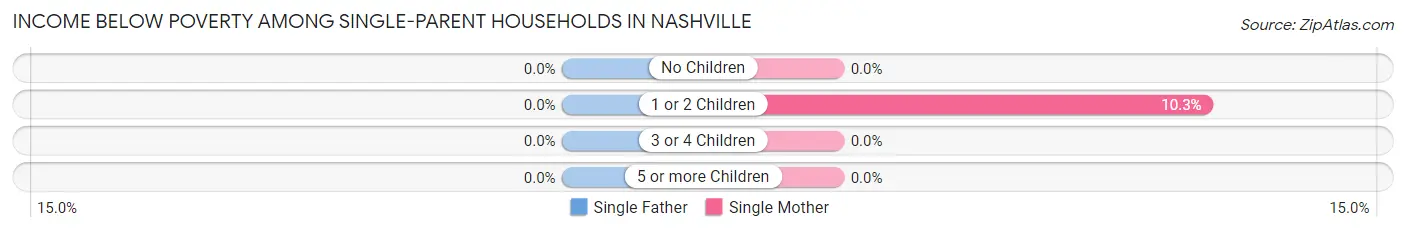
| Children | Single Father | Single Mother |
| No Children | 0 (0.0%) | 0 (0.0%) |
| 1 or 2 Children | 0 (0.0%) | 22 (10.3%) |
| 3 or 4 Children | 0 (0.0%) | 0 (0.0%) |
| 5 or more Children | 0 (0.0%) | 0 (0.0%) |
| Total | 0 (0.0%) | 22 (7.8%) |
Income Below Poverty Among Married-Couple vs Single-Parent Households in Nashville
The poverty data for Nashville shows that 13 of the married-couple family households (2.4%) and 22 of the single-parent households (7.1%) are living below the poverty level. Within the married-couple family households, those with 1 or 2 children have the highest poverty rate, with 13 households (5.9%) falling below the poverty line. Among the single-parent households, those with 1 or 2 children have the highest poverty rate, with 22 household (9.7%) living below poverty.
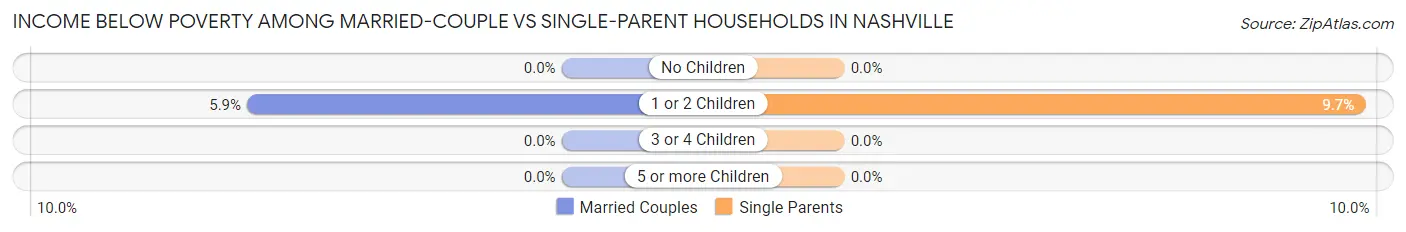
| Children | Married-Couple Families | Single-Parent Households |
| No Children | 0 (0.0%) | 0 (0.0%) |
| 1 or 2 Children | 13 (5.9%) | 22 (9.7%) |
| 3 or 4 Children | 0 (0.0%) | 0 (0.0%) |
| 5 or more Children | 0 (0.0%) | 0 (0.0%) |
| Total | 13 (2.4%) | 22 (7.1%) |
Race in Nashville
The most populous races in Nashville are White / Caucasian (2,947 | 97.4%), Two or more Races (42 | 1.4%), and Black / African American (30 | 1.0%).
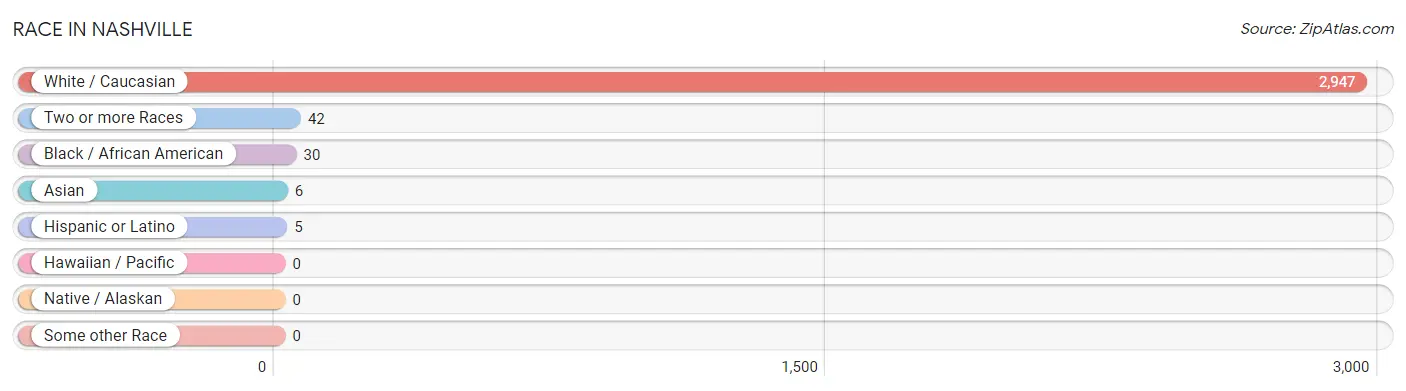
| Race | # Population | % Population |
| Asian | 6 | 0.2% |
| Black / African American | 30 | 1.0% |
| Hawaiian / Pacific | 0 | 0.0% |
| Hispanic or Latino | 5 | 0.2% |
| Native / Alaskan | 0 | 0.0% |
| White / Caucasian | 2,947 | 97.4% |
| Two or more Races | 42 | 1.4% |
| Some other Race | 0 | 0.0% |
| Total | 3,025 | 100.0% |
Ancestry in Nashville
The most populous ancestries reported in Nashville are German (1,426 | 47.1%), Irish (358 | 11.8%), Polish (352 | 11.6%), English (327 | 10.8%), and Italian (185 | 6.1%), together accounting for 87.5% of all Nashville residents.
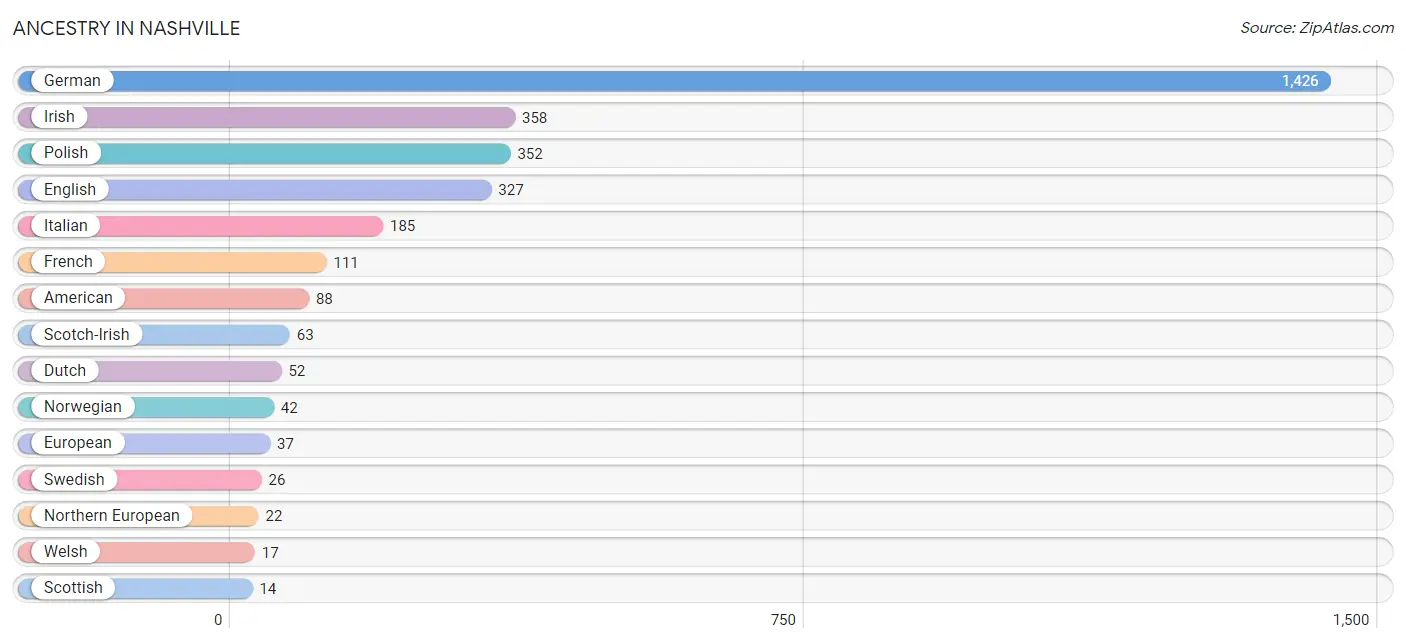
| Ancestry | # Population | % Population |
| American | 88 | 2.9% |
| British | 8 | 0.3% |
| Cherokee | 11 | 0.4% |
| Dutch | 52 | 1.7% |
| English | 327 | 10.8% |
| European | 37 | 1.2% |
| French | 111 | 3.7% |
| German | 1,426 | 47.1% |
| Indian (Asian) | 6 | 0.2% |
| Irish | 358 | 11.8% |
| Italian | 185 | 6.1% |
| Lithuanian | 6 | 0.2% |
| Mexican | 1 | 0.0% |
| Northern European | 22 | 0.7% |
| Norwegian | 42 | 1.4% |
| Polish | 352 | 11.6% |
| Puerto Rican | 4 | 0.1% |
| Scandinavian | 9 | 0.3% |
| Scotch-Irish | 63 | 2.1% |
| Scottish | 14 | 0.5% |
| Swedish | 26 | 0.9% |
| Welsh | 17 | 0.6% | View All 22 Rows |
Immigrants in Nashville

| Immigration Origin | # Population | % Population | View All 0 Rows |
Sex and Age in Nashville
Sex and Age in Nashville
The most populous age groups in Nashville are 40 to 44 Years (165 | 12.1%) for men and 5 to 9 Years (163 | 9.8%) for women.
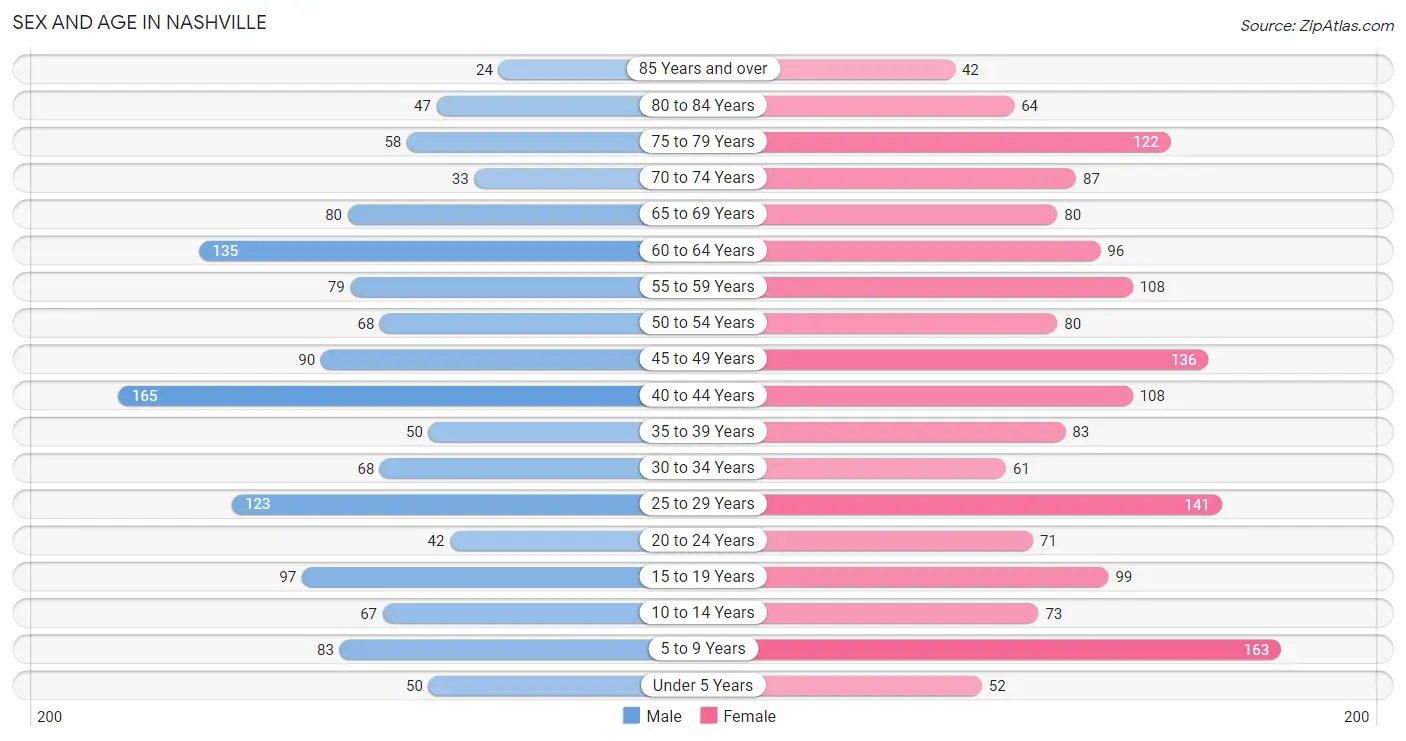
| Age Bracket | Male | Female |
| Under 5 Years | 50 (3.7%) | 52 (3.1%) |
| 5 to 9 Years | 83 (6.1%) | 163 (9.8%) |
| 10 to 14 Years | 67 (4.9%) | 73 (4.4%) |
| 15 to 19 Years | 97 (7.1%) | 99 (5.9%) |
| 20 to 24 Years | 42 (3.1%) | 71 (4.3%) |
| 25 to 29 Years | 123 (9.0%) | 141 (8.5%) |
| 30 to 34 Years | 68 (5.0%) | 61 (3.7%) |
| 35 to 39 Years | 50 (3.7%) | 83 (5.0%) |
| 40 to 44 Years | 165 (12.1%) | 108 (6.5%) |
| 45 to 49 Years | 90 (6.6%) | 136 (8.2%) |
| 50 to 54 Years | 68 (5.0%) | 80 (4.8%) |
| 55 to 59 Years | 79 (5.8%) | 108 (6.5%) |
| 60 to 64 Years | 135 (9.9%) | 96 (5.8%) |
| 65 to 69 Years | 80 (5.9%) | 80 (4.8%) |
| 70 to 74 Years | 33 (2.4%) | 87 (5.2%) |
| 75 to 79 Years | 58 (4.3%) | 122 (7.3%) |
| 80 to 84 Years | 47 (3.5%) | 64 (3.8%) |
| 85 Years and over | 24 (1.8%) | 42 (2.5%) |
| Total | 1,359 (100.0%) | 1,666 (100.0%) |
Families and Households in Nashville
Median Family Size in Nashville
The median family size in Nashville is 2.65 persons per family, with married-couple families (535 | 63.2%) accounting for the largest median family size of 2.81 persons per family. On the other hand, single female/mother families (282 | 33.3%) represent the smallest median family size with 2.34 persons per family.
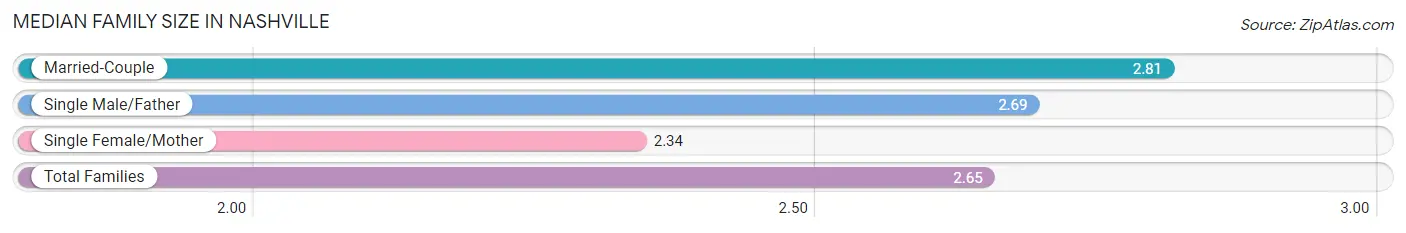
| Family Type | # Families | Family Size |
| Married-Couple | 535 (63.2%) | 2.81 |
| Single Male/Father | 29 (3.4%) | 2.69 |
| Single Female/Mother | 282 (33.3%) | 2.34 |
| Total Families | 846 (100.0%) | 2.65 |
Median Household Size in Nashville
The median household size in Nashville is 2.20 persons per household, with single male/father households (29 | 2.2%) accounting for the largest median household size of 3.31 persons per household. non-family households (459 | 35.2%) represent the smallest median household size with 1.10 persons per household.
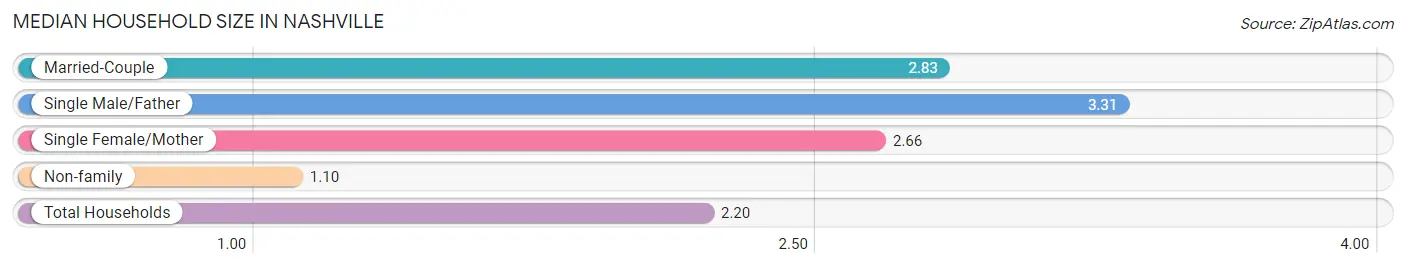
| Household Type | # Households | Household Size |
| Married-Couple | 535 (41.0%) | 2.83 |
| Single Male/Father | 29 (2.2%) | 3.31 |
| Single Female/Mother | 282 (21.6%) | 2.66 |
| Non-family | 459 (35.2%) | 1.10 |
| Total Households | 1,305 (100.0%) | 2.20 |
Household Size by Marriage Status in Nashville
Out of a total of 1,305 households in Nashville, 846 (64.8%) are family households, while 459 (35.2%) are nonfamily households. The most numerous type of family households are 2-person households, comprising 398, and the most common type of nonfamily households are 1-person households, comprising 430.
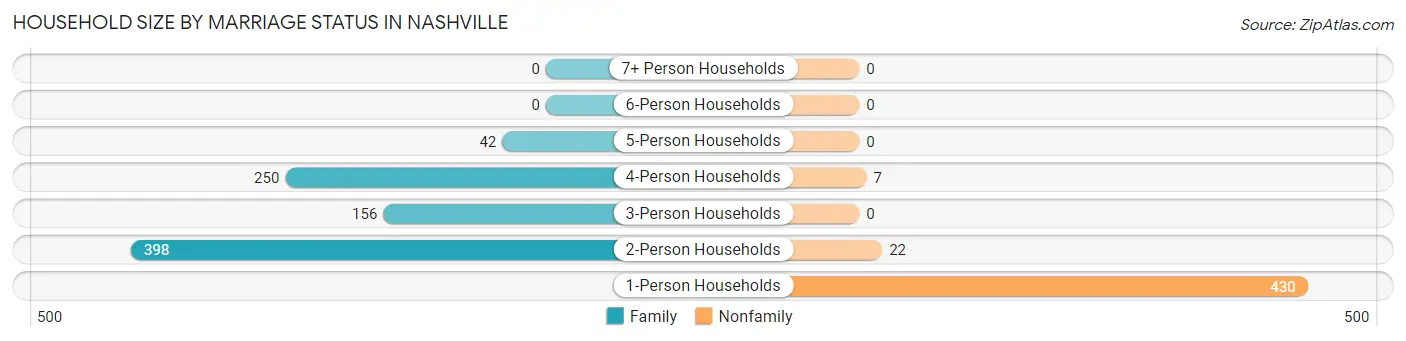
| Household Size | Family Households | Nonfamily Households |
| 1-Person Households | - | 430 (33.0%) |
| 2-Person Households | 398 (30.5%) | 22 (1.7%) |
| 3-Person Households | 156 (11.9%) | 0 (0.0%) |
| 4-Person Households | 250 (19.2%) | 7 (0.5%) |
| 5-Person Households | 42 (3.2%) | 0 (0.0%) |
| 6-Person Households | 0 (0.0%) | 0 (0.0%) |
| 7+ Person Households | 0 (0.0%) | 0 (0.0%) |
| Total | 846 (64.8%) | 459 (35.2%) |
Female Fertility in Nashville
Fertility by Age in Nashville
Average fertility rate in Nashville is 52.0 births per 1,000 women. Women in the age bracket of 20 to 34 years have the highest fertility rate with 62.0 births per 1,000 women. Women in the age bracket of 35 to 50 years acount for 52.8% of all women with births.
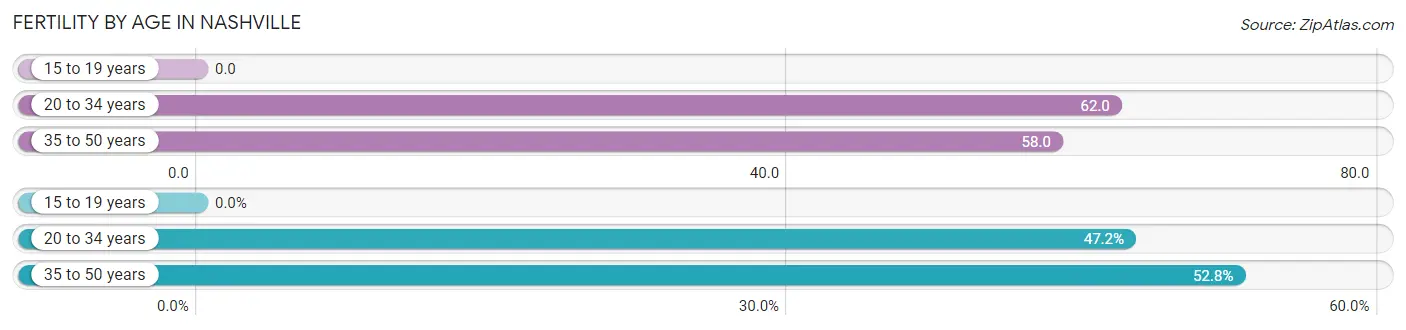
| Age Bracket | Women with Births | Births / 1,000 Women |
| 15 to 19 years | 0 (0.0%) | 0.0 |
| 20 to 34 years | 17 (47.2%) | 62.0 |
| 35 to 50 years | 19 (52.8%) | 58.0 |
| Total | 36 (100.0%) | 52.0 |
Fertility by Age by Marriage Status in Nashville
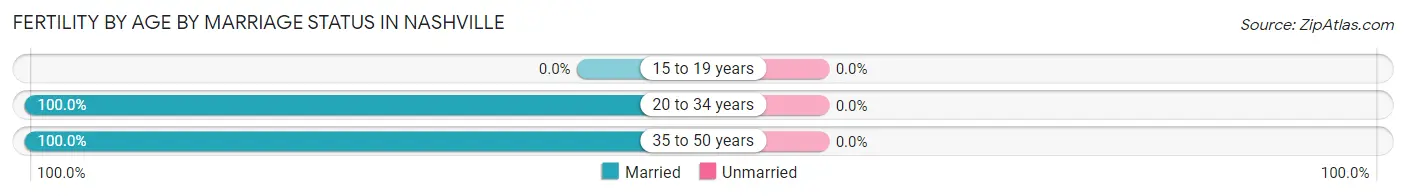
| Age Bracket | Married | Unmarried |
| 15 to 19 years | 0 (0.0%) | 0 (0.0%) |
| 20 to 34 years | 17 (100.0%) | 0 (0.0%) |
| 35 to 50 years | 19 (100.0%) | 0 (0.0%) |
| Total | 36 (100.0%) | 0 (0.0%) |
Fertility by Education in Nashville
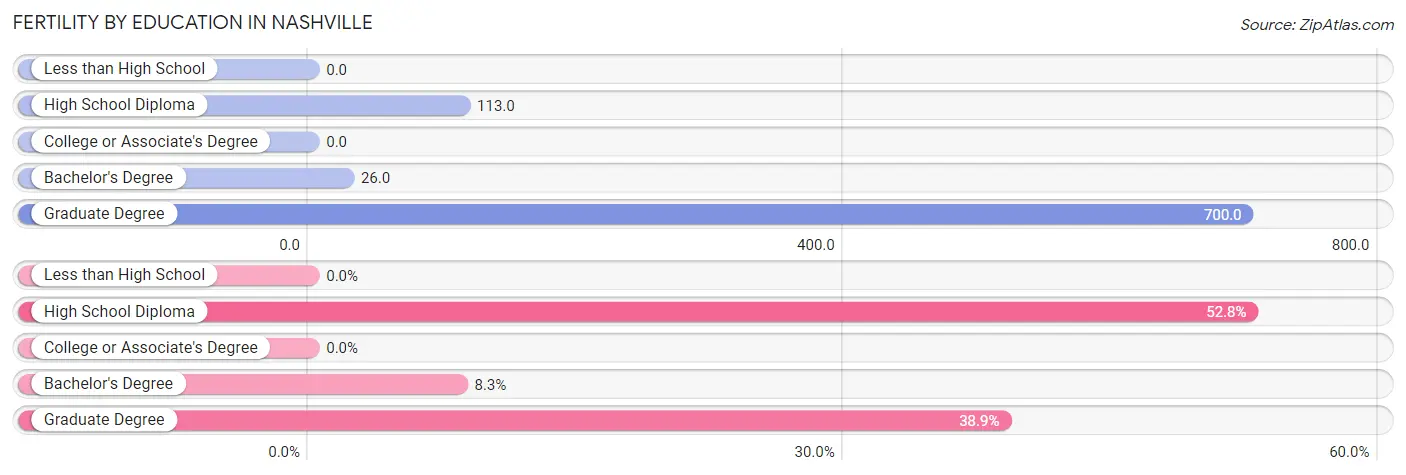
| Educational Attainment | Women with Births | Births / 1,000 Women |
| Less than High School | 0 (0.0%) | 0.0 |
| High School Diploma | 19 (52.8%) | 113.0 |
| College or Associate's Degree | 0 (0.0%) | 0.0 |
| Bachelor's Degree | 3 (8.3%) | 26.0 |
| Graduate Degree | 14 (38.9%) | 700.0 |
| Total | 36 (100.0%) | 52.0 |
Fertility by Education by Marriage Status in Nashville
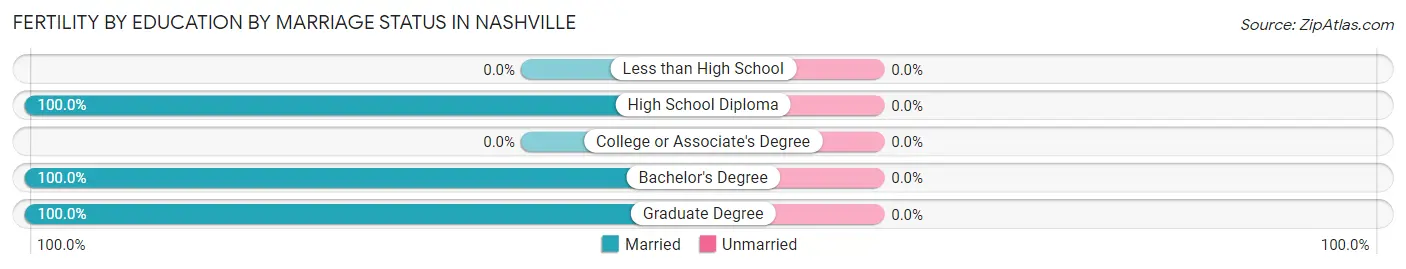
| Educational Attainment | Married | Unmarried |
| Less than High School | 0 (0.0%) | 0 (0.0%) |
| High School Diploma | 19 (100.0%) | 0 (0.0%) |
| College or Associate's Degree | 0 (0.0%) | 0 (0.0%) |
| Bachelor's Degree | 3 (100.0%) | 0 (0.0%) |
| Graduate Degree | 14 (100.0%) | 0 (0.0%) |
| Total | 36 (100.0%) | 0 (0.0%) |
Employment Characteristics in Nashville
Employment by Class of Employer in Nashville
Among the 1,378 employed individuals in Nashville, private company employees (922 | 66.9%), local government employees (160 | 11.6%), and self-employed (not incorporated) (141 | 10.2%) make up the most common classes of employment.
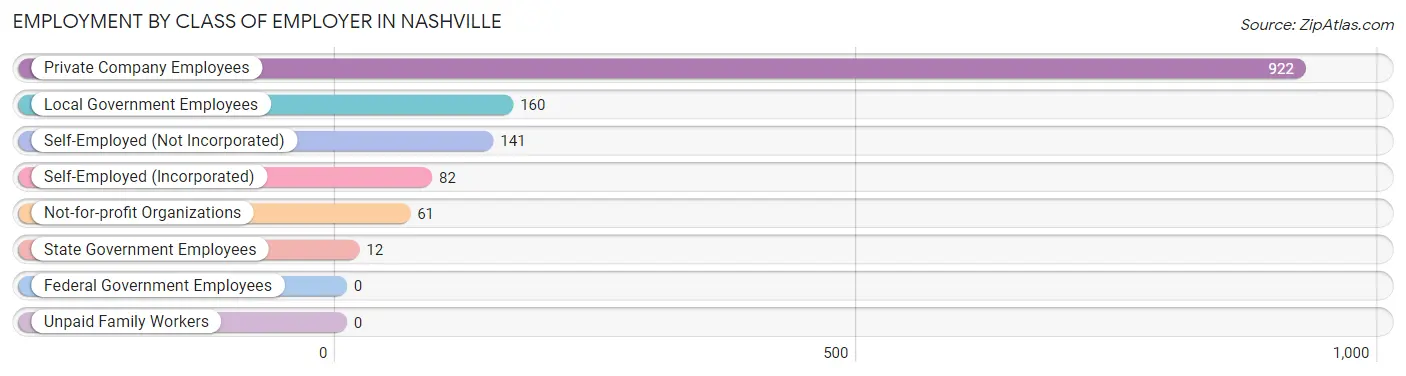
| Employer Class | # Employees | % Employees |
| Private Company Employees | 922 | 66.9% |
| Self-Employed (Incorporated) | 82 | 5.9% |
| Self-Employed (Not Incorporated) | 141 | 10.2% |
| Not-for-profit Organizations | 61 | 4.4% |
| Local Government Employees | 160 | 11.6% |
| State Government Employees | 12 | 0.9% |
| Federal Government Employees | 0 | 0.0% |
| Unpaid Family Workers | 0 | 0.0% |
| Total | 1,378 | 100.0% |
Employment Status by Age in Nashville
According to the labor force statistics for Nashville, out of the total population over 16 years of age (2,517), 61.2% or 1,540 individuals are in the labor force, with 7.6% or 117 of them unemployed. The age group with the highest labor force participation rate is 30 to 34 years, with 89.9% or 116 individuals in the labor force. Within the labor force, the 30 to 34 years age range has the highest percentage of unemployed individuals, with 49.1% or 57 of them being unemployed.
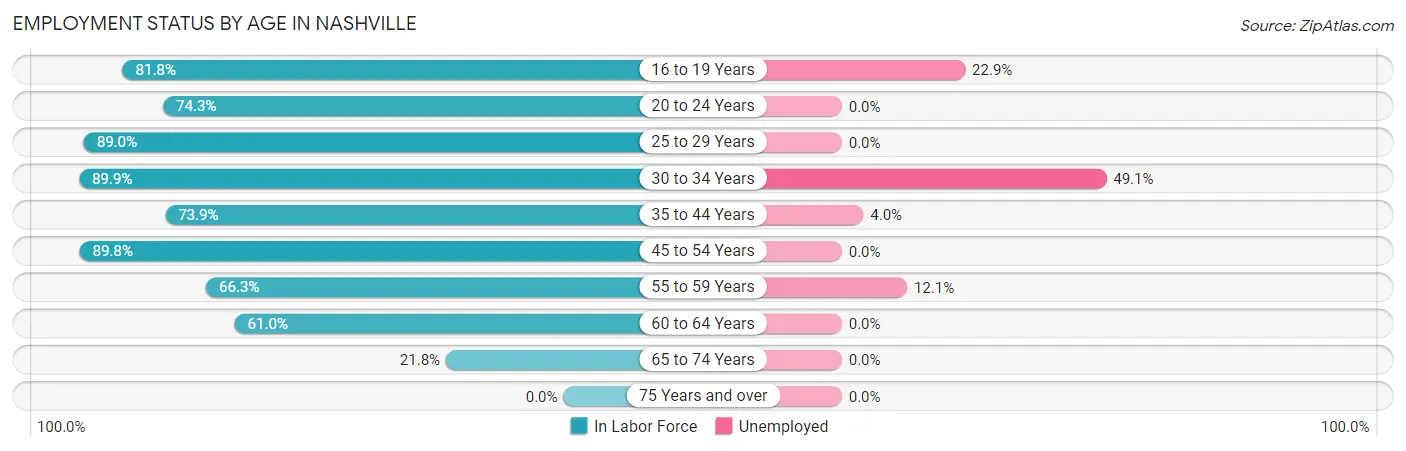
| Age Bracket | In Labor Force | Unemployed |
| 16 to 19 Years | 144 (81.8%) | 33 (22.9%) |
| 20 to 24 Years | 84 (74.3%) | 0 (0.0%) |
| 25 to 29 Years | 235 (89.0%) | 0 (0.0%) |
| 30 to 34 Years | 116 (89.9%) | 57 (49.1%) |
| 35 to 44 Years | 300 (73.9%) | 12 (4.0%) |
| 45 to 54 Years | 336 (89.8%) | 0 (0.0%) |
| 55 to 59 Years | 124 (66.3%) | 15 (12.1%) |
| 60 to 64 Years | 141 (61.0%) | 0 (0.0%) |
| 65 to 74 Years | 61 (21.8%) | 0 (0.0%) |
| 75 Years and over | 0 (0.0%) | 0 (0.0%) |
| Total | 1,540 (61.2%) | 117 (7.6%) |
Employment Status by Educational Attainment in Nashville
According to labor force statistics for Nashville, 78.7% of individuals (1,252) out of the total population between 25 and 64 years of age (1,591) are in the labor force, with 6.7% or 84 of them being unemployed. The group with the highest labor force participation rate are those with the educational attainment of bachelor's degree or higher, with 90.5% or 286 individuals in the labor force. Within the labor force, individuals with high school diploma education have the highest percentage of unemployment, with 20.1% or 59 of them being unemployed.
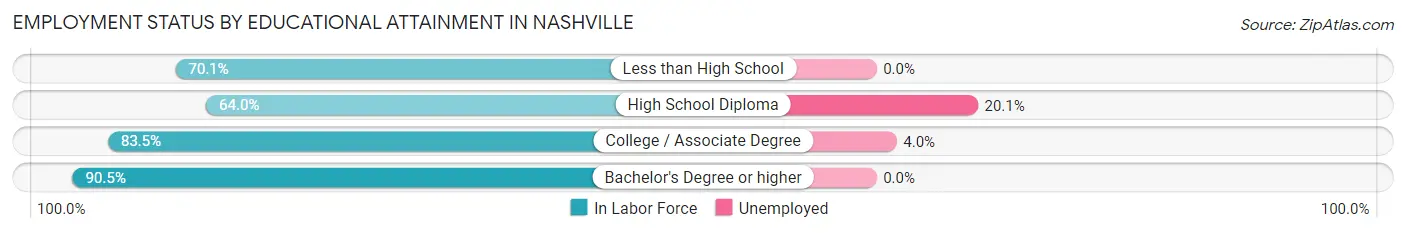
| Educational Attainment | In Labor Force | Unemployed |
| Less than High School | 47 (70.1%) | 0 (0.0%) |
| High School Diploma | 293 (64.0%) | 92 (20.1%) |
| College / Associate Degree | 626 (83.5%) | 30 (4.0%) |
| Bachelor's Degree or higher | 286 (90.5%) | 0 (0.0%) |
| Total | 1,252 (78.7%) | 107 (6.7%) |
Employment Occupations by Sex in Nashville
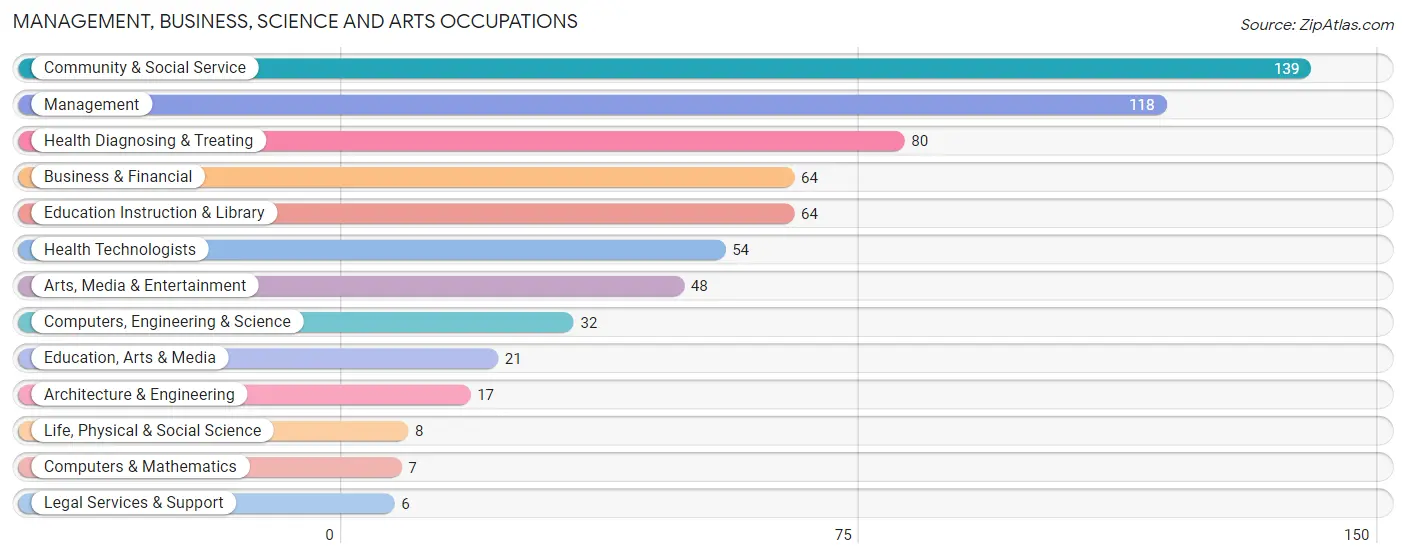
Management, Business, Science and Arts Occupations
The most common Management, Business, Science and Arts occupations in Nashville are Community & Social Service (139 | 9.8%), Management (118 | 8.3%), Health Diagnosing & Treating (80 | 5.6%), Business & Financial (64 | 4.5%), and Education Instruction & Library (64 | 4.5%).
Management, Business, Science and Arts Occupations by Sex
Within the Management, Business, Science and Arts occupations in Nashville, the most male-oriented occupations are Life, Physical & Social Science (100.0%), Management (67.8%), and Education Instruction & Library (51.6%), while the most female-oriented occupations are Business & Financial (100.0%), Computers & Mathematics (100.0%), and Architecture & Engineering (100.0%).
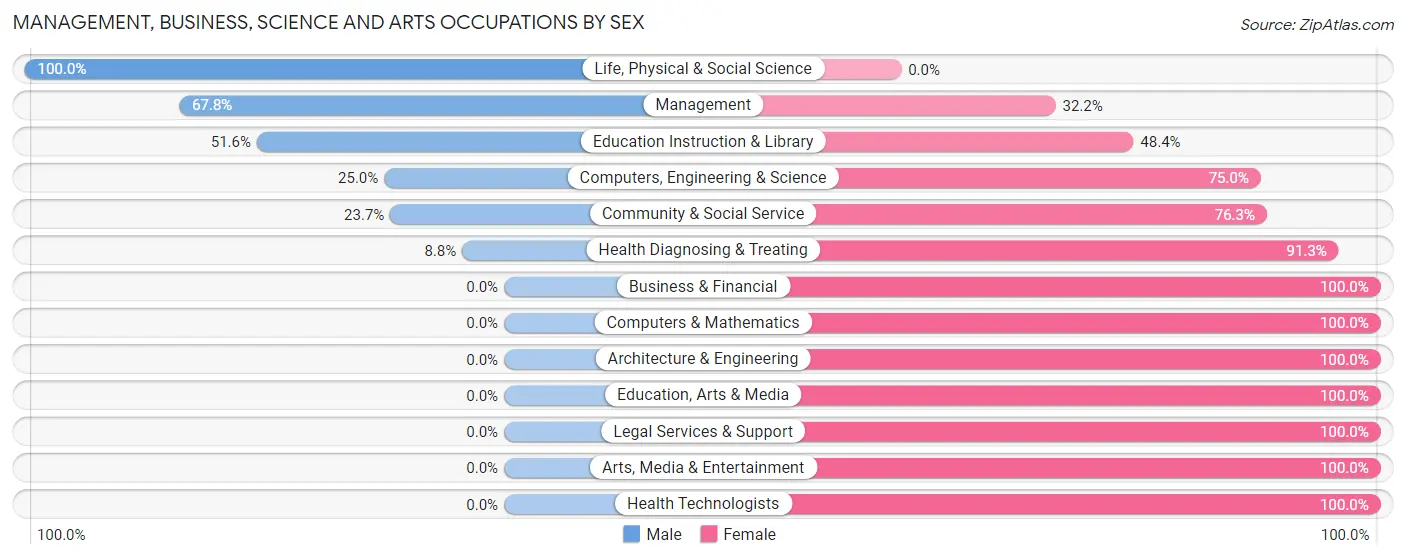
| Occupation | Male | Female |
| Management | 80 (67.8%) | 38 (32.2%) |
| Business & Financial | 0 (0.0%) | 64 (100.0%) |
| Computers, Engineering & Science | 8 (25.0%) | 24 (75.0%) |
| Computers & Mathematics | 0 (0.0%) | 7 (100.0%) |
| Architecture & Engineering | 0 (0.0%) | 17 (100.0%) |
| Life, Physical & Social Science | 8 (100.0%) | 0 (0.0%) |
| Community & Social Service | 33 (23.7%) | 106 (76.3%) |
| Education, Arts & Media | 0 (0.0%) | 21 (100.0%) |
| Legal Services & Support | 0 (0.0%) | 6 (100.0%) |
| Education Instruction & Library | 33 (51.6%) | 31 (48.4%) |
| Arts, Media & Entertainment | 0 (0.0%) | 48 (100.0%) |
| Health Diagnosing & Treating | 7 (8.7%) | 73 (91.2%) |
| Health Technologists | 0 (0.0%) | 54 (100.0%) |
| Total (Category) | 128 (29.6%) | 305 (70.4%) |
| Total (Overall) | 677 (47.5%) | 747 (52.5%) |
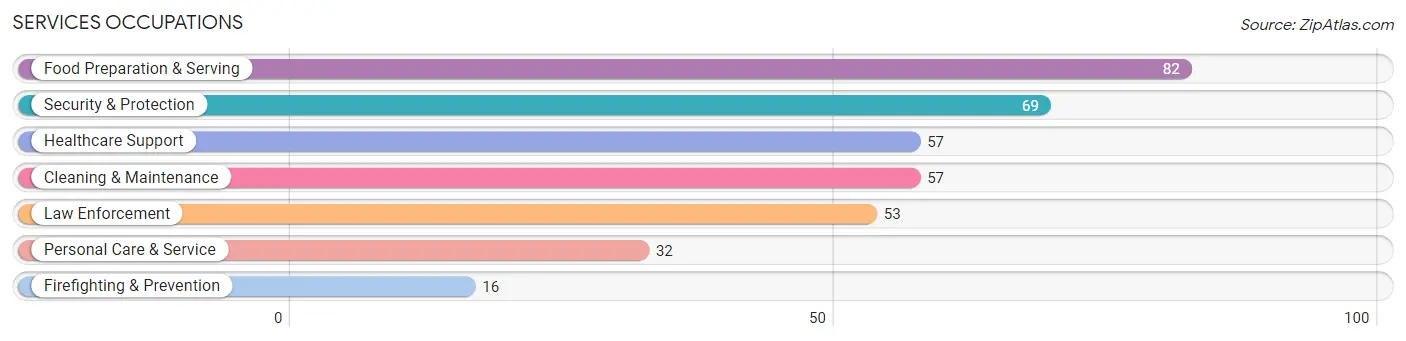
Services Occupations
The most common Services occupations in Nashville are Food Preparation & Serving (82 | 5.8%), Security & Protection (69 | 4.9%), Healthcare Support (57 | 4.0%), Cleaning & Maintenance (57 | 4.0%), and Law Enforcement (53 | 3.7%).
Services Occupations by Sex
Within the Services occupations in Nashville, the most male-oriented occupations are Firefighting & Prevention (100.0%), Security & Protection (79.7%), and Law Enforcement (73.6%), while the most female-oriented occupations are Healthcare Support (100.0%), Food Preparation & Serving (81.7%), and Cleaning & Maintenance (68.4%).
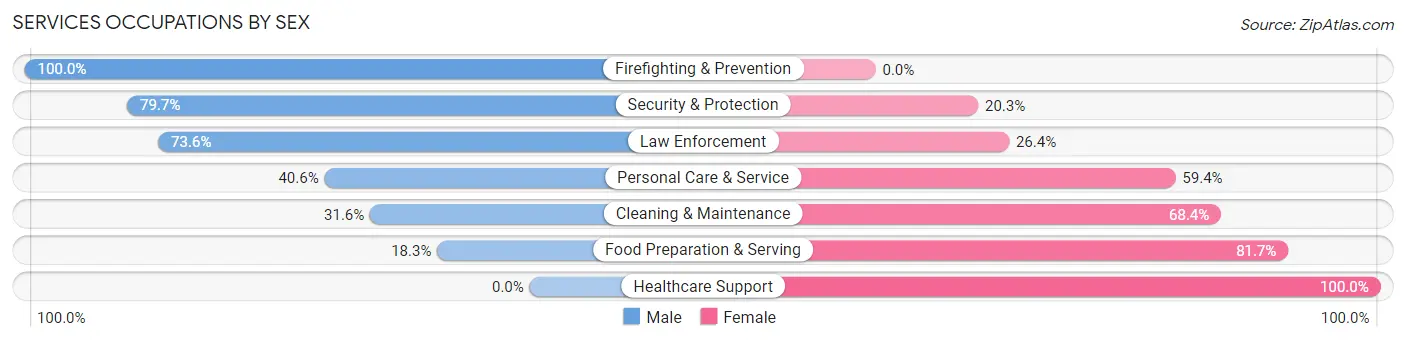
| Occupation | Male | Female |
| Healthcare Support | 0 (0.0%) | 57 (100.0%) |
| Security & Protection | 55 (79.7%) | 14 (20.3%) |
| Firefighting & Prevention | 16 (100.0%) | 0 (0.0%) |
| Law Enforcement | 39 (73.6%) | 14 (26.4%) |
| Food Preparation & Serving | 15 (18.3%) | 67 (81.7%) |
| Cleaning & Maintenance | 18 (31.6%) | 39 (68.4%) |
| Personal Care & Service | 13 (40.6%) | 19 (59.4%) |
| Total (Category) | 101 (34.0%) | 196 (66.0%) |
| Total (Overall) | 677 (47.5%) | 747 (52.5%) |
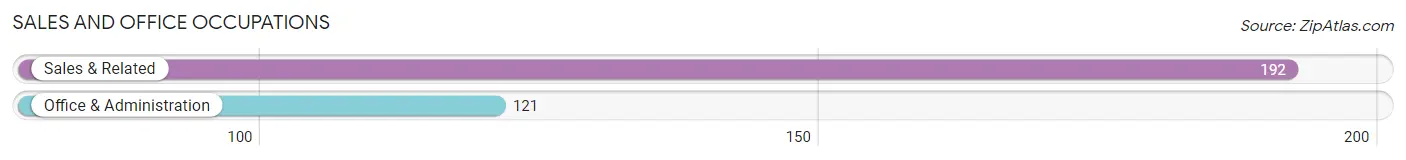
Sales and Office Occupations
The most common Sales and Office occupations in Nashville are Sales & Related (192 | 13.5%), and Office & Administration (121 | 8.5%).
Sales and Office Occupations by Sex

| Occupation | Male | Female |
| Sales & Related | 153 (79.7%) | 39 (20.3%) |
| Office & Administration | 24 (19.8%) | 97 (80.2%) |
| Total (Category) | 177 (56.6%) | 136 (43.4%) |
| Total (Overall) | 677 (47.5%) | 747 (52.5%) |
Natural Resources, Construction and Maintenance Occupations
The most common Natural Resources, Construction and Maintenance occupations in Nashville are Installation, Maintenance & Repair (53 | 3.7%), Construction & Extraction (45 | 3.2%), and Farming, Fishing & Forestry (9 | 0.6%).
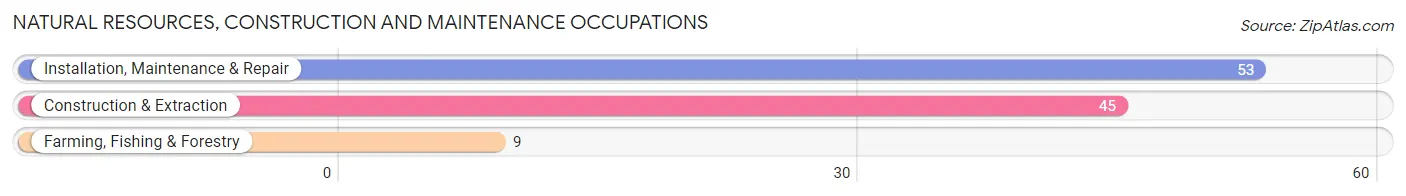
Natural Resources, Construction and Maintenance Occupations by Sex
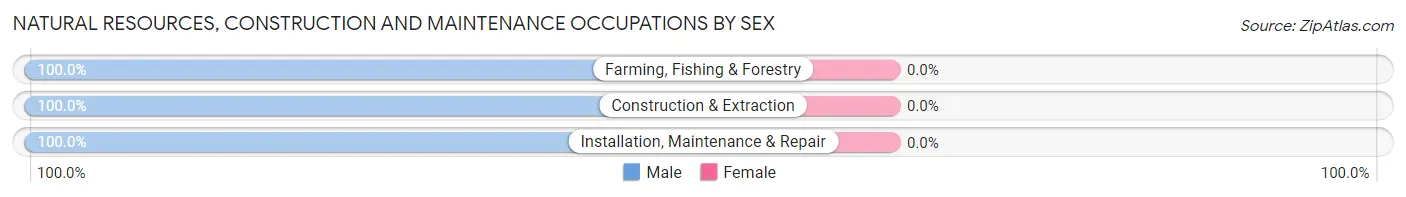
| Occupation | Male | Female |
| Farming, Fishing & Forestry | 9 (100.0%) | 0 (0.0%) |
| Construction & Extraction | 45 (100.0%) | 0 (0.0%) |
| Installation, Maintenance & Repair | 53 (100.0%) | 0 (0.0%) |
| Total (Category) | 107 (100.0%) | 0 (0.0%) |
| Total (Overall) | 677 (47.5%) | 747 (52.5%) |
Production, Transportation and Moving Occupations
The most common Production, Transportation and Moving occupations in Nashville are Production (171 | 12.0%), Transportation (60 | 4.2%), and Material Moving (43 | 3.0%).
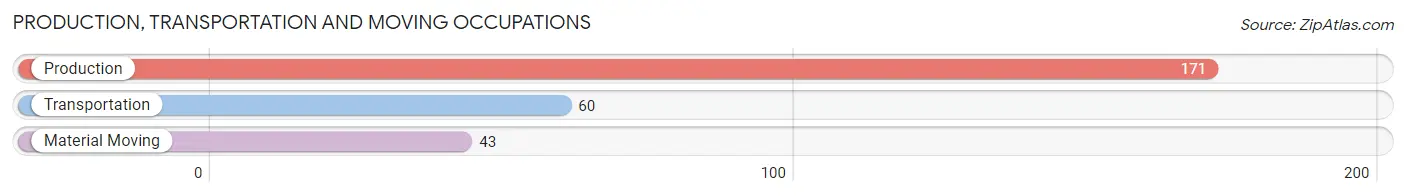
Production, Transportation and Moving Occupations by Sex
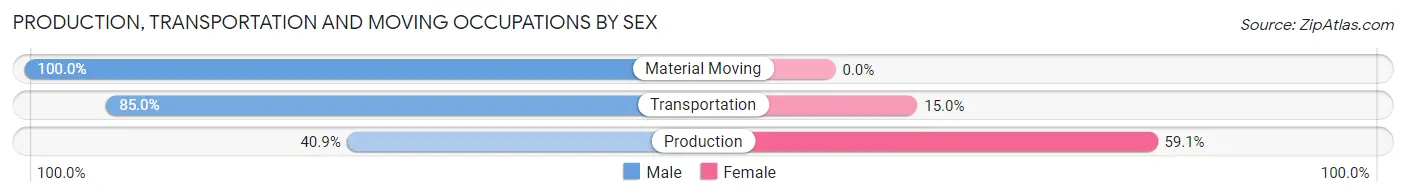
| Occupation | Male | Female |
| Production | 70 (40.9%) | 101 (59.1%) |
| Transportation | 51 (85.0%) | 9 (15.0%) |
| Material Moving | 43 (100.0%) | 0 (0.0%) |
| Total (Category) | 164 (59.9%) | 110 (40.2%) |
| Total (Overall) | 677 (47.5%) | 747 (52.5%) |
Employment Industries by Sex in Nashville
Employment Industries in Nashville
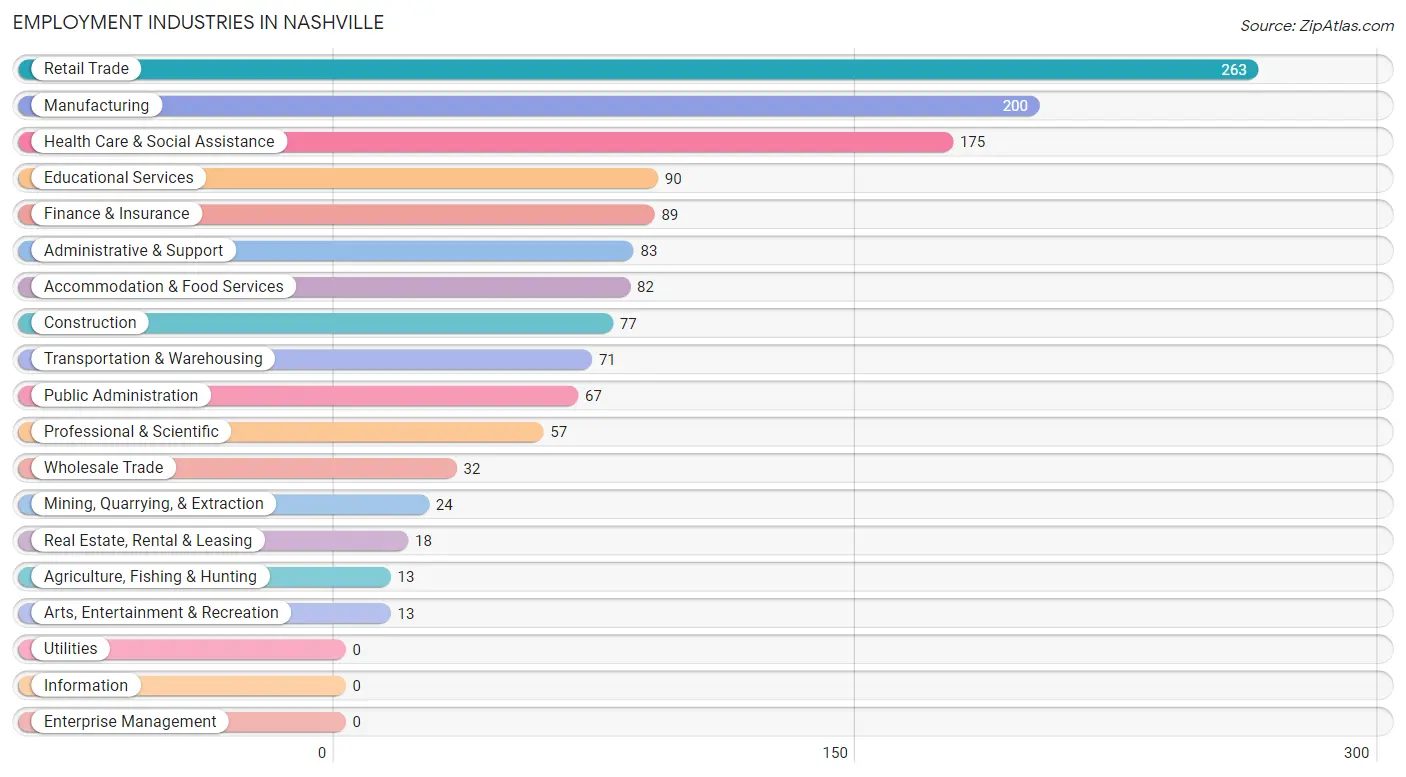
The major employment industries in Nashville include Retail Trade (263 | 18.5%), Manufacturing (200 | 14.0%), Health Care & Social Assistance (175 | 12.3%), Educational Services (90 | 6.3%), and Finance & Insurance (89 | 6.2%).
Employment Industries by Sex in Nashville
The Nashville industries that see more men than women are Agriculture, Fishing & Hunting (100.0%), Mining, Quarrying, & Extraction (100.0%), and Construction (100.0%), whereas the industries that tend to have a higher number of women are Real Estate, Rental & Leasing (100.0%), Administrative & Support (89.2%), and Finance & Insurance (87.6%).
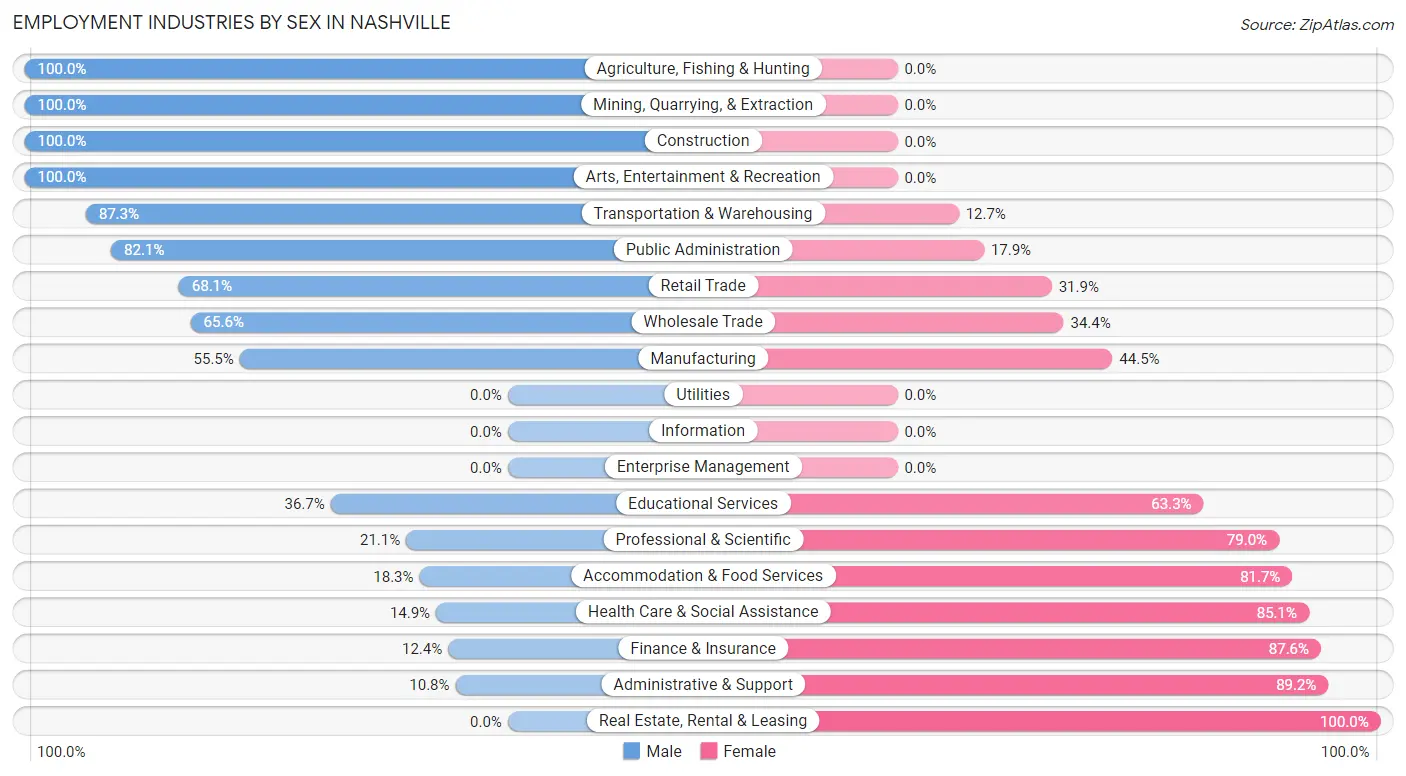
| Industry | Male | Female |
| Agriculture, Fishing & Hunting | 13 (100.0%) | 0 (0.0%) |
| Mining, Quarrying, & Extraction | 24 (100.0%) | 0 (0.0%) |
| Construction | 77 (100.0%) | 0 (0.0%) |
| Manufacturing | 111 (55.5%) | 89 (44.5%) |
| Wholesale Trade | 21 (65.6%) | 11 (34.4%) |
| Retail Trade | 179 (68.1%) | 84 (31.9%) |
| Transportation & Warehousing | 62 (87.3%) | 9 (12.7%) |
| Utilities | 0 (0.0%) | 0 (0.0%) |
| Information | 0 (0.0%) | 0 (0.0%) |
| Finance & Insurance | 11 (12.4%) | 78 (87.6%) |
| Real Estate, Rental & Leasing | 0 (0.0%) | 18 (100.0%) |
| Professional & Scientific | 12 (21.0%) | 45 (78.9%) |
| Enterprise Management | 0 (0.0%) | 0 (0.0%) |
| Administrative & Support | 9 (10.8%) | 74 (89.2%) |
| Educational Services | 33 (36.7%) | 57 (63.3%) |
| Health Care & Social Assistance | 26 (14.9%) | 149 (85.1%) |
| Arts, Entertainment & Recreation | 13 (100.0%) | 0 (0.0%) |
| Accommodation & Food Services | 15 (18.3%) | 67 (81.7%) |
| Public Administration | 55 (82.1%) | 12 (17.9%) |
| Total | 677 (47.5%) | 747 (52.5%) |
Education in Nashville
School Enrollment in Nashville
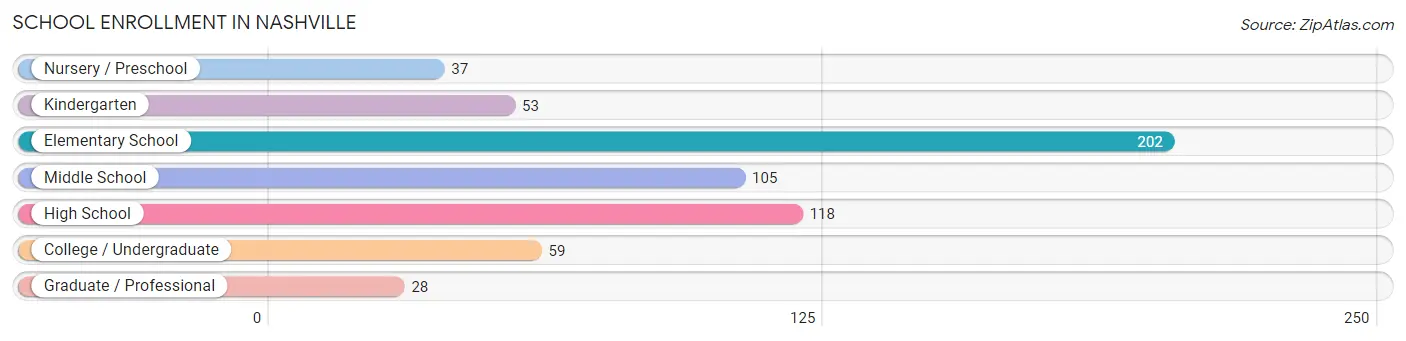
The most common levels of schooling among the 602 students in Nashville are elementary school (202 | 33.6%), high school (118 | 19.6%), and middle school (105 | 17.4%).
| School Level | # Students | % Students |
| Nursery / Preschool | 37 | 6.1% |
| Kindergarten | 53 | 8.8% |
| Elementary School | 202 | 33.6% |
| Middle School | 105 | 17.4% |
| High School | 118 | 19.6% |
| College / Undergraduate | 59 | 9.8% |
| Graduate / Professional | 28 | 4.6% |
| Total | 602 | 100.0% |
School Enrollment by Age by Funding Source in Nashville
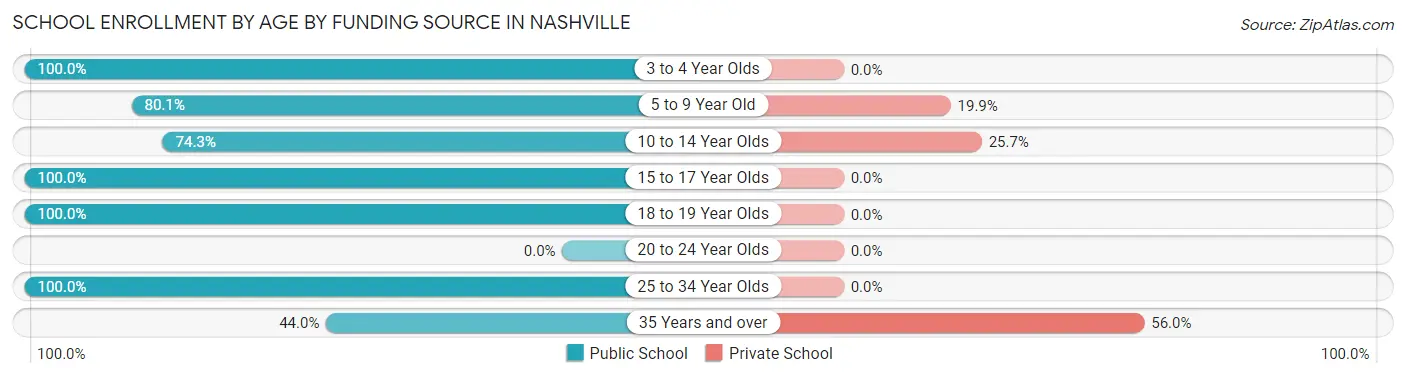
Out of a total of 602 students who are enrolled in schools in Nashville, 99 (16.4%) attend a private institution, while the remaining 503 (83.6%) are enrolled in public schools. The age group of 35 years and over has the highest likelihood of being enrolled in private schools, with 14 (56.0% in the age bracket) enrolled. Conversely, the age group of 3 to 4 year olds has the lowest likelihood of being enrolled in a private school, with 17 (100.0% in the age bracket) attending a public institution.
| Age Bracket | Public School | Private School |
| 3 to 4 Year Olds | 17 (100.0%) | 0 (0.0%) |
| 5 to 9 Year Old | 197 (80.1%) | 49 (19.9%) |
| 10 to 14 Year Olds | 104 (74.3%) | 36 (25.7%) |
| 15 to 17 Year Olds | 112 (100.0%) | 0 (0.0%) |
| 18 to 19 Year Olds | 25 (100.0%) | 0 (0.0%) |
| 20 to 24 Year Olds | 0 (0.0%) | 0 (0.0%) |
| 25 to 34 Year Olds | 37 (100.0%) | 0 (0.0%) |
| 35 Years and over | 11 (44.0%) | 14 (56.0%) |
| Total | 503 (83.6%) | 99 (16.4%) |
Educational Attainment by Field of Study in Nashville
Education (145 | 35.4%), science & technology (89 | 21.8%), bio, nature & agricultural (47 | 11.5%), business (47 | 11.5%), and social sciences (34 | 8.3%) are the most common fields of study among 409 individuals in Nashville who have obtained a bachelor's degree or higher.
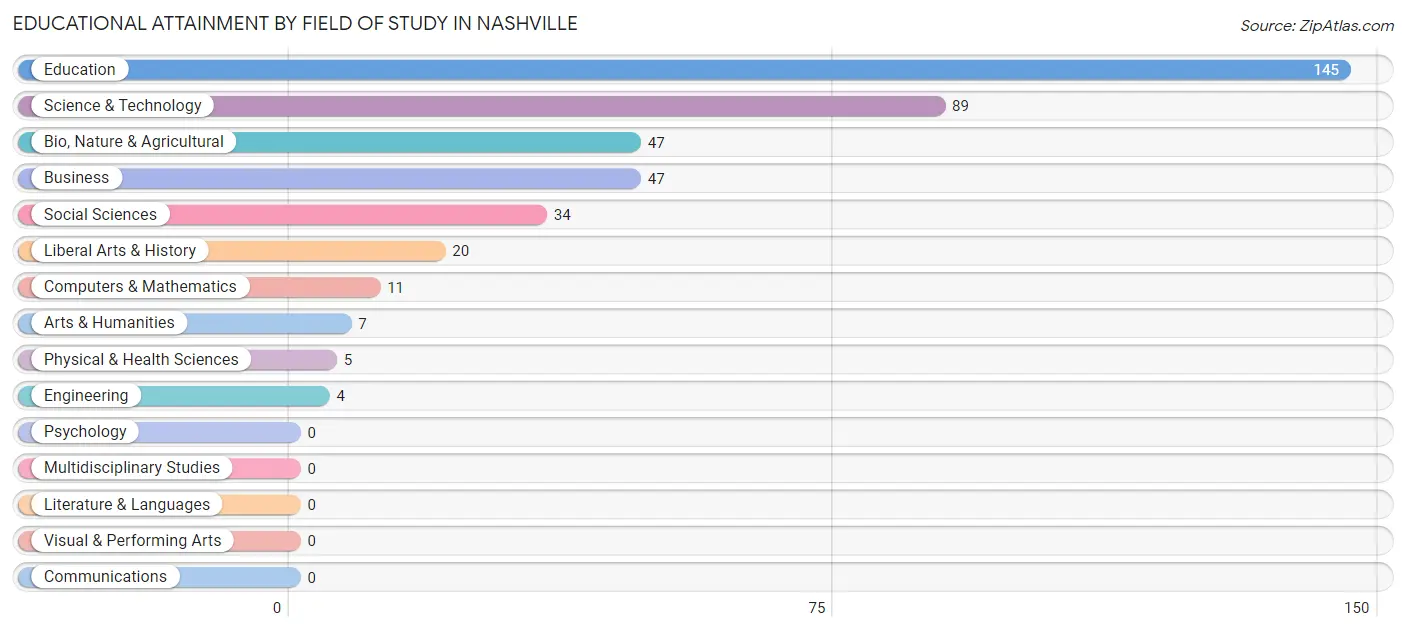
| Field of Study | # Graduates | % Graduates |
| Computers & Mathematics | 11 | 2.7% |
| Bio, Nature & Agricultural | 47 | 11.5% |
| Physical & Health Sciences | 5 | 1.2% |
| Psychology | 0 | 0.0% |
| Social Sciences | 34 | 8.3% |
| Engineering | 4 | 1.0% |
| Multidisciplinary Studies | 0 | 0.0% |
| Science & Technology | 89 | 21.8% |
| Business | 47 | 11.5% |
| Education | 145 | 35.4% |
| Literature & Languages | 0 | 0.0% |
| Liberal Arts & History | 20 | 4.9% |
| Visual & Performing Arts | 0 | 0.0% |
| Communications | 0 | 0.0% |
| Arts & Humanities | 7 | 1.7% |
| Total | 409 | 100.0% |
Transportation & Commute in Nashville
Vehicle Availability by Sex in Nashville
The most prevalent vehicle ownership categories in Nashville are males with 2 vehicles (308, accounting for 45.5%) and females with 2 vehicles (222, making up 43.9%).
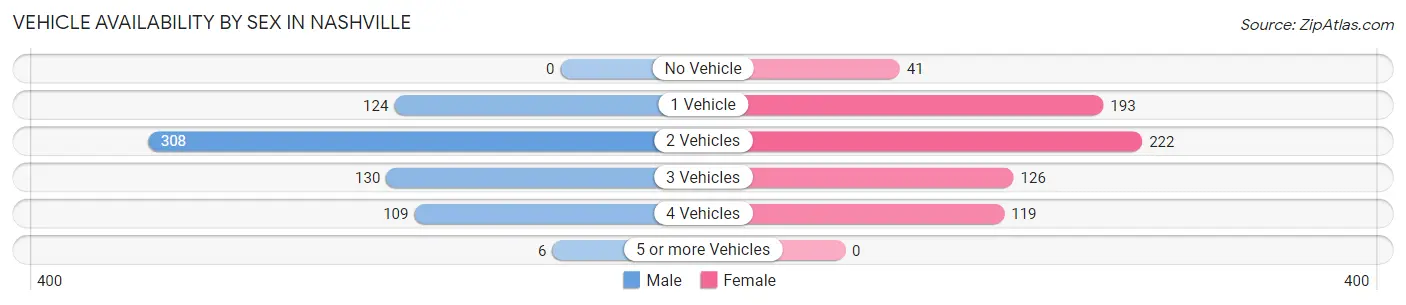
| Vehicles Available | Male | Female |
| No Vehicle | 0 (0.0%) | 41 (5.9%) |
| 1 Vehicle | 124 (18.3%) | 193 (27.5%) |
| 2 Vehicles | 308 (45.5%) | 222 (31.7%) |
| 3 Vehicles | 130 (19.2%) | 126 (18.0%) |
| 4 Vehicles | 109 (16.1%) | 119 (17.0%) |
| 5 or more Vehicles | 6 (0.9%) | 0 (0.0%) |
| Total | 677 (100.0%) | 701 (100.0%) |
Commute Time in Nashville
The most frequently occuring commute durations in Nashville are 5 to 9 minutes (423 commuters, 32.8%), 10 to 14 minutes (162 commuters, 12.6%), and 30 to 34 minutes (146 commuters, 11.3%).
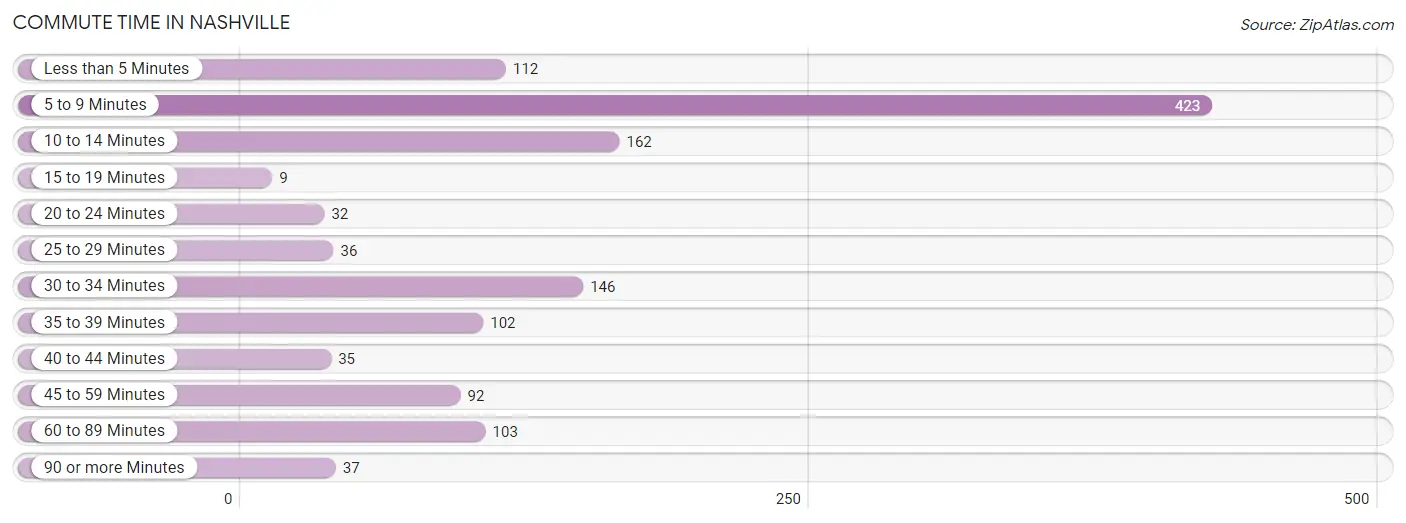
| Commute Time | # Commuters | % Commuters |
| Less than 5 Minutes | 112 | 8.7% |
| 5 to 9 Minutes | 423 | 32.8% |
| 10 to 14 Minutes | 162 | 12.6% |
| 15 to 19 Minutes | 9 | 0.7% |
| 20 to 24 Minutes | 32 | 2.5% |
| 25 to 29 Minutes | 36 | 2.8% |
| 30 to 34 Minutes | 146 | 11.3% |
| 35 to 39 Minutes | 102 | 7.9% |
| 40 to 44 Minutes | 35 | 2.7% |
| 45 to 59 Minutes | 92 | 7.1% |
| 60 to 89 Minutes | 103 | 8.0% |
| 90 or more Minutes | 37 | 2.9% |
Commute Time by Sex in Nashville
The most common commute times in Nashville are 5 to 9 minutes (233 commuters, 35.9%) for males and 5 to 9 minutes (190 commuters, 29.7%) for females.
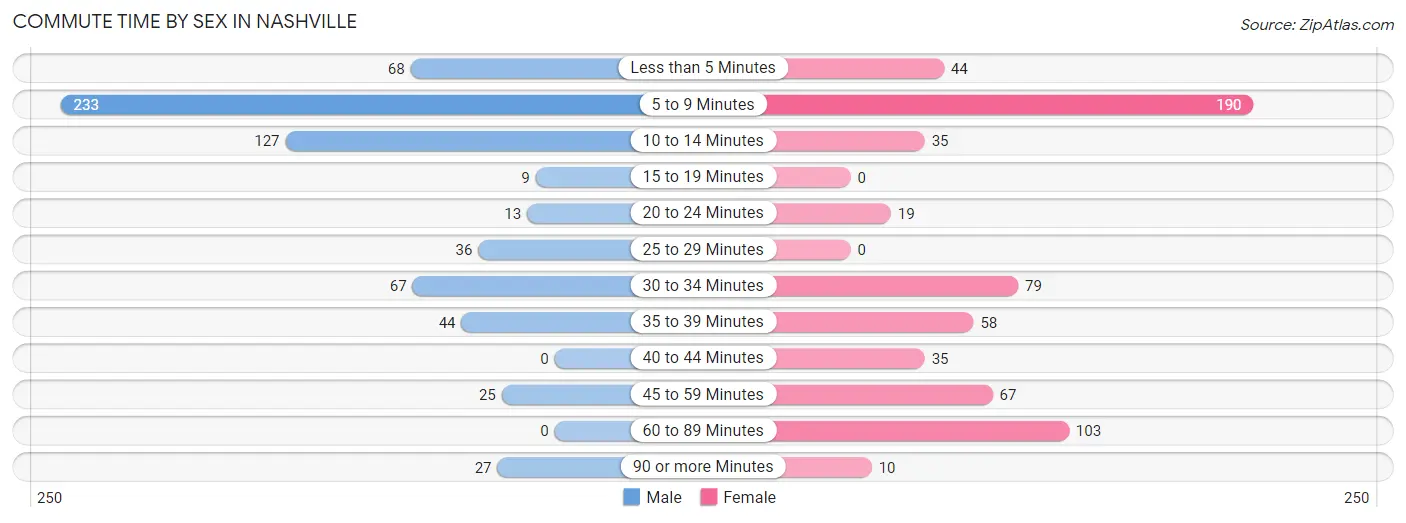
| Commute Time | Male | Female |
| Less than 5 Minutes | 68 (10.5%) | 44 (6.9%) |
| 5 to 9 Minutes | 233 (35.9%) | 190 (29.7%) |
| 10 to 14 Minutes | 127 (19.6%) | 35 (5.5%) |
| 15 to 19 Minutes | 9 (1.4%) | 0 (0.0%) |
| 20 to 24 Minutes | 13 (2.0%) | 19 (3.0%) |
| 25 to 29 Minutes | 36 (5.6%) | 0 (0.0%) |
| 30 to 34 Minutes | 67 (10.3%) | 79 (12.3%) |
| 35 to 39 Minutes | 44 (6.8%) | 58 (9.1%) |
| 40 to 44 Minutes | 0 (0.0%) | 35 (5.5%) |
| 45 to 59 Minutes | 25 (3.8%) | 67 (10.5%) |
| 60 to 89 Minutes | 0 (0.0%) | 103 (16.1%) |
| 90 or more Minutes | 27 (4.2%) | 10 (1.6%) |
Time of Departure to Work by Sex in Nashville
The most frequent times of departure to work in Nashville are 7:30 AM to 7:59 AM (113, 17.4%) for males and 6:30 AM to 6:59 AM (136, 21.2%) for females.
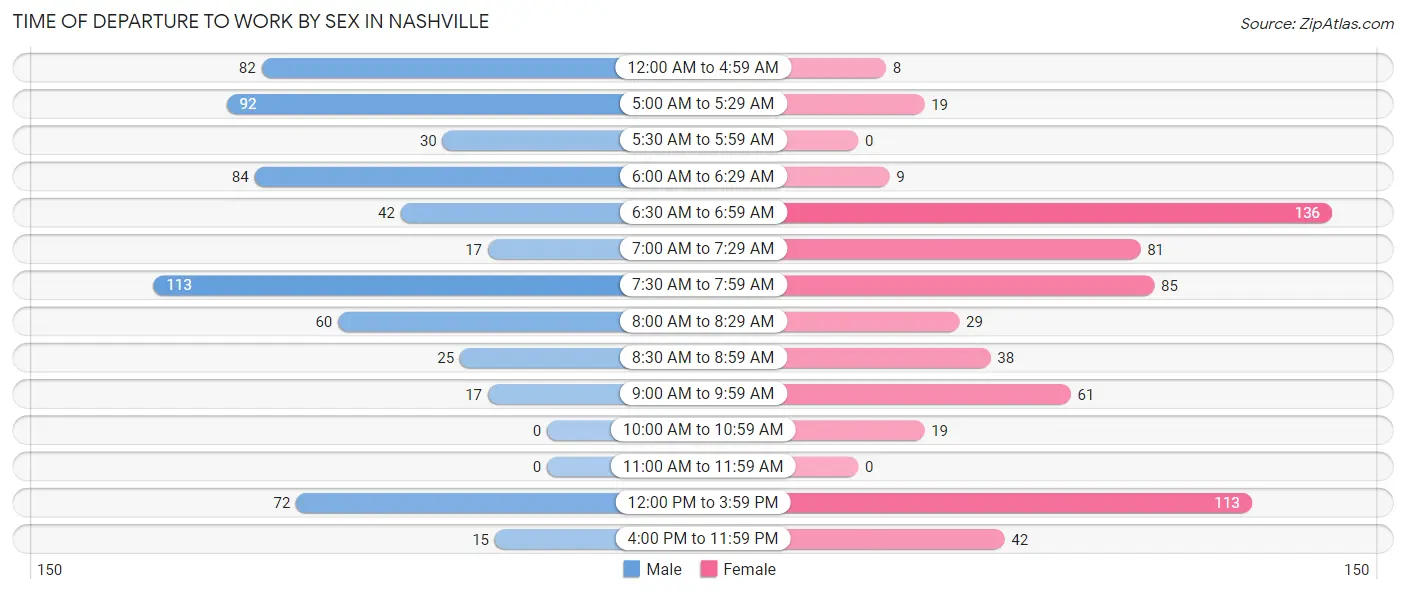
| Time of Departure | Male | Female |
| 12:00 AM to 4:59 AM | 82 (12.6%) | 8 (1.3%) |
| 5:00 AM to 5:29 AM | 92 (14.2%) | 19 (3.0%) |
| 5:30 AM to 5:59 AM | 30 (4.6%) | 0 (0.0%) |
| 6:00 AM to 6:29 AM | 84 (12.9%) | 9 (1.4%) |
| 6:30 AM to 6:59 AM | 42 (6.5%) | 136 (21.2%) |
| 7:00 AM to 7:29 AM | 17 (2.6%) | 81 (12.7%) |
| 7:30 AM to 7:59 AM | 113 (17.4%) | 85 (13.3%) |
| 8:00 AM to 8:29 AM | 60 (9.2%) | 29 (4.5%) |
| 8:30 AM to 8:59 AM | 25 (3.8%) | 38 (5.9%) |
| 9:00 AM to 9:59 AM | 17 (2.6%) | 61 (9.5%) |
| 10:00 AM to 10:59 AM | 0 (0.0%) | 19 (3.0%) |
| 11:00 AM to 11:59 AM | 0 (0.0%) | 0 (0.0%) |
| 12:00 PM to 3:59 PM | 72 (11.1%) | 113 (17.7%) |
| 4:00 PM to 11:59 PM | 15 (2.3%) | 42 (6.6%) |
| Total | 649 (100.0%) | 640 (100.0%) |
Housing Occupancy in Nashville
Occupancy by Ownership in Nashville
Of the total 1,305 dwellings in Nashville, owner-occupied units account for 935 (71.7%), while renter-occupied units make up 370 (28.3%).
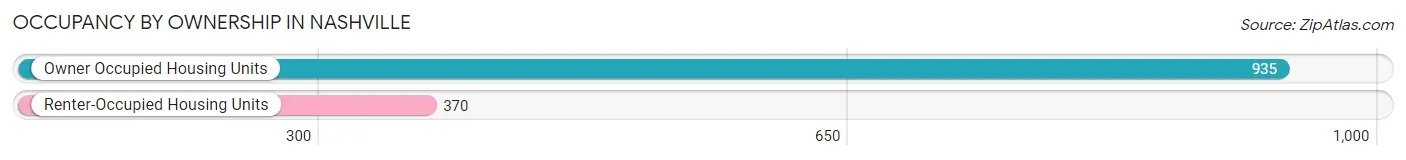
| Occupancy | # Housing Units | % Housing Units |
| Owner Occupied Housing Units | 935 | 71.7% |
| Renter-Occupied Housing Units | 370 | 28.3% |
| Total Occupied Housing Units | 1,305 | 100.0% |
Occupancy by Household Size in Nashville
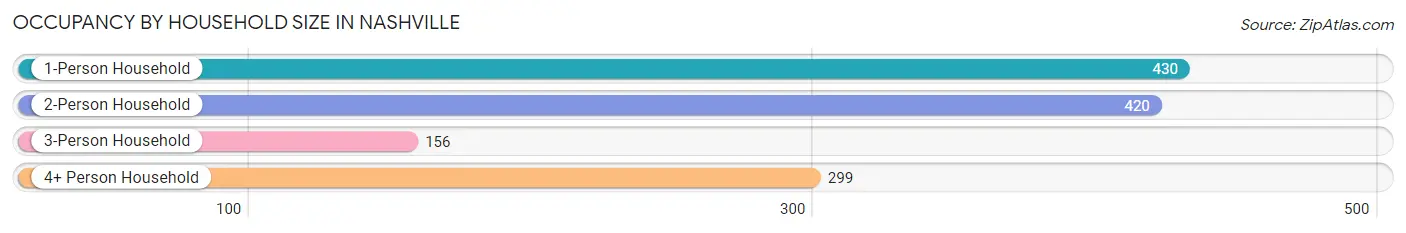
| Household Size | # Housing Units | % Housing Units |
| 1-Person Household | 430 | 33.0% |
| 2-Person Household | 420 | 32.2% |
| 3-Person Household | 156 | 11.9% |
| 4+ Person Household | 299 | 22.9% |
| Total Housing Units | 1,305 | 100.0% |
Occupancy by Ownership by Household Size in Nashville
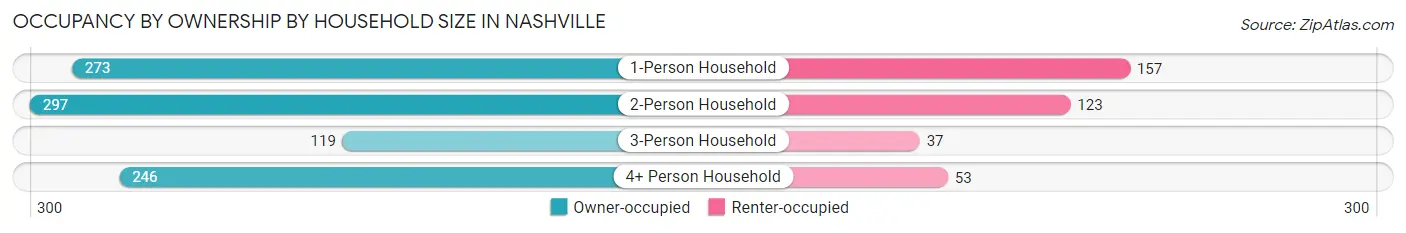
| Household Size | Owner-occupied | Renter-occupied |
| 1-Person Household | 273 (63.5%) | 157 (36.5%) |
| 2-Person Household | 297 (70.7%) | 123 (29.3%) |
| 3-Person Household | 119 (76.3%) | 37 (23.7%) |
| 4+ Person Household | 246 (82.3%) | 53 (17.7%) |
| Total Housing Units | 935 (71.7%) | 370 (28.3%) |
Occupancy by Educational Attainment in Nashville
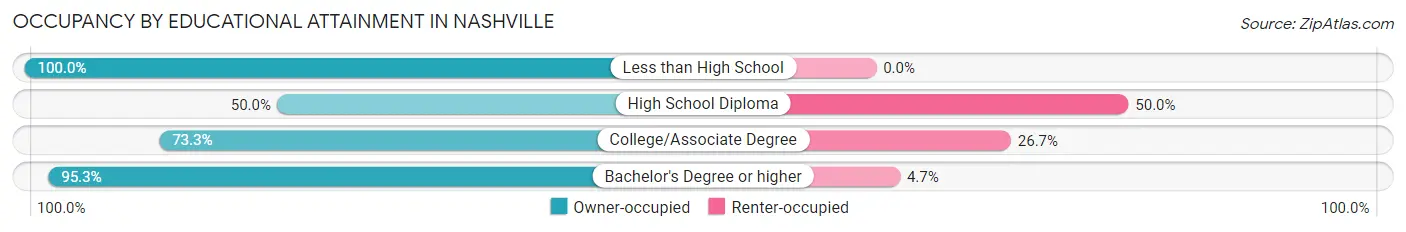
| Household Size | Owner-occupied | Renter-occupied |
| Less than High School | 67 (100.0%) | 0 (0.0%) |
| High School Diploma | 205 (50.0%) | 205 (50.0%) |
| College/Associate Degree | 420 (73.3%) | 153 (26.7%) |
| Bachelor's Degree or higher | 243 (95.3%) | 12 (4.7%) |
Occupancy by Age of Householder in Nashville
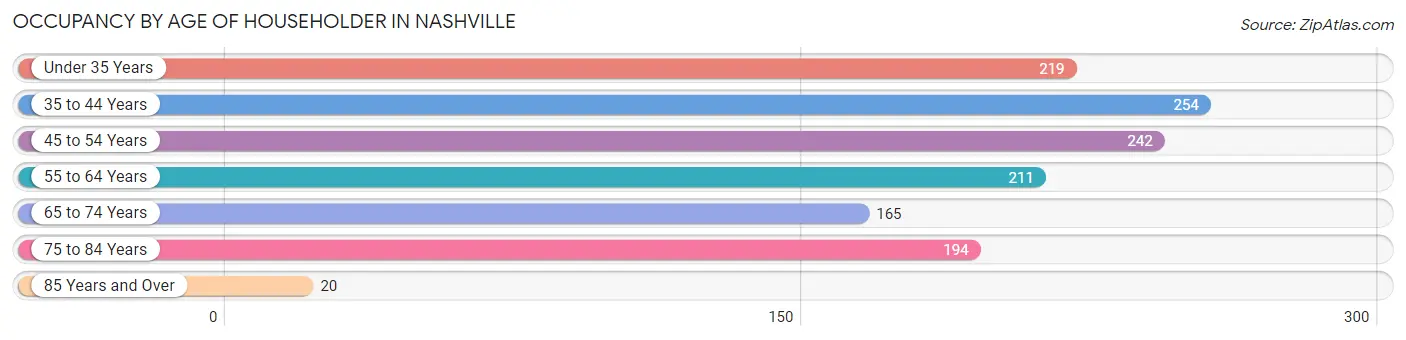
| Age Bracket | # Households | % Households |
| Under 35 Years | 219 | 16.8% |
| 35 to 44 Years | 254 | 19.5% |
| 45 to 54 Years | 242 | 18.5% |
| 55 to 64 Years | 211 | 16.2% |
| 65 to 74 Years | 165 | 12.6% |
| 75 to 84 Years | 194 | 14.9% |
| 85 Years and Over | 20 | 1.5% |
| Total | 1,305 | 100.0% |
Housing Finances in Nashville
Median Income by Occupancy in Nashville
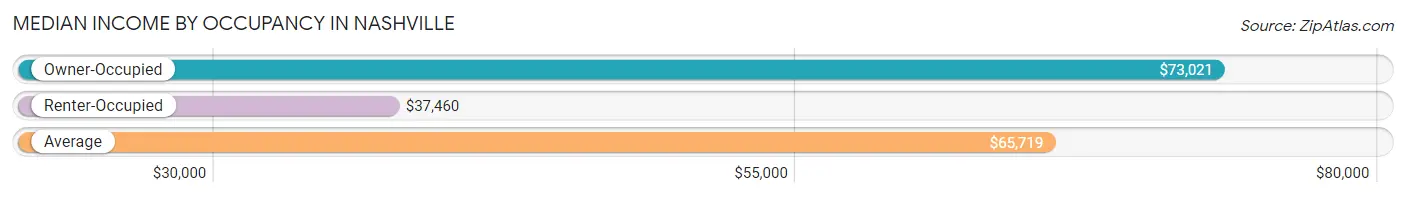
| Occupancy Type | # Households | Median Income |
| Owner-Occupied | 935 (71.7%) | $73,021 |
| Renter-Occupied | 370 (28.3%) | $37,460 |
| Average | 1,305 (100.0%) | $65,719 |
Occupancy by Householder Income Bracket in Nashville
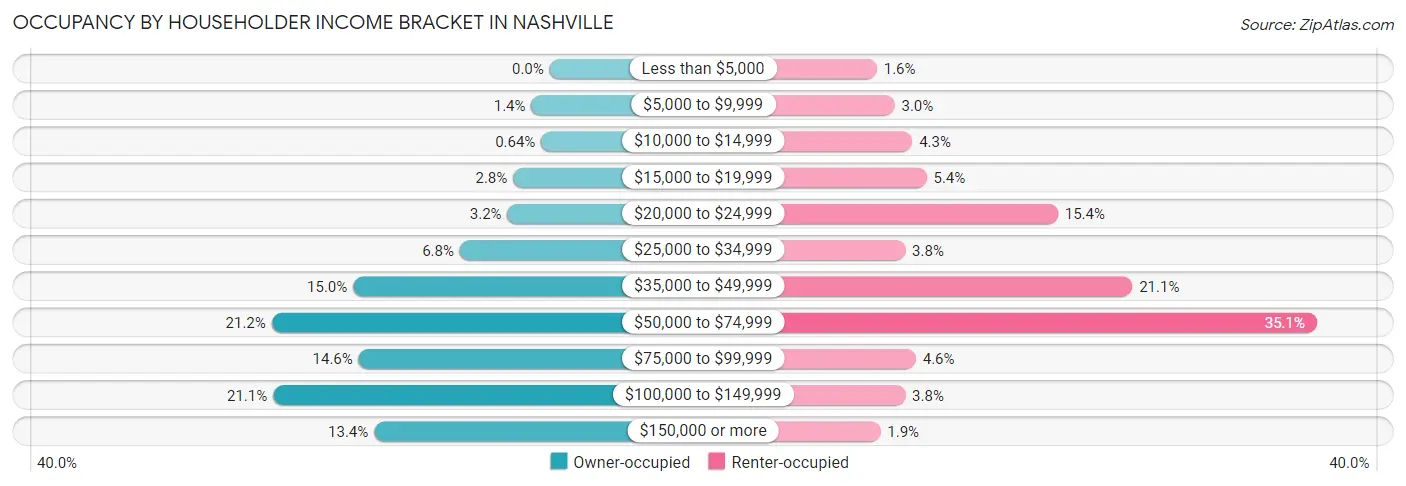
| Income Bracket | Owner-occupied | Renter-occupied |
| Less than $5,000 | 0 (0.0%) | 6 (1.6%) |
| $5,000 to $9,999 | 13 (1.4%) | 11 (3.0%) |
| $10,000 to $14,999 | 6 (0.6%) | 16 (4.3%) |
| $15,000 to $19,999 | 26 (2.8%) | 20 (5.4%) |
| $20,000 to $24,999 | 30 (3.2%) | 57 (15.4%) |
| $25,000 to $34,999 | 64 (6.8%) | 14 (3.8%) |
| $35,000 to $49,999 | 140 (15.0%) | 78 (21.1%) |
| $50,000 to $74,999 | 198 (21.2%) | 130 (35.1%) |
| $75,000 to $99,999 | 136 (14.5%) | 17 (4.6%) |
| $100,000 to $149,999 | 197 (21.1%) | 14 (3.8%) |
| $150,000 or more | 125 (13.4%) | 7 (1.9%) |
| Total | 935 (100.0%) | 370 (100.0%) |
Monthly Housing Cost Tiers in Nashville
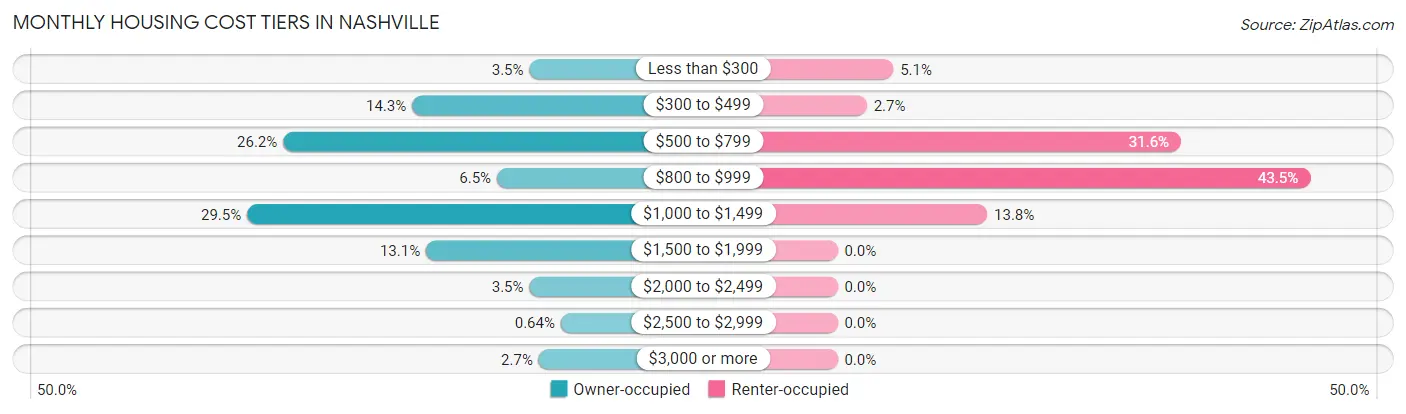
| Monthly Cost | Owner-occupied | Renter-occupied |
| Less than $300 | 33 (3.5%) | 19 (5.1%) |
| $300 to $499 | 134 (14.3%) | 10 (2.7%) |
| $500 to $799 | 245 (26.2%) | 117 (31.6%) |
| $800 to $999 | 61 (6.5%) | 161 (43.5%) |
| $1,000 to $1,499 | 276 (29.5%) | 51 (13.8%) |
| $1,500 to $1,999 | 122 (13.1%) | 0 (0.0%) |
| $2,000 to $2,499 | 33 (3.5%) | 0 (0.0%) |
| $2,500 to $2,999 | 6 (0.6%) | 0 (0.0%) |
| $3,000 or more | 25 (2.7%) | 0 (0.0%) |
| Total | 935 (100.0%) | 370 (100.0%) |
Physical Housing Characteristics in Nashville
Housing Structures in Nashville
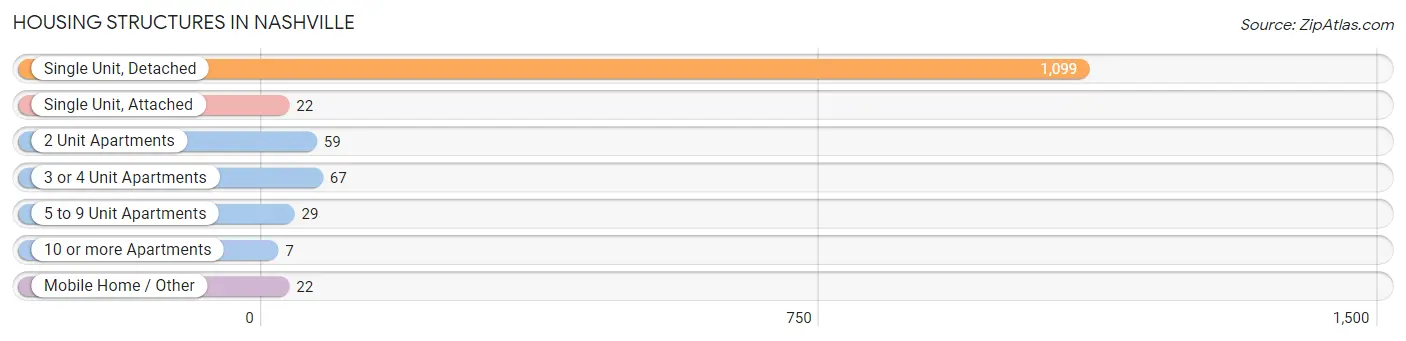
| Structure Type | # Housing Units | % Housing Units |
| Single Unit, Detached | 1,099 | 84.2% |
| Single Unit, Attached | 22 | 1.7% |
| 2 Unit Apartments | 59 | 4.5% |
| 3 or 4 Unit Apartments | 67 | 5.1% |
| 5 to 9 Unit Apartments | 29 | 2.2% |
| 10 or more Apartments | 7 | 0.5% |
| Mobile Home / Other | 22 | 1.7% |
| Total | 1,305 | 100.0% |
Housing Structures by Occupancy in Nashville
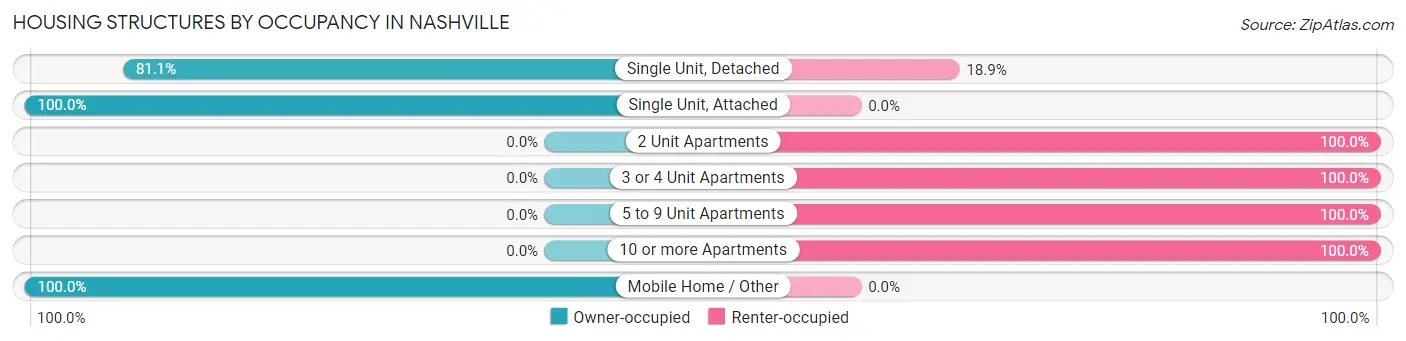
| Structure Type | Owner-occupied | Renter-occupied |
| Single Unit, Detached | 891 (81.1%) | 208 (18.9%) |
| Single Unit, Attached | 22 (100.0%) | 0 (0.0%) |
| 2 Unit Apartments | 0 (0.0%) | 59 (100.0%) |
| 3 or 4 Unit Apartments | 0 (0.0%) | 67 (100.0%) |
| 5 to 9 Unit Apartments | 0 (0.0%) | 29 (100.0%) |
| 10 or more Apartments | 0 (0.0%) | 7 (100.0%) |
| Mobile Home / Other | 22 (100.0%) | 0 (0.0%) |
| Total | 935 (71.7%) | 370 (28.3%) |
Housing Structures by Number of Rooms in Nashville
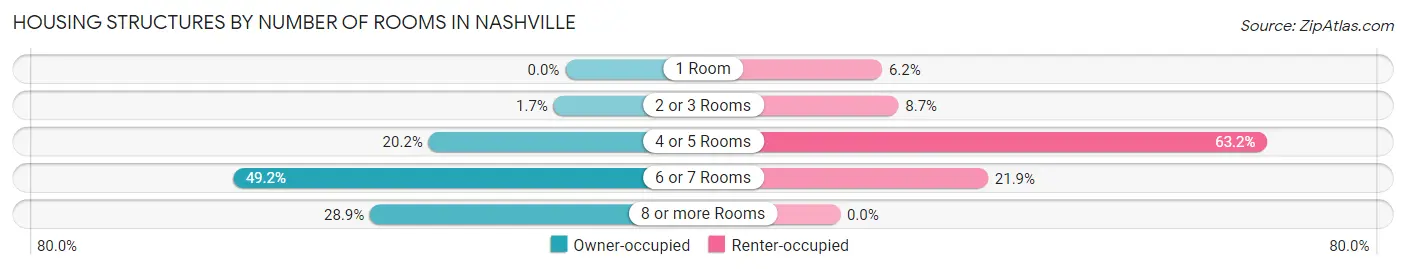
| Number of Rooms | Owner-occupied | Renter-occupied |
| 1 Room | 0 (0.0%) | 23 (6.2%) |
| 2 or 3 Rooms | 16 (1.7%) | 32 (8.6%) |
| 4 or 5 Rooms | 189 (20.2%) | 234 (63.2%) |
| 6 or 7 Rooms | 460 (49.2%) | 81 (21.9%) |
| 8 or more Rooms | 270 (28.9%) | 0 (0.0%) |
| Total | 935 (100.0%) | 370 (100.0%) |
Housing Structure by Heating Type in Nashville
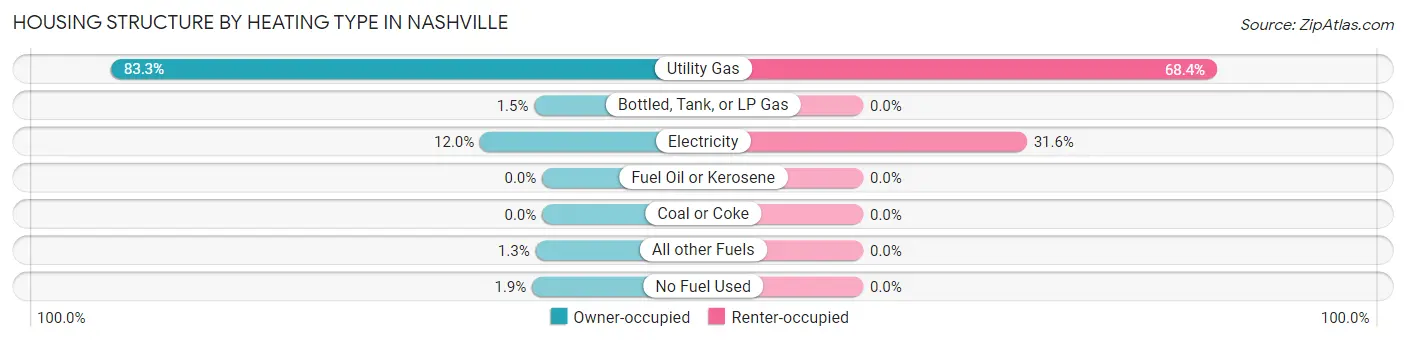
| Heating Type | Owner-occupied | Renter-occupied |
| Utility Gas | 779 (83.3%) | 253 (68.4%) |
| Bottled, Tank, or LP Gas | 14 (1.5%) | 0 (0.0%) |
| Electricity | 112 (12.0%) | 117 (31.6%) |
| Fuel Oil or Kerosene | 0 (0.0%) | 0 (0.0%) |
| Coal or Coke | 0 (0.0%) | 0 (0.0%) |
| All other Fuels | 12 (1.3%) | 0 (0.0%) |
| No Fuel Used | 18 (1.9%) | 0 (0.0%) |
| Total | 935 (100.0%) | 370 (100.0%) |
Household Vehicle Usage in Nashville
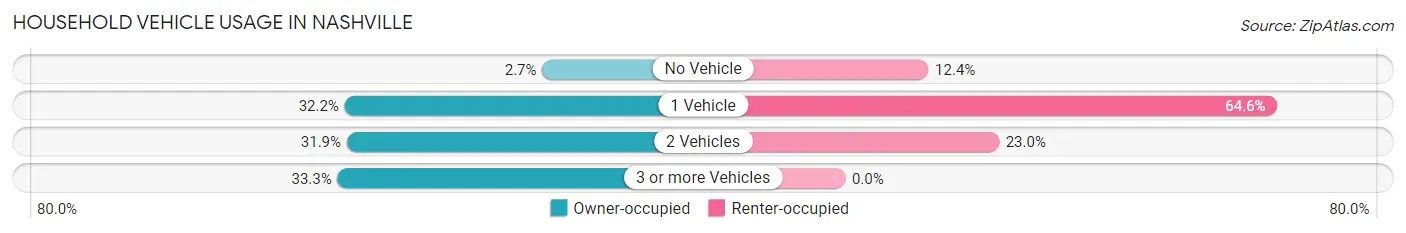
| Vehicles per Household | Owner-occupied | Renter-occupied |
| No Vehicle | 25 (2.7%) | 46 (12.4%) |
| 1 Vehicle | 301 (32.2%) | 239 (64.6%) |
| 2 Vehicles | 298 (31.9%) | 85 (23.0%) |
| 3 or more Vehicles | 311 (33.3%) | 0 (0.0%) |
| Total | 935 (100.0%) | 370 (100.0%) |
Real Estate & Mortgages in Nashville
Real Estate and Mortgage Overview in Nashville
| Characteristic | Without Mortgage | With Mortgage |
| Housing Units | 414 | 521 |
| Median Property Value | $138,400 | $144,100 |
| Median Household Income | $55,000 | $92 |
| Monthly Housing Costs | $563 | $25 |
| Real Estate Taxes | $2,864 | $0 |
Property Value by Mortgage Status in Nashville
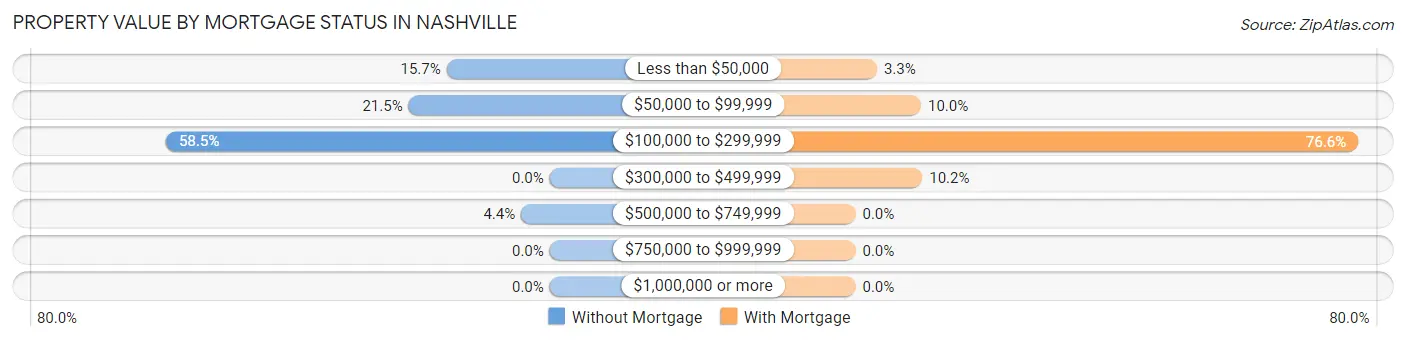
| Property Value | Without Mortgage | With Mortgage |
| Less than $50,000 | 65 (15.7%) | 17 (3.3%) |
| $50,000 to $99,999 | 89 (21.5%) | 52 (10.0%) |
| $100,000 to $299,999 | 242 (58.5%) | 399 (76.6%) |
| $300,000 to $499,999 | 0 (0.0%) | 53 (10.2%) |
| $500,000 to $749,999 | 18 (4.3%) | 0 (0.0%) |
| $750,000 to $999,999 | 0 (0.0%) | 0 (0.0%) |
| $1,000,000 or more | 0 (0.0%) | 0 (0.0%) |
| Total | 414 (100.0%) | 521 (100.0%) |
Household Income by Mortgage Status in Nashville
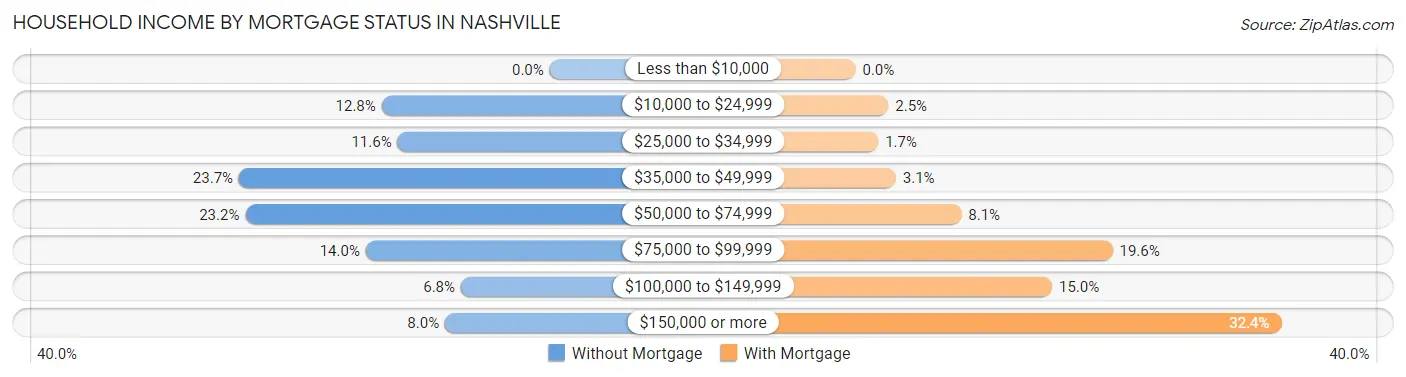
| Household Income | Without Mortgage | With Mortgage |
| Less than $10,000 | 0 (0.0%) | 0 (0.0%) |
| $10,000 to $24,999 | 53 (12.8%) | 13 (2.5%) |
| $25,000 to $34,999 | 48 (11.6%) | 9 (1.7%) |
| $35,000 to $49,999 | 98 (23.7%) | 16 (3.1%) |
| $50,000 to $74,999 | 96 (23.2%) | 42 (8.1%) |
| $75,000 to $99,999 | 58 (14.0%) | 102 (19.6%) |
| $100,000 to $149,999 | 28 (6.8%) | 78 (15.0%) |
| $150,000 or more | 33 (8.0%) | 169 (32.4%) |
| Total | 414 (100.0%) | 521 (100.0%) |
Property Value to Household Income Ratio in Nashville
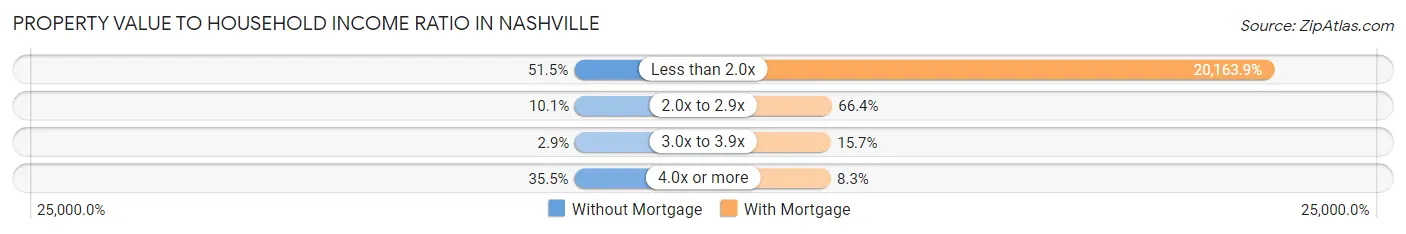
| Value-to-Income Ratio | Without Mortgage | With Mortgage |
| Less than 2.0x | 213 (51.4%) | 105,054 (20,163.9%) |
| 2.0x to 2.9x | 42 (10.1%) | 346 (66.4%) |
| 3.0x to 3.9x | 12 (2.9%) | 82 (15.7%) |
| 4.0x or more | 147 (35.5%) | 43 (8.3%) |
| Total | 414 (100.0%) | 521 (100.0%) |
Real Estate Taxes by Mortgage Status in Nashville
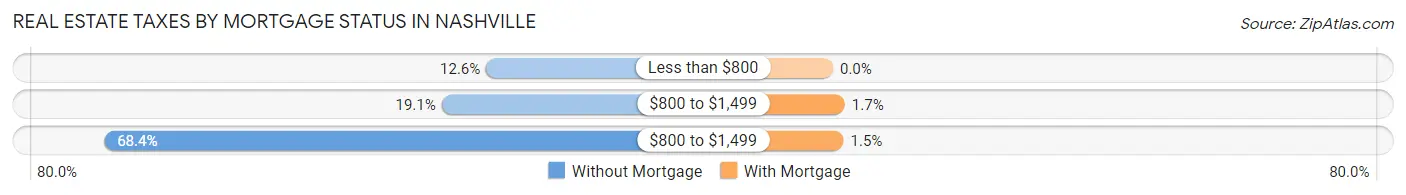
| Property Taxes | Without Mortgage | With Mortgage |
| Less than $800 | 52 (12.6%) | 0 (0.0%) |
| $800 to $1,499 | 79 (19.1%) | 9 (1.7%) |
| $800 to $1,499 | 283 (68.4%) | 8 (1.5%) |
| Total | 414 (100.0%) | 521 (100.0%) |
Health & Disability in Nashville
Health Insurance Coverage by Age in Nashville
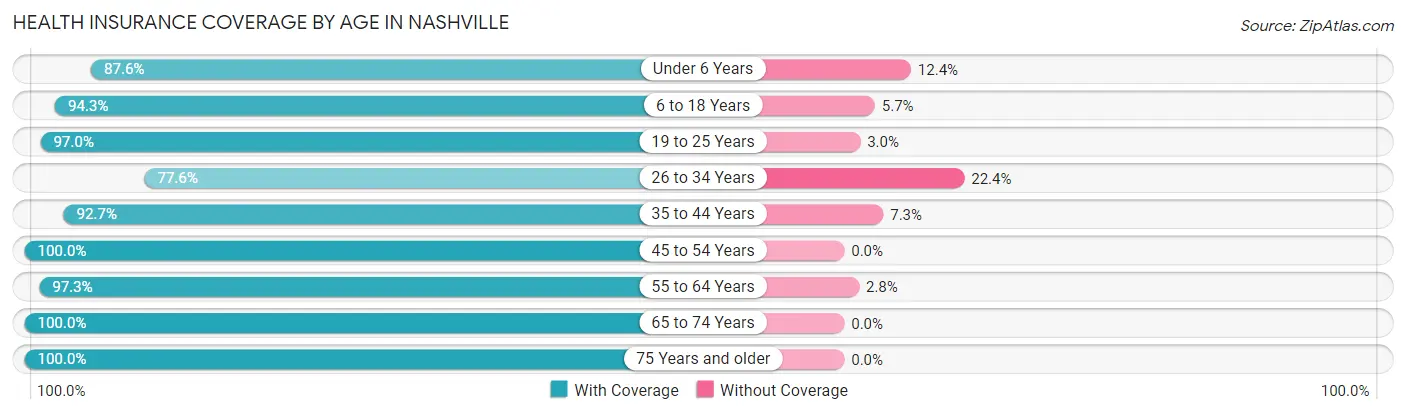
| Age Bracket | With Coverage | Without Coverage |
| Under 6 Years | 141 (87.6%) | 20 (12.4%) |
| 6 to 18 Years | 414 (94.3%) | 25 (5.7%) |
| 19 to 25 Years | 229 (97.0%) | 7 (3.0%) |
| 26 to 34 Years | 267 (77.6%) | 77 (22.4%) |
| 35 to 44 Years | 370 (92.7%) | 29 (7.3%) |
| 45 to 54 Years | 370 (100.0%) | 0 (0.0%) |
| 55 to 64 Years | 389 (97.3%) | 11 (2.8%) |
| 65 to 74 Years | 258 (100.0%) | 0 (0.0%) |
| 75 Years and older | 278 (100.0%) | 0 (0.0%) |
| Total | 2,716 (94.1%) | 169 (5.9%) |
Health Insurance Coverage by Citizenship Status in Nashville
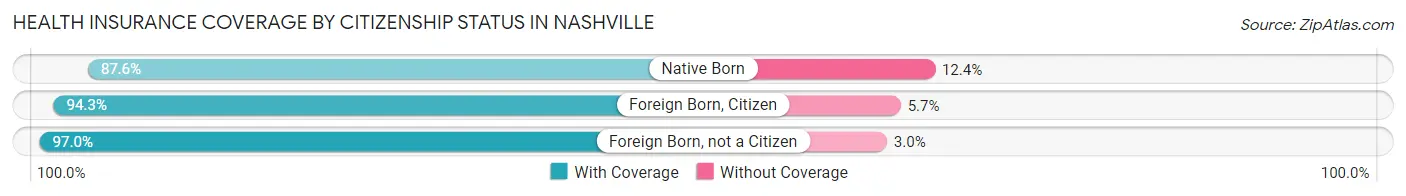
| Citizenship Status | With Coverage | Without Coverage |
| Native Born | 141 (87.6%) | 20 (12.4%) |
| Foreign Born, Citizen | 414 (94.3%) | 25 (5.7%) |
| Foreign Born, not a Citizen | 229 (97.0%) | 7 (3.0%) |
Health Insurance Coverage by Household Income in Nashville
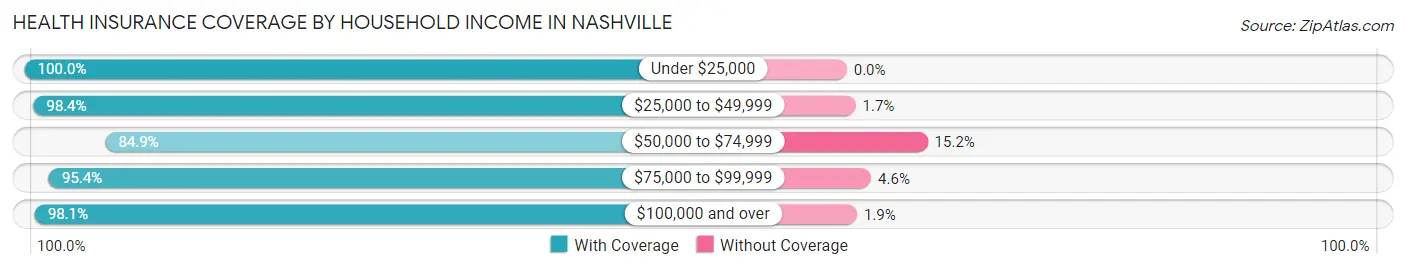
| Household Income | With Coverage | Without Coverage |
| Under $25,000 | 300 (100.0%) | 0 (0.0%) |
| $25,000 to $49,999 | 418 (98.4%) | 7 (1.7%) |
| $50,000 to $74,999 | 633 (84.9%) | 113 (15.1%) |
| $75,000 to $99,999 | 335 (95.4%) | 16 (4.6%) |
| $100,000 and over | 1,023 (98.1%) | 20 (1.9%) |
Public vs Private Health Insurance Coverage by Age in Nashville
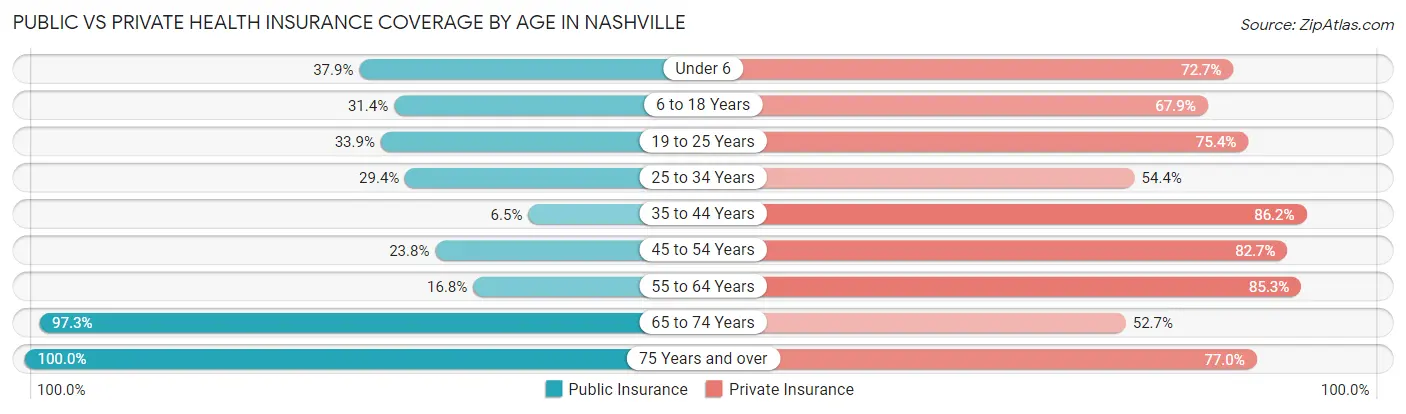
| Age Bracket | Public Insurance | Private Insurance |
| Under 6 | 61 (37.9%) | 117 (72.7%) |
| 6 to 18 Years | 138 (31.4%) | 298 (67.9%) |
| 19 to 25 Years | 80 (33.9%) | 178 (75.4%) |
| 25 to 34 Years | 101 (29.4%) | 187 (54.4%) |
| 35 to 44 Years | 26 (6.5%) | 344 (86.2%) |
| 45 to 54 Years | 88 (23.8%) | 306 (82.7%) |
| 55 to 64 Years | 67 (16.8%) | 341 (85.3%) |
| 65 to 74 Years | 251 (97.3%) | 136 (52.7%) |
| 75 Years and over | 278 (100.0%) | 214 (77.0%) |
| Total | 1,090 (37.8%) | 2,121 (73.5%) |
Disability Status by Sex by Age in Nashville
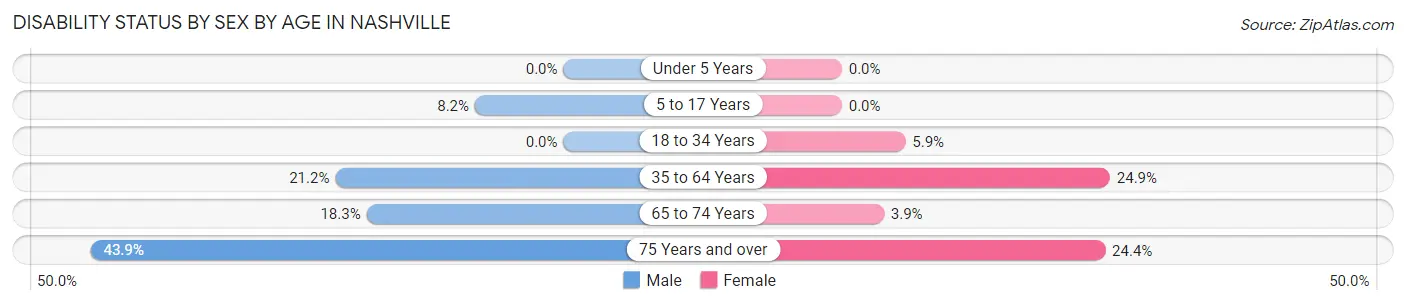
| Age Bracket | Male | Female |
| Under 5 Years | 0 (0.0%) | 0 (0.0%) |
| 5 to 17 Years | 16 (8.2%) | 0 (0.0%) |
| 18 to 34 Years | 0 (0.0%) | 18 (5.9%) |
| 35 to 64 Years | 119 (21.2%) | 151 (24.9%) |
| 65 to 74 Years | 19 (18.3%) | 6 (3.9%) |
| 75 Years and over | 43 (43.9%) | 44 (24.4%) |
Disability Class by Sex by Age in Nashville
Disability Class: Hearing Difficulty
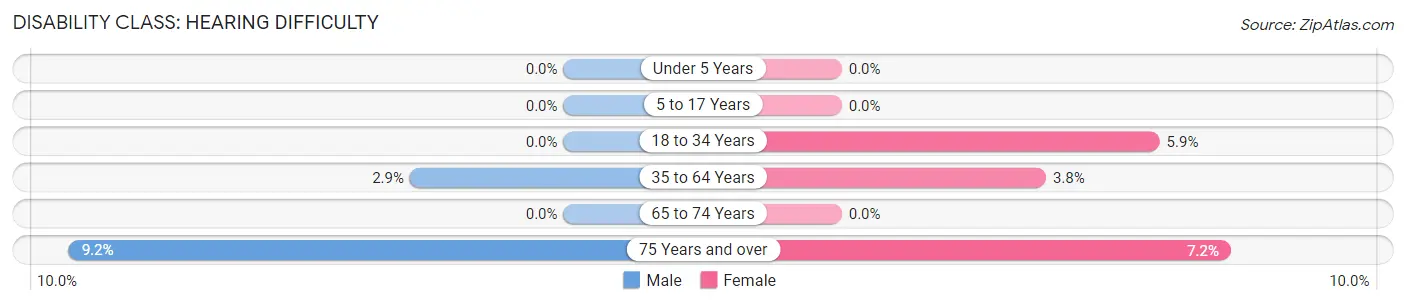
| Age Bracket | Male | Female |
| Under 5 Years | 0 (0.0%) | 0 (0.0%) |
| 5 to 17 Years | 0 (0.0%) | 0 (0.0%) |
| 18 to 34 Years | 0 (0.0%) | 18 (5.9%) |
| 35 to 64 Years | 16 (2.9%) | 23 (3.8%) |
| 65 to 74 Years | 0 (0.0%) | 0 (0.0%) |
| 75 Years and over | 9 (9.2%) | 13 (7.2%) |
Disability Class: Vision Difficulty
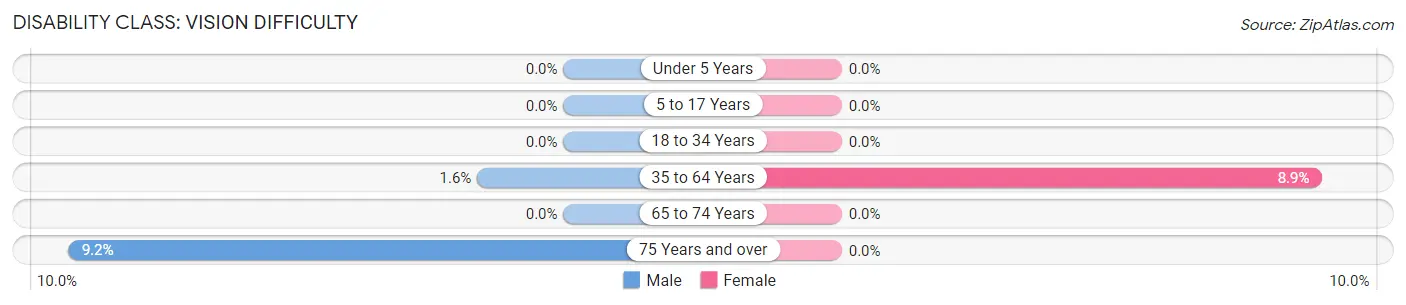
| Age Bracket | Male | Female |
| Under 5 Years | 0 (0.0%) | 0 (0.0%) |
| 5 to 17 Years | 0 (0.0%) | 0 (0.0%) |
| 18 to 34 Years | 0 (0.0%) | 0 (0.0%) |
| 35 to 64 Years | 9 (1.6%) | 54 (8.9%) |
| 65 to 74 Years | 0 (0.0%) | 0 (0.0%) |
| 75 Years and over | 9 (9.2%) | 0 (0.0%) |
Disability Class: Cognitive Difficulty
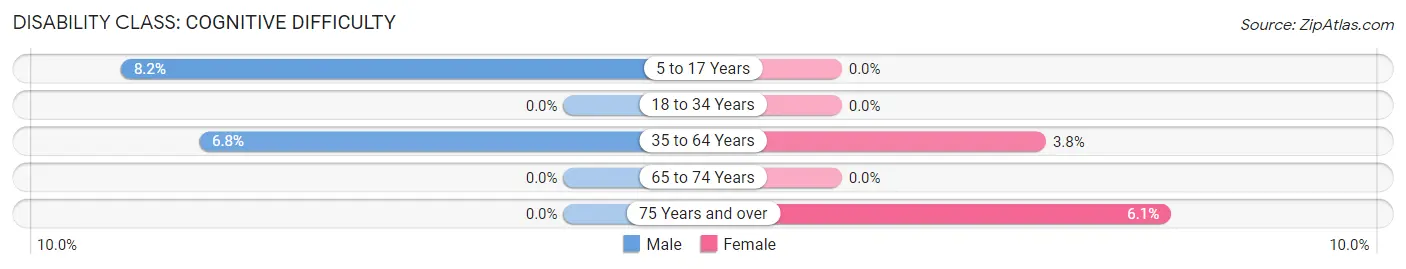
| Age Bracket | Male | Female |
| 5 to 17 Years | 16 (8.2%) | 0 (0.0%) |
| 18 to 34 Years | 0 (0.0%) | 0 (0.0%) |
| 35 to 64 Years | 38 (6.8%) | 23 (3.8%) |
| 65 to 74 Years | 0 (0.0%) | 0 (0.0%) |
| 75 Years and over | 0 (0.0%) | 11 (6.1%) |
Disability Class: Ambulatory Difficulty
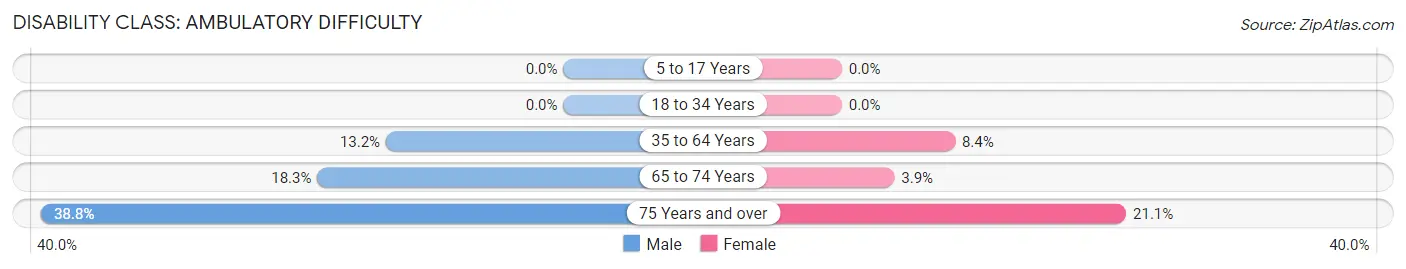
| Age Bracket | Male | Female |
| 5 to 17 Years | 0 (0.0%) | 0 (0.0%) |
| 18 to 34 Years | 0 (0.0%) | 0 (0.0%) |
| 35 to 64 Years | 74 (13.2%) | 51 (8.4%) |
| 65 to 74 Years | 19 (18.3%) | 6 (3.9%) |
| 75 Years and over | 38 (38.8%) | 38 (21.1%) |
Disability Class: Self-Care Difficulty
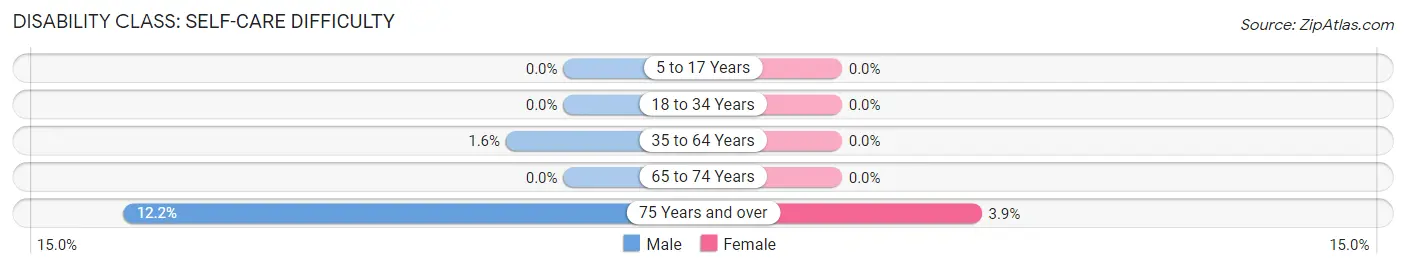
| Age Bracket | Male | Female |
| 5 to 17 Years | 0 (0.0%) | 0 (0.0%) |
| 18 to 34 Years | 0 (0.0%) | 0 (0.0%) |
| 35 to 64 Years | 9 (1.6%) | 0 (0.0%) |
| 65 to 74 Years | 0 (0.0%) | 0 (0.0%) |
| 75 Years and over | 12 (12.2%) | 7 (3.9%) |
Technology Access in Nashville
Computing Device Access in Nashville
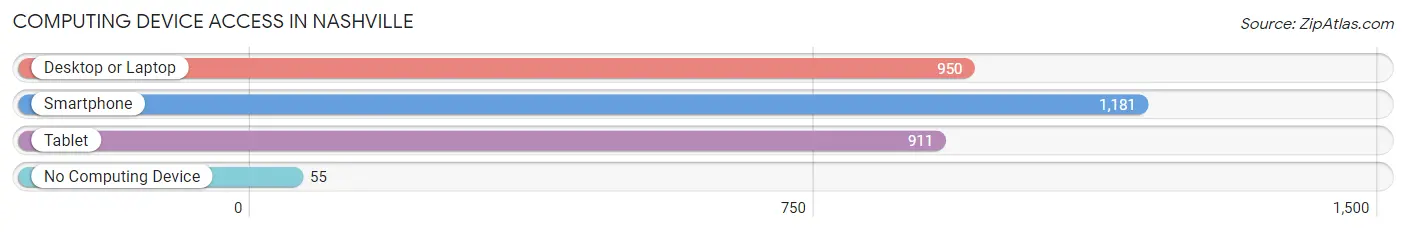
| Device Type | # Households | % Households |
| Desktop or Laptop | 950 | 72.8% |
| Smartphone | 1,181 | 90.5% |
| Tablet | 911 | 69.8% |
| No Computing Device | 55 | 4.2% |
| Total | 1,305 | 100.0% |
Internet Access in Nashville
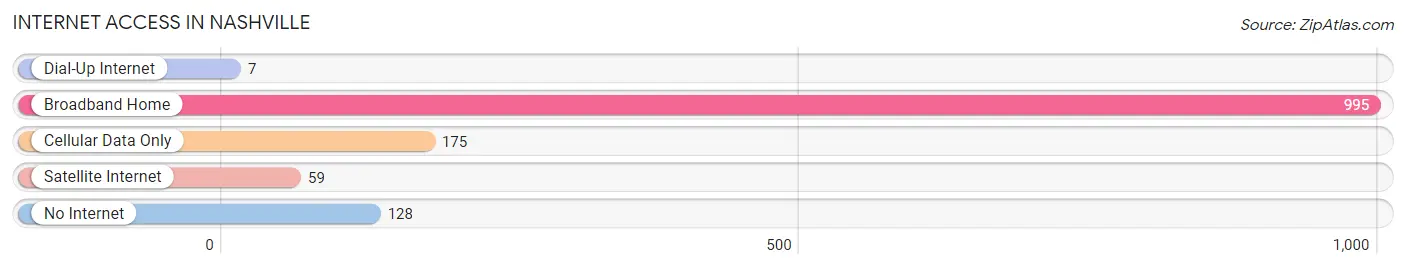
| Internet Type | # Households | % Households |
| Dial-Up Internet | 7 | 0.5% |
| Broadband Home | 995 | 76.2% |
| Cellular Data Only | 175 | 13.4% |
| Satellite Internet | 59 | 4.5% |
| No Internet | 128 | 9.8% |
| Total | 1,305 | 100.0% |
Nashville Summary
Nashville, Illinois is a small town located in Washington County, Illinois. It is situated in the southwestern part of the state, about 30 miles east of St. Louis, Missouri. The town was founded in 1819 and has a population of approximately 1,500 people.
History
Nashville was founded in 1819 by a group of settlers from Tennessee. The town was named after the state of Tennessee, and the settlers brought with them the culture and traditions of their home state. The town was originally a farming community, and the settlers grew corn, wheat, and other crops. The town was also known for its blacksmiths, who made tools and other items for the farmers.
In the late 1800s, the town began to grow and develop. The railroad came to town in 1872, and this allowed for the transportation of goods and people. The town also became a center for the coal mining industry, and many of the town’s residents worked in the mines.
In the early 1900s, the town began to decline. The coal mines closed, and the railroad stopped running. The town’s population began to decline, and by the 1950s, the town had become a ghost town.
In the late 1970s, the town began to experience a revival. The town was designated as a historic district, and many of the old buildings were restored. The town also began to attract new businesses, and the population began to grow again.
Geography
Nashville is located in the southwestern part of Illinois, about 30 miles east of St. Louis, Missouri. The town is situated in the rolling hills of the Ozark Plateau, and the terrain is mostly flat. The town is located on the banks of the Big Muddy River, and the town is surrounded by farmland.
The climate in Nashville is humid continental, with hot summers and cold winters. The average temperature in the summer is around 80 degrees Fahrenheit, and the average temperature in the winter is around 30 degrees Fahrenheit.
Economy
The economy of Nashville is largely based on agriculture. The town is surrounded by farmland, and many of the town’s residents are involved in farming. The town also has a few small businesses, including a grocery store, a hardware store, and a few restaurants.
The town is also home to a few manufacturing companies, including a furniture factory and a plastics factory. The town also has a few tourist attractions, including a historic district and a museum.
Demographics
As of the 2010 census, the population of Nashville was 1,500 people. The town is predominantly white, with about 95% of the population being white. The town also has a small Hispanic population, with about 4% of the population being Hispanic. The median household income in the town is around $40,000, and the median home value is around $90,000.
Nashville is a small town with a rich history and a bright future. The town has a strong agricultural base, and the town is also home to a few small businesses. The town is also home to a few tourist attractions, and the town is a great place to visit and explore.
Common Questions
What is Per Capita Income in Nashville?
Per Capita income in Nashville is $32,733.
What is the Median Family Income in Nashville?
Median Family Income in Nashville is $81,554.
What is the Median Household income in Nashville?
Median Household Income in Nashville is $65,719.
What is Income or Wage Gap in Nashville?
Income or Wage Gap in Nashville is 23.6%.
Women in Nashville earn 76.4 cents for every dollar earned by a man.
What is Inequality or Gini Index in Nashville?
Inequality or Gini Index in Nashville is 0.35.
What is the Total Population of Nashville?
Total Population of Nashville is 3,025.
What is the Total Male Population of Nashville?
Total Male Population of Nashville is 1,359.
What is the Total Female Population of Nashville?
Total Female Population of Nashville is 1,666.
What is the Ratio of Males per 100 Females in Nashville?
There are 81.57 Males per 100 Females in Nashville.
What is the Ratio of Females per 100 Males in Nashville?
There are 122.59 Females per 100 Males in Nashville.
What is the Median Population Age in Nashville?
Median Population Age in Nashville is 43.9 Years.
What is the Average Family Size in Nashville
Average Family Size in Nashville is 2.6 People.
What is the Average Household Size in Nashville
Average Household Size in Nashville is 2.2 People.
How Large is the Labor Force in Nashville?
There are 1,540 People in the Labor Forcein in Nashville.
What is the Percentage of People in the Labor Force in Nashville?
61.2% of People are in the Labor Force in Nashville.
What is the Unemployment Rate in Nashville?
Unemployment Rate in Nashville is 7.6%.