Minonk, IL Map & Demographics
Minonk Map
Minonk Overview
$31,488
PER CAPITA INCOME
$83,510
AVG FAMILY INCOME
$57,169
AVG HOUSEHOLD INCOME
30.2%
WAGE / INCOME GAP [ % ]
69.8¢/ $1
WAGE / INCOME GAP [ $ ]
0.39
INEQUALITY / GINI INDEX
1,966
TOTAL POPULATION
1,048
MALE POPULATION
918
FEMALE POPULATION
114.16
MALES / 100 FEMALES
87.60
FEMALES / 100 MALES
34.8
MEDIAN AGE
3.1
AVG FAMILY SIZE
2.3
AVG HOUSEHOLD SIZE
902
LABOR FORCE [ PEOPLE ]
59.4%
PERCENT IN LABOR FORCE
7.9%
UNEMPLOYMENT RATE
Minonk Zip Codes
Minonk Area Codes
Income in Minonk
Income Overview in Minonk
Per Capita Income in Minonk is $31,488, while median incomes of families and households are $83,510 and $57,169 respectively.
| Characteristic | Number | Measure |
| Per Capita Income | 1,966 | $31,488 |
| Median Family Income | 477 | $83,510 |
| Mean Family Income | 477 | $92,482 |
| Median Household Income | 817 | $57,169 |
| Mean Household Income | 817 | $73,852 |
| Income Deficit | 477 | $0 |
| Wage / Income Gap (%) | 1,966 | 30.24% |
| Wage / Income Gap ($) | 1,966 | 69.76¢ per $1 |
| Gini / Inequality Index | 1,966 | 0.39 |
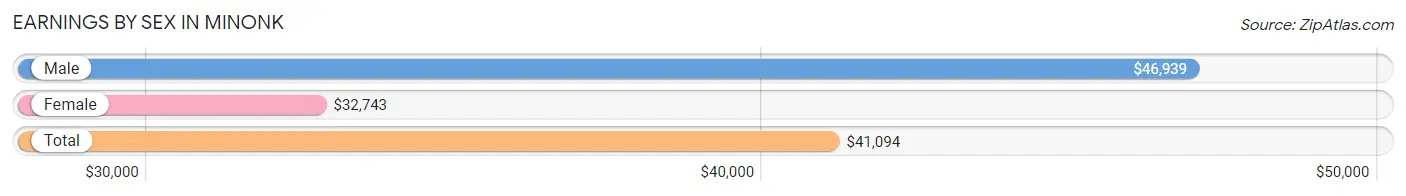
Earnings by Sex in Minonk
Average Earnings in Minonk are $41,094, $46,939 for men and $32,743 for women, a difference of 30.2%.
| Sex | Number | Average Earnings |
| Male | 584 (60.1%) | $46,939 |
| Female | 387 (39.9%) | $32,743 |
| Total | 971 (100.0%) | $41,094 |
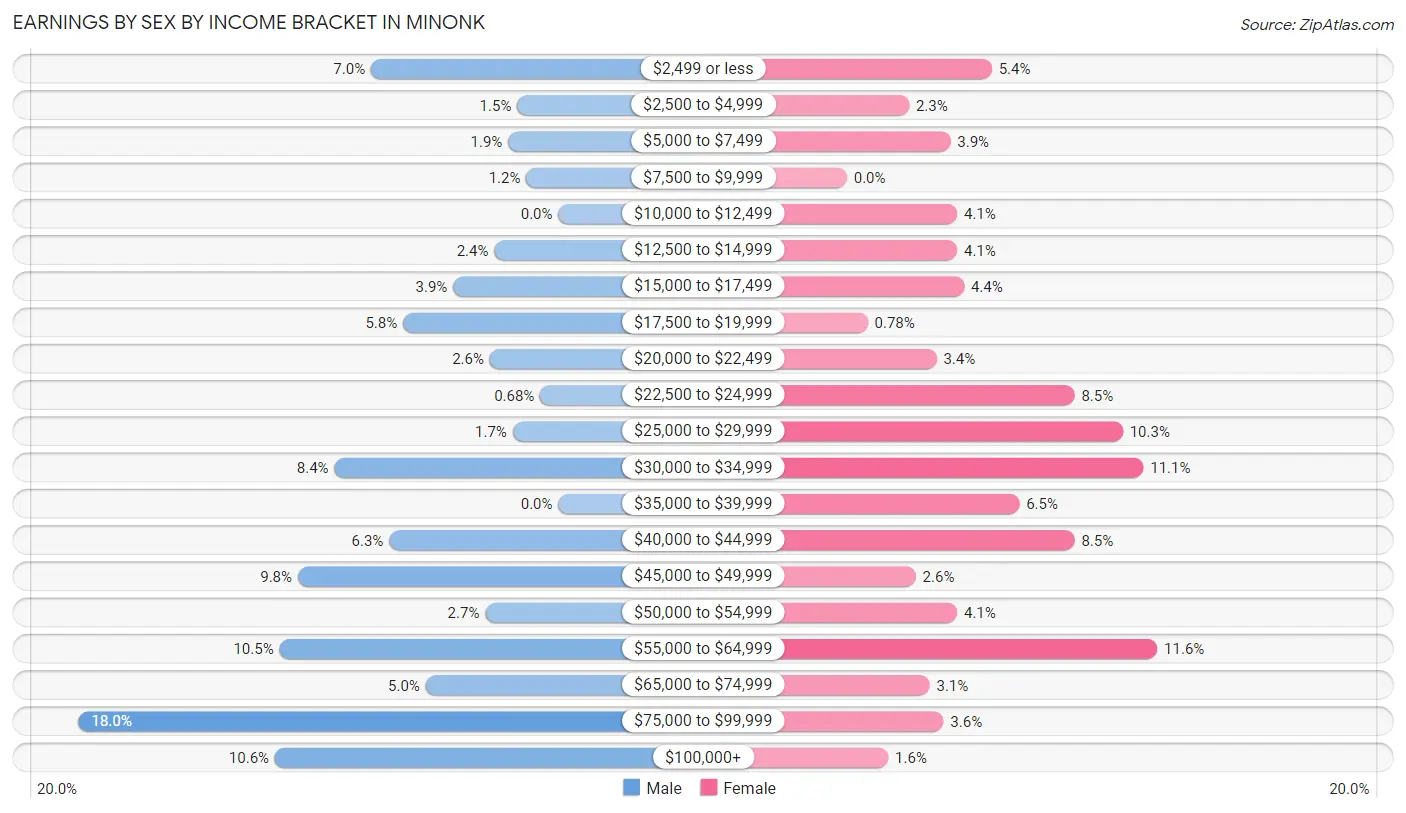
Earnings by Sex by Income Bracket in Minonk
The most common earnings brackets in Minonk are $75,000 to $99,999 for men (105 | 18.0%) and $55,000 to $64,999 for women (45 | 11.6%).
| Income | Male | Female |
| $2,499 or less | 41 (7.0%) | 21 (5.4%) |
| $2,500 to $4,999 | 9 (1.5%) | 9 (2.3%) |
| $5,000 to $7,499 | 11 (1.9%) | 15 (3.9%) |
| $7,500 to $9,999 | 7 (1.2%) | 0 (0.0%) |
| $10,000 to $12,499 | 0 (0.0%) | 16 (4.1%) |
| $12,500 to $14,999 | 14 (2.4%) | 16 (4.1%) |
| $15,000 to $17,499 | 23 (3.9%) | 17 (4.4%) |
| $17,500 to $19,999 | 34 (5.8%) | 3 (0.8%) |
| $20,000 to $22,499 | 15 (2.6%) | 13 (3.4%) |
| $22,500 to $24,999 | 4 (0.7%) | 33 (8.5%) |
| $25,000 to $29,999 | 10 (1.7%) | 40 (10.3%) |
| $30,000 to $34,999 | 49 (8.4%) | 43 (11.1%) |
| $35,000 to $39,999 | 0 (0.0%) | 25 (6.5%) |
| $40,000 to $44,999 | 37 (6.3%) | 33 (8.5%) |
| $45,000 to $49,999 | 57 (9.8%) | 10 (2.6%) |
| $50,000 to $54,999 | 16 (2.7%) | 16 (4.1%) |
| $55,000 to $64,999 | 61 (10.4%) | 45 (11.6%) |
| $65,000 to $74,999 | 29 (5.0%) | 12 (3.1%) |
| $75,000 to $99,999 | 105 (18.0%) | 14 (3.6%) |
| $100,000+ | 62 (10.6%) | 6 (1.5%) |
| Total | 584 (100.0%) | 387 (100.0%) |
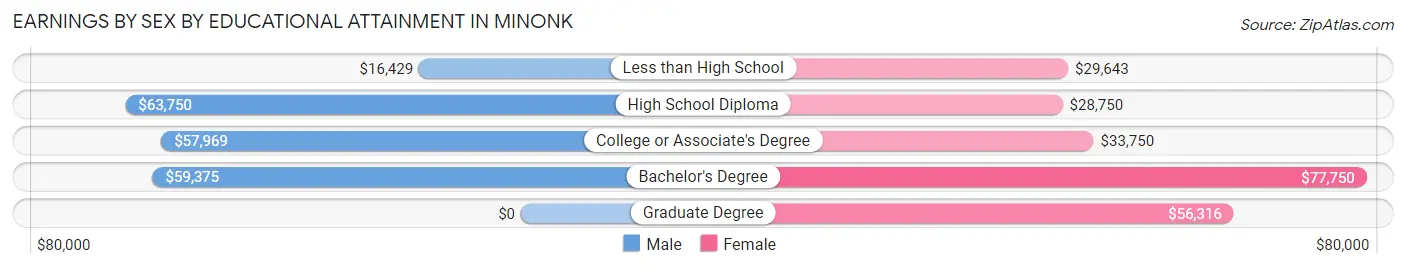
Earnings by Sex by Educational Attainment in Minonk
Average earnings in Minonk are $60,063 for men and $34,444 for women, a difference of 42.6%. Men with an educational attainment of high school diploma enjoy the highest average annual earnings of $63,750, while those with less than high school education earn the least with $16,429. Women with an educational attainment of bachelor's degree earn the most with the average annual earnings of $77,750, while those with high school diploma education have the smallest earnings of $28,750.
| Educational Attainment | Male Income | Female Income |
| Less than High School | $16,429 | $29,643 |
| High School Diploma | $63,750 | $28,750 |
| College or Associate's Degree | $57,969 | $33,750 |
| Bachelor's Degree | $59,375 | $77,750 |
| Graduate Degree | - | - |
| Total | $60,063 | $34,444 |
Family Income in Minonk
Family Income Brackets in Minonk
According to the Minonk family income data, there are 127 families falling into the $100,000 to $149,999 income range, which is the most common income bracket and makes up 26.6% of all families. Conversely, the $10,000 to $14,999 income bracket is the least frequent group with only 3 families (0.6%) belonging to this category.
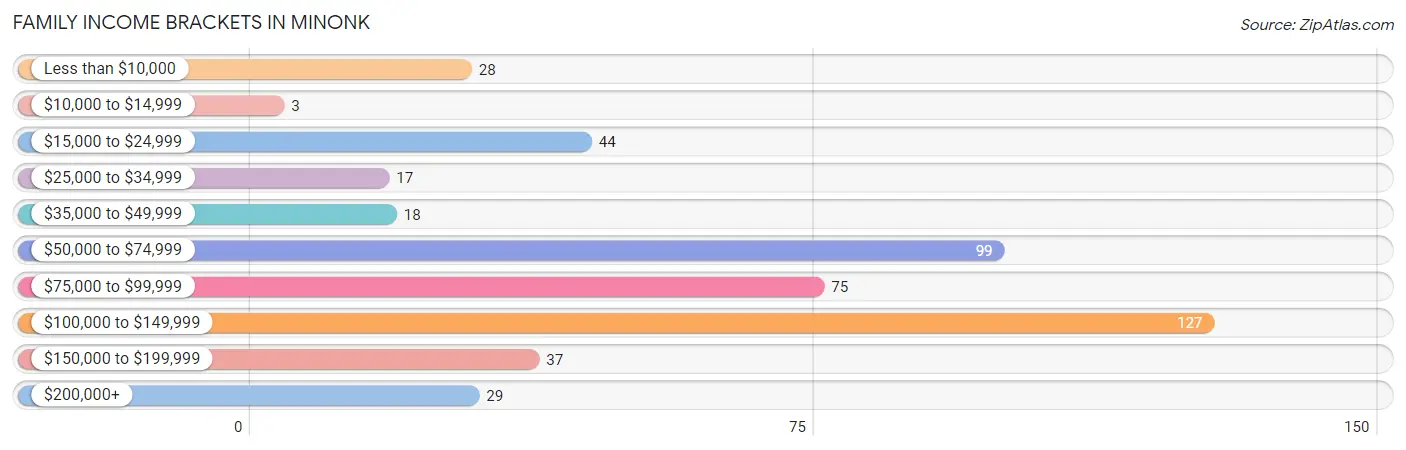
| Income Bracket | # Families | % Families |
| Less than $10,000 | 28 | 5.9% |
| $10,000 to $14,999 | 3 | 0.6% |
| $15,000 to $24,999 | 44 | 9.2% |
| $25,000 to $34,999 | 17 | 3.6% |
| $35,000 to $49,999 | 18 | 3.8% |
| $50,000 to $74,999 | 99 | 20.8% |
| $75,000 to $99,999 | 75 | 15.7% |
| $100,000 to $149,999 | 127 | 26.6% |
| $150,000 to $199,999 | 37 | 7.8% |
| $200,000+ | 29 | 6.1% |
Family Income by Famaliy Size in Minonk
3-person families (112 | 23.5%) account for the highest median family income in Minonk with $95,250 per family, while 2-person families (234 | 49.1%) have the highest median income of $35,909 per family member.
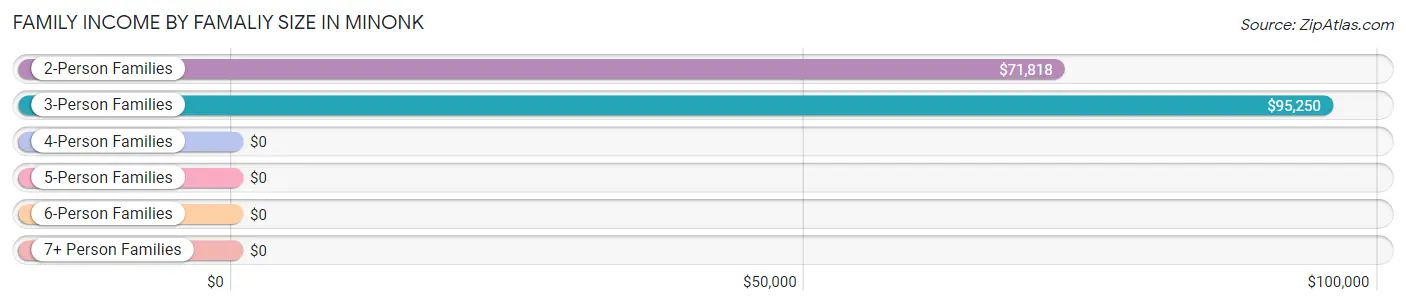
| Income Bracket | # Families | Median Income |
| 2-Person Families | 234 (49.1%) | $71,818 |
| 3-Person Families | 112 (23.5%) | $95,250 |
| 4-Person Families | 57 (11.9%) | $0 |
| 5-Person Families | 68 (14.3%) | $0 |
| 6-Person Families | 3 (0.6%) | $0 |
| 7+ Person Families | 3 (0.6%) | $0 |
| Total | 477 (100.0%) | $83,510 |
Family Income by Number of Earners in Minonk
The median family income in Minonk is $83,510, with families comprising 3+ earners (28) having the highest median family income of $233,333, while families with no earners (72) have the lowest median family income of $22,500, accounting for 5.9% and 15.1% of families, respectively.
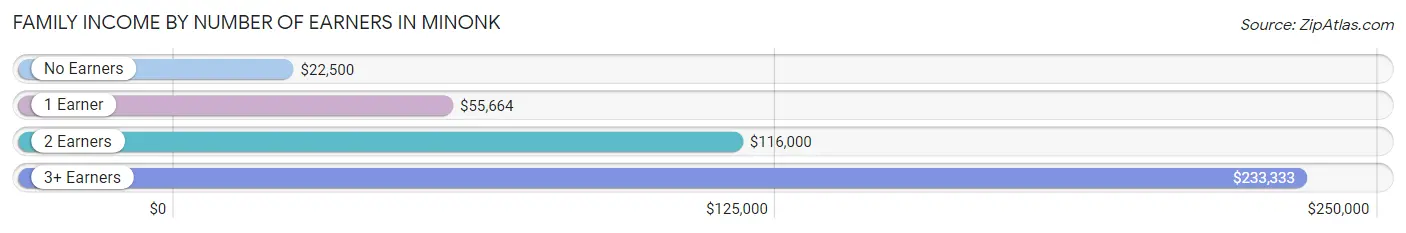
| Number of Earners | # Families | Median Income |
| No Earners | 72 (15.1%) | $22,500 |
| 1 Earner | 151 (31.7%) | $55,664 |
| 2 Earners | 226 (47.4%) | $116,000 |
| 3+ Earners | 28 (5.9%) | $233,333 |
| Total | 477 (100.0%) | $83,510 |
Household Income in Minonk
Household Income Brackets in Minonk
With 208 households falling in the category, the $50,000 to $74,999 income range is the most frequent in Minonk, accounting for 25.5% of all households. In contrast, only 3 households (0.4%) fall into the $10,000 to $14,999 income bracket, making it the least populous group.
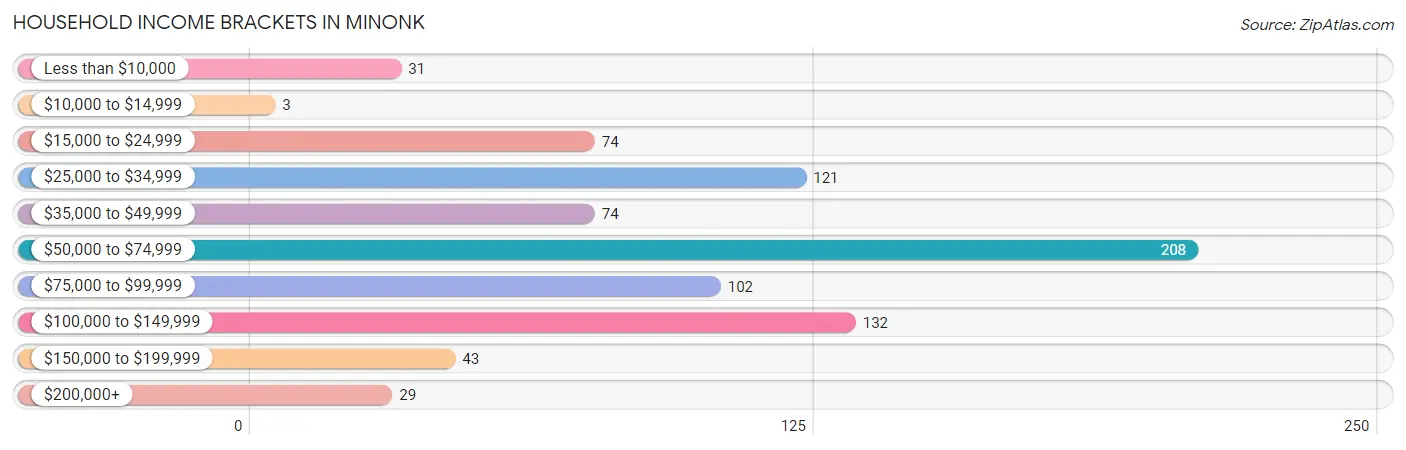
| Income Bracket | # Households | % Households |
| Less than $10,000 | 31 | 3.8% |
| $10,000 to $14,999 | 3 | 0.4% |
| $15,000 to $24,999 | 74 | 9.1% |
| $25,000 to $34,999 | 121 | 14.8% |
| $35,000 to $49,999 | 74 | 9.1% |
| $50,000 to $74,999 | 208 | 25.5% |
| $75,000 to $99,999 | 102 | 12.5% |
| $100,000 to $149,999 | 132 | 16.2% |
| $150,000 to $199,999 | 43 | 5.3% |
| $200,000+ | 29 | 3.5% |
Household Income by Householder Age in Minonk
The median household income in Minonk is $57,169, with the highest median household income of $80,625 found in the 45 to 64 years age bracket for the primary householder. A total of 332 households (40.6%) fall into this category. Meanwhile, the 65+ years age bracket for the primary householder has the lowest median household income of $33,636, with 210 households (25.7%) in this group.

| Income Bracket | # Households | Median Income |
| 15 to 24 Years | 49 (6.0%) | $57,798 |
| 25 to 44 Years | 226 (27.7%) | $56,563 |
| 45 to 64 Years | 332 (40.6%) | $80,625 |
| 65+ Years | 210 (25.7%) | $33,636 |
| Total | 817 (100.0%) | $57,169 |
Poverty in Minonk
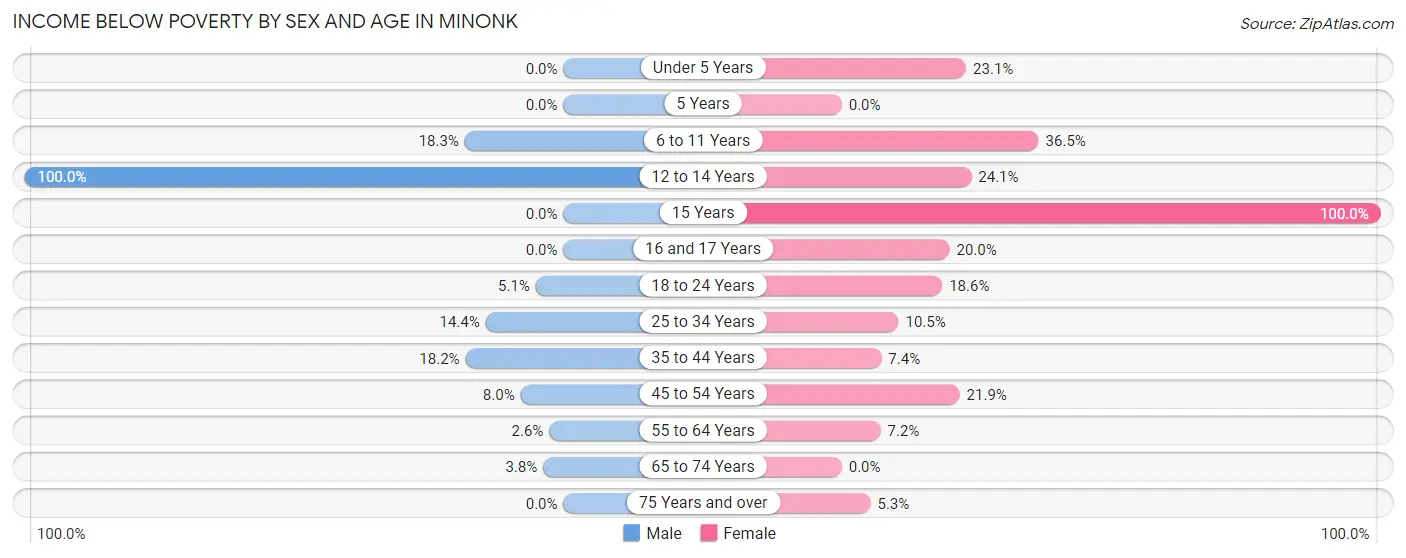
Income Below Poverty by Sex and Age in Minonk
With 9.8% poverty level for males and 15.7% for females among the residents of Minonk, 12 to 14 year old males and 15 year old females are the most vulnerable to poverty, with 13 males (100.0%) and 16 females (100.0%) in their respective age groups living below the poverty level.
| Age Bracket | Male | Female |
| Under 5 Years | 0 (0.0%) | 12 (23.1%) |
| 5 Years | 0 (0.0%) | 0 (0.0%) |
| 6 to 11 Years | 26 (18.3%) | 19 (36.5%) |
| 12 to 14 Years | 13 (100.0%) | 19 (24.0%) |
| 15 Years | 0 (0.0%) | 16 (100.0%) |
| 16 and 17 Years | 0 (0.0%) | 5 (20.0%) |
| 18 to 24 Years | 6 (5.1%) | 11 (18.6%) |
| 25 to 34 Years | 27 (14.4%) | 12 (10.5%) |
| 35 to 44 Years | 10 (18.2%) | 5 (7.3%) |
| 45 to 54 Years | 9 (8.0%) | 28 (21.9%) |
| 55 to 64 Years | 4 (2.6%) | 9 (7.2%) |
| 65 to 74 Years | 4 (3.8%) | 0 (0.0%) |
| 75 Years and over | 0 (0.0%) | 4 (5.3%) |
| Total | 99 (9.8%) | 140 (15.7%) |
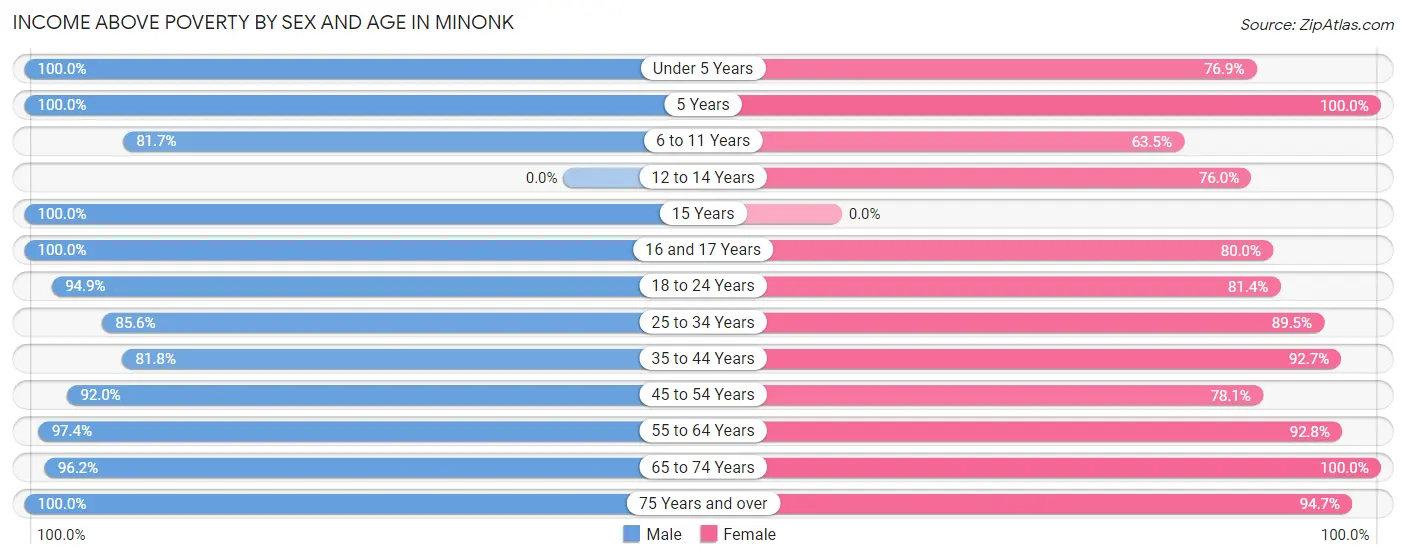
Income Above Poverty by Sex and Age in Minonk
According to the poverty statistics in Minonk, males aged under 5 years and females aged 5 years are the age groups that are most secure financially, with 100.0% of males and 100.0% of females in these age groups living above the poverty line.
| Age Bracket | Male | Female |
| Under 5 Years | 42 (100.0%) | 40 (76.9%) |
| 5 Years | 11 (100.0%) | 11 (100.0%) |
| 6 to 11 Years | 116 (81.7%) | 33 (63.5%) |
| 12 to 14 Years | 0 (0.0%) | 60 (75.9%) |
| 15 Years | 23 (100.0%) | 0 (0.0%) |
| 16 and 17 Years | 40 (100.0%) | 20 (80.0%) |
| 18 to 24 Years | 111 (94.9%) | 48 (81.4%) |
| 25 to 34 Years | 160 (85.6%) | 102 (89.5%) |
| 35 to 44 Years | 45 (81.8%) | 63 (92.6%) |
| 45 to 54 Years | 104 (92.0%) | 100 (78.1%) |
| 55 to 64 Years | 148 (97.4%) | 116 (92.8%) |
| 65 to 74 Years | 102 (96.2%) | 89 (100.0%) |
| 75 Years and over | 14 (100.0%) | 71 (94.7%) |
| Total | 916 (90.2%) | 753 (84.3%) |
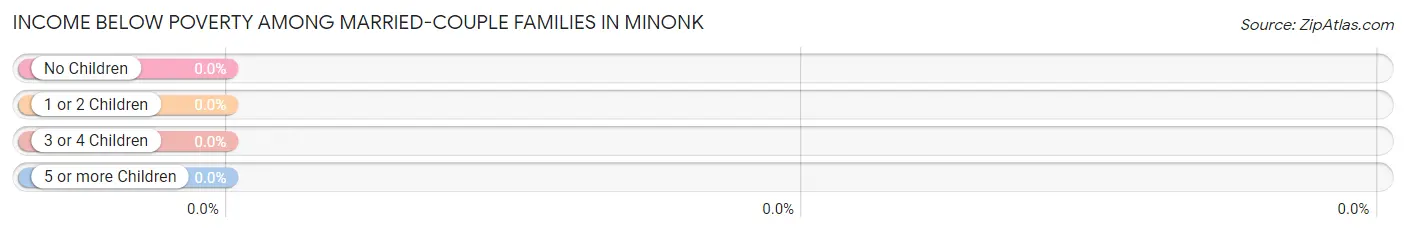
Income Below Poverty Among Married-Couple Families in Minonk
| Children | Above Poverty | Below Poverty |
| No Children | 216 (100.0%) | 0 (0.0%) |
| 1 or 2 Children | 76 (100.0%) | 0 (0.0%) |
| 3 or 4 Children | 69 (100.0%) | 0 (0.0%) |
| 5 or more Children | 0 (0.0%) | 0 (0.0%) |
| Total | 361 (100.0%) | 0 (0.0%) |
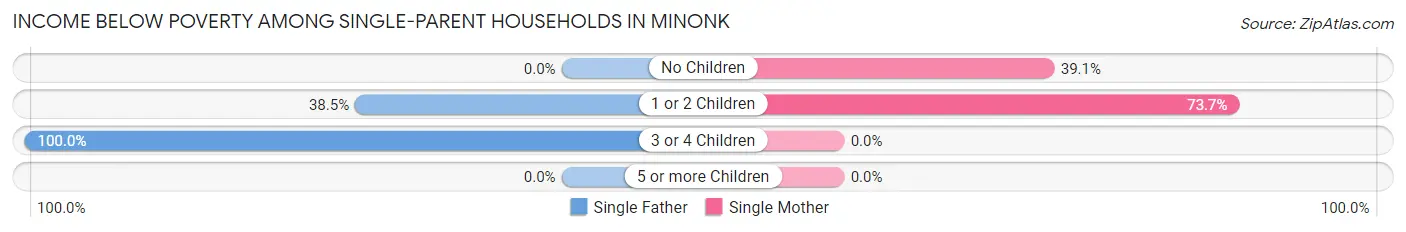
Income Below Poverty Among Single-Parent Households in Minonk
According to the poverty data in Minonk, 40.0% or 22 single-father households and 60.7% or 37 single-mother households are living below the poverty line. Among single-father households, those with 3 or 4 children have the highest poverty rate, with 17 households (100.0%) experiencing poverty. Likewise, among single-mother households, those with 1 or 2 children have the highest poverty rate, with 28 households (73.7%) falling below the poverty line.
| Children | Single Father | Single Mother |
| No Children | 0 (0.0%) | 9 (39.1%) |
| 1 or 2 Children | 5 (38.5%) | 28 (73.7%) |
| 3 or 4 Children | 17 (100.0%) | 0 (0.0%) |
| 5 or more Children | 0 (0.0%) | 0 (0.0%) |
| Total | 22 (40.0%) | 37 (60.7%) |
Income Below Poverty Among Married-Couple vs Single-Parent Households in Minonk
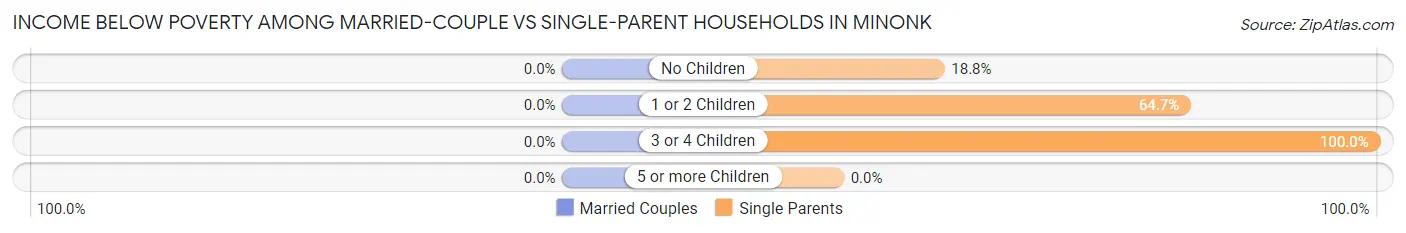
| Children | Married-Couple Families | Single-Parent Households |
| No Children | 0 (0.0%) | 9 (18.8%) |
| 1 or 2 Children | 0 (0.0%) | 33 (64.7%) |
| 3 or 4 Children | 0 (0.0%) | 17 (100.0%) |
| 5 or more Children | 0 (0.0%) | 0 (0.0%) |
| Total | 0 (0.0%) | 59 (50.9%) |
Race in Minonk
The most populous races in Minonk are White / Caucasian (1,933 | 98.3%), Hispanic or Latino (19 | 1.0%), and Two or more Races (19 | 1.0%).
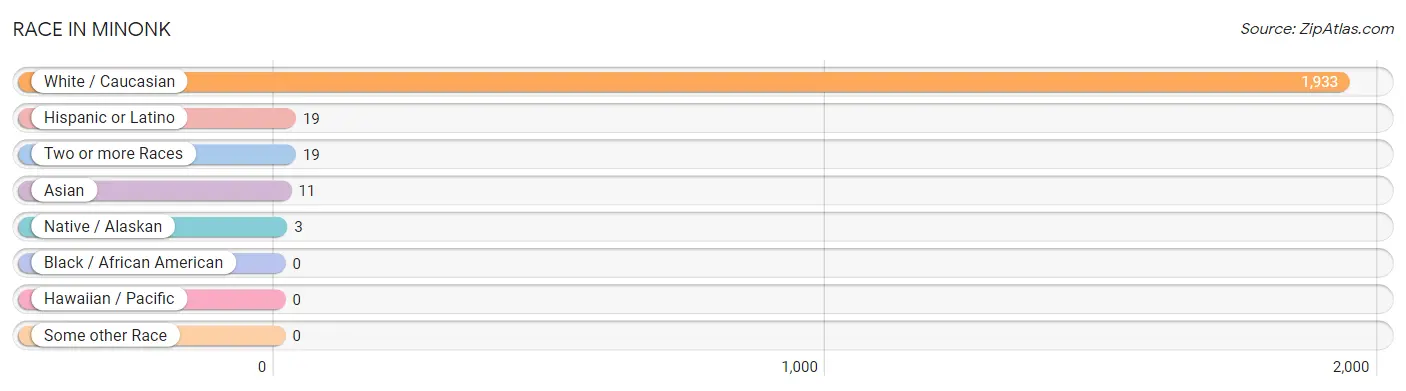
| Race | # Population | % Population |
| Asian | 11 | 0.6% |
| Black / African American | 0 | 0.0% |
| Hawaiian / Pacific | 0 | 0.0% |
| Hispanic or Latino | 19 | 1.0% |
| Native / Alaskan | 3 | 0.2% |
| White / Caucasian | 1,933 | 98.3% |
| Two or more Races | 19 | 1.0% |
| Some other Race | 0 | 0.0% |
| Total | 1,966 | 100.0% |
Ancestry in Minonk
The most populous ancestries reported in Minonk are German (541 | 27.5%), Polish (260 | 13.2%), Irish (222 | 11.3%), European (126 | 6.4%), and English (108 | 5.5%), together accounting for 63.9% of all Minonk residents.
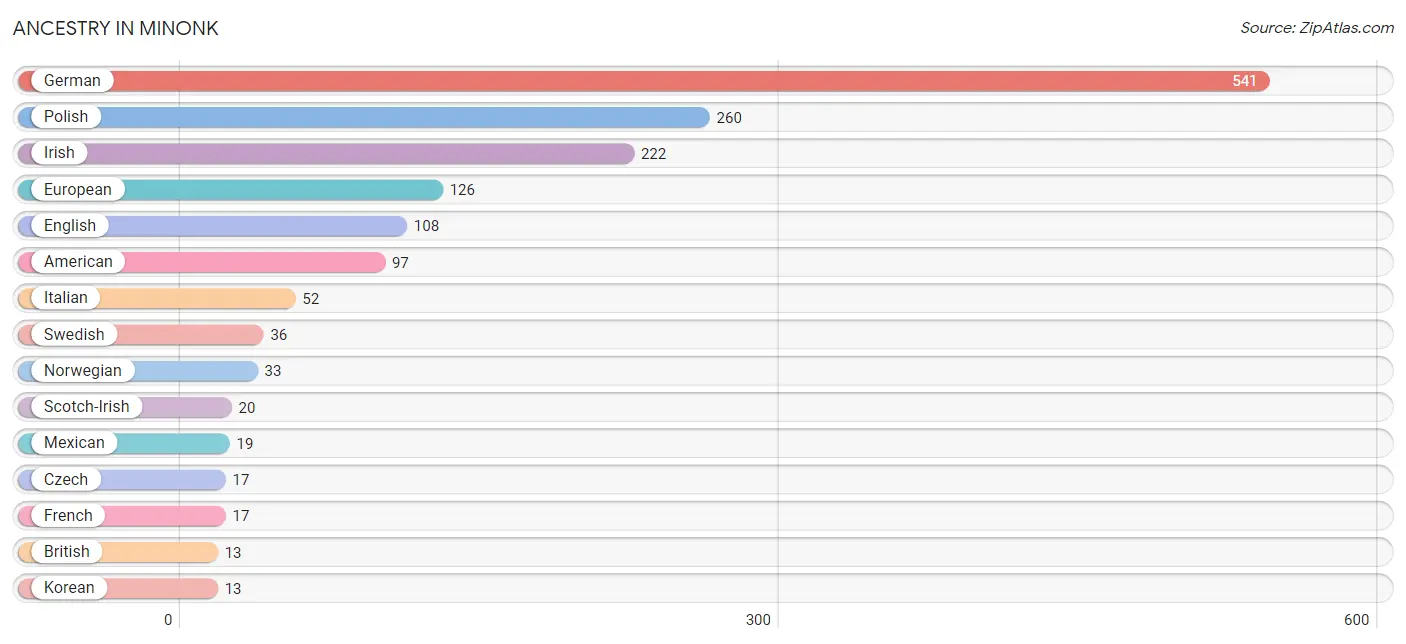
| Ancestry | # Population | % Population |
| American | 97 | 4.9% |
| British | 13 | 0.7% |
| Cherokee | 3 | 0.2% |
| Czech | 17 | 0.9% |
| Dutch | 3 | 0.2% |
| English | 108 | 5.5% |
| European | 126 | 6.4% |
| French | 17 | 0.9% |
| German | 541 | 27.5% |
| Indian (Asian) | 6 | 0.3% |
| Irish | 222 | 11.3% |
| Italian | 52 | 2.6% |
| Korean | 13 | 0.7% |
| Mexican | 19 | 1.0% |
| Norwegian | 33 | 1.7% |
| Polish | 260 | 13.2% |
| Russian | 7 | 0.4% |
| Scotch-Irish | 20 | 1.0% |
| Scottish | 7 | 0.4% |
| Slovak | 11 | 0.6% |
| Swedish | 36 | 1.8% |
| Thai | 6 | 0.3% |
| Welsh | 5 | 0.3% | View All 23 Rows |
Immigrants in Minonk
The most numerous immigrant groups reported in Minonk came from Asia (11 | 0.6%), India (6 | 0.3%), South Central Asia (6 | 0.3%), Philippines (5 | 0.3%), and South Eastern Asia (5 | 0.3%), together accounting for 1.7% of all Minonk residents.
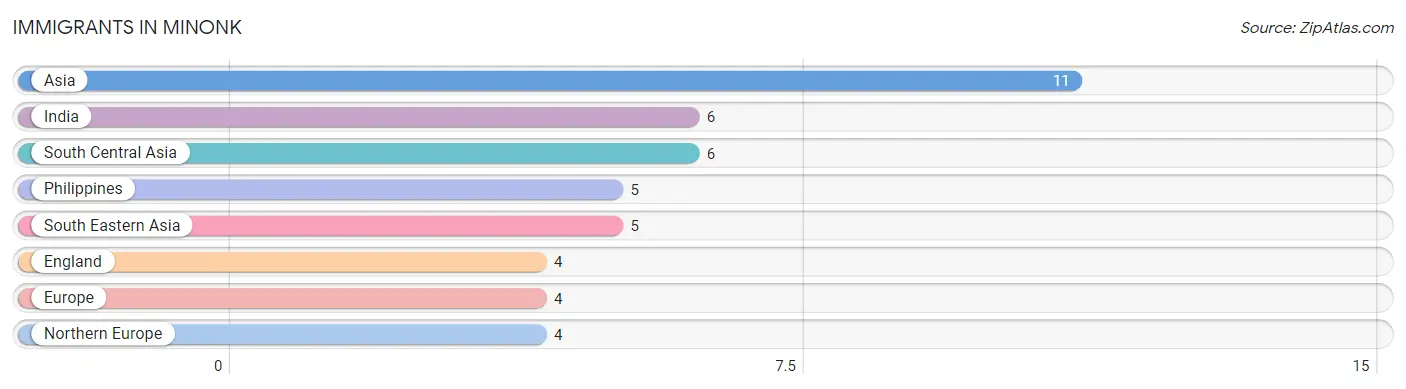
| Immigration Origin | # Population | % Population |
| Asia | 11 | 0.6% |
| England | 4 | 0.2% |
| Europe | 4 | 0.2% |
| India | 6 | 0.3% |
| Northern Europe | 4 | 0.2% |
| Philippines | 5 | 0.3% |
| South Central Asia | 6 | 0.3% |
| South Eastern Asia | 5 | 0.3% | View All 8 Rows |
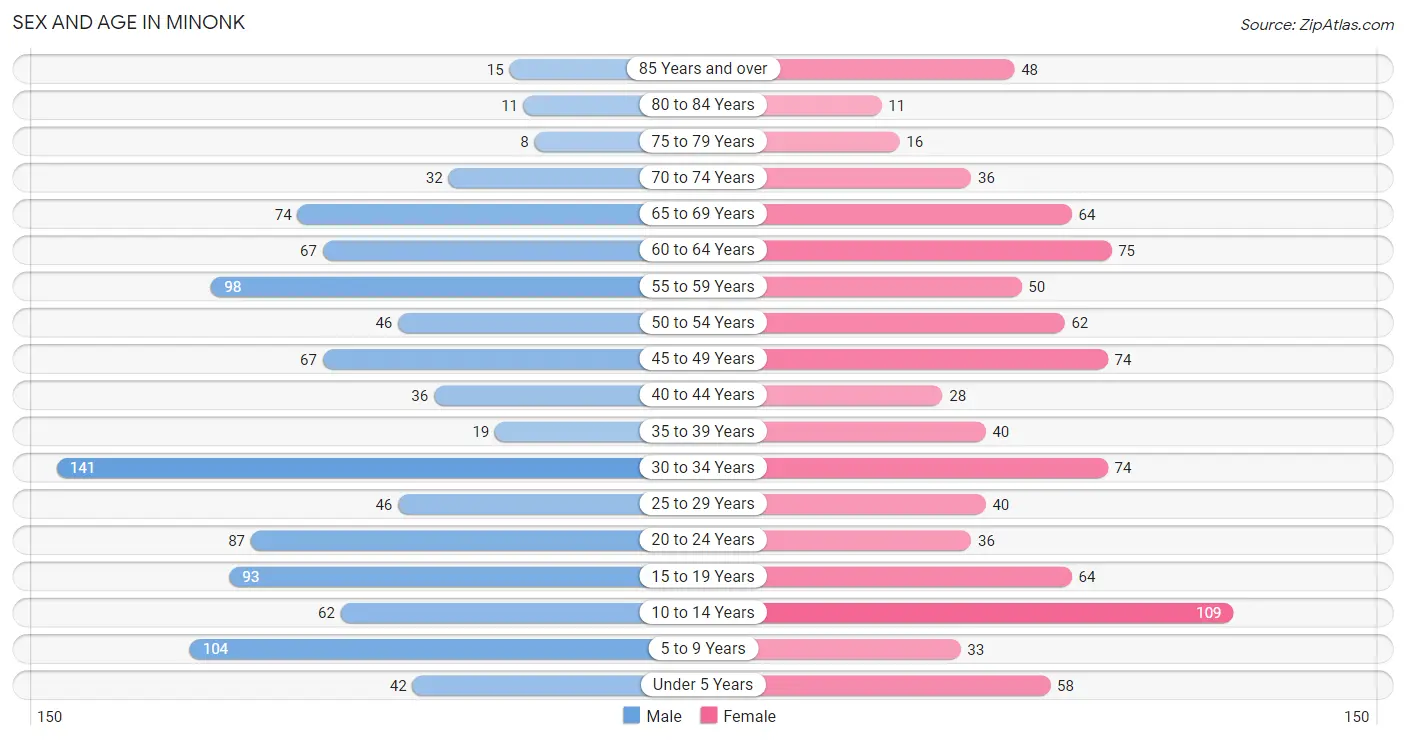
Sex and Age in Minonk
Sex and Age in Minonk
The most populous age groups in Minonk are 30 to 34 Years (141 | 13.5%) for men and 10 to 14 Years (109 | 11.9%) for women.
| Age Bracket | Male | Female |
| Under 5 Years | 42 (4.0%) | 58 (6.3%) |
| 5 to 9 Years | 104 (9.9%) | 33 (3.6%) |
| 10 to 14 Years | 62 (5.9%) | 109 (11.9%) |
| 15 to 19 Years | 93 (8.9%) | 64 (7.0%) |
| 20 to 24 Years | 87 (8.3%) | 36 (3.9%) |
| 25 to 29 Years | 46 (4.4%) | 40 (4.4%) |
| 30 to 34 Years | 141 (13.5%) | 74 (8.1%) |
| 35 to 39 Years | 19 (1.8%) | 40 (4.4%) |
| 40 to 44 Years | 36 (3.4%) | 28 (3.0%) |
| 45 to 49 Years | 67 (6.4%) | 74 (8.1%) |
| 50 to 54 Years | 46 (4.4%) | 62 (6.8%) |
| 55 to 59 Years | 98 (9.3%) | 50 (5.4%) |
| 60 to 64 Years | 67 (6.4%) | 75 (8.2%) |
| 65 to 69 Years | 74 (7.1%) | 64 (7.0%) |
| 70 to 74 Years | 32 (3.0%) | 36 (3.9%) |
| 75 to 79 Years | 8 (0.8%) | 16 (1.7%) |
| 80 to 84 Years | 11 (1.1%) | 11 (1.2%) |
| 85 Years and over | 15 (1.4%) | 48 (5.2%) |
| Total | 1,048 (100.0%) | 918 (100.0%) |
Families and Households in Minonk
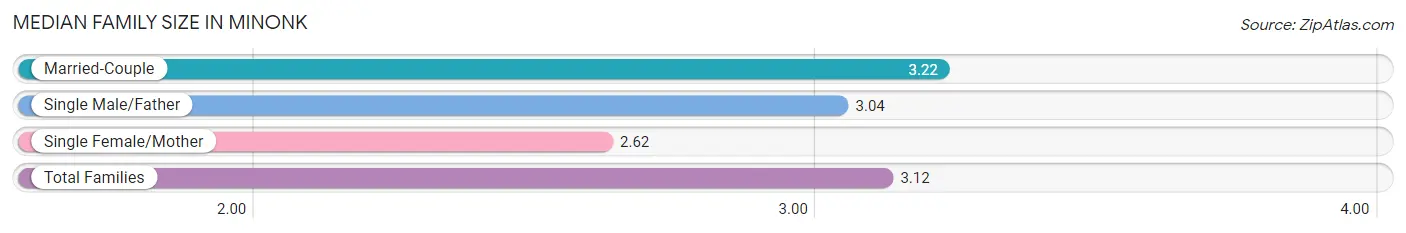
Median Family Size in Minonk
The median family size in Minonk is 3.12 persons per family, with married-couple families (361 | 75.7%) accounting for the largest median family size of 3.22 persons per family. On the other hand, single female/mother families (61 | 12.8%) represent the smallest median family size with 2.62 persons per family.
| Family Type | # Families | Family Size |
| Married-Couple | 361 (75.7%) | 3.22 |
| Single Male/Father | 55 (11.5%) | 3.04 |
| Single Female/Mother | 61 (12.8%) | 2.62 |
| Total Families | 477 (100.0%) | 3.12 |
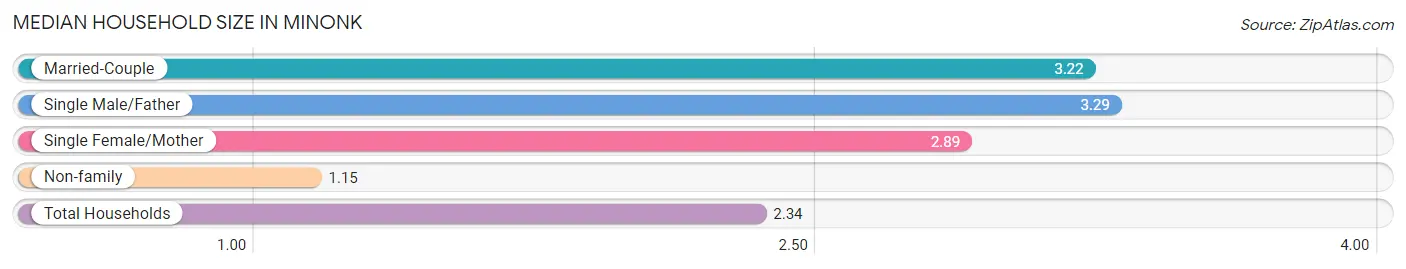
Median Household Size in Minonk
The median household size in Minonk is 2.34 persons per household, with single male/father households (55 | 6.7%) accounting for the largest median household size of 3.29 persons per household. non-family households (340 | 41.6%) represent the smallest median household size with 1.15 persons per household.
| Household Type | # Households | Household Size |
| Married-Couple | 361 (44.2%) | 3.22 |
| Single Male/Father | 55 (6.7%) | 3.29 |
| Single Female/Mother | 61 (7.5%) | 2.89 |
| Non-family | 340 (41.6%) | 1.15 |
| Total Households | 817 (100.0%) | 2.34 |
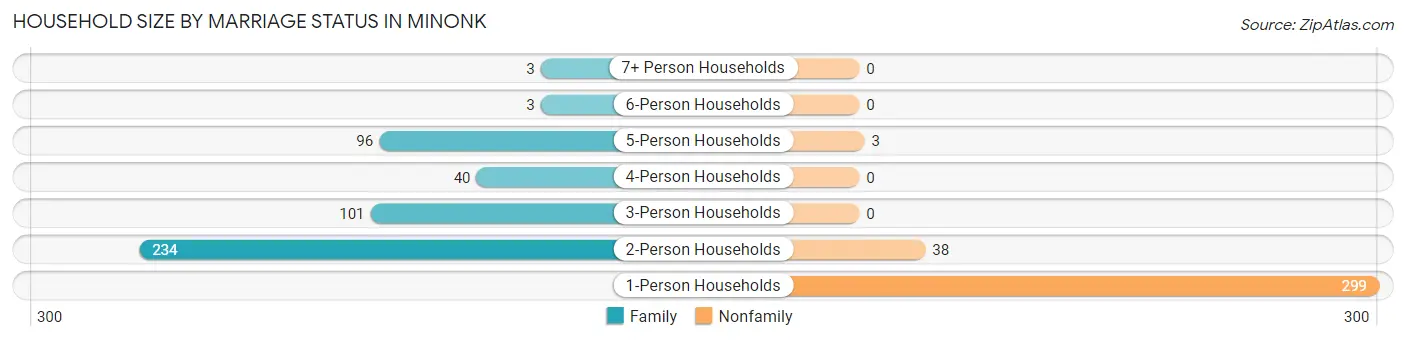
Household Size by Marriage Status in Minonk
Out of a total of 817 households in Minonk, 477 (58.4%) are family households, while 340 (41.6%) are nonfamily households. The most numerous type of family households are 2-person households, comprising 234, and the most common type of nonfamily households are 1-person households, comprising 299.
| Household Size | Family Households | Nonfamily Households |
| 1-Person Households | - | 299 (36.6%) |
| 2-Person Households | 234 (28.6%) | 38 (4.6%) |
| 3-Person Households | 101 (12.4%) | 0 (0.0%) |
| 4-Person Households | 40 (4.9%) | 0 (0.0%) |
| 5-Person Households | 96 (11.7%) | 3 (0.4%) |
| 6-Person Households | 3 (0.4%) | 0 (0.0%) |
| 7+ Person Households | 3 (0.4%) | 0 (0.0%) |
| Total | 477 (58.4%) | 340 (41.6%) |
Female Fertility in Minonk
Fertility by Age in Minonk
Average fertility rate in Minonk is 118.0 births per 1,000 women. Women in the age bracket of 20 to 34 years have the highest fertility rate with 187.0 births per 1,000 women. Women in the age bracket of 20 to 34 years acount for 63.6% of all women with births.
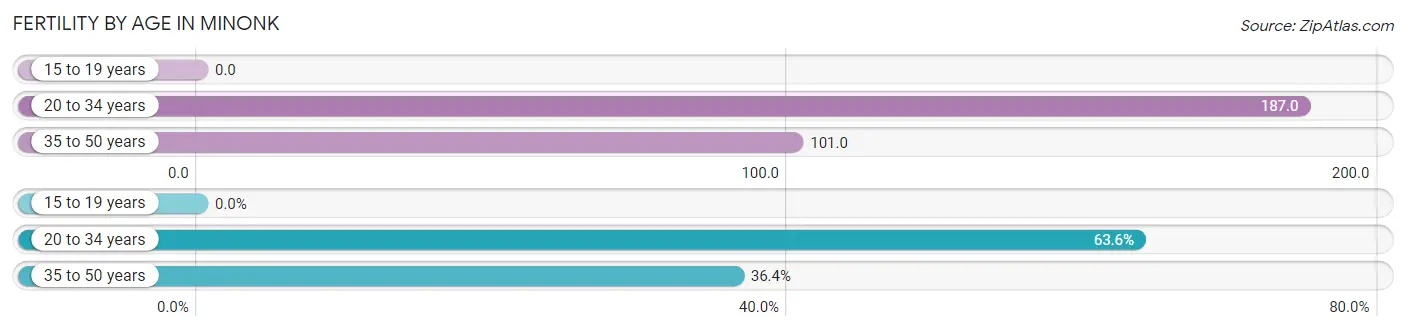
| Age Bracket | Women with Births | Births / 1,000 Women |
| 15 to 19 years | 0 (0.0%) | 0.0 |
| 20 to 34 years | 28 (63.6%) | 187.0 |
| 35 to 50 years | 16 (36.4%) | 101.0 |
| Total | 44 (100.0%) | 118.0 |
Fertility by Age by Marriage Status in Minonk
70.5% of women with births (44) in Minonk are married. The highest percentage of unmarried women with births falls into 20 to 34 years age bracket with 46.4% of them unmarried at the time of birth, while the lowest percentage of unmarried women with births belong to 35 to 50 years age bracket with 0.0% of them unmarried.
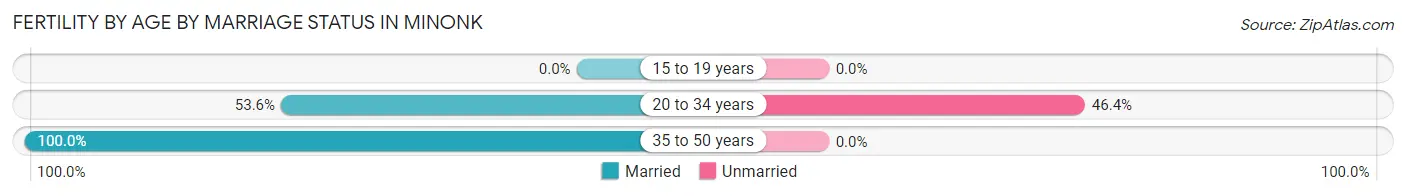
| Age Bracket | Married | Unmarried |
| 15 to 19 years | 0 (0.0%) | 0 (0.0%) |
| 20 to 34 years | 15 (53.6%) | 13 (46.4%) |
| 35 to 50 years | 16 (100.0%) | 0 (0.0%) |
| Total | 31 (70.5%) | 13 (29.5%) |
Fertility by Education in Minonk
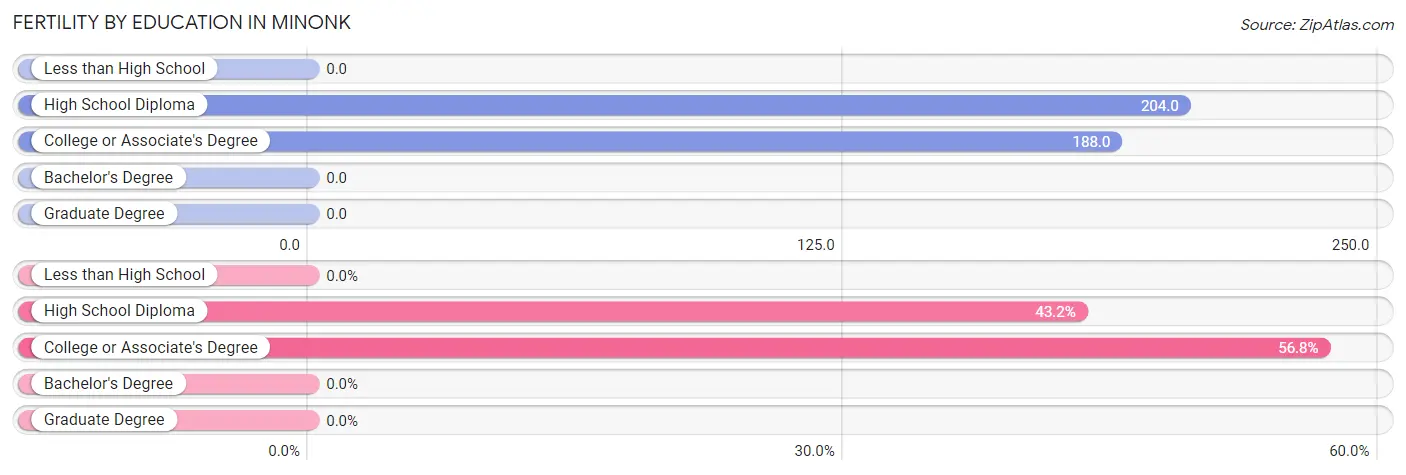
| Educational Attainment | Women with Births | Births / 1,000 Women |
| Less than High School | 0 (0.0%) | 0.0 |
| High School Diploma | 19 (43.2%) | 204.0 |
| College or Associate's Degree | 25 (56.8%) | 188.0 |
| Bachelor's Degree | 0 (0.0%) | 0.0 |
| Graduate Degree | 0 (0.0%) | 0.0 |
| Total | 44 (100.0%) | 118.0 |
Fertility by Education by Marriage Status in Minonk
29.5% of women with births in Minonk are unmarried. Women with the educational attainment of college or associate's degree are most likely to be married with 100.0% of them married at childbirth, while women with the educational attainment of high school diploma are least likely to be married with 68.4% of them unmarried at childbirth.
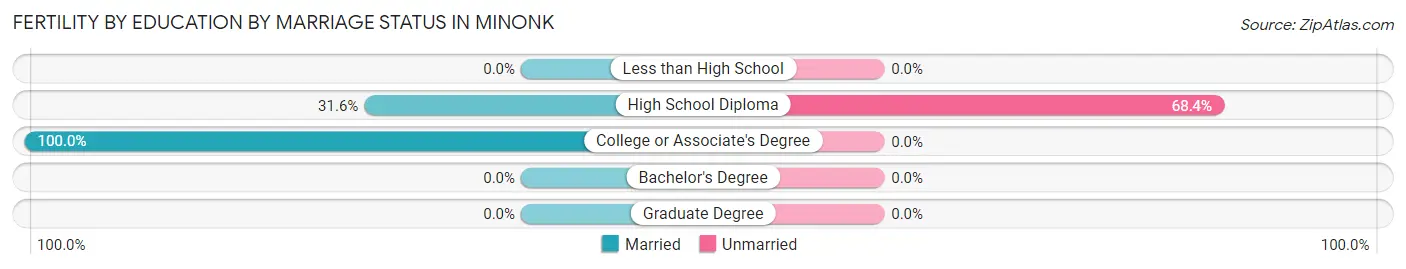
| Educational Attainment | Married | Unmarried |
| Less than High School | 0 (0.0%) | 0 (0.0%) |
| High School Diploma | 6 (31.6%) | 13 (68.4%) |
| College or Associate's Degree | 25 (100.0%) | 0 (0.0%) |
| Bachelor's Degree | 0 (0.0%) | 0 (0.0%) |
| Graduate Degree | 0 (0.0%) | 0 (0.0%) |
| Total | 31 (70.5%) | 13 (29.5%) |
Employment Characteristics in Minonk
Employment by Class of Employer in Minonk
Among the 810 employed individuals in Minonk, private company employees (590 | 72.8%), not-for-profit organizations (66 | 8.2%), and local government employees (56 | 6.9%) make up the most common classes of employment.
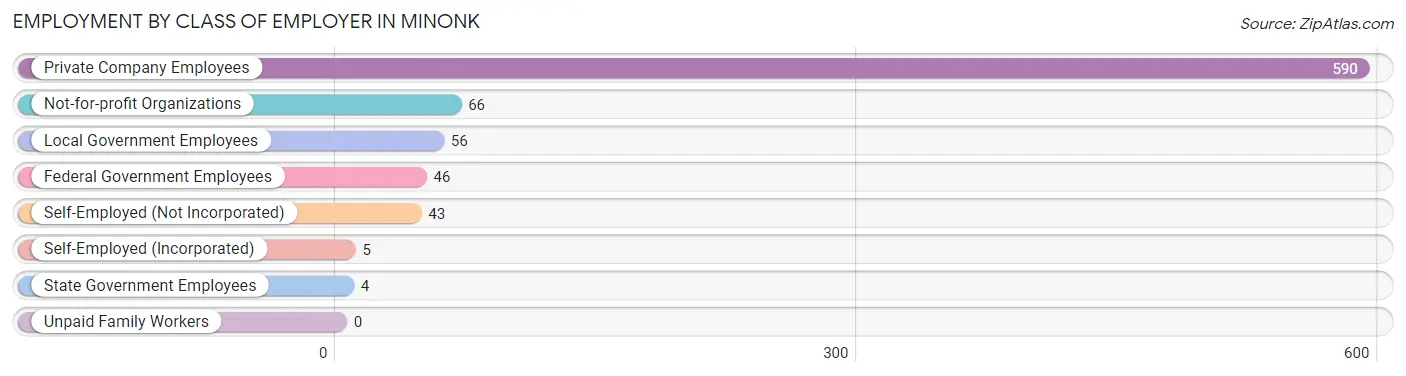
| Employer Class | # Employees | % Employees |
| Private Company Employees | 590 | 72.8% |
| Self-Employed (Incorporated) | 5 | 0.6% |
| Self-Employed (Not Incorporated) | 43 | 5.3% |
| Not-for-profit Organizations | 66 | 8.2% |
| Local Government Employees | 56 | 6.9% |
| State Government Employees | 4 | 0.5% |
| Federal Government Employees | 46 | 5.7% |
| Unpaid Family Workers | 0 | 0.0% |
| Total | 810 | 100.0% |
Employment Status by Age in Minonk
According to the labor force statistics for Minonk, out of the total population over 16 years of age (1,519), 59.4% or 902 individuals are in the labor force, with 7.9% or 71 of them unemployed. The age group with the highest labor force participation rate is 20 to 24 years, with 100.0% or 123 individuals in the labor force. Within the labor force, the 30 to 34 years age range has the highest percentage of unemployed individuals, with 24.7% or 49 of them being unemployed.
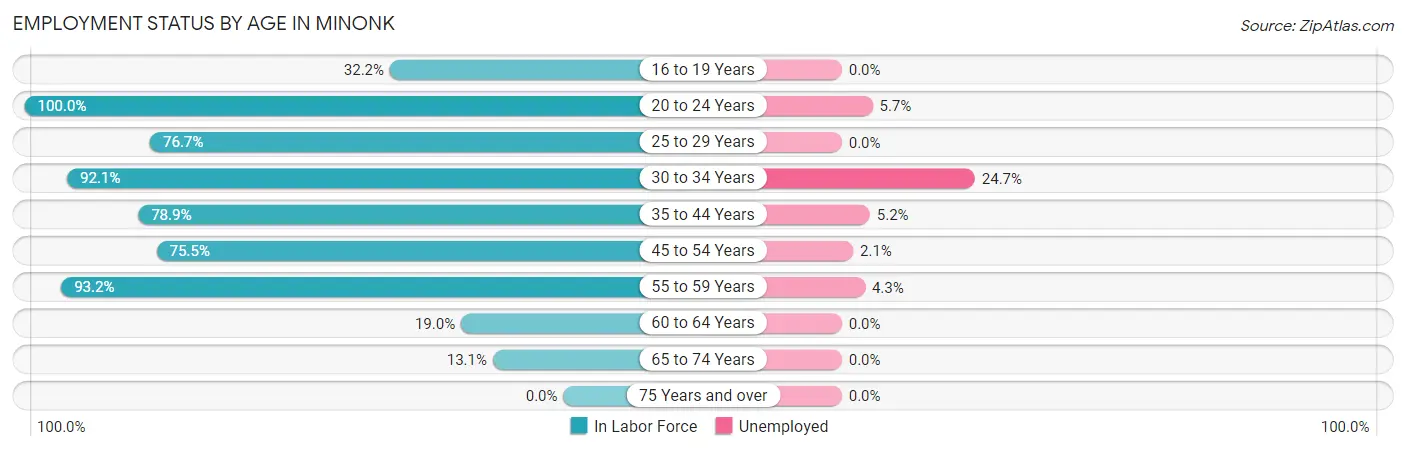
| Age Bracket | In Labor Force | Unemployed |
| 16 to 19 Years | 38 (32.2%) | 0 (0.0%) |
| 20 to 24 Years | 123 (100.0%) | 7 (5.7%) |
| 25 to 29 Years | 66 (76.7%) | 0 (0.0%) |
| 30 to 34 Years | 198 (92.1%) | 49 (24.7%) |
| 35 to 44 Years | 97 (78.9%) | 5 (5.2%) |
| 45 to 54 Years | 188 (75.5%) | 4 (2.1%) |
| 55 to 59 Years | 138 (93.2%) | 6 (4.3%) |
| 60 to 64 Years | 27 (19.0%) | 0 (0.0%) |
| 65 to 74 Years | 27 (13.1%) | 0 (0.0%) |
| 75 Years and over | 0 (0.0%) | 0 (0.0%) |
| Total | 902 (59.4%) | 71 (7.9%) |
Employment Status by Educational Attainment in Minonk
According to labor force statistics for Minonk, 74.1% of individuals (714) out of the total population between 25 and 64 years of age (963) are in the labor force, with 9.0% or 64 of them being unemployed. The group with the highest labor force participation rate are those with the educational attainment of college / associate degree, with 80.1% or 278 individuals in the labor force. Within the labor force, individuals with college / associate degree education have the highest percentage of unemployment, with 20.9% or 58 of them being unemployed.
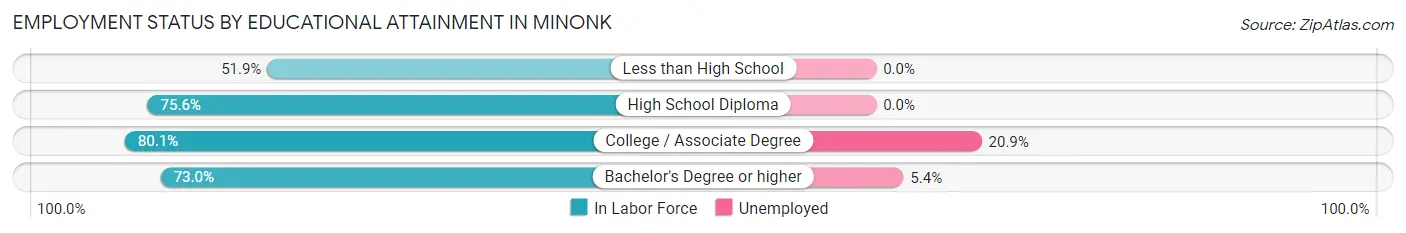
| Educational Attainment | In Labor Force | Unemployed |
| Less than High School | 56 (51.9%) | 0 (0.0%) |
| High School Diploma | 269 (75.6%) | 0 (0.0%) |
| College / Associate Degree | 278 (80.1%) | 73 (20.9%) |
| Bachelor's Degree or higher | 111 (73.0%) | 8 (5.4%) |
| Total | 714 (74.1%) | 87 (9.0%) |
Employment Occupations by Sex in Minonk
Management, Business, Science and Arts Occupations
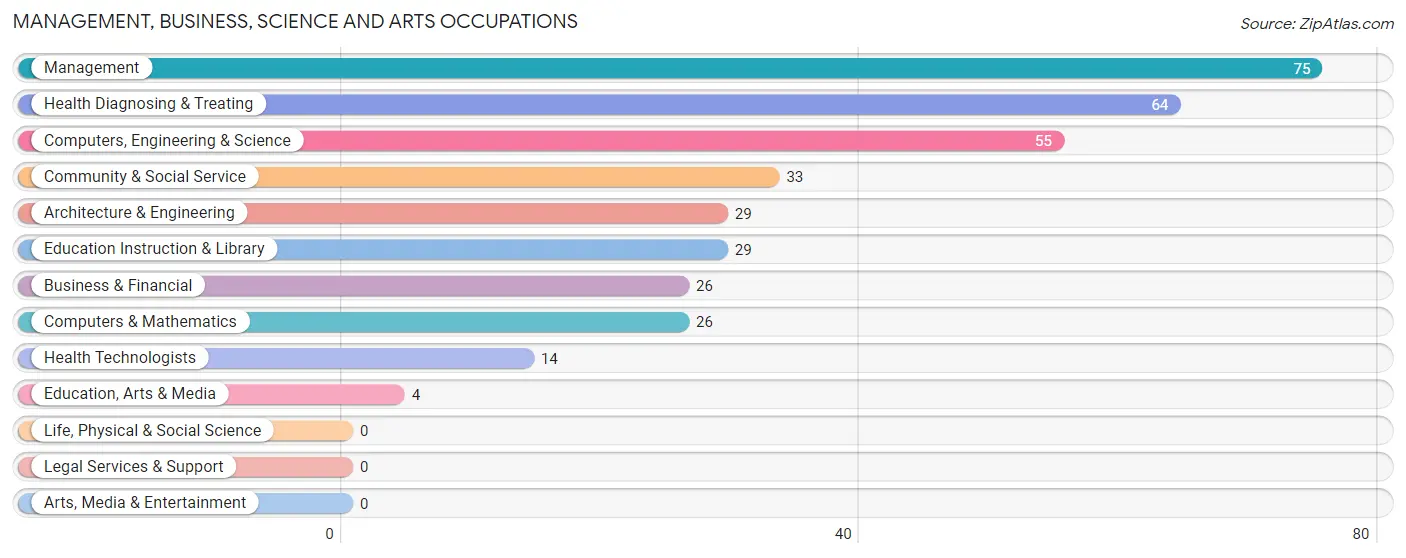
The most common Management, Business, Science and Arts occupations in Minonk are Management (75 | 9.0%), Health Diagnosing & Treating (64 | 7.7%), Computers, Engineering & Science (55 | 6.6%), Community & Social Service (33 | 4.0%), and Architecture & Engineering (29 | 3.5%).
Management, Business, Science and Arts Occupations by Sex
Within the Management, Business, Science and Arts occupations in Minonk, the most male-oriented occupations are Business & Financial (100.0%), Architecture & Engineering (100.0%), and Computers, Engineering & Science (89.1%), while the most female-oriented occupations are Education, Arts & Media (100.0%), Health Technologists (100.0%), and Community & Social Service (81.8%).
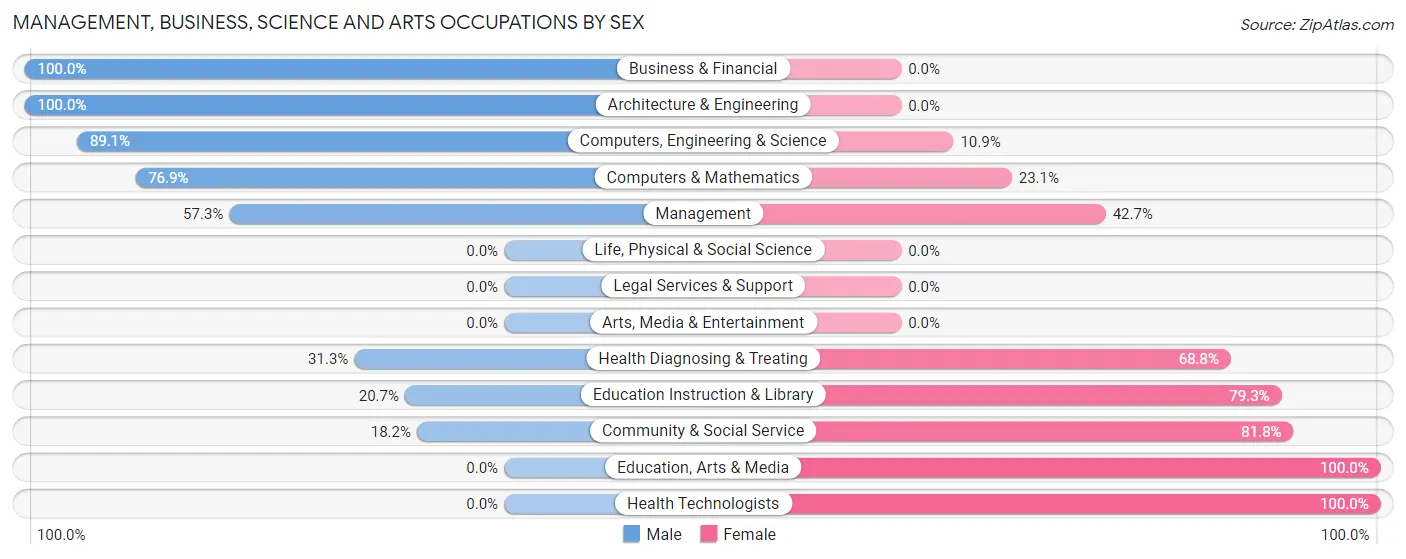
| Occupation | Male | Female |
| Management | 43 (57.3%) | 32 (42.7%) |
| Business & Financial | 26 (100.0%) | 0 (0.0%) |
| Computers, Engineering & Science | 49 (89.1%) | 6 (10.9%) |
| Computers & Mathematics | 20 (76.9%) | 6 (23.1%) |
| Architecture & Engineering | 29 (100.0%) | 0 (0.0%) |
| Life, Physical & Social Science | 0 (0.0%) | 0 (0.0%) |
| Community & Social Service | 6 (18.2%) | 27 (81.8%) |
| Education, Arts & Media | 0 (0.0%) | 4 (100.0%) |
| Legal Services & Support | 0 (0.0%) | 0 (0.0%) |
| Education Instruction & Library | 6 (20.7%) | 23 (79.3%) |
| Arts, Media & Entertainment | 0 (0.0%) | 0 (0.0%) |
| Health Diagnosing & Treating | 20 (31.2%) | 44 (68.8%) |
| Health Technologists | 0 (0.0%) | 14 (100.0%) |
| Total (Category) | 144 (56.9%) | 109 (43.1%) |
| Total (Overall) | 476 (57.3%) | 355 (42.7%) |
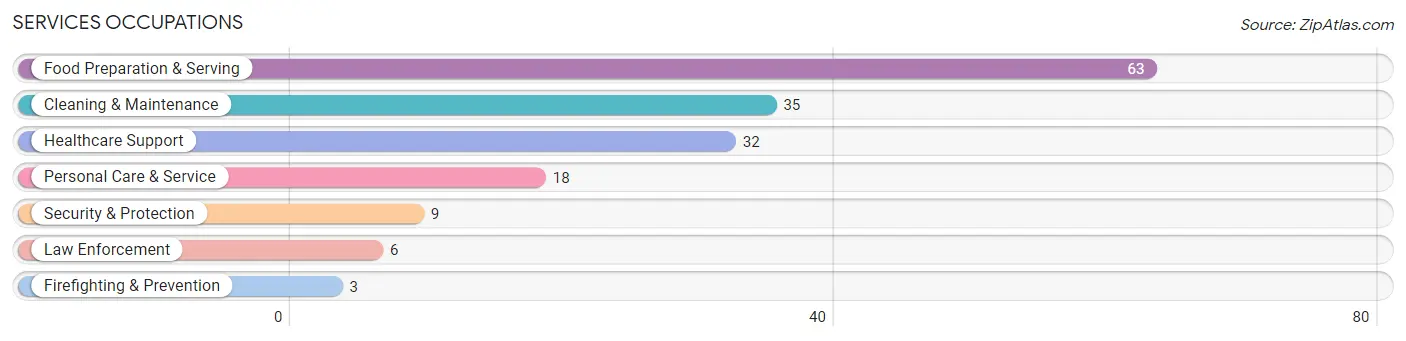
Services Occupations
The most common Services occupations in Minonk are Food Preparation & Serving (63 | 7.6%), Cleaning & Maintenance (35 | 4.2%), Healthcare Support (32 | 3.8%), Personal Care & Service (18 | 2.2%), and Security & Protection (9 | 1.1%).
Services Occupations by Sex
Within the Services occupations in Minonk, the most male-oriented occupations are Law Enforcement (100.0%), Security & Protection (66.7%), and Cleaning & Maintenance (65.7%), while the most female-oriented occupations are Healthcare Support (100.0%), Firefighting & Prevention (100.0%), and Personal Care & Service (100.0%).
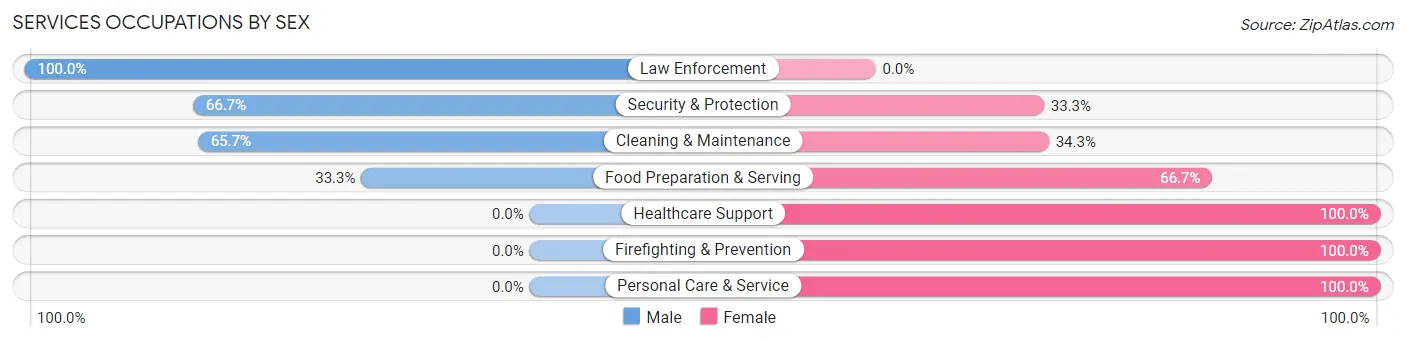
| Occupation | Male | Female |
| Healthcare Support | 0 (0.0%) | 32 (100.0%) |
| Security & Protection | 6 (66.7%) | 3 (33.3%) |
| Firefighting & Prevention | 0 (0.0%) | 3 (100.0%) |
| Law Enforcement | 6 (100.0%) | 0 (0.0%) |
| Food Preparation & Serving | 21 (33.3%) | 42 (66.7%) |
| Cleaning & Maintenance | 23 (65.7%) | 12 (34.3%) |
| Personal Care & Service | 0 (0.0%) | 18 (100.0%) |
| Total (Category) | 50 (31.9%) | 107 (68.1%) |
| Total (Overall) | 476 (57.3%) | 355 (42.7%) |
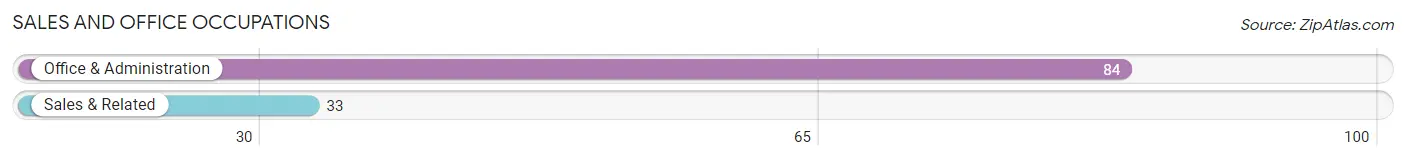
Sales and Office Occupations
The most common Sales and Office occupations in Minonk are Office & Administration (84 | 10.1%), and Sales & Related (33 | 4.0%).
Sales and Office Occupations by Sex
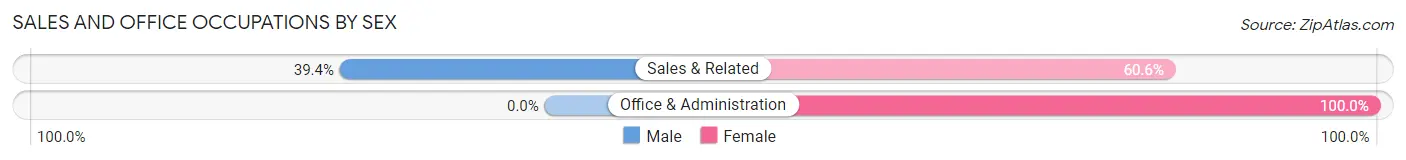
| Occupation | Male | Female |
| Sales & Related | 13 (39.4%) | 20 (60.6%) |
| Office & Administration | 0 (0.0%) | 84 (100.0%) |
| Total (Category) | 13 (11.1%) | 104 (88.9%) |
| Total (Overall) | 476 (57.3%) | 355 (42.7%) |
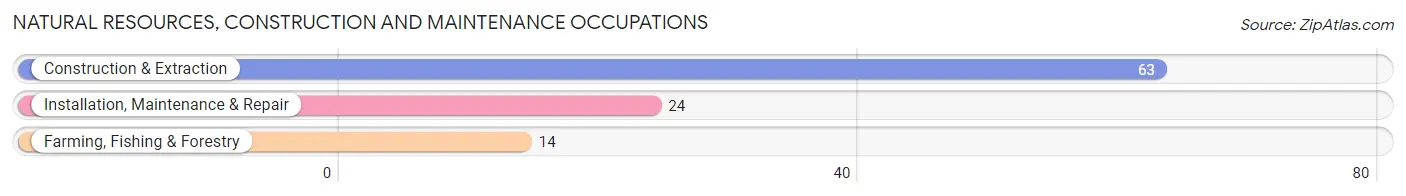
Natural Resources, Construction and Maintenance Occupations
The most common Natural Resources, Construction and Maintenance occupations in Minonk are Construction & Extraction (63 | 7.6%), Installation, Maintenance & Repair (24 | 2.9%), and Farming, Fishing & Forestry (14 | 1.7%).
Natural Resources, Construction and Maintenance Occupations by Sex
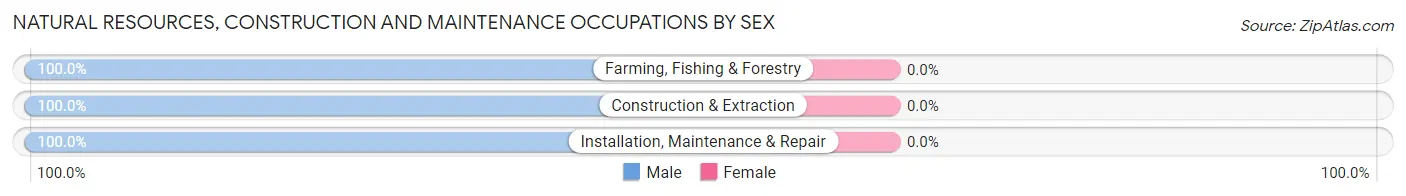
| Occupation | Male | Female |
| Farming, Fishing & Forestry | 14 (100.0%) | 0 (0.0%) |
| Construction & Extraction | 63 (100.0%) | 0 (0.0%) |
| Installation, Maintenance & Repair | 24 (100.0%) | 0 (0.0%) |
| Total (Category) | 101 (100.0%) | 0 (0.0%) |
| Total (Overall) | 476 (57.3%) | 355 (42.7%) |
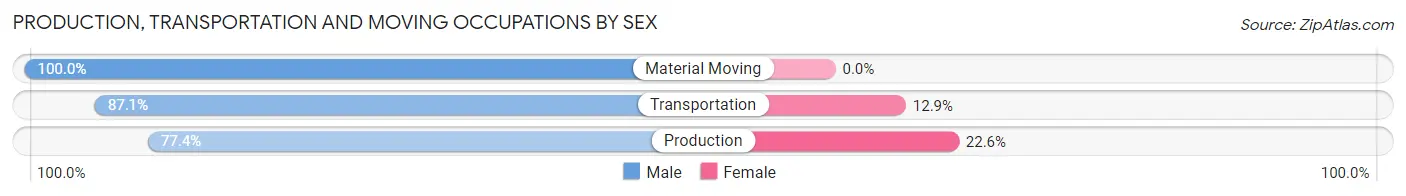
Production, Transportation and Moving Occupations
The most common Production, Transportation and Moving occupations in Minonk are Production (137 | 16.5%), Material Moving (35 | 4.2%), and Transportation (31 | 3.7%).
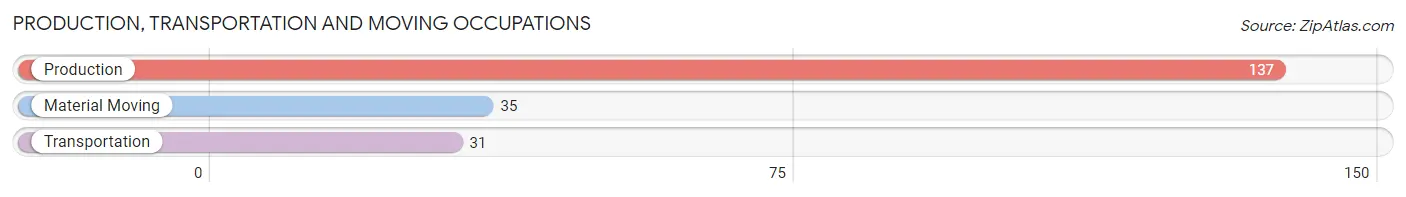
Production, Transportation and Moving Occupations by Sex
| Occupation | Male | Female |
| Production | 106 (77.4%) | 31 (22.6%) |
| Transportation | 27 (87.1%) | 4 (12.9%) |
| Material Moving | 35 (100.0%) | 0 (0.0%) |
| Total (Category) | 168 (82.8%) | 35 (17.2%) |
| Total (Overall) | 476 (57.3%) | 355 (42.7%) |
Employment Industries by Sex in Minonk
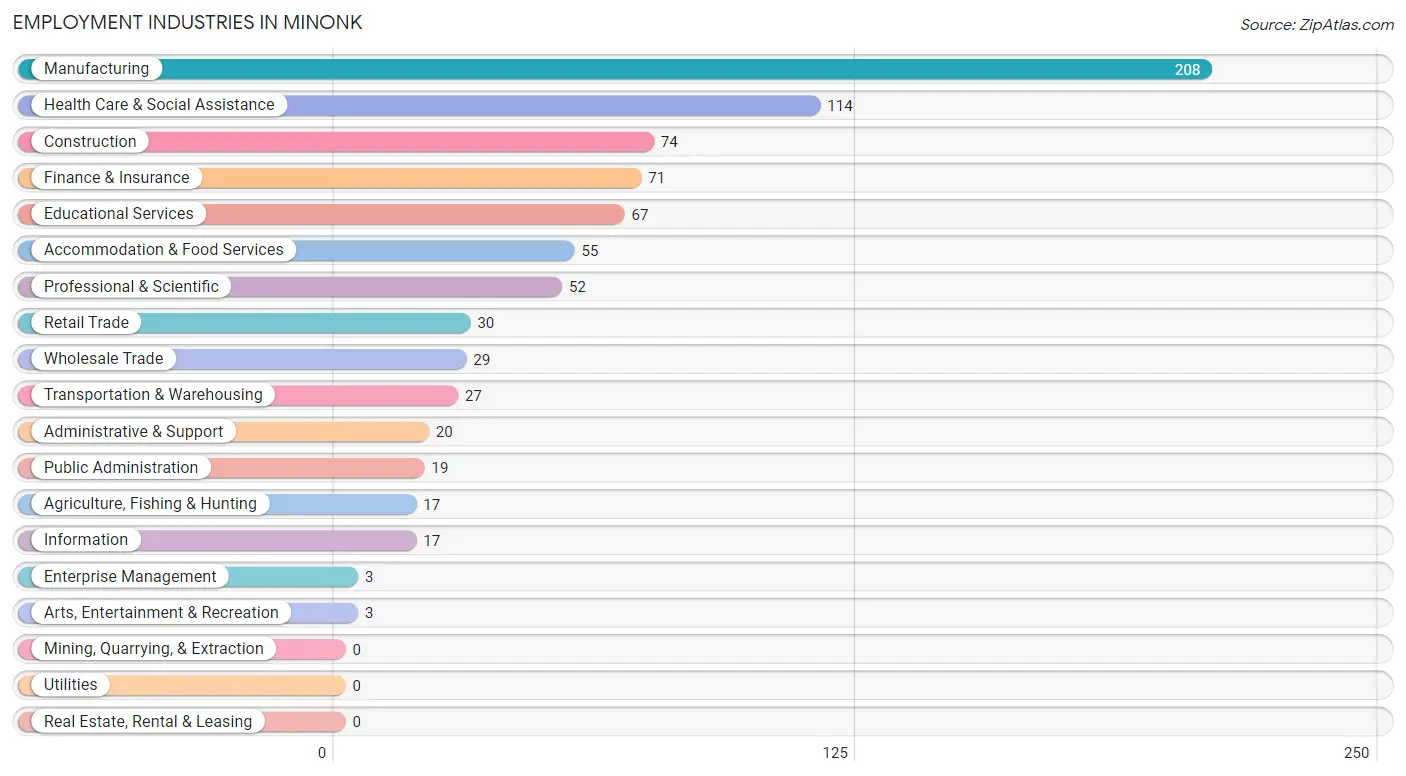
Employment Industries in Minonk
The major employment industries in Minonk include Manufacturing (208 | 25.0%), Health Care & Social Assistance (114 | 13.7%), Construction (74 | 8.9%), Finance & Insurance (71 | 8.5%), and Educational Services (67 | 8.1%).
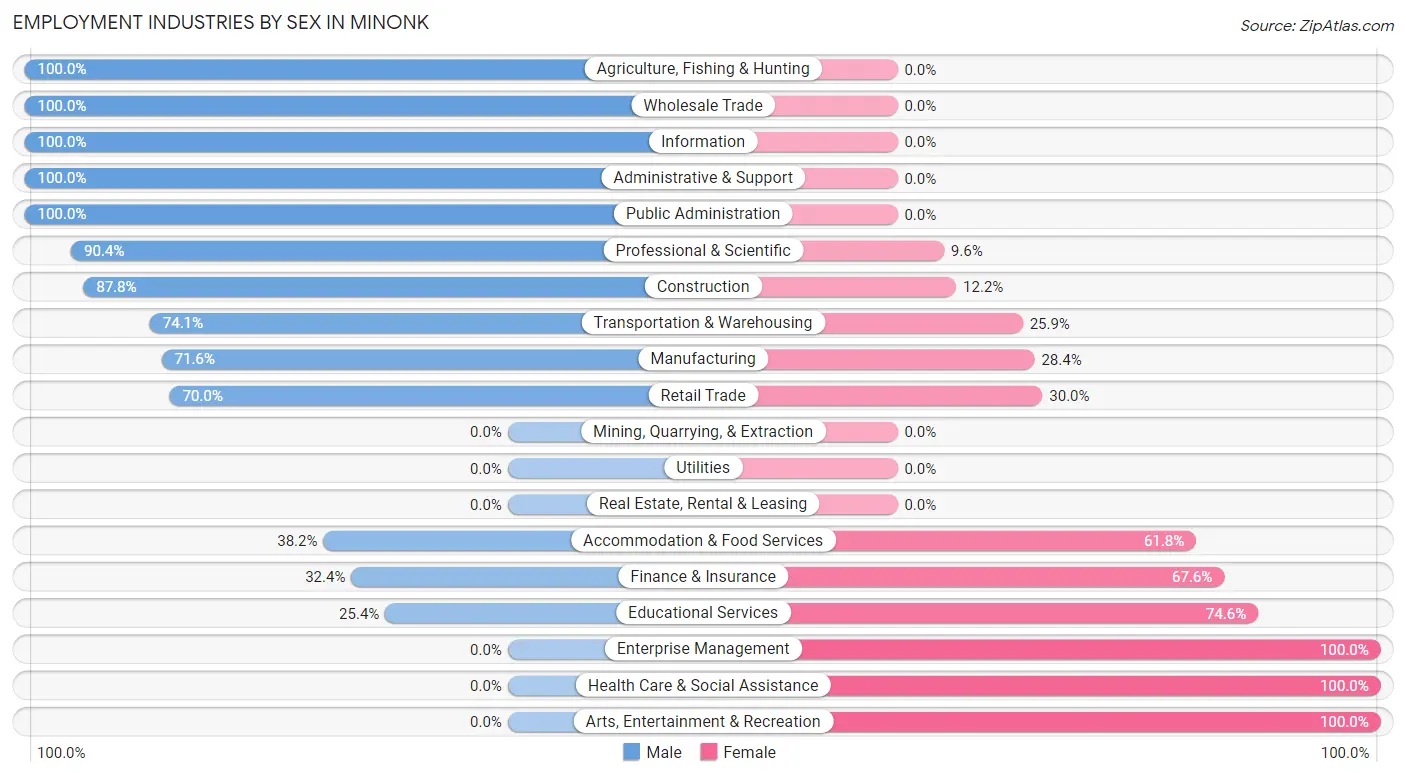
Employment Industries by Sex in Minonk
The Minonk industries that see more men than women are Agriculture, Fishing & Hunting (100.0%), Wholesale Trade (100.0%), and Information (100.0%), whereas the industries that tend to have a higher number of women are Enterprise Management (100.0%), Health Care & Social Assistance (100.0%), and Arts, Entertainment & Recreation (100.0%).
| Industry | Male | Female |
| Agriculture, Fishing & Hunting | 17 (100.0%) | 0 (0.0%) |
| Mining, Quarrying, & Extraction | 0 (0.0%) | 0 (0.0%) |
| Construction | 65 (87.8%) | 9 (12.2%) |
| Manufacturing | 149 (71.6%) | 59 (28.4%) |
| Wholesale Trade | 29 (100.0%) | 0 (0.0%) |
| Retail Trade | 21 (70.0%) | 9 (30.0%) |
| Transportation & Warehousing | 20 (74.1%) | 7 (25.9%) |
| Utilities | 0 (0.0%) | 0 (0.0%) |
| Information | 17 (100.0%) | 0 (0.0%) |
| Finance & Insurance | 23 (32.4%) | 48 (67.6%) |
| Real Estate, Rental & Leasing | 0 (0.0%) | 0 (0.0%) |
| Professional & Scientific | 47 (90.4%) | 5 (9.6%) |
| Enterprise Management | 0 (0.0%) | 3 (100.0%) |
| Administrative & Support | 20 (100.0%) | 0 (0.0%) |
| Educational Services | 17 (25.4%) | 50 (74.6%) |
| Health Care & Social Assistance | 0 (0.0%) | 114 (100.0%) |
| Arts, Entertainment & Recreation | 0 (0.0%) | 3 (100.0%) |
| Accommodation & Food Services | 21 (38.2%) | 34 (61.8%) |
| Public Administration | 19 (100.0%) | 0 (0.0%) |
| Total | 476 (57.3%) | 355 (42.7%) |
Education in Minonk
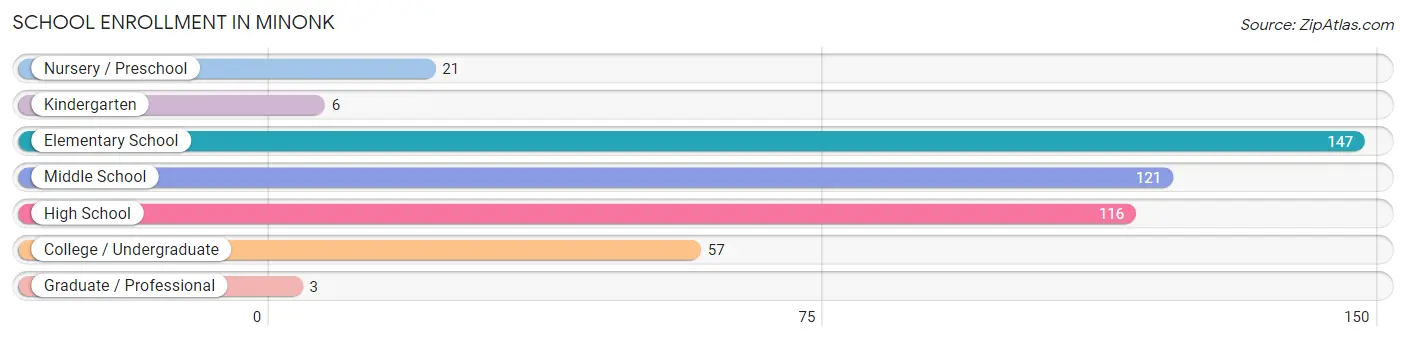
School Enrollment in Minonk
The most common levels of schooling among the 471 students in Minonk are elementary school (147 | 31.2%), middle school (121 | 25.7%), and high school (116 | 24.6%).
| School Level | # Students | % Students |
| Nursery / Preschool | 21 | 4.5% |
| Kindergarten | 6 | 1.3% |
| Elementary School | 147 | 31.2% |
| Middle School | 121 | 25.7% |
| High School | 116 | 24.6% |
| College / Undergraduate | 57 | 12.1% |
| Graduate / Professional | 3 | 0.6% |
| Total | 471 | 100.0% |
School Enrollment by Age by Funding Source in Minonk
Out of a total of 471 students who are enrolled in schools in Minonk, 6 (1.3%) attend a private institution, while the remaining 465 (98.7%) are enrolled in public schools. The age group of 15 to 17 year olds has the highest likelihood of being enrolled in private schools, with 6 (5.8% in the age bracket) enrolled. Conversely, the age group of 3 to 4 year olds has the lowest likelihood of being enrolled in a private school, with 6 (100.0% in the age bracket) attending a public institution.
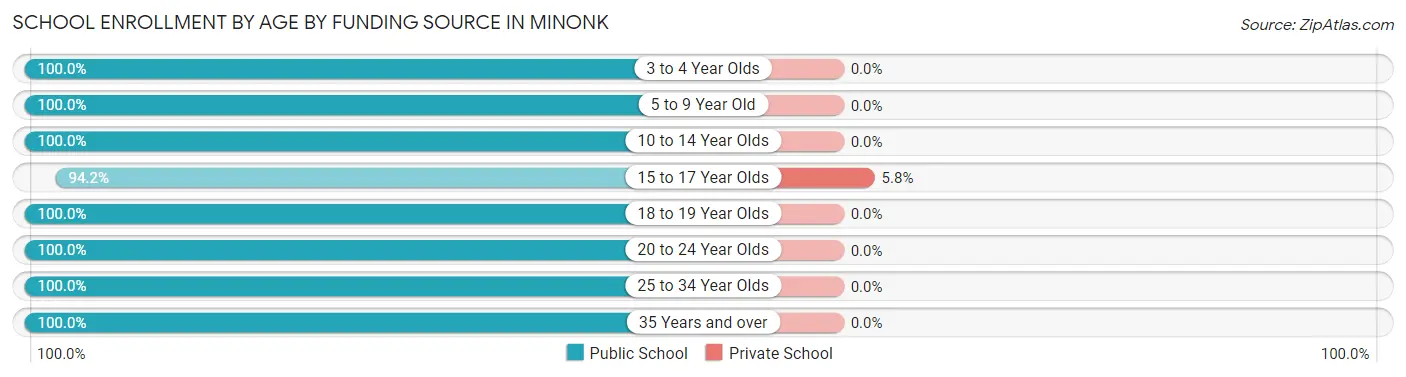
| Age Bracket | Public School | Private School |
| 3 to 4 Year Olds | 6 (100.0%) | 0 (0.0%) |
| 5 to 9 Year Old | 130 (100.0%) | 0 (0.0%) |
| 10 to 14 Year Olds | 171 (100.0%) | 0 (0.0%) |
| 15 to 17 Year Olds | 98 (94.2%) | 6 (5.8%) |
| 18 to 19 Year Olds | 16 (100.0%) | 0 (0.0%) |
| 20 to 24 Year Olds | 9 (100.0%) | 0 (0.0%) |
| 25 to 34 Year Olds | 24 (100.0%) | 0 (0.0%) |
| 35 Years and over | 11 (100.0%) | 0 (0.0%) |
| Total | 465 (98.7%) | 6 (1.3%) |
Educational Attainment by Field of Study in Minonk
Education (69 | 32.7%), business (39 | 18.5%), bio, nature & agricultural (16 | 7.6%), physical & health sciences (16 | 7.6%), and computers & mathematics (15 | 7.1%) are the most common fields of study among 211 individuals in Minonk who have obtained a bachelor's degree or higher.
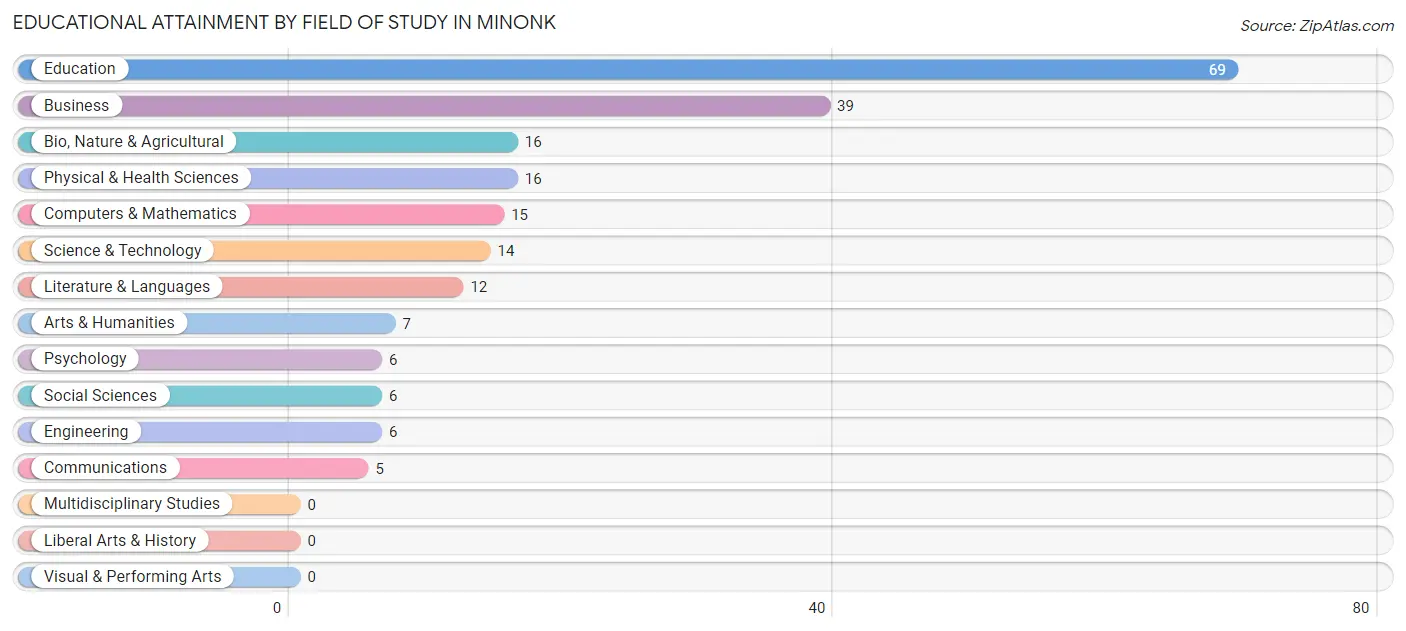
| Field of Study | # Graduates | % Graduates |
| Computers & Mathematics | 15 | 7.1% |
| Bio, Nature & Agricultural | 16 | 7.6% |
| Physical & Health Sciences | 16 | 7.6% |
| Psychology | 6 | 2.8% |
| Social Sciences | 6 | 2.8% |
| Engineering | 6 | 2.8% |
| Multidisciplinary Studies | 0 | 0.0% |
| Science & Technology | 14 | 6.6% |
| Business | 39 | 18.5% |
| Education | 69 | 32.7% |
| Literature & Languages | 12 | 5.7% |
| Liberal Arts & History | 0 | 0.0% |
| Visual & Performing Arts | 0 | 0.0% |
| Communications | 5 | 2.4% |
| Arts & Humanities | 7 | 3.3% |
| Total | 211 | 100.0% |
Transportation & Commute in Minonk
Vehicle Availability by Sex in Minonk
The most prevalent vehicle ownership categories in Minonk are males with 2 vehicles (272, accounting for 59.8%) and females with 2 vehicles (177, making up 76.8%).
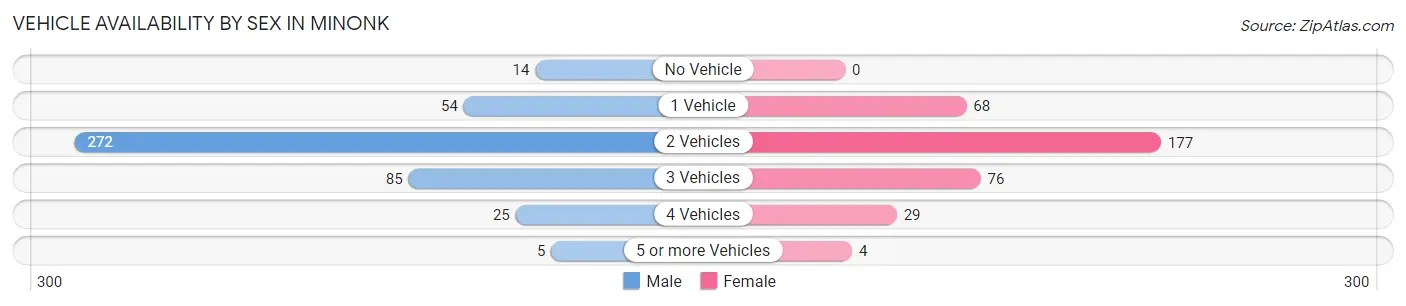
| Vehicles Available | Male | Female |
| No Vehicle | 14 (3.1%) | 0 (0.0%) |
| 1 Vehicle | 54 (11.9%) | 68 (19.2%) |
| 2 Vehicles | 272 (59.8%) | 177 (50.0%) |
| 3 Vehicles | 85 (18.7%) | 76 (21.5%) |
| 4 Vehicles | 25 (5.5%) | 29 (8.2%) |
| 5 or more Vehicles | 5 (1.1%) | 4 (1.1%) |
| Total | 455 (100.0%) | 354 (100.0%) |
Commute Time in Minonk
The most frequently occuring commute durations in Minonk are 5 to 9 minutes (145 commuters, 18.9%), 30 to 34 minutes (117 commuters, 15.2%), and 15 to 19 minutes (107 commuters, 14.0%).
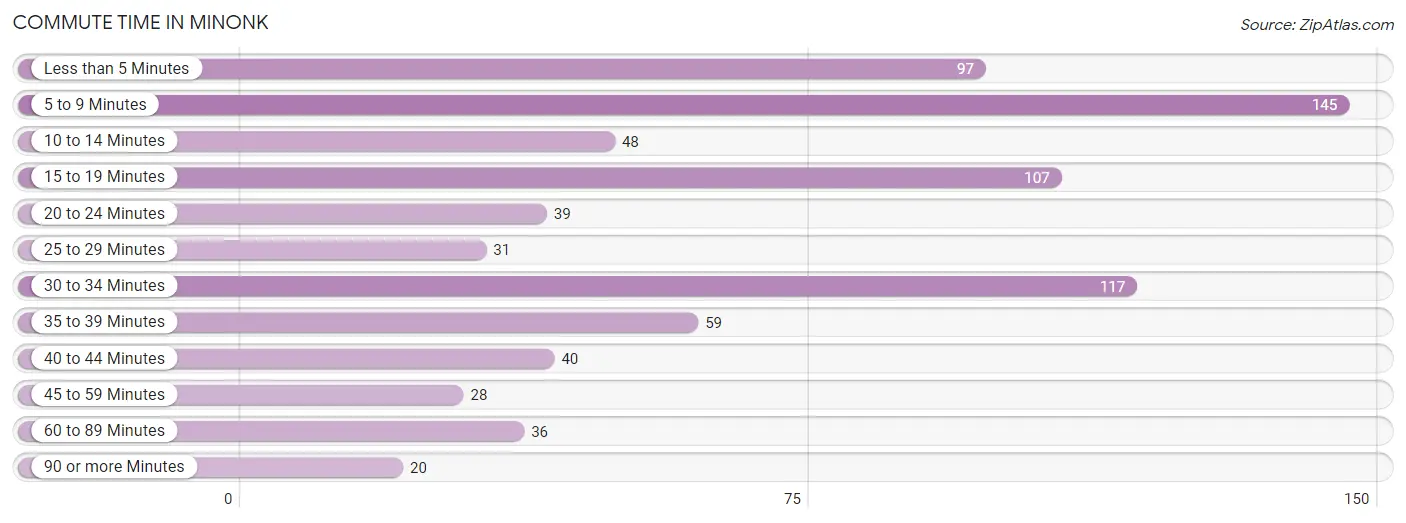
| Commute Time | # Commuters | % Commuters |
| Less than 5 Minutes | 97 | 12.7% |
| 5 to 9 Minutes | 145 | 18.9% |
| 10 to 14 Minutes | 48 | 6.3% |
| 15 to 19 Minutes | 107 | 14.0% |
| 20 to 24 Minutes | 39 | 5.1% |
| 25 to 29 Minutes | 31 | 4.0% |
| 30 to 34 Minutes | 117 | 15.2% |
| 35 to 39 Minutes | 59 | 7.7% |
| 40 to 44 Minutes | 40 | 5.2% |
| 45 to 59 Minutes | 28 | 3.6% |
| 60 to 89 Minutes | 36 | 4.7% |
| 90 or more Minutes | 20 | 2.6% |
Commute Time by Sex in Minonk
The most common commute times in Minonk are 5 to 9 minutes (114 commuters, 26.3%) for males and less than 5 minutes (77 commuters, 23.1%) for females.
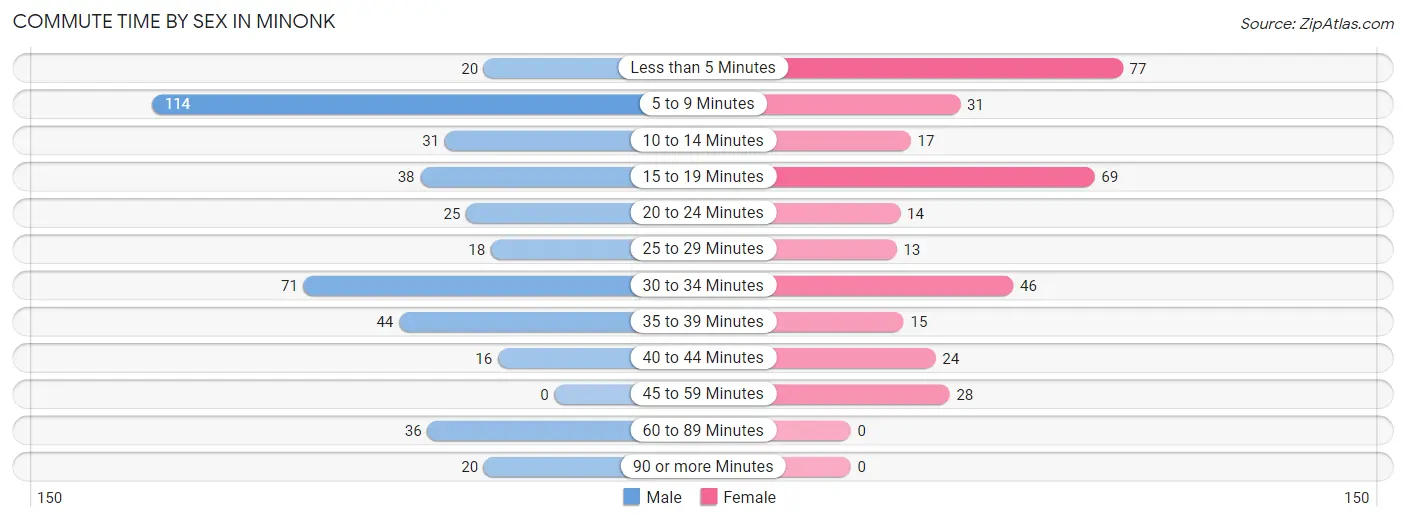
| Commute Time | Male | Female |
| Less than 5 Minutes | 20 (4.6%) | 77 (23.1%) |
| 5 to 9 Minutes | 114 (26.3%) | 31 (9.3%) |
| 10 to 14 Minutes | 31 (7.2%) | 17 (5.1%) |
| 15 to 19 Minutes | 38 (8.8%) | 69 (20.7%) |
| 20 to 24 Minutes | 25 (5.8%) | 14 (4.2%) |
| 25 to 29 Minutes | 18 (4.2%) | 13 (3.9%) |
| 30 to 34 Minutes | 71 (16.4%) | 46 (13.8%) |
| 35 to 39 Minutes | 44 (10.2%) | 15 (4.5%) |
| 40 to 44 Minutes | 16 (3.7%) | 24 (7.2%) |
| 45 to 59 Minutes | 0 (0.0%) | 28 (8.4%) |
| 60 to 89 Minutes | 36 (8.3%) | 0 (0.0%) |
| 90 or more Minutes | 20 (4.6%) | 0 (0.0%) |
Time of Departure to Work by Sex in Minonk
The most frequent times of departure to work in Minonk are 4:00 PM to 11:59 PM (77, 17.8%) for males and 7:30 AM to 7:59 AM (67, 20.1%) for females.
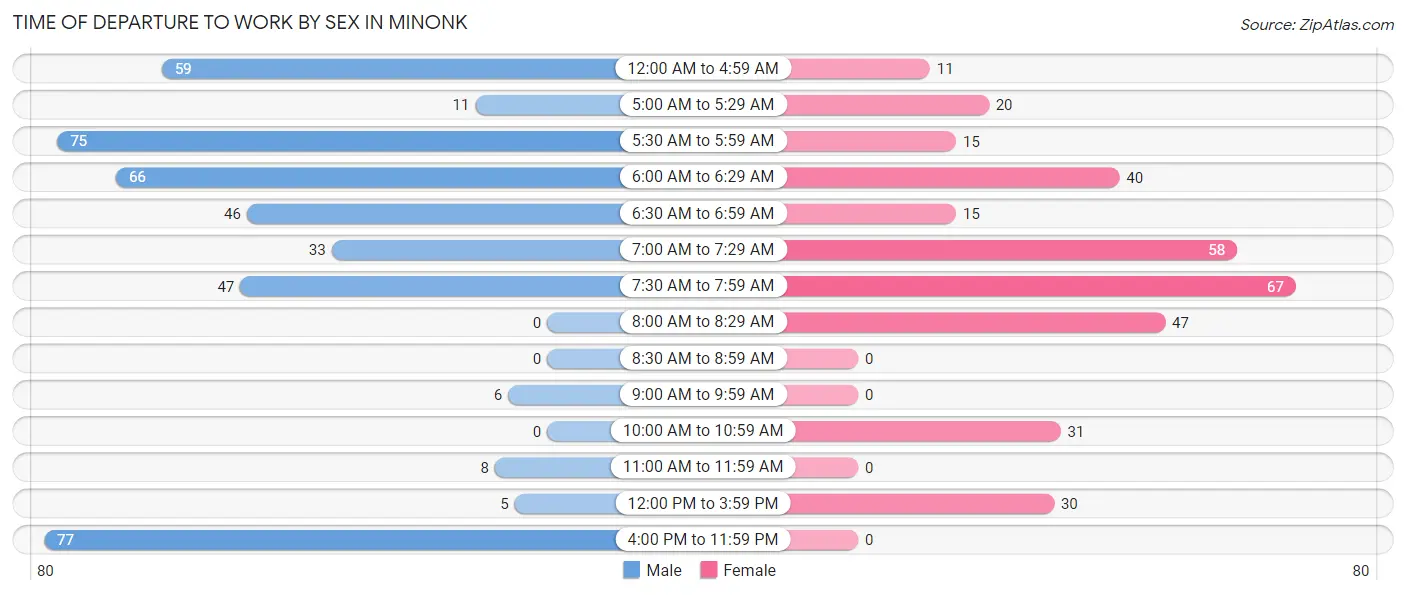
| Time of Departure | Male | Female |
| 12:00 AM to 4:59 AM | 59 (13.6%) | 11 (3.3%) |
| 5:00 AM to 5:29 AM | 11 (2.5%) | 20 (6.0%) |
| 5:30 AM to 5:59 AM | 75 (17.3%) | 15 (4.5%) |
| 6:00 AM to 6:29 AM | 66 (15.2%) | 40 (12.0%) |
| 6:30 AM to 6:59 AM | 46 (10.6%) | 15 (4.5%) |
| 7:00 AM to 7:29 AM | 33 (7.6%) | 58 (17.4%) |
| 7:30 AM to 7:59 AM | 47 (10.8%) | 67 (20.1%) |
| 8:00 AM to 8:29 AM | 0 (0.0%) | 47 (14.1%) |
| 8:30 AM to 8:59 AM | 0 (0.0%) | 0 (0.0%) |
| 9:00 AM to 9:59 AM | 6 (1.4%) | 0 (0.0%) |
| 10:00 AM to 10:59 AM | 0 (0.0%) | 31 (9.3%) |
| 11:00 AM to 11:59 AM | 8 (1.8%) | 0 (0.0%) |
| 12:00 PM to 3:59 PM | 5 (1.1%) | 30 (9.0%) |
| 4:00 PM to 11:59 PM | 77 (17.8%) | 0 (0.0%) |
| Total | 433 (100.0%) | 334 (100.0%) |
Housing Occupancy in Minonk
Occupancy by Ownership in Minonk
Of the total 817 dwellings in Minonk, owner-occupied units account for 559 (68.4%), while renter-occupied units make up 258 (31.6%).
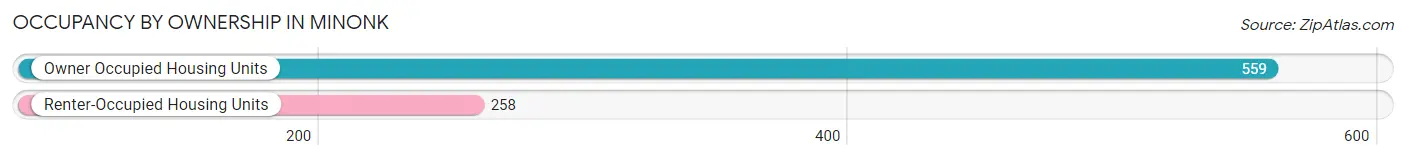
| Occupancy | # Housing Units | % Housing Units |
| Owner Occupied Housing Units | 559 | 68.4% |
| Renter-Occupied Housing Units | 258 | 31.6% |
| Total Occupied Housing Units | 817 | 100.0% |
Occupancy by Household Size in Minonk
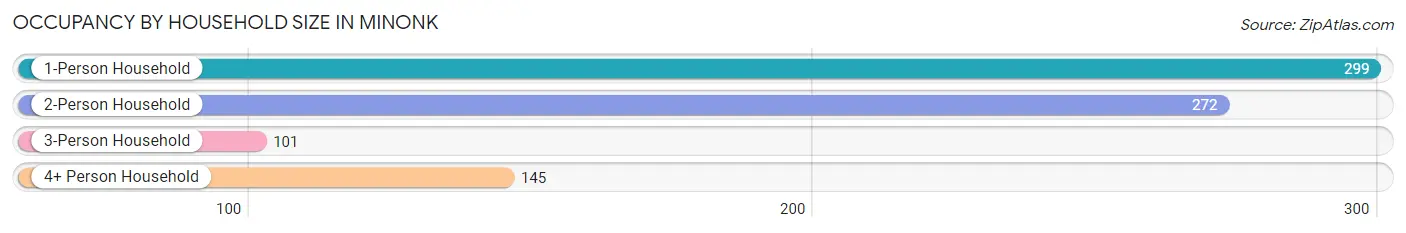
| Household Size | # Housing Units | % Housing Units |
| 1-Person Household | 299 | 36.6% |
| 2-Person Household | 272 | 33.3% |
| 3-Person Household | 101 | 12.4% |
| 4+ Person Household | 145 | 17.7% |
| Total Housing Units | 817 | 100.0% |
Occupancy by Ownership by Household Size in Minonk
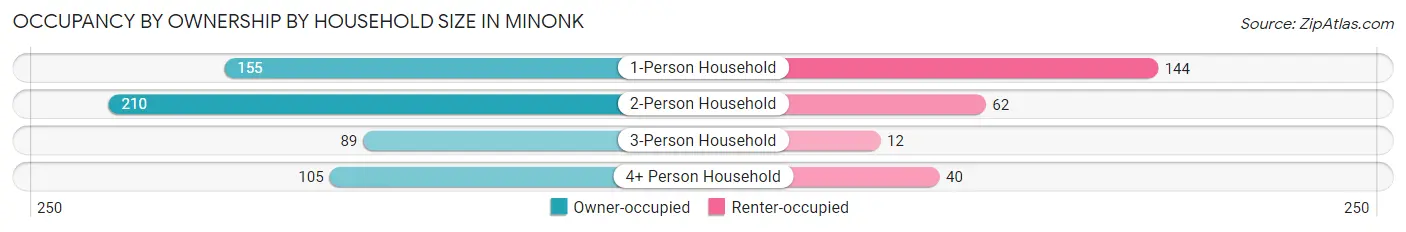
| Household Size | Owner-occupied | Renter-occupied |
| 1-Person Household | 155 (51.8%) | 144 (48.2%) |
| 2-Person Household | 210 (77.2%) | 62 (22.8%) |
| 3-Person Household | 89 (88.1%) | 12 (11.9%) |
| 4+ Person Household | 105 (72.4%) | 40 (27.6%) |
| Total Housing Units | 559 (68.4%) | 258 (31.6%) |
Occupancy by Educational Attainment in Minonk
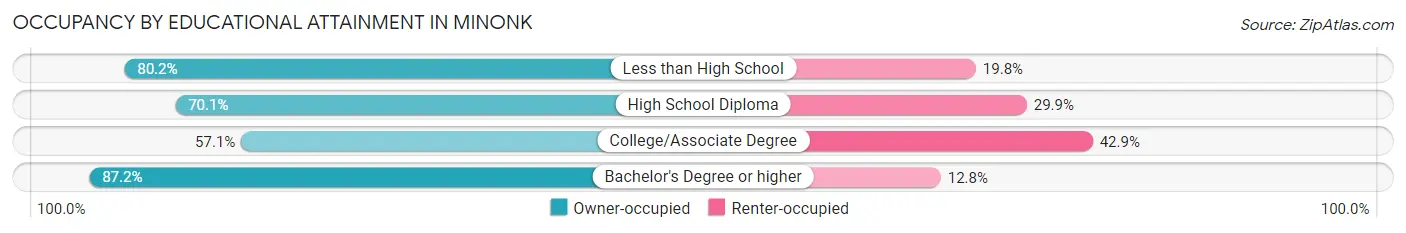
| Household Size | Owner-occupied | Renter-occupied |
| Less than High School | 69 (80.2%) | 17 (19.8%) |
| High School Diploma | 202 (70.1%) | 86 (29.9%) |
| College/Associate Degree | 186 (57.1%) | 140 (42.9%) |
| Bachelor's Degree or higher | 102 (87.2%) | 15 (12.8%) |
Occupancy by Age of Householder in Minonk
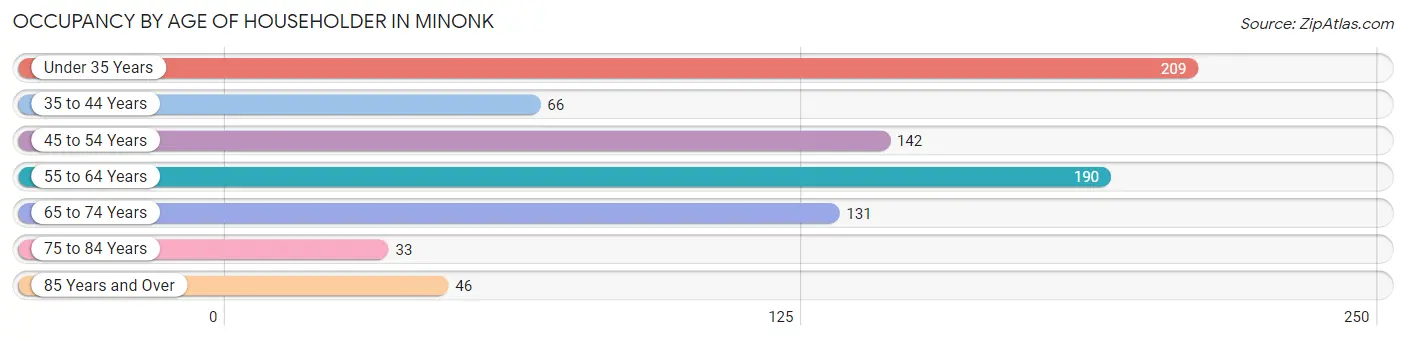
| Age Bracket | # Households | % Households |
| Under 35 Years | 209 | 25.6% |
| 35 to 44 Years | 66 | 8.1% |
| 45 to 54 Years | 142 | 17.4% |
| 55 to 64 Years | 190 | 23.3% |
| 65 to 74 Years | 131 | 16.0% |
| 75 to 84 Years | 33 | 4.0% |
| 85 Years and Over | 46 | 5.6% |
| Total | 817 | 100.0% |
Housing Finances in Minonk
Median Income by Occupancy in Minonk
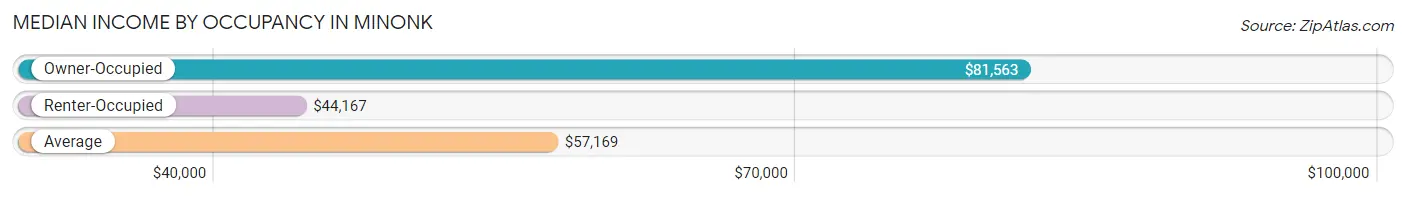
| Occupancy Type | # Households | Median Income |
| Owner-Occupied | 559 (68.4%) | $81,563 |
| Renter-Occupied | 258 (31.6%) | $44,167 |
| Average | 817 (100.0%) | $57,169 |
Occupancy by Householder Income Bracket in Minonk
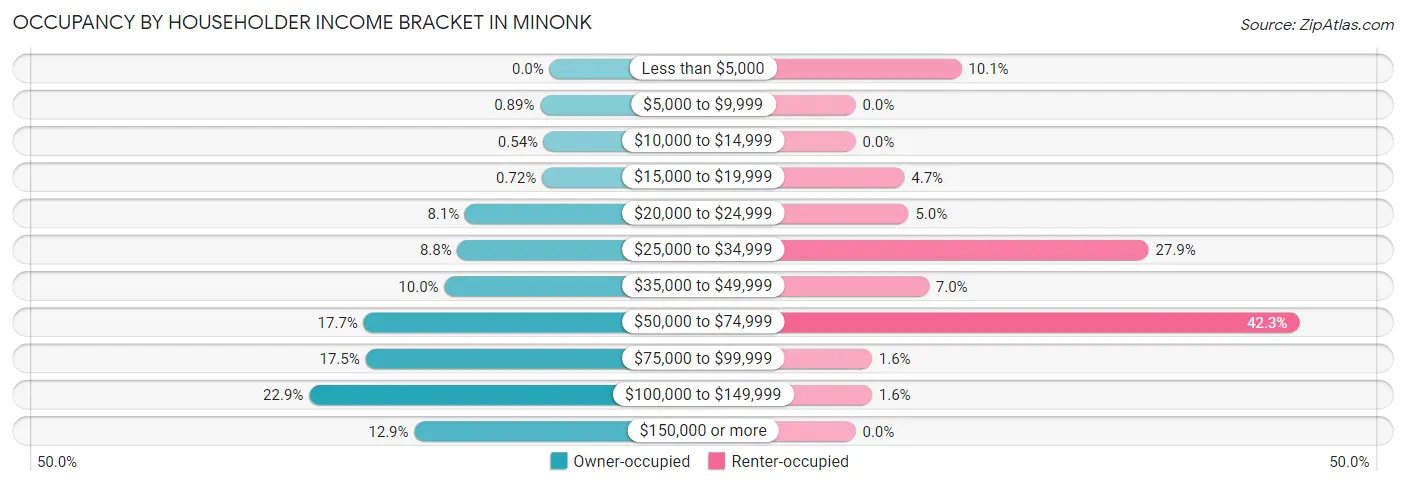
| Income Bracket | Owner-occupied | Renter-occupied |
| Less than $5,000 | 0 (0.0%) | 26 (10.1%) |
| $5,000 to $9,999 | 5 (0.9%) | 0 (0.0%) |
| $10,000 to $14,999 | 3 (0.5%) | 0 (0.0%) |
| $15,000 to $19,999 | 4 (0.7%) | 12 (4.6%) |
| $20,000 to $24,999 | 45 (8.1%) | 13 (5.0%) |
| $25,000 to $34,999 | 49 (8.8%) | 72 (27.9%) |
| $35,000 to $49,999 | 56 (10.0%) | 18 (7.0%) |
| $50,000 to $74,999 | 99 (17.7%) | 109 (42.2%) |
| $75,000 to $99,999 | 98 (17.5%) | 4 (1.5%) |
| $100,000 to $149,999 | 128 (22.9%) | 4 (1.5%) |
| $150,000 or more | 72 (12.9%) | 0 (0.0%) |
| Total | 559 (100.0%) | 258 (100.0%) |
Monthly Housing Cost Tiers in Minonk
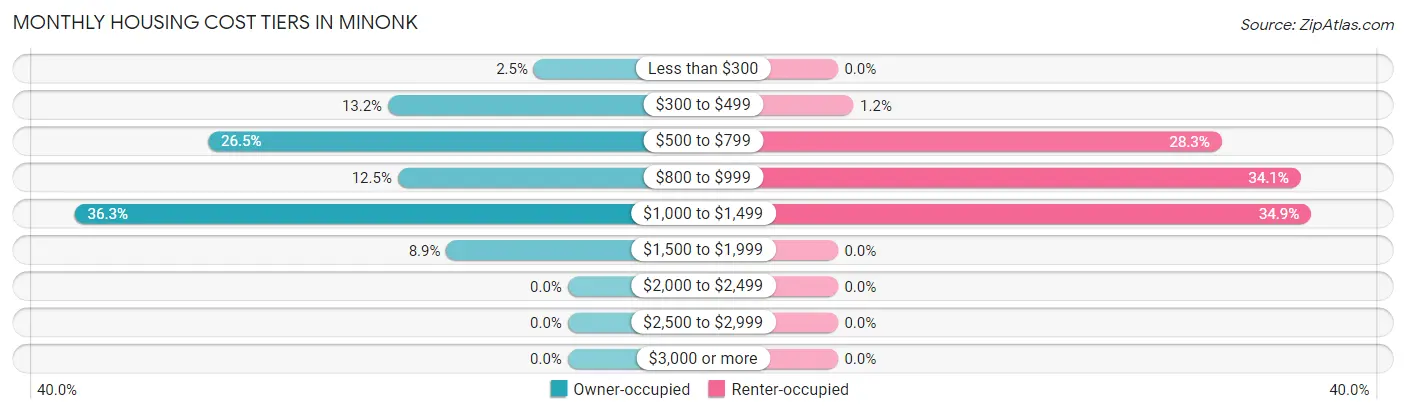
| Monthly Cost | Owner-occupied | Renter-occupied |
| Less than $300 | 14 (2.5%) | 0 (0.0%) |
| $300 to $499 | 74 (13.2%) | 3 (1.2%) |
| $500 to $799 | 148 (26.5%) | 73 (28.3%) |
| $800 to $999 | 70 (12.5%) | 88 (34.1%) |
| $1,000 to $1,499 | 203 (36.3%) | 90 (34.9%) |
| $1,500 to $1,999 | 50 (8.9%) | 0 (0.0%) |
| $2,000 to $2,499 | 0 (0.0%) | 0 (0.0%) |
| $2,500 to $2,999 | 0 (0.0%) | 0 (0.0%) |
| $3,000 or more | 0 (0.0%) | 0 (0.0%) |
| Total | 559 (100.0%) | 258 (100.0%) |
Physical Housing Characteristics in Minonk
Housing Structures in Minonk
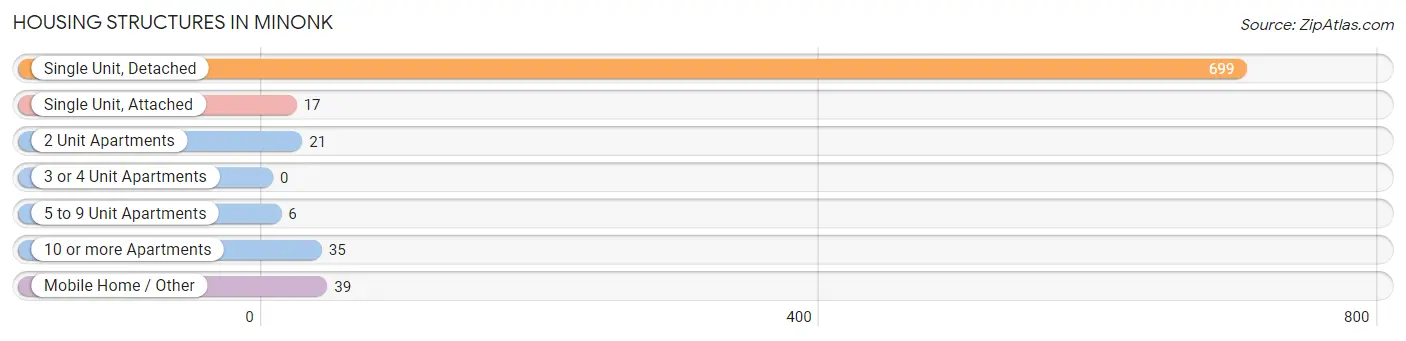
| Structure Type | # Housing Units | % Housing Units |
| Single Unit, Detached | 699 | 85.6% |
| Single Unit, Attached | 17 | 2.1% |
| 2 Unit Apartments | 21 | 2.6% |
| 3 or 4 Unit Apartments | 0 | 0.0% |
| 5 to 9 Unit Apartments | 6 | 0.7% |
| 10 or more Apartments | 35 | 4.3% |
| Mobile Home / Other | 39 | 4.8% |
| Total | 817 | 100.0% |
Housing Structures by Occupancy in Minonk
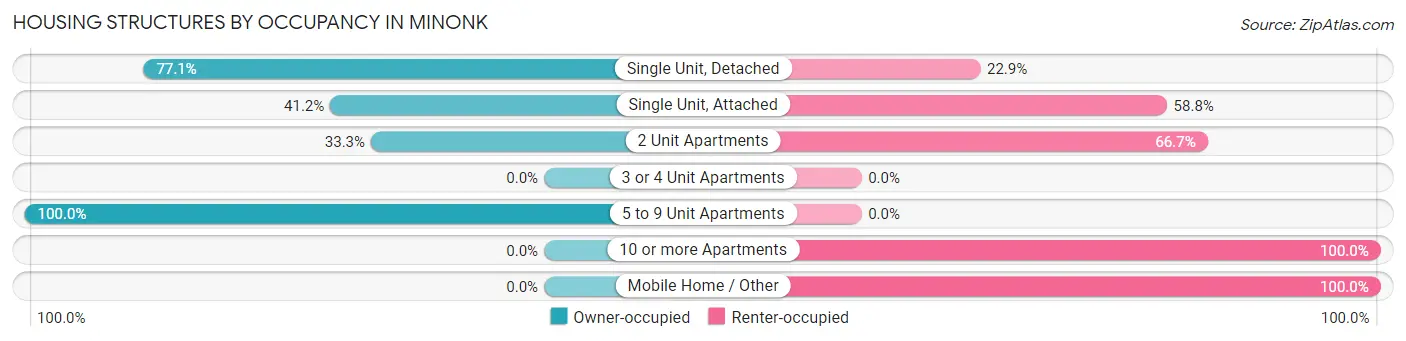
| Structure Type | Owner-occupied | Renter-occupied |
| Single Unit, Detached | 539 (77.1%) | 160 (22.9%) |
| Single Unit, Attached | 7 (41.2%) | 10 (58.8%) |
| 2 Unit Apartments | 7 (33.3%) | 14 (66.7%) |
| 3 or 4 Unit Apartments | 0 (0.0%) | 0 (0.0%) |
| 5 to 9 Unit Apartments | 6 (100.0%) | 0 (0.0%) |
| 10 or more Apartments | 0 (0.0%) | 35 (100.0%) |
| Mobile Home / Other | 0 (0.0%) | 39 (100.0%) |
| Total | 559 (68.4%) | 258 (31.6%) |
Housing Structures by Number of Rooms in Minonk
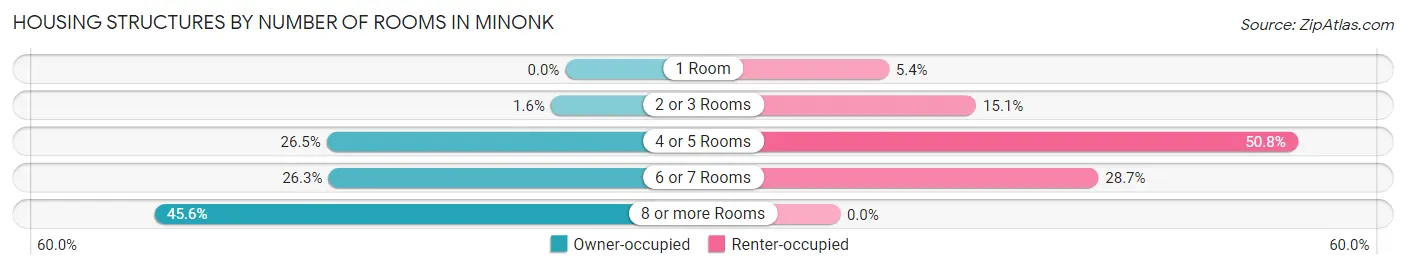
| Number of Rooms | Owner-occupied | Renter-occupied |
| 1 Room | 0 (0.0%) | 14 (5.4%) |
| 2 or 3 Rooms | 9 (1.6%) | 39 (15.1%) |
| 4 or 5 Rooms | 148 (26.5%) | 131 (50.8%) |
| 6 or 7 Rooms | 147 (26.3%) | 74 (28.7%) |
| 8 or more Rooms | 255 (45.6%) | 0 (0.0%) |
| Total | 559 (100.0%) | 258 (100.0%) |
Housing Structure by Heating Type in Minonk
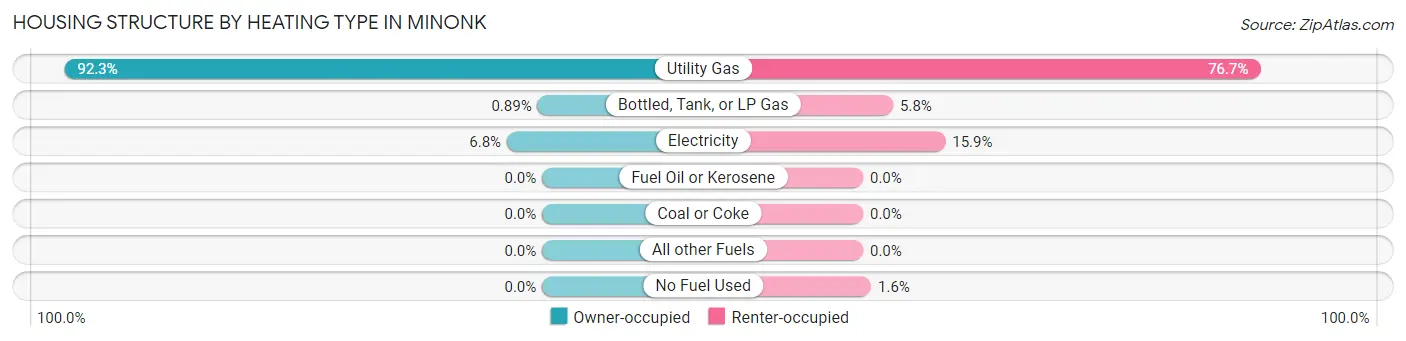
| Heating Type | Owner-occupied | Renter-occupied |
| Utility Gas | 516 (92.3%) | 198 (76.7%) |
| Bottled, Tank, or LP Gas | 5 (0.9%) | 15 (5.8%) |
| Electricity | 38 (6.8%) | 41 (15.9%) |
| Fuel Oil or Kerosene | 0 (0.0%) | 0 (0.0%) |
| Coal or Coke | 0 (0.0%) | 0 (0.0%) |
| All other Fuels | 0 (0.0%) | 0 (0.0%) |
| No Fuel Used | 0 (0.0%) | 4 (1.5%) |
| Total | 559 (100.0%) | 258 (100.0%) |
Household Vehicle Usage in Minonk
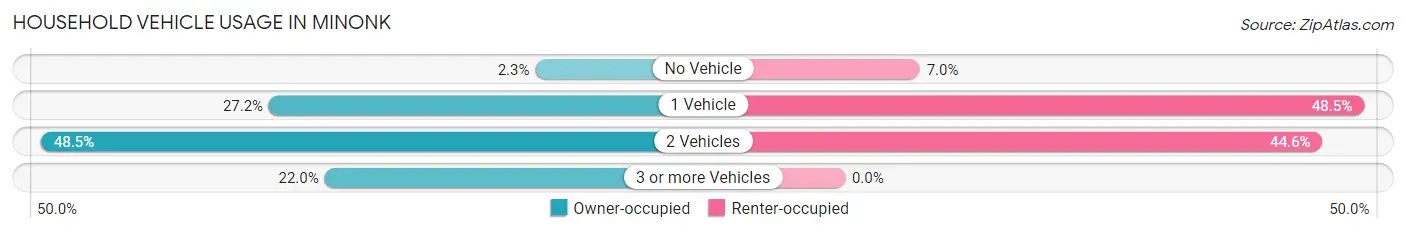
| Vehicles per Household | Owner-occupied | Renter-occupied |
| No Vehicle | 13 (2.3%) | 18 (7.0%) |
| 1 Vehicle | 152 (27.2%) | 125 (48.4%) |
| 2 Vehicles | 271 (48.5%) | 115 (44.6%) |
| 3 or more Vehicles | 123 (22.0%) | 0 (0.0%) |
| Total | 559 (100.0%) | 258 (100.0%) |
Real Estate & Mortgages in Minonk
Real Estate and Mortgage Overview in Minonk
| Characteristic | Without Mortgage | With Mortgage |
| Housing Units | 246 | 313 |
| Median Property Value | $124,000 | $117,200 |
| Median Household Income | $64,063 | $49 |
| Monthly Housing Costs | $568 | $0 |
| Real Estate Taxes | $2,267 | $3 |
Property Value by Mortgage Status in Minonk
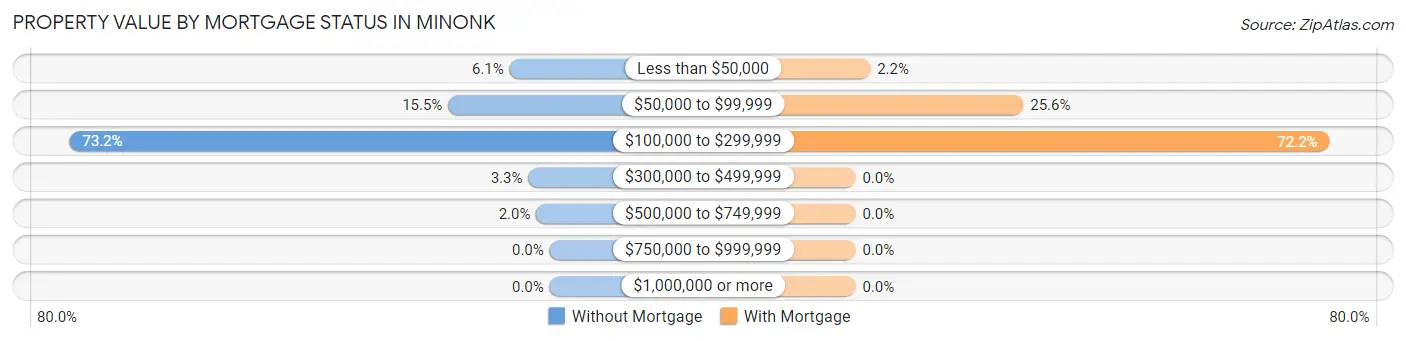
| Property Value | Without Mortgage | With Mortgage |
| Less than $50,000 | 15 (6.1%) | 7 (2.2%) |
| $50,000 to $99,999 | 38 (15.4%) | 80 (25.6%) |
| $100,000 to $299,999 | 180 (73.2%) | 226 (72.2%) |
| $300,000 to $499,999 | 8 (3.3%) | 0 (0.0%) |
| $500,000 to $749,999 | 5 (2.0%) | 0 (0.0%) |
| $750,000 to $999,999 | 0 (0.0%) | 0 (0.0%) |
| $1,000,000 or more | 0 (0.0%) | 0 (0.0%) |
| Total | 246 (100.0%) | 313 (100.0%) |
Household Income by Mortgage Status in Minonk
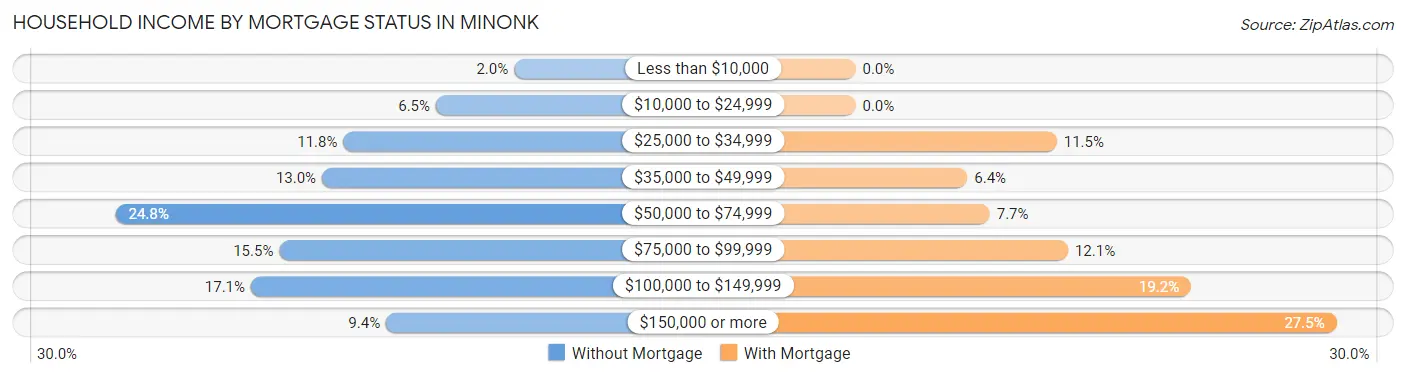
| Household Income | Without Mortgage | With Mortgage |
| Less than $10,000 | 5 (2.0%) | 0 (0.0%) |
| $10,000 to $24,999 | 16 (6.5%) | 0 (0.0%) |
| $25,000 to $34,999 | 29 (11.8%) | 36 (11.5%) |
| $35,000 to $49,999 | 32 (13.0%) | 20 (6.4%) |
| $50,000 to $74,999 | 61 (24.8%) | 24 (7.7%) |
| $75,000 to $99,999 | 38 (15.4%) | 38 (12.1%) |
| $100,000 to $149,999 | 42 (17.1%) | 60 (19.2%) |
| $150,000 or more | 23 (9.3%) | 86 (27.5%) |
| Total | 246 (100.0%) | 313 (100.0%) |
Property Value to Household Income Ratio in Minonk
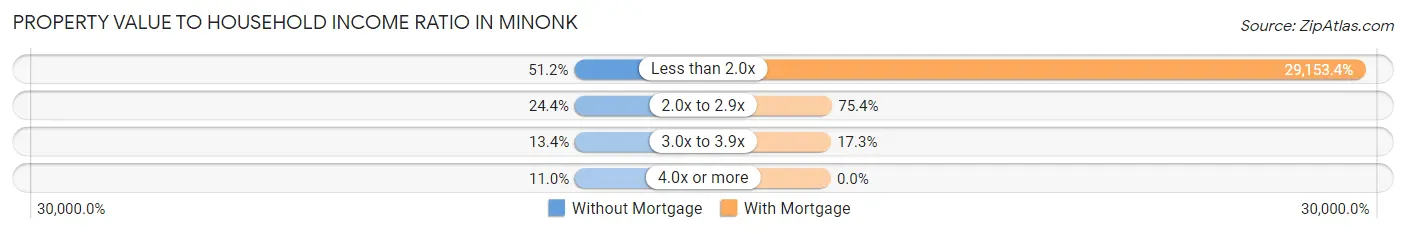
| Value-to-Income Ratio | Without Mortgage | With Mortgage |
| Less than 2.0x | 126 (51.2%) | 91,250 (29,153.4%) |
| 2.0x to 2.9x | 60 (24.4%) | 236 (75.4%) |
| 3.0x to 3.9x | 33 (13.4%) | 54 (17.2%) |
| 4.0x or more | 27 (11.0%) | 0 (0.0%) |
| Total | 246 (100.0%) | 313 (100.0%) |
Real Estate Taxes by Mortgage Status in Minonk
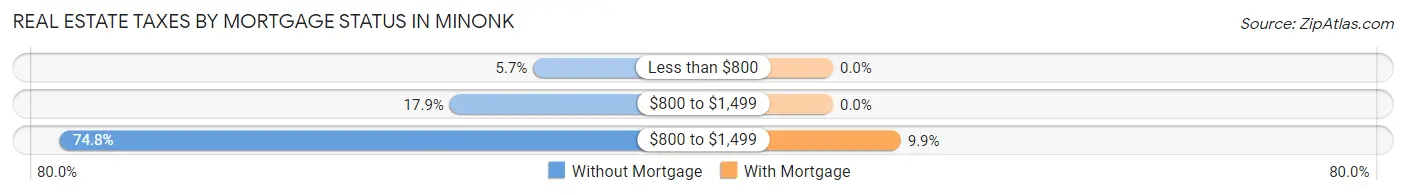
| Property Taxes | Without Mortgage | With Mortgage |
| Less than $800 | 14 (5.7%) | 0 (0.0%) |
| $800 to $1,499 | 44 (17.9%) | 0 (0.0%) |
| $800 to $1,499 | 184 (74.8%) | 31 (9.9%) |
| Total | 246 (100.0%) | 313 (100.0%) |
Health & Disability in Minonk
Health Insurance Coverage by Age in Minonk
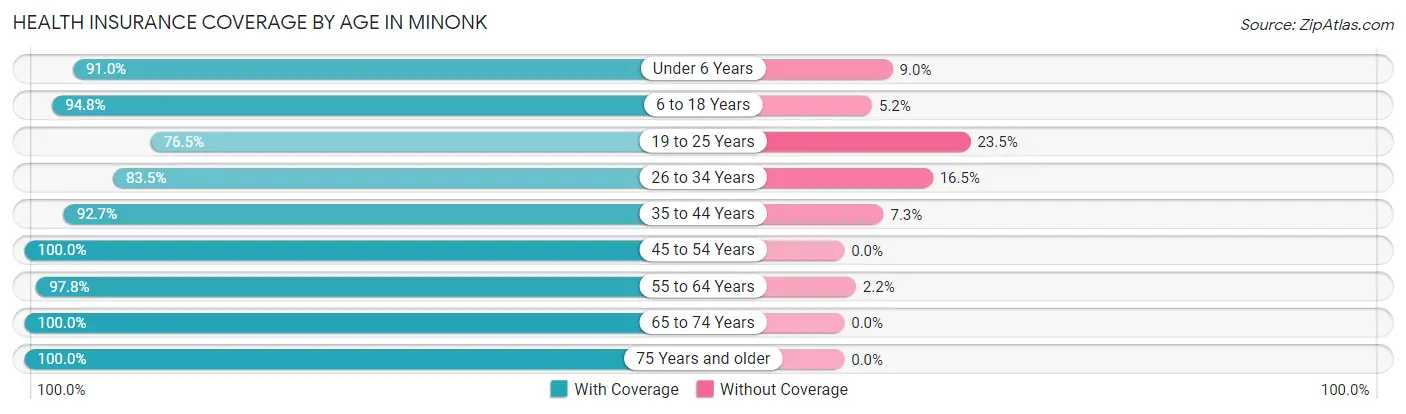
| Age Bracket | With Coverage | Without Coverage |
| Under 6 Years | 111 (91.0%) | 11 (9.0%) |
| 6 to 18 Years | 385 (94.8%) | 21 (5.2%) |
| 19 to 25 Years | 130 (76.5%) | 40 (23.5%) |
| 26 to 34 Years | 243 (83.5%) | 48 (16.5%) |
| 35 to 44 Years | 114 (92.7%) | 9 (7.3%) |
| 45 to 54 Years | 241 (100.0%) | 0 (0.0%) |
| 55 to 64 Years | 271 (97.8%) | 6 (2.2%) |
| 65 to 74 Years | 195 (100.0%) | 0 (0.0%) |
| 75 Years and older | 89 (100.0%) | 0 (0.0%) |
| Total | 1,779 (92.9%) | 135 (7.0%) |
Health Insurance Coverage by Citizenship Status in Minonk
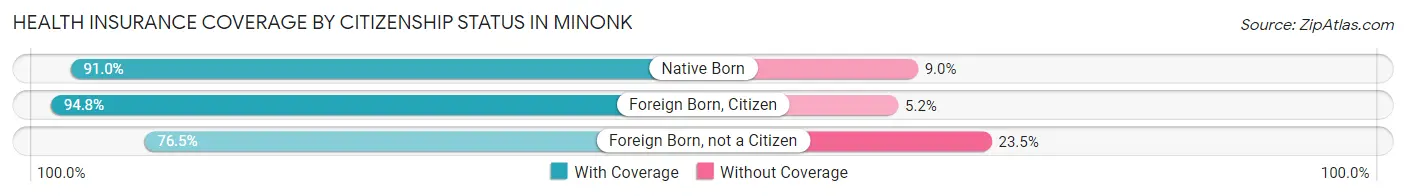
| Citizenship Status | With Coverage | Without Coverage |
| Native Born | 111 (91.0%) | 11 (9.0%) |
| Foreign Born, Citizen | 385 (94.8%) | 21 (5.2%) |
| Foreign Born, not a Citizen | 130 (76.5%) | 40 (23.5%) |
Health Insurance Coverage by Household Income in Minonk
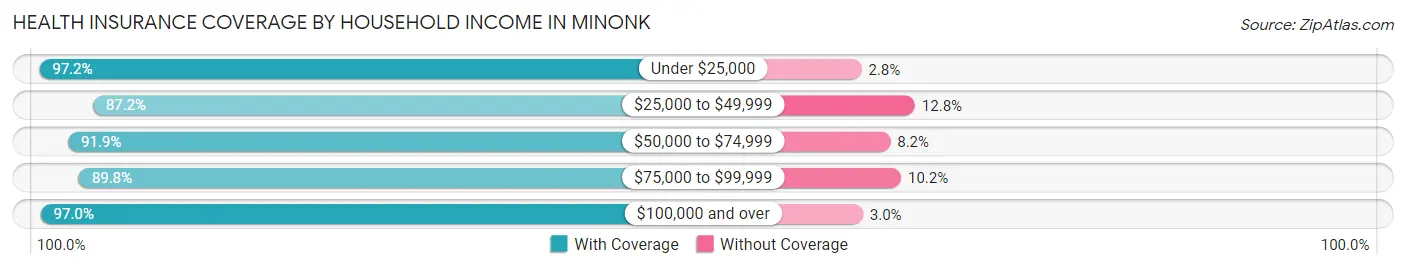
| Household Income | With Coverage | Without Coverage |
| Under $25,000 | 176 (97.2%) | 5 (2.8%) |
| $25,000 to $49,999 | 294 (87.2%) | 43 (12.8%) |
| $50,000 to $74,999 | 428 (91.8%) | 38 (8.2%) |
| $75,000 to $99,999 | 265 (89.8%) | 30 (10.2%) |
| $100,000 and over | 613 (97.0%) | 19 (3.0%) |
Public vs Private Health Insurance Coverage by Age in Minonk
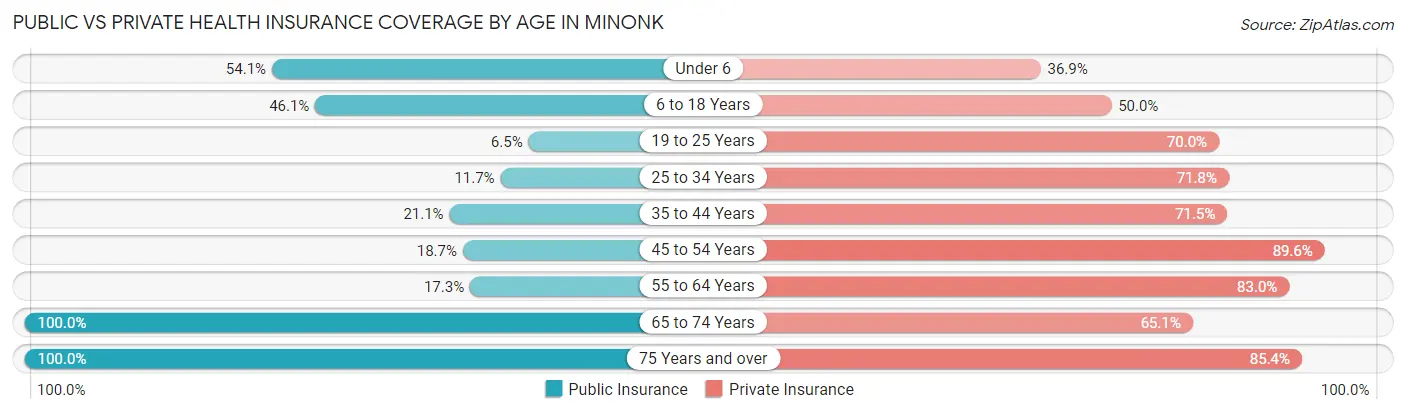
| Age Bracket | Public Insurance | Private Insurance |
| Under 6 | 66 (54.1%) | 45 (36.9%) |
| 6 to 18 Years | 187 (46.1%) | 203 (50.0%) |
| 19 to 25 Years | 11 (6.5%) | 119 (70.0%) |
| 25 to 34 Years | 34 (11.7%) | 209 (71.8%) |
| 35 to 44 Years | 26 (21.1%) | 88 (71.5%) |
| 45 to 54 Years | 45 (18.7%) | 216 (89.6%) |
| 55 to 64 Years | 48 (17.3%) | 230 (83.0%) |
| 65 to 74 Years | 195 (100.0%) | 127 (65.1%) |
| 75 Years and over | 89 (100.0%) | 76 (85.4%) |
| Total | 701 (36.6%) | 1,313 (68.6%) |
Disability Status by Sex by Age in Minonk
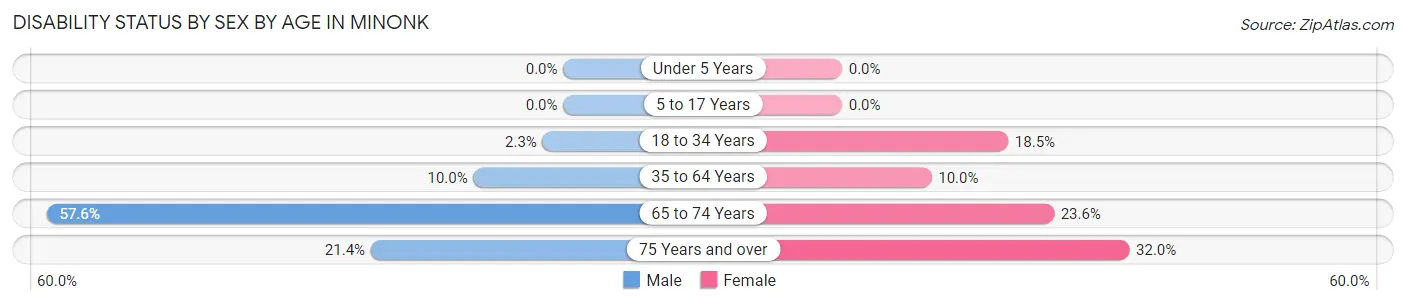
| Age Bracket | Male | Female |
| Under 5 Years | 0 (0.0%) | 0 (0.0%) |
| 5 to 17 Years | 0 (0.0%) | 0 (0.0%) |
| 18 to 34 Years | 7 (2.3%) | 32 (18.5%) |
| 35 to 64 Years | 32 (10.0%) | 32 (10.0%) |
| 65 to 74 Years | 61 (57.6%) | 21 (23.6%) |
| 75 Years and over | 3 (21.4%) | 24 (32.0%) |
Disability Class by Sex by Age in Minonk
Disability Class: Hearing Difficulty
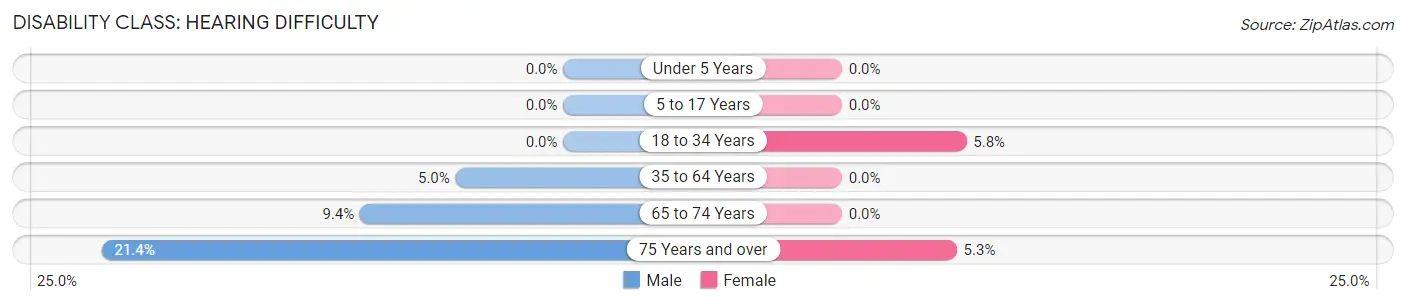
| Age Bracket | Male | Female |
| Under 5 Years | 0 (0.0%) | 0 (0.0%) |
| 5 to 17 Years | 0 (0.0%) | 0 (0.0%) |
| 18 to 34 Years | 0 (0.0%) | 10 (5.8%) |
| 35 to 64 Years | 16 (5.0%) | 0 (0.0%) |
| 65 to 74 Years | 10 (9.4%) | 0 (0.0%) |
| 75 Years and over | 3 (21.4%) | 4 (5.3%) |
Disability Class: Vision Difficulty
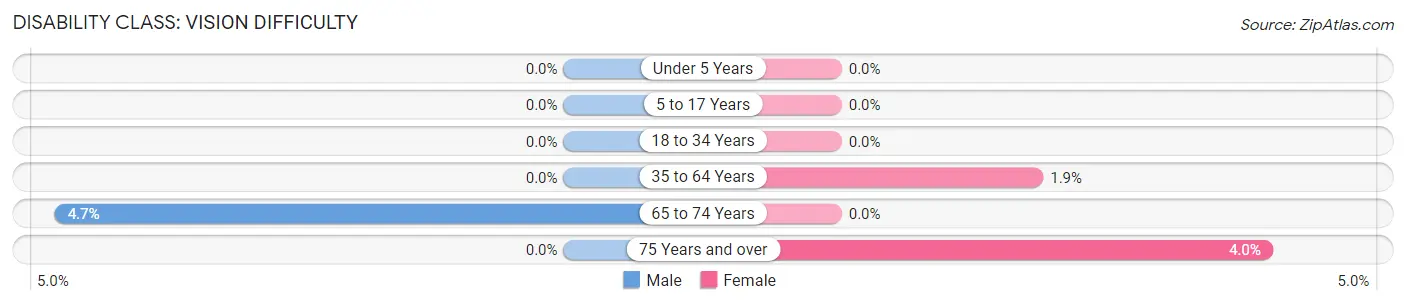
| Age Bracket | Male | Female |
| Under 5 Years | 0 (0.0%) | 0 (0.0%) |
| 5 to 17 Years | 0 (0.0%) | 0 (0.0%) |
| 18 to 34 Years | 0 (0.0%) | 0 (0.0%) |
| 35 to 64 Years | 0 (0.0%) | 6 (1.9%) |
| 65 to 74 Years | 5 (4.7%) | 0 (0.0%) |
| 75 Years and over | 0 (0.0%) | 3 (4.0%) |
Disability Class: Cognitive Difficulty
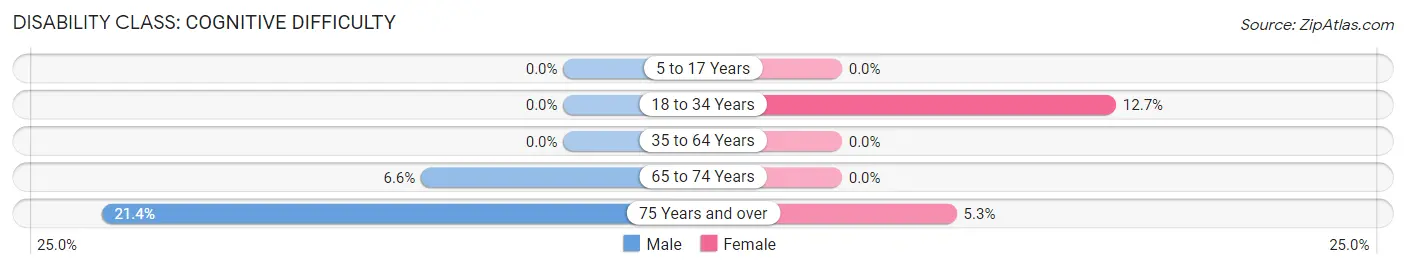
| Age Bracket | Male | Female |
| 5 to 17 Years | 0 (0.0%) | 0 (0.0%) |
| 18 to 34 Years | 0 (0.0%) | 22 (12.7%) |
| 35 to 64 Years | 0 (0.0%) | 0 (0.0%) |
| 65 to 74 Years | 7 (6.6%) | 0 (0.0%) |
| 75 Years and over | 3 (21.4%) | 4 (5.3%) |
Disability Class: Ambulatory Difficulty
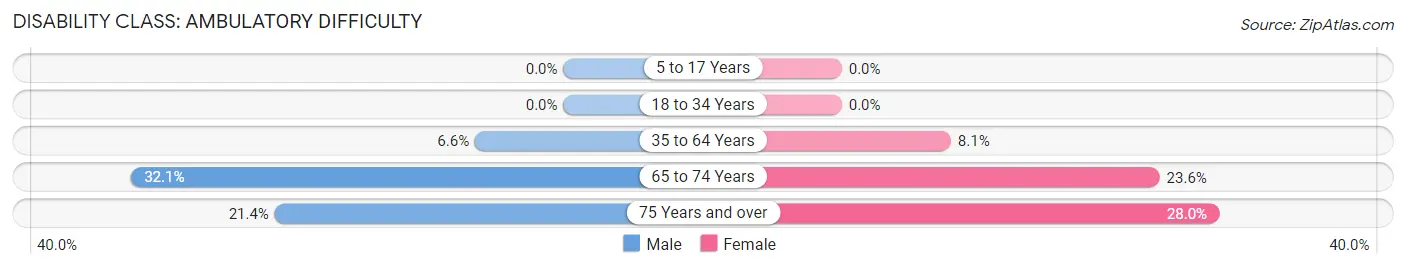
| Age Bracket | Male | Female |
| 5 to 17 Years | 0 (0.0%) | 0 (0.0%) |
| 18 to 34 Years | 0 (0.0%) | 0 (0.0%) |
| 35 to 64 Years | 21 (6.6%) | 26 (8.1%) |
| 65 to 74 Years | 34 (32.1%) | 21 (23.6%) |
| 75 Years and over | 3 (21.4%) | 21 (28.0%) |
Disability Class: Self-Care Difficulty
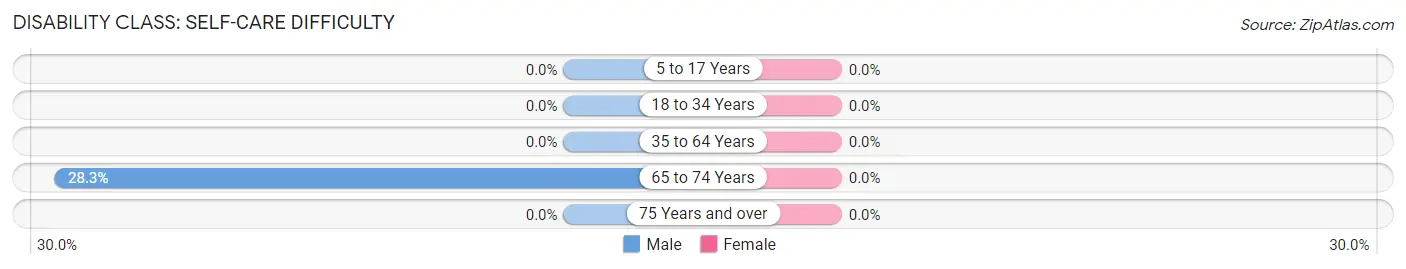
| Age Bracket | Male | Female |
| 5 to 17 Years | 0 (0.0%) | 0 (0.0%) |
| 18 to 34 Years | 0 (0.0%) | 0 (0.0%) |
| 35 to 64 Years | 0 (0.0%) | 0 (0.0%) |
| 65 to 74 Years | 30 (28.3%) | 0 (0.0%) |
| 75 Years and over | 0 (0.0%) | 0 (0.0%) |
Technology Access in Minonk
Computing Device Access in Minonk
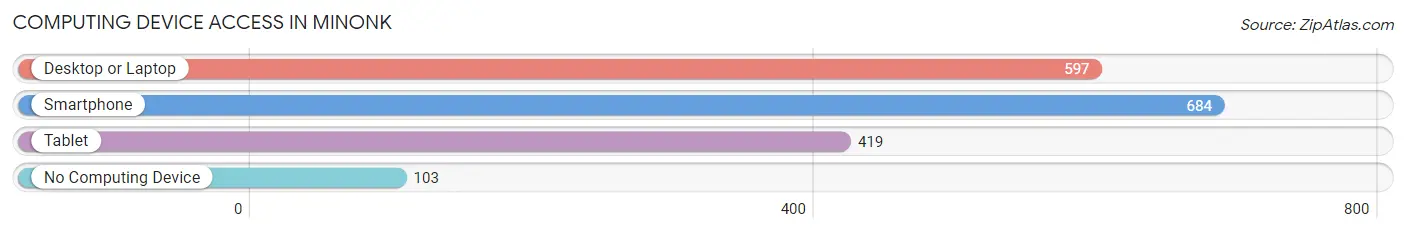
| Device Type | # Households | % Households |
| Desktop or Laptop | 597 | 73.1% |
| Smartphone | 684 | 83.7% |
| Tablet | 419 | 51.3% |
| No Computing Device | 103 | 12.6% |
| Total | 817 | 100.0% |
Internet Access in Minonk
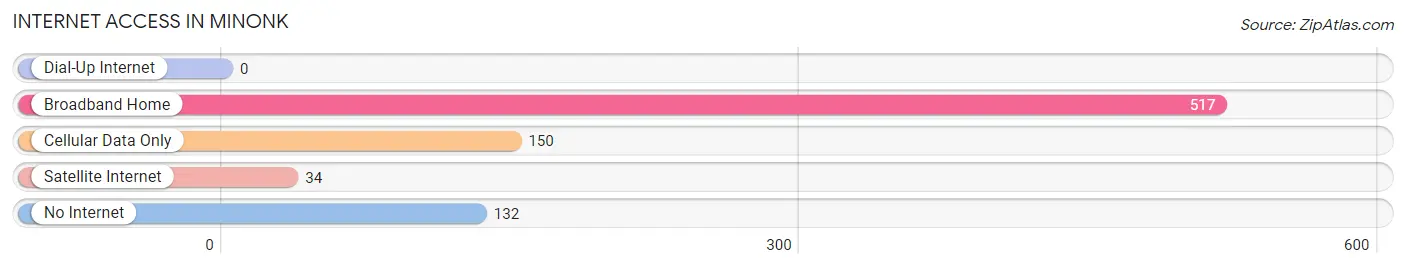
| Internet Type | # Households | % Households |
| Dial-Up Internet | 0 | 0.0% |
| Broadband Home | 517 | 63.3% |
| Cellular Data Only | 150 | 18.4% |
| Satellite Internet | 34 | 4.2% |
| No Internet | 132 | 16.2% |
| Total | 817 | 100.0% |
Minonk Summary
Minonk, Illinois is a small village located in Woodford County, Illinois. It is situated in the heart of the Illinois prairie, approximately 80 miles southwest of Chicago. The village has a population of 1,521 people, according to the 2010 census.
History
Minonk was founded in 1854 by a group of settlers from New York. The village was named after a Native American chief, Minonk, who lived in the area. The settlers were attracted to the area due to its fertile soil and abundant natural resources.
The first settlers built a log cabin and a sawmill, and soon the village began to grow. By 1858, Minonk had a post office, a school, a church, and a general store. The village was incorporated in 1867.
In the late 19th century, Minonk was a thriving agricultural community. The village was home to several grain elevators, a flour mill, and a creamery. The village also had a railroad station, which connected it to the rest of the state.
In the early 20th century, Minonk experienced a period of growth and prosperity. The village was home to several businesses, including a bank, a hotel, a movie theater, and a variety of stores.
Geography
Minonk is located in the heart of the Illinois prairie, approximately 80 miles southwest of Chicago. The village is situated on the banks of the Vermilion River, which flows through the village. The village is surrounded by rolling hills and farmland.
The climate in Minonk is typical of the Midwest, with hot summers and cold winters. The average temperature in the summer is around 75 degrees Fahrenheit, and the average temperature in the winter is around 25 degrees Fahrenheit.
Economy
The economy of Minonk is largely based on agriculture. The village is home to several grain elevators, a flour mill, and a creamery. The village also has a variety of small businesses, including a bank, a hotel, a movie theater, and a variety of stores.
The village is also home to several manufacturing companies, including a plastics manufacturer and a metal fabrication company.
Demographics
According to the 2010 census, Minonk has a population of 1,521 people. The population is predominantly white (96.2%), with a small percentage of African Americans (1.2%) and Hispanics (1.2%). The median household income is $45,000, and the median age is 40.
The village is home to several churches, including the First United Methodist Church, the First Presbyterian Church, and the St. Mary's Catholic Church. The village also has a public library and a community center.
Minonk is a small village with a rich history and a vibrant economy. The village is home to a variety of businesses, churches, and other amenities. The village is a great place to live, work, and raise a family.
Common Questions
What is Per Capita Income in Minonk?
Per Capita income in Minonk is $31,488.
What is the Median Family Income in Minonk?
Median Family Income in Minonk is $83,510.
What is the Median Household income in Minonk?
Median Household Income in Minonk is $57,169.
What is Income or Wage Gap in Minonk?
Income or Wage Gap in Minonk is 30.2%.
Women in Minonk earn 69.8 cents for every dollar earned by a man.
What is Inequality or Gini Index in Minonk?
Inequality or Gini Index in Minonk is 0.39.
What is the Total Population of Minonk?
Total Population of Minonk is 1,966.
What is the Total Male Population of Minonk?
Total Male Population of Minonk is 1,048.
What is the Total Female Population of Minonk?
Total Female Population of Minonk is 918.
What is the Ratio of Males per 100 Females in Minonk?
There are 114.16 Males per 100 Females in Minonk.
What is the Ratio of Females per 100 Males in Minonk?
There are 87.60 Females per 100 Males in Minonk.
What is the Median Population Age in Minonk?
Median Population Age in Minonk is 34.8 Years.
What is the Average Family Size in Minonk
Average Family Size in Minonk is 3.1 People.
What is the Average Household Size in Minonk
Average Household Size in Minonk is 2.3 People.
How Large is the Labor Force in Minonk?
There are 902 People in the Labor Forcein in Minonk.
What is the Percentage of People in the Labor Force in Minonk?
59.4% of People are in the Labor Force in Minonk.
What is the Unemployment Rate in Minonk?
Unemployment Rate in Minonk is 7.9%.