Mineral, IL Map & Demographics
Mineral Map
Mineral Overview
$27,123
PER CAPITA INCOME
$63,750
AVG FAMILY INCOME
$40,833
AVG HOUSEHOLD INCOME
63.6%
WAGE / INCOME GAP [ % ]
36.4¢/ $1
WAGE / INCOME GAP [ $ ]
0.41
INEQUALITY / GINI INDEX
168
TOTAL POPULATION
98
MALE POPULATION
70
FEMALE POPULATION
140.00
MALES / 100 FEMALES
71.43
FEMALES / 100 MALES
45.4
MEDIAN AGE
2.7
AVG FAMILY SIZE
1.8
AVG HOUSEHOLD SIZE
100
LABOR FORCE [ PEOPLE ]
68.5%
PERCENT IN LABOR FORCE
4.0%
UNEMPLOYMENT RATE
Mineral Zip Codes
Income in Mineral
Income Overview in Mineral
Per Capita Income in Mineral is $27,123, while median incomes of families and households are $63,750 and $40,833 respectively.
| Characteristic | Number | Measure |
| Per Capita Income | 168 | $27,123 |
| Median Family Income | 44 | $63,750 |
| Mean Family Income | 44 | $67,082 |
| Median Household Income | 94 | $40,833 |
| Mean Household Income | 94 | $47,768 |
| Income Deficit | 44 | $0 |
| Wage / Income Gap (%) | 168 | 63.59% |
| Wage / Income Gap ($) | 168 | 36.41¢ per $1 |
| Gini / Inequality Index | 168 | 0.41 |
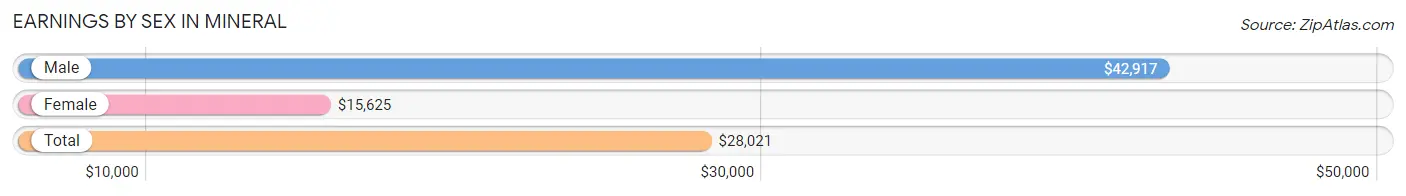
Earnings by Sex in Mineral
Average Earnings in Mineral are $28,021, $42,917 for men and $15,625 for women, a difference of 63.6%.
| Sex | Number | Average Earnings |
| Male | 58 (57.4%) | $42,917 |
| Female | 43 (42.6%) | $15,625 |
| Total | 101 (100.0%) | $28,021 |
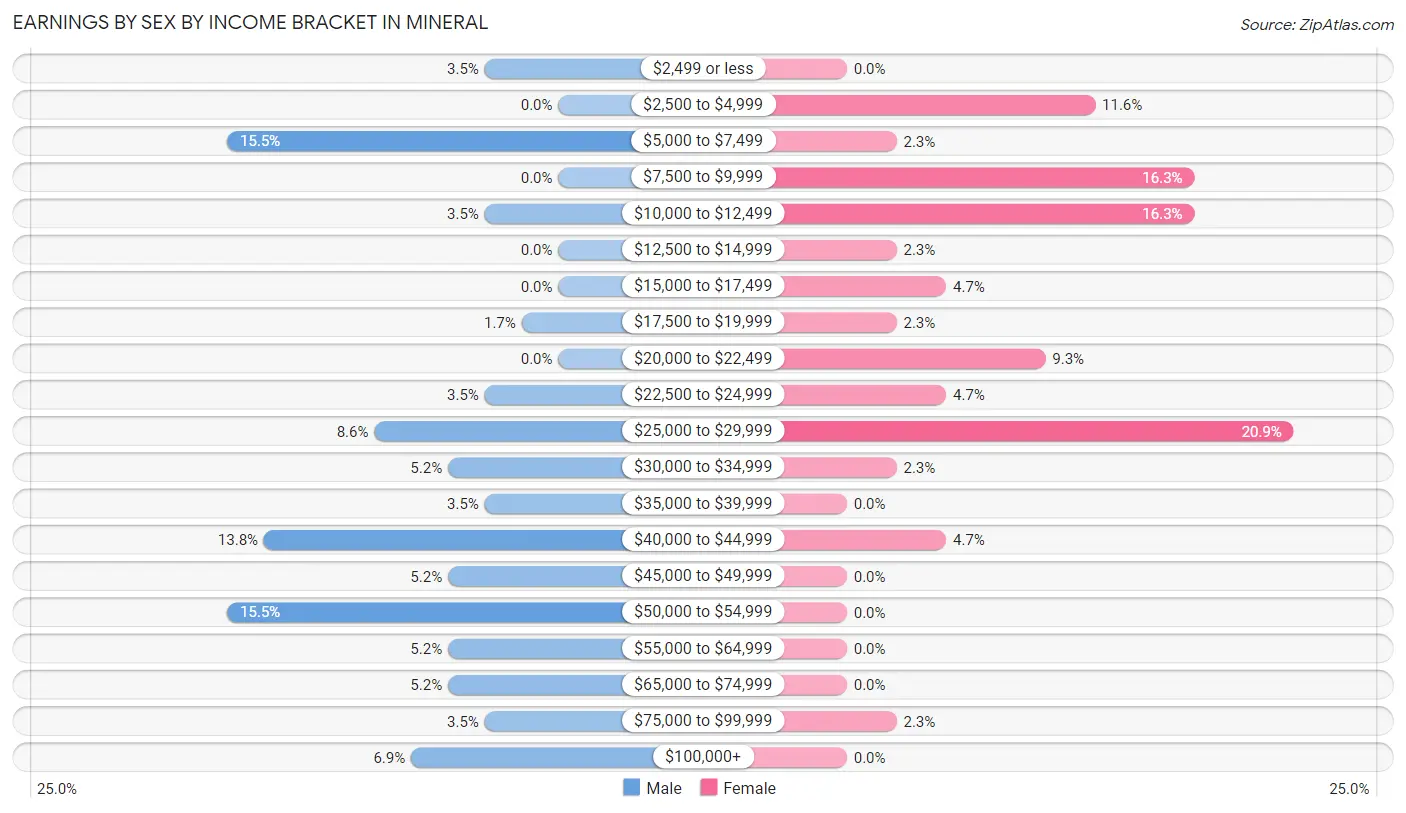
Earnings by Sex by Income Bracket in Mineral
The most common earnings brackets in Mineral are $5,000 to $7,499 for men (9 | 15.5%) and $25,000 to $29,999 for women (9 | 20.9%).
| Income | Male | Female |
| $2,499 or less | 2 (3.5%) | 0 (0.0%) |
| $2,500 to $4,999 | 0 (0.0%) | 5 (11.6%) |
| $5,000 to $7,499 | 9 (15.5%) | 1 (2.3%) |
| $7,500 to $9,999 | 0 (0.0%) | 7 (16.3%) |
| $10,000 to $12,499 | 2 (3.5%) | 7 (16.3%) |
| $12,500 to $14,999 | 0 (0.0%) | 1 (2.3%) |
| $15,000 to $17,499 | 0 (0.0%) | 2 (4.6%) |
| $17,500 to $19,999 | 1 (1.7%) | 1 (2.3%) |
| $20,000 to $22,499 | 0 (0.0%) | 4 (9.3%) |
| $22,500 to $24,999 | 2 (3.5%) | 2 (4.6%) |
| $25,000 to $29,999 | 5 (8.6%) | 9 (20.9%) |
| $30,000 to $34,999 | 3 (5.2%) | 1 (2.3%) |
| $35,000 to $39,999 | 2 (3.5%) | 0 (0.0%) |
| $40,000 to $44,999 | 8 (13.8%) | 2 (4.6%) |
| $45,000 to $49,999 | 3 (5.2%) | 0 (0.0%) |
| $50,000 to $54,999 | 9 (15.5%) | 0 (0.0%) |
| $55,000 to $64,999 | 3 (5.2%) | 0 (0.0%) |
| $65,000 to $74,999 | 3 (5.2%) | 0 (0.0%) |
| $75,000 to $99,999 | 2 (3.5%) | 1 (2.3%) |
| $100,000+ | 4 (6.9%) | 0 (0.0%) |
| Total | 58 (100.0%) | 43 (100.0%) |
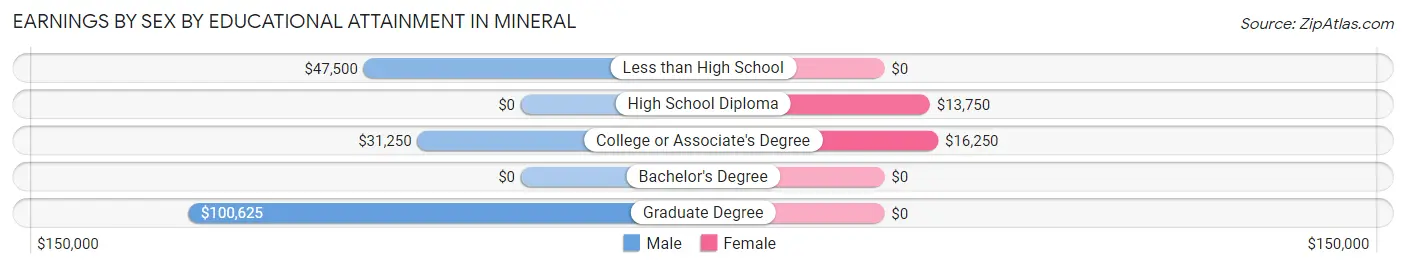
Earnings by Sex by Educational Attainment in Mineral
Average earnings in Mineral are $41,250 for men and $16,250 for women, a difference of 60.6%. Men with an educational attainment of graduate degree enjoy the highest average annual earnings of $100,625, while those with college or associate's degree education earn the least with $31,250. Women with an educational attainment of college or associate's degree earn the most with the average annual earnings of $16,250, while those with high school diploma education have the smallest earnings of $13,750.
| Educational Attainment | Male Income | Female Income |
| Less than High School | $47,500 | $0 |
| High School Diploma | - | - |
| College or Associate's Degree | $31,250 | $16,250 |
| Bachelor's Degree | - | - |
| Graduate Degree | $100,625 | $0 |
| Total | $41,250 | $16,250 |
Family Income in Mineral
Family Income Brackets in Mineral
According to the Mineral family income data, there are 19 families falling into the $50,000 to $74,999 income range, which is the most common income bracket and makes up 43.2% of all families.
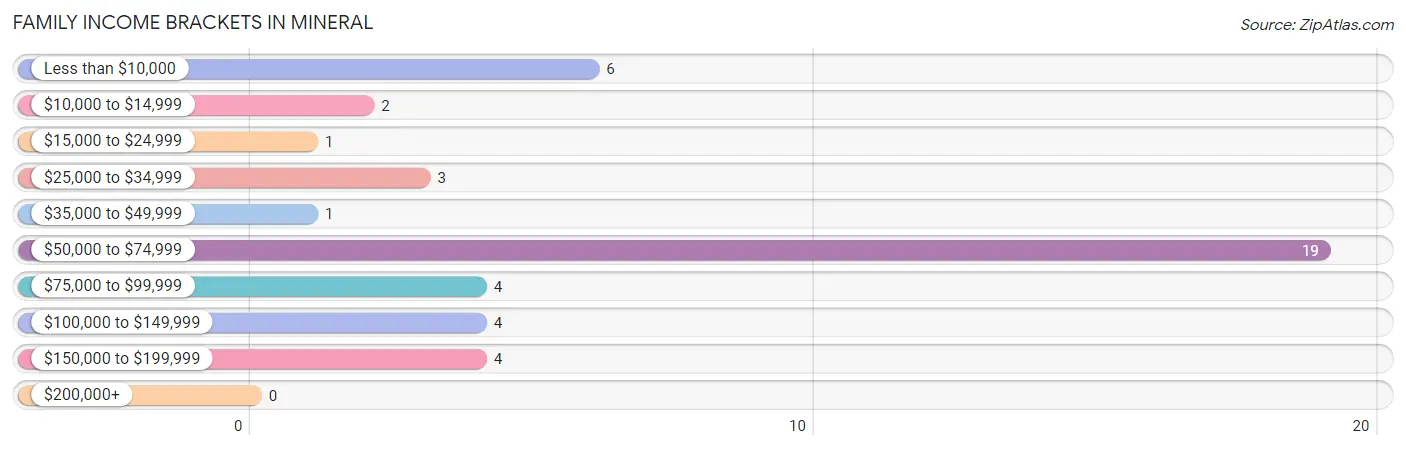
| Income Bracket | # Families | % Families |
| Less than $10,000 | 6 | 13.6% |
| $10,000 to $14,999 | 2 | 4.5% |
| $15,000 to $24,999 | 1 | 2.3% |
| $25,000 to $34,999 | 3 | 6.8% |
| $35,000 to $49,999 | 1 | 2.3% |
| $50,000 to $74,999 | 19 | 43.2% |
| $75,000 to $99,999 | 4 | 9.1% |
| $100,000 to $149,999 | 4 | 9.1% |
| $150,000 to $199,999 | 4 | 9.1% |
| $200,000+ | 0 | 0.0% |
Family Income by Famaliy Size in Mineral
2-person families (28 | 63.6%) account for the highest median family income in Mineral with $65,000 per family, while 2-person families (28 | 63.6%) have the highest median income of $32,500 per family member.
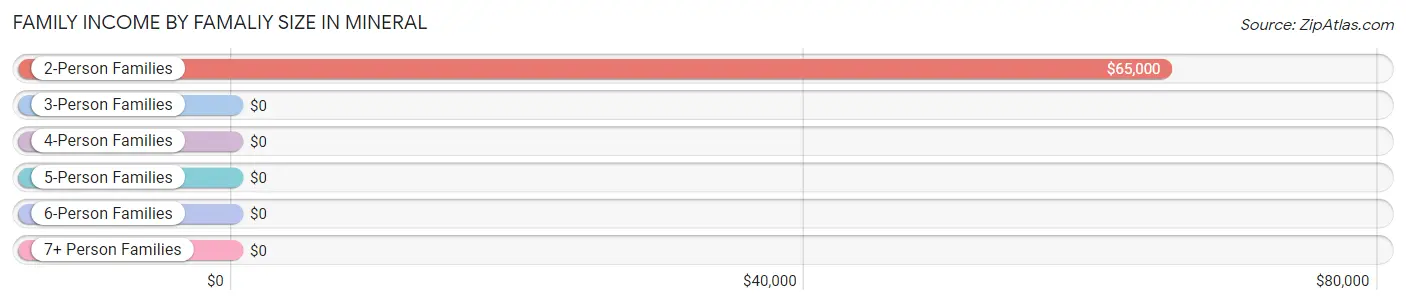
| Income Bracket | # Families | Median Income |
| 2-Person Families | 28 (63.6%) | $65,000 |
| 3-Person Families | 5 (11.4%) | $0 |
| 4-Person Families | 9 (20.4%) | $0 |
| 5-Person Families | 2 (4.5%) | $0 |
| 6-Person Families | 0 (0.0%) | $0 |
| 7+ Person Families | 0 (0.0%) | $0 |
| Total | 44 (100.0%) | $63,750 |
Family Income by Number of Earners in Mineral
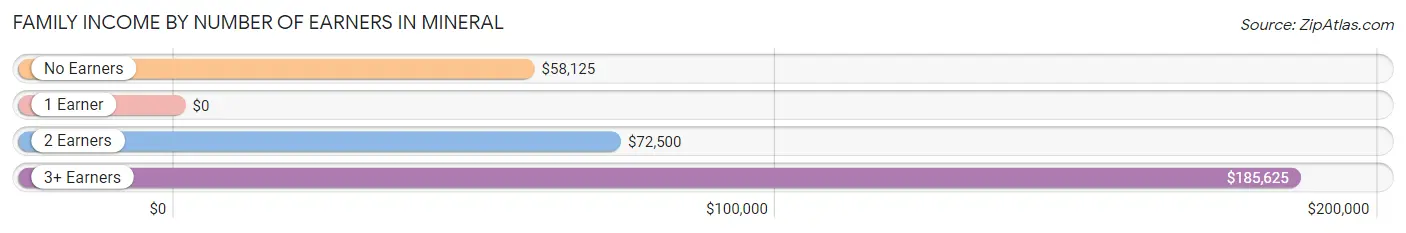
| Number of Earners | # Families | Median Income |
| No Earners | 10 (22.7%) | $58,125 |
| 1 Earner | 10 (22.7%) | $0 |
| 2 Earners | 18 (40.9%) | $72,500 |
| 3+ Earners | 6 (13.6%) | $185,625 |
| Total | 44 (100.0%) | $63,750 |
Household Income in Mineral
Household Income Brackets in Mineral
With 23 households falling in the category, the $15,000 to $24,999 income range is the most frequent in Mineral, accounting for 24.5% of all households.
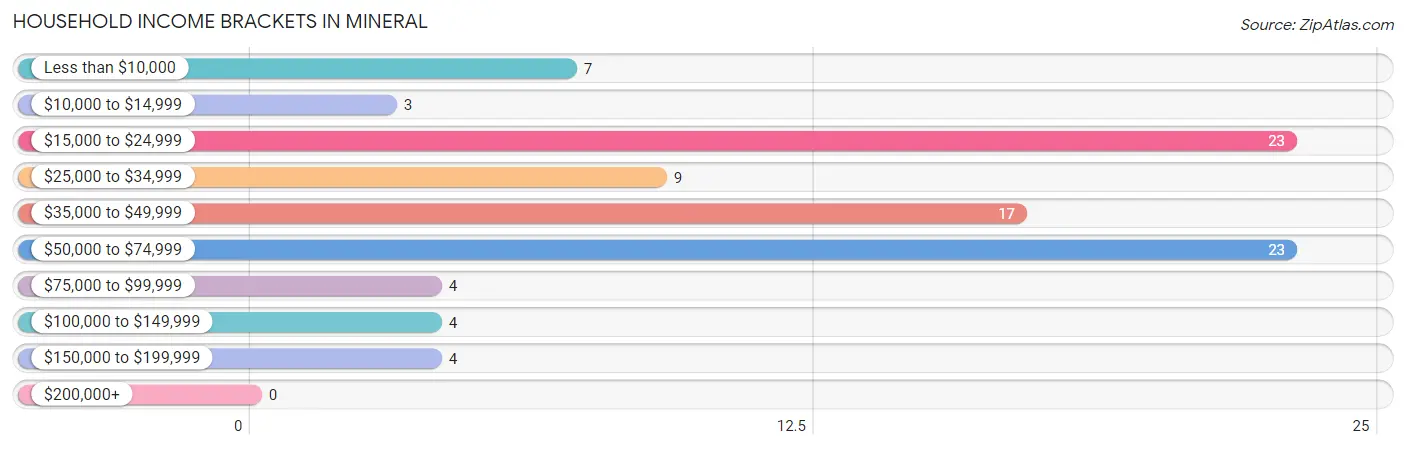
| Income Bracket | # Households | % Households |
| Less than $10,000 | 7 | 7.4% |
| $10,000 to $14,999 | 3 | 3.2% |
| $15,000 to $24,999 | 23 | 24.5% |
| $25,000 to $34,999 | 9 | 9.6% |
| $35,000 to $49,999 | 17 | 18.1% |
| $50,000 to $74,999 | 23 | 24.5% |
| $75,000 to $99,999 | 4 | 4.3% |
| $100,000 to $149,999 | 4 | 4.3% |
| $150,000 to $199,999 | 4 | 4.3% |
| $200,000+ | 0 | 0.0% |
Household Income by Householder Age in Mineral
The median household income in Mineral is $40,833, with the highest median household income of $41,250 found in the 25 to 44 years age bracket for the primary householder. A total of 24 households (25.5%) fall into this category. Meanwhile, the 15 to 24 years age bracket for the primary householder has the lowest median household income of $0, with 5 households (5.3%) in this group.
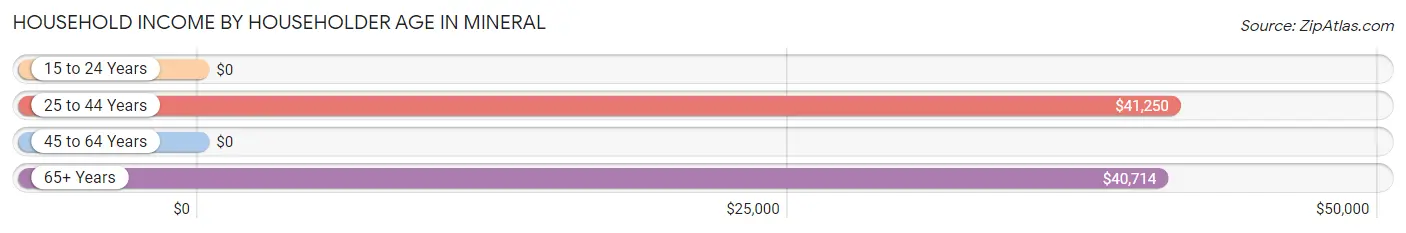
| Income Bracket | # Households | Median Income |
| 15 to 24 Years | 5 (5.3%) | $0 |
| 25 to 44 Years | 24 (25.5%) | $41,250 |
| 45 to 64 Years | 35 (37.2%) | $0 |
| 65+ Years | 30 (31.9%) | $40,714 |
| Total | 94 (100.0%) | $40,833 |
Poverty in Mineral
Income Below Poverty by Sex and Age in Mineral
With 20.4% poverty level for males and 20.0% for females among the residents of Mineral, 12 to 14 year old males and 16 and 17 year old females are the most vulnerable to poverty, with 2 males (100.0%) and 4 females (80.0%) in their respective age groups living below the poverty level.
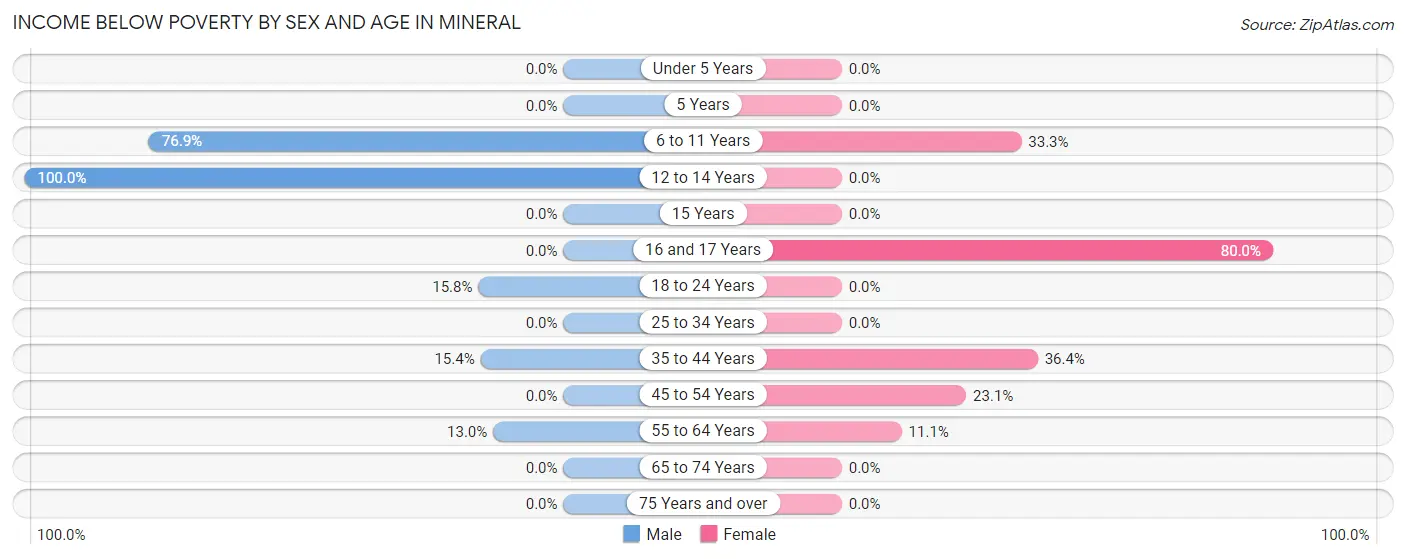
| Age Bracket | Male | Female |
| Under 5 Years | 0 (0.0%) | 0 (0.0%) |
| 5 Years | 0 (0.0%) | 0 (0.0%) |
| 6 to 11 Years | 10 (76.9%) | 2 (33.3%) |
| 12 to 14 Years | 2 (100.0%) | 0 (0.0%) |
| 15 Years | 0 (0.0%) | 0 (0.0%) |
| 16 and 17 Years | 0 (0.0%) | 4 (80.0%) |
| 18 to 24 Years | 3 (15.8%) | 0 (0.0%) |
| 25 to 34 Years | 0 (0.0%) | 0 (0.0%) |
| 35 to 44 Years | 2 (15.4%) | 4 (36.4%) |
| 45 to 54 Years | 0 (0.0%) | 3 (23.1%) |
| 55 to 64 Years | 3 (13.0%) | 1 (11.1%) |
| 65 to 74 Years | 0 (0.0%) | 0 (0.0%) |
| 75 Years and over | 0 (0.0%) | 0 (0.0%) |
| Total | 20 (20.4%) | 14 (20.0%) |
Income Above Poverty by Sex and Age in Mineral
According to the poverty statistics in Mineral, males aged under 5 years and females aged 18 to 24 years are the age groups that are most secure financially, with 100.0% of males and 100.0% of females in these age groups living above the poverty line.
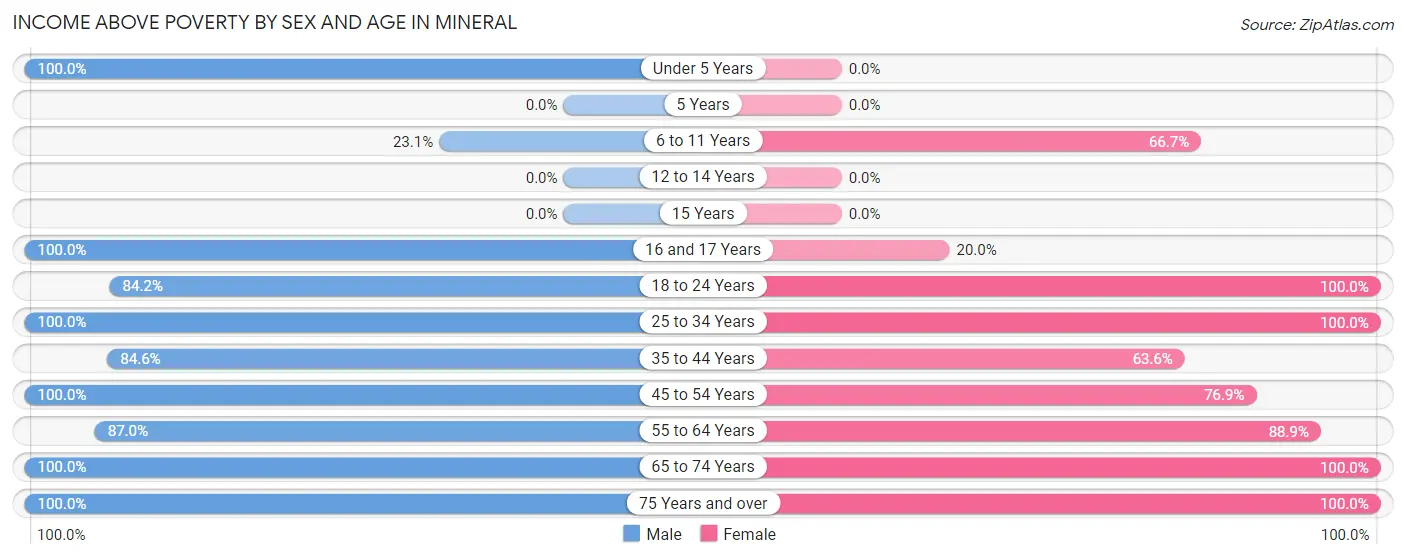
| Age Bracket | Male | Female |
| Under 5 Years | 1 (100.0%) | 0 (0.0%) |
| 5 Years | 0 (0.0%) | 0 (0.0%) |
| 6 to 11 Years | 3 (23.1%) | 4 (66.7%) |
| 12 to 14 Years | 0 (0.0%) | 0 (0.0%) |
| 15 Years | 0 (0.0%) | 0 (0.0%) |
| 16 and 17 Years | 2 (100.0%) | 1 (20.0%) |
| 18 to 24 Years | 16 (84.2%) | 4 (100.0%) |
| 25 to 34 Years | 4 (100.0%) | 2 (100.0%) |
| 35 to 44 Years | 11 (84.6%) | 7 (63.6%) |
| 45 to 54 Years | 4 (100.0%) | 10 (76.9%) |
| 55 to 64 Years | 20 (87.0%) | 8 (88.9%) |
| 65 to 74 Years | 10 (100.0%) | 8 (100.0%) |
| 75 Years and over | 7 (100.0%) | 12 (100.0%) |
| Total | 78 (79.6%) | 56 (80.0%) |
Income Below Poverty Among Married-Couple Families in Mineral
The poverty statistics for married-couple families in Mineral show that 7.1% or 2 of the total 28 families live below the poverty line. Families with 1 or 2 children have the highest poverty rate of 28.6%, comprising of 2 families. On the other hand, families with no children have the lowest poverty rate of 0.0%, which includes 0 families.
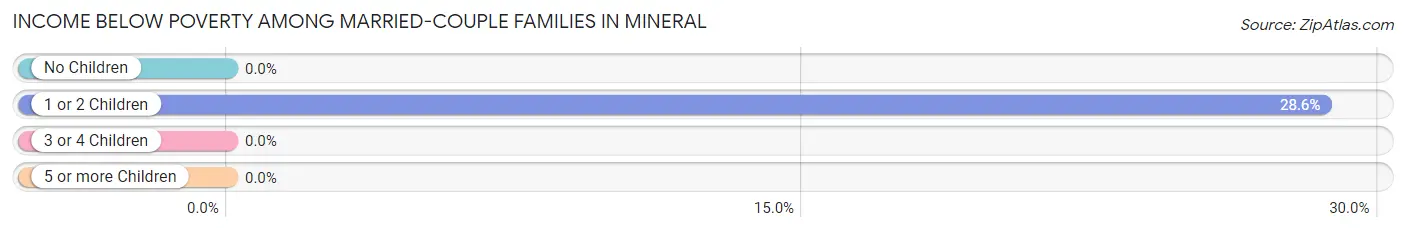
| Children | Above Poverty | Below Poverty |
| No Children | 21 (100.0%) | 0 (0.0%) |
| 1 or 2 Children | 5 (71.4%) | 2 (28.6%) |
| 3 or 4 Children | 0 (0.0%) | 0 (0.0%) |
| 5 or more Children | 0 (0.0%) | 0 (0.0%) |
| Total | 26 (92.9%) | 2 (7.1%) |
Income Below Poverty Among Single-Parent Households in Mineral
According to the poverty data in Mineral, 33.3% or 2 single-father households and 60.0% or 6 single-mother households are living below the poverty line. Among single-father households, those with 1 or 2 children have the highest poverty rate, with 2 households (100.0%) experiencing poverty. Likewise, among single-mother households, those with 3 or 4 children have the highest poverty rate, with 4 households (100.0%) falling below the poverty line.
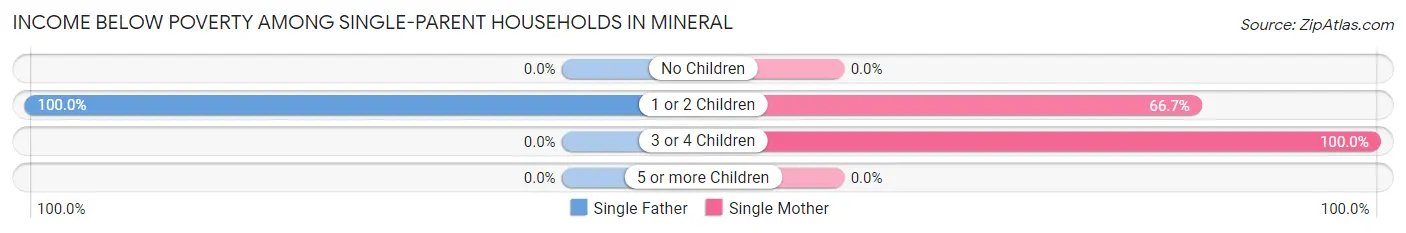
| Children | Single Father | Single Mother |
| No Children | 0 (0.0%) | 0 (0.0%) |
| 1 or 2 Children | 2 (100.0%) | 2 (66.7%) |
| 3 or 4 Children | 0 (0.0%) | 4 (100.0%) |
| 5 or more Children | 0 (0.0%) | 0 (0.0%) |
| Total | 2 (33.3%) | 6 (60.0%) |
Income Below Poverty Among Married-Couple vs Single-Parent Households in Mineral
The poverty data for Mineral shows that 2 of the married-couple family households (7.1%) and 8 of the single-parent households (50.0%) are living below the poverty level. Within the married-couple family households, those with 1 or 2 children have the highest poverty rate, with 2 households (28.6%) falling below the poverty line. Among the single-parent households, those with 3 or 4 children have the highest poverty rate, with 4 household (100.0%) living below poverty.
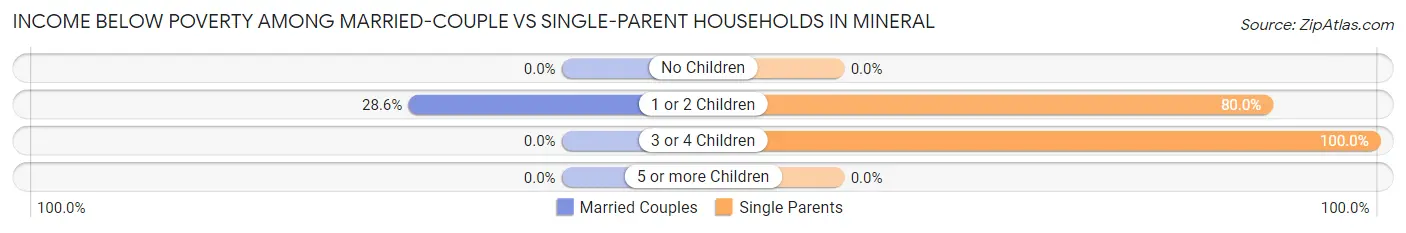
| Children | Married-Couple Families | Single-Parent Households |
| No Children | 0 (0.0%) | 0 (0.0%) |
| 1 or 2 Children | 2 (28.6%) | 4 (80.0%) |
| 3 or 4 Children | 0 (0.0%) | 4 (100.0%) |
| 5 or more Children | 0 (0.0%) | 0 (0.0%) |
| Total | 2 (7.1%) | 8 (50.0%) |
Race in Mineral
The most populous races in Mineral are White / Caucasian (164 | 97.6%), and Black / African American (4 | 2.4%).
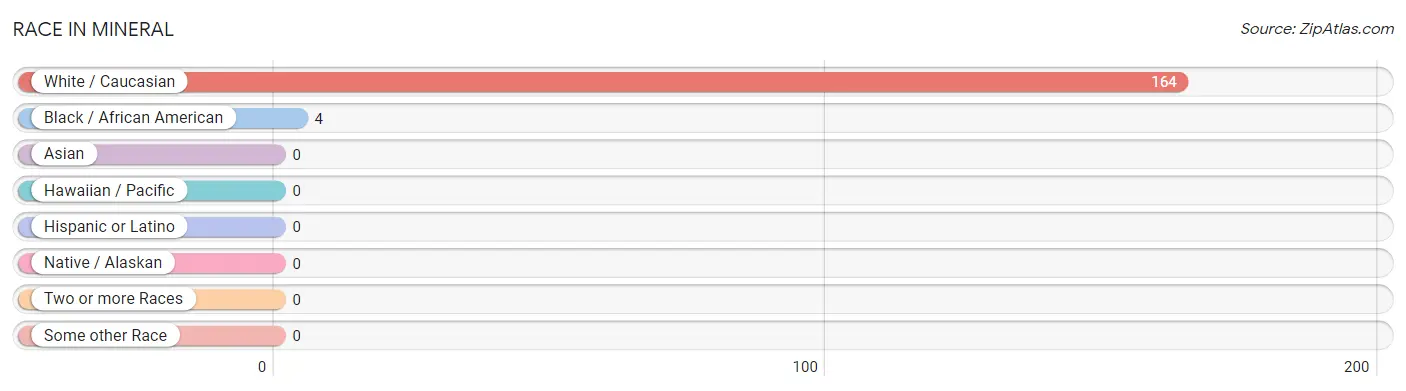
| Race | # Population | % Population |
| Asian | 0 | 0.0% |
| Black / African American | 4 | 2.4% |
| Hawaiian / Pacific | 0 | 0.0% |
| Hispanic or Latino | 0 | 0.0% |
| Native / Alaskan | 0 | 0.0% |
| White / Caucasian | 164 | 97.6% |
| Two or more Races | 0 | 0.0% |
| Some other Race | 0 | 0.0% |
| Total | 168 | 100.0% |
Ancestry in Mineral
The most populous ancestries reported in Mineral are German (41 | 24.4%), English (35 | 20.8%), Irish (17 | 10.1%), Belgian (15 | 8.9%), and American (14 | 8.3%), together accounting for 72.6% of all Mineral residents.
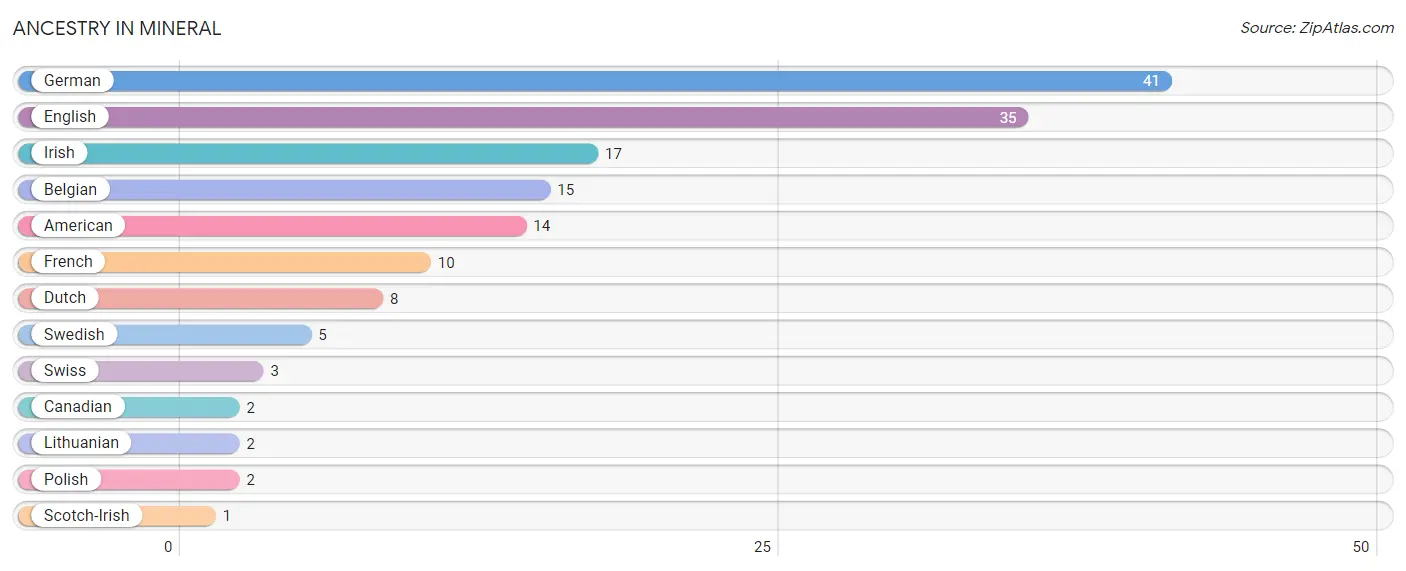
| Ancestry | # Population | % Population |
| American | 14 | 8.3% |
| Belgian | 15 | 8.9% |
| Canadian | 2 | 1.2% |
| Dutch | 8 | 4.8% |
| English | 35 | 20.8% |
| French | 10 | 5.9% |
| German | 41 | 24.4% |
| Irish | 17 | 10.1% |
| Lithuanian | 2 | 1.2% |
| Polish | 2 | 1.2% |
| Scotch-Irish | 1 | 0.6% |
| Swedish | 5 | 3.0% |
| Swiss | 3 | 1.8% | View All 13 Rows |
Immigrants in Mineral

| Immigration Origin | # Population | % Population | View All 0 Rows |
Sex and Age in Mineral
Sex and Age in Mineral
The most populous age groups in Mineral are 20 to 24 Years (19 | 19.4%) for men and 45 to 49 Years (10 | 14.3%) for women.
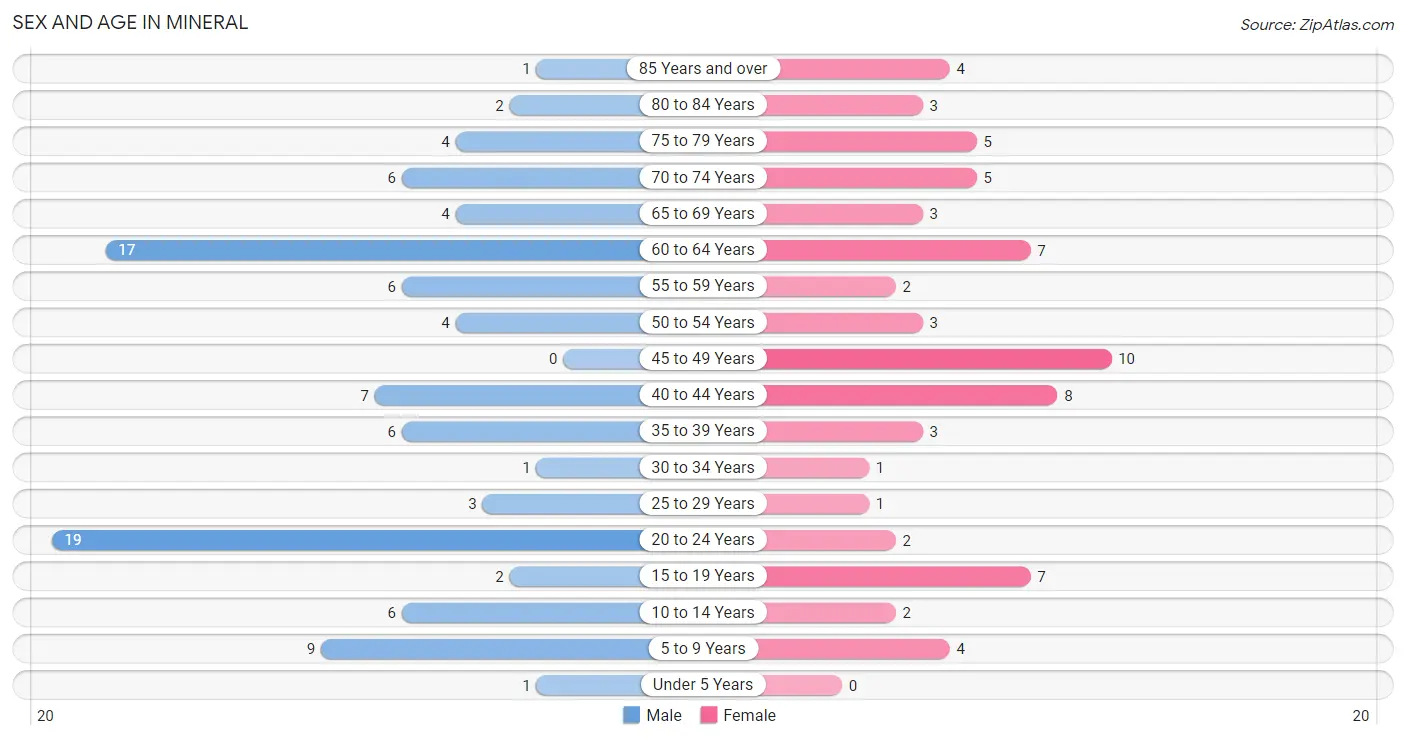
| Age Bracket | Male | Female |
| Under 5 Years | 1 (1.0%) | 0 (0.0%) |
| 5 to 9 Years | 9 (9.2%) | 4 (5.7%) |
| 10 to 14 Years | 6 (6.1%) | 2 (2.9%) |
| 15 to 19 Years | 2 (2.0%) | 7 (10.0%) |
| 20 to 24 Years | 19 (19.4%) | 2 (2.9%) |
| 25 to 29 Years | 3 (3.1%) | 1 (1.4%) |
| 30 to 34 Years | 1 (1.0%) | 1 (1.4%) |
| 35 to 39 Years | 6 (6.1%) | 3 (4.3%) |
| 40 to 44 Years | 7 (7.1%) | 8 (11.4%) |
| 45 to 49 Years | 0 (0.0%) | 10 (14.3%) |
| 50 to 54 Years | 4 (4.1%) | 3 (4.3%) |
| 55 to 59 Years | 6 (6.1%) | 2 (2.9%) |
| 60 to 64 Years | 17 (17.3%) | 7 (10.0%) |
| 65 to 69 Years | 4 (4.1%) | 3 (4.3%) |
| 70 to 74 Years | 6 (6.1%) | 5 (7.1%) |
| 75 to 79 Years | 4 (4.1%) | 5 (7.1%) |
| 80 to 84 Years | 2 (2.0%) | 3 (4.3%) |
| 85 Years and over | 1 (1.0%) | 4 (5.7%) |
| Total | 98 (100.0%) | 70 (100.0%) |
Families and Households in Mineral
Median Family Size in Mineral
The median family size in Mineral is 2.68 persons per family, with single female/mother families (10 | 22.7%) accounting for the largest median family size of 3.1 persons per family. On the other hand, single male/father families (6 | 13.6%) represent the smallest median family size with 2.00 persons per family.
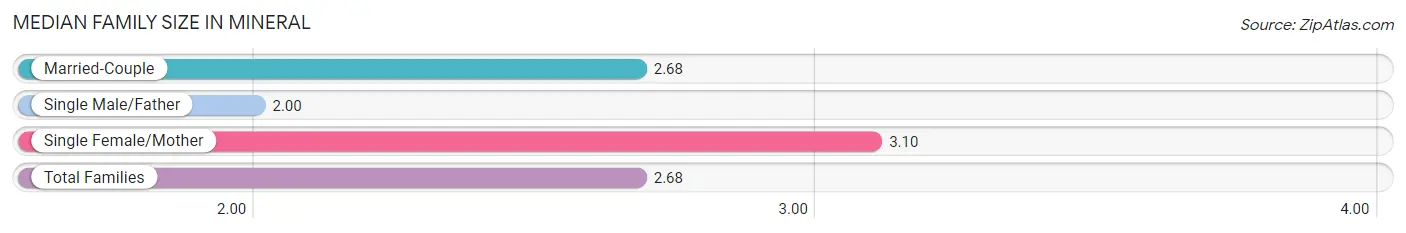
| Family Type | # Families | Family Size |
| Married-Couple | 28 (63.6%) | 2.68 |
| Single Male/Father | 6 (13.6%) | 2.00 |
| Single Female/Mother | 10 (22.7%) | 3.10 |
| Total Families | 44 (100.0%) | 2.68 |
Median Household Size in Mineral
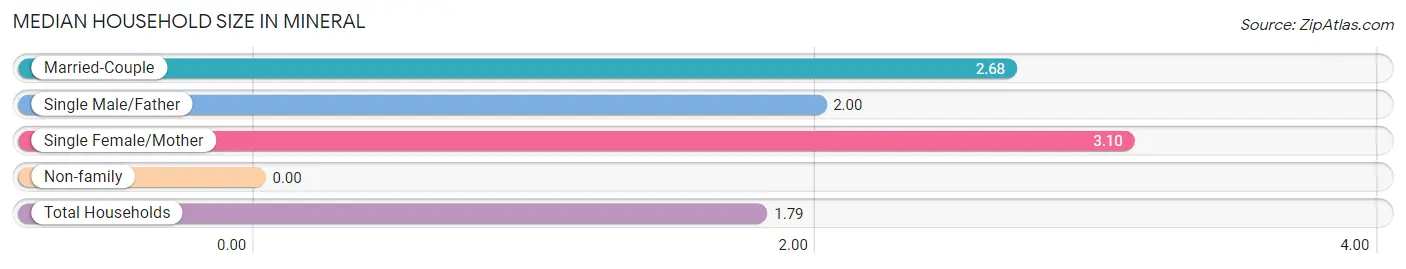
| Household Type | # Households | Household Size |
| Married-Couple | 28 (29.8%) | 2.68 |
| Single Male/Father | 6 (6.4%) | 2.00 |
| Single Female/Mother | 10 (10.6%) | 3.10 |
| Non-family | 50 (53.2%) | - |
| Total Households | 94 (100.0%) | 1.79 |
Household Size by Marriage Status in Mineral
Out of a total of 94 households in Mineral, 44 (46.8%) are family households, while 50 (53.2%) are nonfamily households. The most numerous type of family households are 2-person households, comprising 28, and the most common type of nonfamily households are 1-person households, comprising 50.
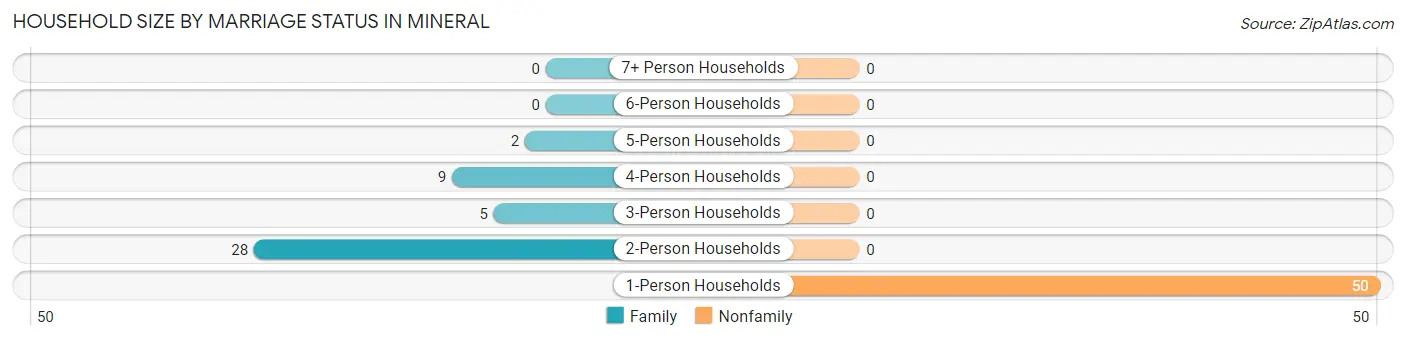
| Household Size | Family Households | Nonfamily Households |
| 1-Person Households | - | 50 (53.2%) |
| 2-Person Households | 28 (29.8%) | 0 (0.0%) |
| 3-Person Households | 5 (5.3%) | 0 (0.0%) |
| 4-Person Households | 9 (9.6%) | 0 (0.0%) |
| 5-Person Households | 2 (2.1%) | 0 (0.0%) |
| 6-Person Households | 0 (0.0%) | 0 (0.0%) |
| 7+ Person Households | 0 (0.0%) | 0 (0.0%) |
| Total | 44 (46.8%) | 50 (53.2%) |
Female Fertility in Mineral
Fertility by Age in Mineral
| Age Bracket | Women with Births | Births / 1,000 Women |
| 15 to 19 years | 0 (0.0%) | 0.0 |
| 20 to 34 years | 0 (0.0%) | 0.0 |
| 35 to 50 years | 0 (0.0%) | 0.0 |
| Total | 0 (0.0%) | 0.0 |
Fertility by Age by Marriage Status in Mineral
| Age Bracket | Married | Unmarried |
| 15 to 19 years | 0 (0.0%) | 0 (0.0%) |
| 20 to 34 years | 0 (0.0%) | 0 (0.0%) |
| 35 to 50 years | 0 (0.0%) | 0 (0.0%) |
| Total | 0 (0.0%) | 0 (0.0%) |
Fertility by Education in Mineral
| Educational Attainment | Women with Births | Births / 1,000 Women |
| Less than High School | 0 (0.0%) | 0.0 |
| High School Diploma | 0 (0.0%) | 0.0 |
| College or Associate's Degree | 0 (0.0%) | 0.0 |
| Bachelor's Degree | 0 (0.0%) | 0.0 |
| Graduate Degree | 0 (0.0%) | 0.0 |
| Total | 0 (0.0%) | 0.0 |
Fertility by Education by Marriage Status in Mineral
| Educational Attainment | Married | Unmarried |
| Less than High School | 0 (0.0%) | 0 (0.0%) |
| High School Diploma | 0 (0.0%) | 0 (0.0%) |
| College or Associate's Degree | 0 (0.0%) | 0 (0.0%) |
| Bachelor's Degree | 0 (0.0%) | 0 (0.0%) |
| Graduate Degree | 0 (0.0%) | 0 (0.0%) |
| Total | 0 (0.0%) | 0 (0.0%) |
Employment Characteristics in Mineral
Employment by Class of Employer in Mineral
Among the 93 employed individuals in Mineral, private company employees (81 | 87.1%), local government employees (5 | 5.4%), and not-for-profit organizations (3 | 3.2%) make up the most common classes of employment.
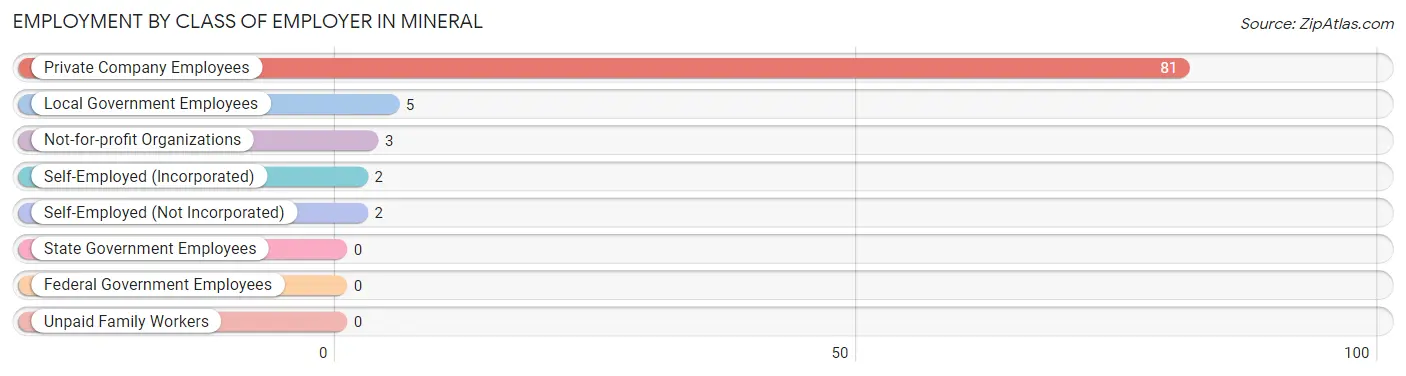
| Employer Class | # Employees | % Employees |
| Private Company Employees | 81 | 87.1% |
| Self-Employed (Incorporated) | 2 | 2.1% |
| Self-Employed (Not Incorporated) | 2 | 2.1% |
| Not-for-profit Organizations | 3 | 3.2% |
| Local Government Employees | 5 | 5.4% |
| State Government Employees | 0 | 0.0% |
| Federal Government Employees | 0 | 0.0% |
| Unpaid Family Workers | 0 | 0.0% |
| Total | 93 | 100.0% |
Employment Status by Age in Mineral
According to the labor force statistics for Mineral, out of the total population over 16 years of age (146), 68.5% or 100 individuals are in the labor force, with 4.0% or 4 of them unemployed. The age group with the highest labor force participation rate is 25 to 29 years, with 100.0% or 4 individuals in the labor force. Within the labor force, the 16 to 19 years age range has the highest percentage of unemployed individuals, with 57.1% or 4 of them being unemployed.
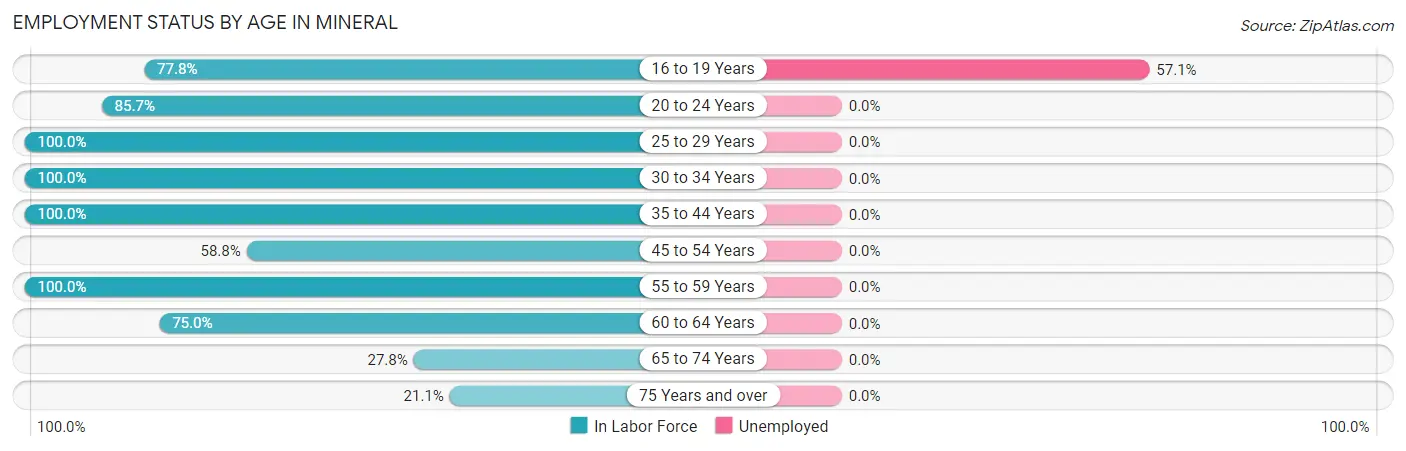
| Age Bracket | In Labor Force | Unemployed |
| 16 to 19 Years | 7 (77.8%) | 4 (57.1%) |
| 20 to 24 Years | 18 (85.7%) | 0 (0.0%) |
| 25 to 29 Years | 4 (100.0%) | 0 (0.0%) |
| 30 to 34 Years | 2 (100.0%) | 0 (0.0%) |
| 35 to 44 Years | 24 (100.0%) | 0 (0.0%) |
| 45 to 54 Years | 10 (58.8%) | 0 (0.0%) |
| 55 to 59 Years | 8 (100.0%) | 0 (0.0%) |
| 60 to 64 Years | 18 (75.0%) | 0 (0.0%) |
| 65 to 74 Years | 5 (27.8%) | 0 (0.0%) |
| 75 Years and over | 4 (21.1%) | 0 (0.0%) |
| Total | 100 (68.5%) | 4 (4.0%) |
Employment Status by Educational Attainment in Mineral
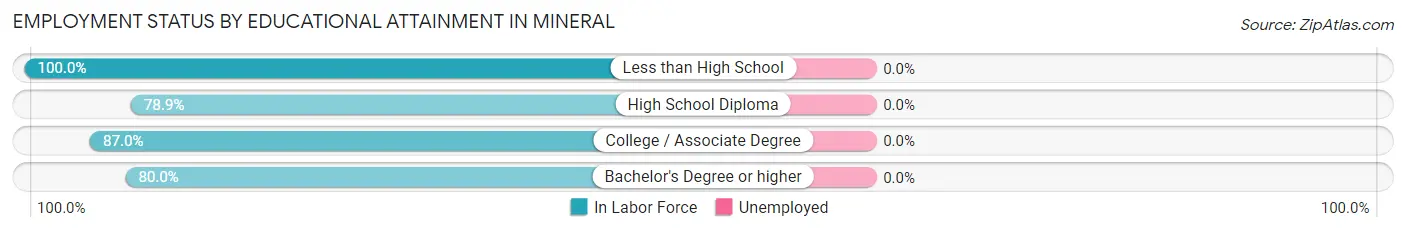
| Educational Attainment | In Labor Force | Unemployed |
| Less than High School | 8 (100.0%) | 0 (0.0%) |
| High School Diploma | 30 (78.9%) | 0 (0.0%) |
| College / Associate Degree | 20 (87.0%) | 0 (0.0%) |
| Bachelor's Degree or higher | 8 (80.0%) | 0 (0.0%) |
| Total | 66 (83.5%) | 0 (0.0%) |
Employment Occupations by Sex in Mineral
Management, Business, Science and Arts Occupations
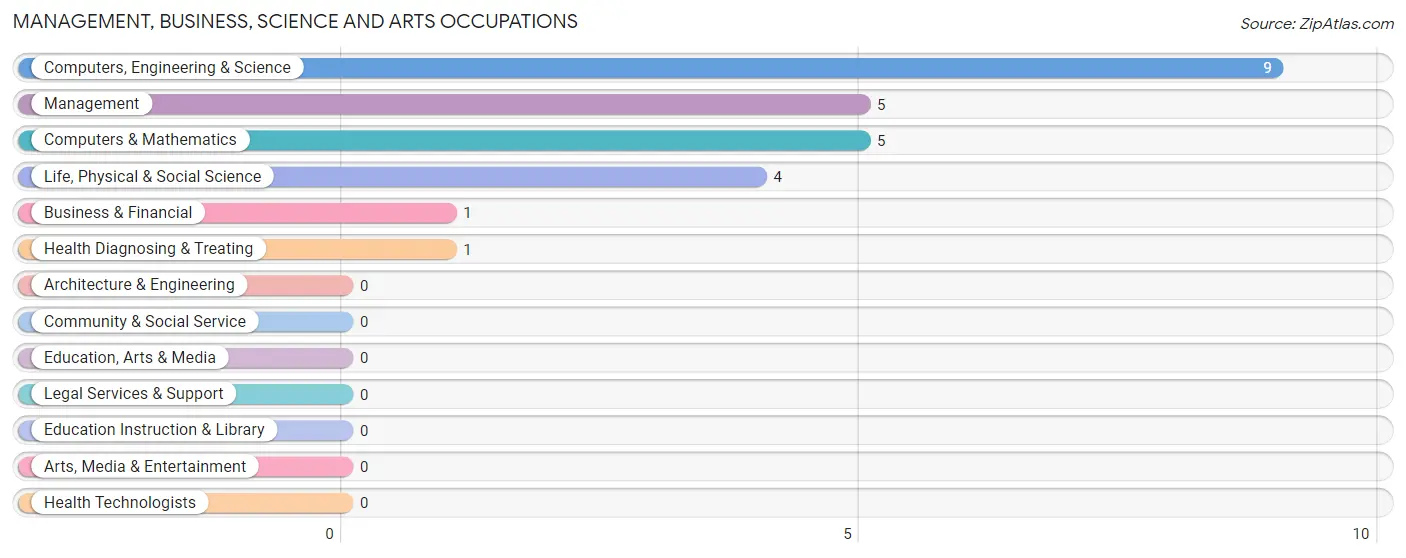
The most common Management, Business, Science and Arts occupations in Mineral are Computers, Engineering & Science (9 | 9.4%), Management (5 | 5.2%), Computers & Mathematics (5 | 5.2%), Life, Physical & Social Science (4 | 4.2%), and Business & Financial (1 | 1.0%).
Management, Business, Science and Arts Occupations by Sex
Within the Management, Business, Science and Arts occupations in Mineral, the most male-oriented occupations are Computers, Engineering & Science (100.0%), Computers & Mathematics (100.0%), and Life, Physical & Social Science (100.0%), while the most female-oriented occupations are Business & Financial (100.0%), and Management (60.0%).
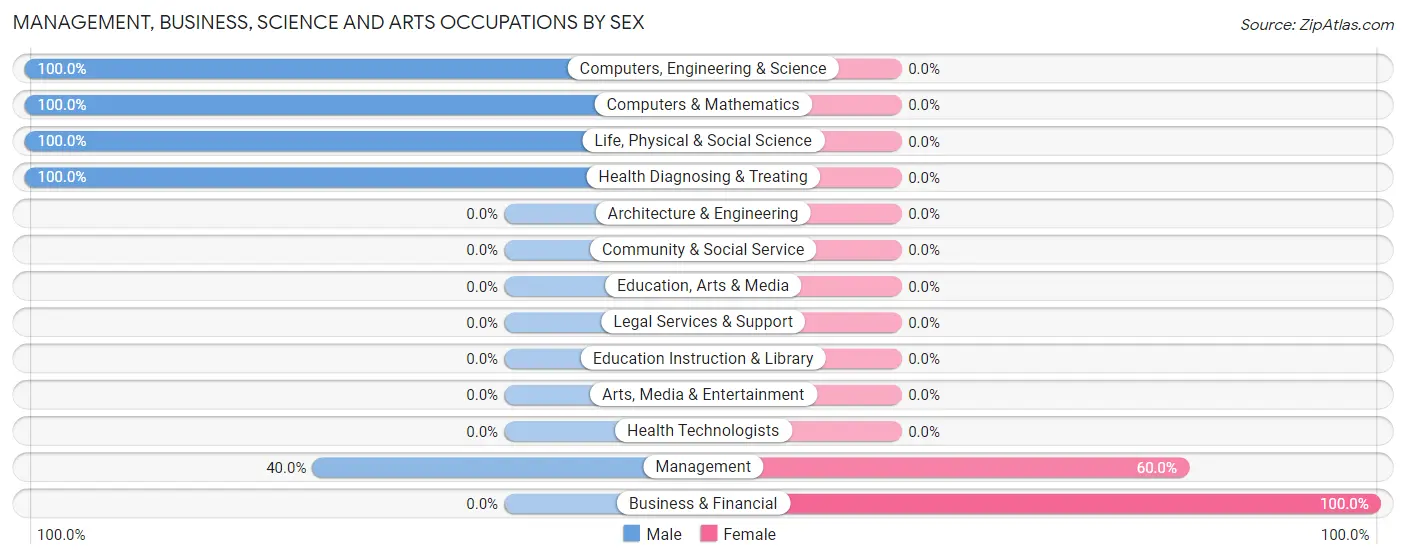
| Occupation | Male | Female |
| Management | 2 (40.0%) | 3 (60.0%) |
| Business & Financial | 0 (0.0%) | 1 (100.0%) |
| Computers, Engineering & Science | 9 (100.0%) | 0 (0.0%) |
| Computers & Mathematics | 5 (100.0%) | 0 (0.0%) |
| Architecture & Engineering | 0 (0.0%) | 0 (0.0%) |
| Life, Physical & Social Science | 4 (100.0%) | 0 (0.0%) |
| Community & Social Service | 0 (0.0%) | 0 (0.0%) |
| Education, Arts & Media | 0 (0.0%) | 0 (0.0%) |
| Legal Services & Support | 0 (0.0%) | 0 (0.0%) |
| Education Instruction & Library | 0 (0.0%) | 0 (0.0%) |
| Arts, Media & Entertainment | 0 (0.0%) | 0 (0.0%) |
| Health Diagnosing & Treating | 1 (100.0%) | 0 (0.0%) |
| Health Technologists | 0 (0.0%) | 0 (0.0%) |
| Total (Category) | 12 (75.0%) | 4 (25.0%) |
| Total (Overall) | 56 (58.3%) | 40 (41.7%) |
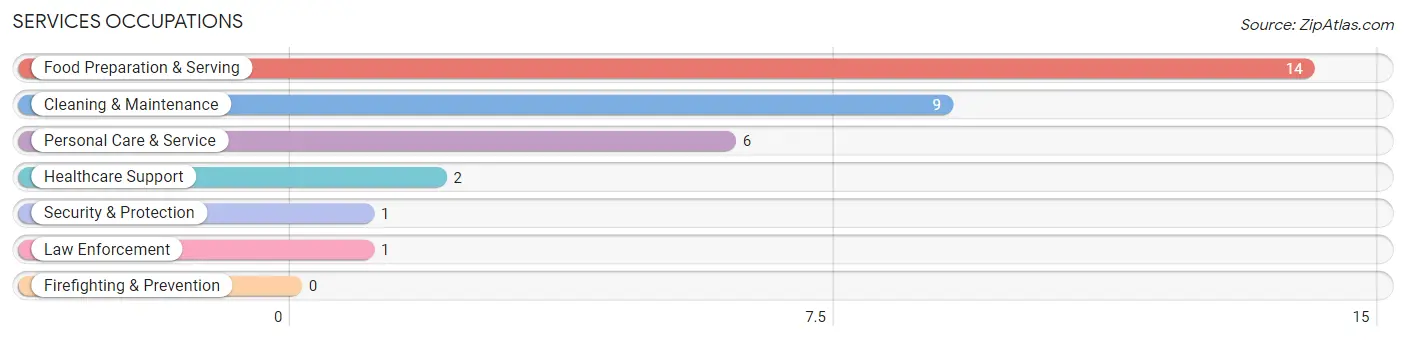
Services Occupations
The most common Services occupations in Mineral are Food Preparation & Serving (14 | 14.6%), Cleaning & Maintenance (9 | 9.4%), Personal Care & Service (6 | 6.2%), Healthcare Support (2 | 2.1%), and Security & Protection (1 | 1.0%).
Services Occupations by Sex
Within the Services occupations in Mineral, the most male-oriented occupations are Security & Protection (100.0%), Law Enforcement (100.0%), and Cleaning & Maintenance (88.9%), while the most female-oriented occupations are Healthcare Support (100.0%), Food Preparation & Serving (100.0%), and Personal Care & Service (100.0%).
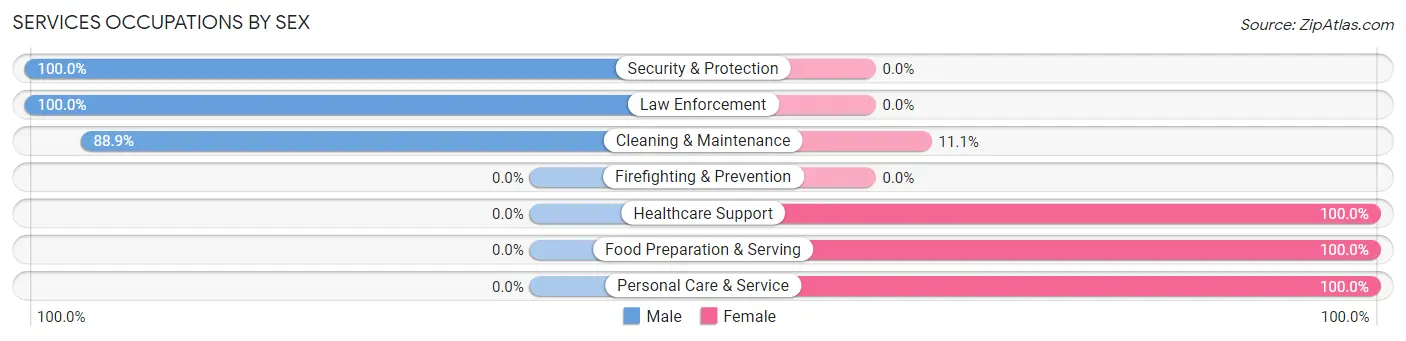
| Occupation | Male | Female |
| Healthcare Support | 0 (0.0%) | 2 (100.0%) |
| Security & Protection | 1 (100.0%) | 0 (0.0%) |
| Firefighting & Prevention | 0 (0.0%) | 0 (0.0%) |
| Law Enforcement | 1 (100.0%) | 0 (0.0%) |
| Food Preparation & Serving | 0 (0.0%) | 14 (100.0%) |
| Cleaning & Maintenance | 8 (88.9%) | 1 (11.1%) |
| Personal Care & Service | 0 (0.0%) | 6 (100.0%) |
| Total (Category) | 9 (28.1%) | 23 (71.9%) |
| Total (Overall) | 56 (58.3%) | 40 (41.7%) |
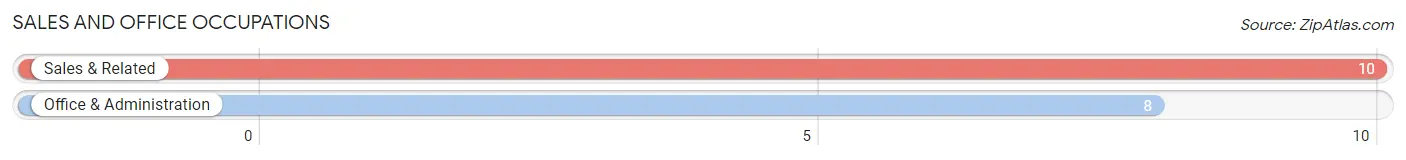
Sales and Office Occupations
The most common Sales and Office occupations in Mineral are Sales & Related (10 | 10.4%), and Office & Administration (8 | 8.3%).
Sales and Office Occupations by Sex
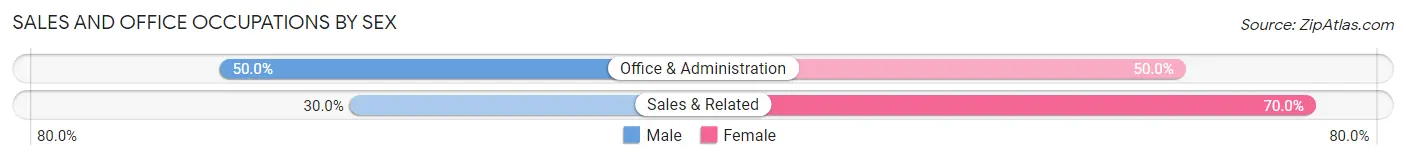
| Occupation | Male | Female |
| Sales & Related | 3 (30.0%) | 7 (70.0%) |
| Office & Administration | 4 (50.0%) | 4 (50.0%) |
| Total (Category) | 7 (38.9%) | 11 (61.1%) |
| Total (Overall) | 56 (58.3%) | 40 (41.7%) |
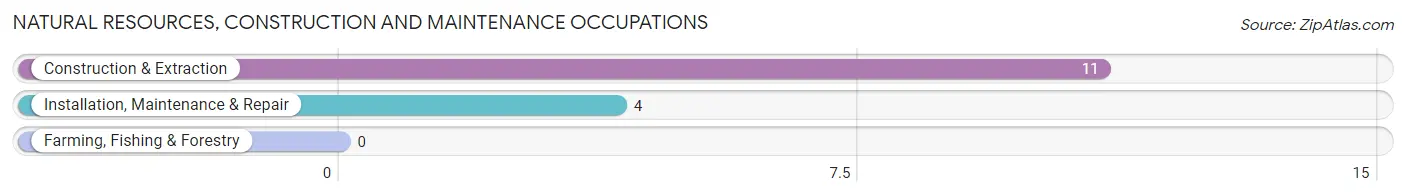
Natural Resources, Construction and Maintenance Occupations
The most common Natural Resources, Construction and Maintenance occupations in Mineral are Construction & Extraction (11 | 11.5%), and Installation, Maintenance & Repair (4 | 4.2%).
Natural Resources, Construction and Maintenance Occupations by Sex
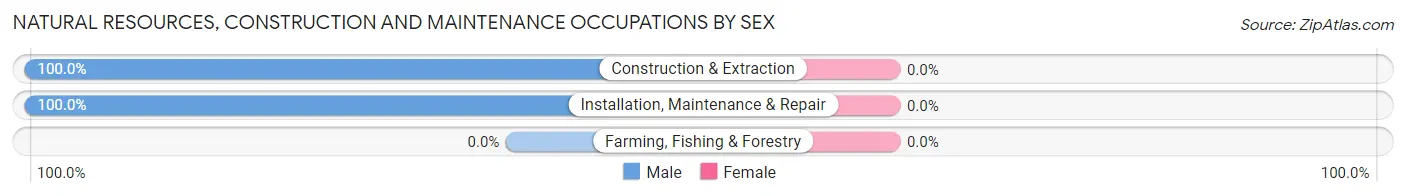
| Occupation | Male | Female |
| Farming, Fishing & Forestry | 0 (0.0%) | 0 (0.0%) |
| Construction & Extraction | 11 (100.0%) | 0 (0.0%) |
| Installation, Maintenance & Repair | 4 (100.0%) | 0 (0.0%) |
| Total (Category) | 15 (100.0%) | 0 (0.0%) |
| Total (Overall) | 56 (58.3%) | 40 (41.7%) |
Production, Transportation and Moving Occupations
The most common Production, Transportation and Moving occupations in Mineral are Transportation (9 | 9.4%), Material Moving (4 | 4.2%), and Production (2 | 2.1%).
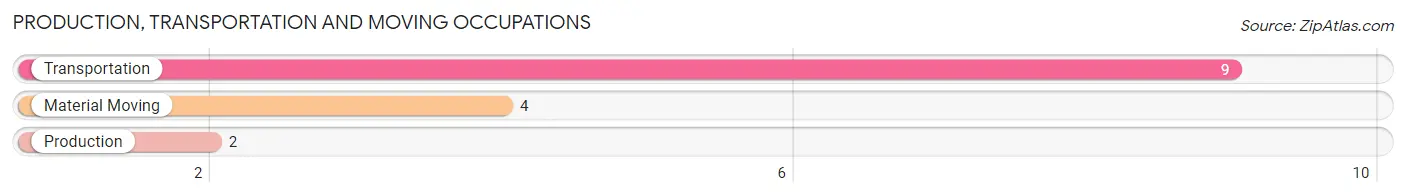
Production, Transportation and Moving Occupations by Sex
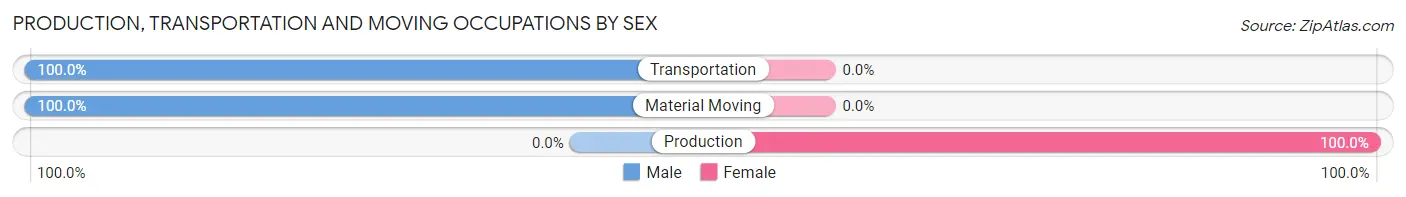
| Occupation | Male | Female |
| Production | 0 (0.0%) | 2 (100.0%) |
| Transportation | 9 (100.0%) | 0 (0.0%) |
| Material Moving | 4 (100.0%) | 0 (0.0%) |
| Total (Category) | 13 (86.7%) | 2 (13.3%) |
| Total (Overall) | 56 (58.3%) | 40 (41.7%) |
Employment Industries by Sex in Mineral
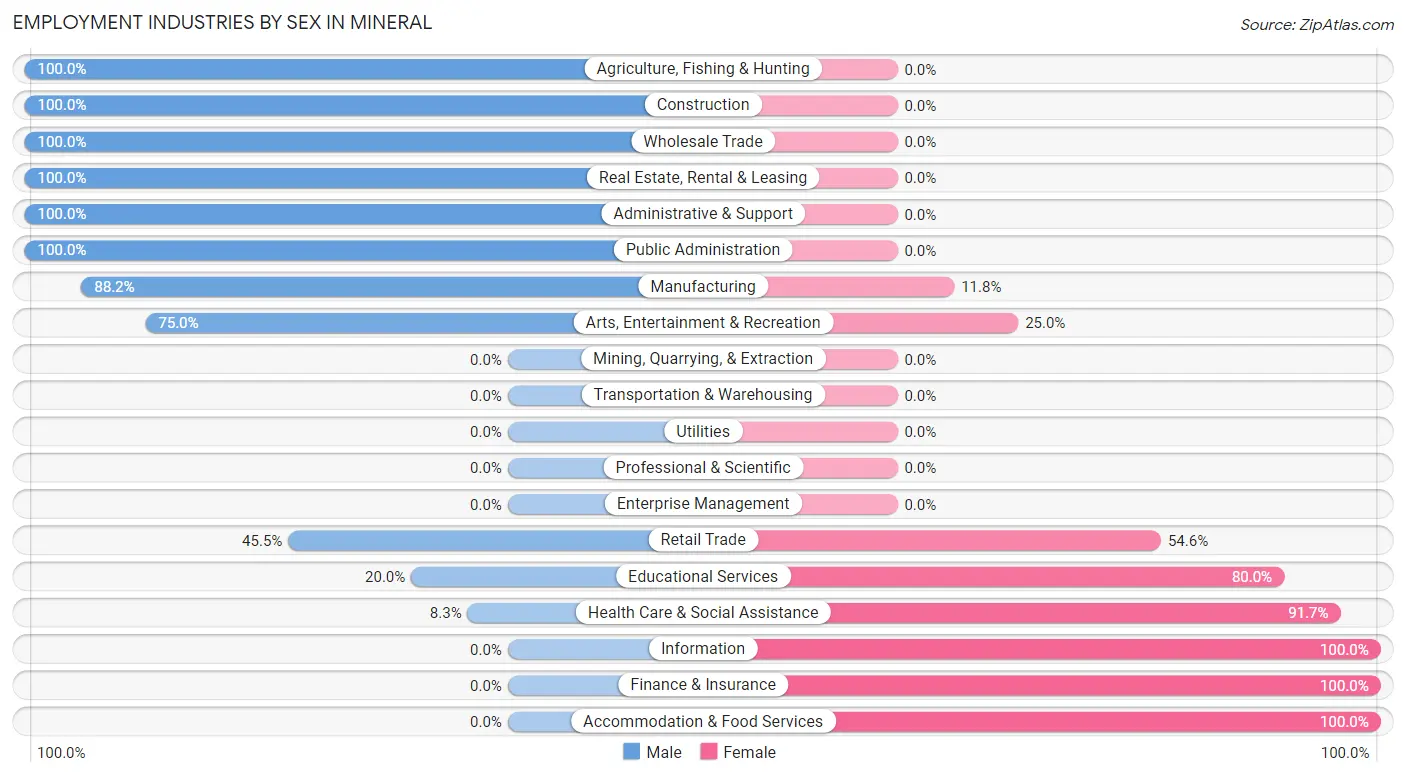
Employment Industries in Mineral
The major employment industries in Mineral include Manufacturing (17 | 17.7%), Wholesale Trade (13 | 13.5%), Accommodation & Food Services (13 | 13.5%), Construction (12 | 12.5%), and Health Care & Social Assistance (12 | 12.5%).
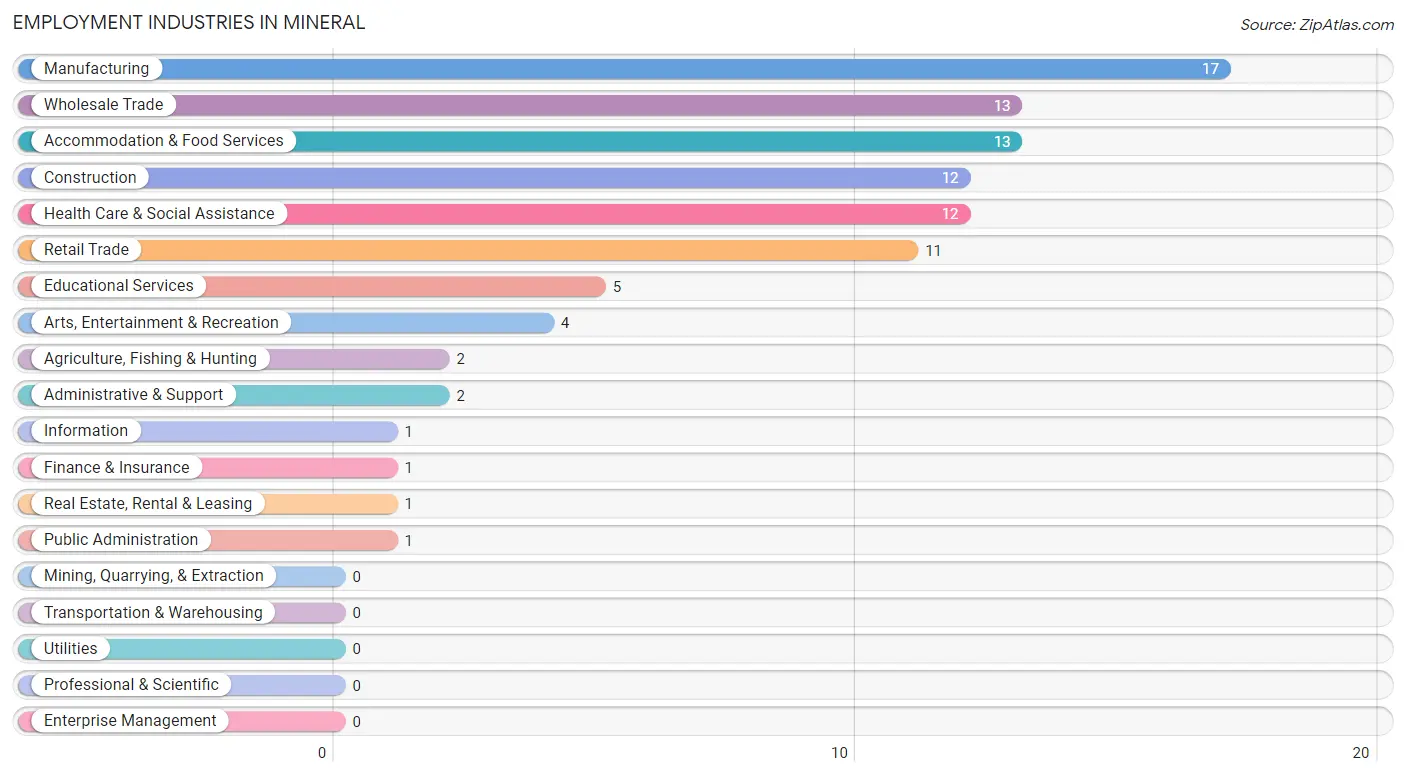
Employment Industries by Sex in Mineral
The Mineral industries that see more men than women are Agriculture, Fishing & Hunting (100.0%), Construction (100.0%), and Wholesale Trade (100.0%), whereas the industries that tend to have a higher number of women are Information (100.0%), Finance & Insurance (100.0%), and Accommodation & Food Services (100.0%).
| Industry | Male | Female |
| Agriculture, Fishing & Hunting | 2 (100.0%) | 0 (0.0%) |
| Mining, Quarrying, & Extraction | 0 (0.0%) | 0 (0.0%) |
| Construction | 12 (100.0%) | 0 (0.0%) |
| Manufacturing | 15 (88.2%) | 2 (11.8%) |
| Wholesale Trade | 13 (100.0%) | 0 (0.0%) |
| Retail Trade | 5 (45.5%) | 6 (54.5%) |
| Transportation & Warehousing | 0 (0.0%) | 0 (0.0%) |
| Utilities | 0 (0.0%) | 0 (0.0%) |
| Information | 0 (0.0%) | 1 (100.0%) |
| Finance & Insurance | 0 (0.0%) | 1 (100.0%) |
| Real Estate, Rental & Leasing | 1 (100.0%) | 0 (0.0%) |
| Professional & Scientific | 0 (0.0%) | 0 (0.0%) |
| Enterprise Management | 0 (0.0%) | 0 (0.0%) |
| Administrative & Support | 2 (100.0%) | 0 (0.0%) |
| Educational Services | 1 (20.0%) | 4 (80.0%) |
| Health Care & Social Assistance | 1 (8.3%) | 11 (91.7%) |
| Arts, Entertainment & Recreation | 3 (75.0%) | 1 (25.0%) |
| Accommodation & Food Services | 0 (0.0%) | 13 (100.0%) |
| Public Administration | 1 (100.0%) | 0 (0.0%) |
| Total | 56 (58.3%) | 40 (41.7%) |
Education in Mineral
School Enrollment in Mineral
The most common levels of schooling among the 34 students in Mineral are elementary school (13 | 38.2%), middle school (8 | 23.5%), and high school (7 | 20.6%).
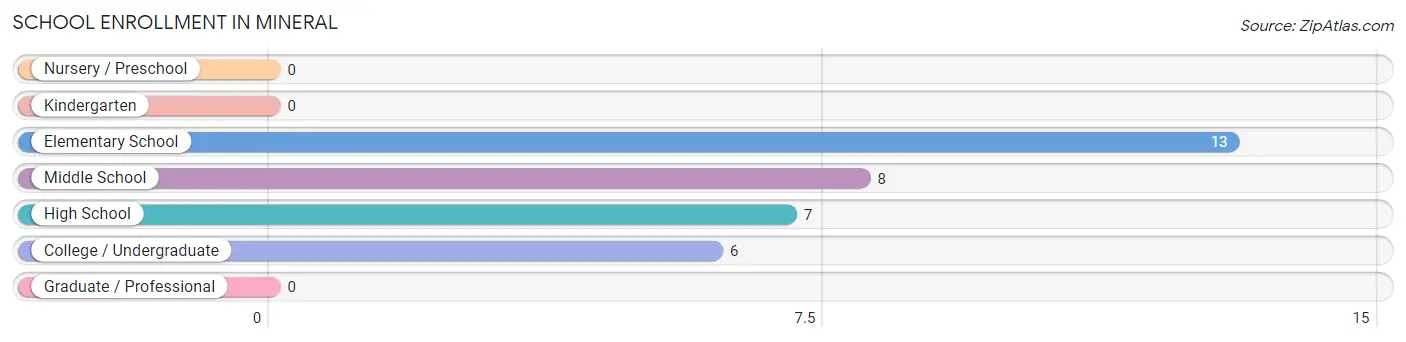
| School Level | # Students | % Students |
| Nursery / Preschool | 0 | 0.0% |
| Kindergarten | 0 | 0.0% |
| Elementary School | 13 | 38.2% |
| Middle School | 8 | 23.5% |
| High School | 7 | 20.6% |
| College / Undergraduate | 6 | 17.6% |
| Graduate / Professional | 0 | 0.0% |
| Total | 34 | 100.0% |
School Enrollment by Age by Funding Source in Mineral
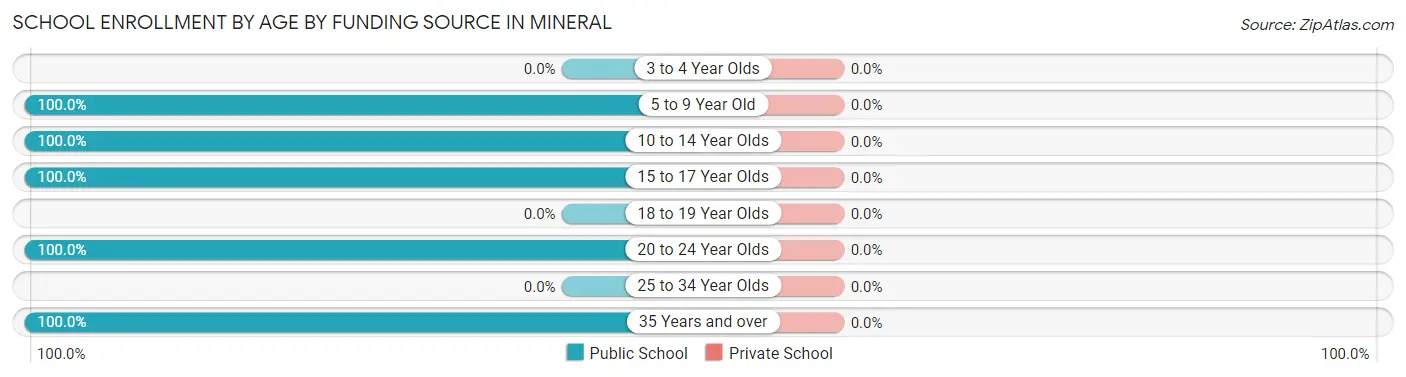
| Age Bracket | Public School | Private School |
| 3 to 4 Year Olds | 0 (0.0%) | 0 (0.0%) |
| 5 to 9 Year Old | 13 (100.0%) | 0 (0.0%) |
| 10 to 14 Year Olds | 8 (100.0%) | 0 (0.0%) |
| 15 to 17 Year Olds | 7 (100.0%) | 0 (0.0%) |
| 18 to 19 Year Olds | 0 (0.0%) | 0 (0.0%) |
| 20 to 24 Year Olds | 5 (100.0%) | 0 (0.0%) |
| 25 to 34 Year Olds | 0 (0.0%) | 0 (0.0%) |
| 35 Years and over | 1 (100.0%) | 0 (0.0%) |
| Total | 34 (100.0%) | 0 (0.0%) |
Educational Attainment by Field of Study in Mineral
Communications (5 | 41.7%), bio, nature & agricultural (3 | 25.0%), physical & health sciences (2 | 16.7%), business (1 | 8.3%), and education (1 | 8.3%) are the most common fields of study among 12 individuals in Mineral who have obtained a bachelor's degree or higher.
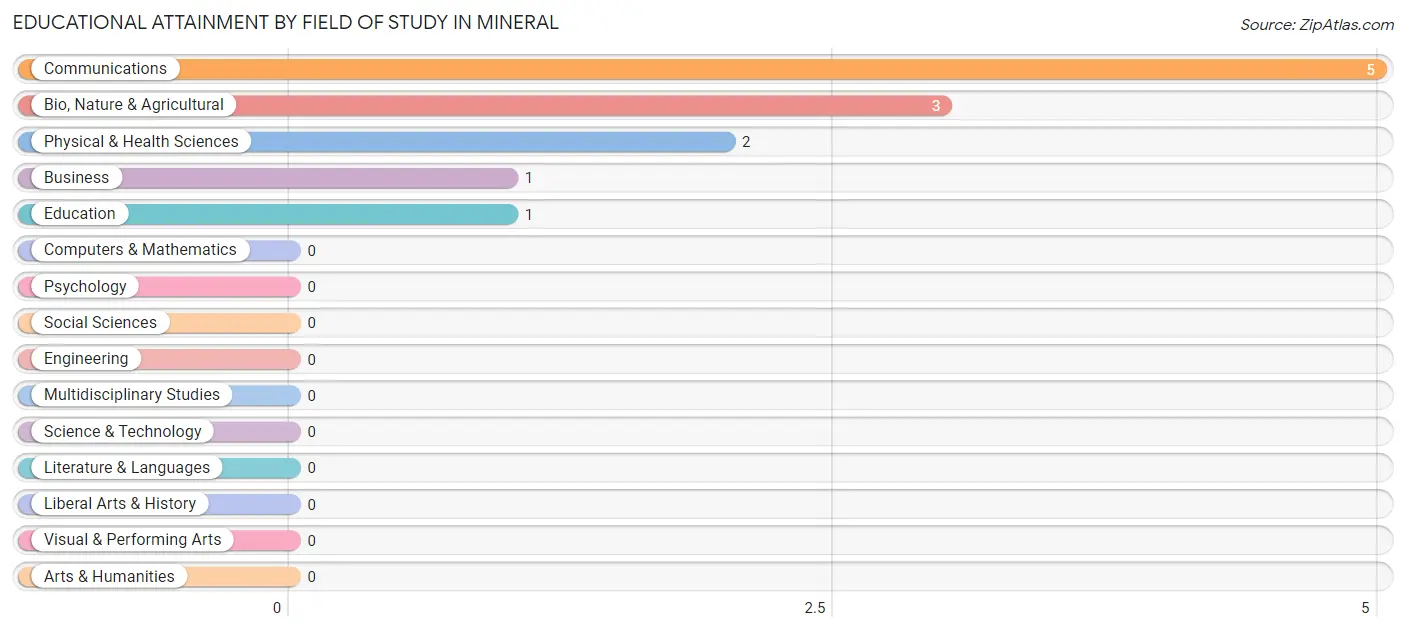
| Field of Study | # Graduates | % Graduates |
| Computers & Mathematics | 0 | 0.0% |
| Bio, Nature & Agricultural | 3 | 25.0% |
| Physical & Health Sciences | 2 | 16.7% |
| Psychology | 0 | 0.0% |
| Social Sciences | 0 | 0.0% |
| Engineering | 0 | 0.0% |
| Multidisciplinary Studies | 0 | 0.0% |
| Science & Technology | 0 | 0.0% |
| Business | 1 | 8.3% |
| Education | 1 | 8.3% |
| Literature & Languages | 0 | 0.0% |
| Liberal Arts & History | 0 | 0.0% |
| Visual & Performing Arts | 0 | 0.0% |
| Communications | 5 | 41.7% |
| Arts & Humanities | 0 | 0.0% |
| Total | 12 | 100.0% |
Transportation & Commute in Mineral
Vehicle Availability by Sex in Mineral
The most prevalent vehicle ownership categories in Mineral are males with 1 vehicle (21, accounting for 37.5%) and females with 1 vehicle (18, making up 56.8%).
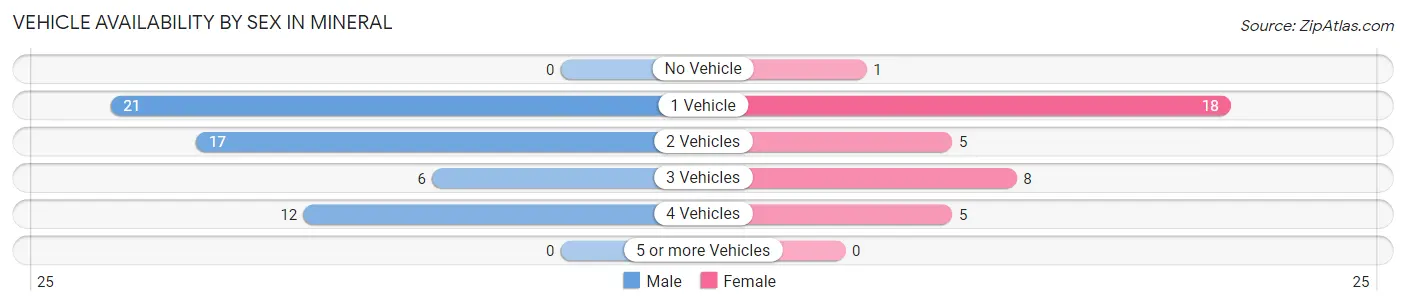
| Vehicles Available | Male | Female |
| No Vehicle | 0 (0.0%) | 1 (2.7%) |
| 1 Vehicle | 21 (37.5%) | 18 (48.6%) |
| 2 Vehicles | 17 (30.4%) | 5 (13.5%) |
| 3 Vehicles | 6 (10.7%) | 8 (21.6%) |
| 4 Vehicles | 12 (21.4%) | 5 (13.5%) |
| 5 or more Vehicles | 0 (0.0%) | 0 (0.0%) |
| Total | 56 (100.0%) | 37 (100.0%) |
Commute Time in Mineral
The most frequently occuring commute durations in Mineral are 25 to 29 minutes (16 commuters, 17.2%), 30 to 34 minutes (15 commuters, 16.1%), and 45 to 59 minutes (14 commuters, 15.0%).
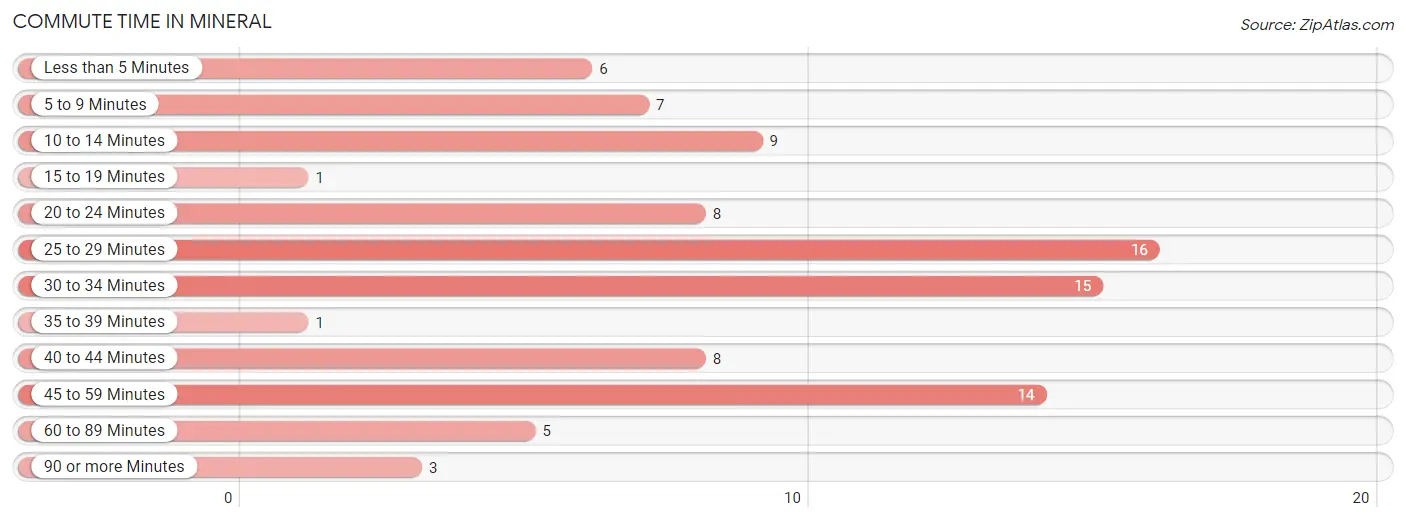
| Commute Time | # Commuters | % Commuters |
| Less than 5 Minutes | 6 | 6.5% |
| 5 to 9 Minutes | 7 | 7.5% |
| 10 to 14 Minutes | 9 | 9.7% |
| 15 to 19 Minutes | 1 | 1.1% |
| 20 to 24 Minutes | 8 | 8.6% |
| 25 to 29 Minutes | 16 | 17.2% |
| 30 to 34 Minutes | 15 | 16.1% |
| 35 to 39 Minutes | 1 | 1.1% |
| 40 to 44 Minutes | 8 | 8.6% |
| 45 to 59 Minutes | 14 | 15.0% |
| 60 to 89 Minutes | 5 | 5.4% |
| 90 or more Minutes | 3 | 3.2% |
Commute Time by Sex in Mineral
The most common commute times in Mineral are 45 to 59 minutes (14 commuters, 25.0%) for males and 30 to 34 minutes (10 commuters, 27.0%) for females.
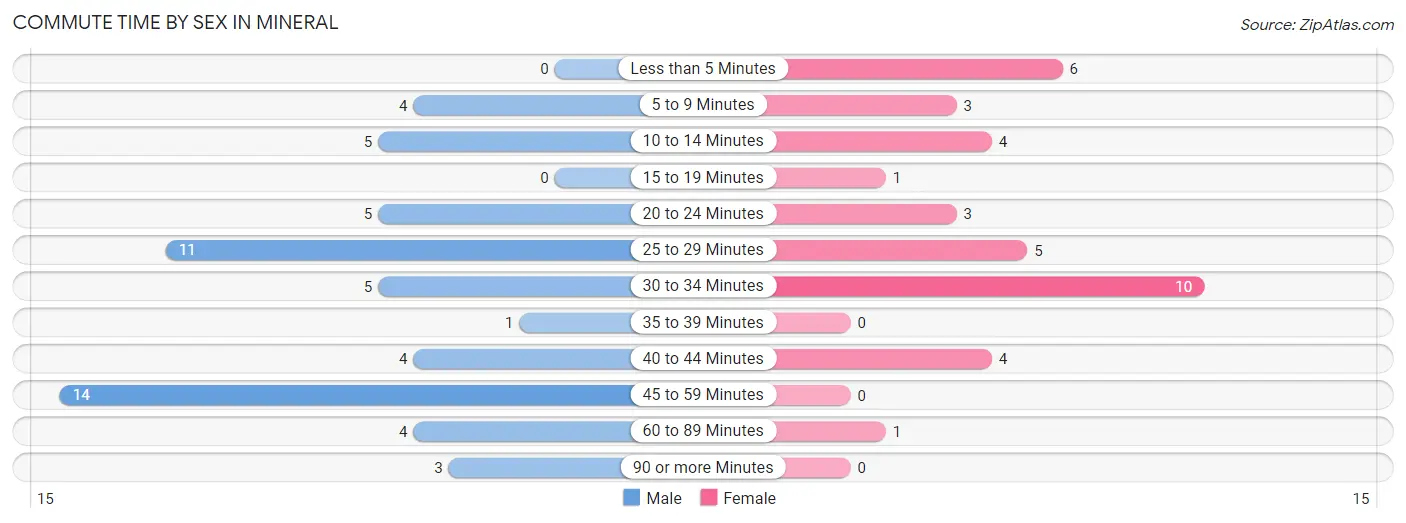
| Commute Time | Male | Female |
| Less than 5 Minutes | 0 (0.0%) | 6 (16.2%) |
| 5 to 9 Minutes | 4 (7.1%) | 3 (8.1%) |
| 10 to 14 Minutes | 5 (8.9%) | 4 (10.8%) |
| 15 to 19 Minutes | 0 (0.0%) | 1 (2.7%) |
| 20 to 24 Minutes | 5 (8.9%) | 3 (8.1%) |
| 25 to 29 Minutes | 11 (19.6%) | 5 (13.5%) |
| 30 to 34 Minutes | 5 (8.9%) | 10 (27.0%) |
| 35 to 39 Minutes | 1 (1.8%) | 0 (0.0%) |
| 40 to 44 Minutes | 4 (7.1%) | 4 (10.8%) |
| 45 to 59 Minutes | 14 (25.0%) | 0 (0.0%) |
| 60 to 89 Minutes | 4 (7.1%) | 1 (2.7%) |
| 90 or more Minutes | 3 (5.4%) | 0 (0.0%) |
Time of Departure to Work by Sex in Mineral
The most frequent times of departure to work in Mineral are 5:30 AM to 5:59 AM (13, 23.2%) for males and 7:30 AM to 7:59 AM (8, 21.6%) for females.
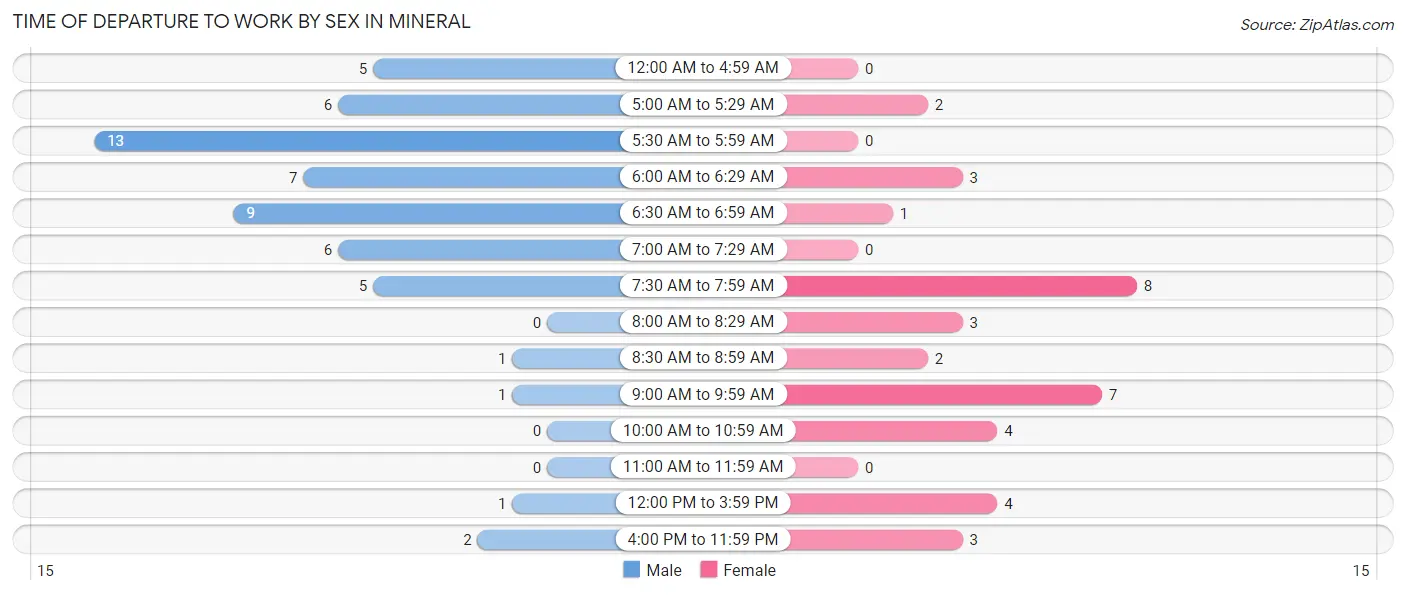
| Time of Departure | Male | Female |
| 12:00 AM to 4:59 AM | 5 (8.9%) | 0 (0.0%) |
| 5:00 AM to 5:29 AM | 6 (10.7%) | 2 (5.4%) |
| 5:30 AM to 5:59 AM | 13 (23.2%) | 0 (0.0%) |
| 6:00 AM to 6:29 AM | 7 (12.5%) | 3 (8.1%) |
| 6:30 AM to 6:59 AM | 9 (16.1%) | 1 (2.7%) |
| 7:00 AM to 7:29 AM | 6 (10.7%) | 0 (0.0%) |
| 7:30 AM to 7:59 AM | 5 (8.9%) | 8 (21.6%) |
| 8:00 AM to 8:29 AM | 0 (0.0%) | 3 (8.1%) |
| 8:30 AM to 8:59 AM | 1 (1.8%) | 2 (5.4%) |
| 9:00 AM to 9:59 AM | 1 (1.8%) | 7 (18.9%) |
| 10:00 AM to 10:59 AM | 0 (0.0%) | 4 (10.8%) |
| 11:00 AM to 11:59 AM | 0 (0.0%) | 0 (0.0%) |
| 12:00 PM to 3:59 PM | 1 (1.8%) | 4 (10.8%) |
| 4:00 PM to 11:59 PM | 2 (3.6%) | 3 (8.1%) |
| Total | 56 (100.0%) | 37 (100.0%) |
Housing Occupancy in Mineral
Occupancy by Ownership in Mineral
Of the total 94 dwellings in Mineral, owner-occupied units account for 85 (90.4%), while renter-occupied units make up 9 (9.6%).
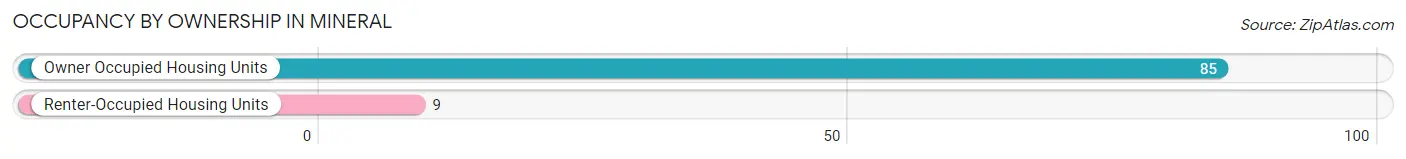
| Occupancy | # Housing Units | % Housing Units |
| Owner Occupied Housing Units | 85 | 90.4% |
| Renter-Occupied Housing Units | 9 | 9.6% |
| Total Occupied Housing Units | 94 | 100.0% |
Occupancy by Household Size in Mineral
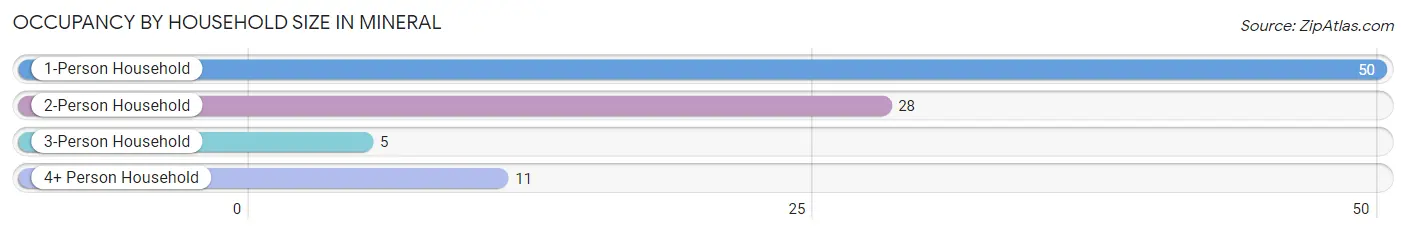
| Household Size | # Housing Units | % Housing Units |
| 1-Person Household | 50 | 53.2% |
| 2-Person Household | 28 | 29.8% |
| 3-Person Household | 5 | 5.3% |
| 4+ Person Household | 11 | 11.7% |
| Total Housing Units | 94 | 100.0% |
Occupancy by Ownership by Household Size in Mineral
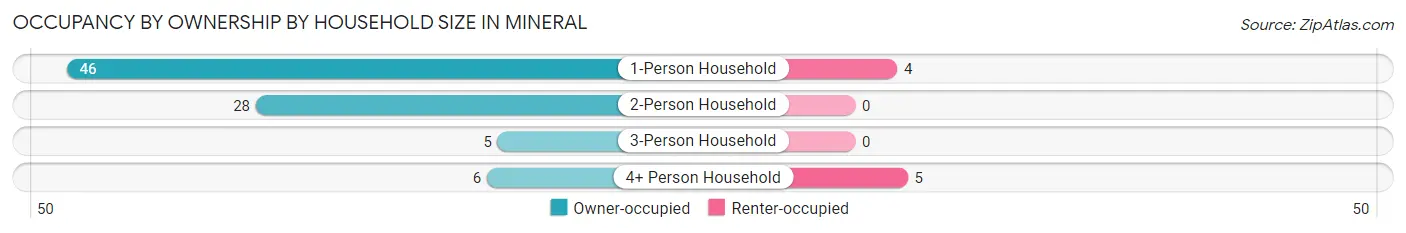
| Household Size | Owner-occupied | Renter-occupied |
| 1-Person Household | 46 (92.0%) | 4 (8.0%) |
| 2-Person Household | 28 (100.0%) | 0 (0.0%) |
| 3-Person Household | 5 (100.0%) | 0 (0.0%) |
| 4+ Person Household | 6 (54.5%) | 5 (45.5%) |
| Total Housing Units | 85 (90.4%) | 9 (9.6%) |
Occupancy by Educational Attainment in Mineral
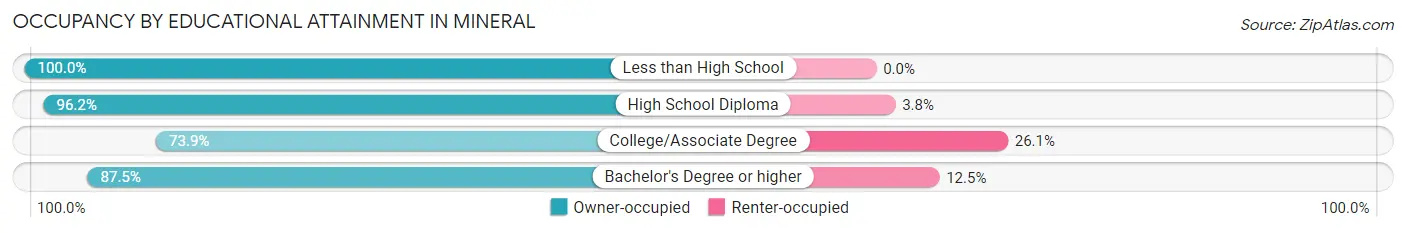
| Household Size | Owner-occupied | Renter-occupied |
| Less than High School | 10 (100.0%) | 0 (0.0%) |
| High School Diploma | 51 (96.2%) | 2 (3.8%) |
| College/Associate Degree | 17 (73.9%) | 6 (26.1%) |
| Bachelor's Degree or higher | 7 (87.5%) | 1 (12.5%) |
Occupancy by Age of Householder in Mineral
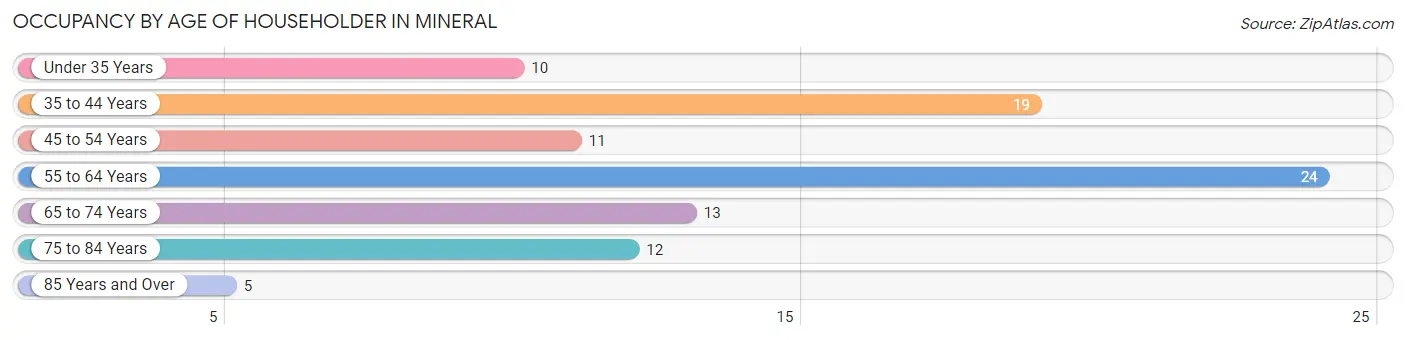
| Age Bracket | # Households | % Households |
| Under 35 Years | 10 | 10.6% |
| 35 to 44 Years | 19 | 20.2% |
| 45 to 54 Years | 11 | 11.7% |
| 55 to 64 Years | 24 | 25.5% |
| 65 to 74 Years | 13 | 13.8% |
| 75 to 84 Years | 12 | 12.8% |
| 85 Years and Over | 5 | 5.3% |
| Total | 94 | 100.0% |
Housing Finances in Mineral
Median Income by Occupancy in Mineral
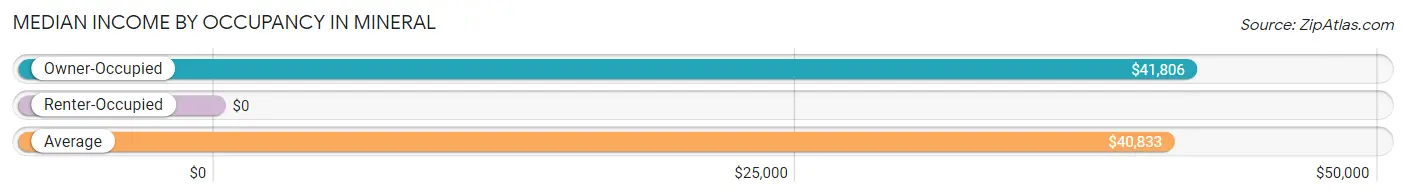
| Occupancy Type | # Households | Median Income |
| Owner-Occupied | 85 (90.4%) | $41,806 |
| Renter-Occupied | 9 (9.6%) | $0 |
| Average | 94 (100.0%) | $40,833 |
Occupancy by Householder Income Bracket in Mineral
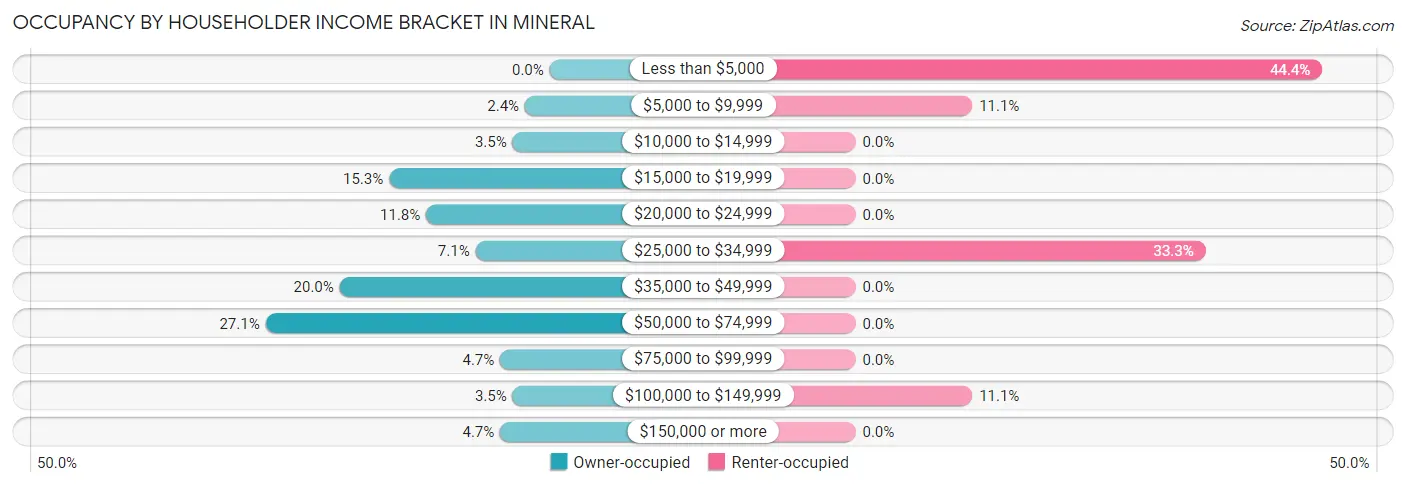
| Income Bracket | Owner-occupied | Renter-occupied |
| Less than $5,000 | 0 (0.0%) | 4 (44.4%) |
| $5,000 to $9,999 | 2 (2.4%) | 1 (11.1%) |
| $10,000 to $14,999 | 3 (3.5%) | 0 (0.0%) |
| $15,000 to $19,999 | 13 (15.3%) | 0 (0.0%) |
| $20,000 to $24,999 | 10 (11.8%) | 0 (0.0%) |
| $25,000 to $34,999 | 6 (7.1%) | 3 (33.3%) |
| $35,000 to $49,999 | 17 (20.0%) | 0 (0.0%) |
| $50,000 to $74,999 | 23 (27.1%) | 0 (0.0%) |
| $75,000 to $99,999 | 4 (4.7%) | 0 (0.0%) |
| $100,000 to $149,999 | 3 (3.5%) | 1 (11.1%) |
| $150,000 or more | 4 (4.7%) | 0 (0.0%) |
| Total | 85 (100.0%) | 9 (100.0%) |
Monthly Housing Cost Tiers in Mineral
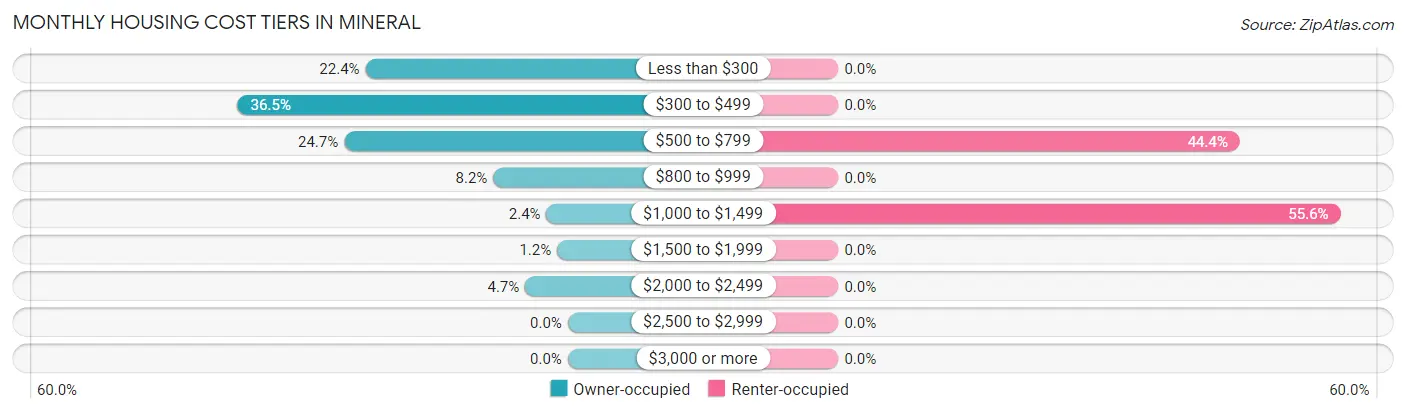
| Monthly Cost | Owner-occupied | Renter-occupied |
| Less than $300 | 19 (22.4%) | 0 (0.0%) |
| $300 to $499 | 31 (36.5%) | 0 (0.0%) |
| $500 to $799 | 21 (24.7%) | 4 (44.4%) |
| $800 to $999 | 7 (8.2%) | 0 (0.0%) |
| $1,000 to $1,499 | 2 (2.4%) | 5 (55.6%) |
| $1,500 to $1,999 | 1 (1.2%) | 0 (0.0%) |
| $2,000 to $2,499 | 4 (4.7%) | 0 (0.0%) |
| $2,500 to $2,999 | 0 (0.0%) | 0 (0.0%) |
| $3,000 or more | 0 (0.0%) | 0 (0.0%) |
| Total | 85 (100.0%) | 9 (100.0%) |
Physical Housing Characteristics in Mineral
Housing Structures in Mineral
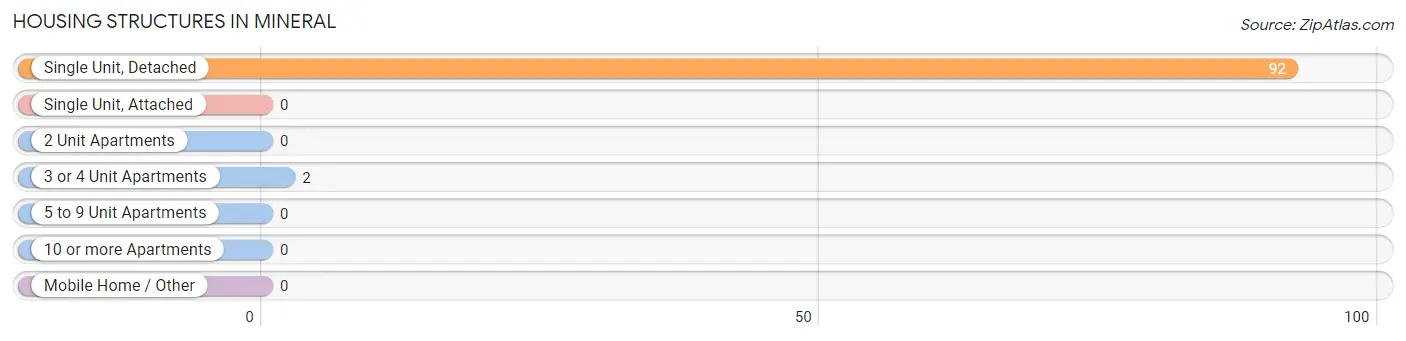
| Structure Type | # Housing Units | % Housing Units |
| Single Unit, Detached | 92 | 97.9% |
| Single Unit, Attached | 0 | 0.0% |
| 2 Unit Apartments | 0 | 0.0% |
| 3 or 4 Unit Apartments | 2 | 2.1% |
| 5 to 9 Unit Apartments | 0 | 0.0% |
| 10 or more Apartments | 0 | 0.0% |
| Mobile Home / Other | 0 | 0.0% |
| Total | 94 | 100.0% |
Housing Structures by Occupancy in Mineral
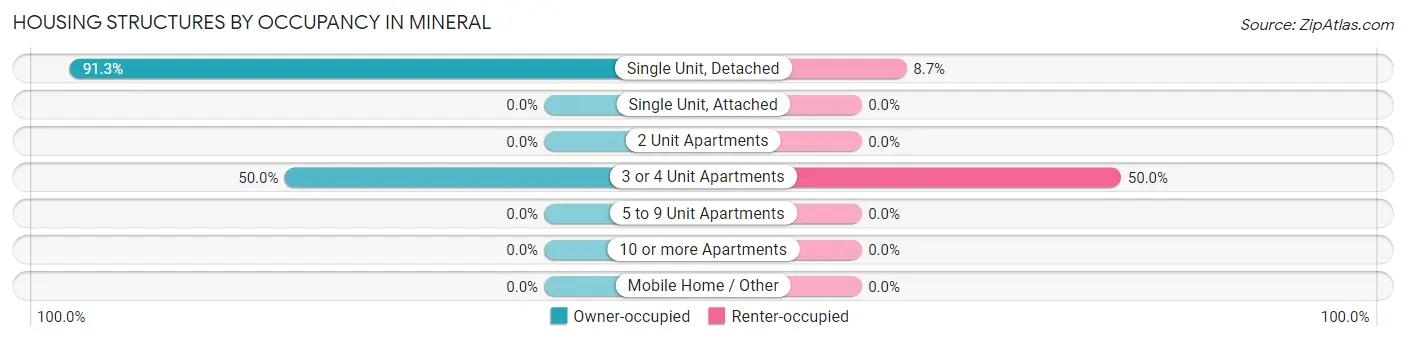
| Structure Type | Owner-occupied | Renter-occupied |
| Single Unit, Detached | 84 (91.3%) | 8 (8.7%) |
| Single Unit, Attached | 0 (0.0%) | 0 (0.0%) |
| 2 Unit Apartments | 0 (0.0%) | 0 (0.0%) |
| 3 or 4 Unit Apartments | 1 (50.0%) | 1 (50.0%) |
| 5 to 9 Unit Apartments | 0 (0.0%) | 0 (0.0%) |
| 10 or more Apartments | 0 (0.0%) | 0 (0.0%) |
| Mobile Home / Other | 0 (0.0%) | 0 (0.0%) |
| Total | 85 (90.4%) | 9 (9.6%) |
Housing Structures by Number of Rooms in Mineral
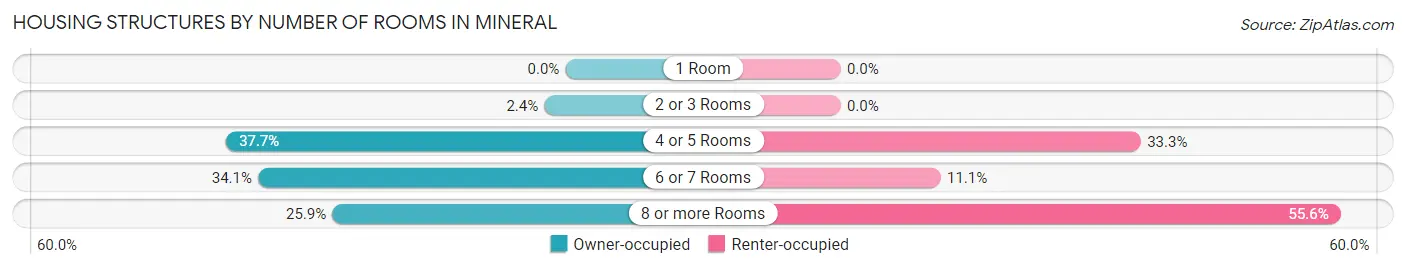
| Number of Rooms | Owner-occupied | Renter-occupied |
| 1 Room | 0 (0.0%) | 0 (0.0%) |
| 2 or 3 Rooms | 2 (2.4%) | 0 (0.0%) |
| 4 or 5 Rooms | 32 (37.7%) | 3 (33.3%) |
| 6 or 7 Rooms | 29 (34.1%) | 1 (11.1%) |
| 8 or more Rooms | 22 (25.9%) | 5 (55.6%) |
| Total | 85 (100.0%) | 9 (100.0%) |
Housing Structure by Heating Type in Mineral
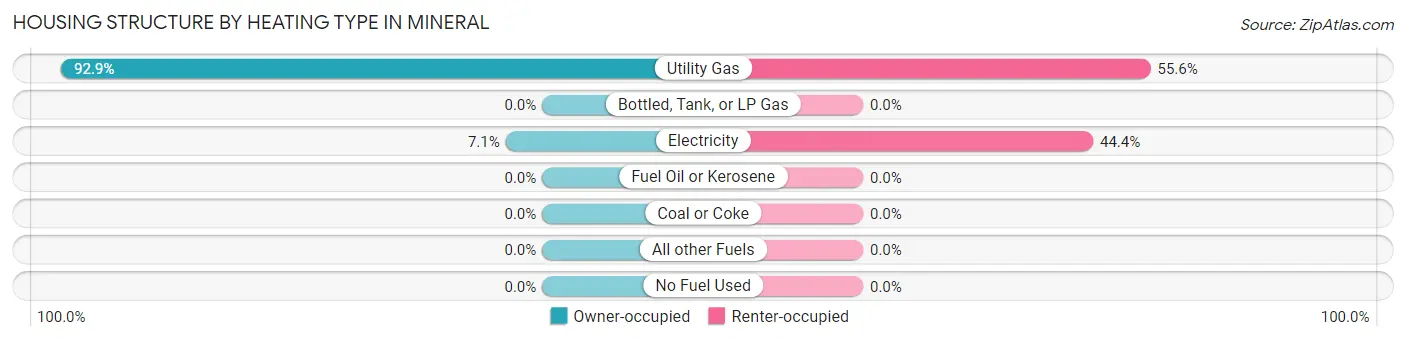
| Heating Type | Owner-occupied | Renter-occupied |
| Utility Gas | 79 (92.9%) | 5 (55.6%) |
| Bottled, Tank, or LP Gas | 0 (0.0%) | 0 (0.0%) |
| Electricity | 6 (7.1%) | 4 (44.4%) |
| Fuel Oil or Kerosene | 0 (0.0%) | 0 (0.0%) |
| Coal or Coke | 0 (0.0%) | 0 (0.0%) |
| All other Fuels | 0 (0.0%) | 0 (0.0%) |
| No Fuel Used | 0 (0.0%) | 0 (0.0%) |
| Total | 85 (100.0%) | 9 (100.0%) |
Household Vehicle Usage in Mineral
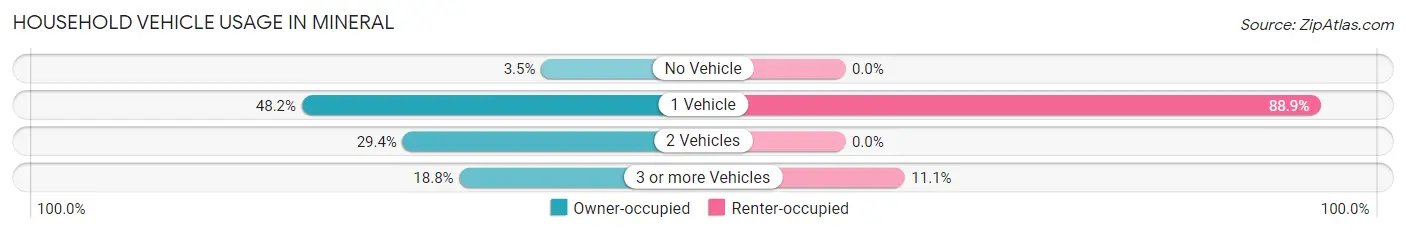
| Vehicles per Household | Owner-occupied | Renter-occupied |
| No Vehicle | 3 (3.5%) | 0 (0.0%) |
| 1 Vehicle | 41 (48.2%) | 8 (88.9%) |
| 2 Vehicles | 25 (29.4%) | 0 (0.0%) |
| 3 or more Vehicles | 16 (18.8%) | 1 (11.1%) |
| Total | 85 (100.0%) | 9 (100.0%) |
Real Estate & Mortgages in Mineral
Real Estate and Mortgage Overview in Mineral
| Characteristic | Without Mortgage | With Mortgage |
| Housing Units | 57 | 28 |
| Median Property Value | $57,900 | $78,300 |
| Median Household Income | $40,208 | $4 |
| Monthly Housing Costs | $365 | $0 |
| Real Estate Taxes | $1,089 | $0 |
Property Value by Mortgage Status in Mineral
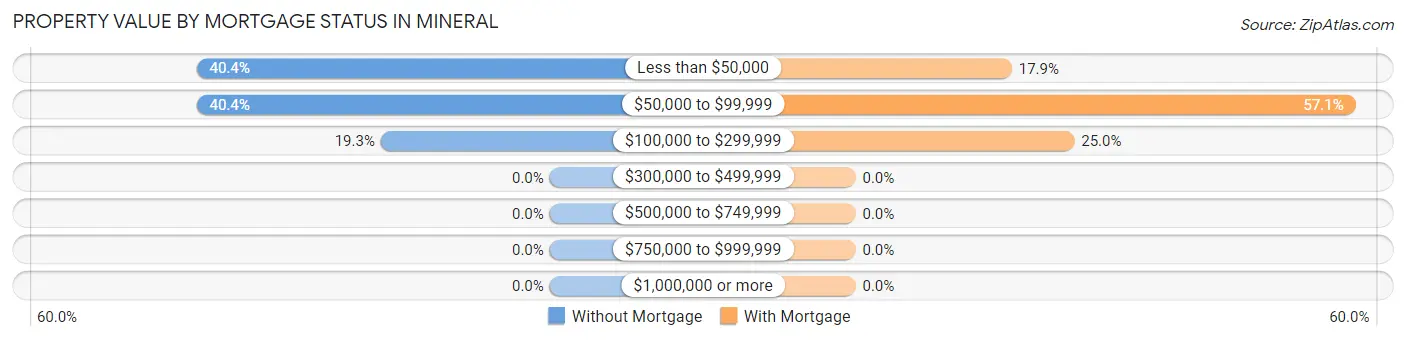
| Property Value | Without Mortgage | With Mortgage |
| Less than $50,000 | 23 (40.4%) | 5 (17.9%) |
| $50,000 to $99,999 | 23 (40.4%) | 16 (57.1%) |
| $100,000 to $299,999 | 11 (19.3%) | 7 (25.0%) |
| $300,000 to $499,999 | 0 (0.0%) | 0 (0.0%) |
| $500,000 to $749,999 | 0 (0.0%) | 0 (0.0%) |
| $750,000 to $999,999 | 0 (0.0%) | 0 (0.0%) |
| $1,000,000 or more | 0 (0.0%) | 0 (0.0%) |
| Total | 57 (100.0%) | 28 (100.0%) |
Household Income by Mortgage Status in Mineral
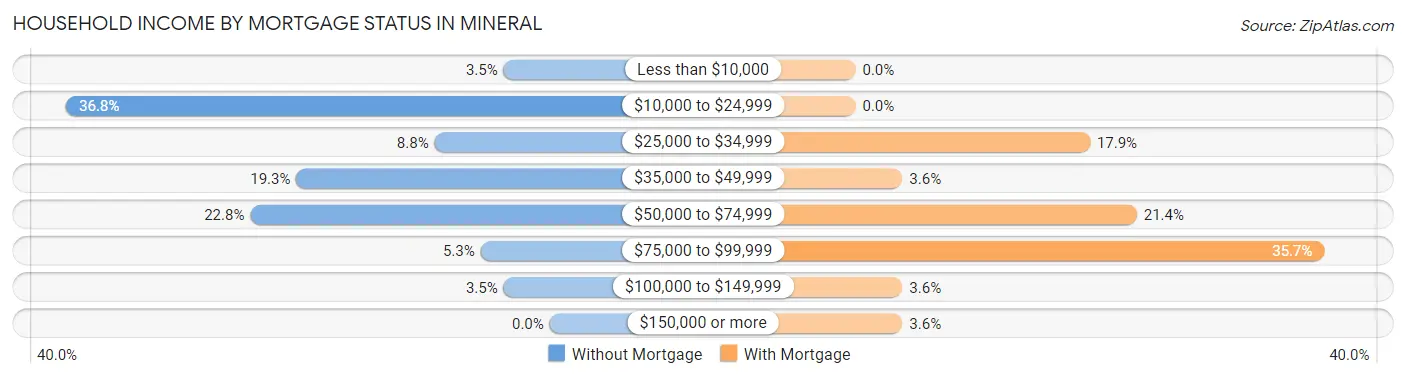
| Household Income | Without Mortgage | With Mortgage |
| Less than $10,000 | 2 (3.5%) | 0 (0.0%) |
| $10,000 to $24,999 | 21 (36.8%) | 0 (0.0%) |
| $25,000 to $34,999 | 5 (8.8%) | 5 (17.9%) |
| $35,000 to $49,999 | 11 (19.3%) | 1 (3.6%) |
| $50,000 to $74,999 | 13 (22.8%) | 6 (21.4%) |
| $75,000 to $99,999 | 3 (5.3%) | 10 (35.7%) |
| $100,000 to $149,999 | 2 (3.5%) | 1 (3.6%) |
| $150,000 or more | 0 (0.0%) | 1 (3.6%) |
| Total | 57 (100.0%) | 28 (100.0%) |
Property Value to Household Income Ratio in Mineral
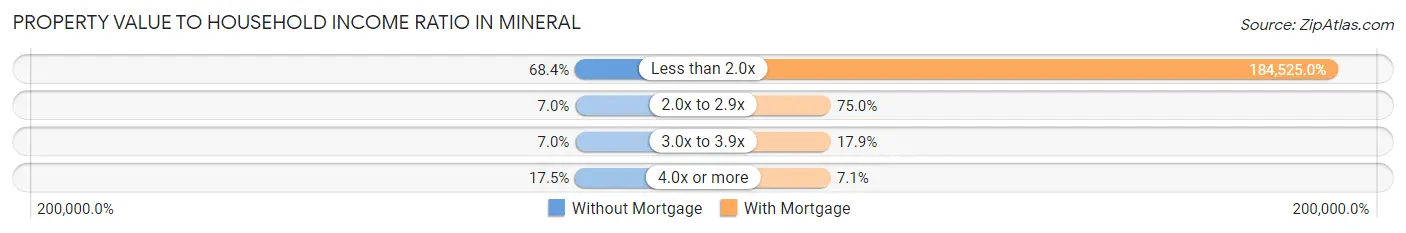
| Value-to-Income Ratio | Without Mortgage | With Mortgage |
| Less than 2.0x | 39 (68.4%) | 51,667 (184,525.0%) |
| 2.0x to 2.9x | 4 (7.0%) | 21 (75.0%) |
| 3.0x to 3.9x | 4 (7.0%) | 5 (17.9%) |
| 4.0x or more | 10 (17.5%) | 2 (7.1%) |
| Total | 57 (100.0%) | 28 (100.0%) |
Real Estate Taxes by Mortgage Status in Mineral
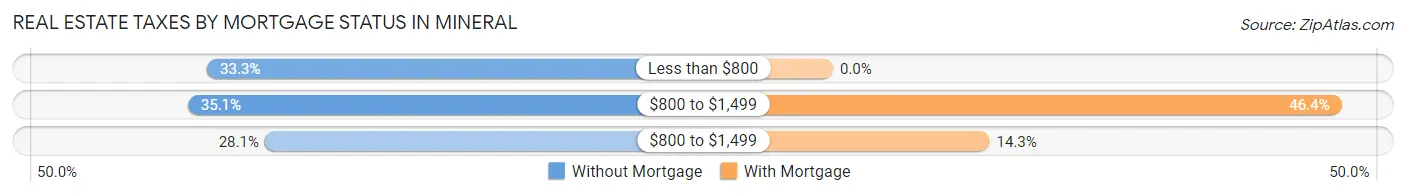
| Property Taxes | Without Mortgage | With Mortgage |
| Less than $800 | 19 (33.3%) | 0 (0.0%) |
| $800 to $1,499 | 20 (35.1%) | 13 (46.4%) |
| $800 to $1,499 | 16 (28.1%) | 4 (14.3%) |
| Total | 57 (100.0%) | 28 (100.0%) |
Health & Disability in Mineral
Health Insurance Coverage by Age in Mineral
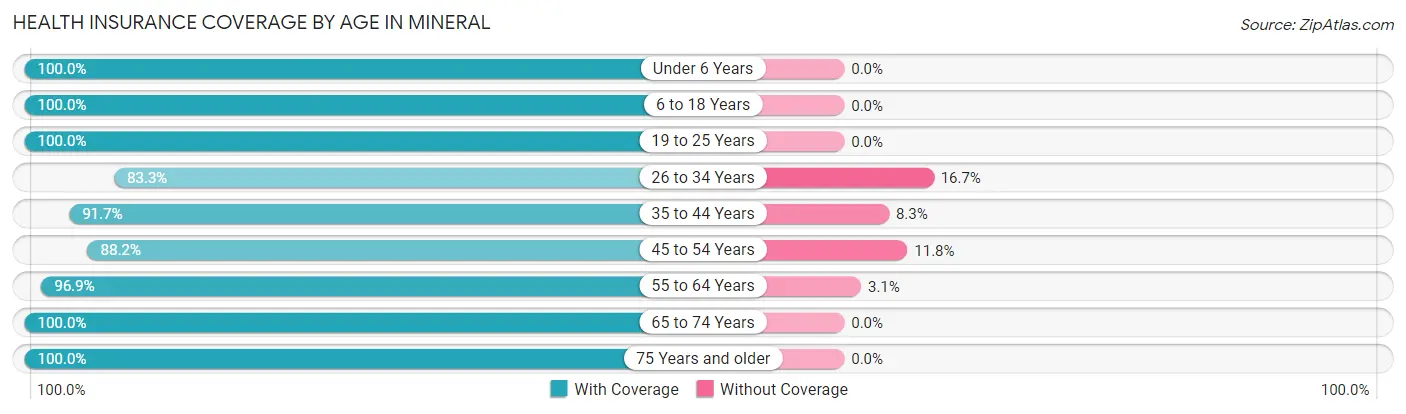
| Age Bracket | With Coverage | Without Coverage |
| Under 6 Years | 1 (100.0%) | 0 (0.0%) |
| 6 to 18 Years | 28 (100.0%) | 0 (0.0%) |
| 19 to 25 Years | 23 (100.0%) | 0 (0.0%) |
| 26 to 34 Years | 5 (83.3%) | 1 (16.7%) |
| 35 to 44 Years | 22 (91.7%) | 2 (8.3%) |
| 45 to 54 Years | 15 (88.2%) | 2 (11.8%) |
| 55 to 64 Years | 31 (96.9%) | 1 (3.1%) |
| 65 to 74 Years | 18 (100.0%) | 0 (0.0%) |
| 75 Years and older | 19 (100.0%) | 0 (0.0%) |
| Total | 162 (96.4%) | 6 (3.6%) |
Health Insurance Coverage by Citizenship Status in Mineral
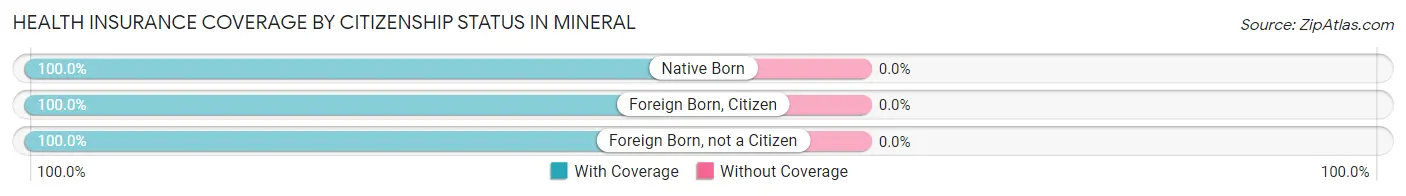
| Citizenship Status | With Coverage | Without Coverage |
| Native Born | 1 (100.0%) | 0 (0.0%) |
| Foreign Born, Citizen | 28 (100.0%) | 0 (0.0%) |
| Foreign Born, not a Citizen | 23 (100.0%) | 0 (0.0%) |
Health Insurance Coverage by Household Income in Mineral
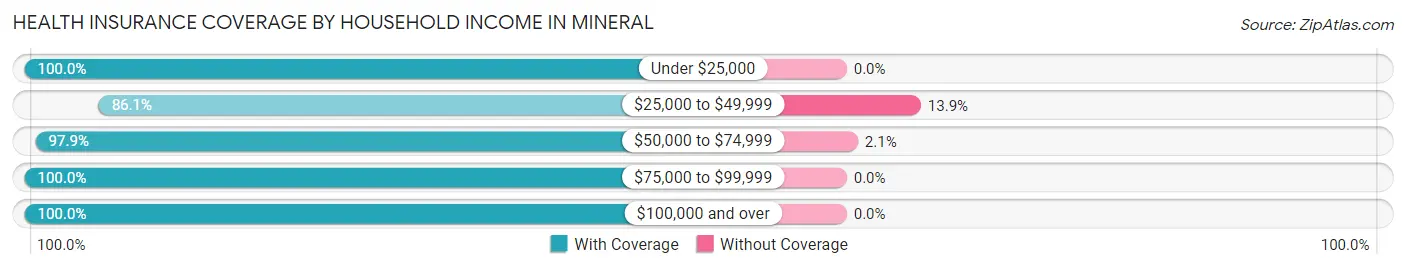
| Household Income | With Coverage | Without Coverage |
| Under $25,000 | 49 (100.0%) | 0 (0.0%) |
| $25,000 to $49,999 | 31 (86.1%) | 5 (13.9%) |
| $50,000 to $74,999 | 47 (97.9%) | 1 (2.1%) |
| $75,000 to $99,999 | 10 (100.0%) | 0 (0.0%) |
| $100,000 and over | 25 (100.0%) | 0 (0.0%) |
Public vs Private Health Insurance Coverage by Age in Mineral
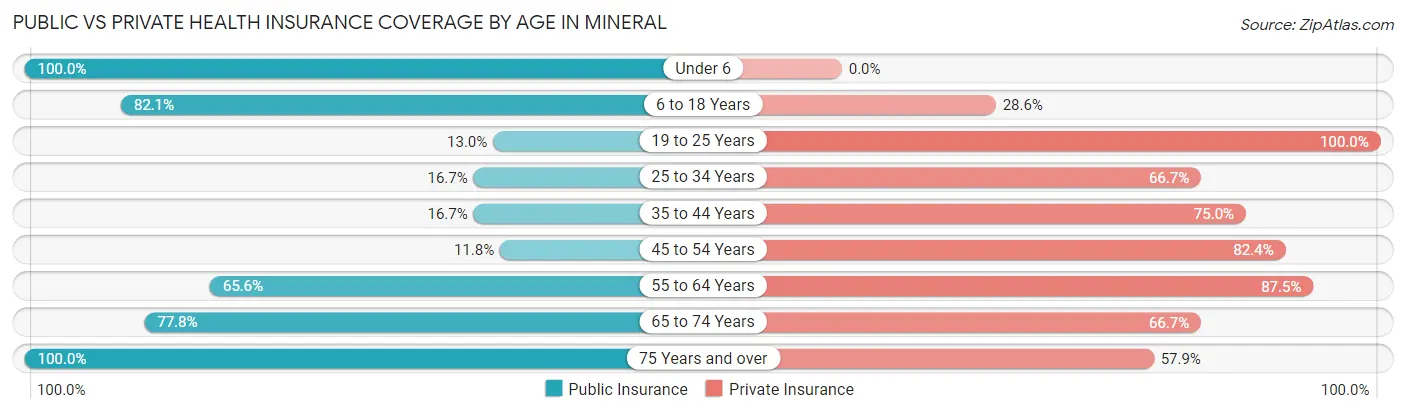
| Age Bracket | Public Insurance | Private Insurance |
| Under 6 | 1 (100.0%) | 0 (0.0%) |
| 6 to 18 Years | 23 (82.1%) | 8 (28.6%) |
| 19 to 25 Years | 3 (13.0%) | 23 (100.0%) |
| 25 to 34 Years | 1 (16.7%) | 4 (66.7%) |
| 35 to 44 Years | 4 (16.7%) | 18 (75.0%) |
| 45 to 54 Years | 2 (11.8%) | 14 (82.4%) |
| 55 to 64 Years | 21 (65.6%) | 28 (87.5%) |
| 65 to 74 Years | 14 (77.8%) | 12 (66.7%) |
| 75 Years and over | 19 (100.0%) | 11 (57.9%) |
| Total | 88 (52.4%) | 118 (70.2%) |
Disability Status by Sex by Age in Mineral
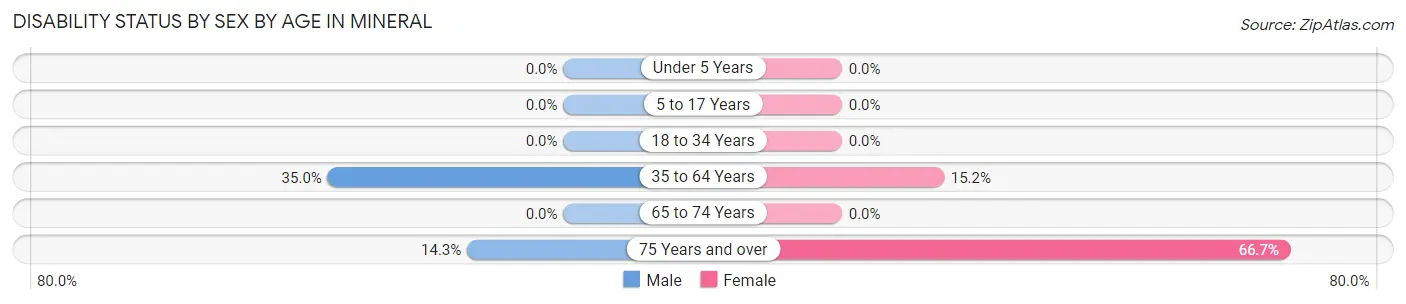
| Age Bracket | Male | Female |
| Under 5 Years | 0 (0.0%) | 0 (0.0%) |
| 5 to 17 Years | 0 (0.0%) | 0 (0.0%) |
| 18 to 34 Years | 0 (0.0%) | 0 (0.0%) |
| 35 to 64 Years | 14 (35.0%) | 5 (15.1%) |
| 65 to 74 Years | 0 (0.0%) | 0 (0.0%) |
| 75 Years and over | 1 (14.3%) | 8 (66.7%) |
Disability Class by Sex by Age in Mineral
Disability Class: Hearing Difficulty
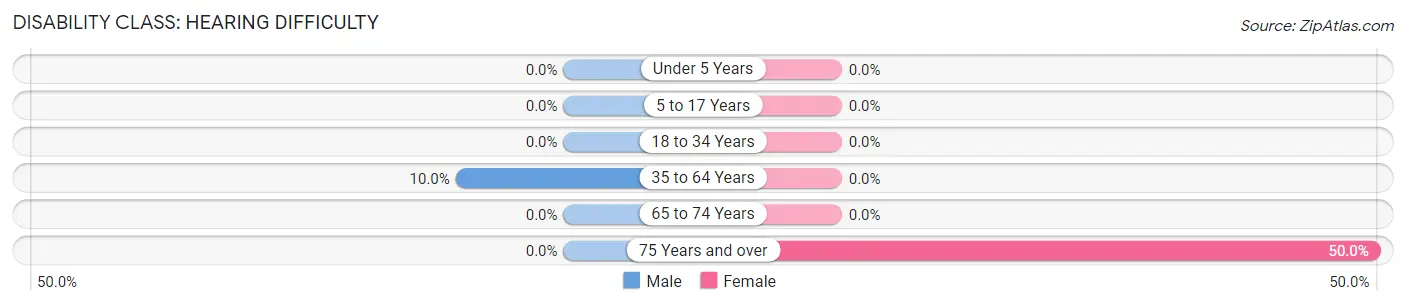
| Age Bracket | Male | Female |
| Under 5 Years | 0 (0.0%) | 0 (0.0%) |
| 5 to 17 Years | 0 (0.0%) | 0 (0.0%) |
| 18 to 34 Years | 0 (0.0%) | 0 (0.0%) |
| 35 to 64 Years | 4 (10.0%) | 0 (0.0%) |
| 65 to 74 Years | 0 (0.0%) | 0 (0.0%) |
| 75 Years and over | 0 (0.0%) | 6 (50.0%) |
Disability Class: Vision Difficulty
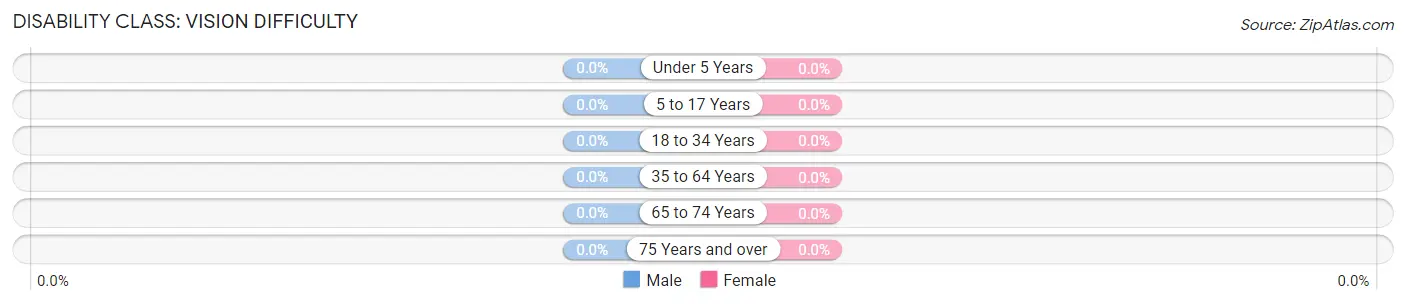
| Age Bracket | Male | Female |
| Under 5 Years | 0 (0.0%) | 0 (0.0%) |
| 5 to 17 Years | 0 (0.0%) | 0 (0.0%) |
| 18 to 34 Years | 0 (0.0%) | 0 (0.0%) |
| 35 to 64 Years | 0 (0.0%) | 0 (0.0%) |
| 65 to 74 Years | 0 (0.0%) | 0 (0.0%) |
| 75 Years and over | 0 (0.0%) | 0 (0.0%) |
Disability Class: Cognitive Difficulty
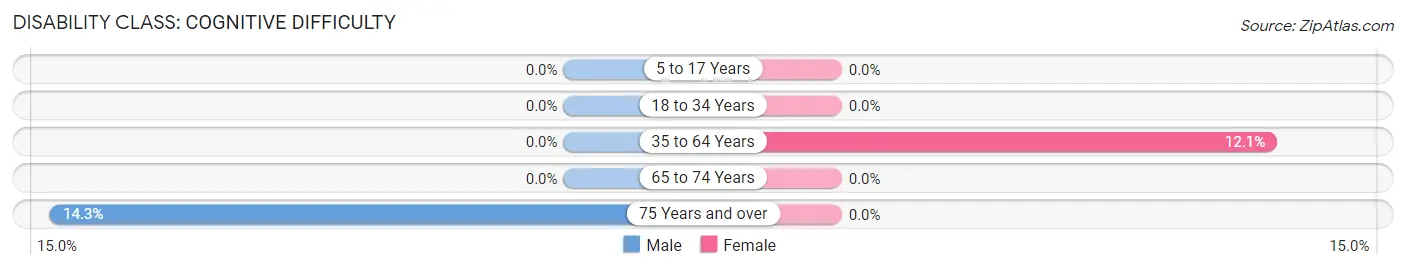
| Age Bracket | Male | Female |
| 5 to 17 Years | 0 (0.0%) | 0 (0.0%) |
| 18 to 34 Years | 0 (0.0%) | 0 (0.0%) |
| 35 to 64 Years | 0 (0.0%) | 4 (12.1%) |
| 65 to 74 Years | 0 (0.0%) | 0 (0.0%) |
| 75 Years and over | 1 (14.3%) | 0 (0.0%) |
Disability Class: Ambulatory Difficulty
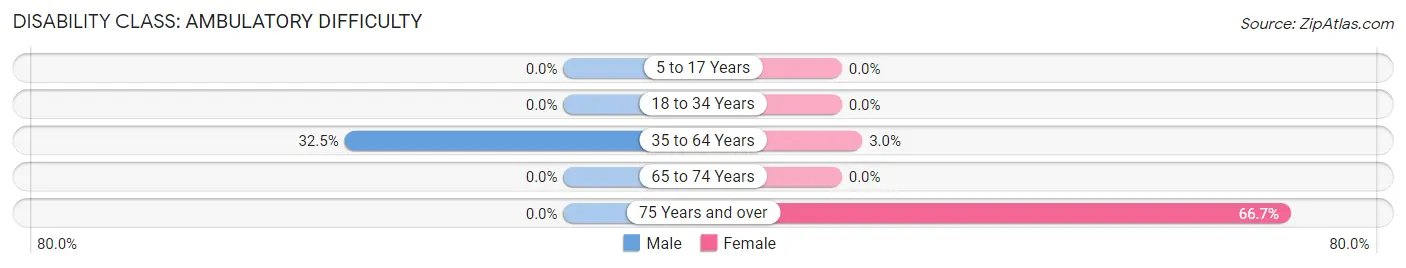
| Age Bracket | Male | Female |
| 5 to 17 Years | 0 (0.0%) | 0 (0.0%) |
| 18 to 34 Years | 0 (0.0%) | 0 (0.0%) |
| 35 to 64 Years | 13 (32.5%) | 1 (3.0%) |
| 65 to 74 Years | 0 (0.0%) | 0 (0.0%) |
| 75 Years and over | 0 (0.0%) | 8 (66.7%) |
Disability Class: Self-Care Difficulty
| Age Bracket | Male | Female |
| 5 to 17 Years | 0 (0.0%) | 0 (0.0%) |
| 18 to 34 Years | 0 (0.0%) | 0 (0.0%) |
| 35 to 64 Years | 0 (0.0%) | 0 (0.0%) |
| 65 to 74 Years | 0 (0.0%) | 0 (0.0%) |
| 75 Years and over | 0 (0.0%) | 0 (0.0%) |
Technology Access in Mineral
Computing Device Access in Mineral
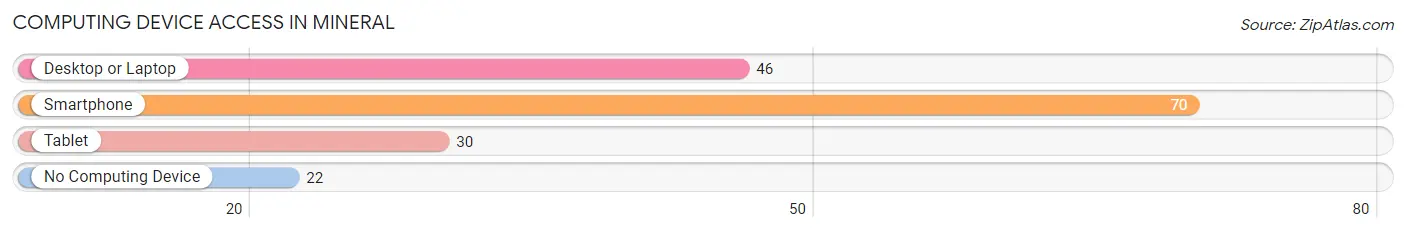
| Device Type | # Households | % Households |
| Desktop or Laptop | 46 | 48.9% |
| Smartphone | 70 | 74.5% |
| Tablet | 30 | 31.9% |
| No Computing Device | 22 | 23.4% |
| Total | 94 | 100.0% |
Internet Access in Mineral
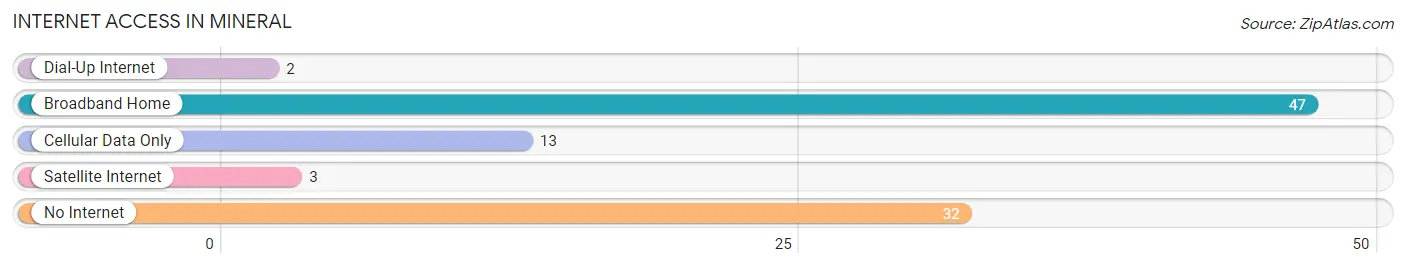
| Internet Type | # Households | % Households |
| Dial-Up Internet | 2 | 2.1% |
| Broadband Home | 47 | 50.0% |
| Cellular Data Only | 13 | 13.8% |
| Satellite Internet | 3 | 3.2% |
| No Internet | 32 | 34.0% |
| Total | 94 | 100.0% |
Mineral Summary
Mineral, Illinois is a small village located in LaSalle County, Illinois. It is situated on the banks of the Vermilion River, approximately 10 miles south of Ottawa, the county seat. The village has a population of approximately 500 people and covers an area of 0.6 square miles.
History
The area that is now Mineral was first settled in the early 1800s by French-Canadian fur traders. The village was originally known as “La Prairie” and was located on the banks of the Vermilion River. In 1837, the village was renamed “Mineral” after the discovery of lead ore in the area. The lead ore was mined and used to make ammunition for the Union Army during the Civil War.
In 1867, the Chicago, Burlington & Quincy Railroad was built through Mineral, connecting it to the larger cities of Chicago and St. Louis. This allowed the village to become a major shipping center for the surrounding area. The railroad also brought new settlers to the area, and the population of Mineral began to grow.
In the late 1800s, Mineral became a popular tourist destination due to its proximity to the Vermilion River. The village was home to several resorts and hotels, as well as a casino. The casino was eventually closed in the early 1900s due to gambling laws.
Geography
Mineral is located in LaSalle County, Illinois. It is situated on the banks of the Vermilion River, approximately 10 miles south of Ottawa, the county seat. The village has a total area of 0.6 square miles, all of which is land.
The village is located in a rural area, surrounded by farmland and woodlands. The Vermilion River runs through the village, providing a scenic backdrop. The village is also located near several state parks, including Starved Rock State Park and Matthiessen State Park.
Economy
The economy of Mineral is largely based on agriculture and tourism. The village is home to several farms, which produce a variety of crops, including corn, soybeans, and wheat. The village is also home to several tourist attractions, including the Vermilion River, Starved Rock State Park, and Matthiessen State Park.
The village is also home to several small businesses, including restaurants, shops, and a grocery store. The village is also home to a post office and a bank.
Demographics
As of the 2010 census, the population of Mineral was 498. The racial makeup of the village was 97.2% White, 0.2% African American, 0.2% Native American, 0.4% Asian, 0.2% from other races, and 1.9% from two or more races. Hispanic or Latino of any race were 1.2% of the population.
The median household income in Mineral was $45,000, and the median family income was $50,000. The per capita income for the village was $20,000. About 8.3% of families and 10.2% of the population were below the poverty line, including 11.3% of those under age 18 and 8.3% of those age 65 or over.
Common Questions
What is Per Capita Income in Mineral?
Per Capita income in Mineral is $27,123.
What is the Median Family Income in Mineral?
Median Family Income in Mineral is $63,750.
What is the Median Household income in Mineral?
Median Household Income in Mineral is $40,833.
What is Income or Wage Gap in Mineral?
Income or Wage Gap in Mineral is 63.6%.
Women in Mineral earn 36.4 cents for every dollar earned by a man.
What is Inequality or Gini Index in Mineral?
Inequality or Gini Index in Mineral is 0.41.
What is the Total Population of Mineral?
Total Population of Mineral is 168.
What is the Total Male Population of Mineral?
Total Male Population of Mineral is 98.
What is the Total Female Population of Mineral?
Total Female Population of Mineral is 70.
What is the Ratio of Males per 100 Females in Mineral?
There are 140.00 Males per 100 Females in Mineral.
What is the Ratio of Females per 100 Males in Mineral?
There are 71.43 Females per 100 Males in Mineral.
What is the Median Population Age in Mineral?
Median Population Age in Mineral is 45.4 Years.
What is the Average Family Size in Mineral
Average Family Size in Mineral is 2.7 People.
What is the Average Household Size in Mineral
Average Household Size in Mineral is 1.8 People.
How Large is the Labor Force in Mineral?
There are 100 People in the Labor Forcein in Mineral.
What is the Percentage of People in the Labor Force in Mineral?
68.5% of People are in the Labor Force in Mineral.
What is the Unemployment Rate in Mineral?
Unemployment Rate in Mineral is 4.0%.