Metropolis, IL Map & Demographics
Metropolis Map
Metropolis Overview
$23,370
PER CAPITA INCOME
$55,237
AVG FAMILY INCOME
$46,397
AVG HOUSEHOLD INCOME
37.4%
WAGE / INCOME GAP [ % ]
62.6¢/ $1
WAGE / INCOME GAP [ $ ]
$8,459
FAMILY INCOME DEFICIT
0.38
INEQUALITY / GINI INDEX
5,963
TOTAL POPULATION
2,625
MALE POPULATION
3,338
FEMALE POPULATION
78.64
MALES / 100 FEMALES
127.16
FEMALES / 100 MALES
43.9
MEDIAN AGE
3.0
AVG FAMILY SIZE
2.3
AVG HOUSEHOLD SIZE
2,220
LABOR FORCE [ PEOPLE ]
46.1%
PERCENT IN LABOR FORCE
2.2%
UNEMPLOYMENT RATE
Metropolis Zip Codes
Metropolis Area Codes
Income in Metropolis
Income Overview in Metropolis
Per Capita Income in Metropolis is $23,370, while median incomes of families and households are $55,237 and $46,397 respectively.
| Characteristic | Number | Measure |
| Per Capita Income | 5,963 | $23,370 |
| Median Family Income | 1,515 | $55,237 |
| Mean Family Income | 1,515 | $65,876 |
| Median Household Income | 2,469 | $46,397 |
| Mean Household Income | 2,469 | $55,340 |
| Income Deficit | 1,515 | $8,459 |
| Wage / Income Gap (%) | 5,963 | 37.36% |
| Wage / Income Gap ($) | 5,963 | 62.64¢ per $1 |
| Gini / Inequality Index | 5,963 | 0.38 |
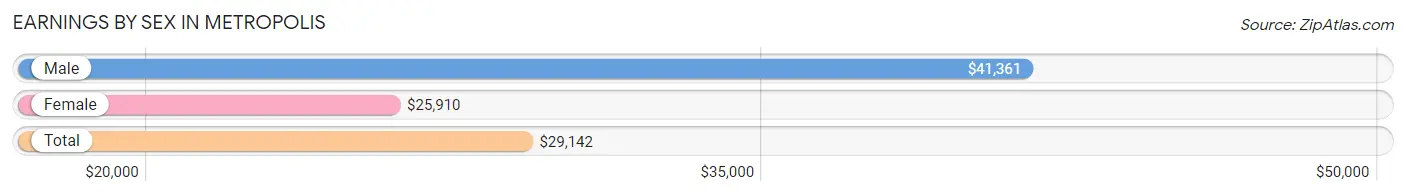
Earnings by Sex in Metropolis
Average Earnings in Metropolis are $29,142, $41,361 for men and $25,910 for women, a difference of 37.4%.
| Sex | Number | Average Earnings |
| Male | 1,041 (45.1%) | $41,361 |
| Female | 1,269 (54.9%) | $25,910 |
| Total | 2,310 (100.0%) | $29,142 |
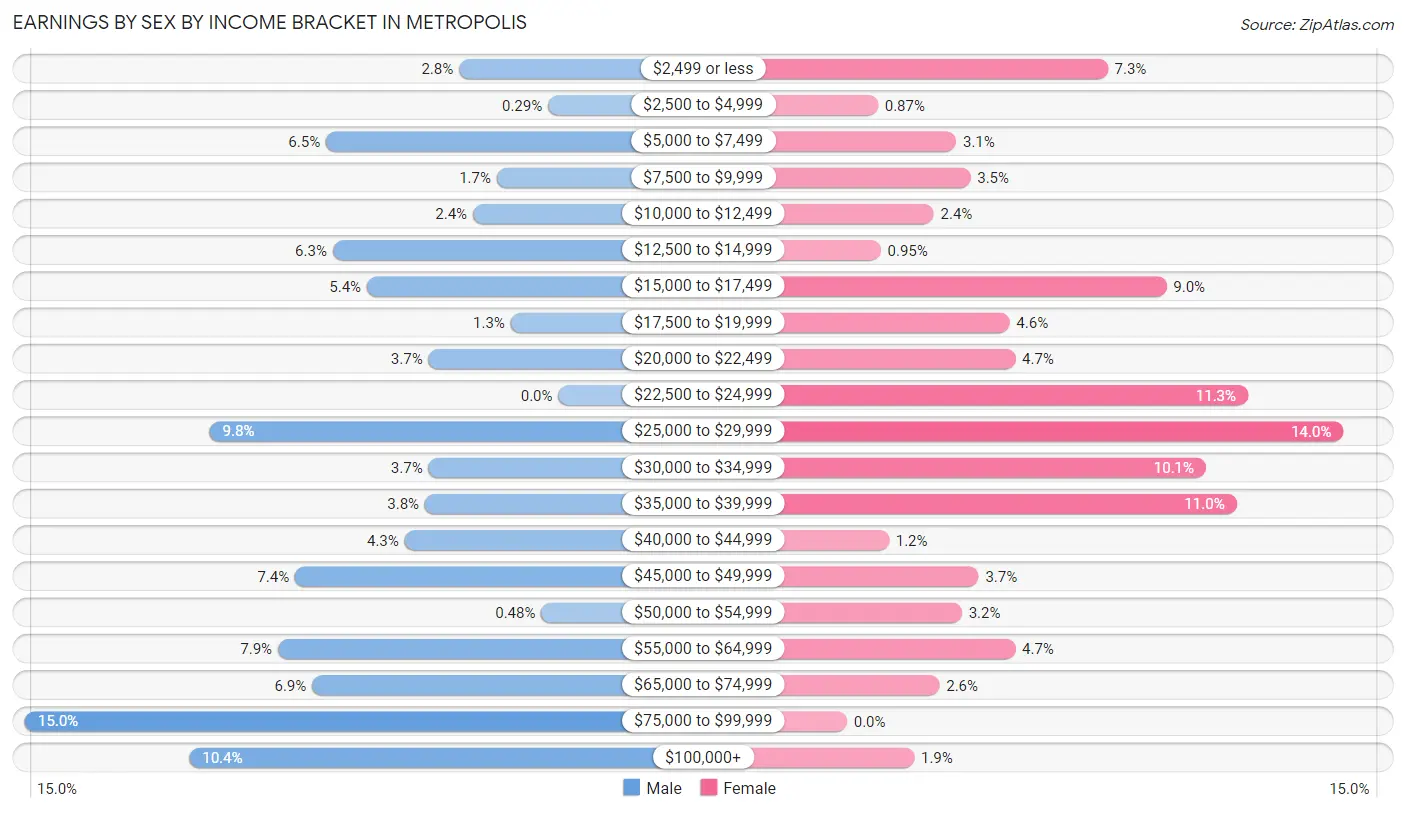
Earnings by Sex by Income Bracket in Metropolis
The most common earnings brackets in Metropolis are $75,000 to $99,999 for men (156 | 15.0%) and $25,000 to $29,999 for women (177 | 14.0%).
| Income | Male | Female |
| $2,499 or less | 29 (2.8%) | 93 (7.3%) |
| $2,500 to $4,999 | 3 (0.3%) | 11 (0.9%) |
| $5,000 to $7,499 | 68 (6.5%) | 39 (3.1%) |
| $7,500 to $9,999 | 18 (1.7%) | 44 (3.5%) |
| $10,000 to $12,499 | 25 (2.4%) | 31 (2.4%) |
| $12,500 to $14,999 | 66 (6.3%) | 12 (0.9%) |
| $15,000 to $17,499 | 56 (5.4%) | 114 (9.0%) |
| $17,500 to $19,999 | 14 (1.3%) | 58 (4.6%) |
| $20,000 to $22,499 | 38 (3.6%) | 60 (4.7%) |
| $22,500 to $24,999 | 0 (0.0%) | 143 (11.3%) |
| $25,000 to $29,999 | 102 (9.8%) | 177 (14.0%) |
| $30,000 to $34,999 | 38 (3.6%) | 128 (10.1%) |
| $35,000 to $39,999 | 39 (3.7%) | 139 (11.0%) |
| $40,000 to $44,999 | 45 (4.3%) | 15 (1.2%) |
| $45,000 to $49,999 | 77 (7.4%) | 47 (3.7%) |
| $50,000 to $54,999 | 5 (0.5%) | 41 (3.2%) |
| $55,000 to $64,999 | 82 (7.9%) | 60 (4.7%) |
| $65,000 to $74,999 | 72 (6.9%) | 33 (2.6%) |
| $75,000 to $99,999 | 156 (15.0%) | 0 (0.0%) |
| $100,000+ | 108 (10.4%) | 24 (1.9%) |
| Total | 1,041 (100.0%) | 1,269 (100.0%) |
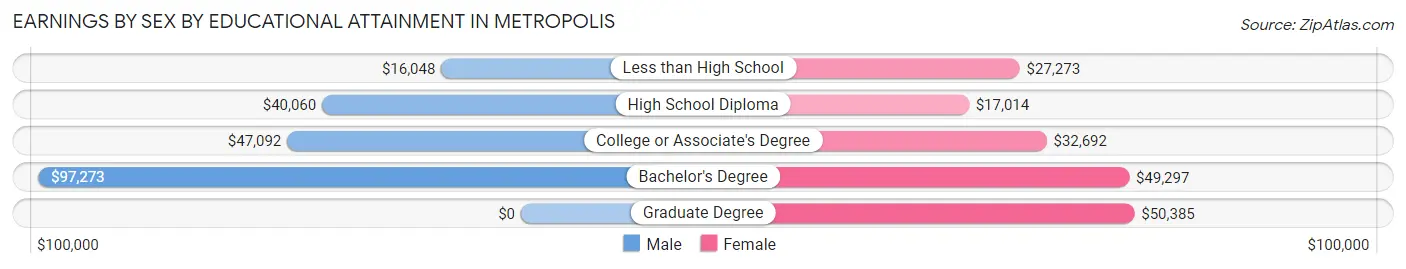
Earnings by Sex by Educational Attainment in Metropolis
Average earnings in Metropolis are $46,681 for men and $28,008 for women, a difference of 40.0%. Men with an educational attainment of bachelor's degree enjoy the highest average annual earnings of $97,273, while those with less than high school education earn the least with $16,048. Women with an educational attainment of graduate degree earn the most with the average annual earnings of $50,385, while those with high school diploma education have the smallest earnings of $17,014.
| Educational Attainment | Male Income | Female Income |
| Less than High School | $16,048 | $27,273 |
| High School Diploma | $40,060 | $17,014 |
| College or Associate's Degree | $47,092 | $32,692 |
| Bachelor's Degree | $97,273 | $49,297 |
| Graduate Degree | - | - |
| Total | $46,681 | $28,008 |
Family Income in Metropolis
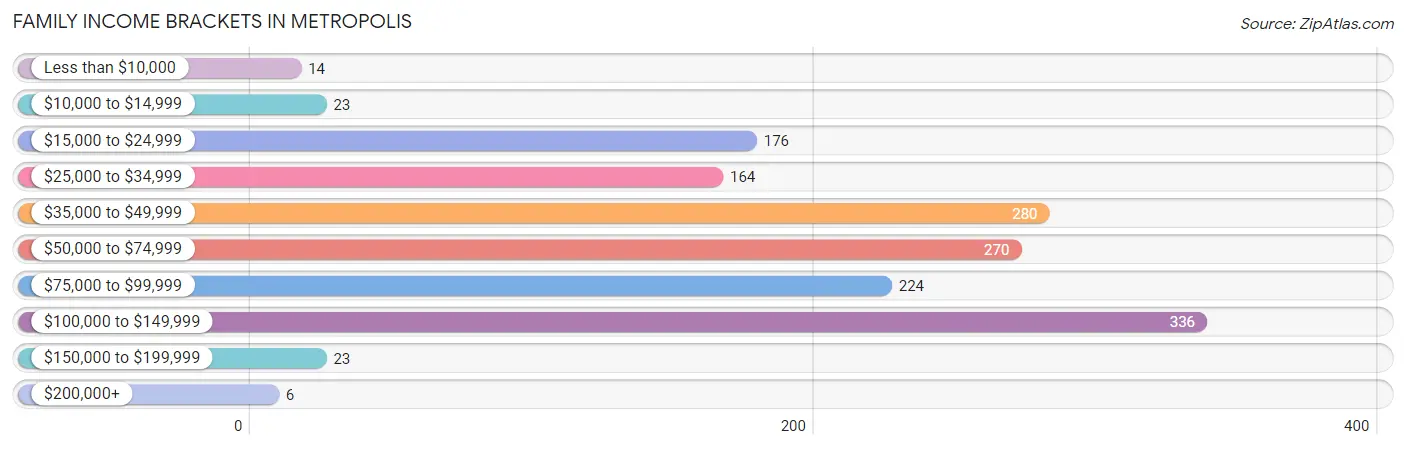
Family Income Brackets in Metropolis
According to the Metropolis family income data, there are 336 families falling into the $100,000 to $149,999 income range, which is the most common income bracket and makes up 22.2% of all families. Conversely, the $200,000+ income bracket is the least frequent group with only 6 families (0.4%) belonging to this category.
| Income Bracket | # Families | % Families |
| Less than $10,000 | 14 | 0.9% |
| $10,000 to $14,999 | 23 | 1.5% |
| $15,000 to $24,999 | 176 | 11.6% |
| $25,000 to $34,999 | 164 | 10.8% |
| $35,000 to $49,999 | 280 | 18.5% |
| $50,000 to $74,999 | 270 | 17.8% |
| $75,000 to $99,999 | 224 | 14.8% |
| $100,000 to $149,999 | 336 | 22.2% |
| $150,000 to $199,999 | 23 | 1.5% |
| $200,000+ | 6 | 0.4% |
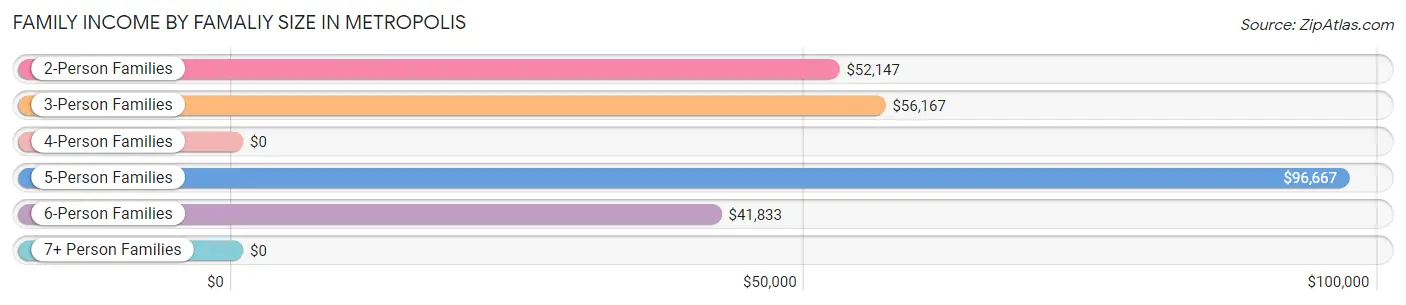
Family Income by Famaliy Size in Metropolis
5-person families (158 | 10.4%) account for the highest median family income in Metropolis with $96,667 per family, while 2-person families (743 | 49.0%) have the highest median income of $26,074 per family member.
| Income Bracket | # Families | Median Income |
| 2-Person Families | 743 (49.0%) | $52,147 |
| 3-Person Families | 350 (23.1%) | $56,167 |
| 4-Person Families | 220 (14.5%) | $0 |
| 5-Person Families | 158 (10.4%) | $96,667 |
| 6-Person Families | 44 (2.9%) | $41,833 |
| 7+ Person Families | 0 (0.0%) | $0 |
| Total | 1,515 (100.0%) | $55,237 |
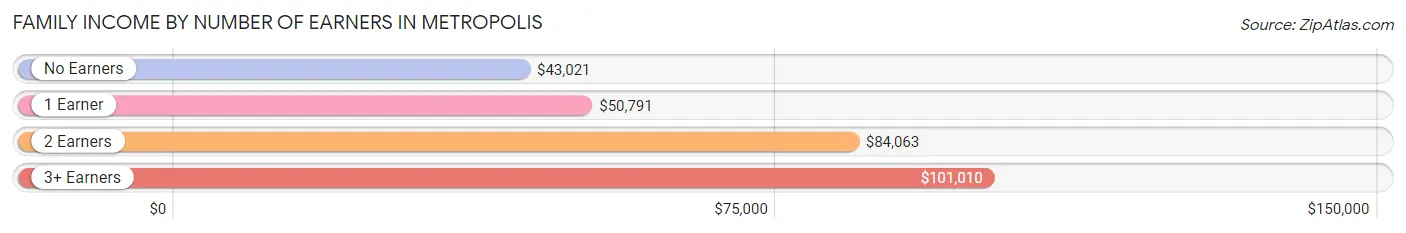
Family Income by Number of Earners in Metropolis
The median family income in Metropolis is $55,237, with families comprising 3+ earners (152) having the highest median family income of $101,010, while families with no earners (359) have the lowest median family income of $43,021, accounting for 10.0% and 23.7% of families, respectively.
| Number of Earners | # Families | Median Income |
| No Earners | 359 (23.7%) | $43,021 |
| 1 Earner | 697 (46.0%) | $50,791 |
| 2 Earners | 307 (20.3%) | $84,063 |
| 3+ Earners | 152 (10.0%) | $101,010 |
| Total | 1,515 (100.0%) | $55,237 |
Household Income in Metropolis
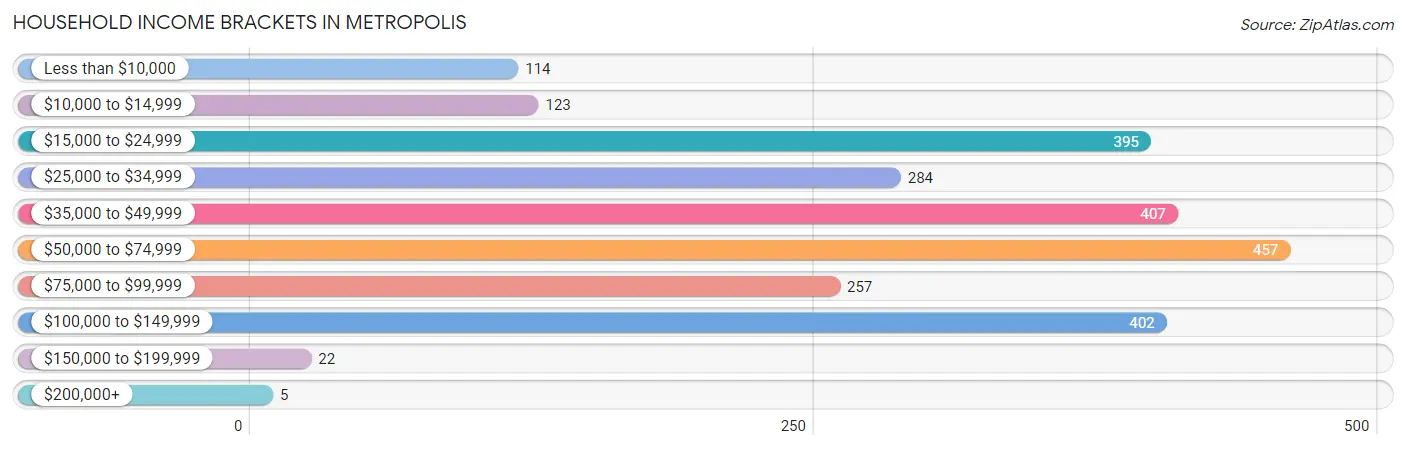
Household Income Brackets in Metropolis
With 457 households falling in the category, the $50,000 to $74,999 income range is the most frequent in Metropolis, accounting for 18.5% of all households. In contrast, only 5 households (0.2%) fall into the $200,000+ income bracket, making it the least populous group.
| Income Bracket | # Households | % Households |
| Less than $10,000 | 114 | 4.6% |
| $10,000 to $14,999 | 123 | 5.0% |
| $15,000 to $24,999 | 395 | 16.0% |
| $25,000 to $34,999 | 284 | 11.5% |
| $35,000 to $49,999 | 407 | 16.5% |
| $50,000 to $74,999 | 457 | 18.5% |
| $75,000 to $99,999 | 257 | 10.4% |
| $100,000 to $149,999 | 402 | 16.3% |
| $150,000 to $199,999 | 22 | 0.9% |
| $200,000+ | 5 | 0.2% |
Household Income by Householder Age in Metropolis
The median household income in Metropolis is $46,397, with the highest median household income of $50,918 found in the 25 to 44 years age bracket for the primary householder. A total of 770 households (31.2%) fall into this category. Meanwhile, the 15 to 24 years age bracket for the primary householder has the lowest median household income of $0, with 26 households (1.1%) in this group.
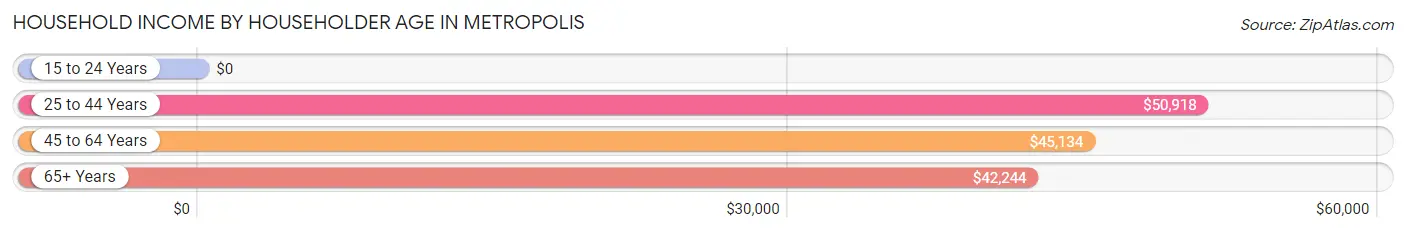
| Income Bracket | # Households | Median Income |
| 15 to 24 Years | 26 (1.1%) | $0 |
| 25 to 44 Years | 770 (31.2%) | $50,918 |
| 45 to 64 Years | 938 (38.0%) | $45,134 |
| 65+ Years | 735 (29.8%) | $42,244 |
| Total | 2,469 (100.0%) | $46,397 |
Poverty in Metropolis
Income Below Poverty by Sex and Age in Metropolis
With 10.7% poverty level for males and 12.7% for females among the residents of Metropolis, 35 to 44 year old males and 16 and 17 year old females are the most vulnerable to poverty, with 114 males (28.6%) and 20 females (74.1%) in their respective age groups living below the poverty level.
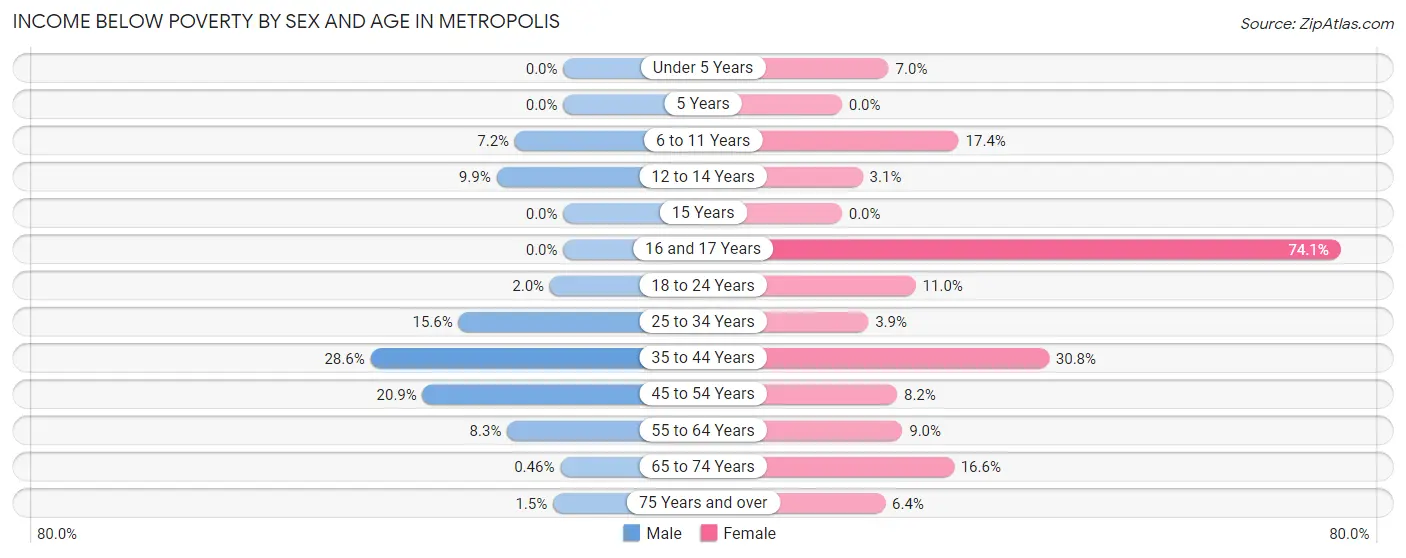
| Age Bracket | Male | Female |
| Under 5 Years | 0 (0.0%) | 11 (7.0%) |
| 5 Years | 0 (0.0%) | 0 (0.0%) |
| 6 to 11 Years | 12 (7.2%) | 51 (17.3%) |
| 12 to 14 Years | 15 (9.9%) | 4 (3.1%) |
| 15 Years | 0 (0.0%) | 0 (0.0%) |
| 16 and 17 Years | 0 (0.0%) | 20 (74.1%) |
| 18 to 24 Years | 4 (2.0%) | 17 (11.0%) |
| 25 to 34 Years | 35 (15.6%) | 14 (3.9%) |
| 35 to 44 Years | 114 (28.6%) | 127 (30.7%) |
| 45 to 54 Years | 56 (20.9%) | 36 (8.2%) |
| 55 to 64 Years | 35 (8.3%) | 38 (9.0%) |
| 65 to 74 Years | 1 (0.5%) | 55 (16.6%) |
| 75 Years and over | 4 (1.5%) | 24 (6.4%) |
| Total | 276 (10.7%) | 397 (12.7%) |
Income Above Poverty by Sex and Age in Metropolis
According to the poverty statistics in Metropolis, males aged under 5 years and females aged 5 years are the age groups that are most secure financially, with 100.0% of males and 100.0% of females in these age groups living above the poverty line.
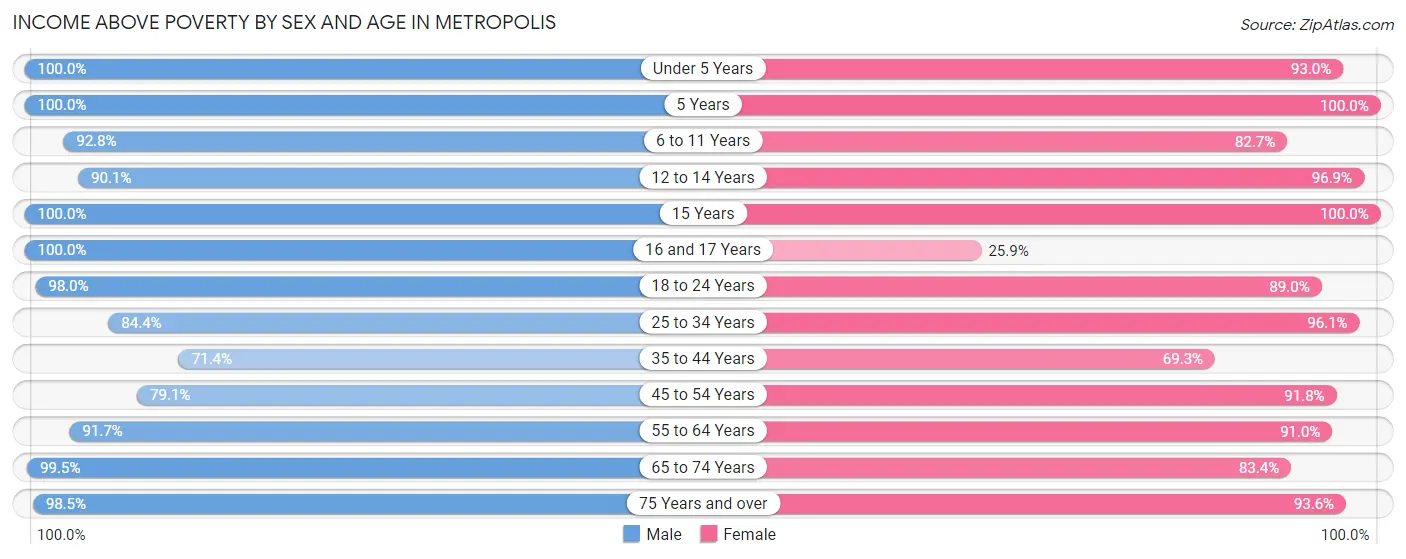
| Age Bracket | Male | Female |
| Under 5 Years | 108 (100.0%) | 147 (93.0%) |
| 5 Years | 32 (100.0%) | 13 (100.0%) |
| 6 to 11 Years | 155 (92.8%) | 243 (82.7%) |
| 12 to 14 Years | 136 (90.1%) | 125 (96.9%) |
| 15 Years | 43 (100.0%) | 12 (100.0%) |
| 16 and 17 Years | 98 (100.0%) | 7 (25.9%) |
| 18 to 24 Years | 197 (98.0%) | 138 (89.0%) |
| 25 to 34 Years | 190 (84.4%) | 343 (96.1%) |
| 35 to 44 Years | 284 (71.4%) | 286 (69.3%) |
| 45 to 54 Years | 212 (79.1%) | 403 (91.8%) |
| 55 to 64 Years | 385 (91.7%) | 385 (91.0%) |
| 65 to 74 Years | 215 (99.5%) | 276 (83.4%) |
| 75 Years and over | 257 (98.5%) | 349 (93.6%) |
| Total | 2,312 (89.3%) | 2,727 (87.3%) |
Income Below Poverty Among Married-Couple Families in Metropolis
The poverty statistics for married-couple families in Metropolis show that 6.1% or 72 of the total 1,172 families live below the poverty line. Families with 1 or 2 children have the highest poverty rate of 15.6%, comprising of 54 families. On the other hand, families with no children have the lowest poverty rate of 1.7%, which includes 12 families.
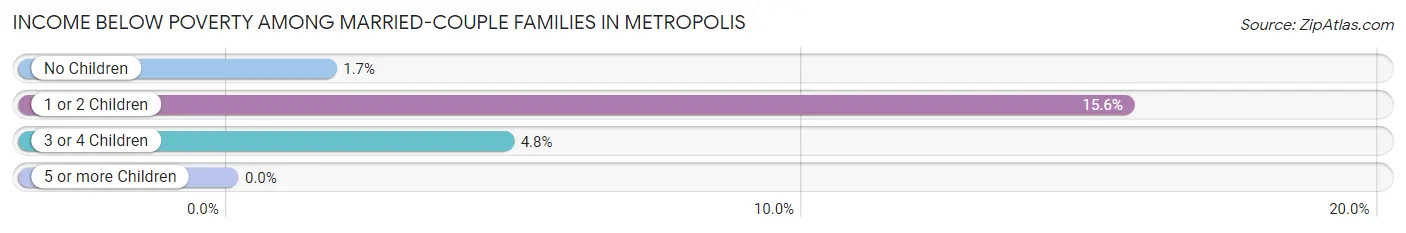
| Children | Above Poverty | Below Poverty |
| No Children | 689 (98.3%) | 12 (1.7%) |
| 1 or 2 Children | 292 (84.4%) | 54 (15.6%) |
| 3 or 4 Children | 119 (95.2%) | 6 (4.8%) |
| 5 or more Children | 0 (0.0%) | 0 (0.0%) |
| Total | 1,100 (93.9%) | 72 (6.1%) |
Income Below Poverty Among Single-Parent Households in Metropolis
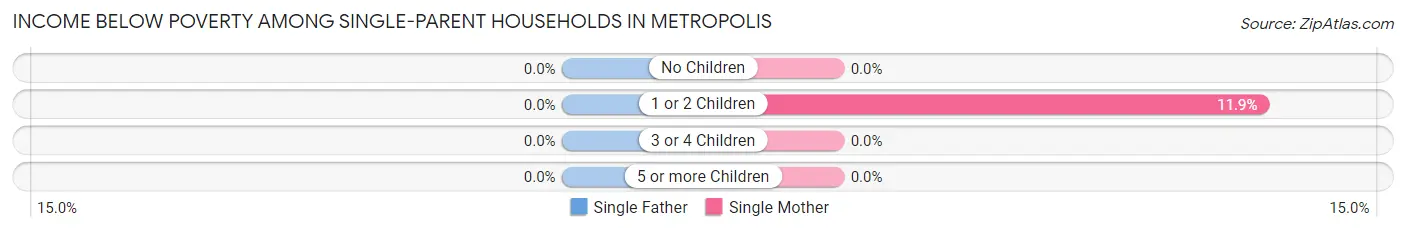
| Children | Single Father | Single Mother |
| No Children | 0 (0.0%) | 0 (0.0%) |
| 1 or 2 Children | 0 (0.0%) | 29 (11.9%) |
| 3 or 4 Children | 0 (0.0%) | 0 (0.0%) |
| 5 or more Children | 0 (0.0%) | 0 (0.0%) |
| Total | 0 (0.0%) | 29 (10.3%) |
Income Below Poverty Among Married-Couple vs Single-Parent Households in Metropolis
The poverty data for Metropolis shows that 72 of the married-couple family households (6.1%) and 29 of the single-parent households (8.5%) are living below the poverty level. Within the married-couple family households, those with 1 or 2 children have the highest poverty rate, with 54 households (15.6%) falling below the poverty line. Among the single-parent households, those with 1 or 2 children have the highest poverty rate, with 29 household (11.5%) living below poverty.
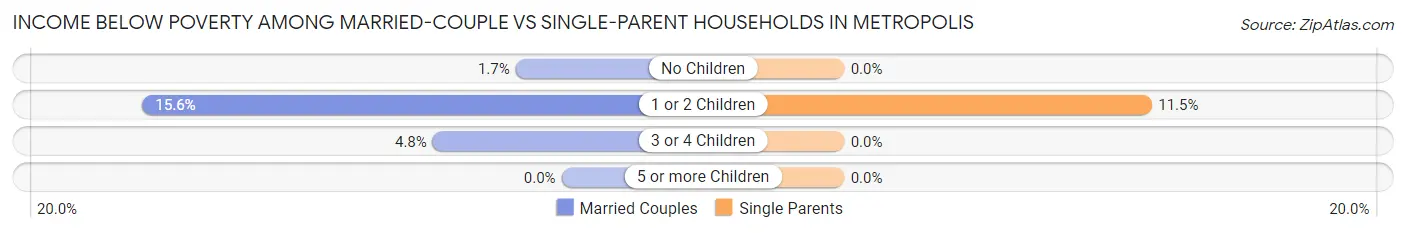
| Children | Married-Couple Families | Single-Parent Households |
| No Children | 12 (1.7%) | 0 (0.0%) |
| 1 or 2 Children | 54 (15.6%) | 29 (11.5%) |
| 3 or 4 Children | 6 (4.8%) | 0 (0.0%) |
| 5 or more Children | 0 (0.0%) | 0 (0.0%) |
| Total | 72 (6.1%) | 29 (8.5%) |
Race in Metropolis
The most populous races in Metropolis are White / Caucasian (5,270 | 88.4%), Black / African American (346 | 5.8%), and Two or more Races (274 | 4.6%).
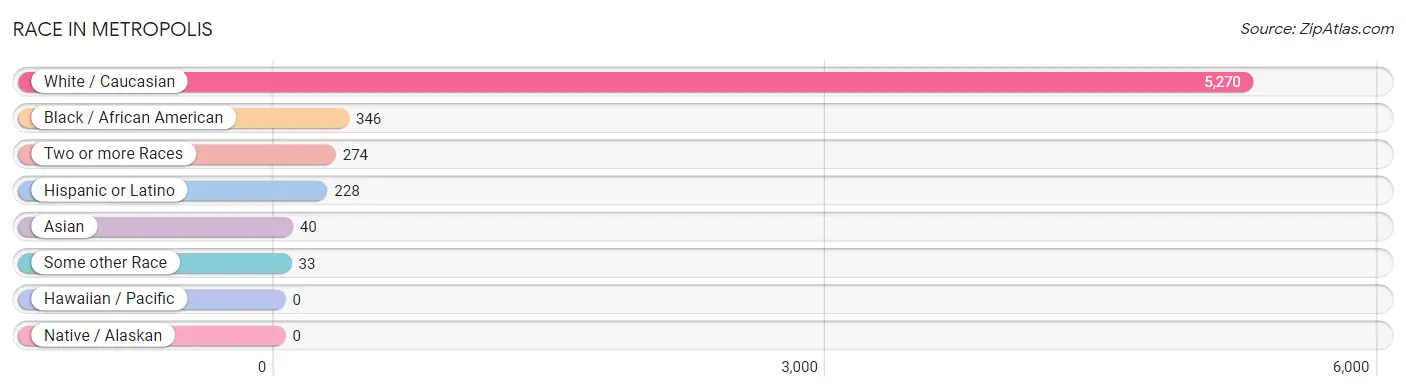
| Race | # Population | % Population |
| Asian | 40 | 0.7% |
| Black / African American | 346 | 5.8% |
| Hawaiian / Pacific | 0 | 0.0% |
| Hispanic or Latino | 228 | 3.8% |
| Native / Alaskan | 0 | 0.0% |
| White / Caucasian | 5,270 | 88.4% |
| Two or more Races | 274 | 4.6% |
| Some other Race | 33 | 0.5% |
| Total | 5,963 | 100.0% |
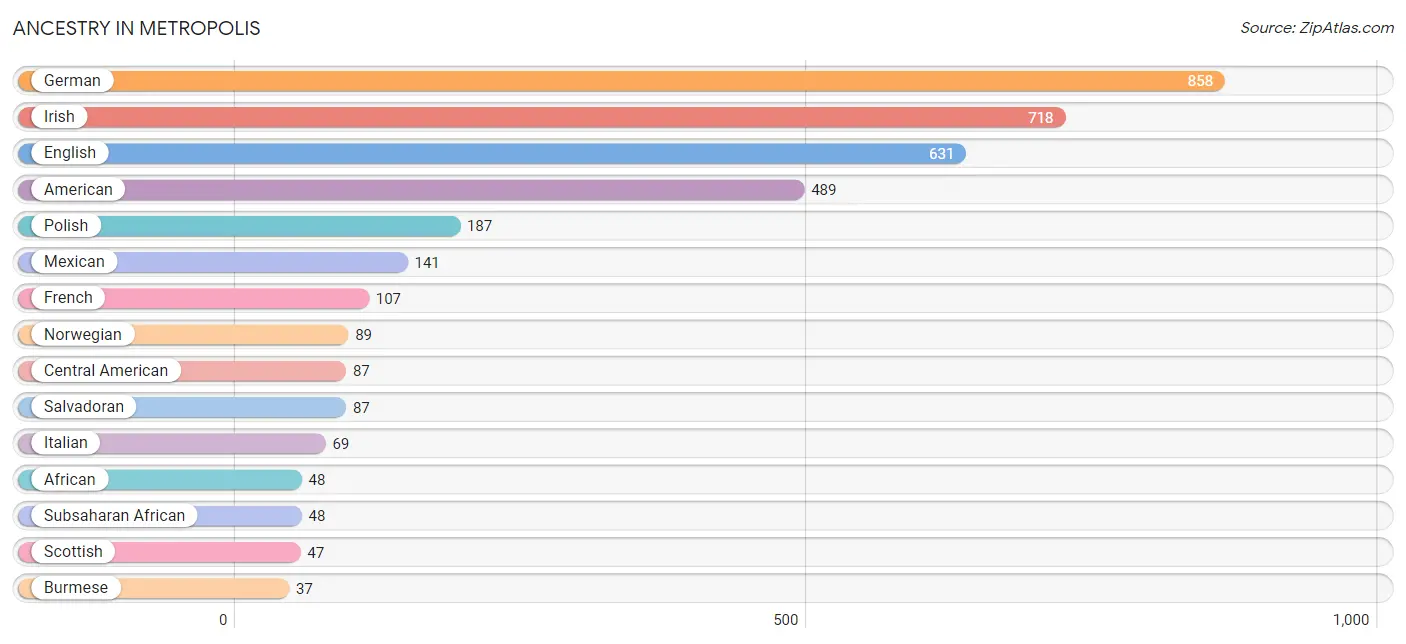
Ancestry in Metropolis
The most populous ancestries reported in Metropolis are German (858 | 14.4%), Irish (718 | 12.0%), English (631 | 10.6%), American (489 | 8.2%), and Polish (187 | 3.1%), together accounting for 48.3% of all Metropolis residents.
| Ancestry | # Population | % Population |
| African | 48 | 0.8% |
| American | 489 | 8.2% |
| Arab | 30 | 0.5% |
| Blackfeet | 6 | 0.1% |
| British | 20 | 0.3% |
| Burmese | 37 | 0.6% |
| Central American | 87 | 1.5% |
| Cherokee | 16 | 0.3% |
| Czech | 11 | 0.2% |
| Dutch | 16 | 0.3% |
| English | 631 | 10.6% |
| European | 33 | 0.5% |
| French | 107 | 1.8% |
| French Canadian | 28 | 0.5% |
| German | 858 | 14.4% |
| Hungarian | 37 | 0.6% |
| Indian (Asian) | 3 | 0.1% |
| Irish | 718 | 12.0% |
| Italian | 69 | 1.2% |
| Jordanian | 9 | 0.2% |
| Mexican | 141 | 2.4% |
| Norwegian | 89 | 1.5% |
| Palestinian | 21 | 0.4% |
| Polish | 187 | 3.1% |
| Salvadoran | 87 | 1.5% |
| Scandinavian | 9 | 0.2% |
| Scotch-Irish | 18 | 0.3% |
| Scottish | 47 | 0.8% |
| Subsaharan African | 48 | 0.8% |
| Swedish | 9 | 0.2% |
| Swiss | 13 | 0.2% |
| Yugoslavian | 4 | 0.1% | View All 32 Rows |
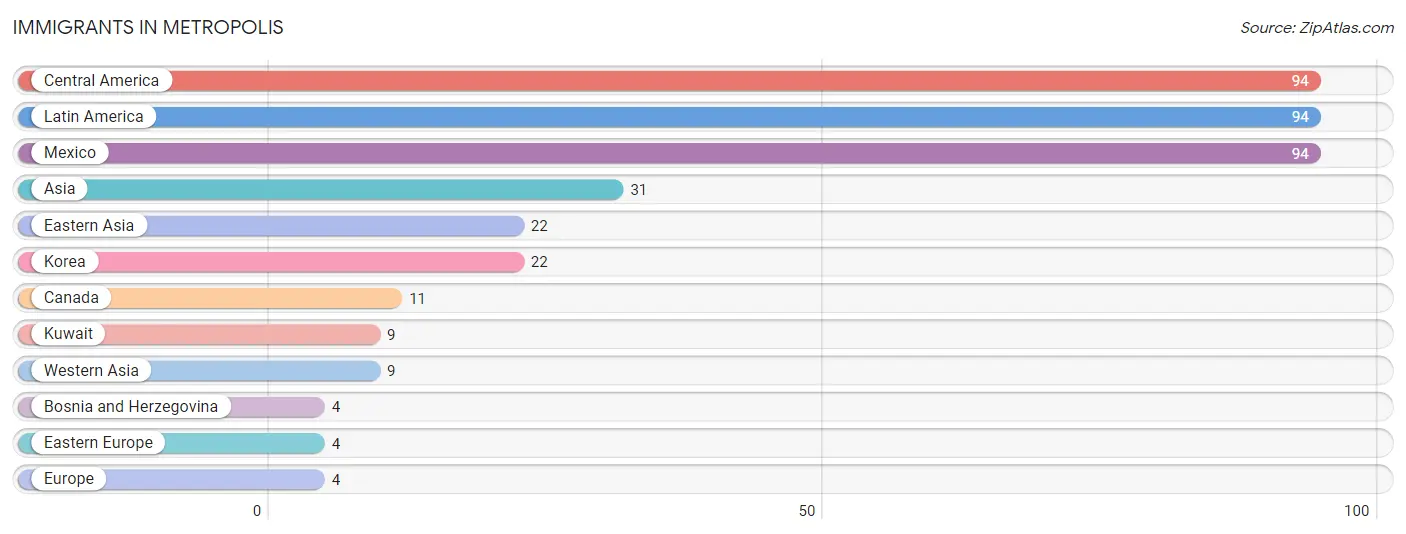
Immigrants in Metropolis
The most numerous immigrant groups reported in Metropolis came from Central America (94 | 1.6%), Latin America (94 | 1.6%), Mexico (94 | 1.6%), Asia (31 | 0.5%), and Eastern Asia (22 | 0.4%), together accounting for 5.6% of all Metropolis residents.
| Immigration Origin | # Population | % Population |
| Asia | 31 | 0.5% |
| Bosnia and Herzegovina | 4 | 0.1% |
| Canada | 11 | 0.2% |
| Central America | 94 | 1.6% |
| Eastern Asia | 22 | 0.4% |
| Eastern Europe | 4 | 0.1% |
| Europe | 4 | 0.1% |
| Korea | 22 | 0.4% |
| Kuwait | 9 | 0.2% |
| Latin America | 94 | 1.6% |
| Mexico | 94 | 1.6% |
| Western Asia | 9 | 0.2% | View All 12 Rows |
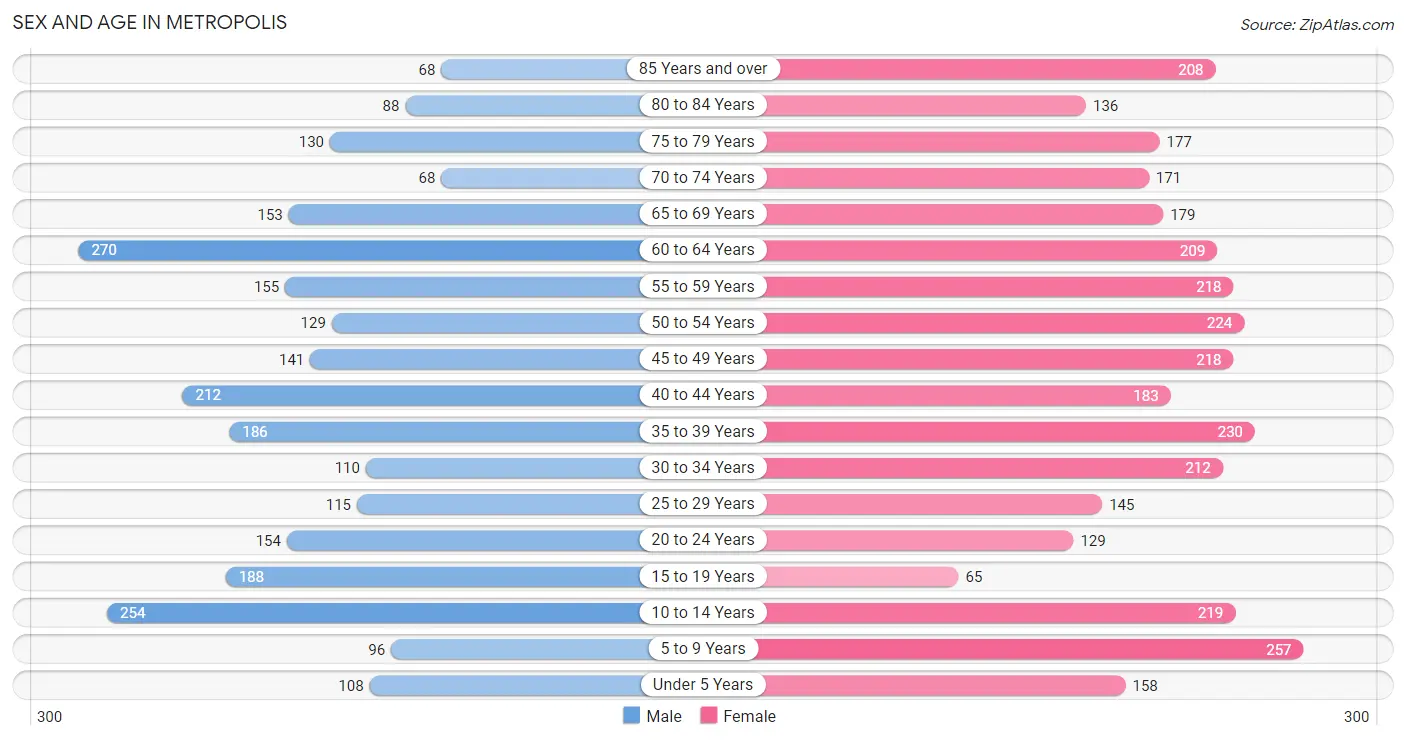
Sex and Age in Metropolis
Sex and Age in Metropolis
The most populous age groups in Metropolis are 60 to 64 Years (270 | 10.3%) for men and 5 to 9 Years (257 | 7.7%) for women.
| Age Bracket | Male | Female |
| Under 5 Years | 108 (4.1%) | 158 (4.7%) |
| 5 to 9 Years | 96 (3.7%) | 257 (7.7%) |
| 10 to 14 Years | 254 (9.7%) | 219 (6.6%) |
| 15 to 19 Years | 188 (7.2%) | 65 (1.9%) |
| 20 to 24 Years | 154 (5.9%) | 129 (3.9%) |
| 25 to 29 Years | 115 (4.4%) | 145 (4.3%) |
| 30 to 34 Years | 110 (4.2%) | 212 (6.4%) |
| 35 to 39 Years | 186 (7.1%) | 230 (6.9%) |
| 40 to 44 Years | 212 (8.1%) | 183 (5.5%) |
| 45 to 49 Years | 141 (5.4%) | 218 (6.5%) |
| 50 to 54 Years | 129 (4.9%) | 224 (6.7%) |
| 55 to 59 Years | 155 (5.9%) | 218 (6.5%) |
| 60 to 64 Years | 270 (10.3%) | 209 (6.3%) |
| 65 to 69 Years | 153 (5.8%) | 179 (5.4%) |
| 70 to 74 Years | 68 (2.6%) | 171 (5.1%) |
| 75 to 79 Years | 130 (5.0%) | 177 (5.3%) |
| 80 to 84 Years | 88 (3.4%) | 136 (4.1%) |
| 85 Years and over | 68 (2.6%) | 208 (6.2%) |
| Total | 2,625 (100.0%) | 3,338 (100.0%) |
Families and Households in Metropolis
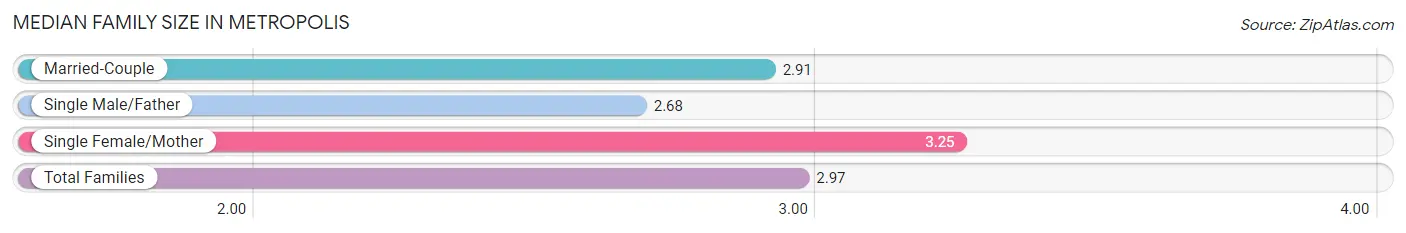
Median Family Size in Metropolis
The median family size in Metropolis is 2.97 persons per family, with single female/mother families (281 | 18.5%) accounting for the largest median family size of 3.25 persons per family. On the other hand, single male/father families (62 | 4.1%) represent the smallest median family size with 2.68 persons per family.
| Family Type | # Families | Family Size |
| Married-Couple | 1,172 (77.4%) | 2.91 |
| Single Male/Father | 62 (4.1%) | 2.68 |
| Single Female/Mother | 281 (18.5%) | 3.25 |
| Total Families | 1,515 (100.0%) | 2.97 |
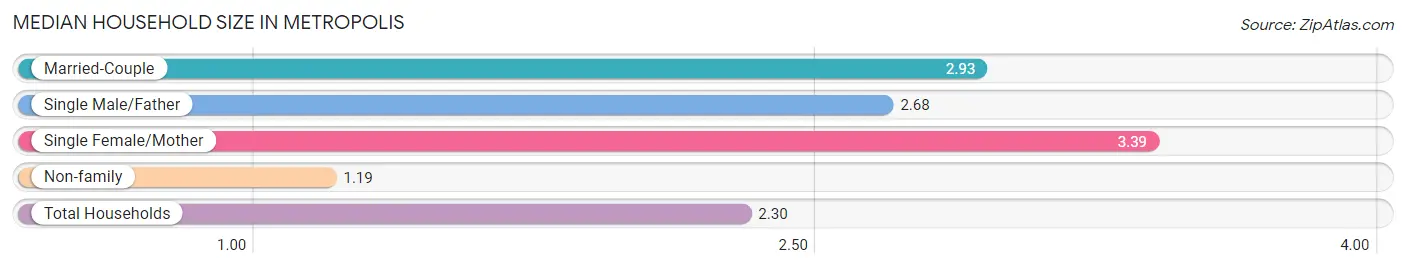
Median Household Size in Metropolis
The median household size in Metropolis is 2.30 persons per household, with single female/mother households (281 | 11.4%) accounting for the largest median household size of 3.39 persons per household. non-family households (954 | 38.6%) represent the smallest median household size with 1.19 persons per household.
| Household Type | # Households | Household Size |
| Married-Couple | 1,172 (47.5%) | 2.93 |
| Single Male/Father | 62 (2.5%) | 2.68 |
| Single Female/Mother | 281 (11.4%) | 3.39 |
| Non-family | 954 (38.6%) | 1.19 |
| Total Households | 2,469 (100.0%) | 2.30 |
Household Size by Marriage Status in Metropolis
Out of a total of 2,469 households in Metropolis, 1,515 (61.4%) are family households, while 954 (38.6%) are nonfamily households. The most numerous type of family households are 2-person households, comprising 712, and the most common type of nonfamily households are 1-person households, comprising 851.
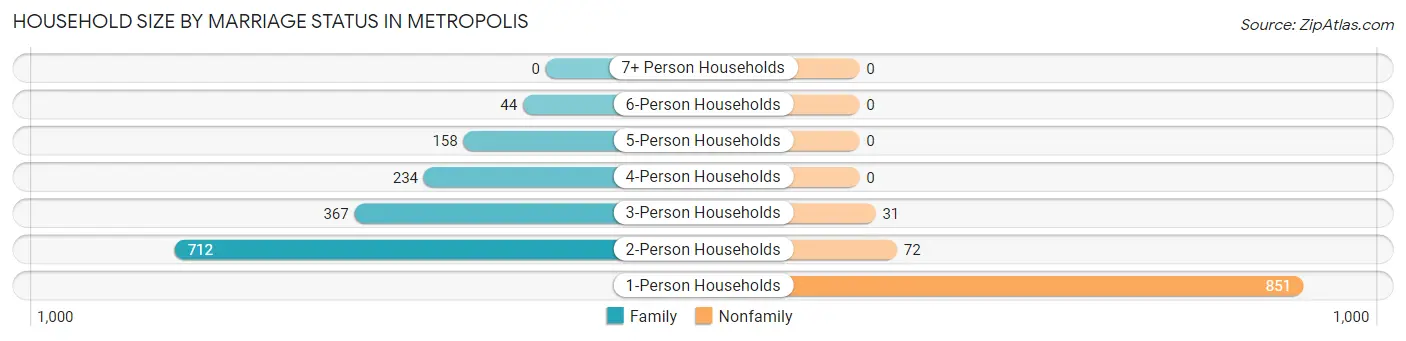
| Household Size | Family Households | Nonfamily Households |
| 1-Person Households | - | 851 (34.5%) |
| 2-Person Households | 712 (28.8%) | 72 (2.9%) |
| 3-Person Households | 367 (14.9%) | 31 (1.3%) |
| 4-Person Households | 234 (9.5%) | 0 (0.0%) |
| 5-Person Households | 158 (6.4%) | 0 (0.0%) |
| 6-Person Households | 44 (1.8%) | 0 (0.0%) |
| 7+ Person Households | 0 (0.0%) | 0 (0.0%) |
| Total | 1,515 (61.4%) | 954 (38.6%) |
Female Fertility in Metropolis
Fertility by Age in Metropolis
Average fertility rate in Metropolis is 28.0 births per 1,000 women. Women in the age bracket of 20 to 34 years have the highest fertility rate with 76.0 births per 1,000 women. Women in the age bracket of 20 to 34 years acount for 100.0% of all women with births.
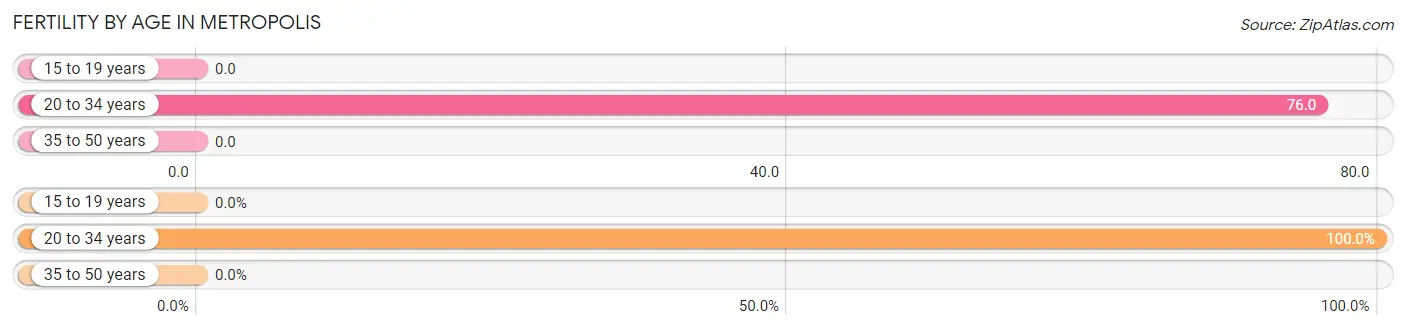
| Age Bracket | Women with Births | Births / 1,000 Women |
| 15 to 19 years | 0 (0.0%) | 0.0 |
| 20 to 34 years | 37 (100.0%) | 76.0 |
| 35 to 50 years | 0 (0.0%) | 0.0 |
| Total | 37 (100.0%) | 28.0 |
Fertility by Age by Marriage Status in Metropolis
51.4% of women with births (37) in Metropolis are married. The highest percentage of unmarried women with births falls into 20 to 34 years age bracket with 48.6% of them unmarried at the time of birth, while the lowest percentage of unmarried women with births belong to 20 to 34 years age bracket with 48.7% of them unmarried.
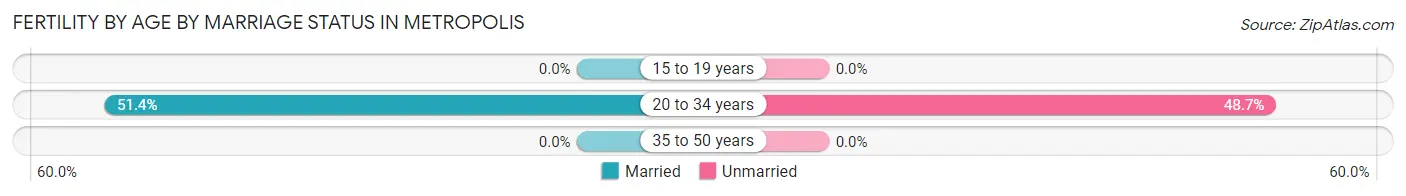
| Age Bracket | Married | Unmarried |
| 15 to 19 years | 0 (0.0%) | 0 (0.0%) |
| 20 to 34 years | 19 (51.3%) | 18 (48.6%) |
| 35 to 50 years | 0 (0.0%) | 0 (0.0%) |
| Total | 19 (51.3%) | 18 (48.6%) |
Fertility by Education in Metropolis
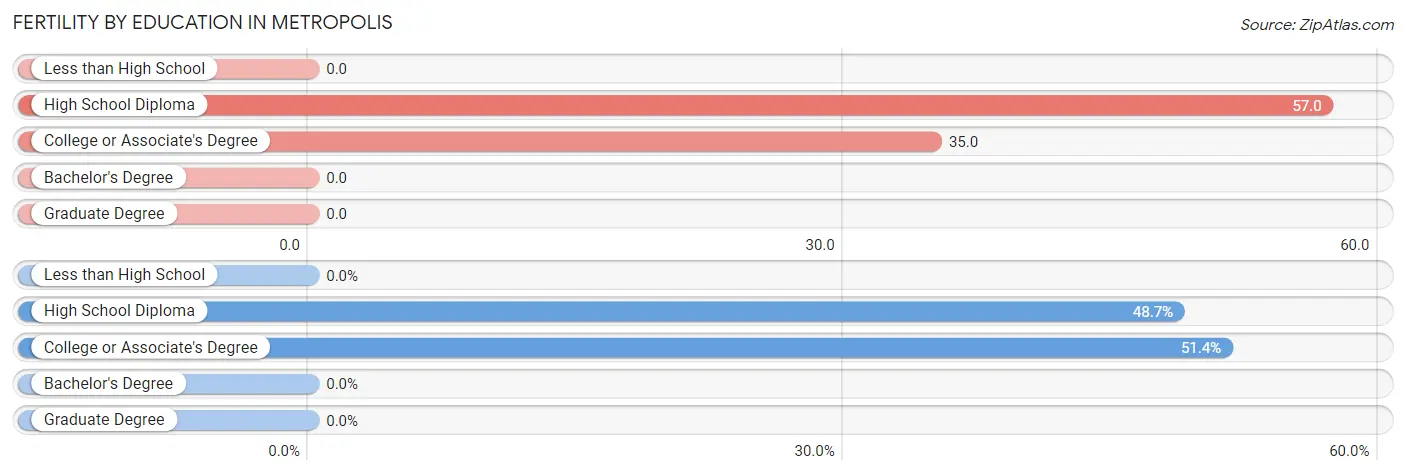
| Educational Attainment | Women with Births | Births / 1,000 Women |
| Less than High School | 0 (0.0%) | 0.0 |
| High School Diploma | 18 (48.6%) | 57.0 |
| College or Associate's Degree | 19 (51.3%) | 35.0 |
| Bachelor's Degree | 0 (0.0%) | 0.0 |
| Graduate Degree | 0 (0.0%) | 0.0 |
| Total | 37 (100.0%) | 28.0 |
Fertility by Education by Marriage Status in Metropolis
48.6% of women with births in Metropolis are unmarried. Women with the educational attainment of college or associate's degree are most likely to be married with 100.0% of them married at childbirth, while women with the educational attainment of high school diploma are least likely to be married with 100.0% of them unmarried at childbirth.
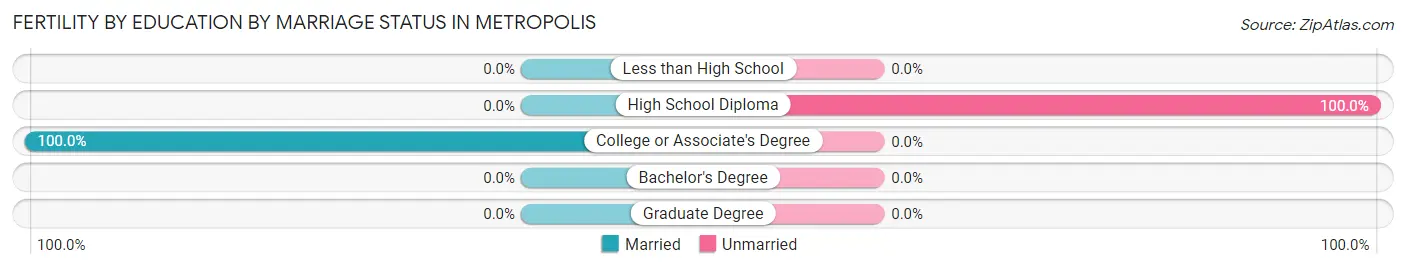
| Educational Attainment | Married | Unmarried |
| Less than High School | 0 (0.0%) | 0 (0.0%) |
| High School Diploma | 0 (0.0%) | 18 (100.0%) |
| College or Associate's Degree | 19 (100.0%) | 0 (0.0%) |
| Bachelor's Degree | 0 (0.0%) | 0 (0.0%) |
| Graduate Degree | 0 (0.0%) | 0 (0.0%) |
| Total | 19 (51.3%) | 18 (48.6%) |
Employment Characteristics in Metropolis
Employment by Class of Employer in Metropolis
Among the 2,167 employed individuals in Metropolis, private company employees (1,392 | 64.2%), local government employees (226 | 10.4%), and state government employees (170 | 7.8%) make up the most common classes of employment.
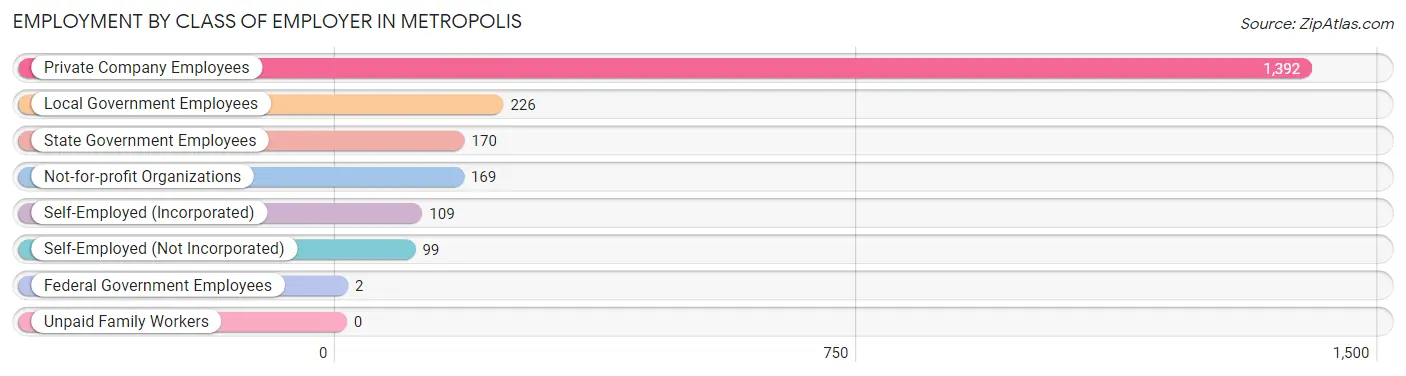
| Employer Class | # Employees | % Employees |
| Private Company Employees | 1,392 | 64.2% |
| Self-Employed (Incorporated) | 109 | 5.0% |
| Self-Employed (Not Incorporated) | 99 | 4.6% |
| Not-for-profit Organizations | 169 | 7.8% |
| Local Government Employees | 226 | 10.4% |
| State Government Employees | 170 | 7.8% |
| Federal Government Employees | 2 | 0.1% |
| Unpaid Family Workers | 0 | 0.0% |
| Total | 2,167 | 100.0% |
Employment Status by Age in Metropolis
According to the labor force statistics for Metropolis, out of the total population over 16 years of age (4,816), 46.1% or 2,220 individuals are in the labor force, with 2.2% or 49 of them unemployed. The age group with the highest labor force participation rate is 30 to 34 years, with 92.5% or 298 individuals in the labor force. Within the labor force, the 16 to 19 years age range has the highest percentage of unemployed individuals, with 41.2% or 14 of them being unemployed.
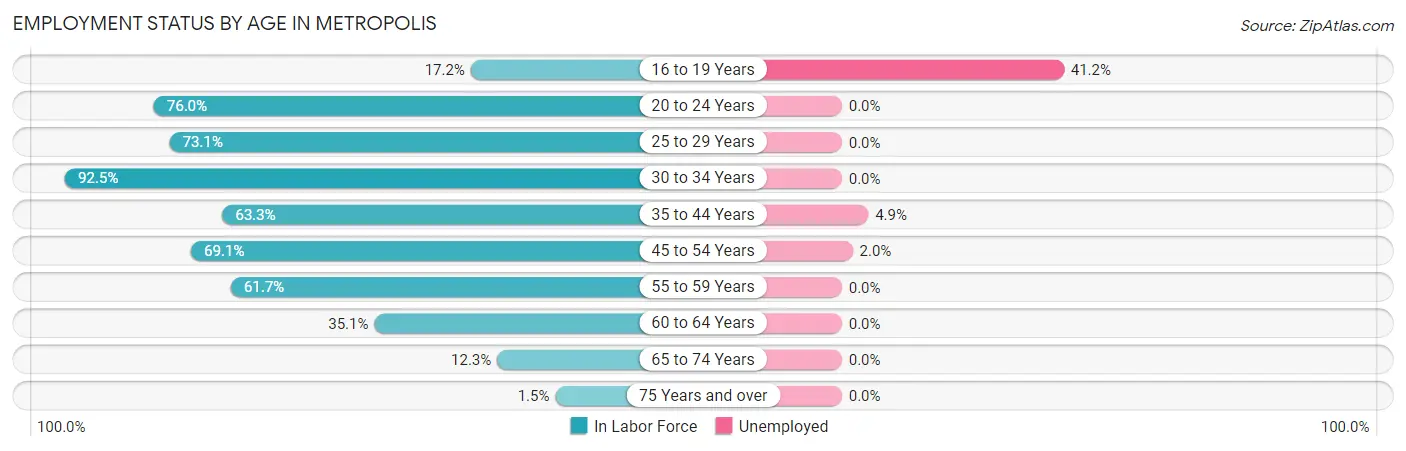
| Age Bracket | In Labor Force | Unemployed |
| 16 to 19 Years | 34 (17.2%) | 14 (41.2%) |
| 20 to 24 Years | 215 (76.0%) | 0 (0.0%) |
| 25 to 29 Years | 190 (73.1%) | 0 (0.0%) |
| 30 to 34 Years | 298 (92.5%) | 0 (0.0%) |
| 35 to 44 Years | 513 (63.3%) | 25 (4.9%) |
| 45 to 54 Years | 492 (69.1%) | 10 (2.0%) |
| 55 to 59 Years | 230 (61.7%) | 0 (0.0%) |
| 60 to 64 Years | 168 (35.1%) | 0 (0.0%) |
| 65 to 74 Years | 70 (12.3%) | 0 (0.0%) |
| 75 Years and over | 12 (1.5%) | 0 (0.0%) |
| Total | 2,220 (46.1%) | 49 (2.2%) |
Employment Status by Educational Attainment in Metropolis
According to labor force statistics for Metropolis, 63.9% of individuals (1,890) out of the total population between 25 and 64 years of age (2,957) are in the labor force, with 1.9% or 36 of them being unemployed. The group with the highest labor force participation rate are those with the educational attainment of bachelor's degree or higher, with 87.0% or 322 individuals in the labor force. Within the labor force, individuals with college / associate degree education have the highest percentage of unemployment, with 3.9% or 25 of them being unemployed.
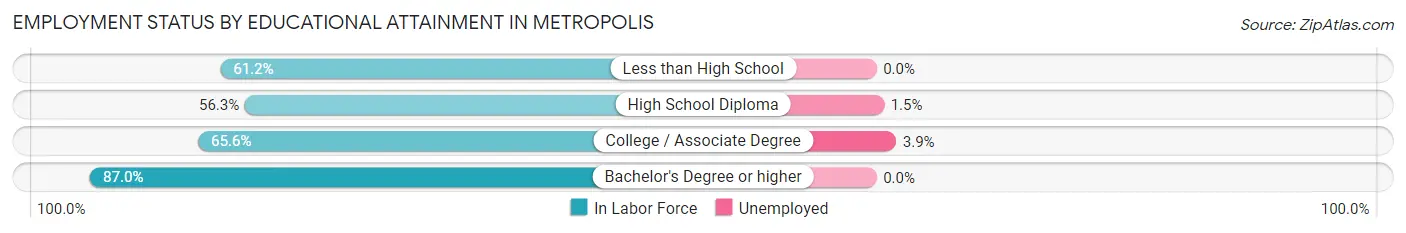
| Educational Attainment | In Labor Force | Unemployed |
| Less than High School | 284 (61.2%) | 0 (0.0%) |
| High School Diploma | 649 (56.3%) | 17 (1.5%) |
| College / Associate Degree | 637 (65.6%) | 38 (3.9%) |
| Bachelor's Degree or higher | 322 (87.0%) | 0 (0.0%) |
| Total | 1,890 (63.9%) | 56 (1.9%) |
Employment Occupations by Sex in Metropolis
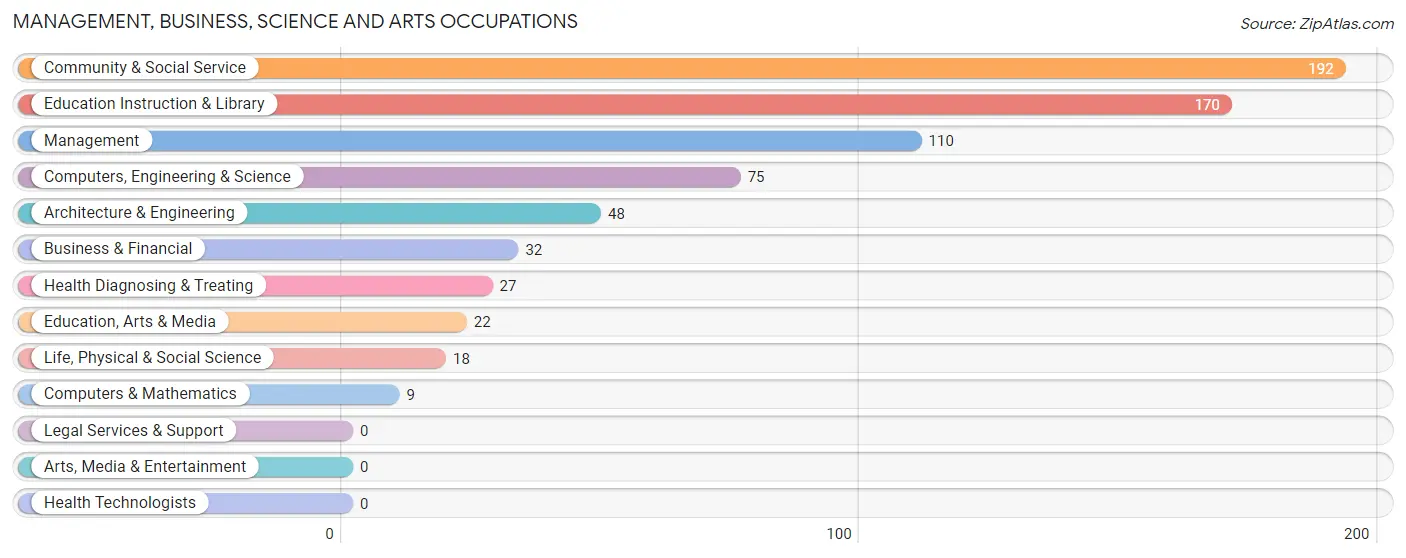
Management, Business, Science and Arts Occupations
The most common Management, Business, Science and Arts occupations in Metropolis are Community & Social Service (192 | 8.8%), Education Instruction & Library (170 | 7.8%), Management (110 | 5.1%), Computers, Engineering & Science (75 | 3.5%), and Architecture & Engineering (48 | 2.2%).
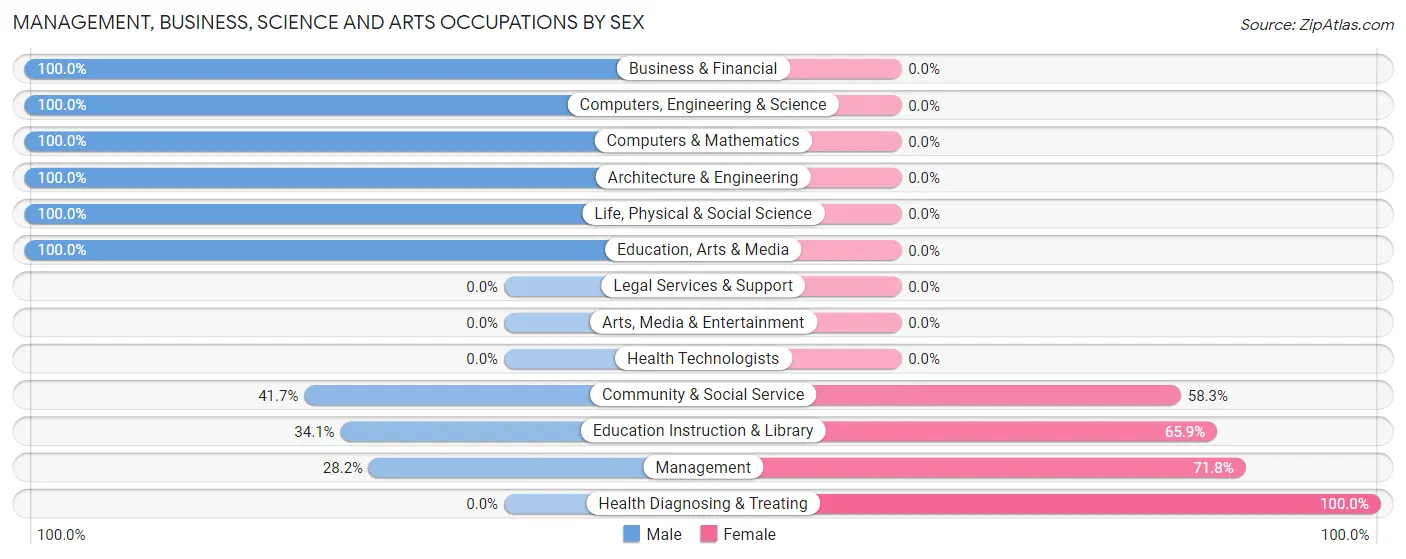
Management, Business, Science and Arts Occupations by Sex
Within the Management, Business, Science and Arts occupations in Metropolis, the most male-oriented occupations are Business & Financial (100.0%), Computers, Engineering & Science (100.0%), and Computers & Mathematics (100.0%), while the most female-oriented occupations are Health Diagnosing & Treating (100.0%), Management (71.8%), and Education Instruction & Library (65.9%).
| Occupation | Male | Female |
| Management | 31 (28.2%) | 79 (71.8%) |
| Business & Financial | 32 (100.0%) | 0 (0.0%) |
| Computers, Engineering & Science | 75 (100.0%) | 0 (0.0%) |
| Computers & Mathematics | 9 (100.0%) | 0 (0.0%) |
| Architecture & Engineering | 48 (100.0%) | 0 (0.0%) |
| Life, Physical & Social Science | 18 (100.0%) | 0 (0.0%) |
| Community & Social Service | 80 (41.7%) | 112 (58.3%) |
| Education, Arts & Media | 22 (100.0%) | 0 (0.0%) |
| Legal Services & Support | 0 (0.0%) | 0 (0.0%) |
| Education Instruction & Library | 58 (34.1%) | 112 (65.9%) |
| Arts, Media & Entertainment | 0 (0.0%) | 0 (0.0%) |
| Health Diagnosing & Treating | 0 (0.0%) | 27 (100.0%) |
| Health Technologists | 0 (0.0%) | 0 (0.0%) |
| Total (Category) | 218 (50.0%) | 218 (50.0%) |
| Total (Overall) | 999 (46.0%) | 1,174 (54.0%) |
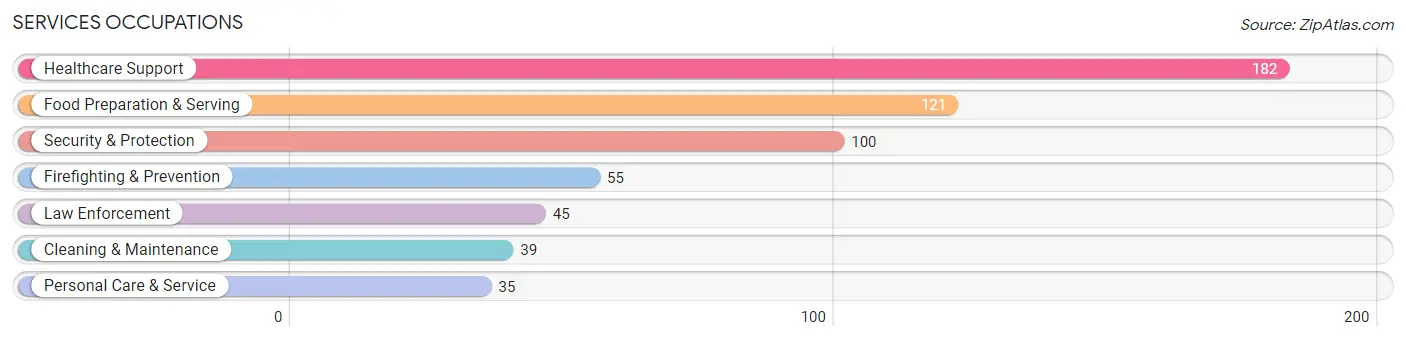
Services Occupations
The most common Services occupations in Metropolis are Healthcare Support (182 | 8.4%), Food Preparation & Serving (121 | 5.6%), Security & Protection (100 | 4.6%), Firefighting & Prevention (55 | 2.5%), and Law Enforcement (45 | 2.1%).
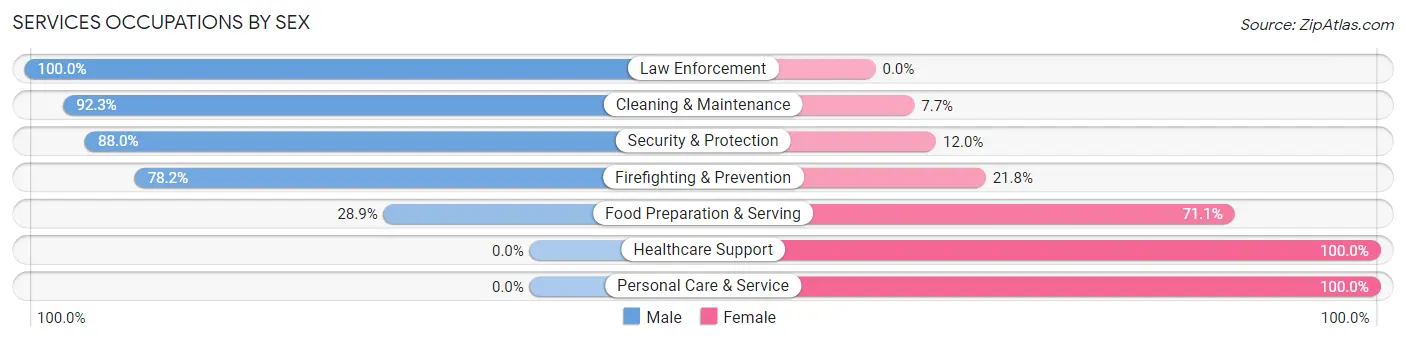
Services Occupations by Sex
Within the Services occupations in Metropolis, the most male-oriented occupations are Law Enforcement (100.0%), Cleaning & Maintenance (92.3%), and Security & Protection (88.0%), while the most female-oriented occupations are Healthcare Support (100.0%), Personal Care & Service (100.0%), and Food Preparation & Serving (71.1%).
| Occupation | Male | Female |
| Healthcare Support | 0 (0.0%) | 182 (100.0%) |
| Security & Protection | 88 (88.0%) | 12 (12.0%) |
| Firefighting & Prevention | 43 (78.2%) | 12 (21.8%) |
| Law Enforcement | 45 (100.0%) | 0 (0.0%) |
| Food Preparation & Serving | 35 (28.9%) | 86 (71.1%) |
| Cleaning & Maintenance | 36 (92.3%) | 3 (7.7%) |
| Personal Care & Service | 0 (0.0%) | 35 (100.0%) |
| Total (Category) | 159 (33.3%) | 318 (66.7%) |
| Total (Overall) | 999 (46.0%) | 1,174 (54.0%) |
Sales and Office Occupations
The most common Sales and Office occupations in Metropolis are Office & Administration (449 | 20.7%), and Sales & Related (302 | 13.9%).
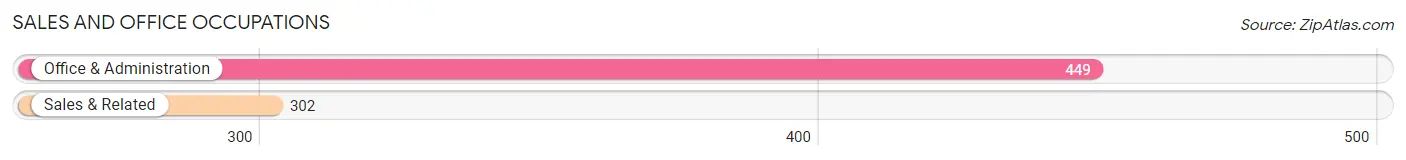
Sales and Office Occupations by Sex

| Occupation | Male | Female |
| Sales & Related | 56 (18.5%) | 246 (81.5%) |
| Office & Administration | 165 (36.7%) | 284 (63.2%) |
| Total (Category) | 221 (29.4%) | 530 (70.6%) |
| Total (Overall) | 999 (46.0%) | 1,174 (54.0%) |
Natural Resources, Construction and Maintenance Occupations
The most common Natural Resources, Construction and Maintenance occupations in Metropolis are Construction & Extraction (96 | 4.4%), Installation, Maintenance & Repair (60 | 2.8%), and Farming, Fishing & Forestry (6 | 0.3%).
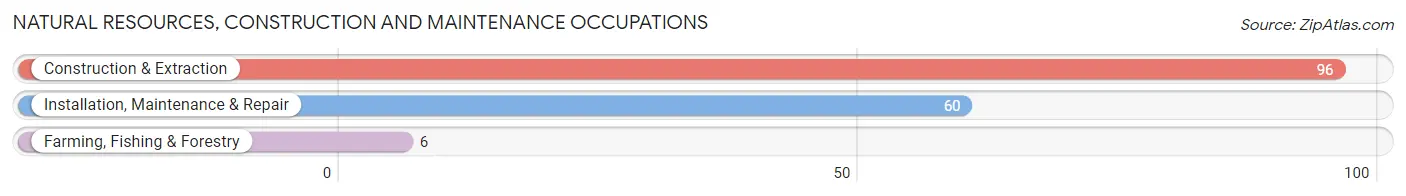
Natural Resources, Construction and Maintenance Occupations by Sex

| Occupation | Male | Female |
| Farming, Fishing & Forestry | 6 (100.0%) | 0 (0.0%) |
| Construction & Extraction | 96 (100.0%) | 0 (0.0%) |
| Installation, Maintenance & Repair | 60 (100.0%) | 0 (0.0%) |
| Total (Category) | 162 (100.0%) | 0 (0.0%) |
| Total (Overall) | 999 (46.0%) | 1,174 (54.0%) |
Production, Transportation and Moving Occupations
The most common Production, Transportation and Moving occupations in Metropolis are Production (171 | 7.9%), Transportation (114 | 5.2%), and Material Moving (62 | 2.9%).
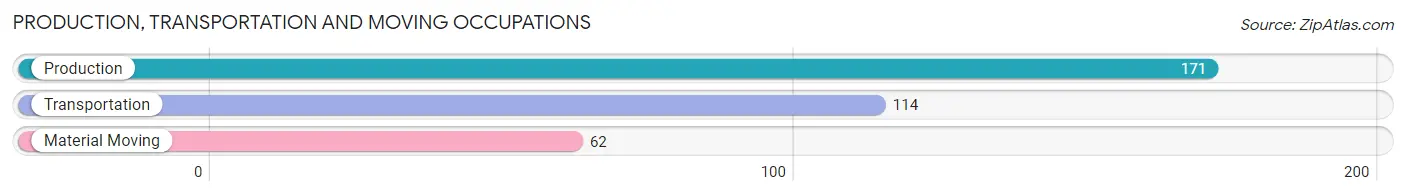
Production, Transportation and Moving Occupations by Sex
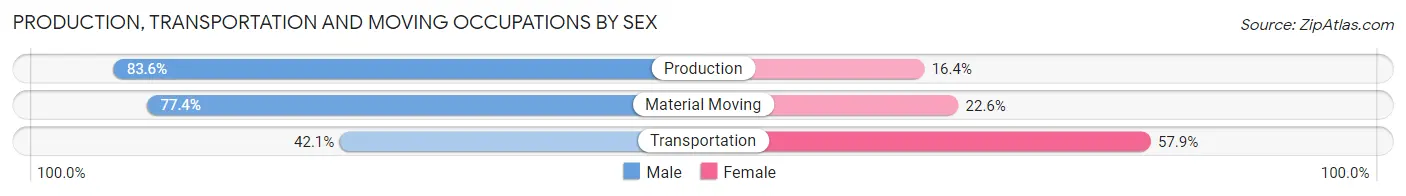
| Occupation | Male | Female |
| Production | 143 (83.6%) | 28 (16.4%) |
| Transportation | 48 (42.1%) | 66 (57.9%) |
| Material Moving | 48 (77.4%) | 14 (22.6%) |
| Total (Category) | 239 (68.9%) | 108 (31.1%) |
| Total (Overall) | 999 (46.0%) | 1,174 (54.0%) |
Employment Industries by Sex in Metropolis
Employment Industries in Metropolis
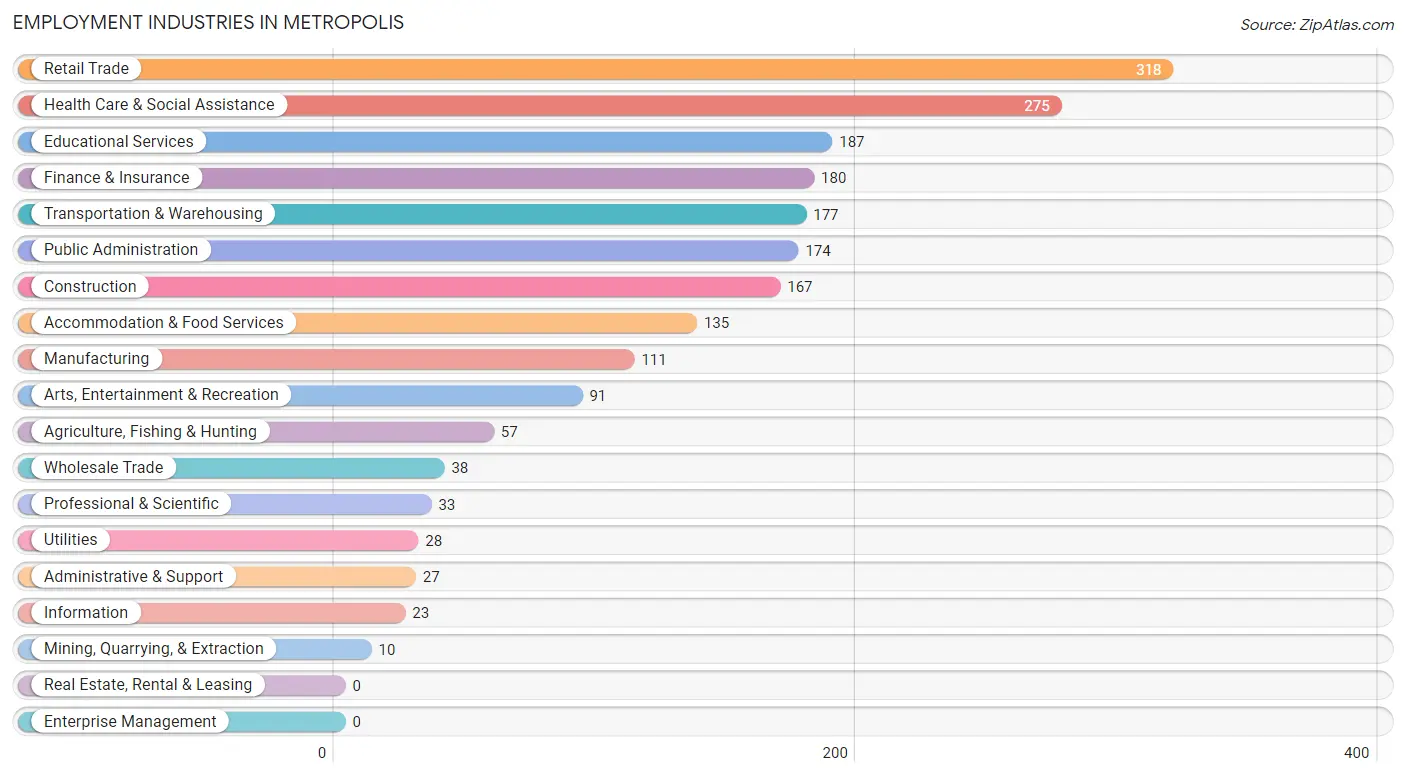
The major employment industries in Metropolis include Retail Trade (318 | 14.6%), Health Care & Social Assistance (275 | 12.7%), Educational Services (187 | 8.6%), Finance & Insurance (180 | 8.3%), and Transportation & Warehousing (177 | 8.2%).
Employment Industries by Sex in Metropolis
The Metropolis industries that see more men than women are Mining, Quarrying, & Extraction (100.0%), Construction (100.0%), and Wholesale Trade (100.0%), whereas the industries that tend to have a higher number of women are Retail Trade (84.9%), Health Care & Social Assistance (79.3%), and Finance & Insurance (78.9%).
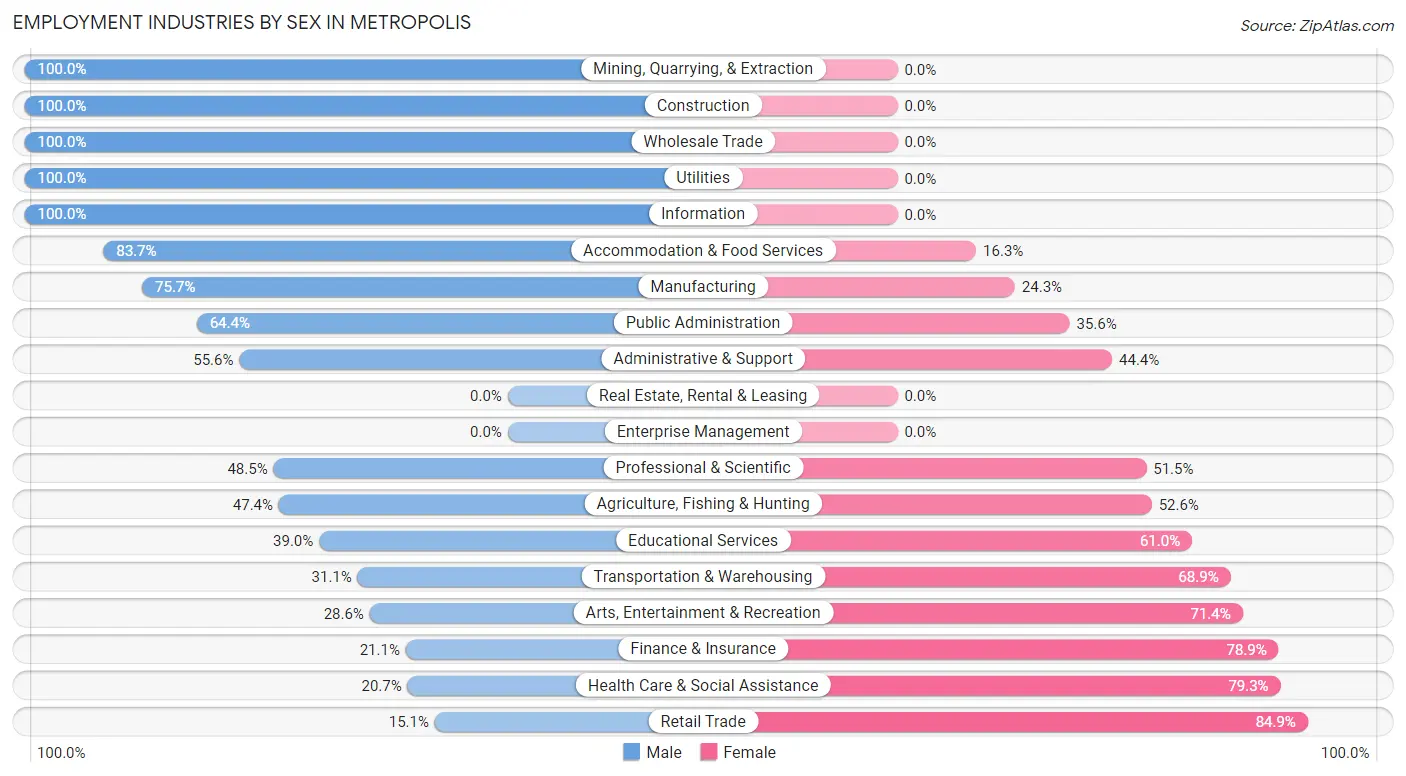
| Industry | Male | Female |
| Agriculture, Fishing & Hunting | 27 (47.4%) | 30 (52.6%) |
| Mining, Quarrying, & Extraction | 10 (100.0%) | 0 (0.0%) |
| Construction | 167 (100.0%) | 0 (0.0%) |
| Manufacturing | 84 (75.7%) | 27 (24.3%) |
| Wholesale Trade | 38 (100.0%) | 0 (0.0%) |
| Retail Trade | 48 (15.1%) | 270 (84.9%) |
| Transportation & Warehousing | 55 (31.1%) | 122 (68.9%) |
| Utilities | 28 (100.0%) | 0 (0.0%) |
| Information | 23 (100.0%) | 0 (0.0%) |
| Finance & Insurance | 38 (21.1%) | 142 (78.9%) |
| Real Estate, Rental & Leasing | 0 (0.0%) | 0 (0.0%) |
| Professional & Scientific | 16 (48.5%) | 17 (51.5%) |
| Enterprise Management | 0 (0.0%) | 0 (0.0%) |
| Administrative & Support | 15 (55.6%) | 12 (44.4%) |
| Educational Services | 73 (39.0%) | 114 (61.0%) |
| Health Care & Social Assistance | 57 (20.7%) | 218 (79.3%) |
| Arts, Entertainment & Recreation | 26 (28.6%) | 65 (71.4%) |
| Accommodation & Food Services | 113 (83.7%) | 22 (16.3%) |
| Public Administration | 112 (64.4%) | 62 (35.6%) |
| Total | 999 (46.0%) | 1,174 (54.0%) |
Education in Metropolis
School Enrollment in Metropolis
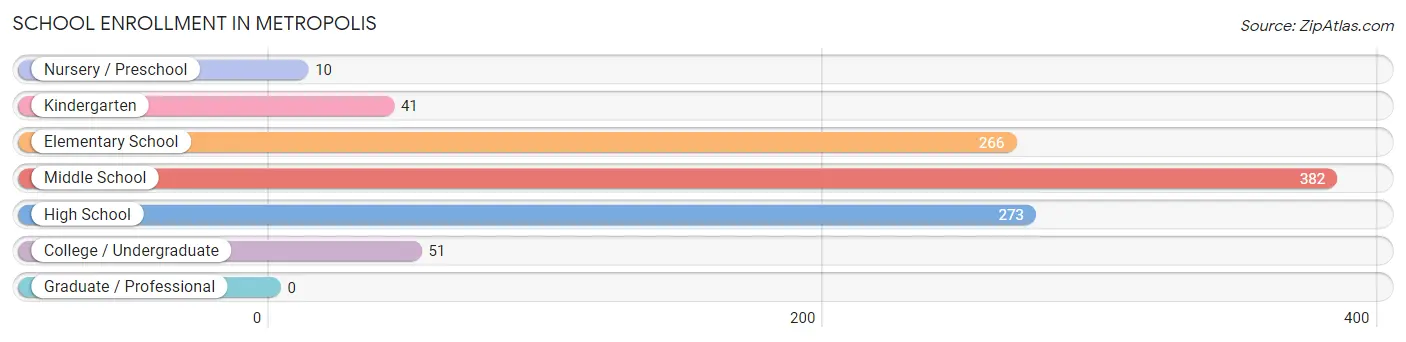
The most common levels of schooling among the 1,023 students in Metropolis are middle school (382 | 37.3%), high school (273 | 26.7%), and elementary school (266 | 26.0%).
| School Level | # Students | % Students |
| Nursery / Preschool | 10 | 1.0% |
| Kindergarten | 41 | 4.0% |
| Elementary School | 266 | 26.0% |
| Middle School | 382 | 37.3% |
| High School | 273 | 26.7% |
| College / Undergraduate | 51 | 5.0% |
| Graduate / Professional | 0 | 0.0% |
| Total | 1,023 | 100.0% |
School Enrollment by Age by Funding Source in Metropolis
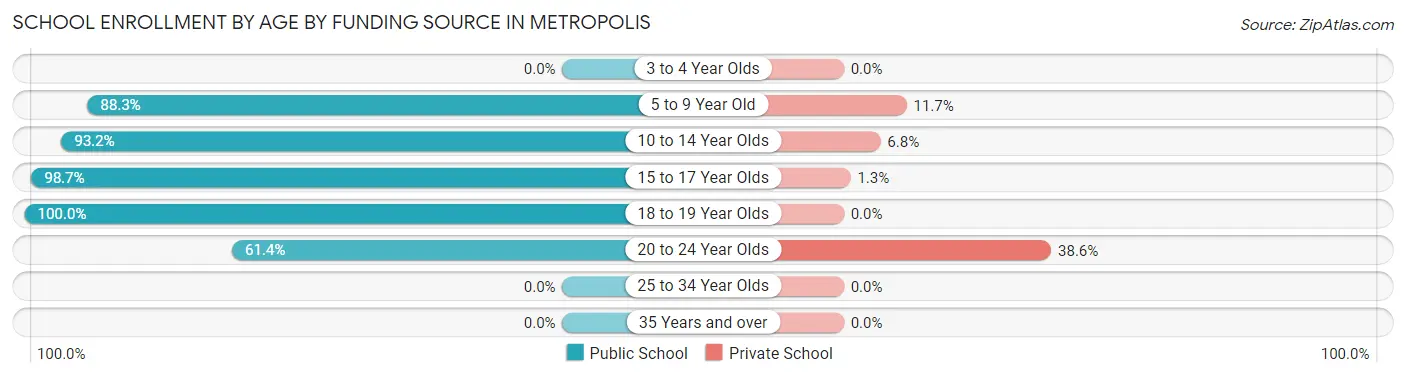
Out of a total of 1,023 students who are enrolled in schools in Metropolis, 89 (8.7%) attend a private institution, while the remaining 934 (91.3%) are enrolled in public schools. The age group of 20 to 24 year olds has the highest likelihood of being enrolled in private schools, with 17 (38.6% in the age bracket) enrolled. Conversely, the age group of 18 to 19 year olds has the lowest likelihood of being enrolled in a private school, with 46 (100.0% in the age bracket) attending a public institution.
| Age Bracket | Public School | Private School |
| 3 to 4 Year Olds | 0 (0.0%) | 0 (0.0%) |
| 5 to 9 Year Old | 309 (88.3%) | 41 (11.7%) |
| 10 to 14 Year Olds | 395 (93.2%) | 29 (6.8%) |
| 15 to 17 Year Olds | 157 (98.7%) | 2 (1.3%) |
| 18 to 19 Year Olds | 46 (100.0%) | 0 (0.0%) |
| 20 to 24 Year Olds | 27 (61.4%) | 17 (38.6%) |
| 25 to 34 Year Olds | 0 (0.0%) | 0 (0.0%) |
| 35 Years and over | 0 (0.0%) | 0 (0.0%) |
| Total | 934 (91.3%) | 89 (8.7%) |
Educational Attainment by Field of Study in Metropolis
Education (179 | 30.2%), business (102 | 17.2%), science & technology (100 | 16.9%), engineering (65 | 11.0%), and literature & languages (30 | 5.1%) are the most common fields of study among 593 individuals in Metropolis who have obtained a bachelor's degree or higher.
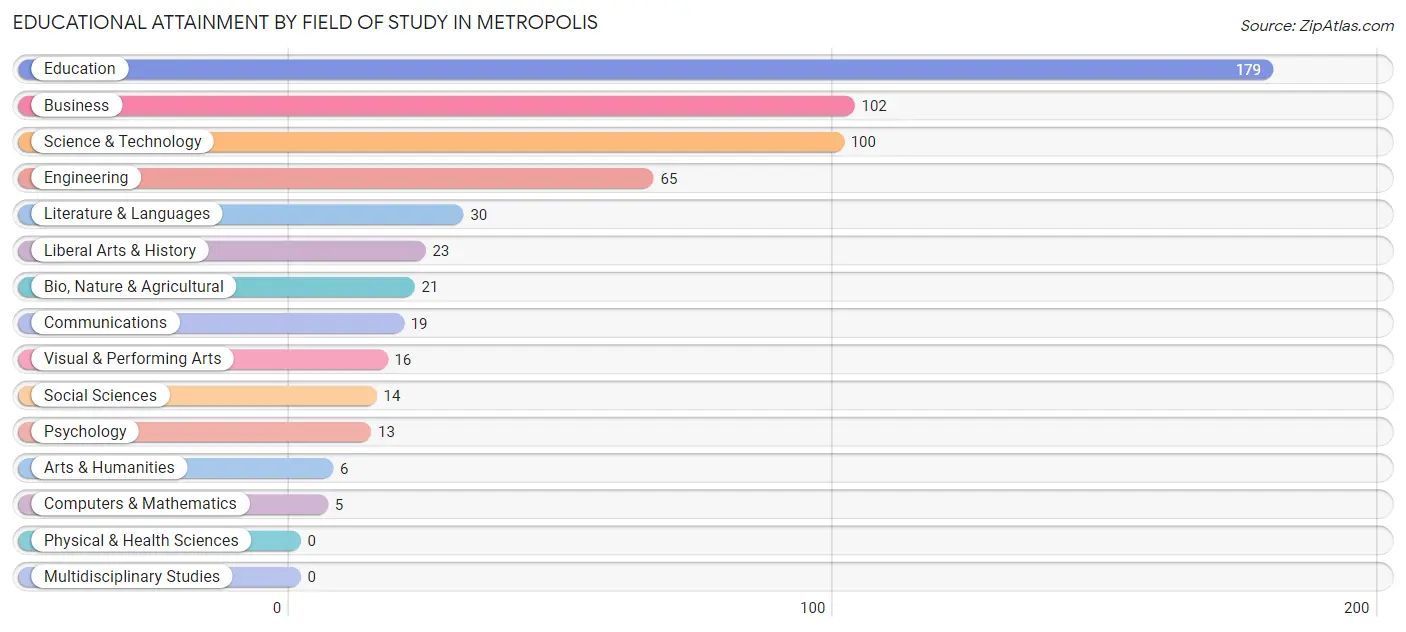
| Field of Study | # Graduates | % Graduates |
| Computers & Mathematics | 5 | 0.8% |
| Bio, Nature & Agricultural | 21 | 3.5% |
| Physical & Health Sciences | 0 | 0.0% |
| Psychology | 13 | 2.2% |
| Social Sciences | 14 | 2.4% |
| Engineering | 65 | 11.0% |
| Multidisciplinary Studies | 0 | 0.0% |
| Science & Technology | 100 | 16.9% |
| Business | 102 | 17.2% |
| Education | 179 | 30.2% |
| Literature & Languages | 30 | 5.1% |
| Liberal Arts & History | 23 | 3.9% |
| Visual & Performing Arts | 16 | 2.7% |
| Communications | 19 | 3.2% |
| Arts & Humanities | 6 | 1.0% |
| Total | 593 | 100.0% |
Transportation & Commute in Metropolis
Vehicle Availability by Sex in Metropolis
The most prevalent vehicle ownership categories in Metropolis are males with 2 vehicles (622, accounting for 64.1%) and females with 2 vehicles (461, making up 53.7%).
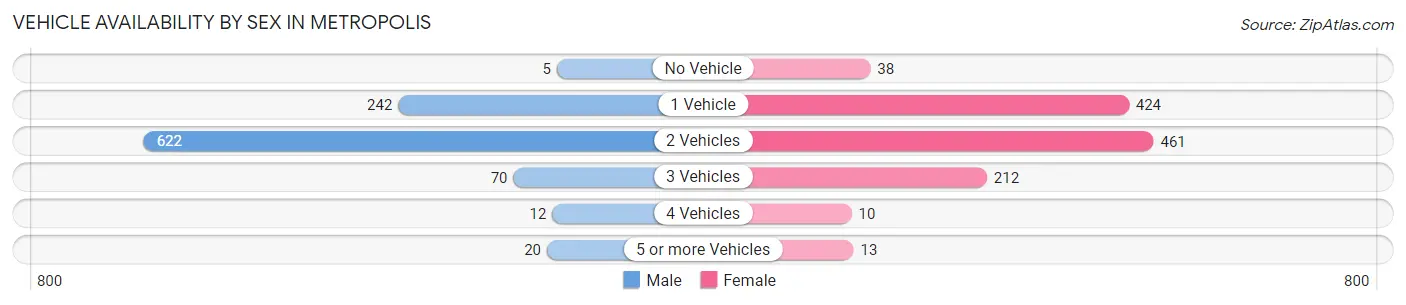
| Vehicles Available | Male | Female |
| No Vehicle | 5 (0.5%) | 38 (3.3%) |
| 1 Vehicle | 242 (24.9%) | 424 (36.6%) |
| 2 Vehicles | 622 (64.1%) | 461 (39.8%) |
| 3 Vehicles | 70 (7.2%) | 212 (18.3%) |
| 4 Vehicles | 12 (1.2%) | 10 (0.9%) |
| 5 or more Vehicles | 20 (2.1%) | 13 (1.1%) |
| Total | 971 (100.0%) | 1,158 (100.0%) |
Commute Time in Metropolis
The most frequently occuring commute durations in Metropolis are 15 to 19 minutes (435 commuters, 21.2%), 5 to 9 minutes (387 commuters, 18.9%), and 10 to 14 minutes (368 commuters, 17.9%).
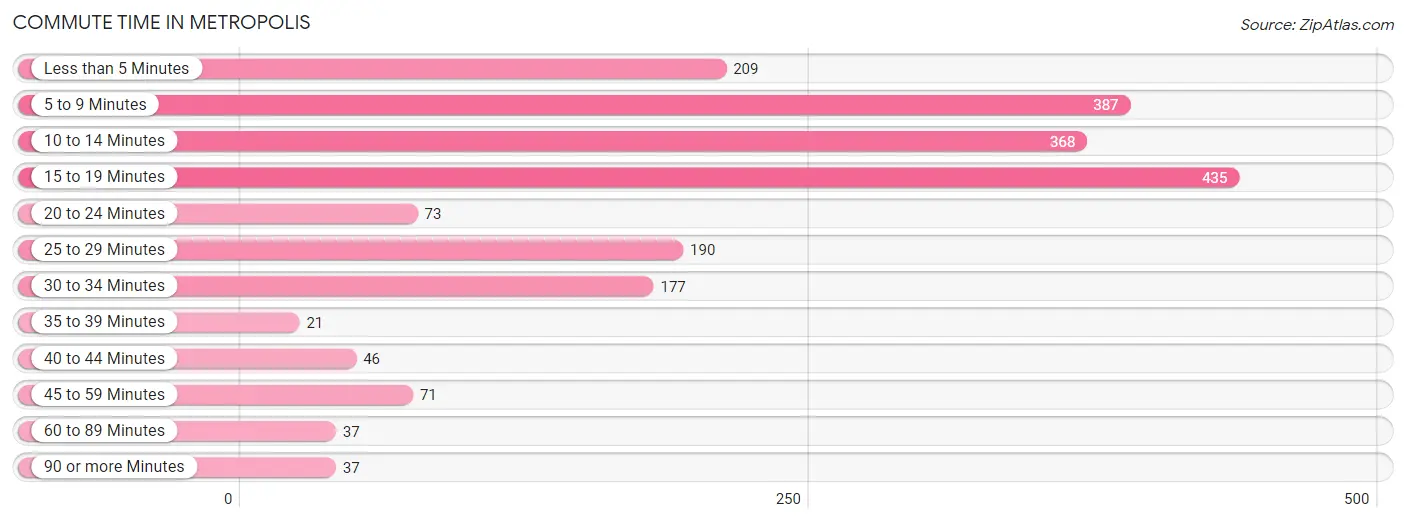
| Commute Time | # Commuters | % Commuters |
| Less than 5 Minutes | 209 | 10.2% |
| 5 to 9 Minutes | 387 | 18.9% |
| 10 to 14 Minutes | 368 | 17.9% |
| 15 to 19 Minutes | 435 | 21.2% |
| 20 to 24 Minutes | 73 | 3.6% |
| 25 to 29 Minutes | 190 | 9.3% |
| 30 to 34 Minutes | 177 | 8.6% |
| 35 to 39 Minutes | 21 | 1.0% |
| 40 to 44 Minutes | 46 | 2.2% |
| 45 to 59 Minutes | 71 | 3.5% |
| 60 to 89 Minutes | 37 | 1.8% |
| 90 or more Minutes | 37 | 1.8% |
Commute Time by Sex in Metropolis
The most common commute times in Metropolis are 10 to 14 minutes (205 commuters, 22.2%) for males and 15 to 19 minutes (310 commuters, 27.5%) for females.
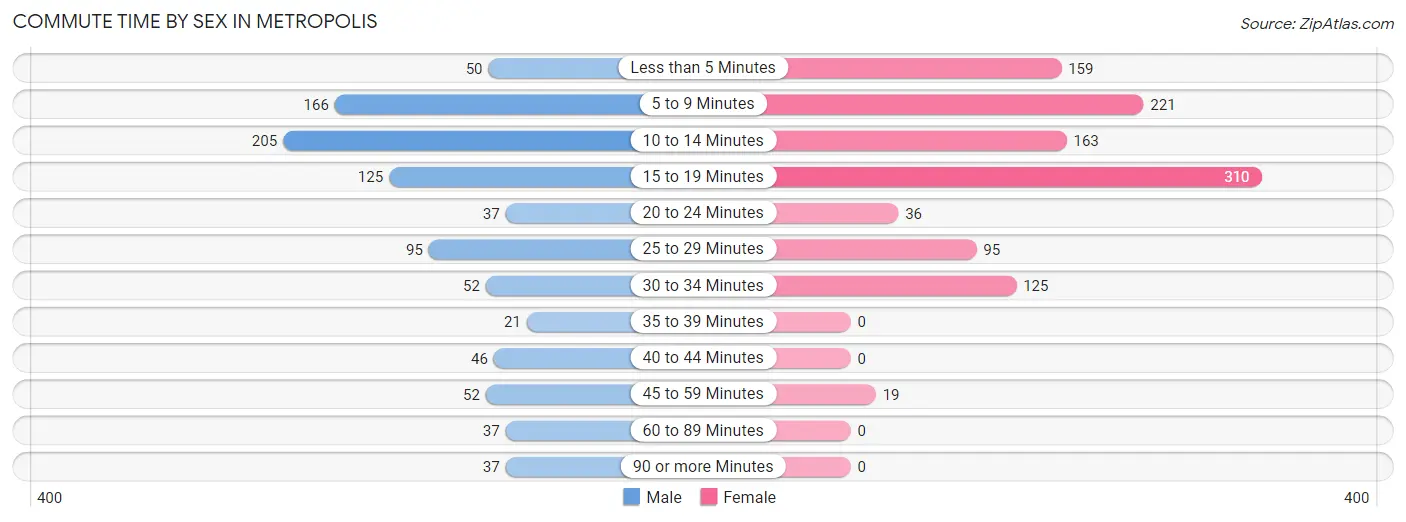
| Commute Time | Male | Female |
| Less than 5 Minutes | 50 (5.4%) | 159 (14.1%) |
| 5 to 9 Minutes | 166 (18.0%) | 221 (19.6%) |
| 10 to 14 Minutes | 205 (22.2%) | 163 (14.4%) |
| 15 to 19 Minutes | 125 (13.5%) | 310 (27.5%) |
| 20 to 24 Minutes | 37 (4.0%) | 36 (3.2%) |
| 25 to 29 Minutes | 95 (10.3%) | 95 (8.4%) |
| 30 to 34 Minutes | 52 (5.6%) | 125 (11.1%) |
| 35 to 39 Minutes | 21 (2.3%) | 0 (0.0%) |
| 40 to 44 Minutes | 46 (5.0%) | 0 (0.0%) |
| 45 to 59 Minutes | 52 (5.6%) | 19 (1.7%) |
| 60 to 89 Minutes | 37 (4.0%) | 0 (0.0%) |
| 90 or more Minutes | 37 (4.0%) | 0 (0.0%) |
Time of Departure to Work by Sex in Metropolis
The most frequent times of departure to work in Metropolis are 8:00 AM to 8:29 AM (221, 23.9%) for males and 8:00 AM to 8:29 AM (262, 23.2%) for females.
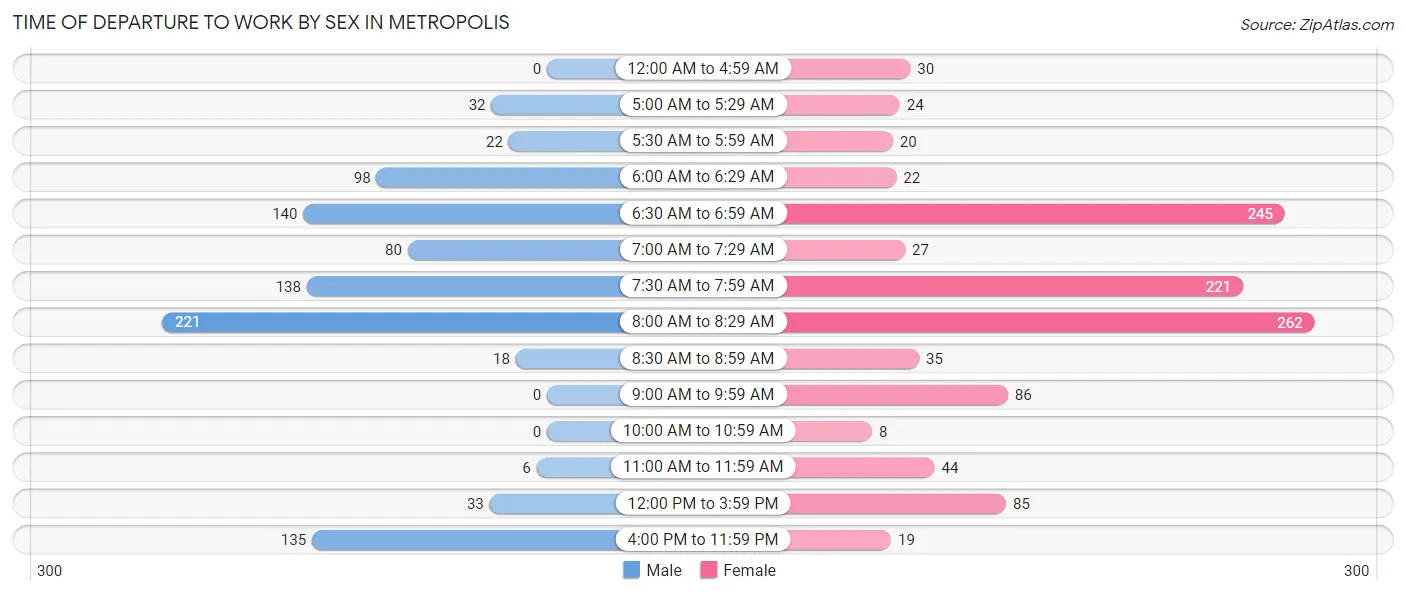
| Time of Departure | Male | Female |
| 12:00 AM to 4:59 AM | 0 (0.0%) | 30 (2.7%) |
| 5:00 AM to 5:29 AM | 32 (3.5%) | 24 (2.1%) |
| 5:30 AM to 5:59 AM | 22 (2.4%) | 20 (1.8%) |
| 6:00 AM to 6:29 AM | 98 (10.6%) | 22 (1.9%) |
| 6:30 AM to 6:59 AM | 140 (15.2%) | 245 (21.7%) |
| 7:00 AM to 7:29 AM | 80 (8.7%) | 27 (2.4%) |
| 7:30 AM to 7:59 AM | 138 (14.9%) | 221 (19.6%) |
| 8:00 AM to 8:29 AM | 221 (23.9%) | 262 (23.2%) |
| 8:30 AM to 8:59 AM | 18 (1.9%) | 35 (3.1%) |
| 9:00 AM to 9:59 AM | 0 (0.0%) | 86 (7.6%) |
| 10:00 AM to 10:59 AM | 0 (0.0%) | 8 (0.7%) |
| 11:00 AM to 11:59 AM | 6 (0.6%) | 44 (3.9%) |
| 12:00 PM to 3:59 PM | 33 (3.6%) | 85 (7.5%) |
| 4:00 PM to 11:59 PM | 135 (14.6%) | 19 (1.7%) |
| Total | 923 (100.0%) | 1,128 (100.0%) |
Housing Occupancy in Metropolis
Occupancy by Ownership in Metropolis
Of the total 2,469 dwellings in Metropolis, owner-occupied units account for 1,650 (66.8%), while renter-occupied units make up 819 (33.2%).
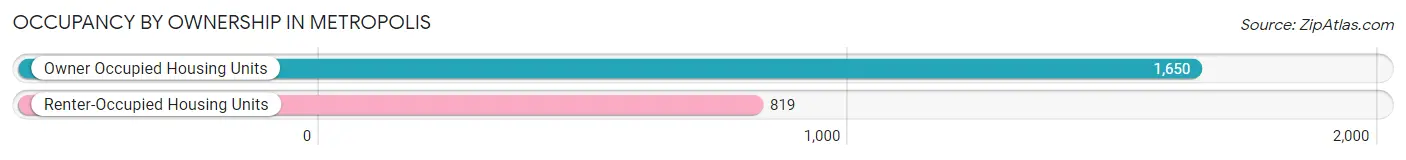
| Occupancy | # Housing Units | % Housing Units |
| Owner Occupied Housing Units | 1,650 | 66.8% |
| Renter-Occupied Housing Units | 819 | 33.2% |
| Total Occupied Housing Units | 2,469 | 100.0% |
Occupancy by Household Size in Metropolis
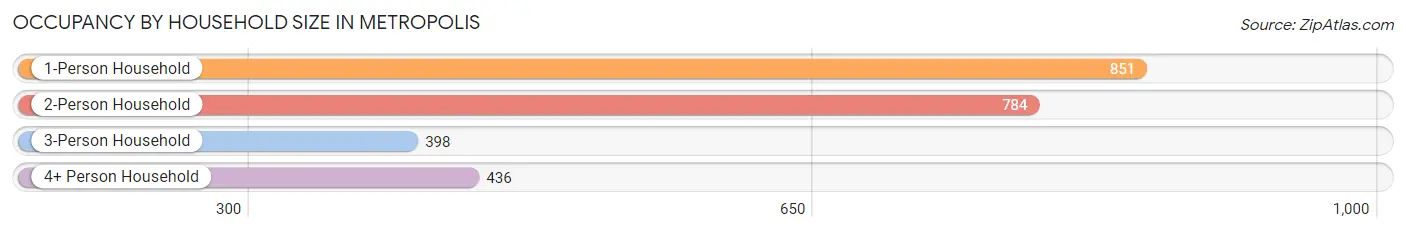
| Household Size | # Housing Units | % Housing Units |
| 1-Person Household | 851 | 34.5% |
| 2-Person Household | 784 | 31.8% |
| 3-Person Household | 398 | 16.1% |
| 4+ Person Household | 436 | 17.7% |
| Total Housing Units | 2,469 | 100.0% |
Occupancy by Ownership by Household Size in Metropolis
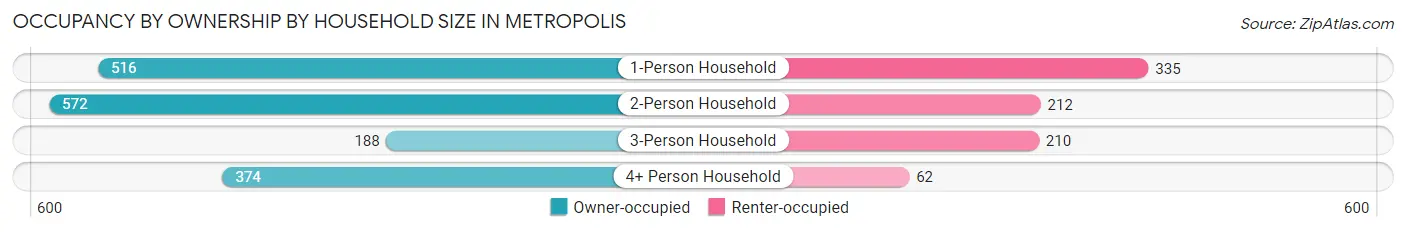
| Household Size | Owner-occupied | Renter-occupied |
| 1-Person Household | 516 (60.6%) | 335 (39.4%) |
| 2-Person Household | 572 (73.0%) | 212 (27.0%) |
| 3-Person Household | 188 (47.2%) | 210 (52.8%) |
| 4+ Person Household | 374 (85.8%) | 62 (14.2%) |
| Total Housing Units | 1,650 (66.8%) | 819 (33.2%) |
Occupancy by Educational Attainment in Metropolis
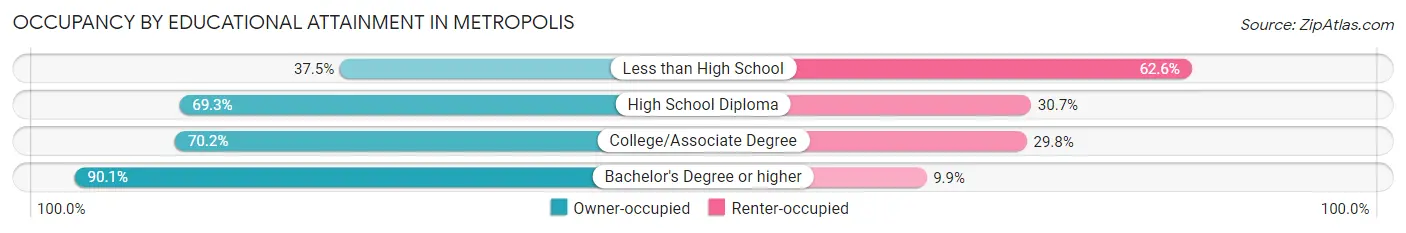
| Household Size | Owner-occupied | Renter-occupied |
| Less than High School | 176 (37.4%) | 294 (62.5%) |
| High School Diploma | 574 (69.3%) | 254 (30.7%) |
| College/Associate Degree | 546 (70.2%) | 232 (29.8%) |
| Bachelor's Degree or higher | 354 (90.1%) | 39 (9.9%) |
Occupancy by Age of Householder in Metropolis
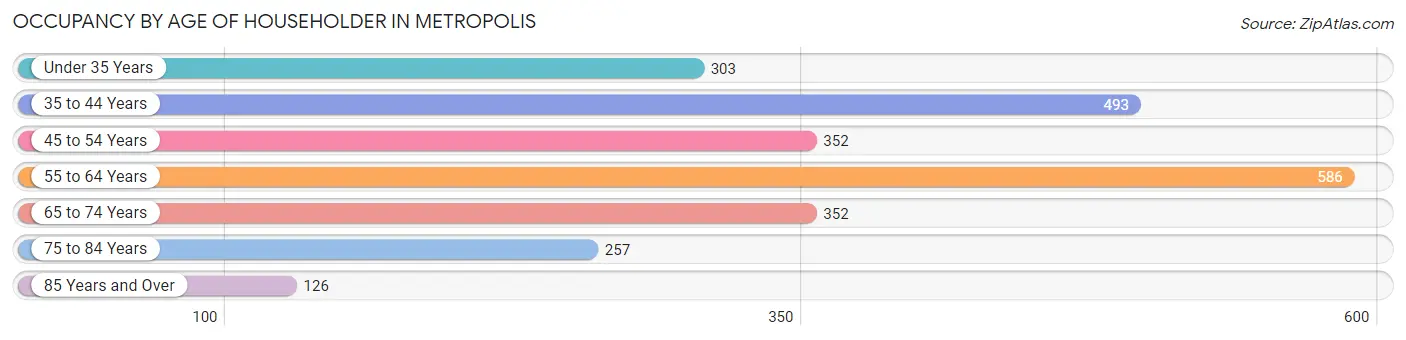
| Age Bracket | # Households | % Households |
| Under 35 Years | 303 | 12.3% |
| 35 to 44 Years | 493 | 20.0% |
| 45 to 54 Years | 352 | 14.3% |
| 55 to 64 Years | 586 | 23.7% |
| 65 to 74 Years | 352 | 14.3% |
| 75 to 84 Years | 257 | 10.4% |
| 85 Years and Over | 126 | 5.1% |
| Total | 2,469 | 100.0% |
Housing Finances in Metropolis
Median Income by Occupancy in Metropolis
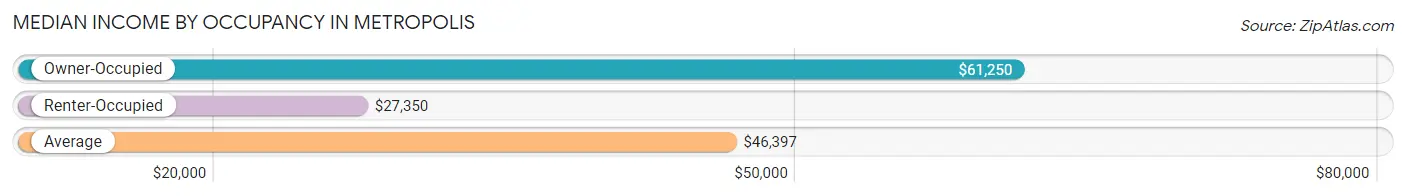
| Occupancy Type | # Households | Median Income |
| Owner-Occupied | 1,650 (66.8%) | $61,250 |
| Renter-Occupied | 819 (33.2%) | $27,350 |
| Average | 2,469 (100.0%) | $46,397 |
Occupancy by Householder Income Bracket in Metropolis
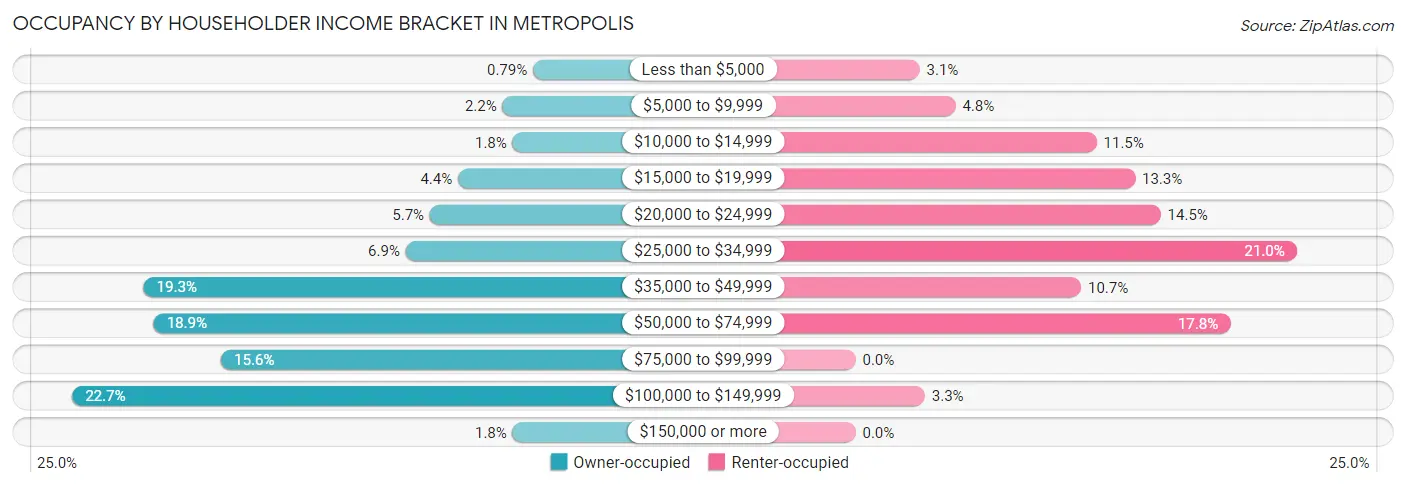
| Income Bracket | Owner-occupied | Renter-occupied |
| Less than $5,000 | 13 (0.8%) | 25 (3.0%) |
| $5,000 to $9,999 | 37 (2.2%) | 39 (4.8%) |
| $10,000 to $14,999 | 29 (1.8%) | 94 (11.5%) |
| $15,000 to $19,999 | 72 (4.4%) | 109 (13.3%) |
| $20,000 to $24,999 | 94 (5.7%) | 119 (14.5%) |
| $25,000 to $34,999 | 113 (6.9%) | 172 (21.0%) |
| $35,000 to $49,999 | 319 (19.3%) | 88 (10.7%) |
| $50,000 to $74,999 | 311 (18.9%) | 146 (17.8%) |
| $75,000 to $99,999 | 258 (15.6%) | 0 (0.0%) |
| $100,000 to $149,999 | 375 (22.7%) | 27 (3.3%) |
| $150,000 or more | 29 (1.8%) | 0 (0.0%) |
| Total | 1,650 (100.0%) | 819 (100.0%) |
Monthly Housing Cost Tiers in Metropolis
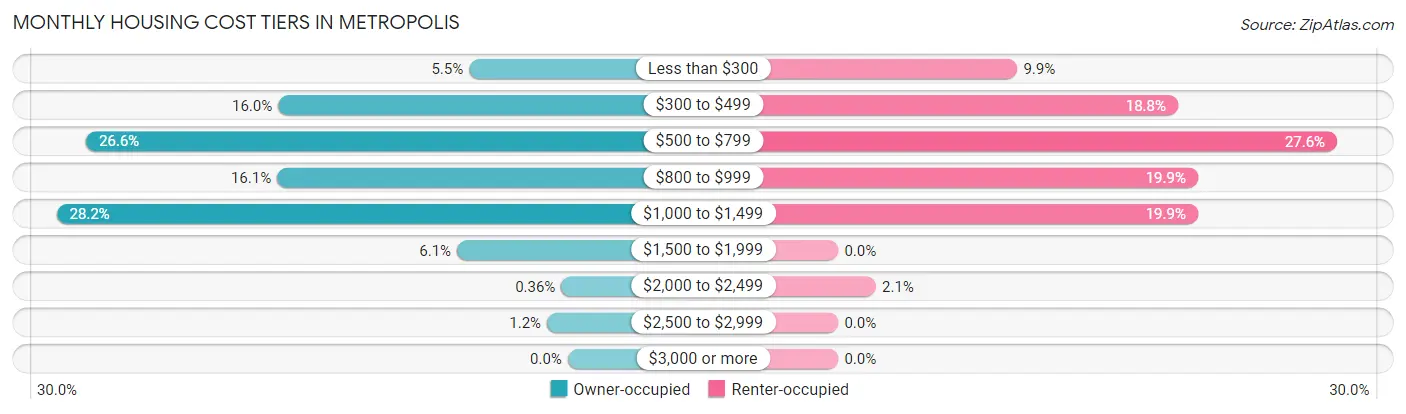
| Monthly Cost | Owner-occupied | Renter-occupied |
| Less than $300 | 90 (5.4%) | 81 (9.9%) |
| $300 to $499 | 264 (16.0%) | 154 (18.8%) |
| $500 to $799 | 439 (26.6%) | 226 (27.6%) |
| $800 to $999 | 265 (16.1%) | 163 (19.9%) |
| $1,000 to $1,499 | 466 (28.2%) | 163 (19.9%) |
| $1,500 to $1,999 | 101 (6.1%) | 0 (0.0%) |
| $2,000 to $2,499 | 6 (0.4%) | 17 (2.1%) |
| $2,500 to $2,999 | 19 (1.1%) | 0 (0.0%) |
| $3,000 or more | 0 (0.0%) | 0 (0.0%) |
| Total | 1,650 (100.0%) | 819 (100.0%) |
Physical Housing Characteristics in Metropolis
Housing Structures in Metropolis
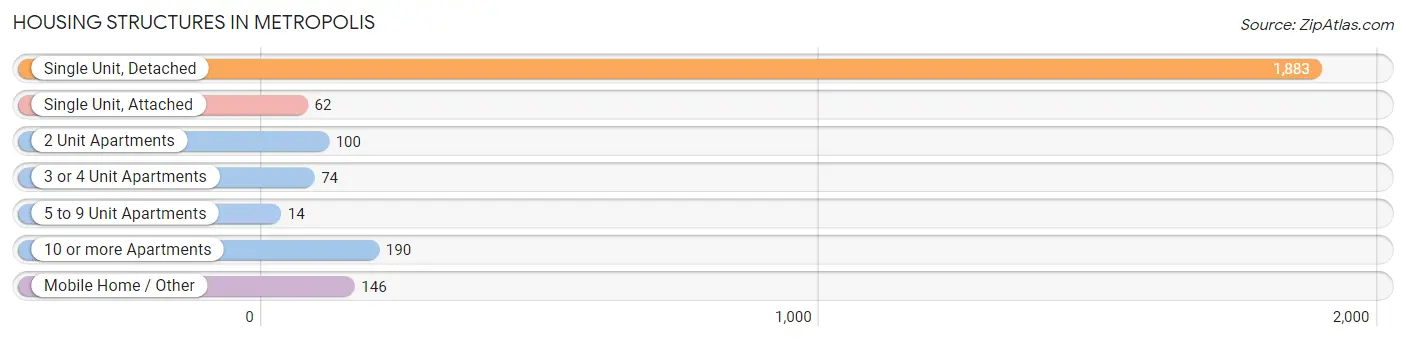
| Structure Type | # Housing Units | % Housing Units |
| Single Unit, Detached | 1,883 | 76.3% |
| Single Unit, Attached | 62 | 2.5% |
| 2 Unit Apartments | 100 | 4.1% |
| 3 or 4 Unit Apartments | 74 | 3.0% |
| 5 to 9 Unit Apartments | 14 | 0.6% |
| 10 or more Apartments | 190 | 7.7% |
| Mobile Home / Other | 146 | 5.9% |
| Total | 2,469 | 100.0% |
Housing Structures by Occupancy in Metropolis
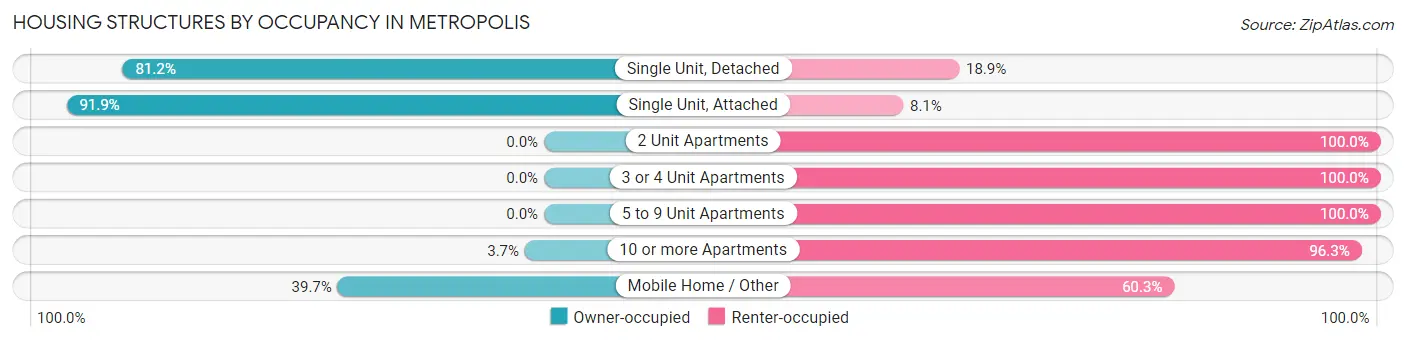
| Structure Type | Owner-occupied | Renter-occupied |
| Single Unit, Detached | 1,528 (81.1%) | 355 (18.9%) |
| Single Unit, Attached | 57 (91.9%) | 5 (8.1%) |
| 2 Unit Apartments | 0 (0.0%) | 100 (100.0%) |
| 3 or 4 Unit Apartments | 0 (0.0%) | 74 (100.0%) |
| 5 to 9 Unit Apartments | 0 (0.0%) | 14 (100.0%) |
| 10 or more Apartments | 7 (3.7%) | 183 (96.3%) |
| Mobile Home / Other | 58 (39.7%) | 88 (60.3%) |
| Total | 1,650 (66.8%) | 819 (33.2%) |
Housing Structures by Number of Rooms in Metropolis
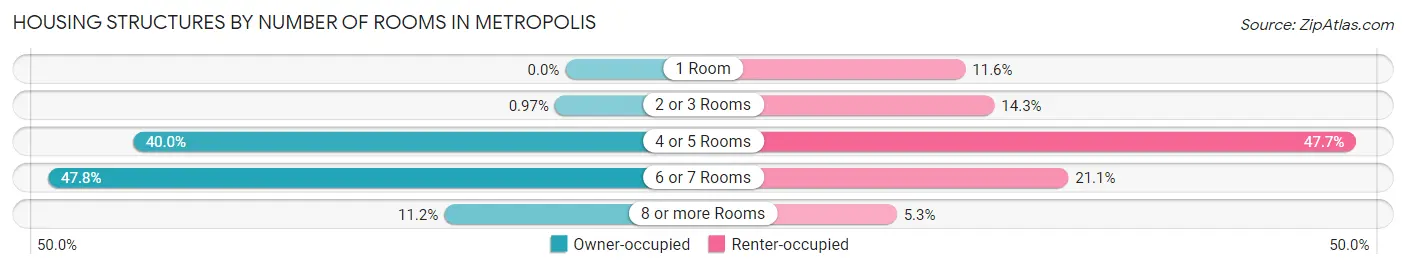
| Number of Rooms | Owner-occupied | Renter-occupied |
| 1 Room | 0 (0.0%) | 95 (11.6%) |
| 2 or 3 Rooms | 16 (1.0%) | 117 (14.3%) |
| 4 or 5 Rooms | 660 (40.0%) | 391 (47.7%) |
| 6 or 7 Rooms | 789 (47.8%) | 173 (21.1%) |
| 8 or more Rooms | 185 (11.2%) | 43 (5.2%) |
| Total | 1,650 (100.0%) | 819 (100.0%) |
Housing Structure by Heating Type in Metropolis
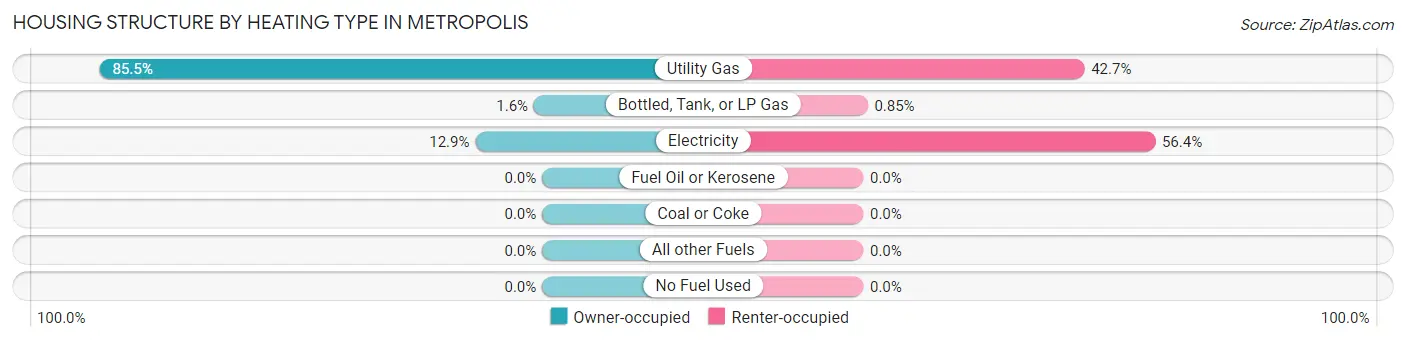
| Heating Type | Owner-occupied | Renter-occupied |
| Utility Gas | 1,411 (85.5%) | 350 (42.7%) |
| Bottled, Tank, or LP Gas | 26 (1.6%) | 7 (0.9%) |
| Electricity | 213 (12.9%) | 462 (56.4%) |
| Fuel Oil or Kerosene | 0 (0.0%) | 0 (0.0%) |
| Coal or Coke | 0 (0.0%) | 0 (0.0%) |
| All other Fuels | 0 (0.0%) | 0 (0.0%) |
| No Fuel Used | 0 (0.0%) | 0 (0.0%) |
| Total | 1,650 (100.0%) | 819 (100.0%) |
Household Vehicle Usage in Metropolis
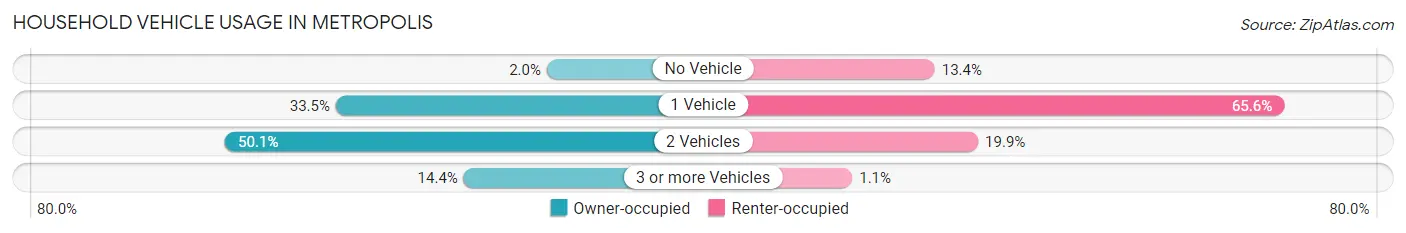
| Vehicles per Household | Owner-occupied | Renter-occupied |
| No Vehicle | 33 (2.0%) | 110 (13.4%) |
| 1 Vehicle | 553 (33.5%) | 537 (65.6%) |
| 2 Vehicles | 826 (50.1%) | 163 (19.9%) |
| 3 or more Vehicles | 238 (14.4%) | 9 (1.1%) |
| Total | 1,650 (100.0%) | 819 (100.0%) |
Real Estate & Mortgages in Metropolis
Real Estate and Mortgage Overview in Metropolis
| Characteristic | Without Mortgage | With Mortgage |
| Housing Units | 672 | 978 |
| Median Property Value | $98,400 | $97,100 |
| Median Household Income | $54,621 | $21 |
| Monthly Housing Costs | $493 | $0 |
| Real Estate Taxes | $1,406 | $30 |
Property Value by Mortgage Status in Metropolis
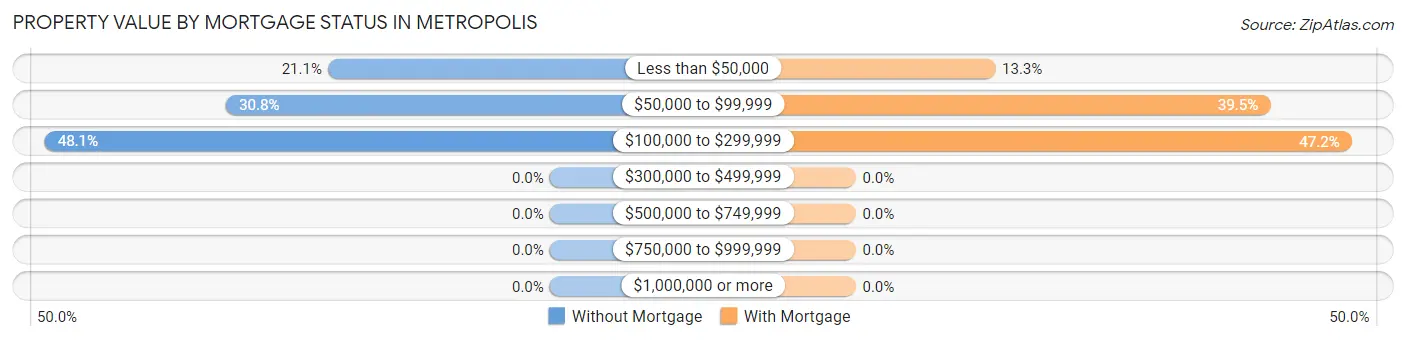
| Property Value | Without Mortgage | With Mortgage |
| Less than $50,000 | 142 (21.1%) | 130 (13.3%) |
| $50,000 to $99,999 | 207 (30.8%) | 386 (39.5%) |
| $100,000 to $299,999 | 323 (48.1%) | 462 (47.2%) |
| $300,000 to $499,999 | 0 (0.0%) | 0 (0.0%) |
| $500,000 to $749,999 | 0 (0.0%) | 0 (0.0%) |
| $750,000 to $999,999 | 0 (0.0%) | 0 (0.0%) |
| $1,000,000 or more | 0 (0.0%) | 0 (0.0%) |
| Total | 672 (100.0%) | 978 (100.0%) |
Household Income by Mortgage Status in Metropolis
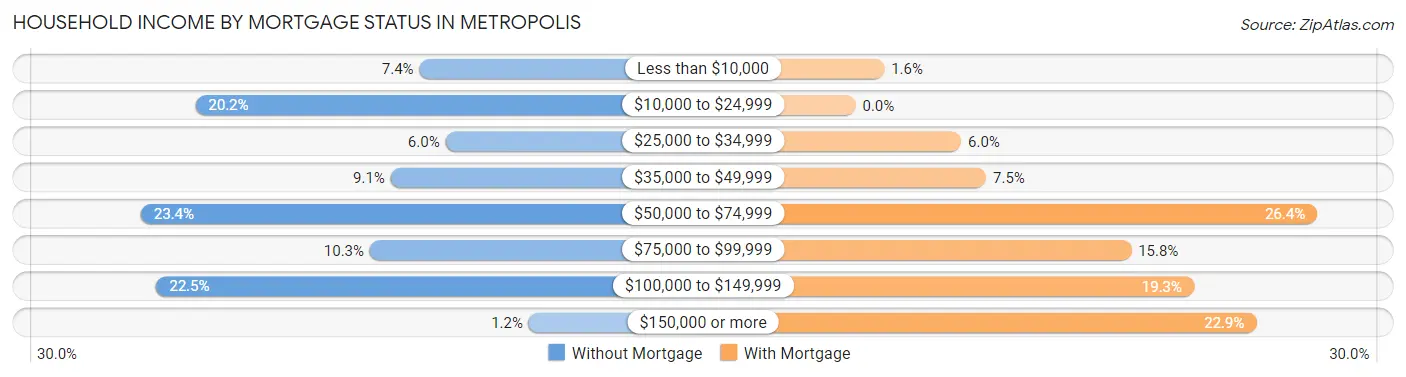
| Household Income | Without Mortgage | With Mortgage |
| Less than $10,000 | 50 (7.4%) | 16 (1.6%) |
| $10,000 to $24,999 | 136 (20.2%) | 0 (0.0%) |
| $25,000 to $34,999 | 40 (5.9%) | 59 (6.0%) |
| $35,000 to $49,999 | 61 (9.1%) | 73 (7.5%) |
| $50,000 to $74,999 | 157 (23.4%) | 258 (26.4%) |
| $75,000 to $99,999 | 69 (10.3%) | 154 (15.8%) |
| $100,000 to $149,999 | 151 (22.5%) | 189 (19.3%) |
| $150,000 or more | 8 (1.2%) | 224 (22.9%) |
| Total | 672 (100.0%) | 978 (100.0%) |
Property Value to Household Income Ratio in Metropolis
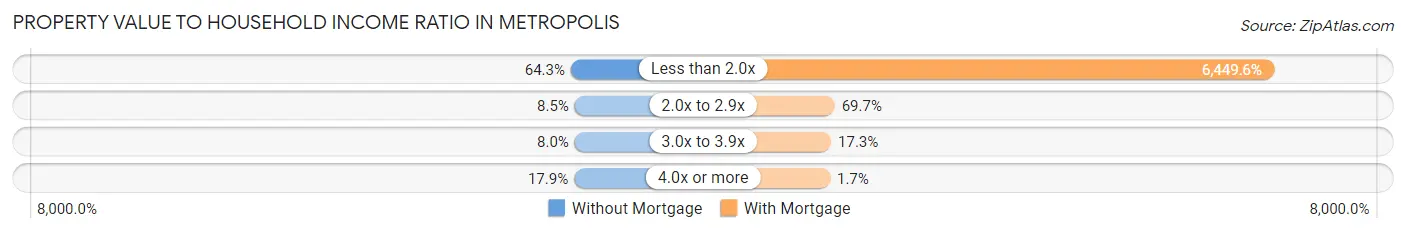
| Value-to-Income Ratio | Without Mortgage | With Mortgage |
| Less than 2.0x | 432 (64.3%) | 63,077 (6,449.6%) |
| 2.0x to 2.9x | 57 (8.5%) | 682 (69.7%) |
| 3.0x to 3.9x | 54 (8.0%) | 169 (17.3%) |
| 4.0x or more | 120 (17.9%) | 17 (1.7%) |
| Total | 672 (100.0%) | 978 (100.0%) |
Real Estate Taxes by Mortgage Status in Metropolis
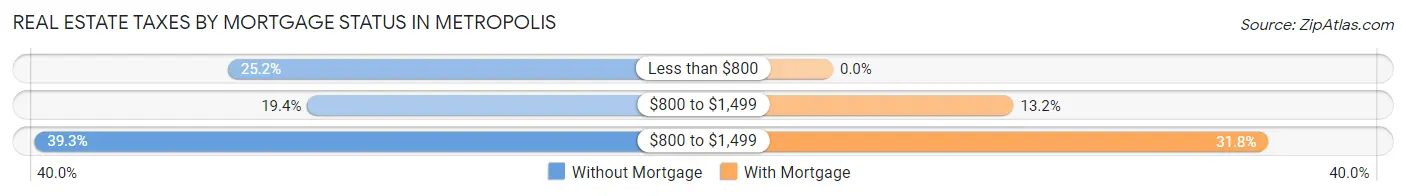
| Property Taxes | Without Mortgage | With Mortgage |
| Less than $800 | 169 (25.2%) | 0 (0.0%) |
| $800 to $1,499 | 130 (19.4%) | 129 (13.2%) |
| $800 to $1,499 | 264 (39.3%) | 311 (31.8%) |
| Total | 672 (100.0%) | 978 (100.0%) |
Health & Disability in Metropolis
Health Insurance Coverage by Age in Metropolis
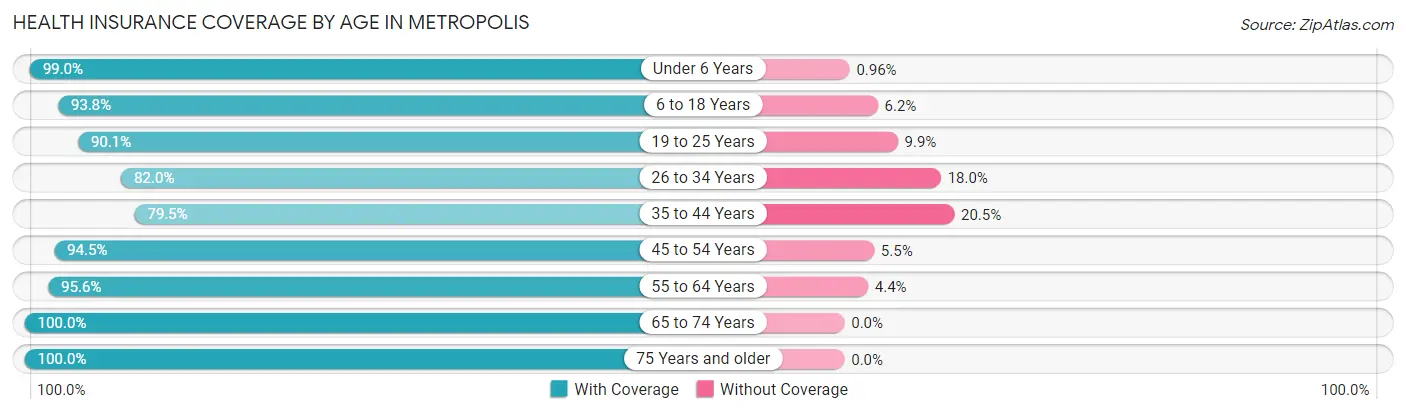
| Age Bracket | With Coverage | Without Coverage |
| Under 6 Years | 308 (99.0%) | 3 (1.0%) |
| 6 to 18 Years | 951 (93.8%) | 63 (6.2%) |
| 19 to 25 Years | 281 (90.1%) | 31 (9.9%) |
| 26 to 34 Years | 470 (82.0%) | 103 (18.0%) |
| 35 to 44 Years | 645 (79.5%) | 166 (20.5%) |
| 45 to 54 Years | 668 (94.5%) | 39 (5.5%) |
| 55 to 64 Years | 806 (95.6%) | 37 (4.4%) |
| 65 to 74 Years | 547 (100.0%) | 0 (0.0%) |
| 75 Years and older | 634 (100.0%) | 0 (0.0%) |
| Total | 5,310 (92.3%) | 442 (7.7%) |
Health Insurance Coverage by Citizenship Status in Metropolis
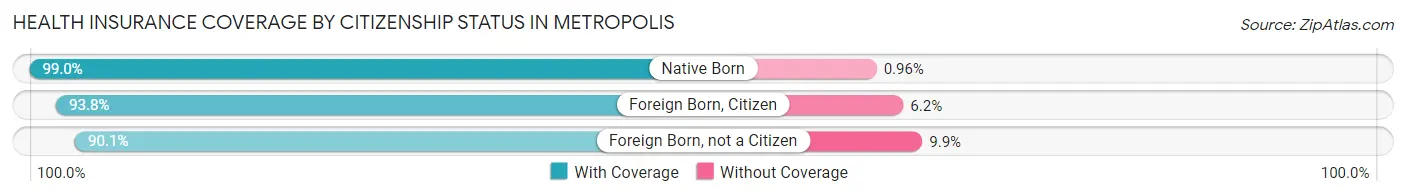
| Citizenship Status | With Coverage | Without Coverage |
| Native Born | 308 (99.0%) | 3 (1.0%) |
| Foreign Born, Citizen | 951 (93.8%) | 63 (6.2%) |
| Foreign Born, not a Citizen | 281 (90.1%) | 31 (9.9%) |
Health Insurance Coverage by Household Income in Metropolis
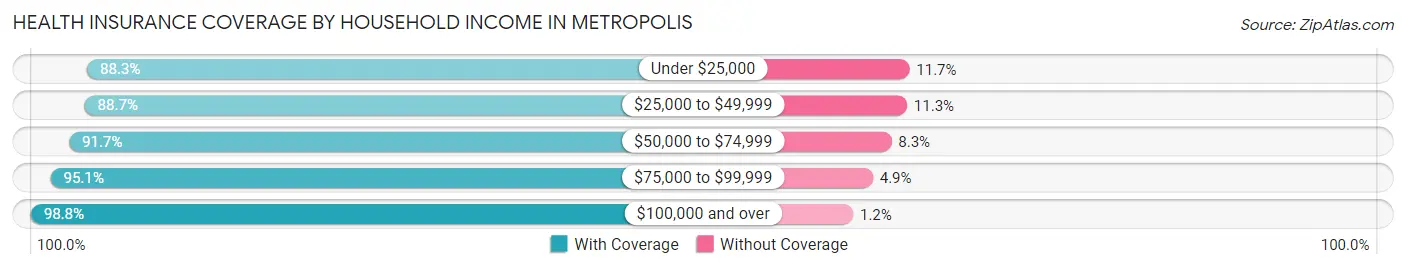
| Household Income | With Coverage | Without Coverage |
| Under $25,000 | 866 (88.3%) | 115 (11.7%) |
| $25,000 to $49,999 | 1,544 (88.7%) | 196 (11.3%) |
| $50,000 to $74,999 | 912 (91.7%) | 83 (8.3%) |
| $75,000 to $99,999 | 644 (95.1%) | 33 (4.9%) |
| $100,000 and over | 1,271 (98.8%) | 15 (1.2%) |
Public vs Private Health Insurance Coverage by Age in Metropolis
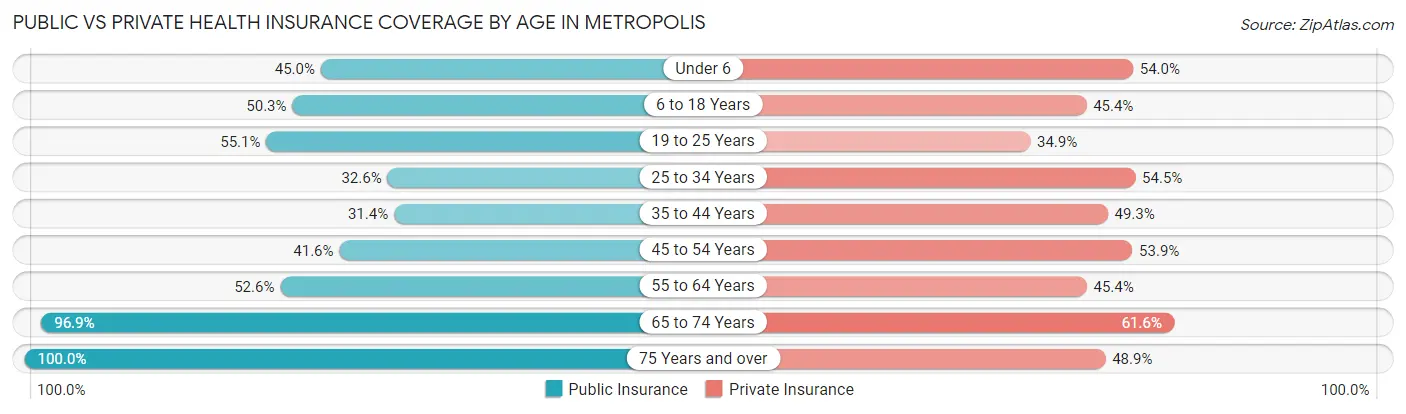
| Age Bracket | Public Insurance | Private Insurance |
| Under 6 | 140 (45.0%) | 168 (54.0%) |
| 6 to 18 Years | 510 (50.3%) | 460 (45.4%) |
| 19 to 25 Years | 172 (55.1%) | 109 (34.9%) |
| 25 to 34 Years | 187 (32.6%) | 312 (54.4%) |
| 35 to 44 Years | 255 (31.4%) | 400 (49.3%) |
| 45 to 54 Years | 294 (41.6%) | 381 (53.9%) |
| 55 to 64 Years | 443 (52.5%) | 383 (45.4%) |
| 65 to 74 Years | 530 (96.9%) | 337 (61.6%) |
| 75 Years and over | 634 (100.0%) | 310 (48.9%) |
| Total | 3,165 (55.0%) | 2,860 (49.7%) |
Disability Status by Sex by Age in Metropolis
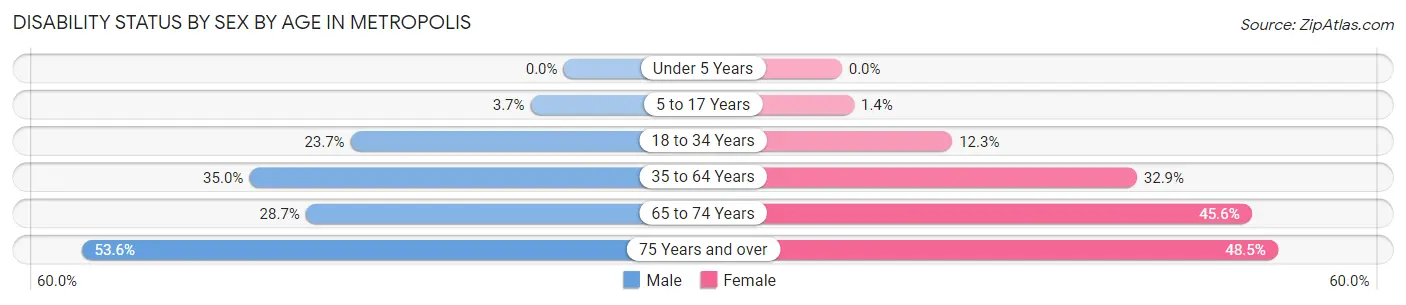
| Age Bracket | Male | Female |
| Under 5 Years | 0 (0.0%) | 0 (0.0%) |
| 5 to 17 Years | 18 (3.7%) | 7 (1.4%) |
| 18 to 34 Years | 101 (23.7%) | 63 (12.3%) |
| 35 to 64 Years | 380 (35.0%) | 419 (32.9%) |
| 65 to 74 Years | 62 (28.7%) | 151 (45.6%) |
| 75 Years and over | 140 (53.6%) | 181 (48.5%) |
Disability Class by Sex by Age in Metropolis
Disability Class: Hearing Difficulty
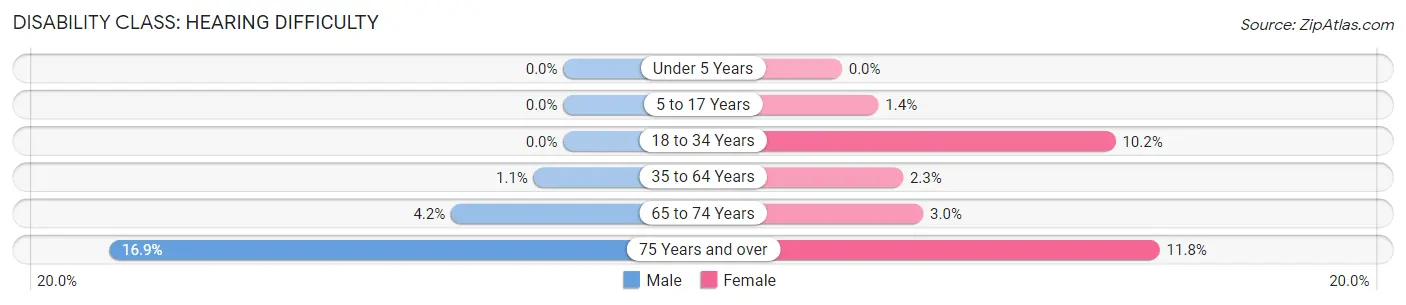
| Age Bracket | Male | Female |
| Under 5 Years | 0 (0.0%) | 0 (0.0%) |
| 5 to 17 Years | 0 (0.0%) | 7 (1.4%) |
| 18 to 34 Years | 0 (0.0%) | 52 (10.2%) |
| 35 to 64 Years | 12 (1.1%) | 29 (2.3%) |
| 65 to 74 Years | 9 (4.2%) | 10 (3.0%) |
| 75 Years and over | 44 (16.9%) | 44 (11.8%) |
Disability Class: Vision Difficulty
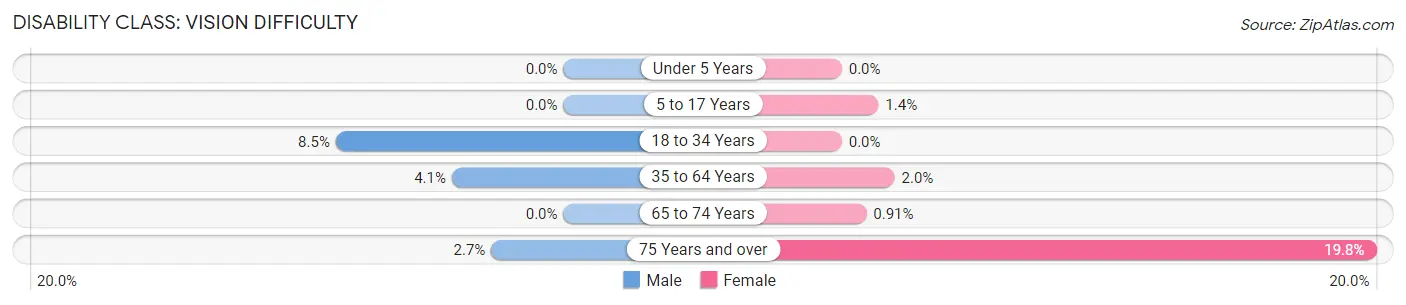
| Age Bracket | Male | Female |
| Under 5 Years | 0 (0.0%) | 0 (0.0%) |
| 5 to 17 Years | 0 (0.0%) | 7 (1.4%) |
| 18 to 34 Years | 36 (8.5%) | 0 (0.0%) |
| 35 to 64 Years | 45 (4.1%) | 25 (2.0%) |
| 65 to 74 Years | 0 (0.0%) | 3 (0.9%) |
| 75 Years and over | 7 (2.7%) | 74 (19.8%) |
Disability Class: Cognitive Difficulty
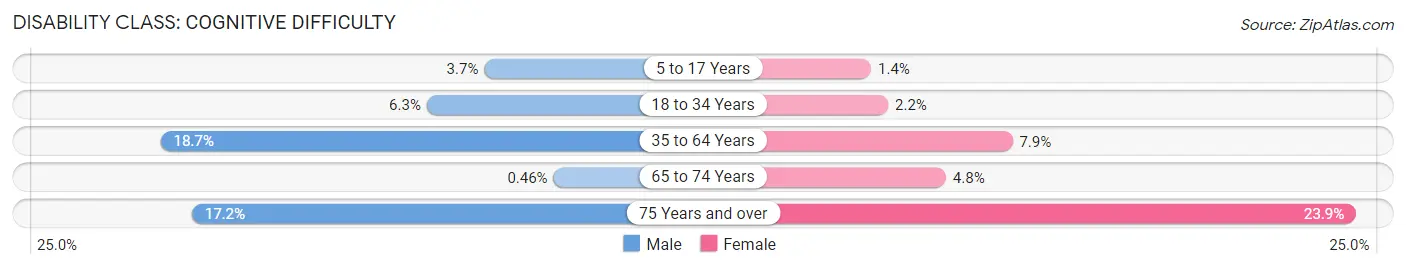
| Age Bracket | Male | Female |
| 5 to 17 Years | 18 (3.7%) | 7 (1.4%) |
| 18 to 34 Years | 27 (6.3%) | 11 (2.1%) |
| 35 to 64 Years | 203 (18.7%) | 101 (7.9%) |
| 65 to 74 Years | 1 (0.5%) | 16 (4.8%) |
| 75 Years and over | 45 (17.2%) | 89 (23.9%) |
Disability Class: Ambulatory Difficulty
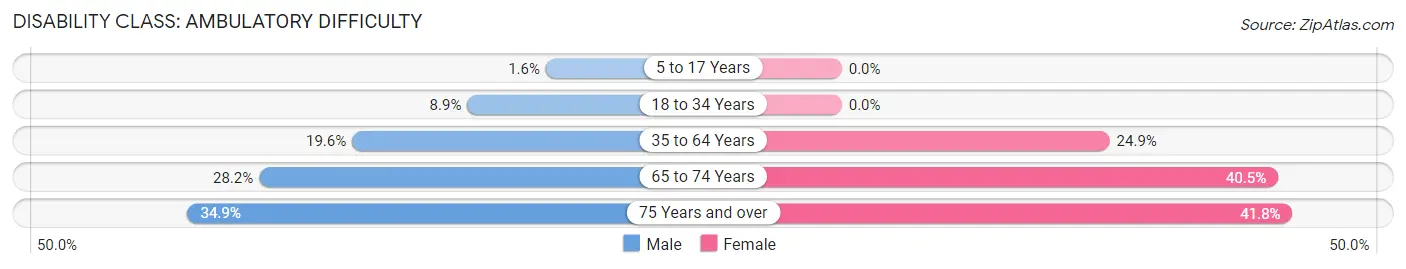
| Age Bracket | Male | Female |
| 5 to 17 Years | 8 (1.6%) | 0 (0.0%) |
| 18 to 34 Years | 38 (8.9%) | 0 (0.0%) |
| 35 to 64 Years | 213 (19.6%) | 317 (24.9%) |
| 65 to 74 Years | 61 (28.2%) | 134 (40.5%) |
| 75 Years and over | 91 (34.9%) | 156 (41.8%) |
Disability Class: Self-Care Difficulty
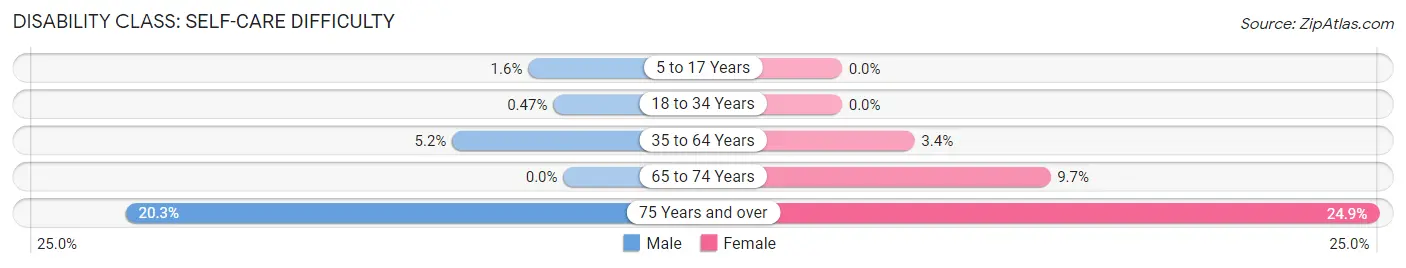
| Age Bracket | Male | Female |
| 5 to 17 Years | 8 (1.6%) | 0 (0.0%) |
| 18 to 34 Years | 2 (0.5%) | 0 (0.0%) |
| 35 to 64 Years | 56 (5.2%) | 43 (3.4%) |
| 65 to 74 Years | 0 (0.0%) | 32 (9.7%) |
| 75 Years and over | 53 (20.3%) | 93 (24.9%) |
Technology Access in Metropolis
Computing Device Access in Metropolis
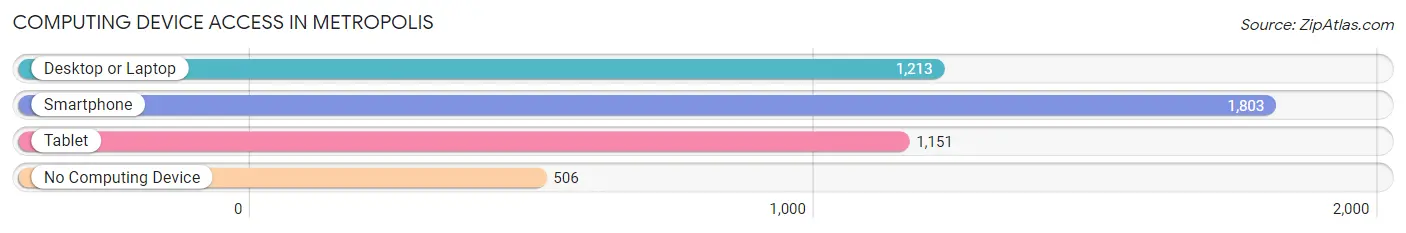
| Device Type | # Households | % Households |
| Desktop or Laptop | 1,213 | 49.1% |
| Smartphone | 1,803 | 73.0% |
| Tablet | 1,151 | 46.6% |
| No Computing Device | 506 | 20.5% |
| Total | 2,469 | 100.0% |
Internet Access in Metropolis
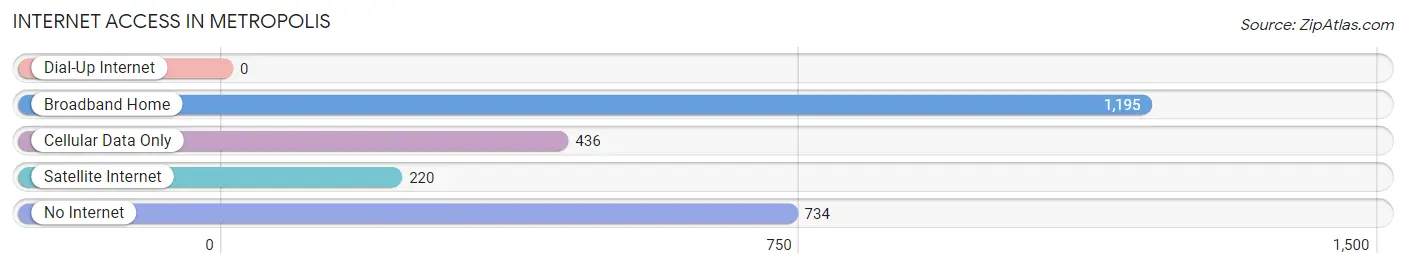
| Internet Type | # Households | % Households |
| Dial-Up Internet | 0 | 0.0% |
| Broadband Home | 1,195 | 48.4% |
| Cellular Data Only | 436 | 17.7% |
| Satellite Internet | 220 | 8.9% |
| No Internet | 734 | 29.7% |
| Total | 2,469 | 100.0% |
Metropolis Summary
Metropolis, Illinois is a small city located in the far southern tip of the state, along the banks of the Ohio River. It is the county seat of Massac County and is the largest city in the county. The city is known for its rich history, diverse geography, and vibrant economy.
History
Metropolis was founded in 1839 by John W. Marshall, a local businessman. The city was named after the Greek word for “mother city” and was intended to be a hub of commerce and industry for the region. The city quickly grew and by the mid-1800s, it was a bustling port town with a population of over 1,000.
During the Civil War, Metropolis was a major supply center for the Union Army. The city was also the site of a major battle in 1862, when Confederate forces attempted to take control of the city. The Union forces were able to repel the attack and the city remained in Union hands for the remainder of the war.
In the late 1800s, Metropolis experienced a period of rapid growth and development. The city was home to several factories and businesses, including a large steel mill. The city also became a major transportation hub, with several railroads connecting it to other cities in the region.
Geography
Metropolis is located in the far southern tip of Illinois, along the banks of the Ohio River. The city is situated in a flat, low-lying area, with the Ohio River forming the western border. The city is surrounded by rolling hills and wooded areas, with the Shawnee National Forest located to the south.
The climate in Metropolis is humid continental, with hot, humid summers and cold, wet winters. The average annual temperature is around 54 degrees Fahrenheit, with an average annual precipitation of around 40 inches.
Economy
Metropolis has a diverse economy, with a variety of industries and businesses. The city is home to several manufacturing companies, including a large steel mill. The city is also home to several retail stores, restaurants, and other businesses.
The city is also home to several educational institutions, including a community college and a technical school. The city is also home to a large medical center, which provides healthcare services to the region.
Demographics
As of the 2010 census, the population of Metropolis was 6,465. The city has a diverse population, with a variety of ethnic and racial backgrounds. The largest racial group is white, making up around 75% of the population. The other major racial groups are African American (14%), Hispanic (7%), and Asian (3%).
The median household income in Metropolis is around $37,000, which is slightly lower than the national average. The city has a higher than average poverty rate, with around 20% of the population living below the poverty line.
Metropolis is a small city with a rich history, diverse geography, and vibrant economy. The city is home to a variety of businesses and industries, as well as several educational institutions. The city has a diverse population, with a variety of ethnic and racial backgrounds. The city has a lower than average median household income and a higher than average poverty rate.
Common Questions
What is Per Capita Income in Metropolis?
Per Capita income in Metropolis is $23,370.
What is the Median Family Income in Metropolis?
Median Family Income in Metropolis is $55,237.
What is the Median Household income in Metropolis?
Median Household Income in Metropolis is $46,397.
What is Income or Wage Gap in Metropolis?
Income or Wage Gap in Metropolis is 37.4%.
Women in Metropolis earn 62.6 cents for every dollar earned by a man.
What is Family Income Deficit in Metropolis?
Family Income Deficit in Metropolis is $8,459.
Families that are below poverty line in Metropolis earn $8,459 less on average than the poverty threshold level.
What is Inequality or Gini Index in Metropolis?
Inequality or Gini Index in Metropolis is 0.38.
What is the Total Population of Metropolis?
Total Population of Metropolis is 5,963.
What is the Total Male Population of Metropolis?
Total Male Population of Metropolis is 2,625.
What is the Total Female Population of Metropolis?
Total Female Population of Metropolis is 3,338.
What is the Ratio of Males per 100 Females in Metropolis?
There are 78.64 Males per 100 Females in Metropolis.
What is the Ratio of Females per 100 Males in Metropolis?
There are 127.16 Females per 100 Males in Metropolis.
What is the Median Population Age in Metropolis?
Median Population Age in Metropolis is 43.9 Years.
What is the Average Family Size in Metropolis
Average Family Size in Metropolis is 3.0 People.
What is the Average Household Size in Metropolis
Average Household Size in Metropolis is 2.3 People.
How Large is the Labor Force in Metropolis?
There are 2,220 People in the Labor Forcein in Metropolis.
What is the Percentage of People in the Labor Force in Metropolis?
46.1% of People are in the Labor Force in Metropolis.
What is the Unemployment Rate in Metropolis?
Unemployment Rate in Metropolis is 2.2%.