Media, IL Map & Demographics
Media Map
Media Overview
$31,665
PER CAPITA INCOME
$70,714
AVG FAMILY INCOME
$70,357
AVG HOUSEHOLD INCOME
10.0%
WAGE / INCOME GAP [ % ]
90.0¢/ $1
WAGE / INCOME GAP [ $ ]
0.40
INEQUALITY / GINI INDEX
113
TOTAL POPULATION
60
MALE POPULATION
53
FEMALE POPULATION
113.21
MALES / 100 FEMALES
88.33
FEMALES / 100 MALES
49.1
MEDIAN AGE
2.8
AVG FAMILY SIZE
2.4
AVG HOUSEHOLD SIZE
57
LABOR FORCE [ PEOPLE ]
59.4%
PERCENT IN LABOR FORCE
Media Zip Codes
Media Area Codes
Income in Media
Income Overview in Media
Per Capita Income in Media is $31,665, while median incomes of families and households are $70,714 and $70,357 respectively.
| Characteristic | Number | Measure |
| Per Capita Income | 113 | $31,665 |
| Median Family Income | 34 | $70,714 |
| Mean Family Income | 34 | $71,691 |
| Median Household Income | 48 | $70,357 |
| Mean Household Income | 48 | $76,531 |
| Income Deficit | 34 | $0 |
| Wage / Income Gap (%) | 113 | 10.00% |
| Wage / Income Gap ($) | 113 | 90.00¢ per $1 |
| Gini / Inequality Index | 113 | 0.40 |
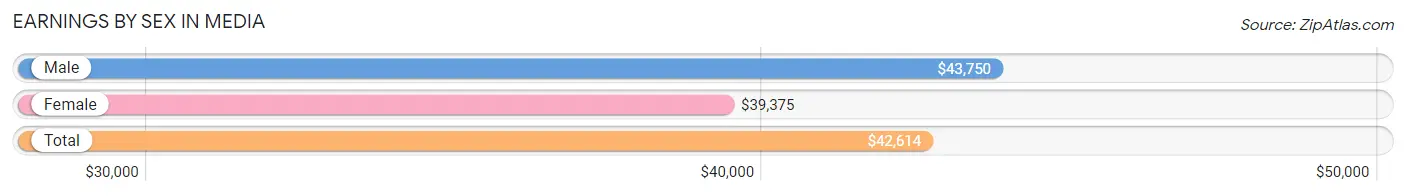
Earnings by Sex in Media
Average Earnings in Media are $42,614, $43,750 for men and $39,375 for women, a difference of 10.0%.
| Sex | Number | Average Earnings |
| Male | 29 (49.1%) | $43,750 |
| Female | 30 (50.8%) | $39,375 |
| Total | 59 (100.0%) | $42,614 |
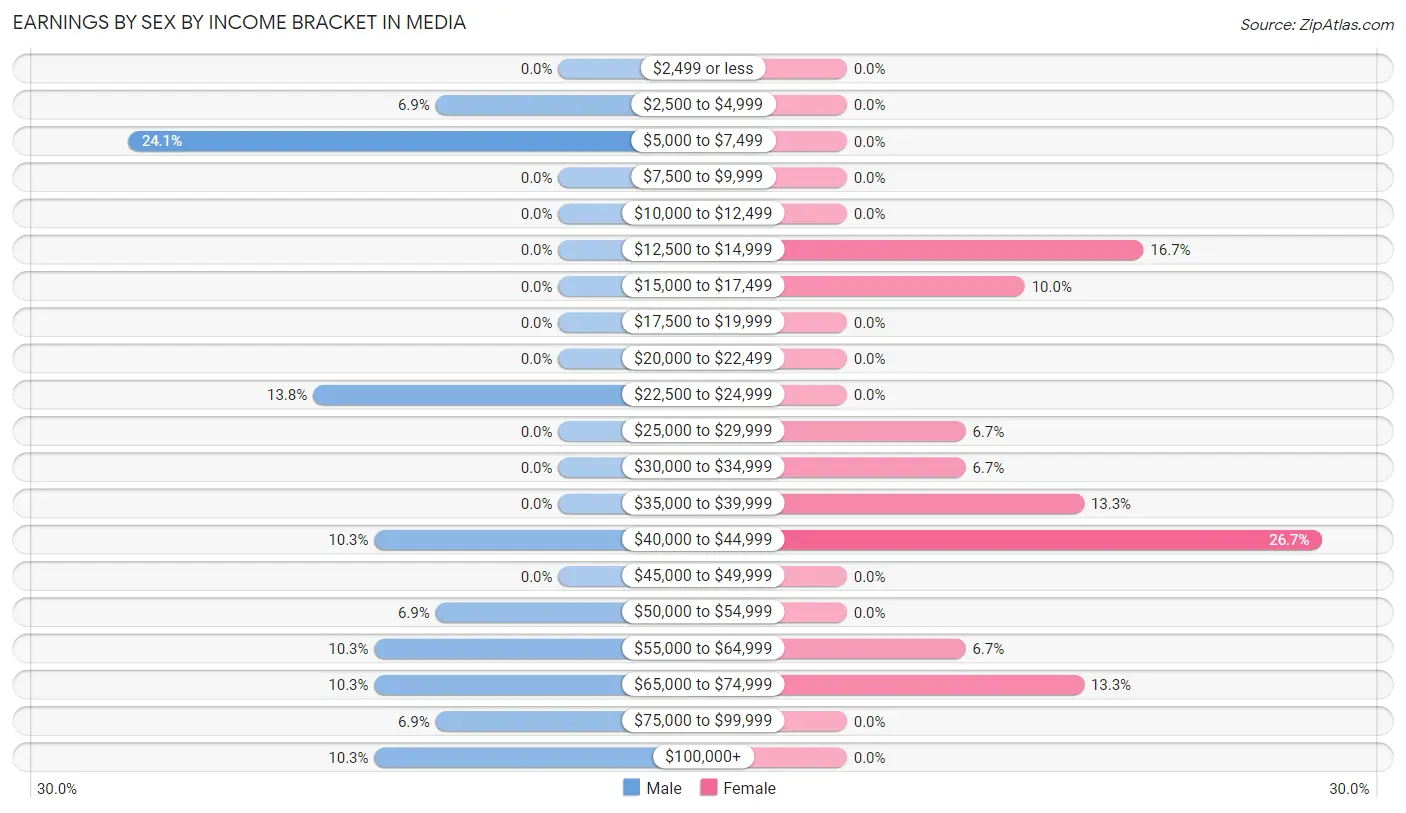
Earnings by Sex by Income Bracket in Media
The most common earnings brackets in Media are $5,000 to $7,499 for men (7 | 24.1%) and $40,000 to $44,999 for women (8 | 26.7%).
| Income | Male | Female |
| $2,499 or less | 0 (0.0%) | 0 (0.0%) |
| $2,500 to $4,999 | 2 (6.9%) | 0 (0.0%) |
| $5,000 to $7,499 | 7 (24.1%) | 0 (0.0%) |
| $7,500 to $9,999 | 0 (0.0%) | 0 (0.0%) |
| $10,000 to $12,499 | 0 (0.0%) | 0 (0.0%) |
| $12,500 to $14,999 | 0 (0.0%) | 5 (16.7%) |
| $15,000 to $17,499 | 0 (0.0%) | 3 (10.0%) |
| $17,500 to $19,999 | 0 (0.0%) | 0 (0.0%) |
| $20,000 to $22,499 | 0 (0.0%) | 0 (0.0%) |
| $22,500 to $24,999 | 4 (13.8%) | 0 (0.0%) |
| $25,000 to $29,999 | 0 (0.0%) | 2 (6.7%) |
| $30,000 to $34,999 | 0 (0.0%) | 2 (6.7%) |
| $35,000 to $39,999 | 0 (0.0%) | 4 (13.3%) |
| $40,000 to $44,999 | 3 (10.3%) | 8 (26.7%) |
| $45,000 to $49,999 | 0 (0.0%) | 0 (0.0%) |
| $50,000 to $54,999 | 2 (6.9%) | 0 (0.0%) |
| $55,000 to $64,999 | 3 (10.3%) | 2 (6.7%) |
| $65,000 to $74,999 | 3 (10.3%) | 4 (13.3%) |
| $75,000 to $99,999 | 2 (6.9%) | 0 (0.0%) |
| $100,000+ | 3 (10.3%) | 0 (0.0%) |
| Total | 29 (100.0%) | 30 (100.0%) |
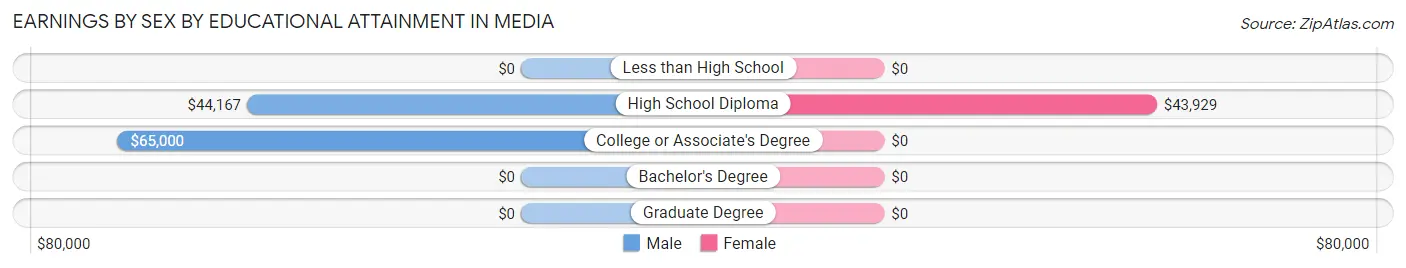
Earnings by Sex by Educational Attainment in Media
Average earnings in Media are $47,500 for men and $39,688 for women, a difference of 16.5%. Men with an educational attainment of college or associate's degree enjoy the highest average annual earnings of $65,000, while those with high school diploma education earn the least with $44,167. Women with an educational attainment of high school diploma earn the most with the average annual earnings of $43,929, while those with high school diploma education have the smallest earnings of $43,929.
| Educational Attainment | Male Income | Female Income |
| Less than High School | - | - |
| High School Diploma | $44,167 | $43,929 |
| College or Associate's Degree | $65,000 | $0 |
| Bachelor's Degree | - | - |
| Graduate Degree | - | - |
| Total | $47,500 | $39,688 |
Family Income in Media
Family Income Brackets in Media
According to the Media family income data, there are 9 families falling into the $50,000 to $74,999 income range, which is the most common income bracket and makes up 26.5% of all families.
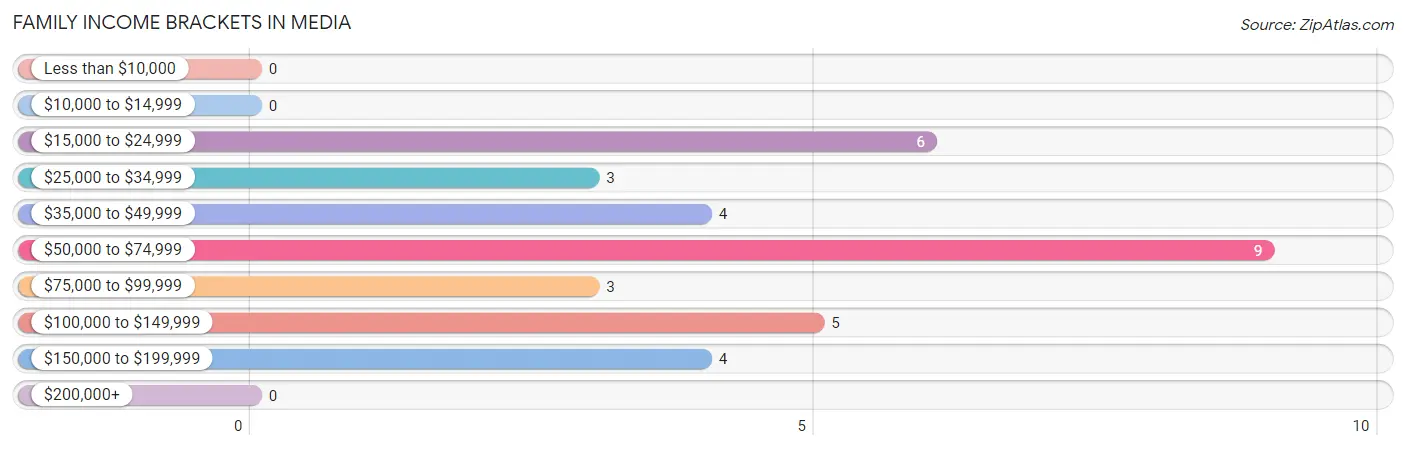
| Income Bracket | # Families | % Families |
| Less than $10,000 | 0 | 0.0% |
| $10,000 to $14,999 | 0 | 0.0% |
| $15,000 to $24,999 | 6 | 17.6% |
| $25,000 to $34,999 | 3 | 8.8% |
| $35,000 to $49,999 | 4 | 11.8% |
| $50,000 to $74,999 | 9 | 26.5% |
| $75,000 to $99,999 | 3 | 8.8% |
| $100,000 to $149,999 | 5 | 14.7% |
| $150,000 to $199,999 | 4 | 11.8% |
| $200,000+ | 0 | 0.0% |
Family Income by Famaliy Size in Media
3-person families (21 | 61.8%) account for the highest median family income in Media with $71,964 per family, while 3-person families (21 | 61.8%) have the highest median income of $23,988 per family member.
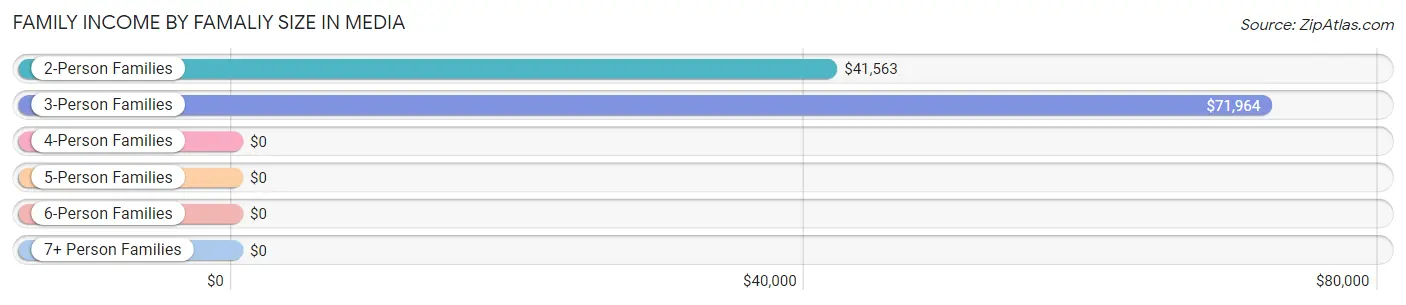
| Income Bracket | # Families | Median Income |
| 2-Person Families | 11 (32.4%) | $41,563 |
| 3-Person Families | 21 (61.8%) | $71,964 |
| 4-Person Families | 1 (2.9%) | $0 |
| 5-Person Families | 1 (2.9%) | $0 |
| 6-Person Families | 0 (0.0%) | $0 |
| 7+ Person Families | 0 (0.0%) | $0 |
| Total | 34 (100.0%) | $70,714 |
Family Income by Number of Earners in Media
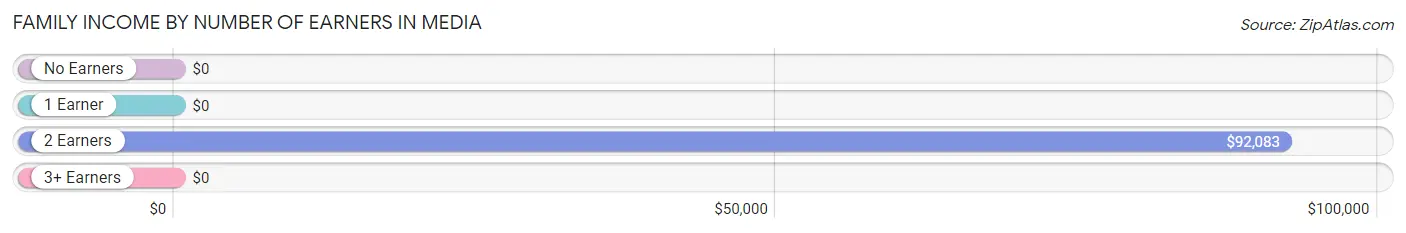
| Number of Earners | # Families | Median Income |
| No Earners | 6 (17.6%) | $0 |
| 1 Earner | 9 (26.5%) | $0 |
| 2 Earners | 19 (55.9%) | $92,083 |
| 3+ Earners | 0 (0.0%) | $0 |
| Total | 34 (100.0%) | $70,714 |
Household Income in Media
Household Income Brackets in Media
With 13 households falling in the category, the $50,000 to $74,999 income range is the most frequent in Media, accounting for 27.1% of all households.
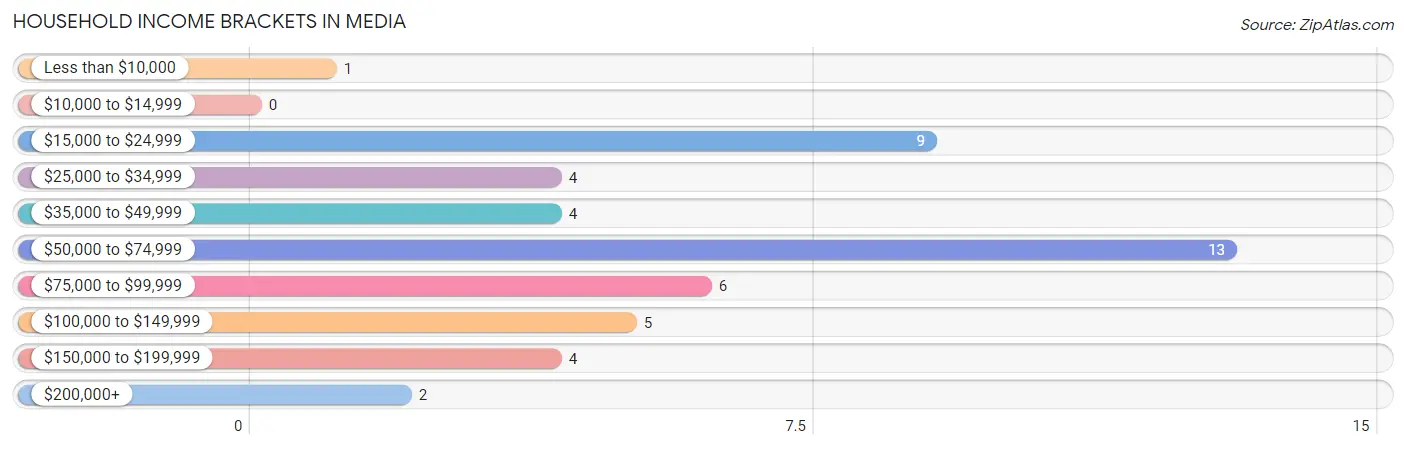
| Income Bracket | # Households | % Households |
| Less than $10,000 | 1 | 2.1% |
| $10,000 to $14,999 | 0 | 0.0% |
| $15,000 to $24,999 | 9 | 18.8% |
| $25,000 to $34,999 | 4 | 8.3% |
| $35,000 to $49,999 | 4 | 8.3% |
| $50,000 to $74,999 | 13 | 27.1% |
| $75,000 to $99,999 | 6 | 12.5% |
| $100,000 to $149,999 | 5 | 10.4% |
| $150,000 to $199,999 | 4 | 8.3% |
| $200,000+ | 2 | 4.2% |
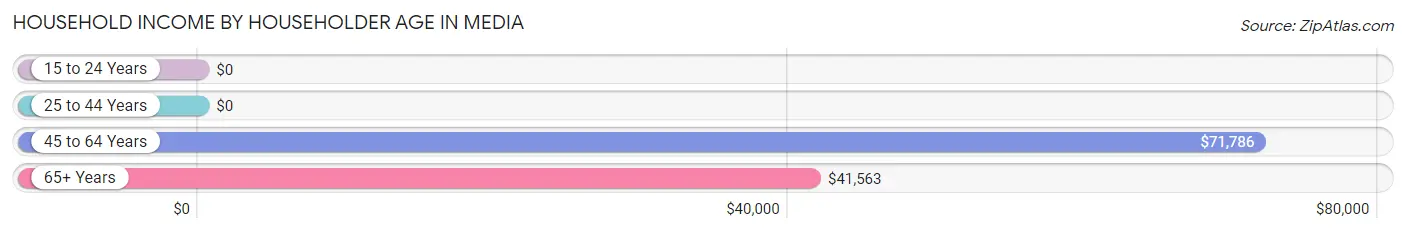
Household Income by Householder Age in Media
The median household income in Media is $70,357, with the highest median household income of $71,786 found in the 45 to 64 years age bracket for the primary householder. A total of 26 households (54.2%) fall into this category. Meanwhile, the 15 to 24 years age bracket for the primary householder has the lowest median household income of $0, with 1 households (2.1%) in this group.
| Income Bracket | # Households | Median Income |
| 15 to 24 Years | 1 (2.1%) | $0 |
| 25 to 44 Years | 10 (20.8%) | $0 |
| 45 to 64 Years | 26 (54.2%) | $71,786 |
| 65+ Years | 11 (22.9%) | $41,563 |
| Total | 48 (100.0%) | $70,357 |
Poverty in Media
Income Below Poverty by Sex and Age in Media
With 13.3% poverty level for males and 34.0% for females among the residents of Media, under 5 year old males and 16 and 17 year old females are the most vulnerable to poverty, with 1 males (100.0%) and 7 females (100.0%) in their respective age groups living below the poverty level.
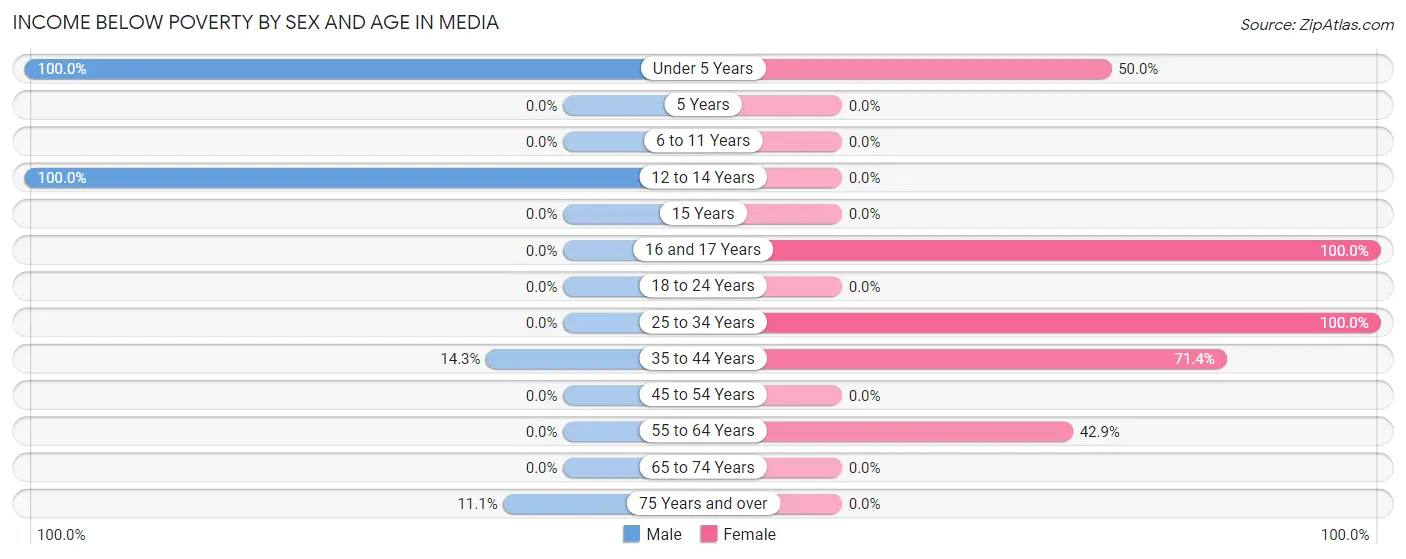
| Age Bracket | Male | Female |
| Under 5 Years | 1 (100.0%) | 2 (50.0%) |
| 5 Years | 0 (0.0%) | 0 (0.0%) |
| 6 to 11 Years | 0 (0.0%) | 0 (0.0%) |
| 12 to 14 Years | 5 (100.0%) | 0 (0.0%) |
| 15 Years | 0 (0.0%) | 0 (0.0%) |
| 16 and 17 Years | 0 (0.0%) | 7 (100.0%) |
| 18 to 24 Years | 0 (0.0%) | 0 (0.0%) |
| 25 to 34 Years | 0 (0.0%) | 1 (100.0%) |
| 35 to 44 Years | 1 (14.3%) | 5 (71.4%) |
| 45 to 54 Years | 0 (0.0%) | 0 (0.0%) |
| 55 to 64 Years | 0 (0.0%) | 3 (42.9%) |
| 65 to 74 Years | 0 (0.0%) | 0 (0.0%) |
| 75 Years and over | 1 (11.1%) | 0 (0.0%) |
| Total | 8 (13.3%) | 18 (34.0%) |
Income Above Poverty by Sex and Age in Media
According to the poverty statistics in Media, males aged 15 years and females aged 6 to 11 years are the age groups that are most secure financially, with 100.0% of males and 100.0% of females in these age groups living above the poverty line.
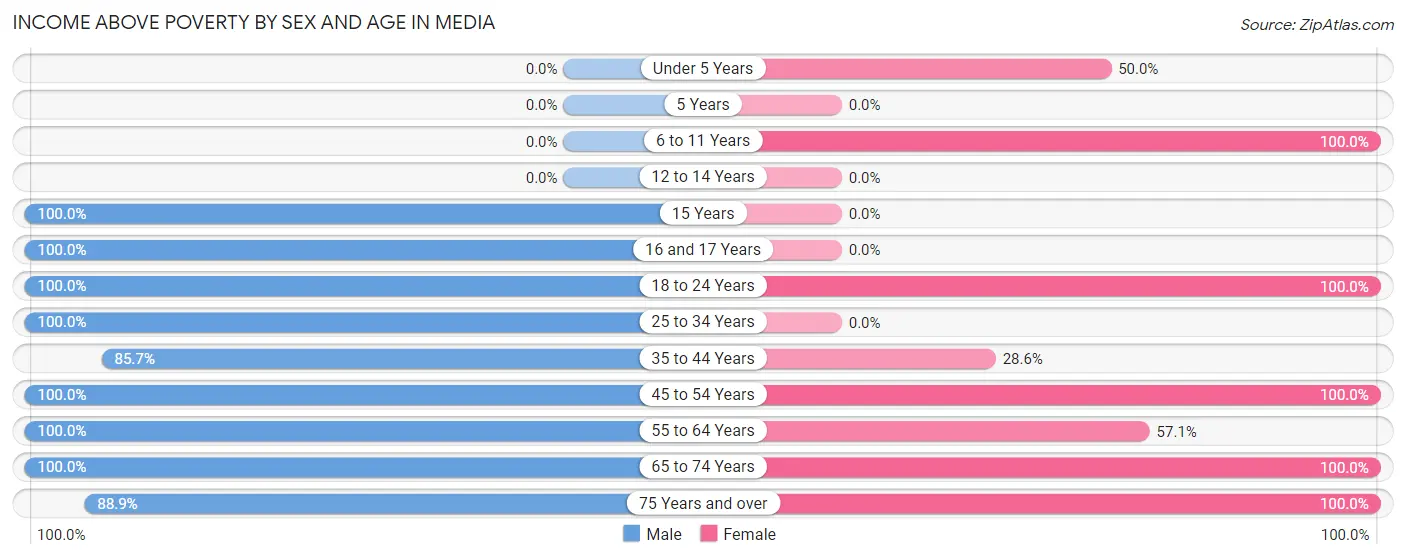
| Age Bracket | Male | Female |
| Under 5 Years | 0 (0.0%) | 2 (50.0%) |
| 5 Years | 0 (0.0%) | 0 (0.0%) |
| 6 to 11 Years | 0 (0.0%) | 4 (100.0%) |
| 12 to 14 Years | 0 (0.0%) | 0 (0.0%) |
| 15 Years | 3 (100.0%) | 0 (0.0%) |
| 16 and 17 Years | 1 (100.0%) | 0 (0.0%) |
| 18 to 24 Years | 3 (100.0%) | 1 (100.0%) |
| 25 to 34 Years | 9 (100.0%) | 0 (0.0%) |
| 35 to 44 Years | 6 (85.7%) | 2 (28.6%) |
| 45 to 54 Years | 13 (100.0%) | 15 (100.0%) |
| 55 to 64 Years | 7 (100.0%) | 4 (57.1%) |
| 65 to 74 Years | 2 (100.0%) | 1 (100.0%) |
| 75 Years and over | 8 (88.9%) | 6 (100.0%) |
| Total | 52 (86.7%) | 35 (66.0%) |
Income Below Poverty Among Married-Couple Families in Media
The poverty statistics for married-couple families in Media show that 3.6% or 1 of the total 28 families live below the poverty line. Families with 1 or 2 children have the highest poverty rate of 20.0%, comprising of 1 families. On the other hand, families with no children have the lowest poverty rate of 0.0%, which includes 0 families.
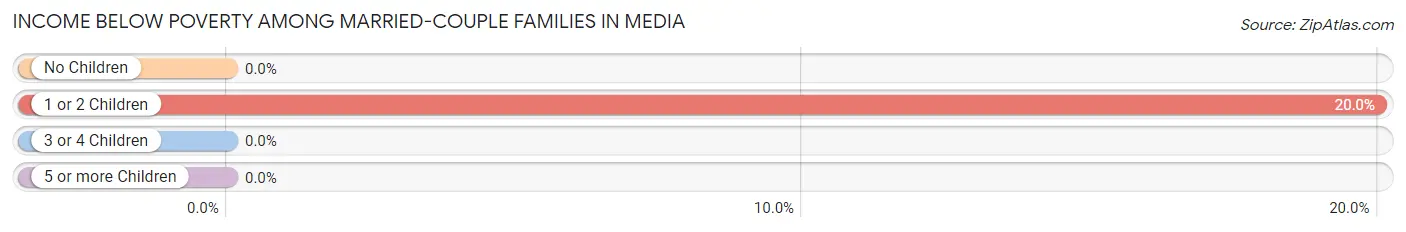
| Children | Above Poverty | Below Poverty |
| No Children | 22 (100.0%) | 0 (0.0%) |
| 1 or 2 Children | 4 (80.0%) | 1 (20.0%) |
| 3 or 4 Children | 1 (100.0%) | 0 (0.0%) |
| 5 or more Children | 0 (0.0%) | 0 (0.0%) |
| Total | 27 (96.4%) | 1 (3.6%) |
Income Below Poverty Among Single-Parent Households in Media
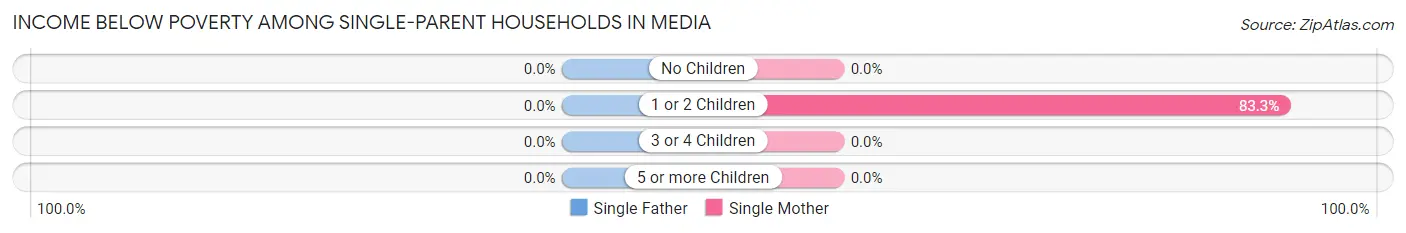
| Children | Single Father | Single Mother |
| No Children | 0 (0.0%) | 0 (0.0%) |
| 1 or 2 Children | 0 (0.0%) | 5 (83.3%) |
| 3 or 4 Children | 0 (0.0%) | 0 (0.0%) |
| 5 or more Children | 0 (0.0%) | 0 (0.0%) |
| Total | 0 (0.0%) | 5 (83.3%) |
Income Below Poverty Among Married-Couple vs Single-Parent Households in Media
The poverty data for Media shows that 1 of the married-couple family households (3.6%) and 5 of the single-parent households (83.3%) are living below the poverty level. Within the married-couple family households, those with 1 or 2 children have the highest poverty rate, with 1 households (20.0%) falling below the poverty line. Among the single-parent households, those with 1 or 2 children have the highest poverty rate, with 5 household (83.3%) living below poverty.
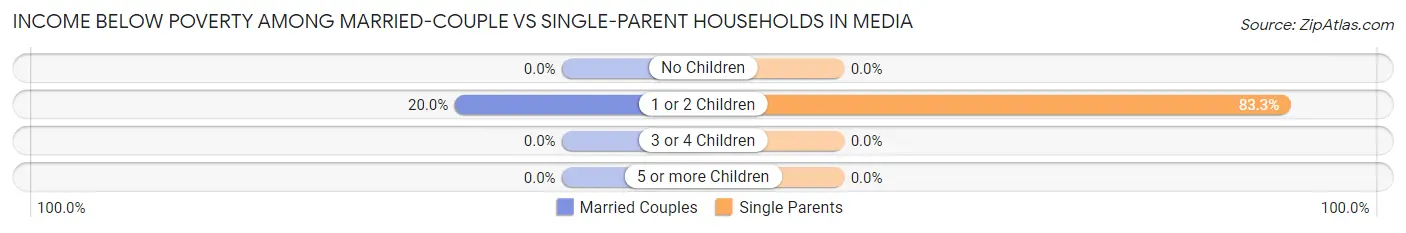
| Children | Married-Couple Families | Single-Parent Households |
| No Children | 0 (0.0%) | 0 (0.0%) |
| 1 or 2 Children | 1 (20.0%) | 5 (83.3%) |
| 3 or 4 Children | 0 (0.0%) | 0 (0.0%) |
| 5 or more Children | 0 (0.0%) | 0 (0.0%) |
| Total | 1 (3.6%) | 5 (83.3%) |
Race in Media
The most populous races in Media are , and White / Caucasian (113 | 100.0%).
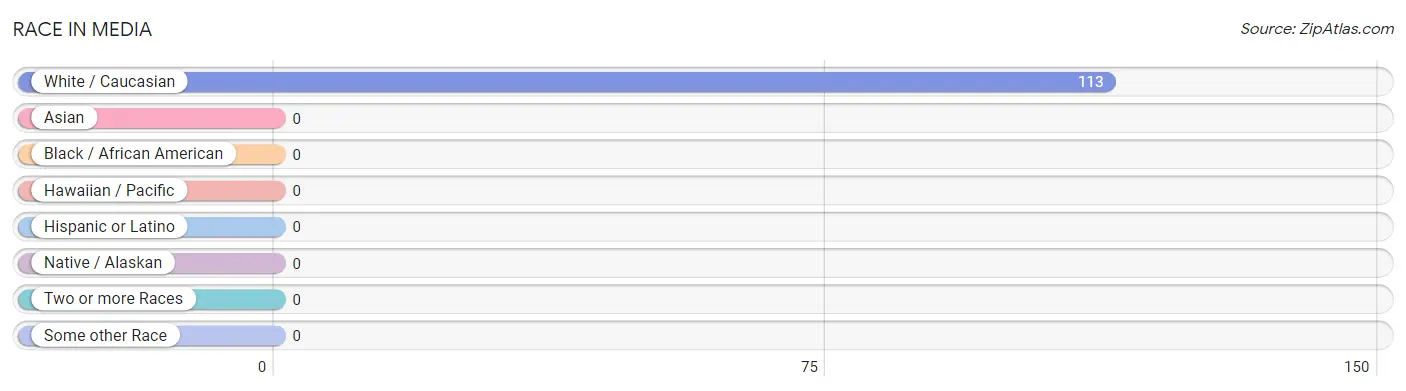
| Race | # Population | % Population |
| Asian | 0 | 0.0% |
| Black / African American | 0 | 0.0% |
| Hawaiian / Pacific | 0 | 0.0% |
| Hispanic or Latino | 0 | 0.0% |
| Native / Alaskan | 0 | 0.0% |
| White / Caucasian | 113 | 100.0% |
| Two or more Races | 0 | 0.0% |
| Some other Race | 0 | 0.0% |
| Total | 113 | 100.0% |
Ancestry in Media
The most populous ancestries reported in Media are English (33 | 29.2%), Irish (31 | 27.4%), German (17 | 15.0%), American (8 | 7.1%), and Scottish (3 | 2.6%), together accounting for 81.4% of all Media residents.
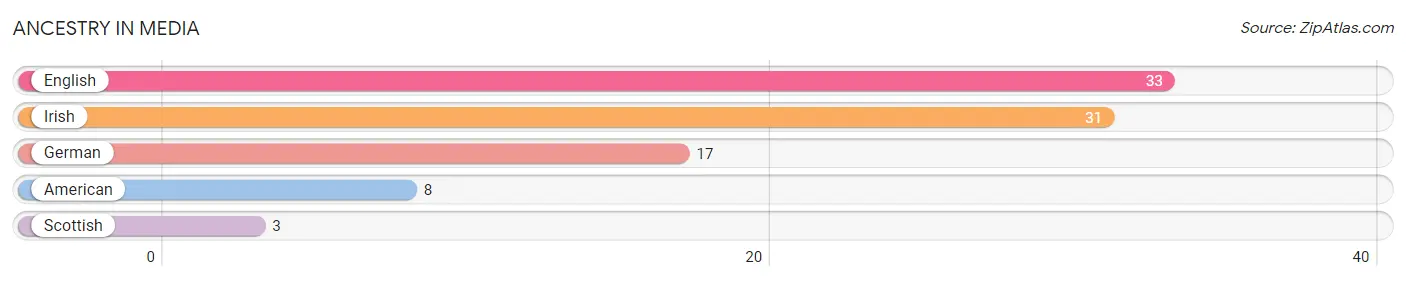
| Ancestry | # Population | % Population |
| American | 8 | 7.1% |
| English | 33 | 29.2% |
| German | 17 | 15.0% |
| Irish | 31 | 27.4% |
| Scottish | 3 | 2.6% | View All 5 Rows |
Immigrants in Media

| Immigration Origin | # Population | % Population | View All 0 Rows |
Sex and Age in Media
Sex and Age in Media
The most populous age groups in Media are 50 to 54 Years (10 | 16.7%) for men and 50 to 54 Years (11 | 20.7%) for women.
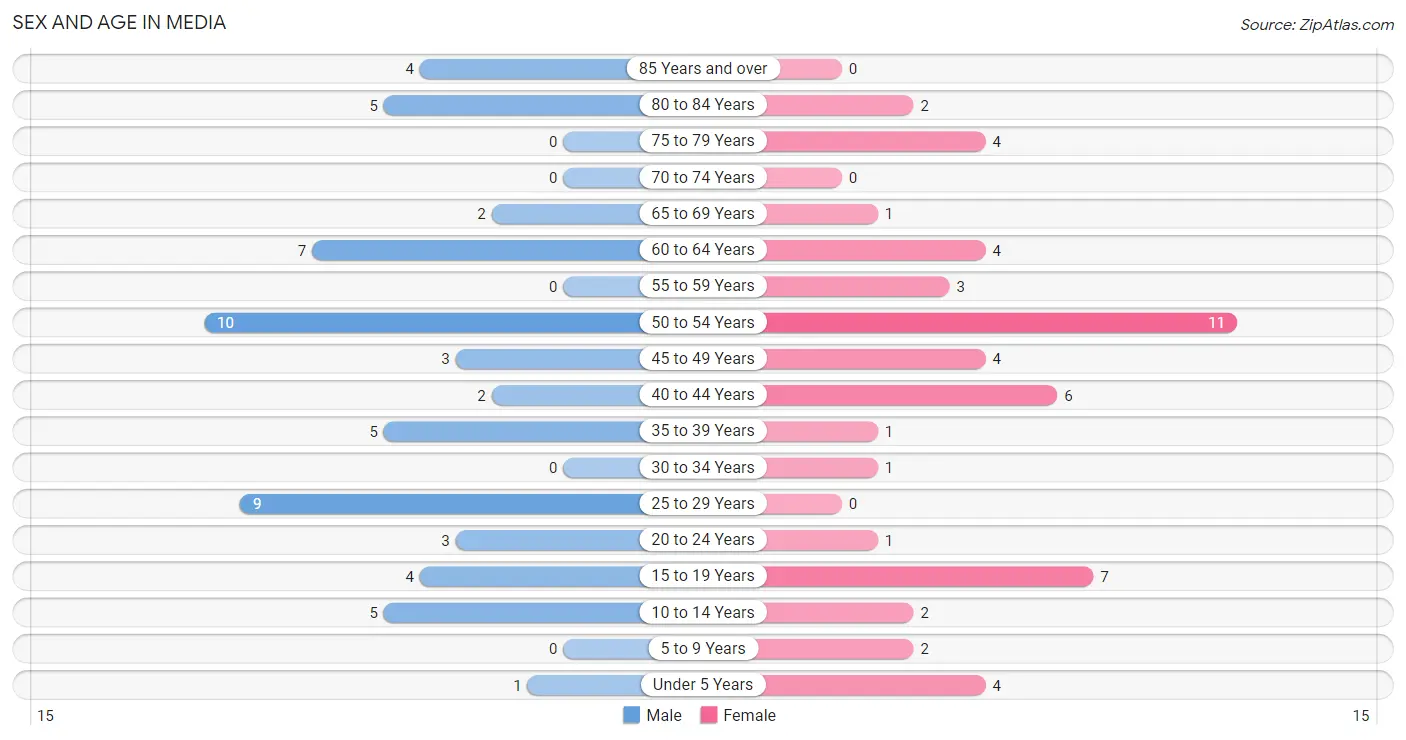
| Age Bracket | Male | Female |
| Under 5 Years | 1 (1.7%) | 4 (7.5%) |
| 5 to 9 Years | 0 (0.0%) | 2 (3.8%) |
| 10 to 14 Years | 5 (8.3%) | 2 (3.8%) |
| 15 to 19 Years | 4 (6.7%) | 7 (13.2%) |
| 20 to 24 Years | 3 (5.0%) | 1 (1.9%) |
| 25 to 29 Years | 9 (15.0%) | 0 (0.0%) |
| 30 to 34 Years | 0 (0.0%) | 1 (1.9%) |
| 35 to 39 Years | 5 (8.3%) | 1 (1.9%) |
| 40 to 44 Years | 2 (3.3%) | 6 (11.3%) |
| 45 to 49 Years | 3 (5.0%) | 4 (7.5%) |
| 50 to 54 Years | 10 (16.7%) | 11 (20.7%) |
| 55 to 59 Years | 0 (0.0%) | 3 (5.7%) |
| 60 to 64 Years | 7 (11.7%) | 4 (7.5%) |
| 65 to 69 Years | 2 (3.3%) | 1 (1.9%) |
| 70 to 74 Years | 0 (0.0%) | 0 (0.0%) |
| 75 to 79 Years | 0 (0.0%) | 4 (7.5%) |
| 80 to 84 Years | 5 (8.3%) | 2 (3.8%) |
| 85 Years and over | 4 (6.7%) | 0 (0.0%) |
| Total | 60 (100.0%) | 53 (100.0%) |
Families and Households in Media
Median Family Size in Media
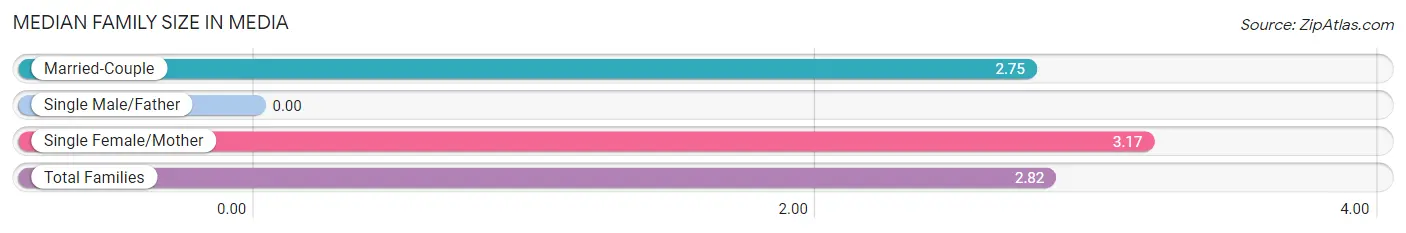
| Family Type | # Families | Family Size |
| Married-Couple | 28 (82.4%) | 2.75 |
| Single Male/Father | 0 (0.0%) | - |
| Single Female/Mother | 6 (17.6%) | 3.17 |
| Total Families | 34 (100.0%) | 2.82 |
Median Household Size in Media
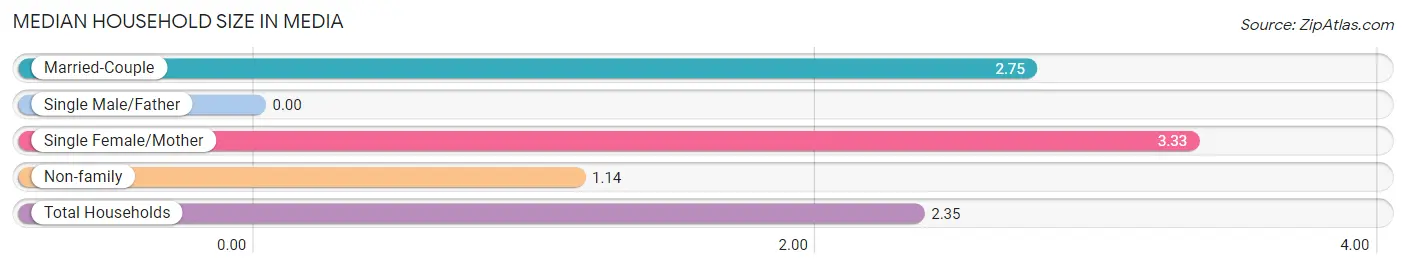
| Household Type | # Households | Household Size |
| Married-Couple | 28 (58.3%) | 2.75 |
| Single Male/Father | 0 (0.0%) | - |
| Single Female/Mother | 6 (12.5%) | 3.33 |
| Non-family | 14 (29.2%) | 1.14 |
| Total Households | 48 (100.0%) | 2.35 |
Household Size by Marriage Status in Media
Out of a total of 48 households in Media, 34 (70.8%) are family households, while 14 (29.2%) are nonfamily households. The most numerous type of family households are 3-person households, comprising 22, and the most common type of nonfamily households are 1-person households, comprising 13.
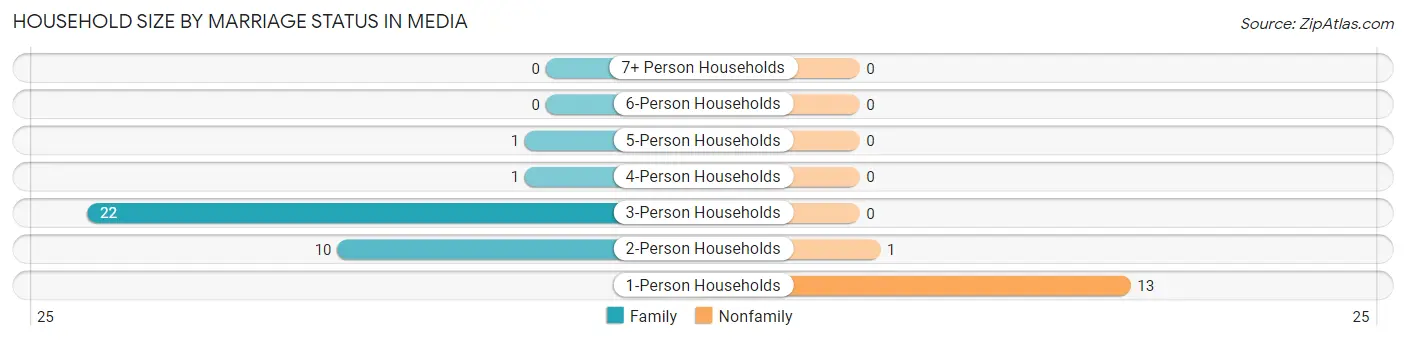
| Household Size | Family Households | Nonfamily Households |
| 1-Person Households | - | 13 (27.1%) |
| 2-Person Households | 10 (20.8%) | 1 (2.1%) |
| 3-Person Households | 22 (45.8%) | 0 (0.0%) |
| 4-Person Households | 1 (2.1%) | 0 (0.0%) |
| 5-Person Households | 1 (2.1%) | 0 (0.0%) |
| 6-Person Households | 0 (0.0%) | 0 (0.0%) |
| 7+ Person Households | 0 (0.0%) | 0 (0.0%) |
| Total | 34 (70.8%) | 14 (29.2%) |
Female Fertility in Media
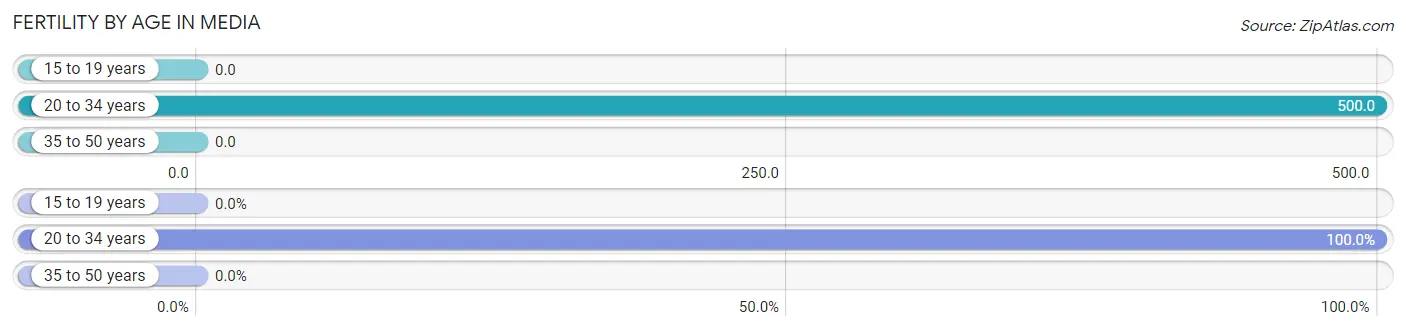
Fertility by Age in Media
Average fertility rate in Media is 50.0 births per 1,000 women. Women in the age bracket of 20 to 34 years have the highest fertility rate with 500.0 births per 1,000 women. Women in the age bracket of 20 to 34 years acount for 100.0% of all women with births.
| Age Bracket | Women with Births | Births / 1,000 Women |
| 15 to 19 years | 0 (0.0%) | 0.0 |
| 20 to 34 years | 1 (100.0%) | 500.0 |
| 35 to 50 years | 0 (0.0%) | 0.0 |
| Total | 1 (100.0%) | 50.0 |
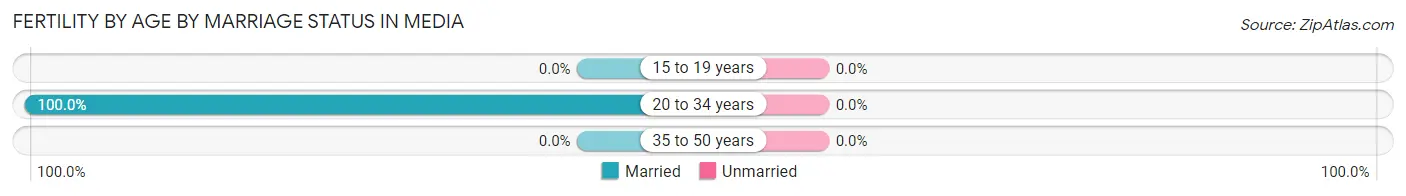
Fertility by Age by Marriage Status in Media
| Age Bracket | Married | Unmarried |
| 15 to 19 years | 0 (0.0%) | 0 (0.0%) |
| 20 to 34 years | 1 (100.0%) | 0 (0.0%) |
| 35 to 50 years | 0 (0.0%) | 0 (0.0%) |
| Total | 1 (100.0%) | 0 (0.0%) |
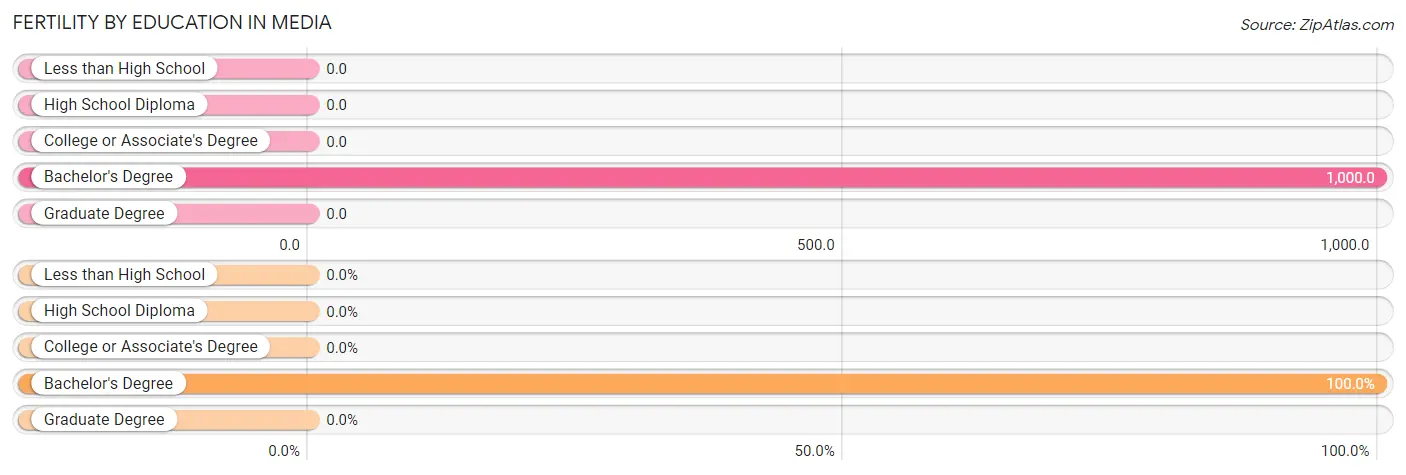
Fertility by Education in Media
| Educational Attainment | Women with Births | Births / 1,000 Women |
| Less than High School | 0 (0.0%) | 0.0 |
| High School Diploma | 0 (0.0%) | 0.0 |
| College or Associate's Degree | 0 (0.0%) | 0.0 |
| Bachelor's Degree | 1 (100.0%) | 1,000.0 |
| Graduate Degree | 0 (0.0%) | 0.0 |
| Total | 1 (100.0%) | 50.0 |
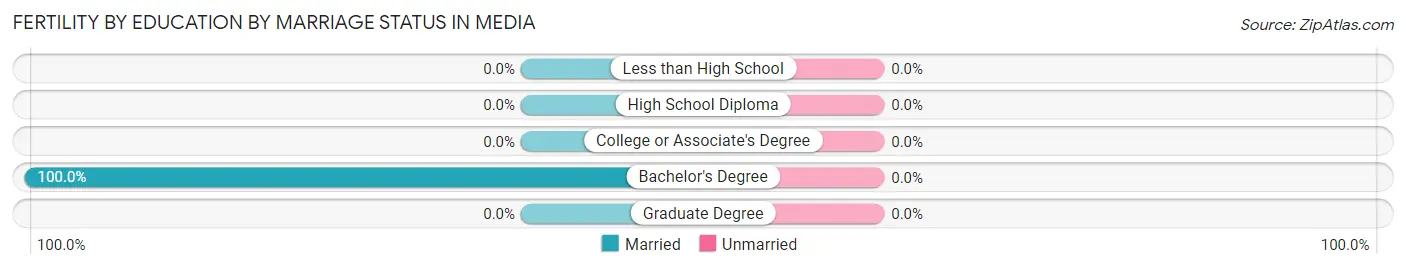
Fertility by Education by Marriage Status in Media
| Educational Attainment | Married | Unmarried |
| Less than High School | 0 (0.0%) | 0 (0.0%) |
| High School Diploma | 0 (0.0%) | 0 (0.0%) |
| College or Associate's Degree | 0 (0.0%) | 0 (0.0%) |
| Bachelor's Degree | 1 (100.0%) | 0 (0.0%) |
| Graduate Degree | 0 (0.0%) | 0 (0.0%) |
| Total | 1 (100.0%) | 0 (0.0%) |
Employment Characteristics in Media
Employment by Class of Employer in Media
Among the 57 employed individuals in Media, private company employees (49 | 86.0%), local government employees (6 | 10.5%), and self-employed (not incorporated) (1 | 1.8%) make up the most common classes of employment.
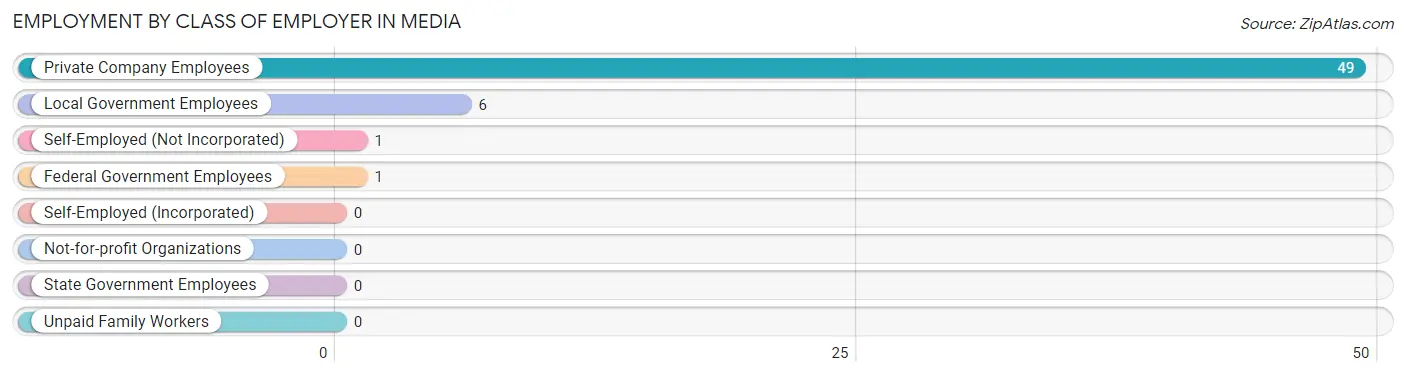
| Employer Class | # Employees | % Employees |
| Private Company Employees | 49 | 86.0% |
| Self-Employed (Incorporated) | 0 | 0.0% |
| Self-Employed (Not Incorporated) | 1 | 1.8% |
| Not-for-profit Organizations | 0 | 0.0% |
| Local Government Employees | 6 | 10.5% |
| State Government Employees | 0 | 0.0% |
| Federal Government Employees | 1 | 1.8% |
| Unpaid Family Workers | 0 | 0.0% |
| Total | 57 | 100.0% |
Employment Status by Age in Media
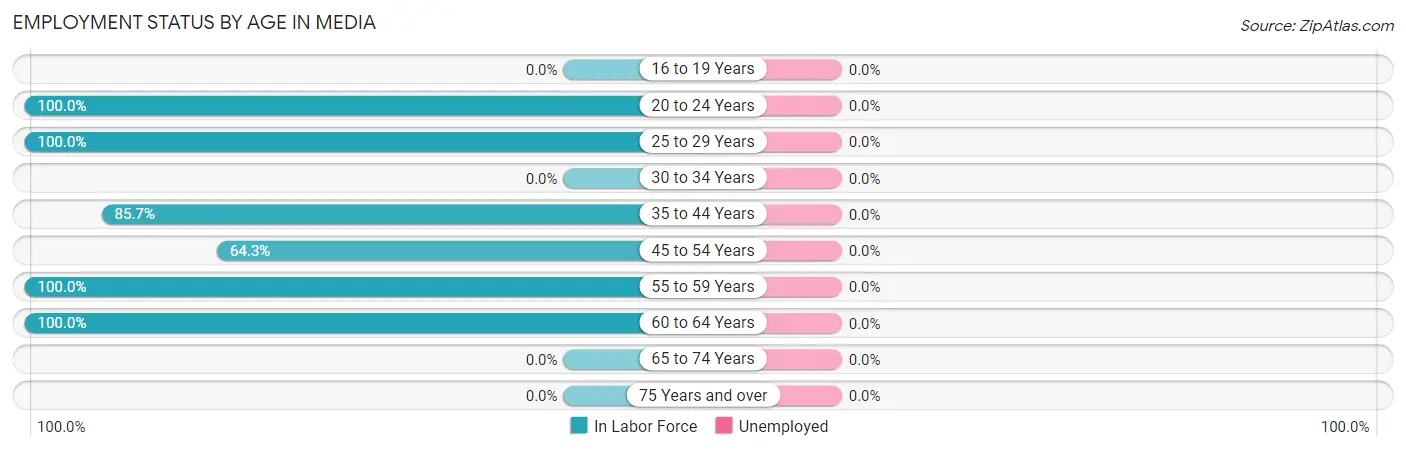
| Age Bracket | In Labor Force | Unemployed |
| 16 to 19 Years | 0 (0.0%) | 0 (0.0%) |
| 20 to 24 Years | 4 (100.0%) | 0 (0.0%) |
| 25 to 29 Years | 9 (100.0%) | 0 (0.0%) |
| 30 to 34 Years | 0 (0.0%) | 0 (0.0%) |
| 35 to 44 Years | 12 (85.7%) | 0 (0.0%) |
| 45 to 54 Years | 18 (64.3%) | 0 (0.0%) |
| 55 to 59 Years | 3 (100.0%) | 0 (0.0%) |
| 60 to 64 Years | 11 (100.0%) | 0 (0.0%) |
| 65 to 74 Years | 0 (0.0%) | 0 (0.0%) |
| 75 Years and over | 0 (0.0%) | 0 (0.0%) |
| Total | 57 (59.4%) | 0 (0.0%) |
Employment Status by Educational Attainment in Media
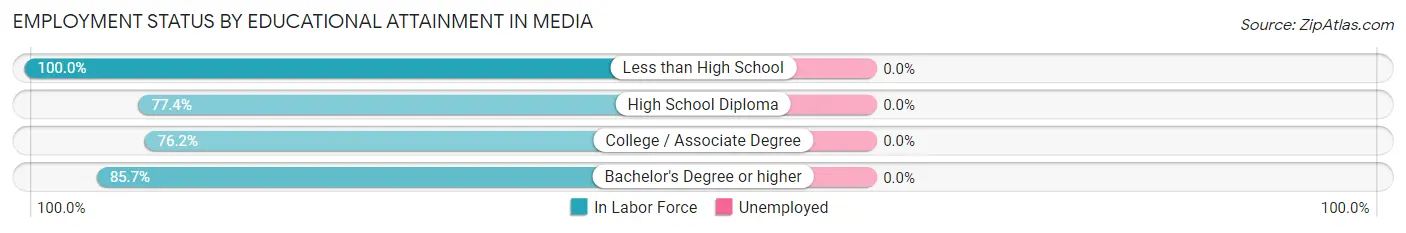
| Educational Attainment | In Labor Force | Unemployed |
| Less than High School | 7 (100.0%) | 0 (0.0%) |
| High School Diploma | 24 (77.4%) | 0 (0.0%) |
| College / Associate Degree | 16 (76.2%) | 0 (0.0%) |
| Bachelor's Degree or higher | 6 (85.7%) | 0 (0.0%) |
| Total | 53 (80.3%) | 0 (0.0%) |
Employment Occupations by Sex in Media
Management, Business, Science and Arts Occupations
The most common Management, Business, Science and Arts occupations in Media are Management (8 | 14.0%), Community & Social Service (8 | 14.0%), Education Instruction & Library (6 | 10.5%), Education, Arts & Media (2 | 3.5%), and Health Diagnosing & Treating (1 | 1.8%).
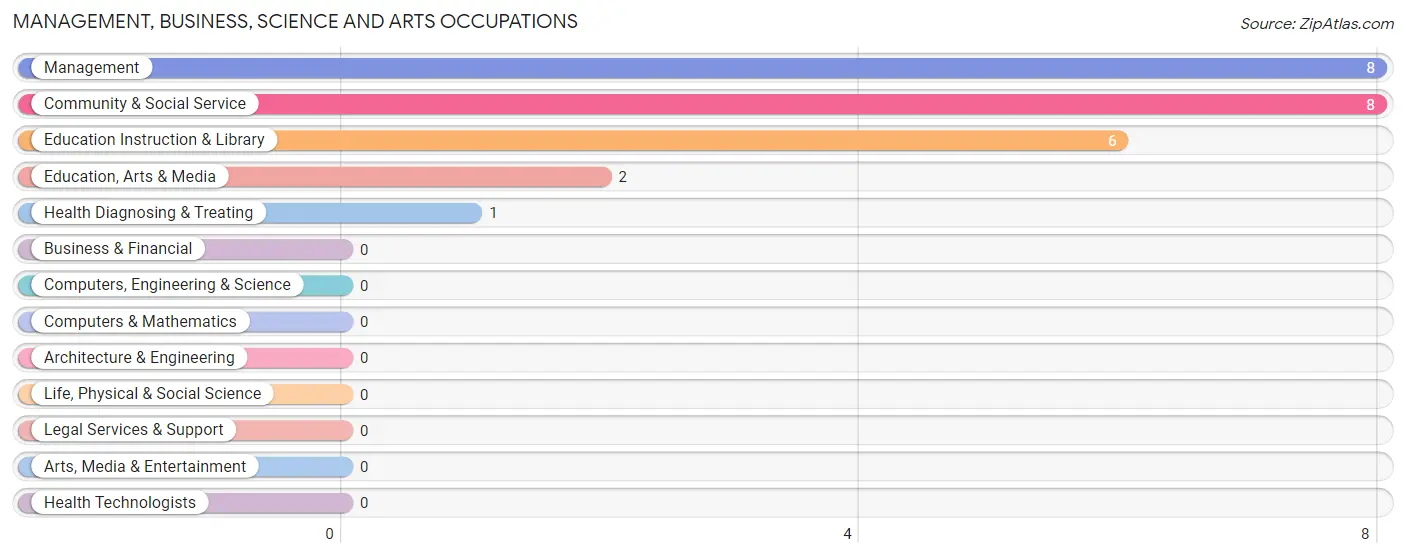
Management, Business, Science and Arts Occupations by Sex
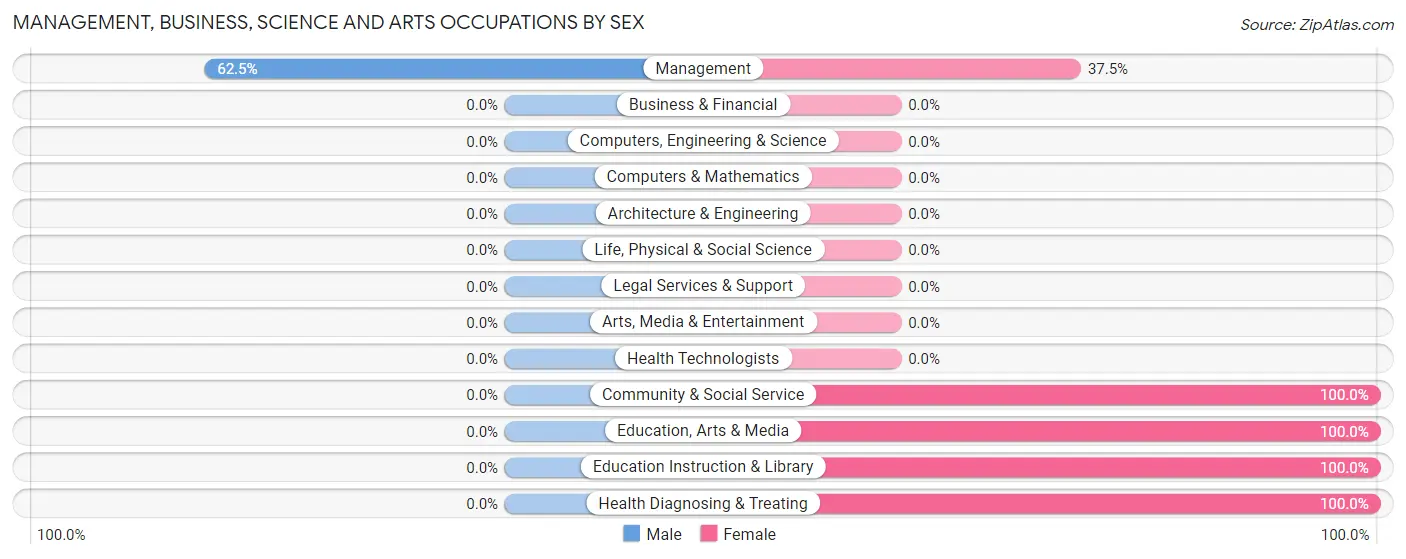
| Occupation | Male | Female |
| Management | 5 (62.5%) | 3 (37.5%) |
| Business & Financial | 0 (0.0%) | 0 (0.0%) |
| Computers, Engineering & Science | 0 (0.0%) | 0 (0.0%) |
| Computers & Mathematics | 0 (0.0%) | 0 (0.0%) |
| Architecture & Engineering | 0 (0.0%) | 0 (0.0%) |
| Life, Physical & Social Science | 0 (0.0%) | 0 (0.0%) |
| Community & Social Service | 0 (0.0%) | 8 (100.0%) |
| Education, Arts & Media | 0 (0.0%) | 2 (100.0%) |
| Legal Services & Support | 0 (0.0%) | 0 (0.0%) |
| Education Instruction & Library | 0 (0.0%) | 6 (100.0%) |
| Arts, Media & Entertainment | 0 (0.0%) | 0 (0.0%) |
| Health Diagnosing & Treating | 0 (0.0%) | 1 (100.0%) |
| Health Technologists | 0 (0.0%) | 0 (0.0%) |
| Total (Category) | 5 (29.4%) | 12 (70.6%) |
| Total (Overall) | 27 (47.4%) | 30 (52.6%) |
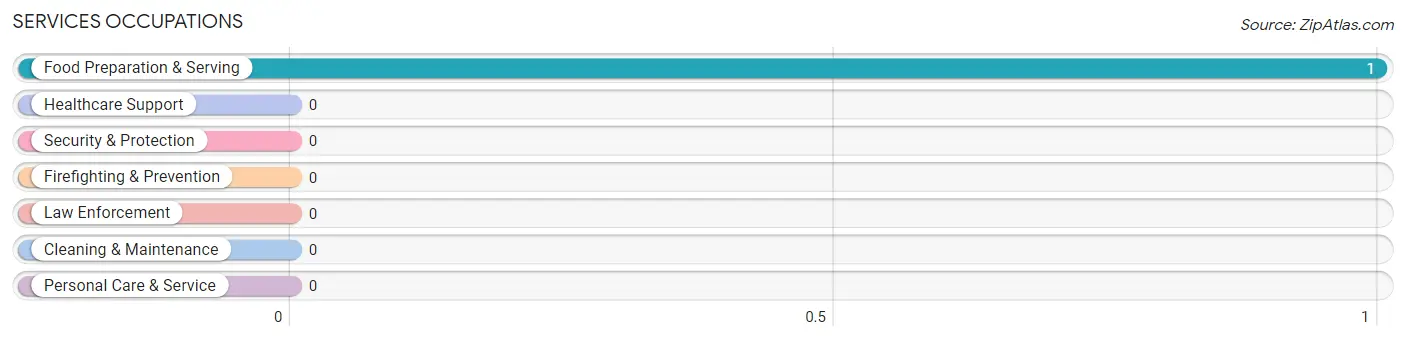
Services Occupations
The most common Services occupations in Media are , and Food Preparation & Serving (1 | 1.8%).
Services Occupations by Sex
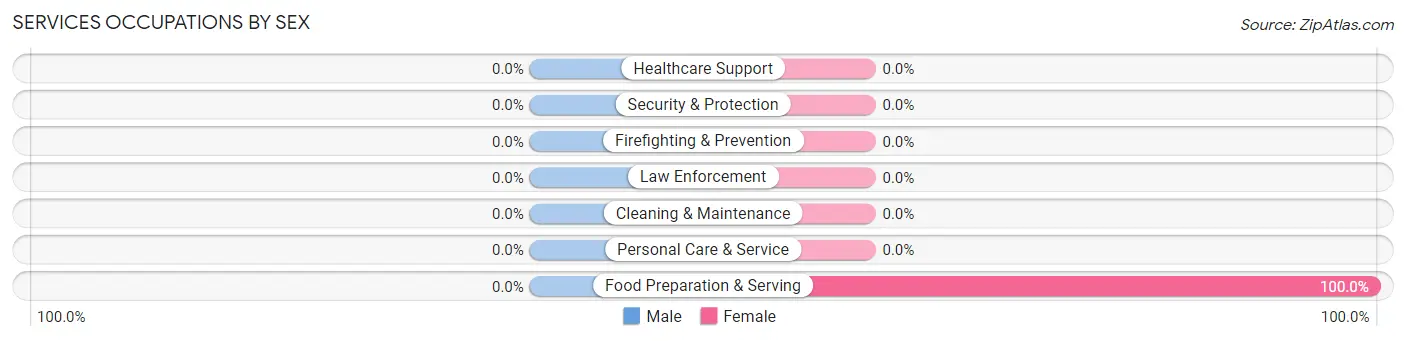
| Occupation | Male | Female |
| Healthcare Support | 0 (0.0%) | 0 (0.0%) |
| Security & Protection | 0 (0.0%) | 0 (0.0%) |
| Firefighting & Prevention | 0 (0.0%) | 0 (0.0%) |
| Law Enforcement | 0 (0.0%) | 0 (0.0%) |
| Food Preparation & Serving | 0 (0.0%) | 1 (100.0%) |
| Cleaning & Maintenance | 0 (0.0%) | 0 (0.0%) |
| Personal Care & Service | 0 (0.0%) | 0 (0.0%) |
| Total (Category) | 0 (0.0%) | 1 (100.0%) |
| Total (Overall) | 27 (47.4%) | 30 (52.6%) |
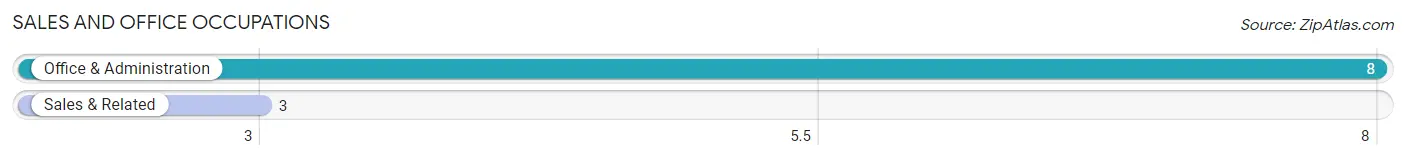
Sales and Office Occupations
The most common Sales and Office occupations in Media are Office & Administration (8 | 14.0%), and Sales & Related (3 | 5.3%).
Sales and Office Occupations by Sex

| Occupation | Male | Female |
| Sales & Related | 3 (100.0%) | 0 (0.0%) |
| Office & Administration | 2 (25.0%) | 6 (75.0%) |
| Total (Category) | 5 (45.5%) | 6 (54.5%) |
| Total (Overall) | 27 (47.4%) | 30 (52.6%) |
Natural Resources, Construction and Maintenance Occupations
The most common Natural Resources, Construction and Maintenance occupations in Media are Farming, Fishing & Forestry (7 | 12.3%), Installation, Maintenance & Repair (7 | 12.3%), and Construction & Extraction (2 | 3.5%).
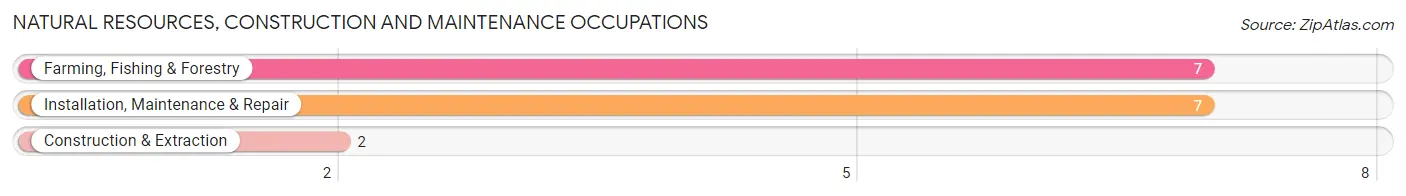
Natural Resources, Construction and Maintenance Occupations by Sex
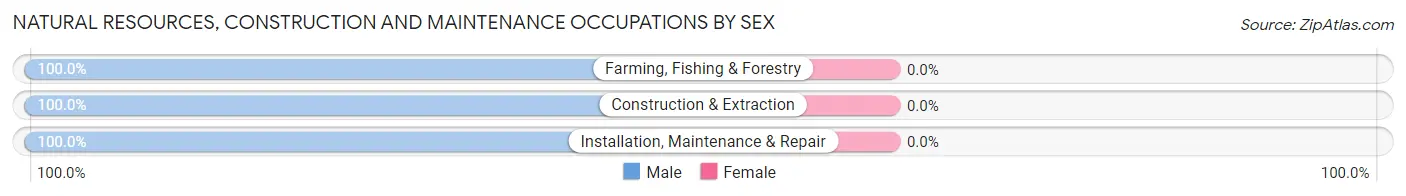
| Occupation | Male | Female |
| Farming, Fishing & Forestry | 7 (100.0%) | 0 (0.0%) |
| Construction & Extraction | 2 (100.0%) | 0 (0.0%) |
| Installation, Maintenance & Repair | 7 (100.0%) | 0 (0.0%) |
| Total (Category) | 16 (100.0%) | 0 (0.0%) |
| Total (Overall) | 27 (47.4%) | 30 (52.6%) |
Production, Transportation and Moving Occupations
The most common Production, Transportation and Moving occupations in Media are Production (8 | 14.0%), and Material Moving (4 | 7.0%).
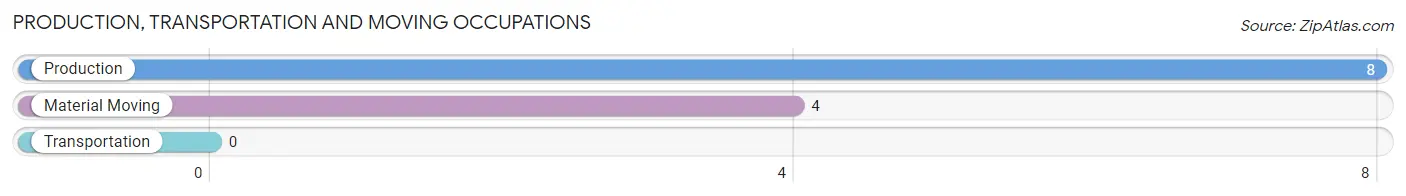
Production, Transportation and Moving Occupations by Sex
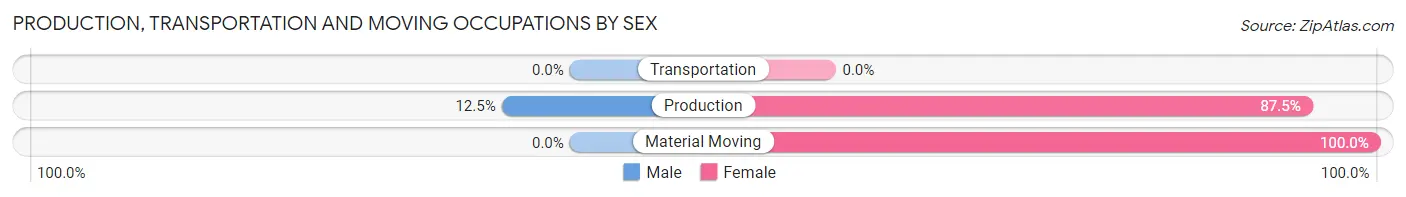
| Occupation | Male | Female |
| Production | 1 (12.5%) | 7 (87.5%) |
| Transportation | 0 (0.0%) | 0 (0.0%) |
| Material Moving | 0 (0.0%) | 4 (100.0%) |
| Total (Category) | 1 (8.3%) | 11 (91.7%) |
| Total (Overall) | 27 (47.4%) | 30 (52.6%) |
Employment Industries by Sex in Media
Employment Industries in Media
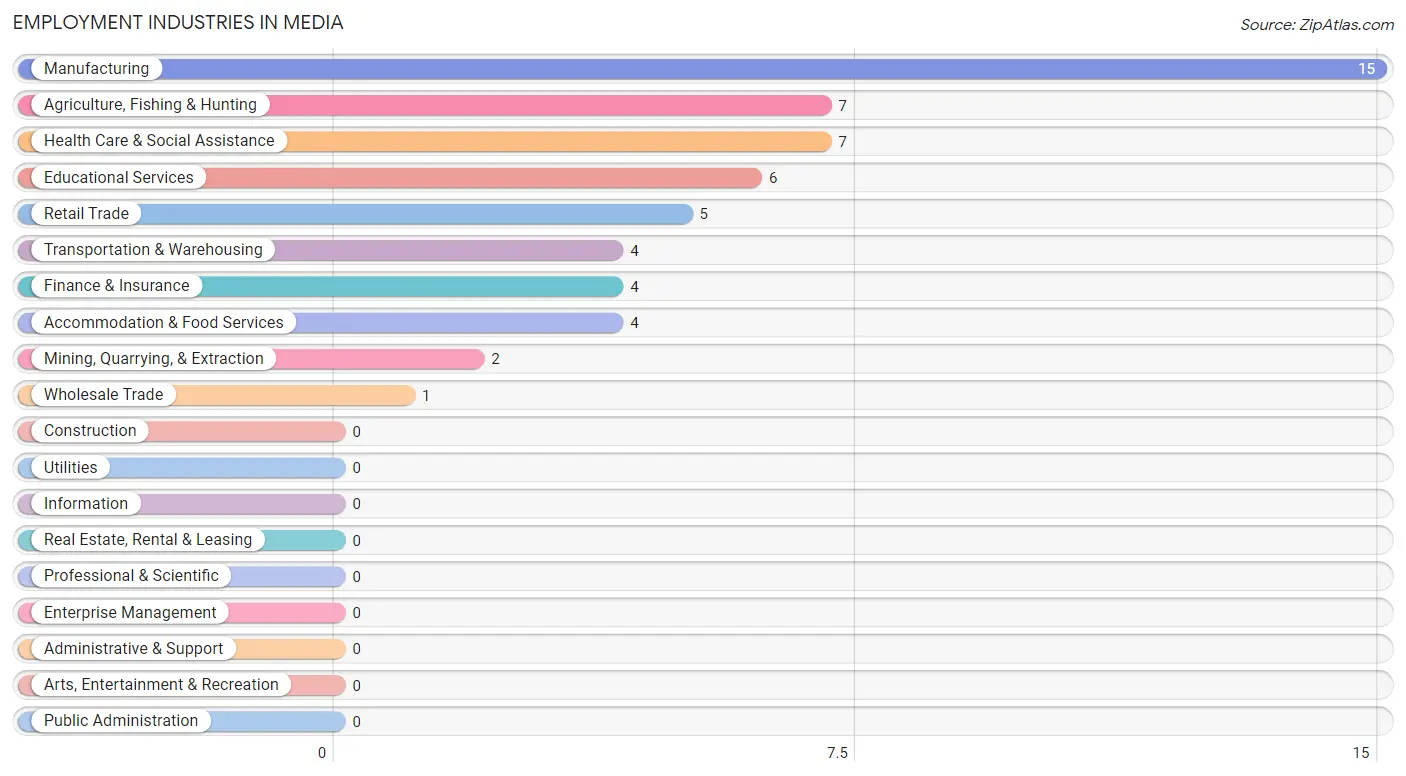
The major employment industries in Media include Manufacturing (15 | 26.3%), Agriculture, Fishing & Hunting (7 | 12.3%), Health Care & Social Assistance (7 | 12.3%), Educational Services (6 | 10.5%), and Retail Trade (5 | 8.8%).
Employment Industries by Sex in Media
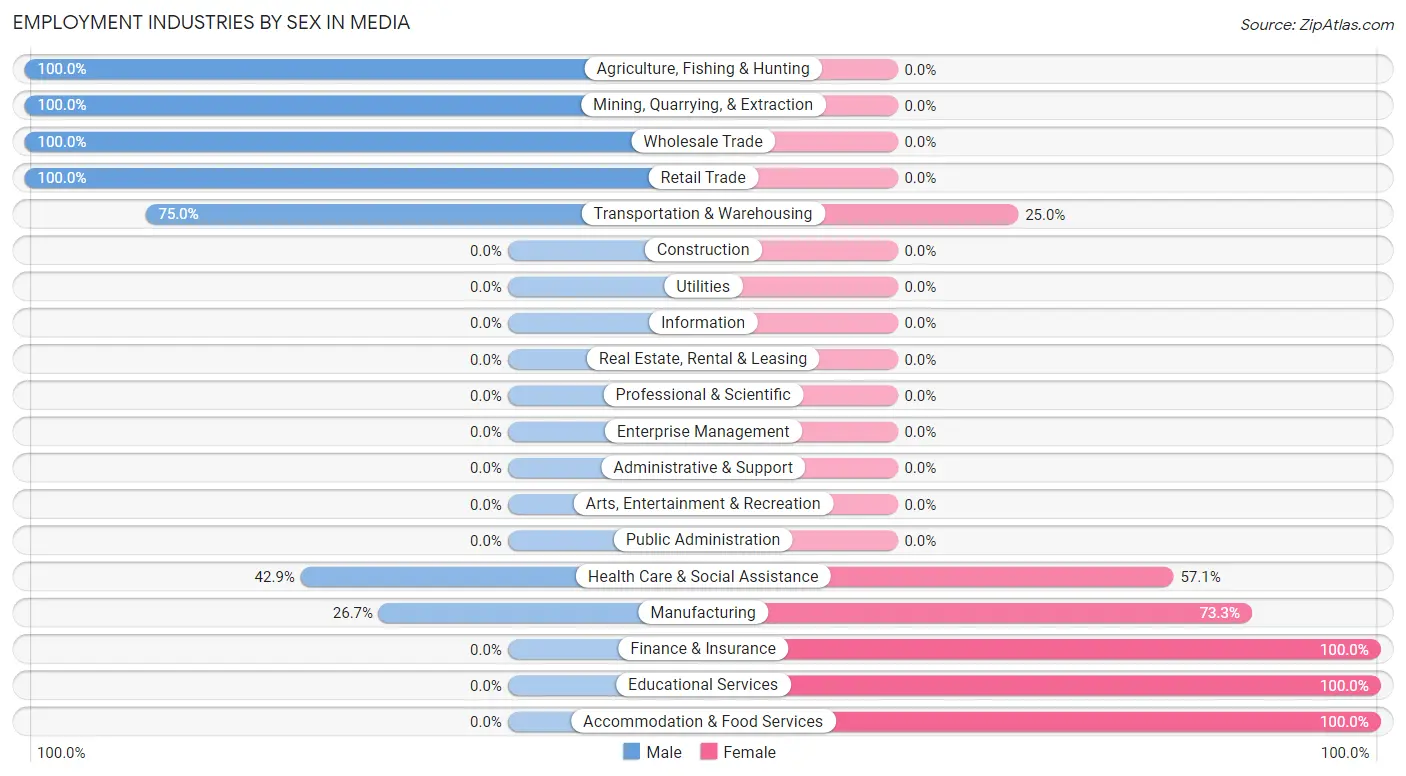
The Media industries that see more men than women are Agriculture, Fishing & Hunting (100.0%), Mining, Quarrying, & Extraction (100.0%), and Wholesale Trade (100.0%), whereas the industries that tend to have a higher number of women are Finance & Insurance (100.0%), Educational Services (100.0%), and Accommodation & Food Services (100.0%).
| Industry | Male | Female |
| Agriculture, Fishing & Hunting | 7 (100.0%) | 0 (0.0%) |
| Mining, Quarrying, & Extraction | 2 (100.0%) | 0 (0.0%) |
| Construction | 0 (0.0%) | 0 (0.0%) |
| Manufacturing | 4 (26.7%) | 11 (73.3%) |
| Wholesale Trade | 1 (100.0%) | 0 (0.0%) |
| Retail Trade | 5 (100.0%) | 0 (0.0%) |
| Transportation & Warehousing | 3 (75.0%) | 1 (25.0%) |
| Utilities | 0 (0.0%) | 0 (0.0%) |
| Information | 0 (0.0%) | 0 (0.0%) |
| Finance & Insurance | 0 (0.0%) | 4 (100.0%) |
| Real Estate, Rental & Leasing | 0 (0.0%) | 0 (0.0%) |
| Professional & Scientific | 0 (0.0%) | 0 (0.0%) |
| Enterprise Management | 0 (0.0%) | 0 (0.0%) |
| Administrative & Support | 0 (0.0%) | 0 (0.0%) |
| Educational Services | 0 (0.0%) | 6 (100.0%) |
| Health Care & Social Assistance | 3 (42.9%) | 4 (57.1%) |
| Arts, Entertainment & Recreation | 0 (0.0%) | 0 (0.0%) |
| Accommodation & Food Services | 0 (0.0%) | 4 (100.0%) |
| Public Administration | 0 (0.0%) | 0 (0.0%) |
| Total | 27 (47.4%) | 30 (52.6%) |
Education in Media
School Enrollment in Media
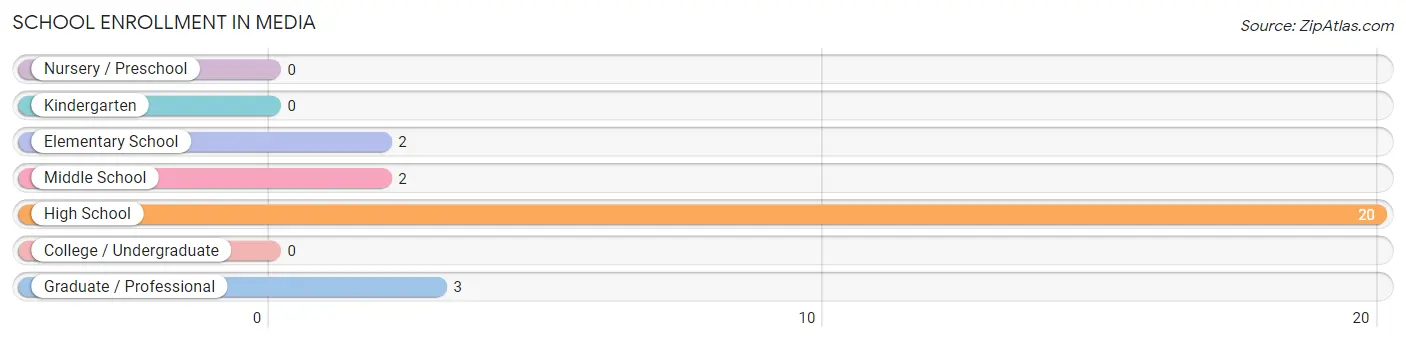
The most common levels of schooling among the 27 students in Media are high school (20 | 74.1%), graduate / professional (3 | 11.1%), and elementary school (2 | 7.4%).
| School Level | # Students | % Students |
| Nursery / Preschool | 0 | 0.0% |
| Kindergarten | 0 | 0.0% |
| Elementary School | 2 | 7.4% |
| Middle School | 2 | 7.4% |
| High School | 20 | 74.1% |
| College / Undergraduate | 0 | 0.0% |
| Graduate / Professional | 3 | 11.1% |
| Total | 27 | 100.0% |
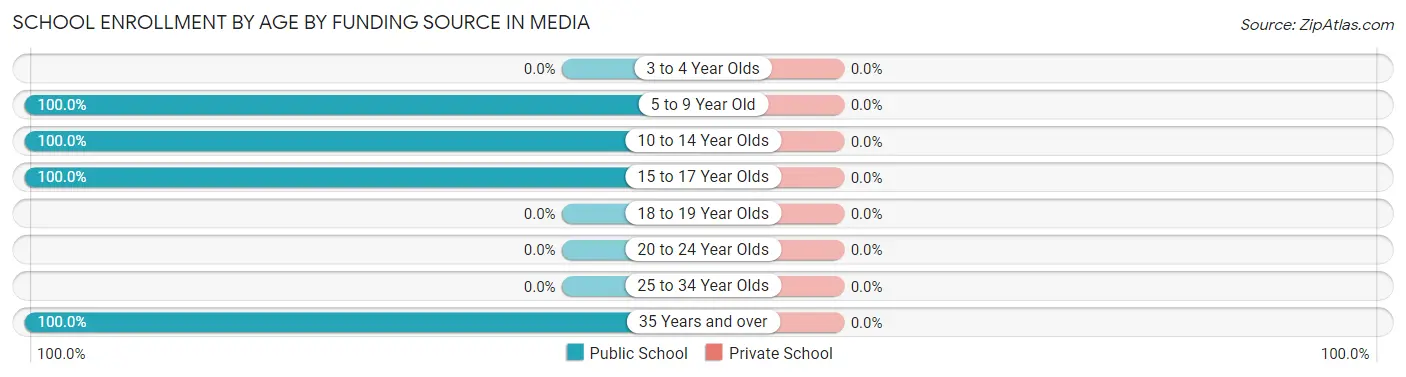
School Enrollment by Age by Funding Source in Media
| Age Bracket | Public School | Private School |
| 3 to 4 Year Olds | 0 (0.0%) | 0 (0.0%) |
| 5 to 9 Year Old | 2 (100.0%) | 0 (0.0%) |
| 10 to 14 Year Olds | 7 (100.0%) | 0 (0.0%) |
| 15 to 17 Year Olds | 11 (100.0%) | 0 (0.0%) |
| 18 to 19 Year Olds | 0 (0.0%) | 0 (0.0%) |
| 20 to 24 Year Olds | 0 (0.0%) | 0 (0.0%) |
| 25 to 34 Year Olds | 0 (0.0%) | 0 (0.0%) |
| 35 Years and over | 7 (100.0%) | 0 (0.0%) |
| Total | 27 (100.0%) | 0 (0.0%) |
Educational Attainment by Field of Study in Media
Bio, nature & agricultural (3 | 33.3%), science & technology (2 | 22.2%), education (2 | 22.2%), and literature & languages (2 | 22.2%) are the most common fields of study among 9 individuals in Media who have obtained a bachelor's degree or higher.
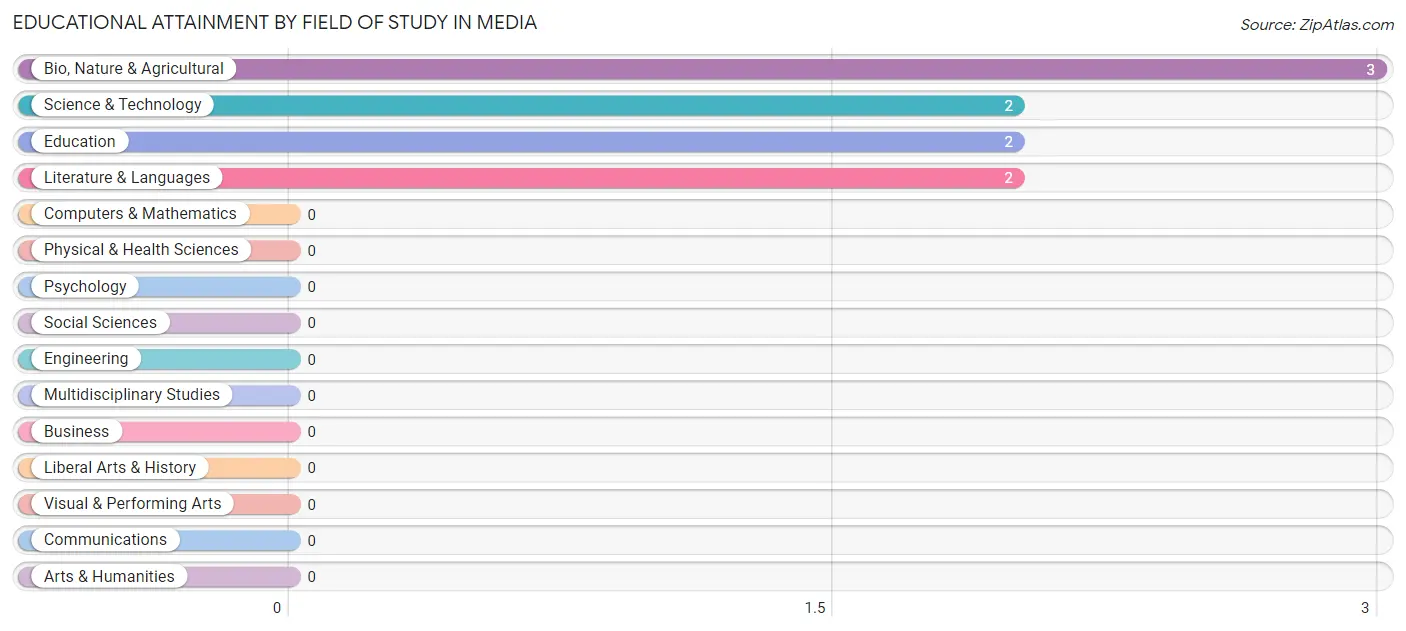
| Field of Study | # Graduates | % Graduates |
| Computers & Mathematics | 0 | 0.0% |
| Bio, Nature & Agricultural | 3 | 33.3% |
| Physical & Health Sciences | 0 | 0.0% |
| Psychology | 0 | 0.0% |
| Social Sciences | 0 | 0.0% |
| Engineering | 0 | 0.0% |
| Multidisciplinary Studies | 0 | 0.0% |
| Science & Technology | 2 | 22.2% |
| Business | 0 | 0.0% |
| Education | 2 | 22.2% |
| Literature & Languages | 2 | 22.2% |
| Liberal Arts & History | 0 | 0.0% |
| Visual & Performing Arts | 0 | 0.0% |
| Communications | 0 | 0.0% |
| Arts & Humanities | 0 | 0.0% |
| Total | 9 | 100.0% |
Transportation & Commute in Media
Vehicle Availability by Sex in Media
The most prevalent vehicle ownership categories in Media are males with 2 vehicles (14, accounting for 51.8%) and females with 2 vehicles (17, making up 46.7%).
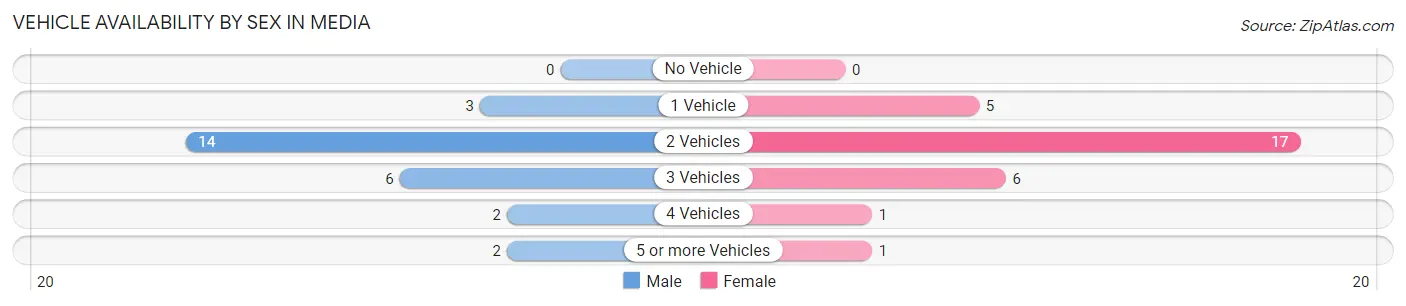
| Vehicles Available | Male | Female |
| No Vehicle | 0 (0.0%) | 0 (0.0%) |
| 1 Vehicle | 3 (11.1%) | 5 (16.7%) |
| 2 Vehicles | 14 (51.8%) | 17 (56.7%) |
| 3 Vehicles | 6 (22.2%) | 6 (20.0%) |
| 4 Vehicles | 2 (7.4%) | 1 (3.3%) |
| 5 or more Vehicles | 2 (7.4%) | 1 (3.3%) |
| Total | 27 (100.0%) | 30 (100.0%) |
Commute Time in Media
The most frequently occuring commute durations in Media are 45 to 59 minutes (17 commuters, 29.8%), 30 to 34 minutes (10 commuters, 17.5%), and 10 to 14 minutes (8 commuters, 14.0%).
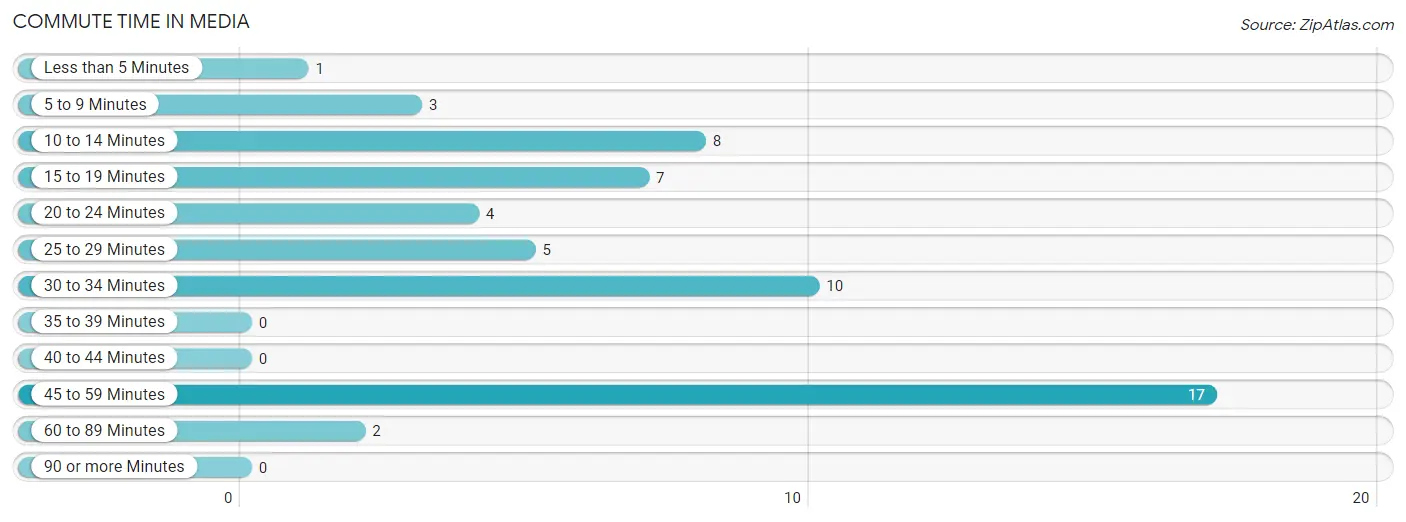
| Commute Time | # Commuters | % Commuters |
| Less than 5 Minutes | 1 | 1.8% |
| 5 to 9 Minutes | 3 | 5.3% |
| 10 to 14 Minutes | 8 | 14.0% |
| 15 to 19 Minutes | 7 | 12.3% |
| 20 to 24 Minutes | 4 | 7.0% |
| 25 to 29 Minutes | 5 | 8.8% |
| 30 to 34 Minutes | 10 | 17.5% |
| 35 to 39 Minutes | 0 | 0.0% |
| 40 to 44 Minutes | 0 | 0.0% |
| 45 to 59 Minutes | 17 | 29.8% |
| 60 to 89 Minutes | 2 | 3.5% |
| 90 or more Minutes | 0 | 0.0% |
Commute Time by Sex in Media
The most common commute times in Media are 45 to 59 minutes (12 commuters, 44.4%) for males and 30 to 34 minutes (10 commuters, 33.3%) for females.
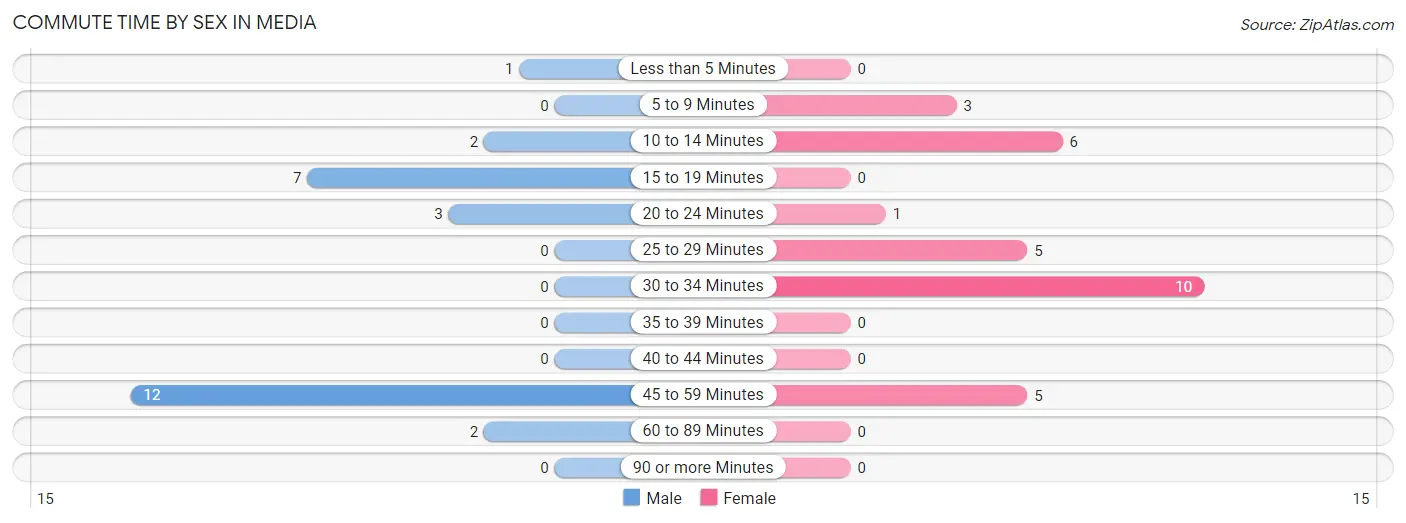
| Commute Time | Male | Female |
| Less than 5 Minutes | 1 (3.7%) | 0 (0.0%) |
| 5 to 9 Minutes | 0 (0.0%) | 3 (10.0%) |
| 10 to 14 Minutes | 2 (7.4%) | 6 (20.0%) |
| 15 to 19 Minutes | 7 (25.9%) | 0 (0.0%) |
| 20 to 24 Minutes | 3 (11.1%) | 1 (3.3%) |
| 25 to 29 Minutes | 0 (0.0%) | 5 (16.7%) |
| 30 to 34 Minutes | 0 (0.0%) | 10 (33.3%) |
| 35 to 39 Minutes | 0 (0.0%) | 0 (0.0%) |
| 40 to 44 Minutes | 0 (0.0%) | 0 (0.0%) |
| 45 to 59 Minutes | 12 (44.4%) | 5 (16.7%) |
| 60 to 89 Minutes | 2 (7.4%) | 0 (0.0%) |
| 90 or more Minutes | 0 (0.0%) | 0 (0.0%) |
Time of Departure to Work by Sex in Media
The most frequent times of departure to work in Media are 6:30 AM to 6:59 AM (9, 33.3%) for males and 7:30 AM to 7:59 AM (12, 40.0%) for females.
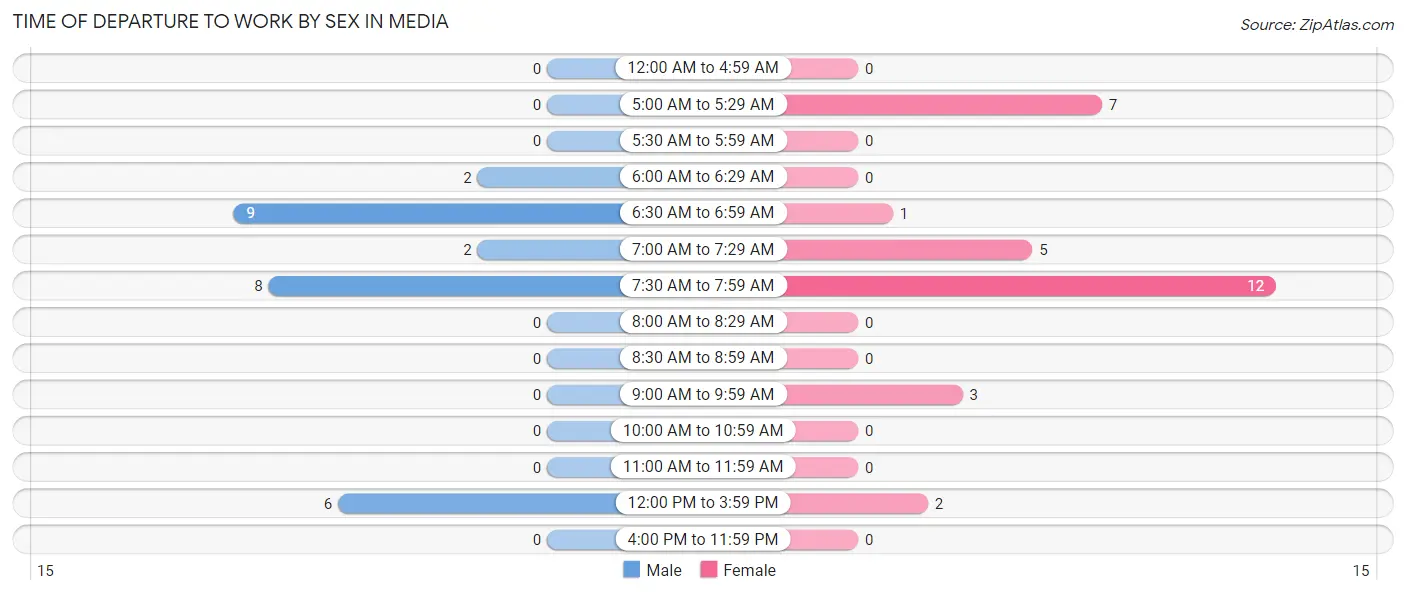
| Time of Departure | Male | Female |
| 12:00 AM to 4:59 AM | 0 (0.0%) | 0 (0.0%) |
| 5:00 AM to 5:29 AM | 0 (0.0%) | 7 (23.3%) |
| 5:30 AM to 5:59 AM | 0 (0.0%) | 0 (0.0%) |
| 6:00 AM to 6:29 AM | 2 (7.4%) | 0 (0.0%) |
| 6:30 AM to 6:59 AM | 9 (33.3%) | 1 (3.3%) |
| 7:00 AM to 7:29 AM | 2 (7.4%) | 5 (16.7%) |
| 7:30 AM to 7:59 AM | 8 (29.6%) | 12 (40.0%) |
| 8:00 AM to 8:29 AM | 0 (0.0%) | 0 (0.0%) |
| 8:30 AM to 8:59 AM | 0 (0.0%) | 0 (0.0%) |
| 9:00 AM to 9:59 AM | 0 (0.0%) | 3 (10.0%) |
| 10:00 AM to 10:59 AM | 0 (0.0%) | 0 (0.0%) |
| 11:00 AM to 11:59 AM | 0 (0.0%) | 0 (0.0%) |
| 12:00 PM to 3:59 PM | 6 (22.2%) | 2 (6.7%) |
| 4:00 PM to 11:59 PM | 0 (0.0%) | 0 (0.0%) |
| Total | 27 (100.0%) | 30 (100.0%) |
Housing Occupancy in Media
Occupancy by Ownership in Media
Of the total 48 dwellings in Media, owner-occupied units account for 36 (75.0%), while renter-occupied units make up 12 (25.0%).
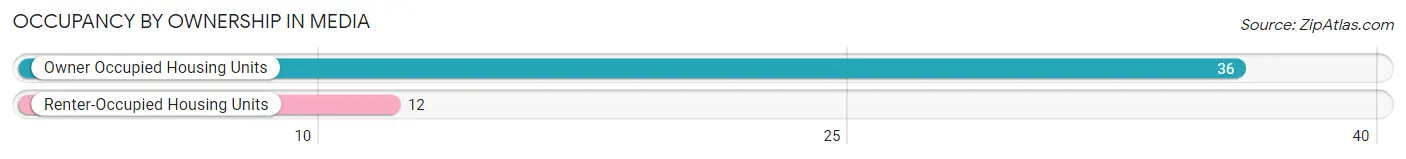
| Occupancy | # Housing Units | % Housing Units |
| Owner Occupied Housing Units | 36 | 75.0% |
| Renter-Occupied Housing Units | 12 | 25.0% |
| Total Occupied Housing Units | 48 | 100.0% |
Occupancy by Household Size in Media
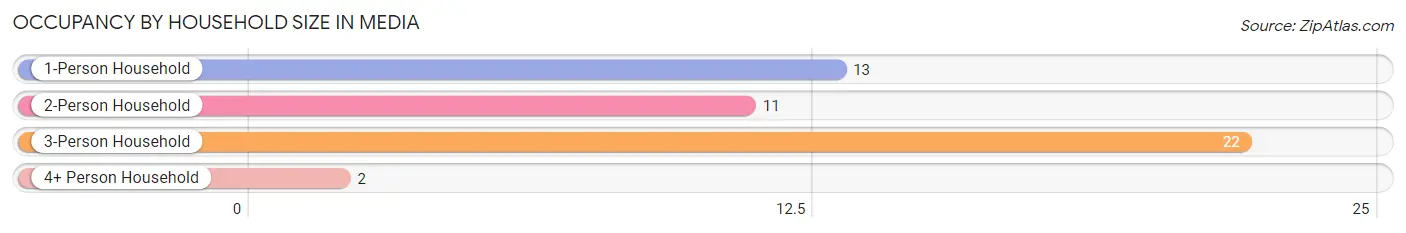
| Household Size | # Housing Units | % Housing Units |
| 1-Person Household | 13 | 27.1% |
| 2-Person Household | 11 | 22.9% |
| 3-Person Household | 22 | 45.8% |
| 4+ Person Household | 2 | 4.2% |
| Total Housing Units | 48 | 100.0% |
Occupancy by Ownership by Household Size in Media
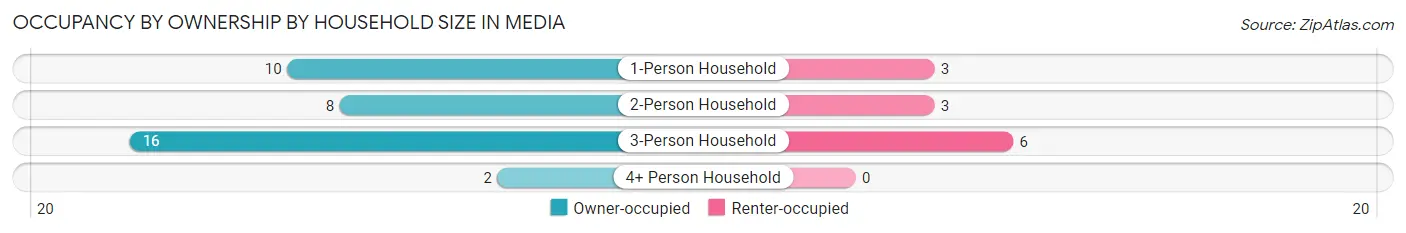
| Household Size | Owner-occupied | Renter-occupied |
| 1-Person Household | 10 (76.9%) | 3 (23.1%) |
| 2-Person Household | 8 (72.7%) | 3 (27.3%) |
| 3-Person Household | 16 (72.7%) | 6 (27.3%) |
| 4+ Person Household | 2 (100.0%) | 0 (0.0%) |
| Total Housing Units | 36 (75.0%) | 12 (25.0%) |
Occupancy by Educational Attainment in Media
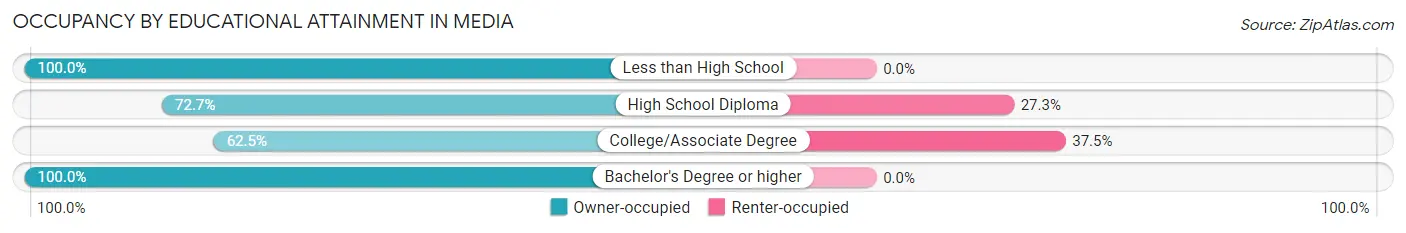
| Household Size | Owner-occupied | Renter-occupied |
| Less than High School | 7 (100.0%) | 0 (0.0%) |
| High School Diploma | 16 (72.7%) | 6 (27.3%) |
| College/Associate Degree | 10 (62.5%) | 6 (37.5%) |
| Bachelor's Degree or higher | 3 (100.0%) | 0 (0.0%) |
Occupancy by Age of Householder in Media
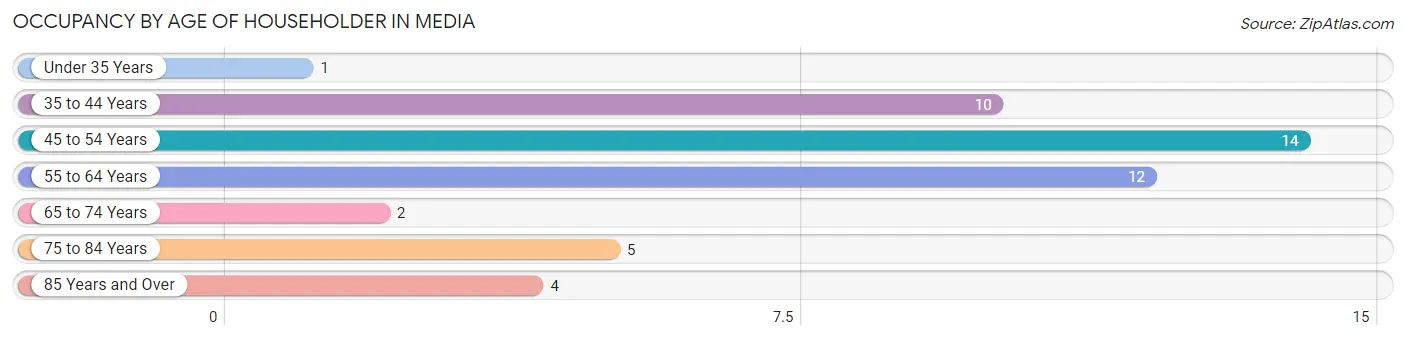
| Age Bracket | # Households | % Households |
| Under 35 Years | 1 | 2.1% |
| 35 to 44 Years | 10 | 20.8% |
| 45 to 54 Years | 14 | 29.2% |
| 55 to 64 Years | 12 | 25.0% |
| 65 to 74 Years | 2 | 4.2% |
| 75 to 84 Years | 5 | 10.4% |
| 85 Years and Over | 4 | 8.3% |
| Total | 48 | 100.0% |
Housing Finances in Media
Median Income by Occupancy in Media
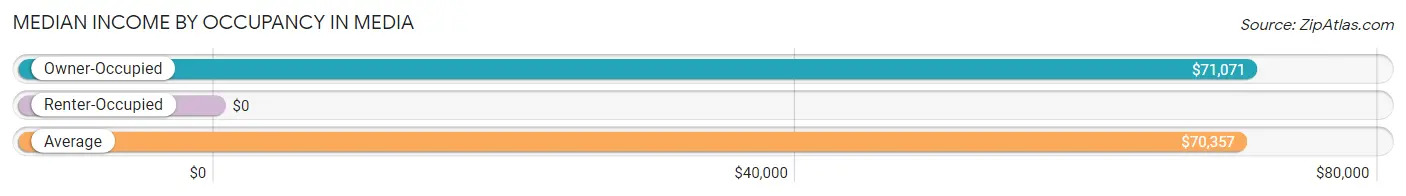
| Occupancy Type | # Households | Median Income |
| Owner-Occupied | 36 (75.0%) | $71,071 |
| Renter-Occupied | 12 (25.0%) | $0 |
| Average | 48 (100.0%) | $70,357 |
Occupancy by Householder Income Bracket in Media
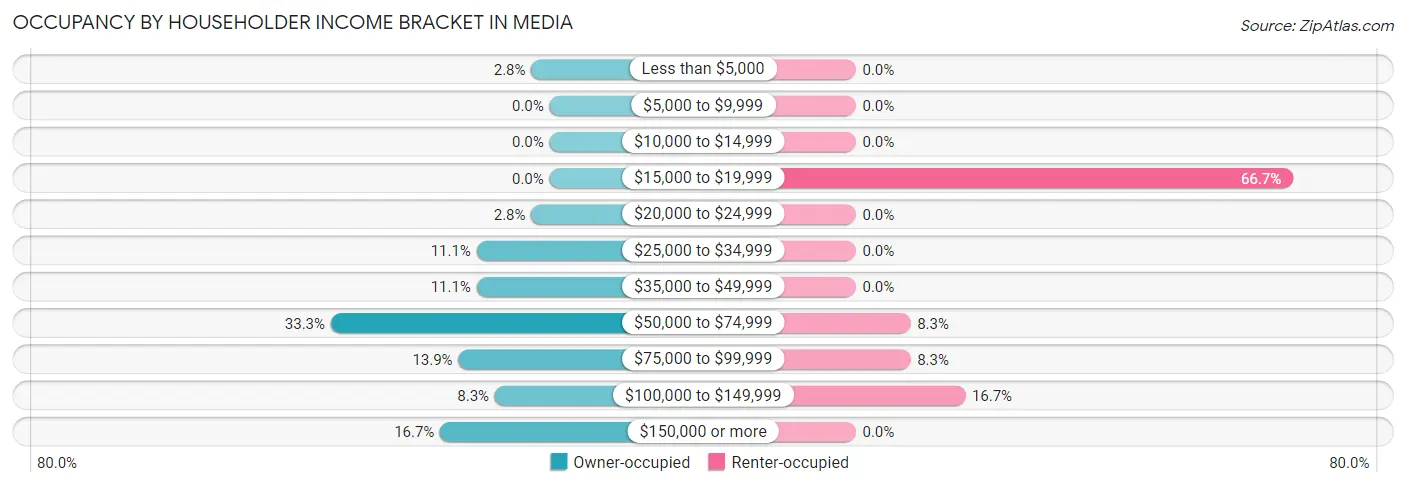
| Income Bracket | Owner-occupied | Renter-occupied |
| Less than $5,000 | 1 (2.8%) | 0 (0.0%) |
| $5,000 to $9,999 | 0 (0.0%) | 0 (0.0%) |
| $10,000 to $14,999 | 0 (0.0%) | 0 (0.0%) |
| $15,000 to $19,999 | 0 (0.0%) | 8 (66.7%) |
| $20,000 to $24,999 | 1 (2.8%) | 0 (0.0%) |
| $25,000 to $34,999 | 4 (11.1%) | 0 (0.0%) |
| $35,000 to $49,999 | 4 (11.1%) | 0 (0.0%) |
| $50,000 to $74,999 | 12 (33.3%) | 1 (8.3%) |
| $75,000 to $99,999 | 5 (13.9%) | 1 (8.3%) |
| $100,000 to $149,999 | 3 (8.3%) | 2 (16.7%) |
| $150,000 or more | 6 (16.7%) | 0 (0.0%) |
| Total | 36 (100.0%) | 12 (100.0%) |
Monthly Housing Cost Tiers in Media
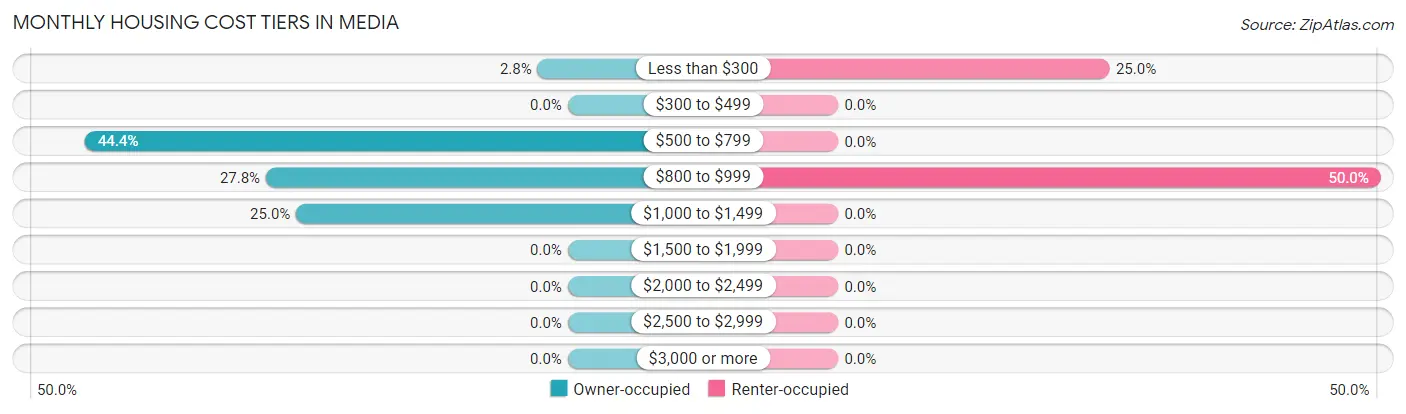
| Monthly Cost | Owner-occupied | Renter-occupied |
| Less than $300 | 1 (2.8%) | 3 (25.0%) |
| $300 to $499 | 0 (0.0%) | 0 (0.0%) |
| $500 to $799 | 16 (44.4%) | 0 (0.0%) |
| $800 to $999 | 10 (27.8%) | 6 (50.0%) |
| $1,000 to $1,499 | 9 (25.0%) | 0 (0.0%) |
| $1,500 to $1,999 | 0 (0.0%) | 0 (0.0%) |
| $2,000 to $2,499 | 0 (0.0%) | 0 (0.0%) |
| $2,500 to $2,999 | 0 (0.0%) | 0 (0.0%) |
| $3,000 or more | 0 (0.0%) | 0 (0.0%) |
| Total | 36 (100.0%) | 12 (100.0%) |
Physical Housing Characteristics in Media
Housing Structures in Media
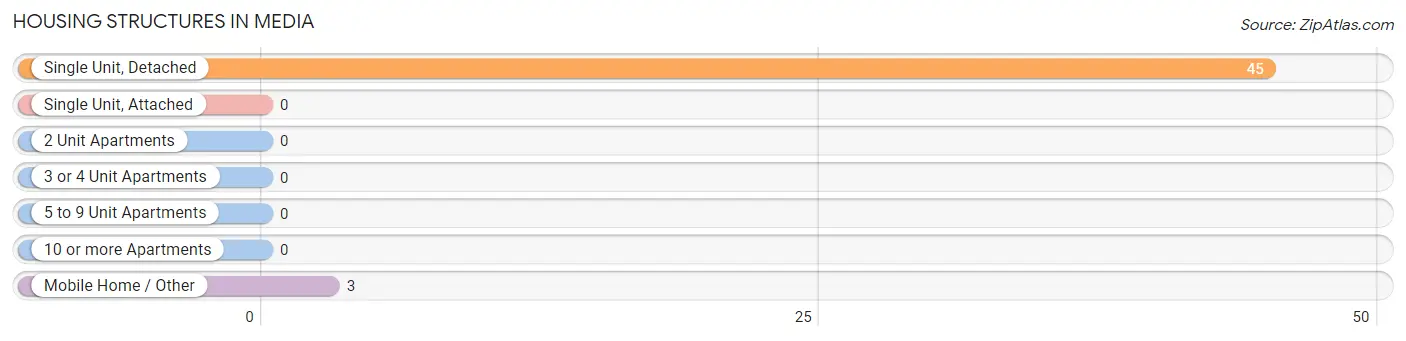
| Structure Type | # Housing Units | % Housing Units |
| Single Unit, Detached | 45 | 93.8% |
| Single Unit, Attached | 0 | 0.0% |
| 2 Unit Apartments | 0 | 0.0% |
| 3 or 4 Unit Apartments | 0 | 0.0% |
| 5 to 9 Unit Apartments | 0 | 0.0% |
| 10 or more Apartments | 0 | 0.0% |
| Mobile Home / Other | 3 | 6.2% |
| Total | 48 | 100.0% |
Housing Structures by Occupancy in Media
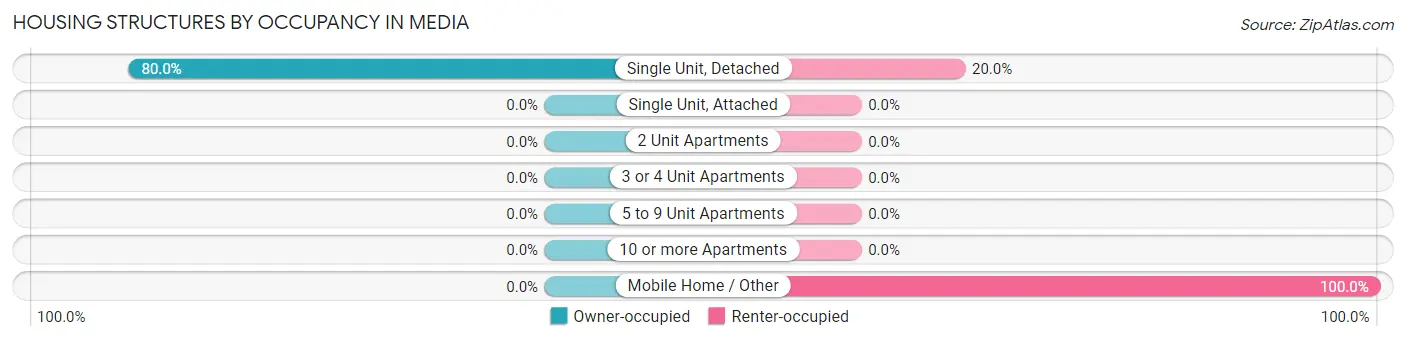
| Structure Type | Owner-occupied | Renter-occupied |
| Single Unit, Detached | 36 (80.0%) | 9 (20.0%) |
| Single Unit, Attached | 0 (0.0%) | 0 (0.0%) |
| 2 Unit Apartments | 0 (0.0%) | 0 (0.0%) |
| 3 or 4 Unit Apartments | 0 (0.0%) | 0 (0.0%) |
| 5 to 9 Unit Apartments | 0 (0.0%) | 0 (0.0%) |
| 10 or more Apartments | 0 (0.0%) | 0 (0.0%) |
| Mobile Home / Other | 0 (0.0%) | 3 (100.0%) |
| Total | 36 (75.0%) | 12 (25.0%) |
Housing Structures by Number of Rooms in Media
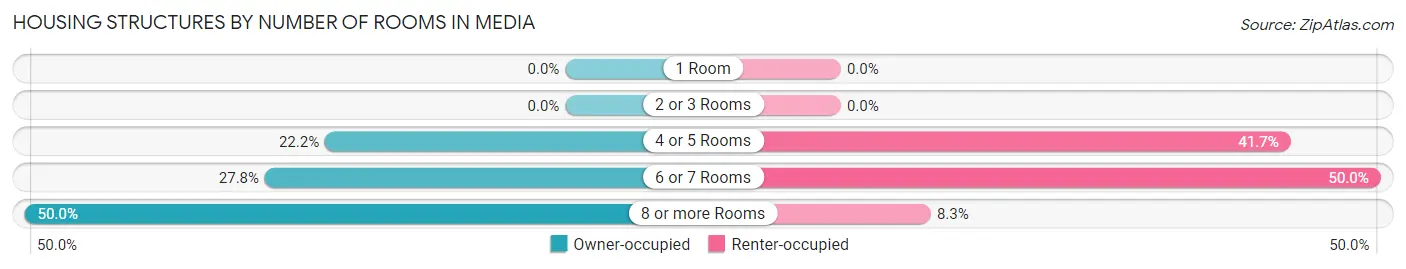
| Number of Rooms | Owner-occupied | Renter-occupied |
| 1 Room | 0 (0.0%) | 0 (0.0%) |
| 2 or 3 Rooms | 0 (0.0%) | 0 (0.0%) |
| 4 or 5 Rooms | 8 (22.2%) | 5 (41.7%) |
| 6 or 7 Rooms | 10 (27.8%) | 6 (50.0%) |
| 8 or more Rooms | 18 (50.0%) | 1 (8.3%) |
| Total | 36 (100.0%) | 12 (100.0%) |
Housing Structure by Heating Type in Media
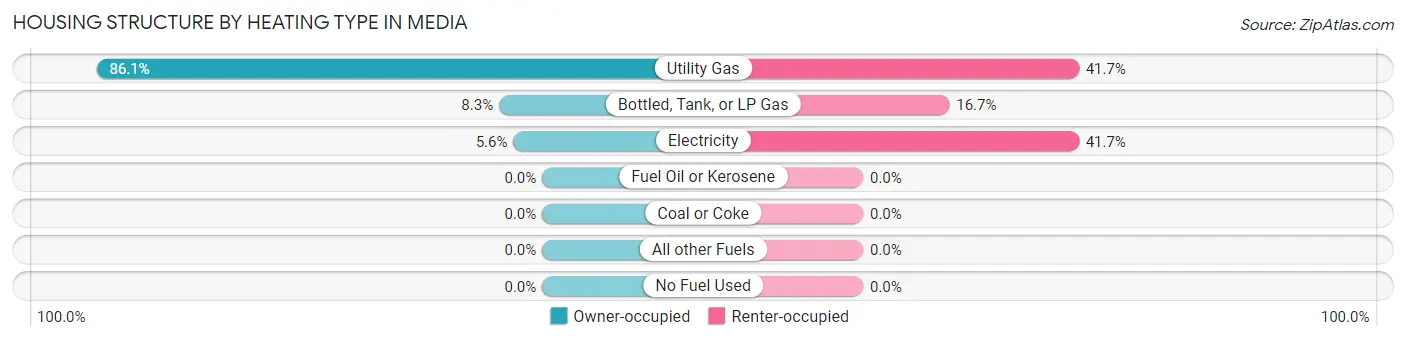
| Heating Type | Owner-occupied | Renter-occupied |
| Utility Gas | 31 (86.1%) | 5 (41.7%) |
| Bottled, Tank, or LP Gas | 3 (8.3%) | 2 (16.7%) |
| Electricity | 2 (5.6%) | 5 (41.7%) |
| Fuel Oil or Kerosene | 0 (0.0%) | 0 (0.0%) |
| Coal or Coke | 0 (0.0%) | 0 (0.0%) |
| All other Fuels | 0 (0.0%) | 0 (0.0%) |
| No Fuel Used | 0 (0.0%) | 0 (0.0%) |
| Total | 36 (100.0%) | 12 (100.0%) |
Household Vehicle Usage in Media
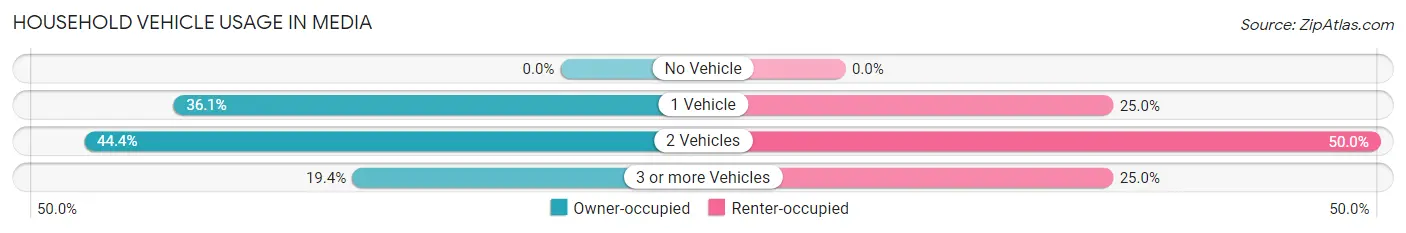
| Vehicles per Household | Owner-occupied | Renter-occupied |
| No Vehicle | 0 (0.0%) | 0 (0.0%) |
| 1 Vehicle | 13 (36.1%) | 3 (25.0%) |
| 2 Vehicles | 16 (44.4%) | 6 (50.0%) |
| 3 or more Vehicles | 7 (19.4%) | 3 (25.0%) |
| Total | 36 (100.0%) | 12 (100.0%) |
Real Estate & Mortgages in Media
Real Estate and Mortgage Overview in Media
| Characteristic | Without Mortgage | With Mortgage |
| Housing Units | 12 | 24 |
| Median Property Value | $95,000 | $78,300 |
| Median Household Income | $41,250 | $4 |
| Monthly Housing Costs | $571 | $0 |
| Real Estate Taxes | $1,786 | $0 |
Property Value by Mortgage Status in Media
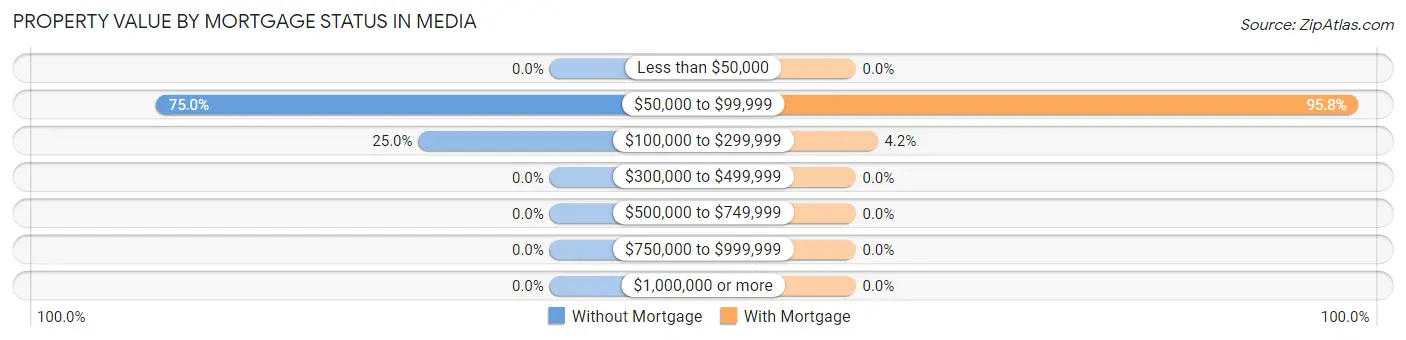
| Property Value | Without Mortgage | With Mortgage |
| Less than $50,000 | 0 (0.0%) | 0 (0.0%) |
| $50,000 to $99,999 | 9 (75.0%) | 23 (95.8%) |
| $100,000 to $299,999 | 3 (25.0%) | 1 (4.2%) |
| $300,000 to $499,999 | 0 (0.0%) | 0 (0.0%) |
| $500,000 to $749,999 | 0 (0.0%) | 0 (0.0%) |
| $750,000 to $999,999 | 0 (0.0%) | 0 (0.0%) |
| $1,000,000 or more | 0 (0.0%) | 0 (0.0%) |
| Total | 12 (100.0%) | 24 (100.0%) |
Household Income by Mortgage Status in Media
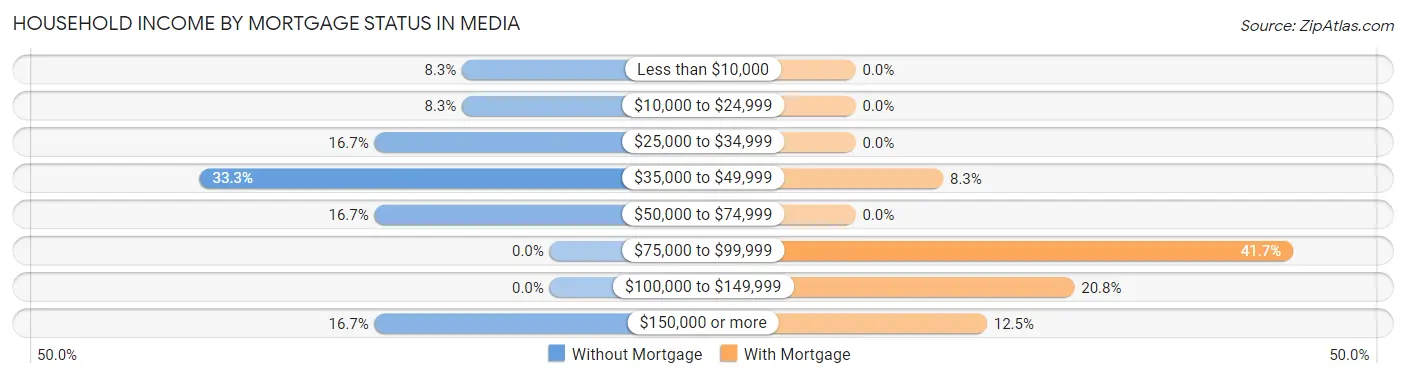
| Household Income | Without Mortgage | With Mortgage |
| Less than $10,000 | 1 (8.3%) | 0 (0.0%) |
| $10,000 to $24,999 | 1 (8.3%) | 0 (0.0%) |
| $25,000 to $34,999 | 2 (16.7%) | 0 (0.0%) |
| $35,000 to $49,999 | 4 (33.3%) | 2 (8.3%) |
| $50,000 to $74,999 | 2 (16.7%) | 0 (0.0%) |
| $75,000 to $99,999 | 0 (0.0%) | 10 (41.7%) |
| $100,000 to $149,999 | 0 (0.0%) | 5 (20.8%) |
| $150,000 or more | 2 (16.7%) | 3 (12.5%) |
| Total | 12 (100.0%) | 24 (100.0%) |
Property Value to Household Income Ratio in Media
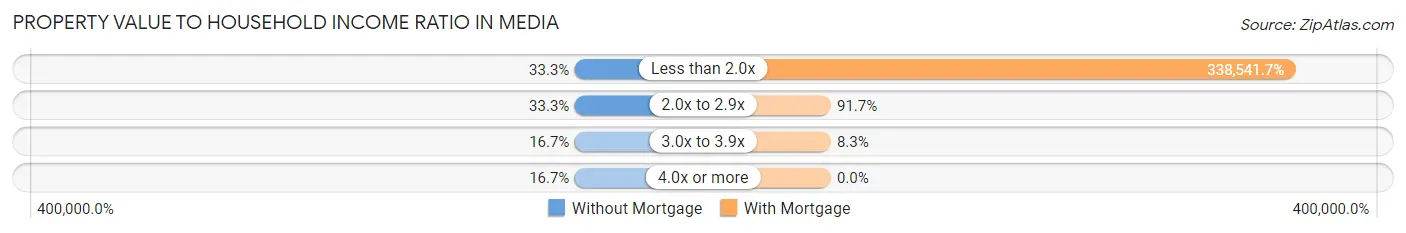
| Value-to-Income Ratio | Without Mortgage | With Mortgage |
| Less than 2.0x | 4 (33.3%) | 81,250 (338,541.7%) |
| 2.0x to 2.9x | 4 (33.3%) | 22 (91.7%) |
| 3.0x to 3.9x | 2 (16.7%) | 2 (8.3%) |
| 4.0x or more | 2 (16.7%) | 0 (0.0%) |
| Total | 12 (100.0%) | 24 (100.0%) |
Real Estate Taxes by Mortgage Status in Media

| Property Taxes | Without Mortgage | With Mortgage |
| Less than $800 | 1 (8.3%) | 0 (0.0%) |
| $800 to $1,499 | 0 (0.0%) | 0 (0.0%) |
| $800 to $1,499 | 9 (75.0%) | 6 (25.0%) |
| Total | 12 (100.0%) | 24 (100.0%) |
Health & Disability in Media
Health Insurance Coverage by Age in Media
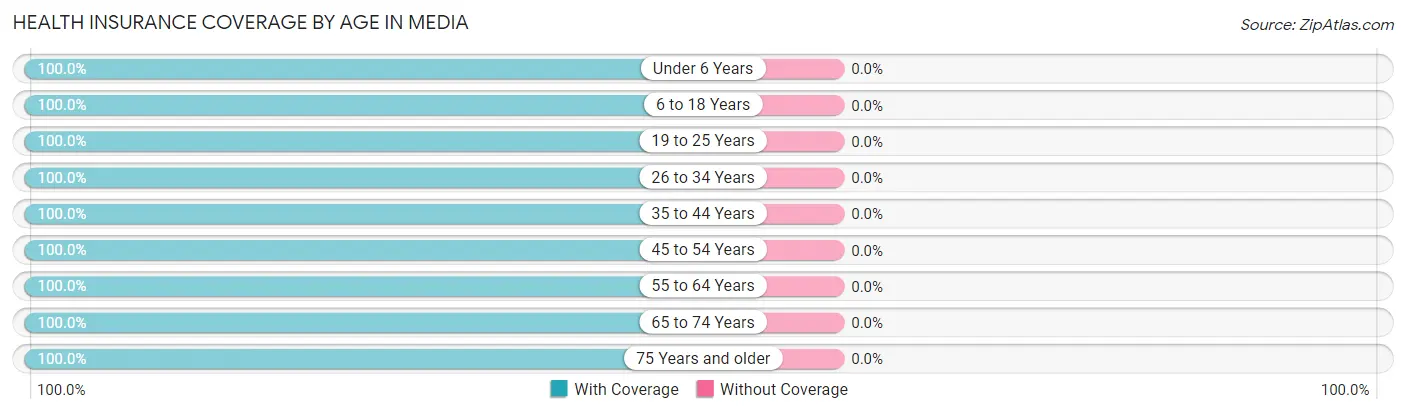
| Age Bracket | With Coverage | Without Coverage |
| Under 6 Years | 5 (100.0%) | 0 (0.0%) |
| 6 to 18 Years | 20 (100.0%) | 0 (0.0%) |
| 19 to 25 Years | 4 (100.0%) | 0 (0.0%) |
| 26 to 34 Years | 10 (100.0%) | 0 (0.0%) |
| 35 to 44 Years | 14 (100.0%) | 0 (0.0%) |
| 45 to 54 Years | 28 (100.0%) | 0 (0.0%) |
| 55 to 64 Years | 14 (100.0%) | 0 (0.0%) |
| 65 to 74 Years | 3 (100.0%) | 0 (0.0%) |
| 75 Years and older | 15 (100.0%) | 0 (0.0%) |
| Total | 113 (100.0%) | 0 (0.0%) |
Health Insurance Coverage by Citizenship Status in Media
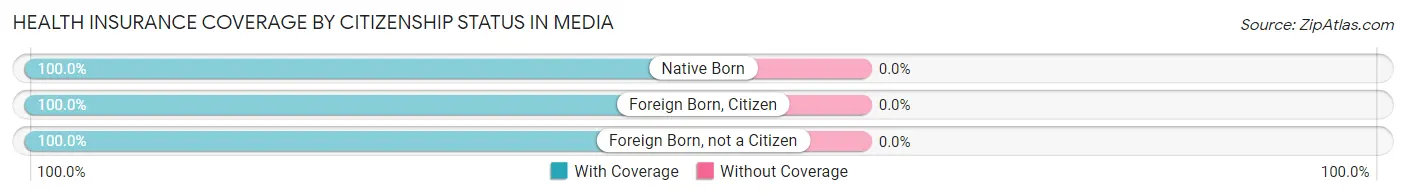
| Citizenship Status | With Coverage | Without Coverage |
| Native Born | 5 (100.0%) | 0 (0.0%) |
| Foreign Born, Citizen | 20 (100.0%) | 0 (0.0%) |
| Foreign Born, not a Citizen | 4 (100.0%) | 0 (0.0%) |
Health Insurance Coverage by Household Income in Media
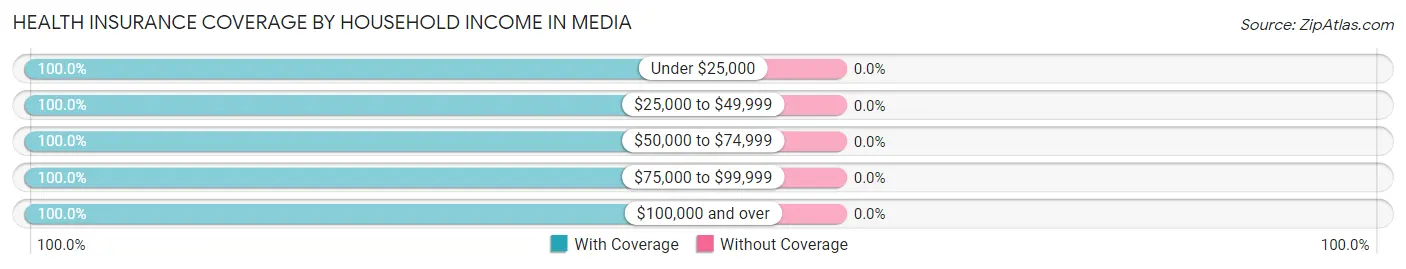
| Household Income | With Coverage | Without Coverage |
| Under $25,000 | 26 (100.0%) | 0 (0.0%) |
| $25,000 to $49,999 | 14 (100.0%) | 0 (0.0%) |
| $50,000 to $74,999 | 30 (100.0%) | 0 (0.0%) |
| $75,000 to $99,999 | 15 (100.0%) | 0 (0.0%) |
| $100,000 and over | 28 (100.0%) | 0 (0.0%) |
Public vs Private Health Insurance Coverage by Age in Media
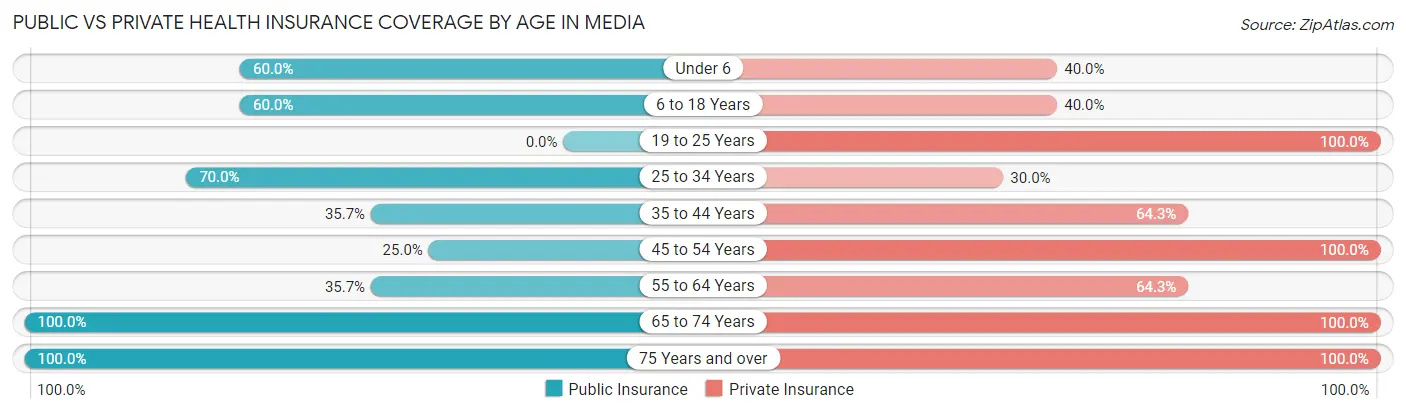
| Age Bracket | Public Insurance | Private Insurance |
| Under 6 | 3 (60.0%) | 2 (40.0%) |
| 6 to 18 Years | 12 (60.0%) | 8 (40.0%) |
| 19 to 25 Years | 0 (0.0%) | 4 (100.0%) |
| 25 to 34 Years | 7 (70.0%) | 3 (30.0%) |
| 35 to 44 Years | 5 (35.7%) | 9 (64.3%) |
| 45 to 54 Years | 7 (25.0%) | 28 (100.0%) |
| 55 to 64 Years | 5 (35.7%) | 9 (64.3%) |
| 65 to 74 Years | 3 (100.0%) | 3 (100.0%) |
| 75 Years and over | 15 (100.0%) | 15 (100.0%) |
| Total | 57 (50.4%) | 81 (71.7%) |
Disability Status by Sex by Age in Media
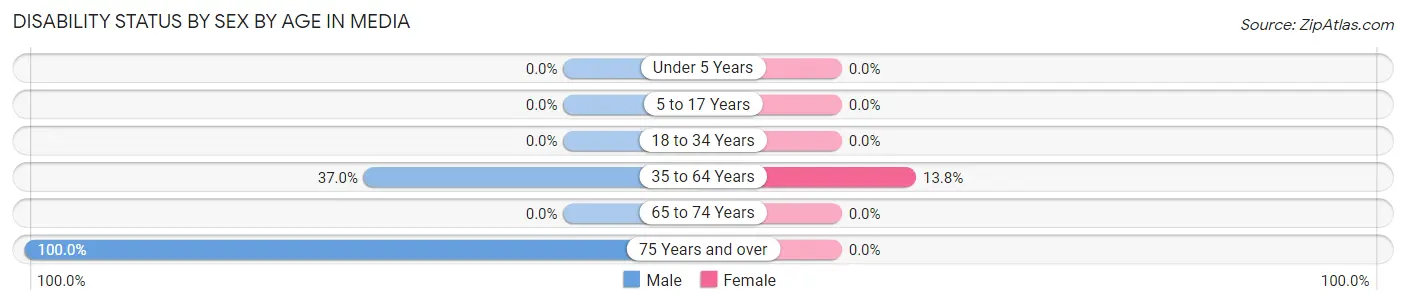
| Age Bracket | Male | Female |
| Under 5 Years | 0 (0.0%) | 0 (0.0%) |
| 5 to 17 Years | 0 (0.0%) | 0 (0.0%) |
| 18 to 34 Years | 0 (0.0%) | 0 (0.0%) |
| 35 to 64 Years | 10 (37.0%) | 4 (13.8%) |
| 65 to 74 Years | 0 (0.0%) | 0 (0.0%) |
| 75 Years and over | 9 (100.0%) | 0 (0.0%) |
Disability Class by Sex by Age in Media
Disability Class: Hearing Difficulty
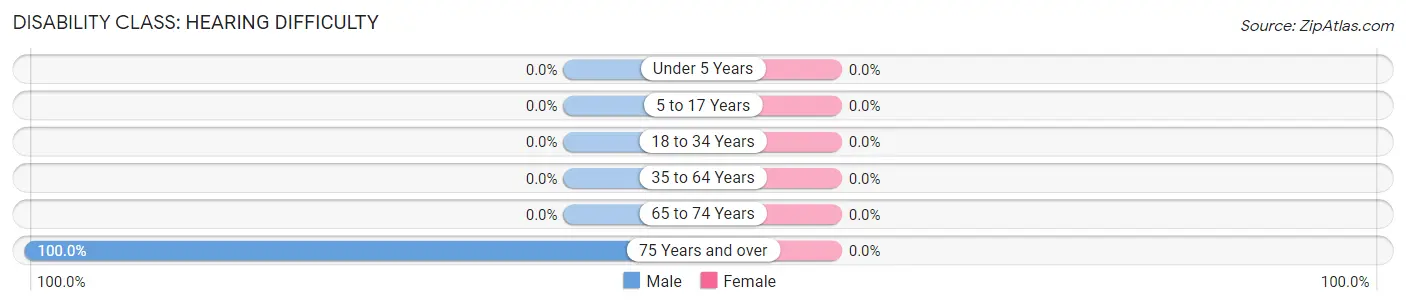
| Age Bracket | Male | Female |
| Under 5 Years | 0 (0.0%) | 0 (0.0%) |
| 5 to 17 Years | 0 (0.0%) | 0 (0.0%) |
| 18 to 34 Years | 0 (0.0%) | 0 (0.0%) |
| 35 to 64 Years | 0 (0.0%) | 0 (0.0%) |
| 65 to 74 Years | 0 (0.0%) | 0 (0.0%) |
| 75 Years and over | 9 (100.0%) | 0 (0.0%) |
Disability Class: Vision Difficulty
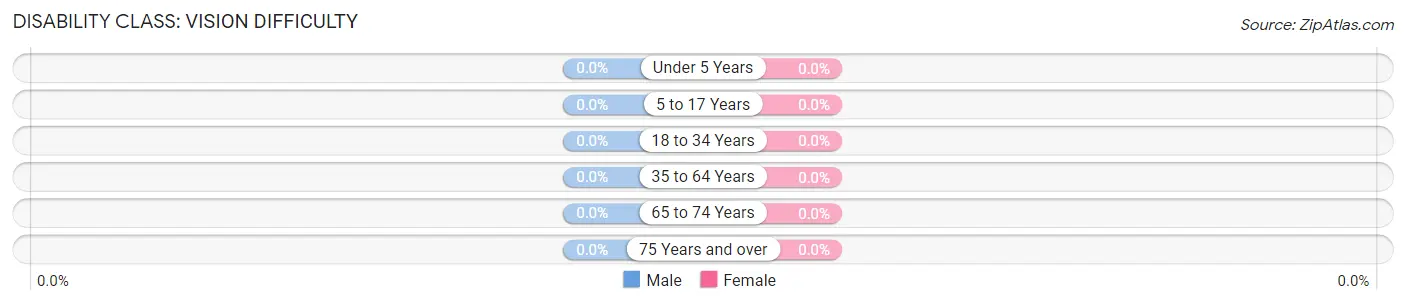
| Age Bracket | Male | Female |
| Under 5 Years | 0 (0.0%) | 0 (0.0%) |
| 5 to 17 Years | 0 (0.0%) | 0 (0.0%) |
| 18 to 34 Years | 0 (0.0%) | 0 (0.0%) |
| 35 to 64 Years | 0 (0.0%) | 0 (0.0%) |
| 65 to 74 Years | 0 (0.0%) | 0 (0.0%) |
| 75 Years and over | 0 (0.0%) | 0 (0.0%) |
Disability Class: Cognitive Difficulty
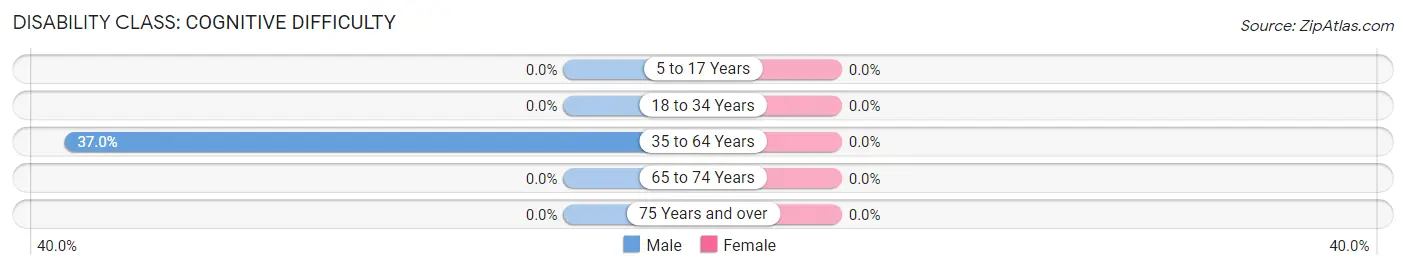
| Age Bracket | Male | Female |
| 5 to 17 Years | 0 (0.0%) | 0 (0.0%) |
| 18 to 34 Years | 0 (0.0%) | 0 (0.0%) |
| 35 to 64 Years | 10 (37.0%) | 0 (0.0%) |
| 65 to 74 Years | 0 (0.0%) | 0 (0.0%) |
| 75 Years and over | 0 (0.0%) | 0 (0.0%) |
Disability Class: Ambulatory Difficulty
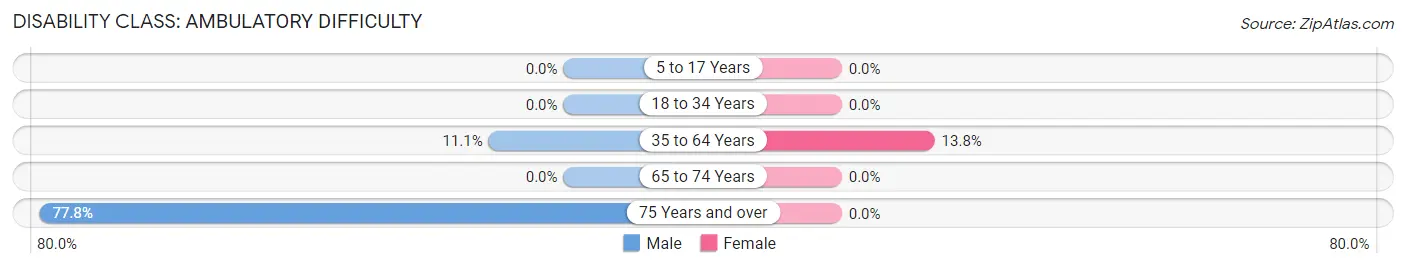
| Age Bracket | Male | Female |
| 5 to 17 Years | 0 (0.0%) | 0 (0.0%) |
| 18 to 34 Years | 0 (0.0%) | 0 (0.0%) |
| 35 to 64 Years | 3 (11.1%) | 4 (13.8%) |
| 65 to 74 Years | 0 (0.0%) | 0 (0.0%) |
| 75 Years and over | 7 (77.8%) | 0 (0.0%) |
Disability Class: Self-Care Difficulty
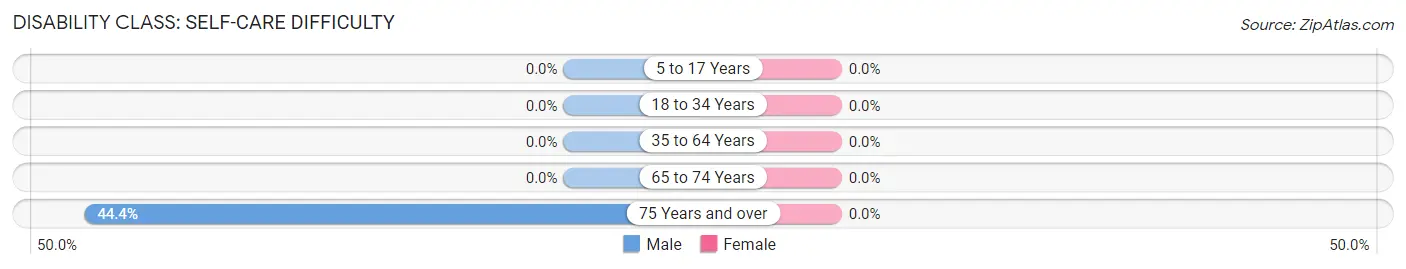
| Age Bracket | Male | Female |
| 5 to 17 Years | 0 (0.0%) | 0 (0.0%) |
| 18 to 34 Years | 0 (0.0%) | 0 (0.0%) |
| 35 to 64 Years | 0 (0.0%) | 0 (0.0%) |
| 65 to 74 Years | 0 (0.0%) | 0 (0.0%) |
| 75 Years and over | 4 (44.4%) | 0 (0.0%) |
Technology Access in Media
Computing Device Access in Media
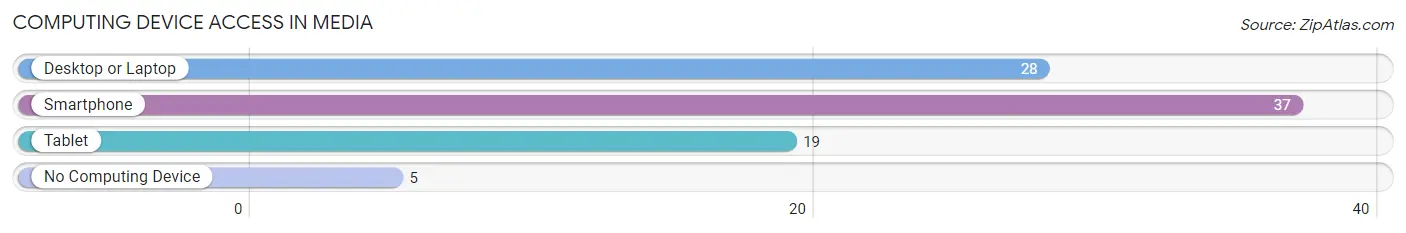
| Device Type | # Households | % Households |
| Desktop or Laptop | 28 | 58.3% |
| Smartphone | 37 | 77.1% |
| Tablet | 19 | 39.6% |
| No Computing Device | 5 | 10.4% |
| Total | 48 | 100.0% |
Internet Access in Media
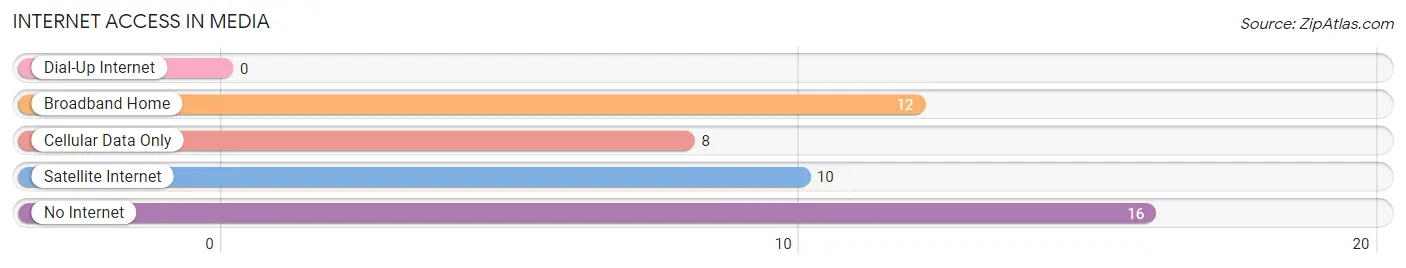
| Internet Type | # Households | % Households |
| Dial-Up Internet | 0 | 0.0% |
| Broadband Home | 12 | 25.0% |
| Cellular Data Only | 8 | 16.7% |
| Satellite Internet | 10 | 20.8% |
| No Internet | 16 | 33.3% |
| Total | 48 | 100.0% |
Media Summary
Illinois is a state located in the Midwestern United States. It is the sixth most populous state in the country, with a population of 12,859,995 as of the 2019 United States Census. Illinois is bordered by Wisconsin to the north, Iowa to the west, Missouri to the south, and Indiana to the east. The capital of Illinois is Springfield, and the largest city is Chicago.
History
The history of Illinois dates back to the Native American tribes that inhabited the area prior to European settlement. The first Europeans to explore the region were French explorers, who arrived in the late 1600s. The French established trading posts and settlements in the area, and the region eventually became part of the French colony of New France. In 1763, the region was ceded to Great Britain as part of the Treaty of Paris.
In 1778, the area became part of the newly formed United States of America, and was organized as part of the Northwest Territory. In 1809, Illinois became the 21st state to join the Union. During the 19th century, Illinois experienced rapid growth and development, becoming an important center of industry and transportation.
Geography
Illinois is located in the Midwestern United States, and is bordered by Wisconsin to the north, Iowa to the west, Missouri to the south, and Indiana to the east. The state has a total area of 57,914 square miles, making it the 25th largest state in the country.
Illinois is divided into three distinct geographic regions: the Central Plains, the Shawnee Hills, and the Mississippi River Valley. The Central Plains region is located in the northern part of the state, and is characterized by flat terrain and fertile soil. The Shawnee Hills region is located in the southern part of the state, and is characterized by rolling hills and forests. The Mississippi River Valley region is located in the western part of the state, and is characterized by flat terrain and rich soil.
Economy
Illinois has a diverse and robust economy, with a gross state product of $845 billion in 2018. The state is home to a number of major industries, including manufacturing, finance, insurance, real estate, and health care.
Illinois is a major agricultural state, with corn, soybeans, and hogs being the top three agricultural products. The state is also a major producer of coal, and is home to a number of major oil refineries.
Illinois is home to a number of major corporations, including Boeing, Caterpillar, Archer Daniels Midland, and Motorola Solutions. The state is also home to a number of major universities, including the University of Illinois, Northwestern University, and the University of Chicago.
Demographics
As of the 2019 United States Census, the population of Illinois was 12,859,995. The state is home to a diverse population, with the largest ethnic groups being White (77.2%), Black or African American (14.7%), Hispanic or Latino (13.2%), and Asian (5.2%).
The median household income in Illinois is $62,992, and the median home value is $203,400. The state has a poverty rate of 11.3%, and the unemployment rate is 4.2%.
Conclusion
Illinois is a state located in the Midwestern United States. It is the sixth most populous state in the country, with a population of 12,859,995 as of the 2019 United States Census. Illinois has a diverse and robust economy, with a gross state product of $845 billion in 2018. The state is home to a diverse population, with the largest ethnic groups being White (77.2%), Black or African American (14.7%), Hispanic or Latino (13.2%), and Asian (5.2%). Illinois is an important center of industry and transportation, and is home to a number of major corporations, universities, and agricultural products.
Common Questions
What is Per Capita Income in Media?
Per Capita income in Media is $31,665.
What is the Median Family Income in Media?
Median Family Income in Media is $70,714.
What is the Median Household income in Media?
Median Household Income in Media is $70,357.
What is Income or Wage Gap in Media?
Income or Wage Gap in Media is 10.0%.
Women in Media earn 90.0 cents for every dollar earned by a man.
What is Inequality or Gini Index in Media?
Inequality or Gini Index in Media is 0.40.
What is the Total Population of Media?
Total Population of Media is 113.
What is the Total Male Population of Media?
Total Male Population of Media is 60.
What is the Total Female Population of Media?
Total Female Population of Media is 53.
What is the Ratio of Males per 100 Females in Media?
There are 113.21 Males per 100 Females in Media.
What is the Ratio of Females per 100 Males in Media?
There are 88.33 Females per 100 Males in Media.
What is the Median Population Age in Media?
Median Population Age in Media is 49.1 Years.
What is the Average Family Size in Media
Average Family Size in Media is 2.8 People.
What is the Average Household Size in Media
Average Household Size in Media is 2.4 People.
How Large is the Labor Force in Media?
There are 57 People in the Labor Forcein in Media.
What is the Percentage of People in the Labor Force in Media?
59.4% of People are in the Labor Force in Media.