Matherville, IL Map & Demographics
Matherville Map
Matherville Overview
$25,986
PER CAPITA INCOME
$87,250
AVG FAMILY INCOME
$70,556
AVG HOUSEHOLD INCOME
48.7%
WAGE / INCOME GAP [ % ]
51.3¢/ $1
WAGE / INCOME GAP [ $ ]
0.39
INEQUALITY / GINI INDEX
794
TOTAL POPULATION
337
MALE POPULATION
457
FEMALE POPULATION
73.74
MALES / 100 FEMALES
135.61
FEMALES / 100 MALES
34.4
MEDIAN AGE
3.3
AVG FAMILY SIZE
2.9
AVG HOUSEHOLD SIZE
320
LABOR FORCE [ PEOPLE ]
58.7%
PERCENT IN LABOR FORCE
5.9%
UNEMPLOYMENT RATE
Matherville Zip Codes
Matherville Area Codes
Income in Matherville
Income Overview in Matherville
Per Capita Income in Matherville is $25,986, while median incomes of families and households are $87,250 and $70,556 respectively.
| Characteristic | Number | Measure |
| Per Capita Income | 794 | $25,986 |
| Median Family Income | 223 | $87,250 |
| Mean Family Income | 223 | $82,585 |
| Median Household Income | 274 | $70,556 |
| Mean Household Income | 274 | $73,138 |
| Income Deficit | 223 | $0 |
| Wage / Income Gap (%) | 794 | 48.73% |
| Wage / Income Gap ($) | 794 | 51.27¢ per $1 |
| Gini / Inequality Index | 794 | 0.39 |
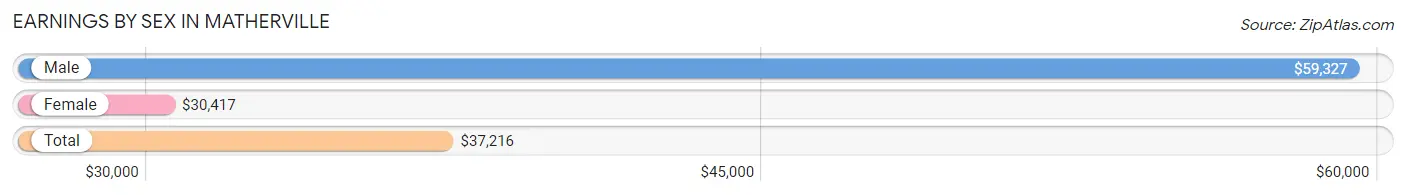
Earnings by Sex in Matherville
Average Earnings in Matherville are $37,216, $59,327 for men and $30,417 for women, a difference of 48.7%.
| Sex | Number | Average Earnings |
| Male | 139 (40.8%) | $59,327 |
| Female | 202 (59.2%) | $30,417 |
| Total | 341 (100.0%) | $37,216 |
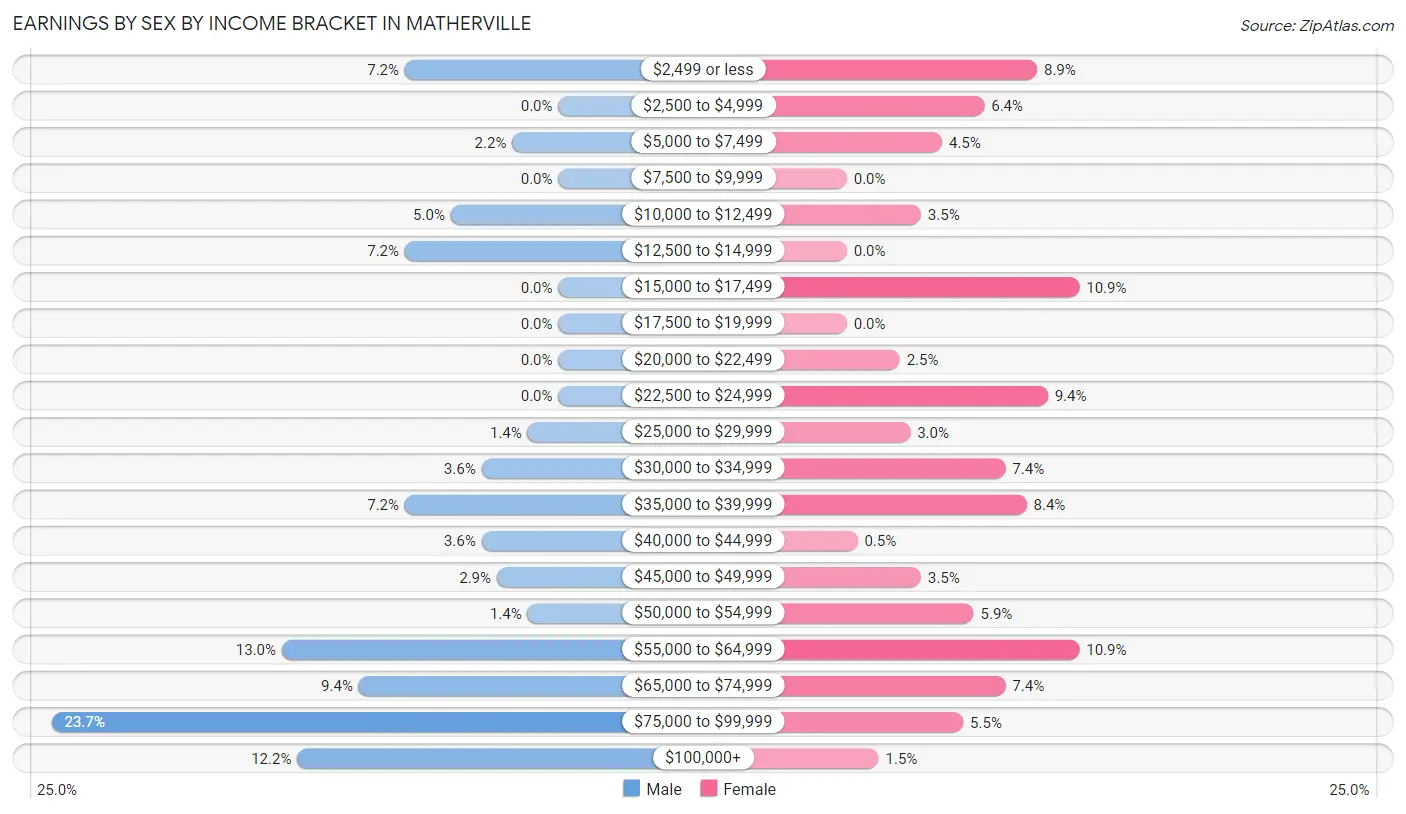
Earnings by Sex by Income Bracket in Matherville
The most common earnings brackets in Matherville are $75,000 to $99,999 for men (33 | 23.7%) and $15,000 to $17,499 for women (22 | 10.9%).
| Income | Male | Female |
| $2,499 or less | 10 (7.2%) | 18 (8.9%) |
| $2,500 to $4,999 | 0 (0.0%) | 13 (6.4%) |
| $5,000 to $7,499 | 3 (2.2%) | 9 (4.5%) |
| $7,500 to $9,999 | 0 (0.0%) | 0 (0.0%) |
| $10,000 to $12,499 | 7 (5.0%) | 7 (3.5%) |
| $12,500 to $14,999 | 10 (7.2%) | 0 (0.0%) |
| $15,000 to $17,499 | 0 (0.0%) | 22 (10.9%) |
| $17,500 to $19,999 | 0 (0.0%) | 0 (0.0%) |
| $20,000 to $22,499 | 0 (0.0%) | 5 (2.5%) |
| $22,500 to $24,999 | 0 (0.0%) | 19 (9.4%) |
| $25,000 to $29,999 | 2 (1.4%) | 6 (3.0%) |
| $30,000 to $34,999 | 5 (3.6%) | 15 (7.4%) |
| $35,000 to $39,999 | 10 (7.2%) | 17 (8.4%) |
| $40,000 to $44,999 | 5 (3.6%) | 1 (0.5%) |
| $45,000 to $49,999 | 4 (2.9%) | 7 (3.5%) |
| $50,000 to $54,999 | 2 (1.4%) | 12 (5.9%) |
| $55,000 to $64,999 | 18 (13.0%) | 22 (10.9%) |
| $65,000 to $74,999 | 13 (9.3%) | 15 (7.4%) |
| $75,000 to $99,999 | 33 (23.7%) | 11 (5.4%) |
| $100,000+ | 17 (12.2%) | 3 (1.5%) |
| Total | 139 (100.0%) | 202 (100.0%) |
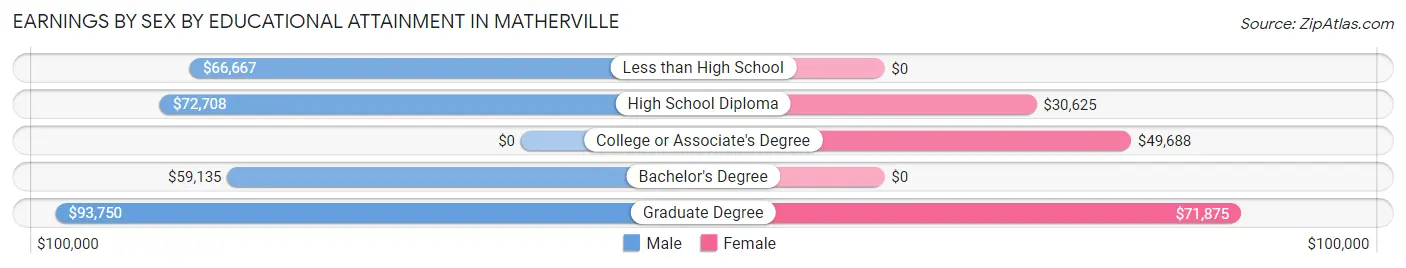
Earnings by Sex by Educational Attainment in Matherville
Average earnings in Matherville are $68,750 for men and $33,750 for women, a difference of 50.9%. Men with an educational attainment of graduate degree enjoy the highest average annual earnings of $93,750, while those with bachelor's degree education earn the least with $59,135. Women with an educational attainment of graduate degree earn the most with the average annual earnings of $71,875, while those with high school diploma education have the smallest earnings of $30,625.
| Educational Attainment | Male Income | Female Income |
| Less than High School | $66,667 | $0 |
| High School Diploma | $72,708 | $30,625 |
| College or Associate's Degree | - | - |
| Bachelor's Degree | $59,135 | $0 |
| Graduate Degree | $93,750 | $71,875 |
| Total | $68,750 | $33,750 |
Family Income in Matherville
Family Income Brackets in Matherville
According to the Matherville family income data, there are 68 families falling into the $100,000 to $149,999 income range, which is the most common income bracket and makes up 30.5% of all families.
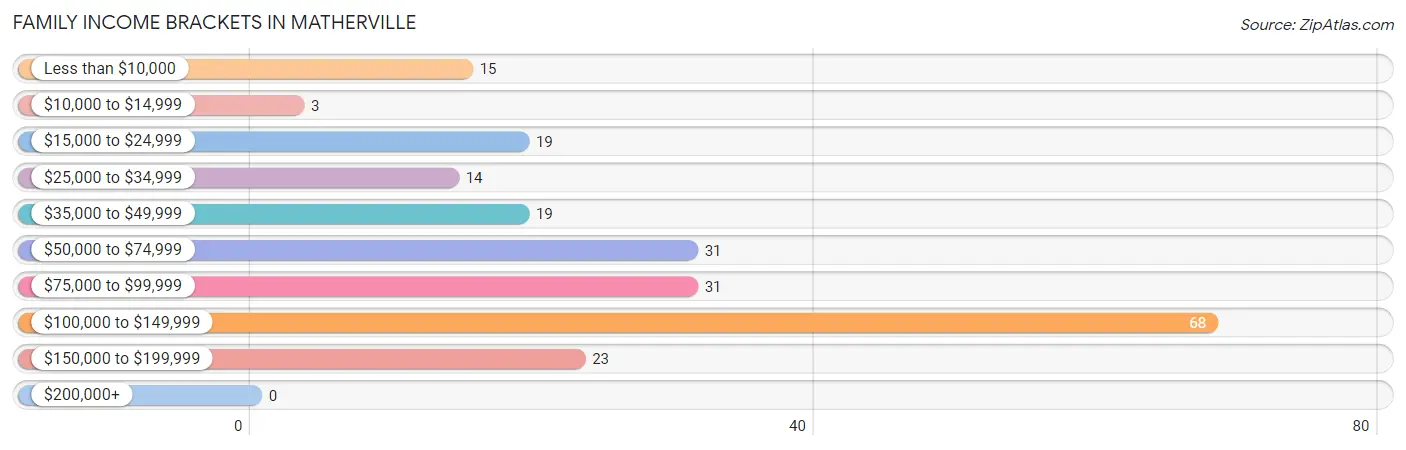
| Income Bracket | # Families | % Families |
| Less than $10,000 | 15 | 6.7% |
| $10,000 to $14,999 | 3 | 1.3% |
| $15,000 to $24,999 | 19 | 8.5% |
| $25,000 to $34,999 | 14 | 6.3% |
| $35,000 to $49,999 | 19 | 8.5% |
| $50,000 to $74,999 | 31 | 13.9% |
| $75,000 to $99,999 | 31 | 13.9% |
| $100,000 to $149,999 | 68 | 30.5% |
| $150,000 to $199,999 | 23 | 10.3% |
| $200,000+ | 0 | 0.0% |
Family Income by Famaliy Size in Matherville
2-person families (120 | 53.8%) account for the highest median family income in Matherville with $97,500 per family, while 2-person families (120 | 53.8%) have the highest median income of $48,750 per family member.
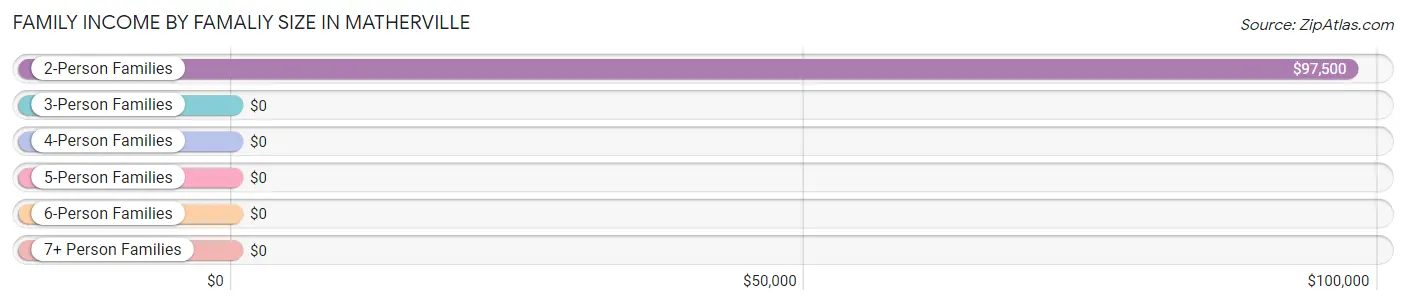
| Income Bracket | # Families | Median Income |
| 2-Person Families | 120 (53.8%) | $97,500 |
| 3-Person Families | 25 (11.2%) | $0 |
| 4-Person Families | 37 (16.6%) | $0 |
| 5-Person Families | 38 (17.0%) | $0 |
| 6-Person Families | 0 (0.0%) | $0 |
| 7+ Person Families | 3 (1.3%) | $0 |
| Total | 223 (100.0%) | $87,250 |
Family Income by Number of Earners in Matherville
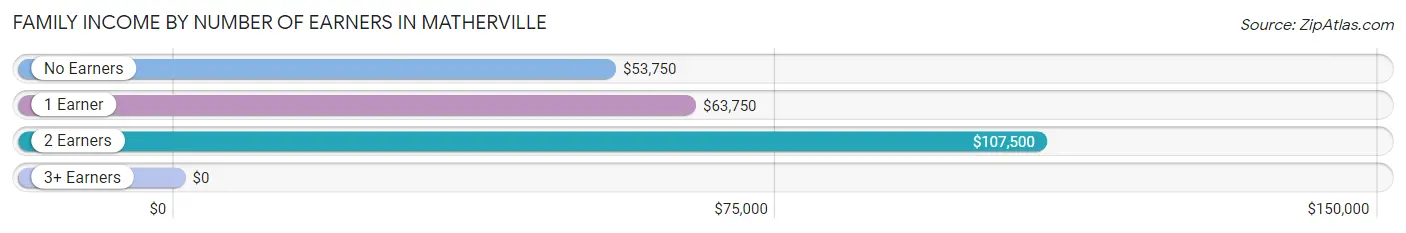
| Number of Earners | # Families | Median Income |
| No Earners | 46 (20.6%) | $53,750 |
| 1 Earner | 74 (33.2%) | $63,750 |
| 2 Earners | 92 (41.3%) | $107,500 |
| 3+ Earners | 11 (4.9%) | $0 |
| Total | 223 (100.0%) | $87,250 |
Household Income in Matherville
Household Income Brackets in Matherville
With 69 households falling in the category, the $100,000 to $149,999 income range is the most frequent in Matherville, accounting for 25.2% of all households.
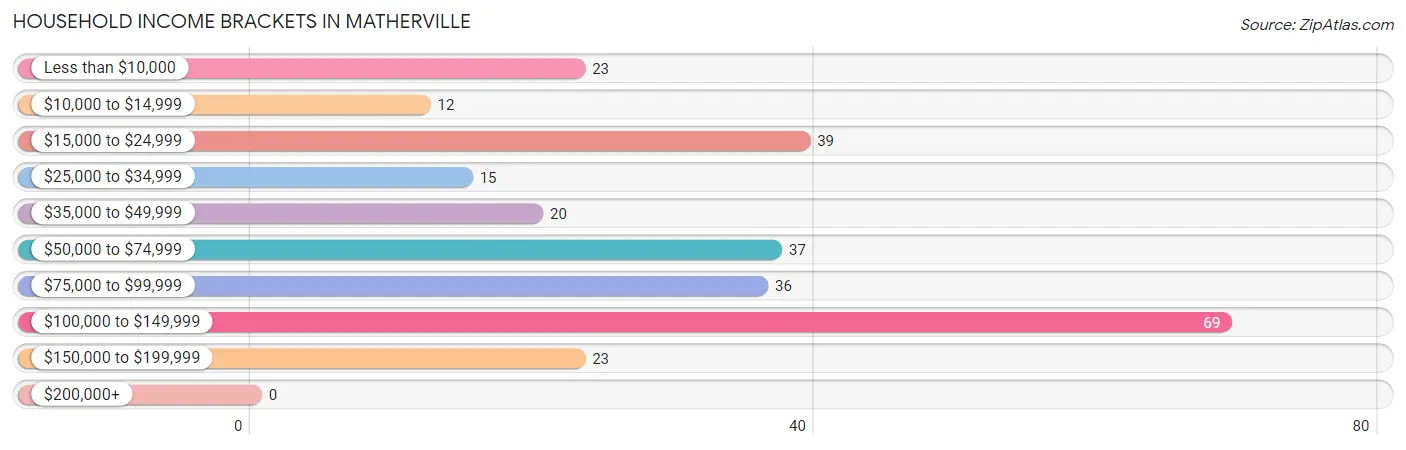
| Income Bracket | # Households | % Households |
| Less than $10,000 | 23 | 8.4% |
| $10,000 to $14,999 | 12 | 4.4% |
| $15,000 to $24,999 | 39 | 14.2% |
| $25,000 to $34,999 | 15 | 5.5% |
| $35,000 to $49,999 | 20 | 7.3% |
| $50,000 to $74,999 | 37 | 13.5% |
| $75,000 to $99,999 | 36 | 13.1% |
| $100,000 to $149,999 | 69 | 25.2% |
| $150,000 to $199,999 | 23 | 8.4% |
| $200,000+ | 0 | 0.0% |
Household Income by Householder Age in Matherville
The median household income in Matherville is $70,556, with the highest median household income of $111,429 found in the 25 to 44 years age bracket for the primary householder. A total of 86 households (31.4%) fall into this category. Meanwhile, the 15 to 24 years age bracket for the primary householder has the lowest median household income of $0, with 9 households (3.3%) in this group.
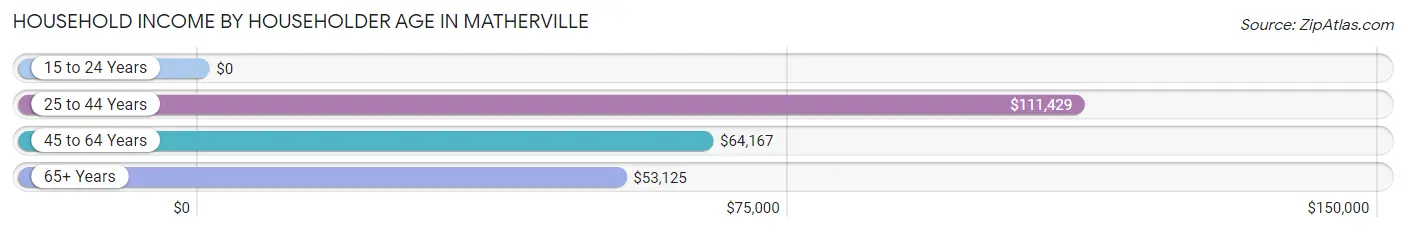
| Income Bracket | # Households | Median Income |
| 15 to 24 Years | 9 (3.3%) | $0 |
| 25 to 44 Years | 86 (31.4%) | $111,429 |
| 45 to 64 Years | 112 (40.9%) | $64,167 |
| 65+ Years | 67 (24.4%) | $53,125 |
| Total | 274 (100.0%) | $70,556 |
Poverty in Matherville
Income Below Poverty by Sex and Age in Matherville
With 14.0% poverty level for males and 16.9% for females among the residents of Matherville, under 5 year old males and under 5 year old females are the most vulnerable to poverty, with 21 males (60.0%) and 16 females (33.3%) in their respective age groups living below the poverty level.
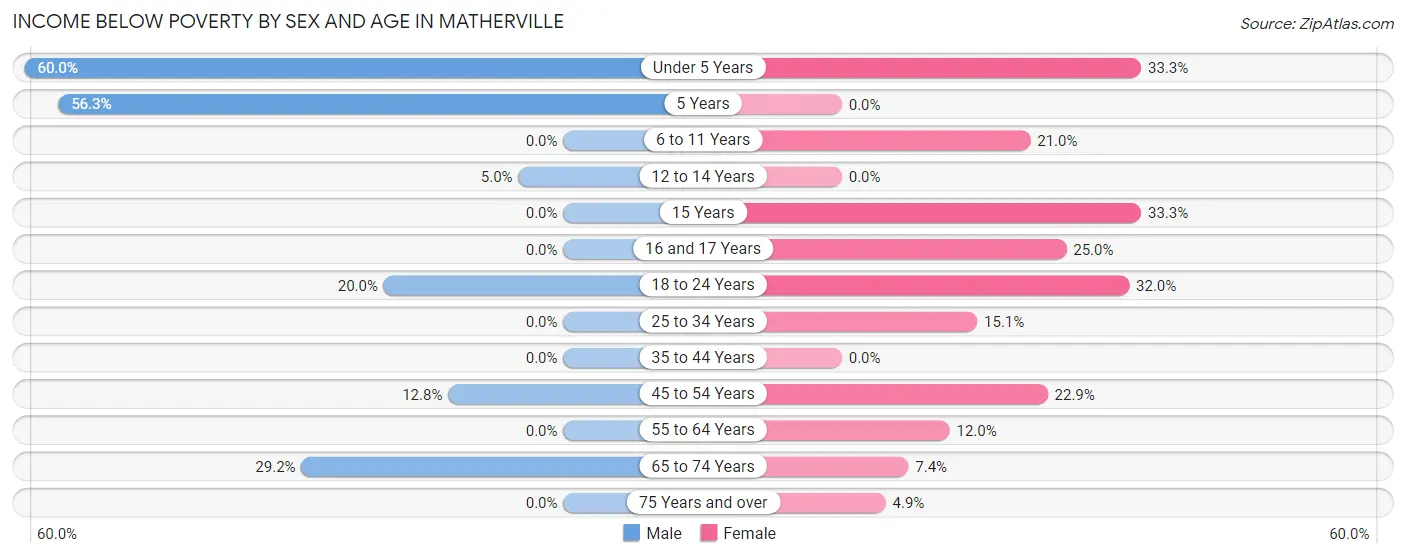
| Age Bracket | Male | Female |
| Under 5 Years | 21 (60.0%) | 16 (33.3%) |
| 5 Years | 9 (56.2%) | 0 (0.0%) |
| 6 to 11 Years | 0 (0.0%) | 17 (21.0%) |
| 12 to 14 Years | 1 (5.0%) | 0 (0.0%) |
| 15 Years | 0 (0.0%) | 3 (33.3%) |
| 16 and 17 Years | 0 (0.0%) | 1 (25.0%) |
| 18 to 24 Years | 4 (20.0%) | 8 (32.0%) |
| 25 to 34 Years | 0 (0.0%) | 11 (15.1%) |
| 35 to 44 Years | 0 (0.0%) | 0 (0.0%) |
| 45 to 54 Years | 5 (12.8%) | 11 (22.9%) |
| 55 to 64 Years | 0 (0.0%) | 6 (12.0%) |
| 65 to 74 Years | 7 (29.2%) | 2 (7.4%) |
| 75 Years and over | 0 (0.0%) | 2 (4.9%) |
| Total | 47 (14.0%) | 77 (16.9%) |
Income Above Poverty by Sex and Age in Matherville
According to the poverty statistics in Matherville, males aged 6 to 11 years and females aged 5 years are the age groups that are most secure financially, with 100.0% of males and 100.0% of females in these age groups living above the poverty line.
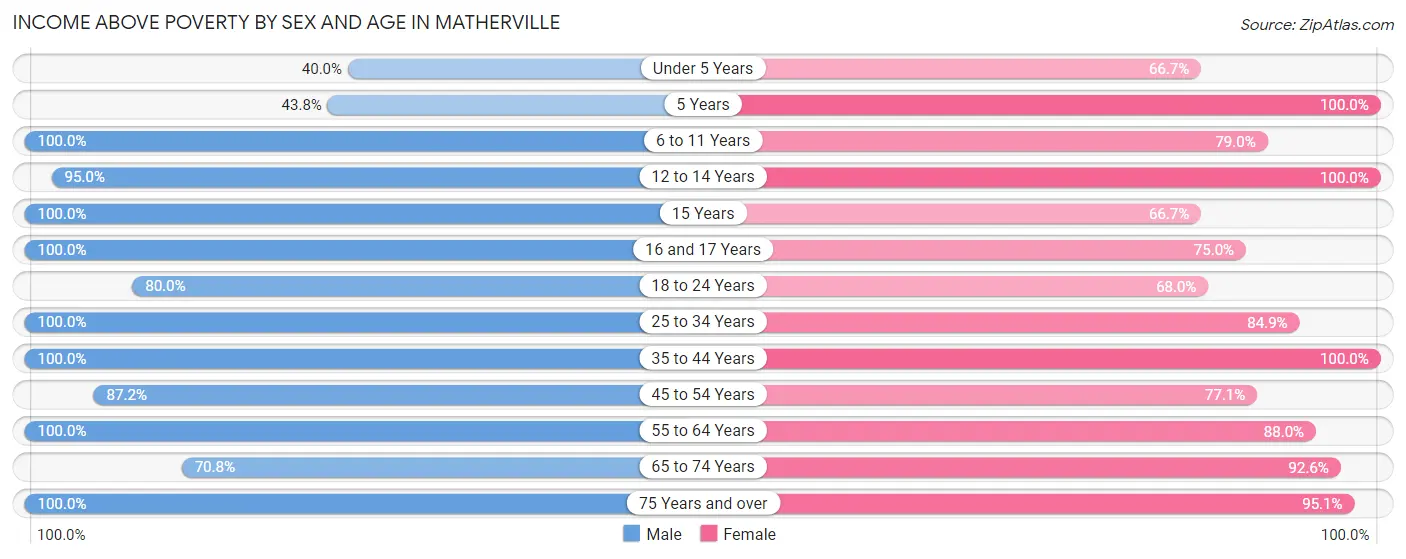
| Age Bracket | Male | Female |
| Under 5 Years | 14 (40.0%) | 32 (66.7%) |
| 5 Years | 7 (43.8%) | 9 (100.0%) |
| 6 to 11 Years | 29 (100.0%) | 64 (79.0%) |
| 12 to 14 Years | 19 (95.0%) | 1 (100.0%) |
| 15 Years | 1 (100.0%) | 6 (66.7%) |
| 16 and 17 Years | 6 (100.0%) | 3 (75.0%) |
| 18 to 24 Years | 16 (80.0%) | 17 (68.0%) |
| 25 to 34 Years | 33 (100.0%) | 62 (84.9%) |
| 35 to 44 Years | 37 (100.0%) | 41 (100.0%) |
| 45 to 54 Years | 34 (87.2%) | 37 (77.1%) |
| 55 to 64 Years | 42 (100.0%) | 44 (88.0%) |
| 65 to 74 Years | 17 (70.8%) | 25 (92.6%) |
| 75 Years and over | 35 (100.0%) | 39 (95.1%) |
| Total | 290 (86.1%) | 380 (83.2%) |
Income Below Poverty Among Married-Couple Families in Matherville
The poverty statistics for married-couple families in Matherville show that 3.3% or 6 of the total 183 families live below the poverty line. Families with 1 or 2 children have the highest poverty rate of 10.6%, comprising of 5 families. On the other hand, families with 3 or 4 children have the lowest poverty rate of 0.0%, which includes 0 families.
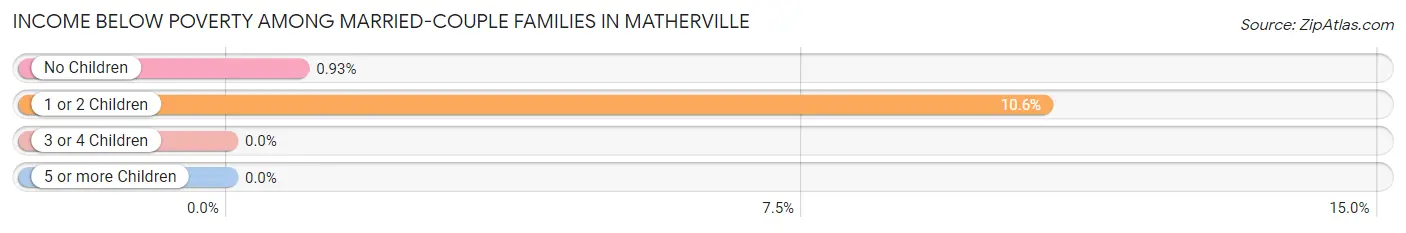
| Children | Above Poverty | Below Poverty |
| No Children | 107 (99.1%) | 1 (0.9%) |
| 1 or 2 Children | 42 (89.4%) | 5 (10.6%) |
| 3 or 4 Children | 25 (100.0%) | 0 (0.0%) |
| 5 or more Children | 3 (100.0%) | 0 (0.0%) |
| Total | 177 (96.7%) | 6 (3.3%) |
Income Below Poverty Among Single-Parent Households in Matherville
According to the poverty data in Matherville, 100.0% or 1 single-father households and 56.4% or 22 single-mother households are living below the poverty line. Among single-father households, those with 1 or 2 children have the highest poverty rate, with 1 households (100.0%) experiencing poverty. Likewise, among single-mother households, those with 3 or 4 children have the highest poverty rate, with 11 households (84.6%) falling below the poverty line.
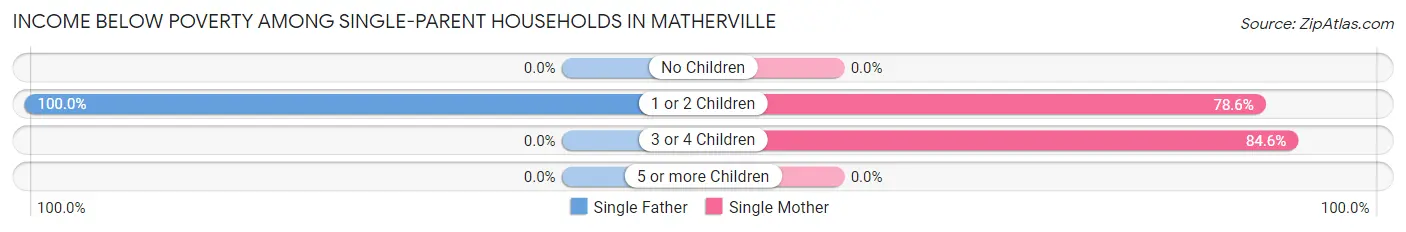
| Children | Single Father | Single Mother |
| No Children | 0 (0.0%) | 0 (0.0%) |
| 1 or 2 Children | 1 (100.0%) | 11 (78.6%) |
| 3 or 4 Children | 0 (0.0%) | 11 (84.6%) |
| 5 or more Children | 0 (0.0%) | 0 (0.0%) |
| Total | 1 (100.0%) | 22 (56.4%) |
Income Below Poverty Among Married-Couple vs Single-Parent Households in Matherville
The poverty data for Matherville shows that 6 of the married-couple family households (3.3%) and 23 of the single-parent households (57.5%) are living below the poverty level. Within the married-couple family households, those with 1 or 2 children have the highest poverty rate, with 5 households (10.6%) falling below the poverty line. Among the single-parent households, those with 3 or 4 children have the highest poverty rate, with 11 household (84.6%) living below poverty.
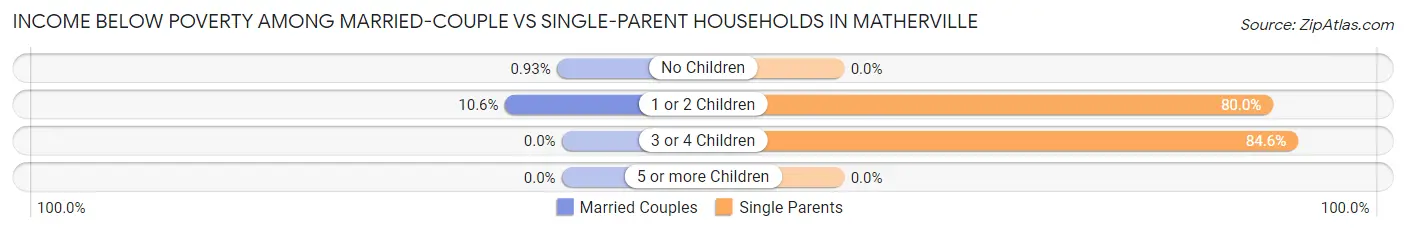
| Children | Married-Couple Families | Single-Parent Households |
| No Children | 1 (0.9%) | 0 (0.0%) |
| 1 or 2 Children | 5 (10.6%) | 12 (80.0%) |
| 3 or 4 Children | 0 (0.0%) | 11 (84.6%) |
| 5 or more Children | 0 (0.0%) | 0 (0.0%) |
| Total | 6 (3.3%) | 23 (57.5%) |
Race in Matherville
The most populous races in Matherville are White / Caucasian (763 | 96.1%), Hispanic or Latino (47 | 5.9%), and Two or more Races (17 | 2.1%).
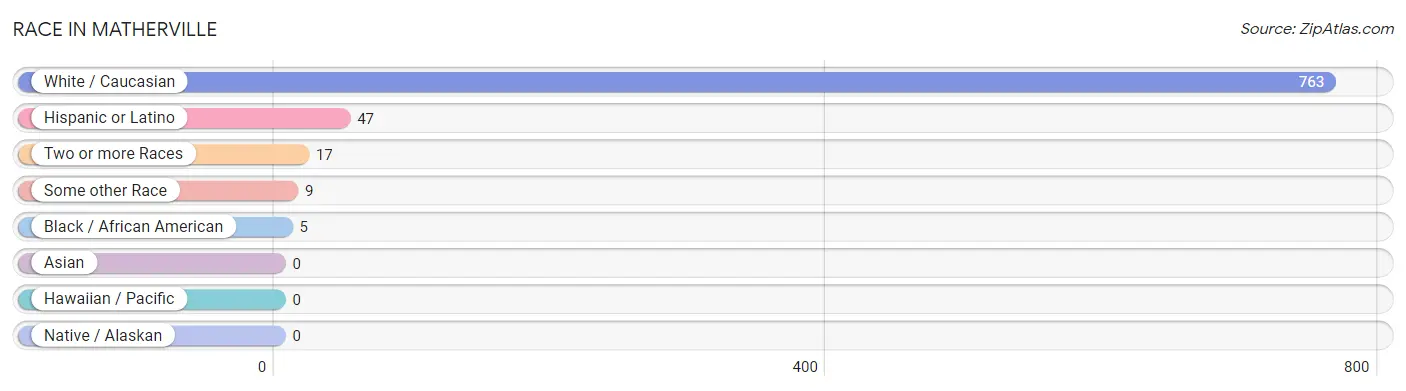
| Race | # Population | % Population |
| Asian | 0 | 0.0% |
| Black / African American | 5 | 0.6% |
| Hawaiian / Pacific | 0 | 0.0% |
| Hispanic or Latino | 47 | 5.9% |
| Native / Alaskan | 0 | 0.0% |
| White / Caucasian | 763 | 96.1% |
| Two or more Races | 17 | 2.1% |
| Some other Race | 9 | 1.1% |
| Total | 794 | 100.0% |
Ancestry in Matherville
The most populous ancestries reported in Matherville are German (145 | 18.3%), Swedish (60 | 7.6%), English (53 | 6.7%), Mexican (46 | 5.8%), and Dutch (42 | 5.3%), together accounting for 43.6% of all Matherville residents.
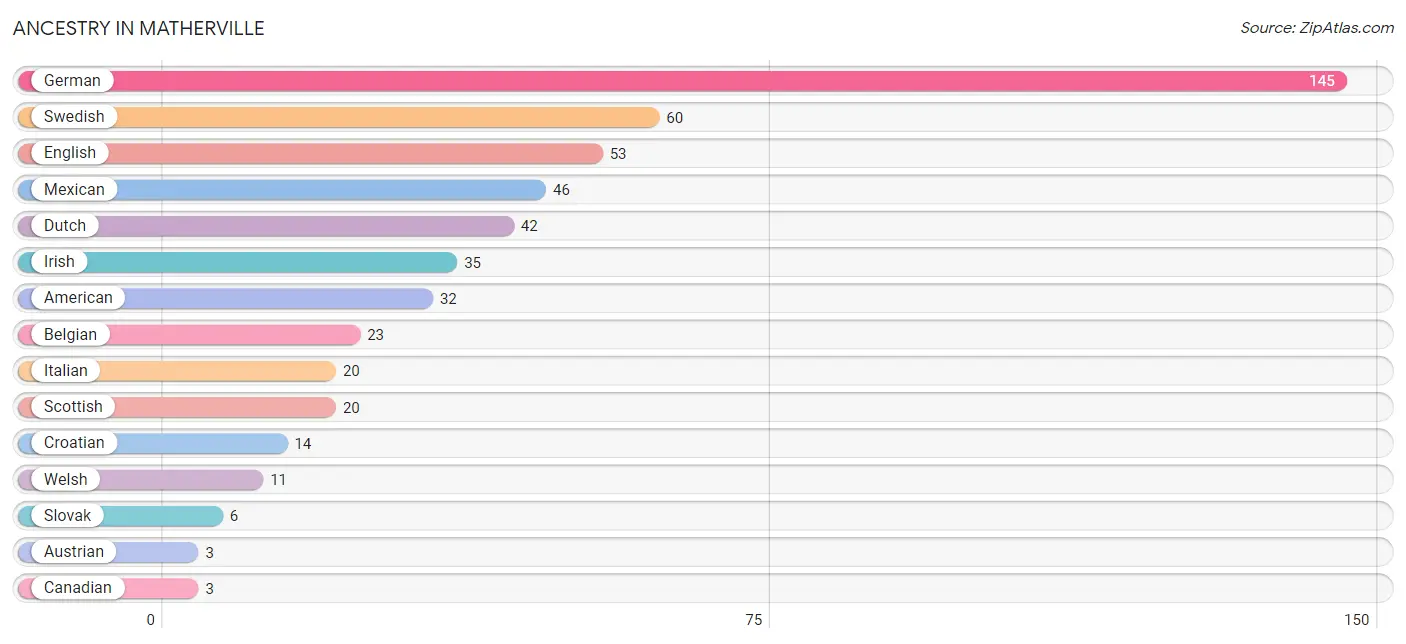
| Ancestry | # Population | % Population |
| American | 32 | 4.0% |
| Austrian | 3 | 0.4% |
| Belgian | 23 | 2.9% |
| Canadian | 3 | 0.4% |
| Croatian | 14 | 1.8% |
| Czech | 1 | 0.1% |
| Danish | 3 | 0.4% |
| Dutch | 42 | 5.3% |
| English | 53 | 6.7% |
| French Canadian | 2 | 0.3% |
| German | 145 | 18.3% |
| Irish | 35 | 4.4% |
| Italian | 20 | 2.5% |
| Mexican | 46 | 5.8% |
| Polish | 3 | 0.4% |
| Scandinavian | 1 | 0.1% |
| Scottish | 20 | 2.5% |
| Slovak | 6 | 0.8% |
| Swedish | 60 | 7.6% |
| Welsh | 11 | 1.4% |
| Yugoslavian | 3 | 0.4% | View All 21 Rows |
Immigrants in Matherville
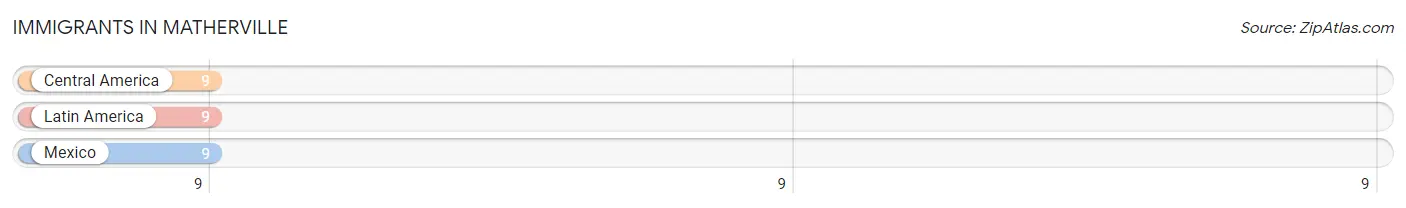
The most numerous immigrant groups reported in Matherville came from Central America (9 | 1.1%), Latin America (9 | 1.1%), and Mexico (9 | 1.1%), together accounting for 3.4% of all Matherville residents.
| Immigration Origin | # Population | % Population |
| Central America | 9 | 1.1% |
| Latin America | 9 | 1.1% |
| Mexico | 9 | 1.1% | View All 3 Rows |
Sex and Age in Matherville
Sex and Age in Matherville
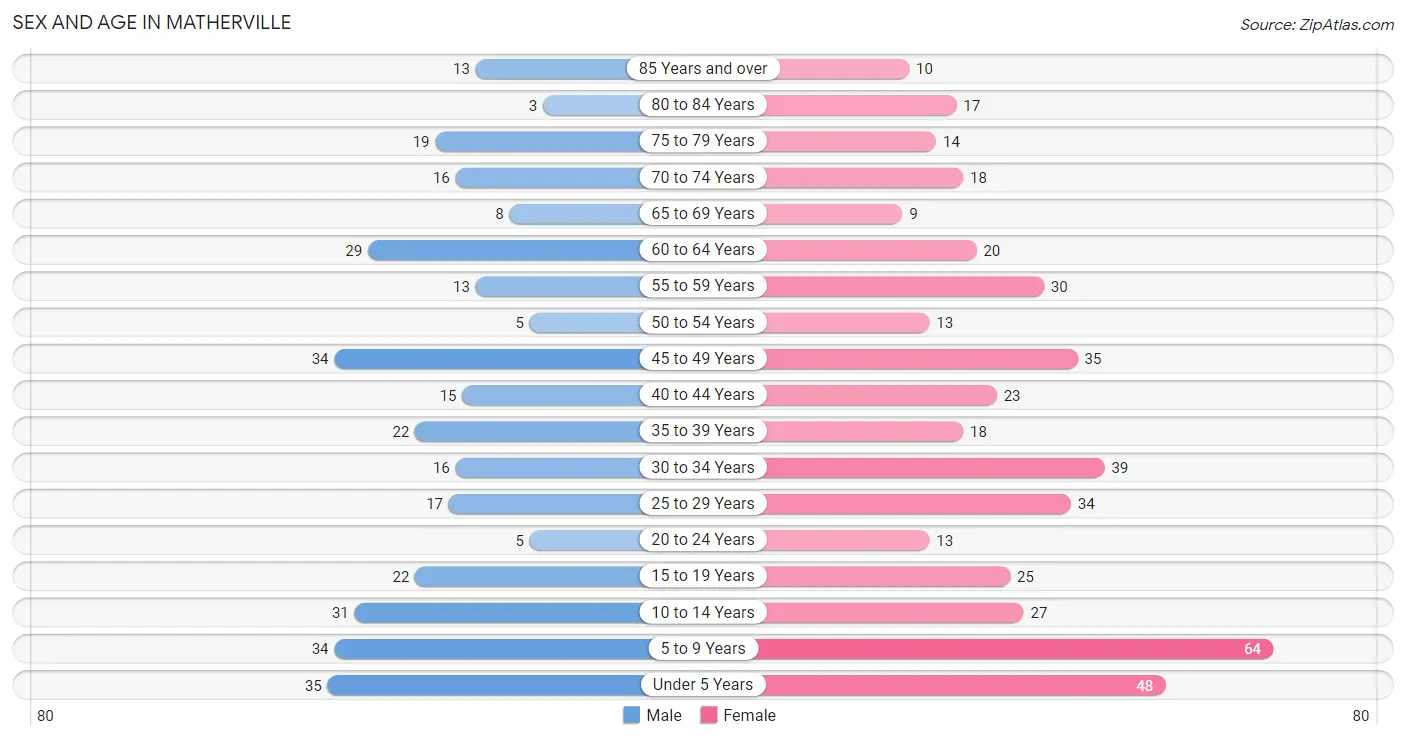
The most populous age groups in Matherville are Under 5 Years (35 | 10.4%) for men and 5 to 9 Years (64 | 14.0%) for women.
| Age Bracket | Male | Female |
| Under 5 Years | 35 (10.4%) | 48 (10.5%) |
| 5 to 9 Years | 34 (10.1%) | 64 (14.0%) |
| 10 to 14 Years | 31 (9.2%) | 27 (5.9%) |
| 15 to 19 Years | 22 (6.5%) | 25 (5.5%) |
| 20 to 24 Years | 5 (1.5%) | 13 (2.8%) |
| 25 to 29 Years | 17 (5.0%) | 34 (7.4%) |
| 30 to 34 Years | 16 (4.8%) | 39 (8.5%) |
| 35 to 39 Years | 22 (6.5%) | 18 (3.9%) |
| 40 to 44 Years | 15 (4.4%) | 23 (5.0%) |
| 45 to 49 Years | 34 (10.1%) | 35 (7.7%) |
| 50 to 54 Years | 5 (1.5%) | 13 (2.8%) |
| 55 to 59 Years | 13 (3.9%) | 30 (6.6%) |
| 60 to 64 Years | 29 (8.6%) | 20 (4.4%) |
| 65 to 69 Years | 8 (2.4%) | 9 (2.0%) |
| 70 to 74 Years | 16 (4.8%) | 18 (3.9%) |
| 75 to 79 Years | 19 (5.6%) | 14 (3.1%) |
| 80 to 84 Years | 3 (0.9%) | 17 (3.7%) |
| 85 Years and over | 13 (3.9%) | 10 (2.2%) |
| Total | 337 (100.0%) | 457 (100.0%) |
Families and Households in Matherville
Median Family Size in Matherville
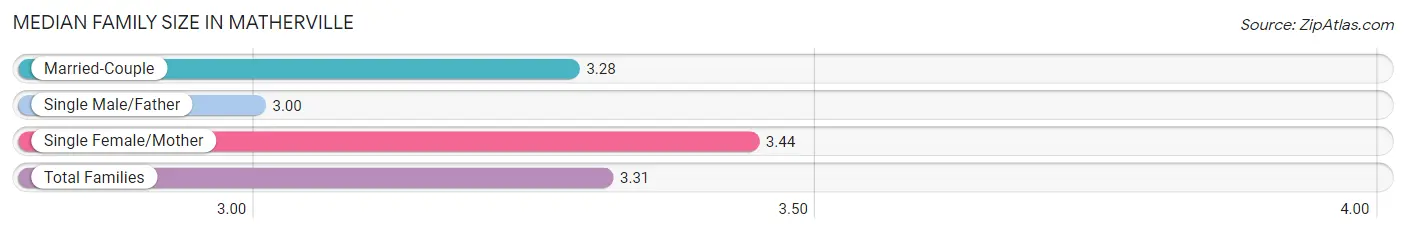
The median family size in Matherville is 3.31 persons per family, with single female/mother families (39 | 17.5%) accounting for the largest median family size of 3.44 persons per family. On the other hand, single male/father families (1 | 0.4%) represent the smallest median family size with 3.00 persons per family.
| Family Type | # Families | Family Size |
| Married-Couple | 183 (82.1%) | 3.28 |
| Single Male/Father | 1 (0.4%) | 3.00 |
| Single Female/Mother | 39 (17.5%) | 3.44 |
| Total Families | 223 (100.0%) | 3.31 |
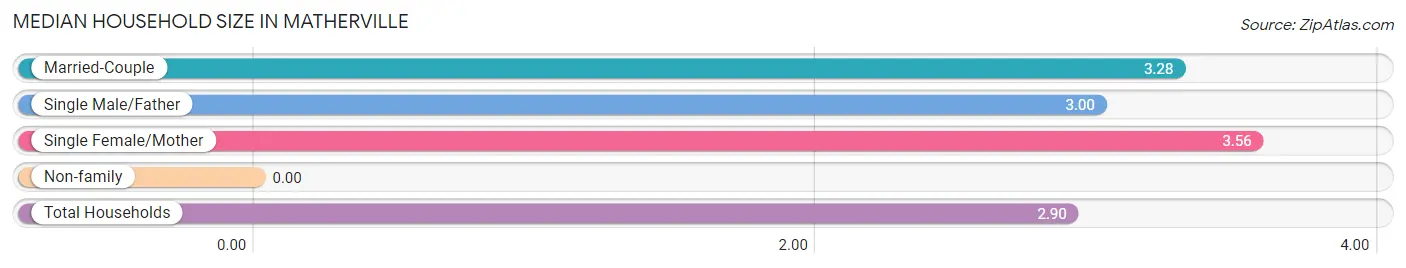
Median Household Size in Matherville
| Household Type | # Households | Household Size |
| Married-Couple | 183 (66.8%) | 3.28 |
| Single Male/Father | 1 (0.4%) | 3.00 |
| Single Female/Mother | 39 (14.2%) | 3.56 |
| Non-family | 51 (18.6%) | - |
| Total Households | 274 (100.0%) | 2.90 |
Household Size by Marriage Status in Matherville
Out of a total of 274 households in Matherville, 223 (81.4%) are family households, while 51 (18.6%) are nonfamily households. The most numerous type of family households are 2-person households, comprising 120, and the most common type of nonfamily households are 1-person households, comprising 51.
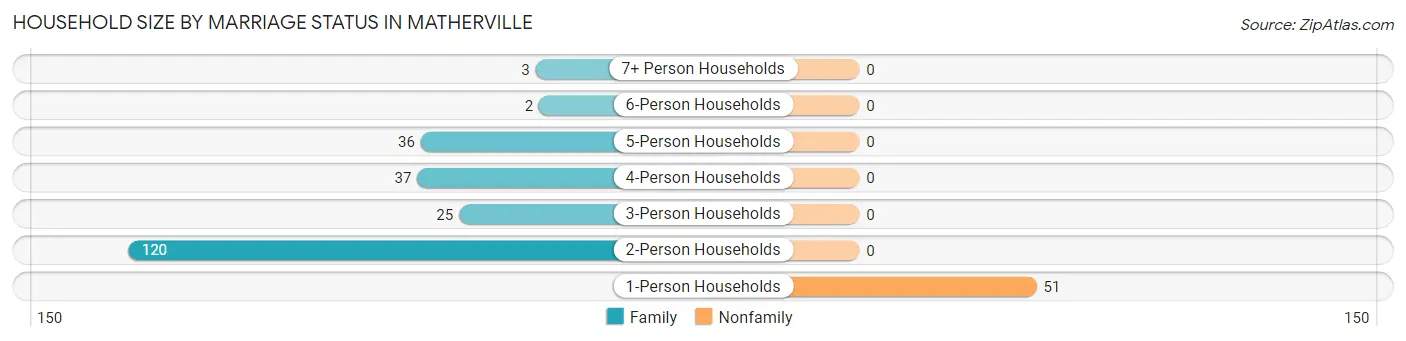
| Household Size | Family Households | Nonfamily Households |
| 1-Person Households | - | 51 (18.6%) |
| 2-Person Households | 120 (43.8%) | 0 (0.0%) |
| 3-Person Households | 25 (9.1%) | 0 (0.0%) |
| 4-Person Households | 37 (13.5%) | 0 (0.0%) |
| 5-Person Households | 36 (13.1%) | 0 (0.0%) |
| 6-Person Households | 2 (0.7%) | 0 (0.0%) |
| 7+ Person Households | 3 (1.1%) | 0 (0.0%) |
| Total | 223 (81.4%) | 51 (18.6%) |
Female Fertility in Matherville
Fertility by Age in Matherville
Average fertility rate in Matherville is 79.0 births per 1,000 women. Women in the age bracket of 20 to 34 years have the highest fertility rate with 116.0 births per 1,000 women. Women in the age bracket of 20 to 34 years acount for 66.7% of all women with births.
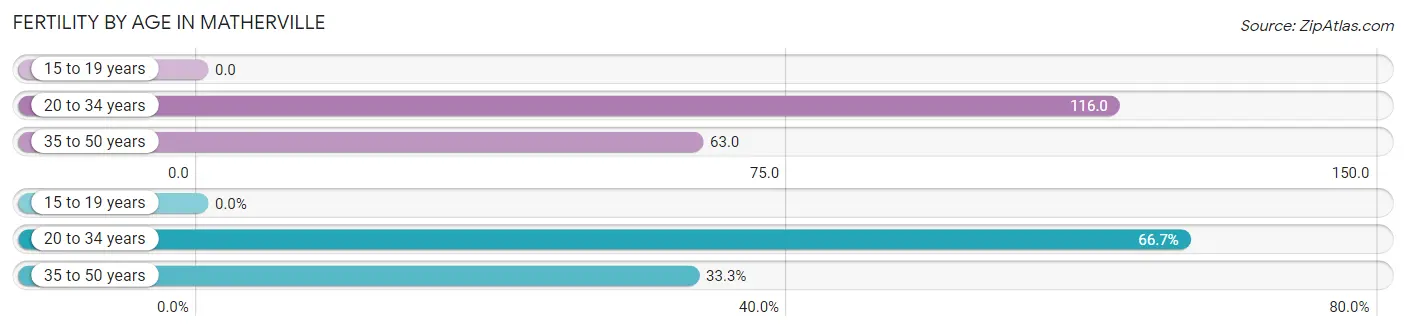
| Age Bracket | Women with Births | Births / 1,000 Women |
| 15 to 19 years | 0 (0.0%) | 0.0 |
| 20 to 34 years | 10 (66.7%) | 116.0 |
| 35 to 50 years | 5 (33.3%) | 63.0 |
| Total | 15 (100.0%) | 79.0 |
Fertility by Age by Marriage Status in Matherville
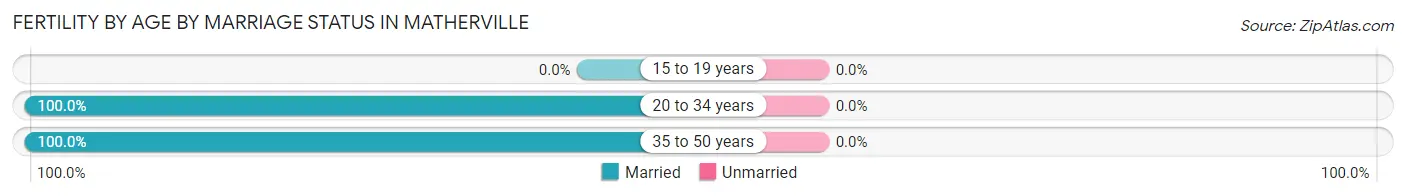
| Age Bracket | Married | Unmarried |
| 15 to 19 years | 0 (0.0%) | 0 (0.0%) |
| 20 to 34 years | 10 (100.0%) | 0 (0.0%) |
| 35 to 50 years | 5 (100.0%) | 0 (0.0%) |
| Total | 15 (100.0%) | 0 (0.0%) |
Fertility by Education in Matherville
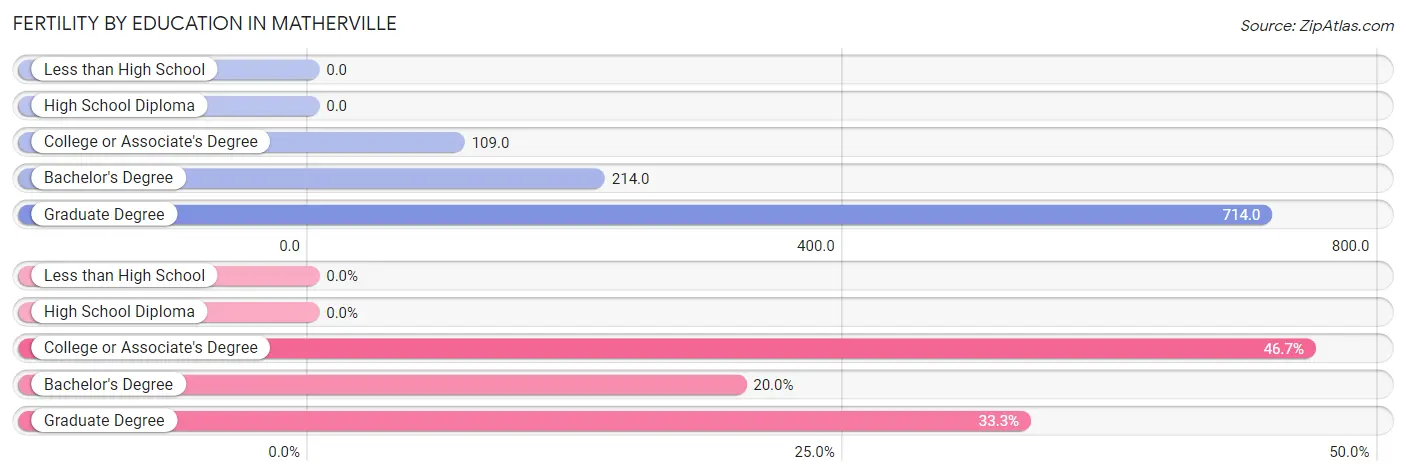
| Educational Attainment | Women with Births | Births / 1,000 Women |
| Less than High School | 0 (0.0%) | 0.0 |
| High School Diploma | 0 (0.0%) | 0.0 |
| College or Associate's Degree | 7 (46.7%) | 109.0 |
| Bachelor's Degree | 3 (20.0%) | 214.0 |
| Graduate Degree | 5 (33.3%) | 714.0 |
| Total | 15 (100.0%) | 79.0 |
Fertility by Education by Marriage Status in Matherville
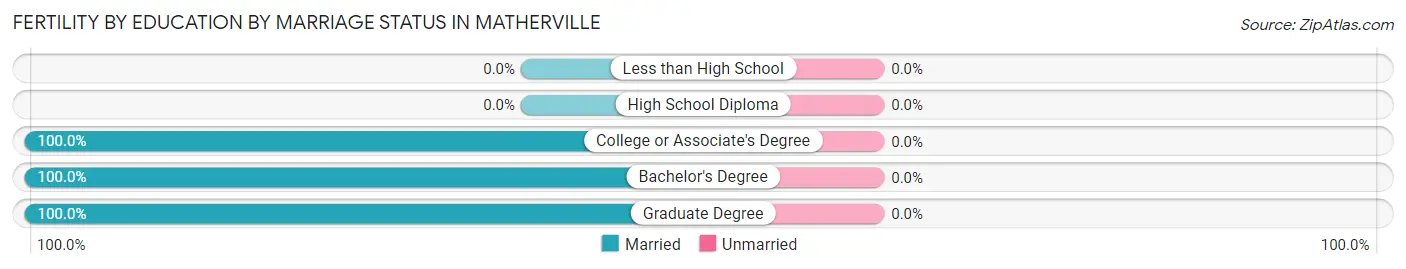
| Educational Attainment | Married | Unmarried |
| Less than High School | 0 (0.0%) | 0 (0.0%) |
| High School Diploma | 0 (0.0%) | 0 (0.0%) |
| College or Associate's Degree | 7 (100.0%) | 0 (0.0%) |
| Bachelor's Degree | 3 (100.0%) | 0 (0.0%) |
| Graduate Degree | 5 (100.0%) | 0 (0.0%) |
| Total | 15 (100.0%) | 0 (0.0%) |
Employment Characteristics in Matherville
Employment by Class of Employer in Matherville
Among the 282 employed individuals in Matherville, private company employees (218 | 77.3%), local government employees (18 | 6.4%), and not-for-profit organizations (17 | 6.0%) make up the most common classes of employment.
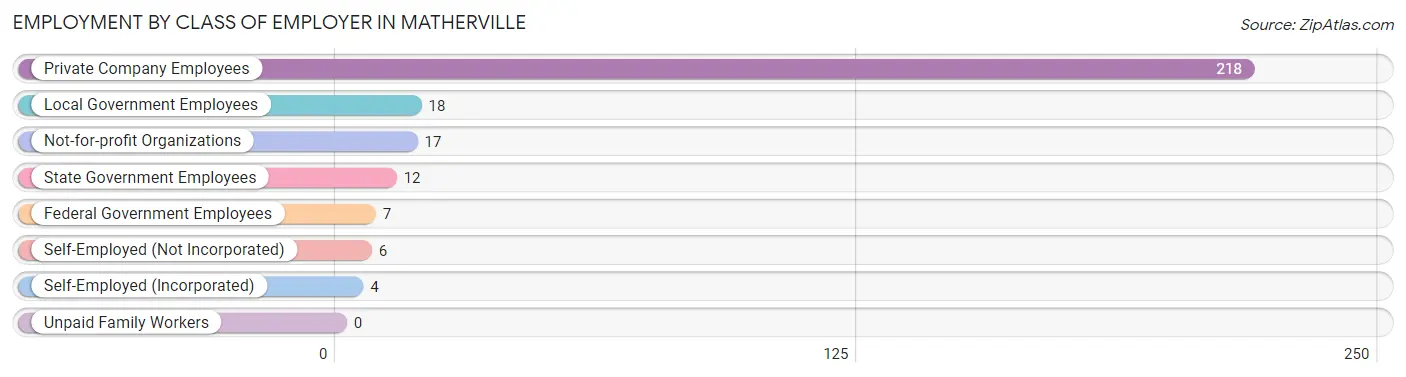
| Employer Class | # Employees | % Employees |
| Private Company Employees | 218 | 77.3% |
| Self-Employed (Incorporated) | 4 | 1.4% |
| Self-Employed (Not Incorporated) | 6 | 2.1% |
| Not-for-profit Organizations | 17 | 6.0% |
| Local Government Employees | 18 | 6.4% |
| State Government Employees | 12 | 4.3% |
| Federal Government Employees | 7 | 2.5% |
| Unpaid Family Workers | 0 | 0.0% |
| Total | 282 | 100.0% |
Employment Status by Age in Matherville
According to the labor force statistics for Matherville, out of the total population over 16 years of age (545), 58.7% or 320 individuals are in the labor force, with 5.9% or 19 of them unemployed. The age group with the highest labor force participation rate is 20 to 24 years, with 100.0% or 18 individuals in the labor force. Within the labor force, the 20 to 24 years age range has the highest percentage of unemployed individuals, with 72.2% or 13 of them being unemployed.
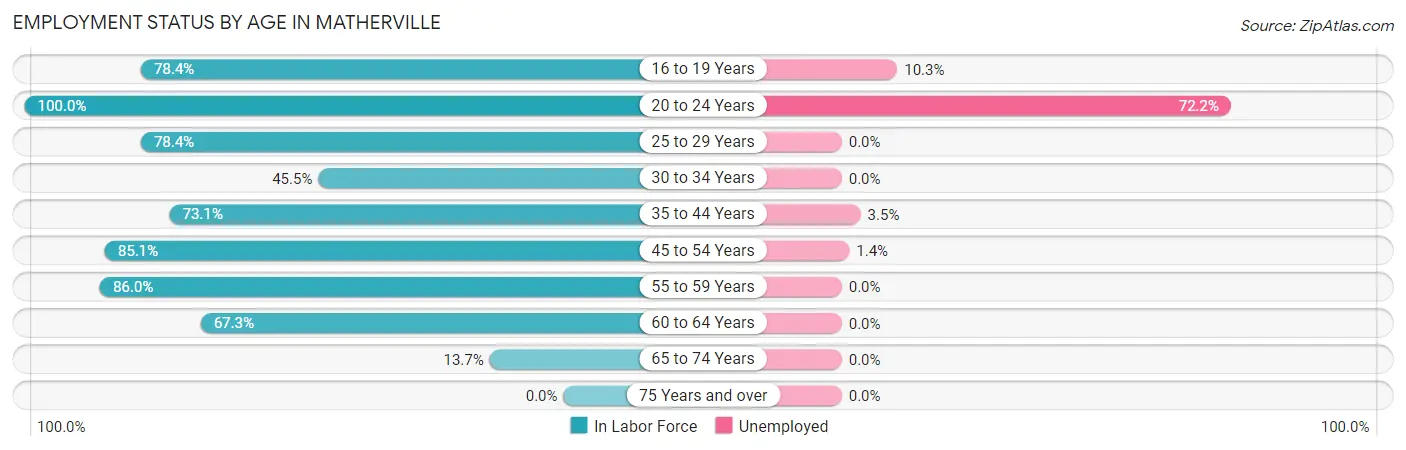
| Age Bracket | In Labor Force | Unemployed |
| 16 to 19 Years | 29 (78.4%) | 3 (10.3%) |
| 20 to 24 Years | 18 (100.0%) | 13 (72.2%) |
| 25 to 29 Years | 40 (78.4%) | 0 (0.0%) |
| 30 to 34 Years | 25 (45.5%) | 0 (0.0%) |
| 35 to 44 Years | 57 (73.1%) | 2 (3.5%) |
| 45 to 54 Years | 74 (85.1%) | 1 (1.4%) |
| 55 to 59 Years | 37 (86.0%) | 0 (0.0%) |
| 60 to 64 Years | 33 (67.3%) | 0 (0.0%) |
| 65 to 74 Years | 7 (13.7%) | 0 (0.0%) |
| 75 Years and over | 0 (0.0%) | 0 (0.0%) |
| Total | 320 (58.7%) | 19 (5.9%) |
Employment Status by Educational Attainment in Matherville
According to labor force statistics for Matherville, 73.3% of individuals (266) out of the total population between 25 and 64 years of age (363) are in the labor force, with 1.1% or 3 of them being unemployed. The group with the highest labor force participation rate are those with the educational attainment of bachelor's degree or higher, with 95.1% or 58 individuals in the labor force. Within the labor force, individuals with college / associate degree education have the highest percentage of unemployment, with 2.5% or 2 of them being unemployed.
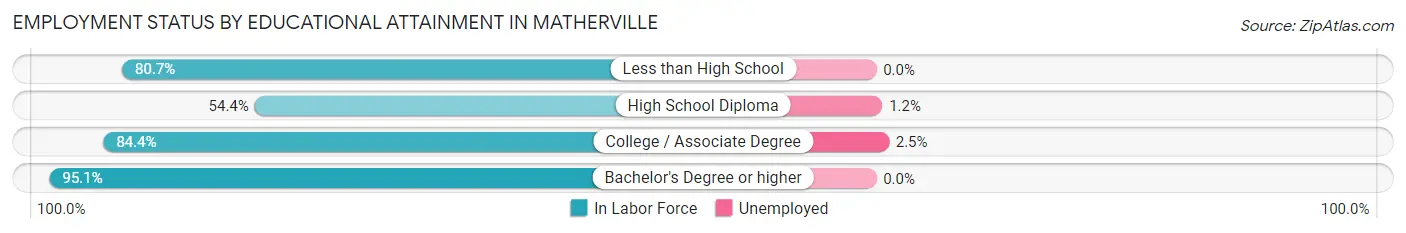
| Educational Attainment | In Labor Force | Unemployed |
| Less than High School | 46 (80.7%) | 0 (0.0%) |
| High School Diploma | 81 (54.4%) | 2 (1.2%) |
| College / Associate Degree | 81 (84.4%) | 2 (2.5%) |
| Bachelor's Degree or higher | 58 (95.1%) | 0 (0.0%) |
| Total | 266 (73.3%) | 4 (1.1%) |
Employment Occupations by Sex in Matherville
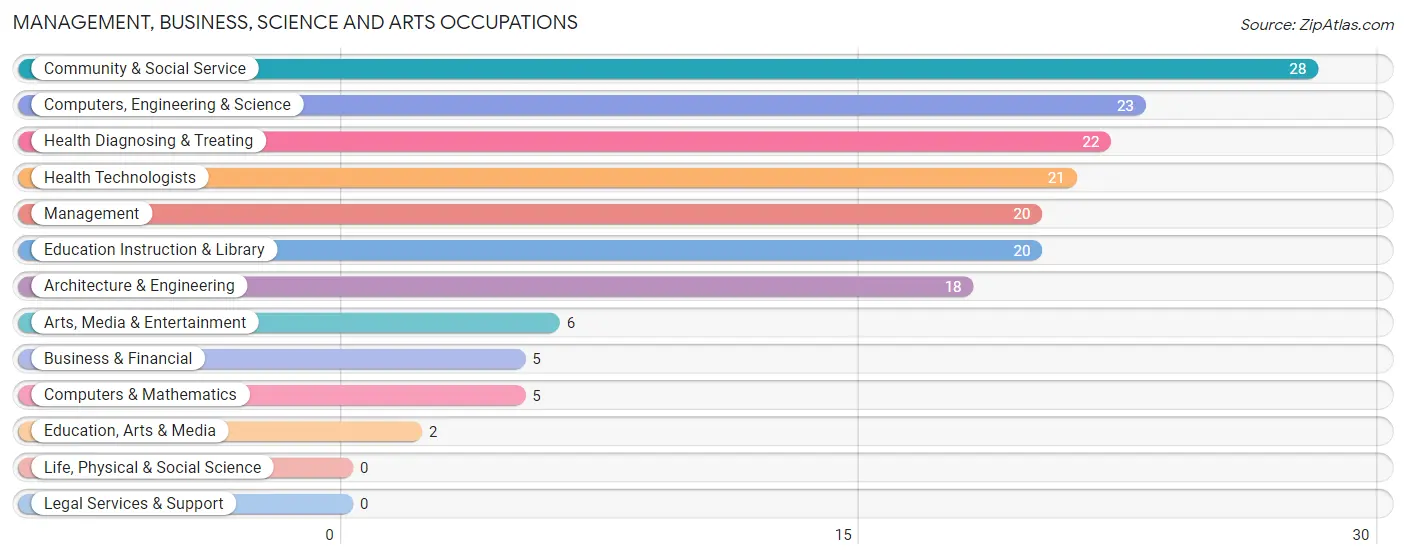
Management, Business, Science and Arts Occupations
The most common Management, Business, Science and Arts occupations in Matherville are Community & Social Service (28 | 9.3%), Computers, Engineering & Science (23 | 7.6%), Health Diagnosing & Treating (22 | 7.3%), Health Technologists (21 | 7.0%), and Management (20 | 6.6%).
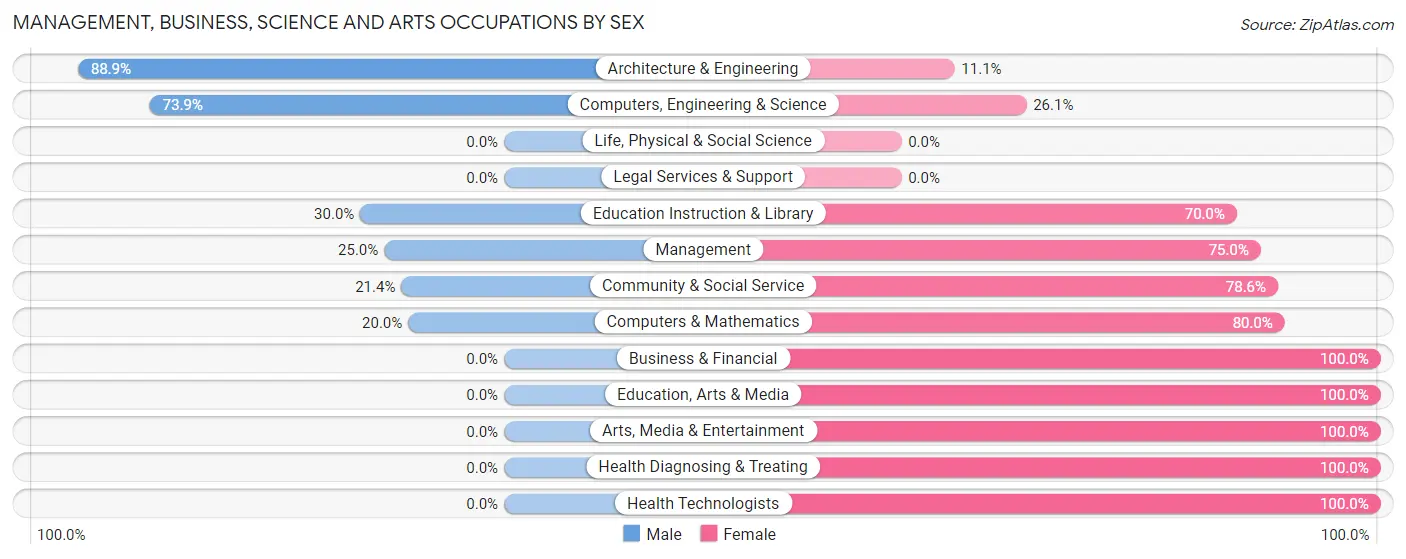
Management, Business, Science and Arts Occupations by Sex
Within the Management, Business, Science and Arts occupations in Matherville, the most male-oriented occupations are Architecture & Engineering (88.9%), Computers, Engineering & Science (73.9%), and Education Instruction & Library (30.0%), while the most female-oriented occupations are Business & Financial (100.0%), Education, Arts & Media (100.0%), and Arts, Media & Entertainment (100.0%).
| Occupation | Male | Female |
| Management | 5 (25.0%) | 15 (75.0%) |
| Business & Financial | 0 (0.0%) | 5 (100.0%) |
| Computers, Engineering & Science | 17 (73.9%) | 6 (26.1%) |
| Computers & Mathematics | 1 (20.0%) | 4 (80.0%) |
| Architecture & Engineering | 16 (88.9%) | 2 (11.1%) |
| Life, Physical & Social Science | 0 (0.0%) | 0 (0.0%) |
| Community & Social Service | 6 (21.4%) | 22 (78.6%) |
| Education, Arts & Media | 0 (0.0%) | 2 (100.0%) |
| Legal Services & Support | 0 (0.0%) | 0 (0.0%) |
| Education Instruction & Library | 6 (30.0%) | 14 (70.0%) |
| Arts, Media & Entertainment | 0 (0.0%) | 6 (100.0%) |
| Health Diagnosing & Treating | 0 (0.0%) | 22 (100.0%) |
| Health Technologists | 0 (0.0%) | 21 (100.0%) |
| Total (Category) | 28 (28.6%) | 70 (71.4%) |
| Total (Overall) | 132 (43.9%) | 169 (56.1%) |
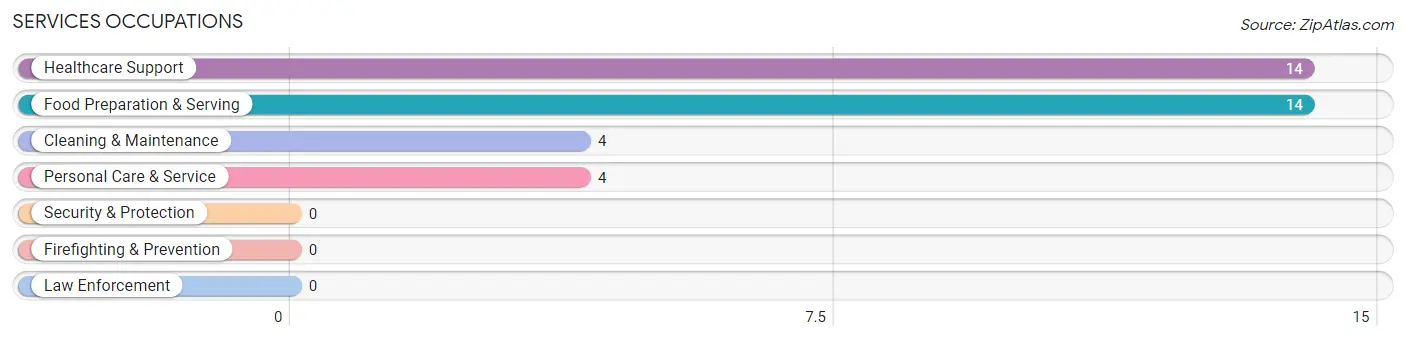
Services Occupations
The most common Services occupations in Matherville are Healthcare Support (14 | 4.6%), Food Preparation & Serving (14 | 4.6%), Cleaning & Maintenance (4 | 1.3%), and Personal Care & Service (4 | 1.3%).
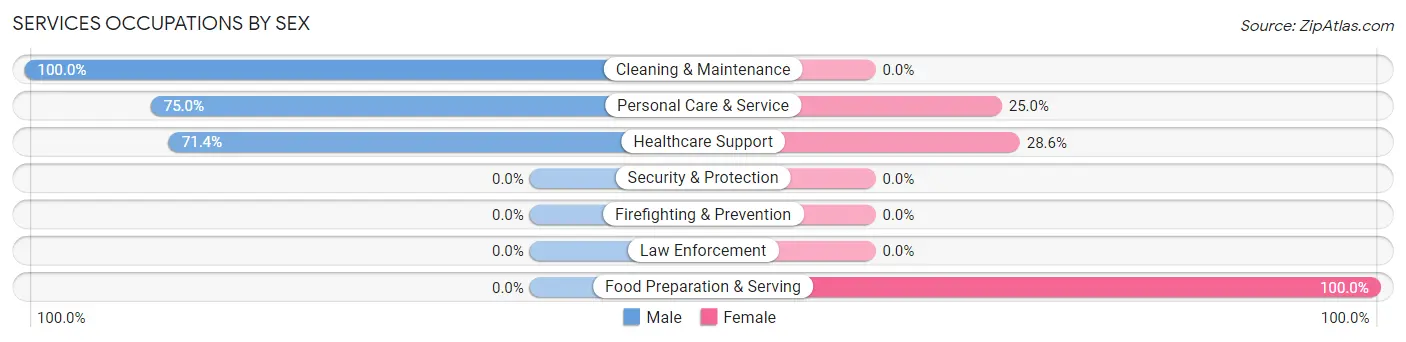
Services Occupations by Sex
Within the Services occupations in Matherville, the most male-oriented occupations are Cleaning & Maintenance (100.0%), Personal Care & Service (75.0%), and Healthcare Support (71.4%), while the most female-oriented occupations are Food Preparation & Serving (100.0%), Healthcare Support (28.6%), and Personal Care & Service (25.0%).
| Occupation | Male | Female |
| Healthcare Support | 10 (71.4%) | 4 (28.6%) |
| Security & Protection | 0 (0.0%) | 0 (0.0%) |
| Firefighting & Prevention | 0 (0.0%) | 0 (0.0%) |
| Law Enforcement | 0 (0.0%) | 0 (0.0%) |
| Food Preparation & Serving | 0 (0.0%) | 14 (100.0%) |
| Cleaning & Maintenance | 4 (100.0%) | 0 (0.0%) |
| Personal Care & Service | 3 (75.0%) | 1 (25.0%) |
| Total (Category) | 17 (47.2%) | 19 (52.8%) |
| Total (Overall) | 132 (43.9%) | 169 (56.1%) |
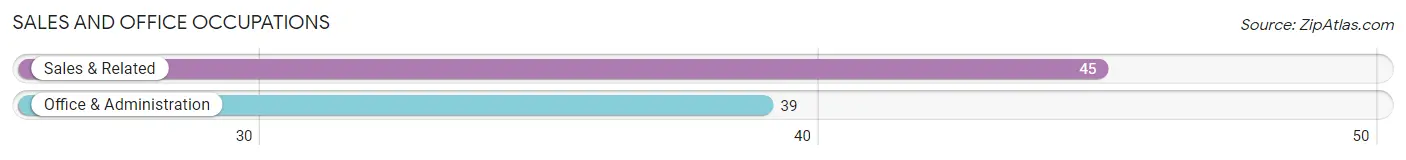
Sales and Office Occupations
The most common Sales and Office occupations in Matherville are Sales & Related (45 | 14.9%), and Office & Administration (39 | 13.0%).
Sales and Office Occupations by Sex
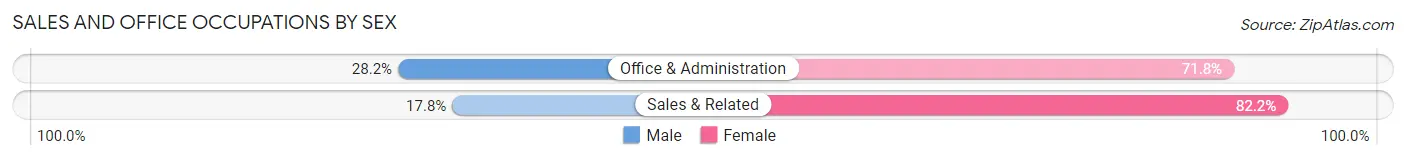
| Occupation | Male | Female |
| Sales & Related | 8 (17.8%) | 37 (82.2%) |
| Office & Administration | 11 (28.2%) | 28 (71.8%) |
| Total (Category) | 19 (22.6%) | 65 (77.4%) |
| Total (Overall) | 132 (43.9%) | 169 (56.1%) |
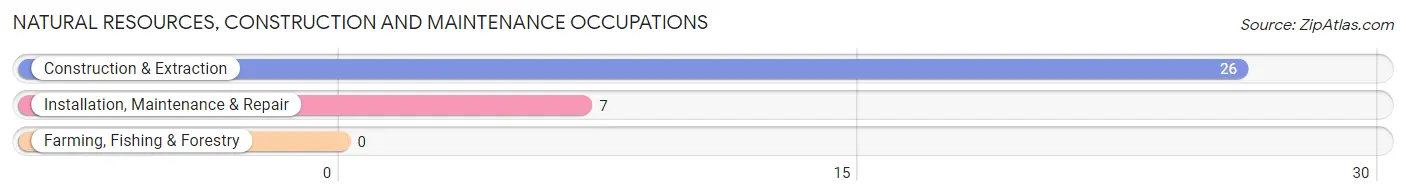
Natural Resources, Construction and Maintenance Occupations
The most common Natural Resources, Construction and Maintenance occupations in Matherville are Construction & Extraction (26 | 8.6%), and Installation, Maintenance & Repair (7 | 2.3%).
Natural Resources, Construction and Maintenance Occupations by Sex
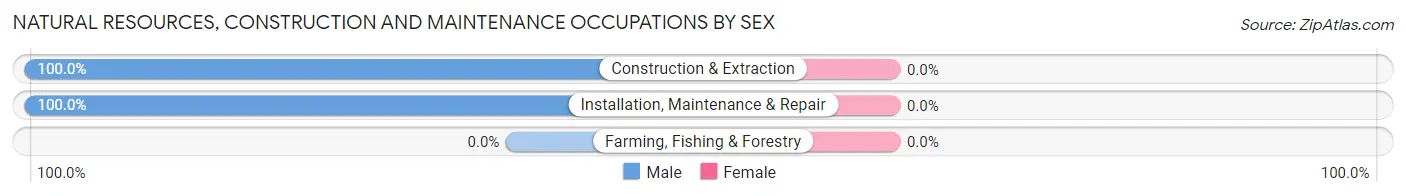
| Occupation | Male | Female |
| Farming, Fishing & Forestry | 0 (0.0%) | 0 (0.0%) |
| Construction & Extraction | 26 (100.0%) | 0 (0.0%) |
| Installation, Maintenance & Repair | 7 (100.0%) | 0 (0.0%) |
| Total (Category) | 33 (100.0%) | 0 (0.0%) |
| Total (Overall) | 132 (43.9%) | 169 (56.1%) |
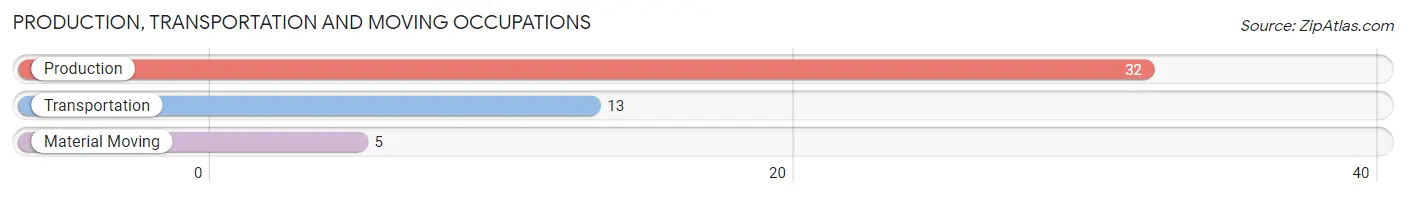
Production, Transportation and Moving Occupations
The most common Production, Transportation and Moving occupations in Matherville are Production (32 | 10.6%), Transportation (13 | 4.3%), and Material Moving (5 | 1.7%).
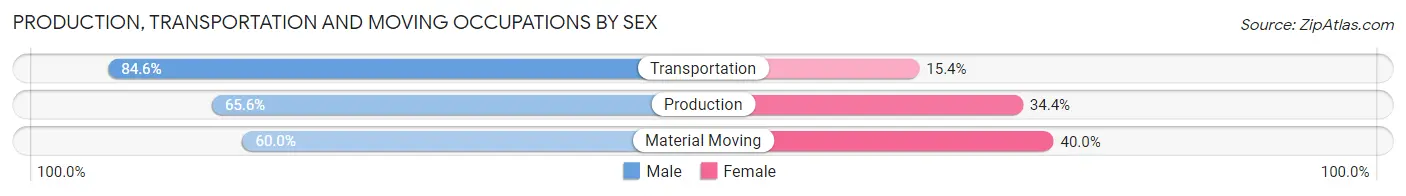
Production, Transportation and Moving Occupations by Sex
| Occupation | Male | Female |
| Production | 21 (65.6%) | 11 (34.4%) |
| Transportation | 11 (84.6%) | 2 (15.4%) |
| Material Moving | 3 (60.0%) | 2 (40.0%) |
| Total (Category) | 35 (70.0%) | 15 (30.0%) |
| Total (Overall) | 132 (43.9%) | 169 (56.1%) |
Employment Industries by Sex in Matherville
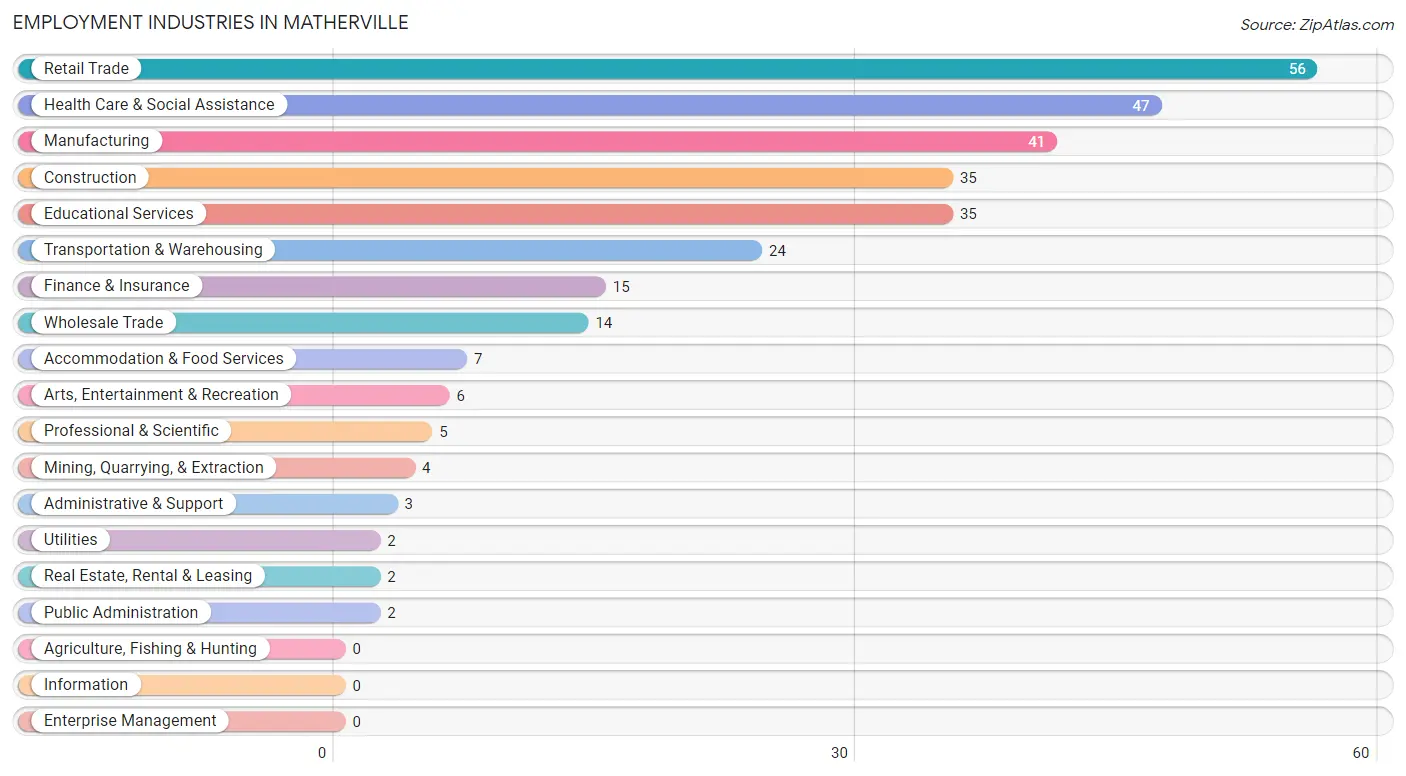
Employment Industries in Matherville
The major employment industries in Matherville include Retail Trade (56 | 18.6%), Health Care & Social Assistance (47 | 15.6%), Manufacturing (41 | 13.6%), Construction (35 | 11.6%), and Educational Services (35 | 11.6%).
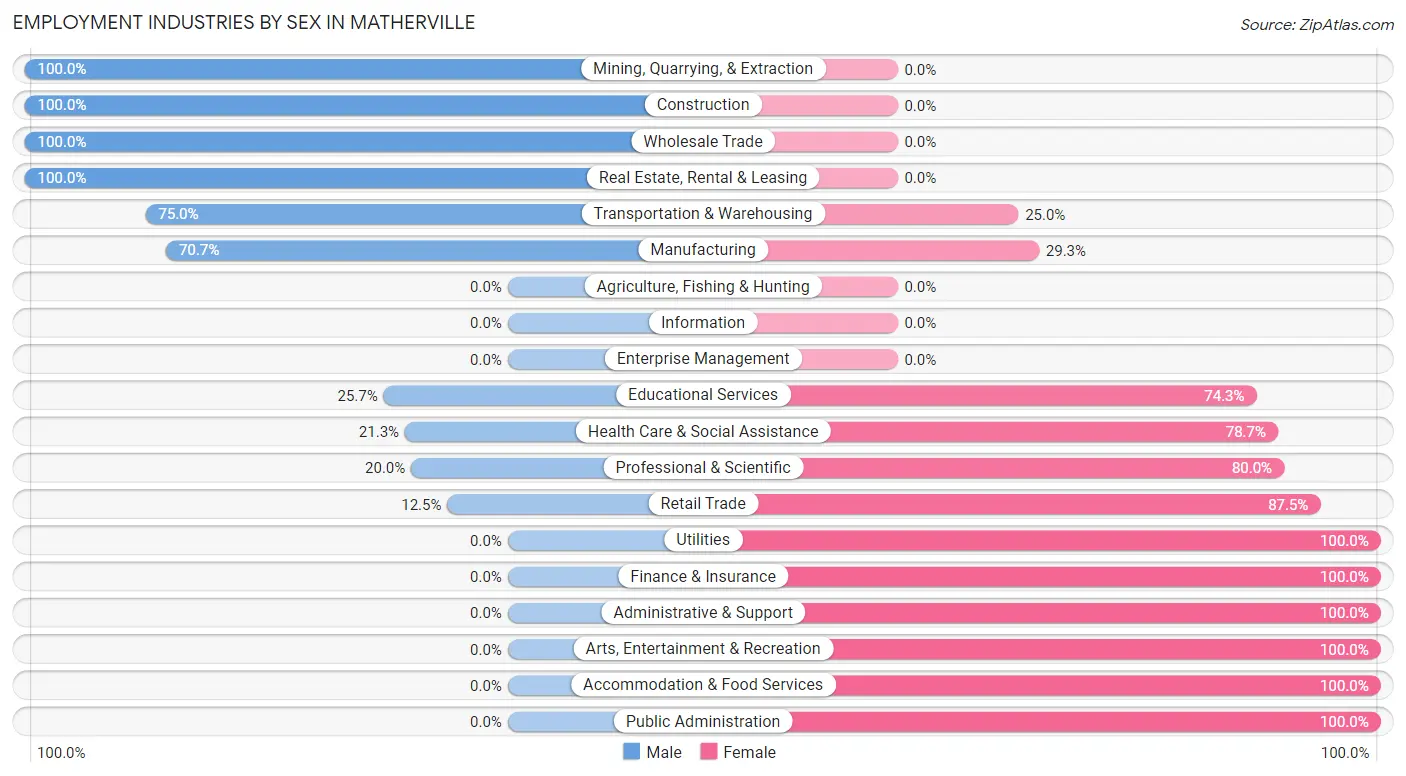
Employment Industries by Sex in Matherville
The Matherville industries that see more men than women are Mining, Quarrying, & Extraction (100.0%), Construction (100.0%), and Wholesale Trade (100.0%), whereas the industries that tend to have a higher number of women are Utilities (100.0%), Finance & Insurance (100.0%), and Administrative & Support (100.0%).
| Industry | Male | Female |
| Agriculture, Fishing & Hunting | 0 (0.0%) | 0 (0.0%) |
| Mining, Quarrying, & Extraction | 4 (100.0%) | 0 (0.0%) |
| Construction | 35 (100.0%) | 0 (0.0%) |
| Manufacturing | 29 (70.7%) | 12 (29.3%) |
| Wholesale Trade | 14 (100.0%) | 0 (0.0%) |
| Retail Trade | 7 (12.5%) | 49 (87.5%) |
| Transportation & Warehousing | 18 (75.0%) | 6 (25.0%) |
| Utilities | 0 (0.0%) | 2 (100.0%) |
| Information | 0 (0.0%) | 0 (0.0%) |
| Finance & Insurance | 0 (0.0%) | 15 (100.0%) |
| Real Estate, Rental & Leasing | 2 (100.0%) | 0 (0.0%) |
| Professional & Scientific | 1 (20.0%) | 4 (80.0%) |
| Enterprise Management | 0 (0.0%) | 0 (0.0%) |
| Administrative & Support | 0 (0.0%) | 3 (100.0%) |
| Educational Services | 9 (25.7%) | 26 (74.3%) |
| Health Care & Social Assistance | 10 (21.3%) | 37 (78.7%) |
| Arts, Entertainment & Recreation | 0 (0.0%) | 6 (100.0%) |
| Accommodation & Food Services | 0 (0.0%) | 7 (100.0%) |
| Public Administration | 0 (0.0%) | 2 (100.0%) |
| Total | 132 (43.9%) | 169 (56.1%) |
Education in Matherville
School Enrollment in Matherville
The most common levels of schooling among the 220 students in Matherville are elementary school (66 | 30.0%), middle school (51 | 23.2%), and nursery / preschool (41 | 18.6%).
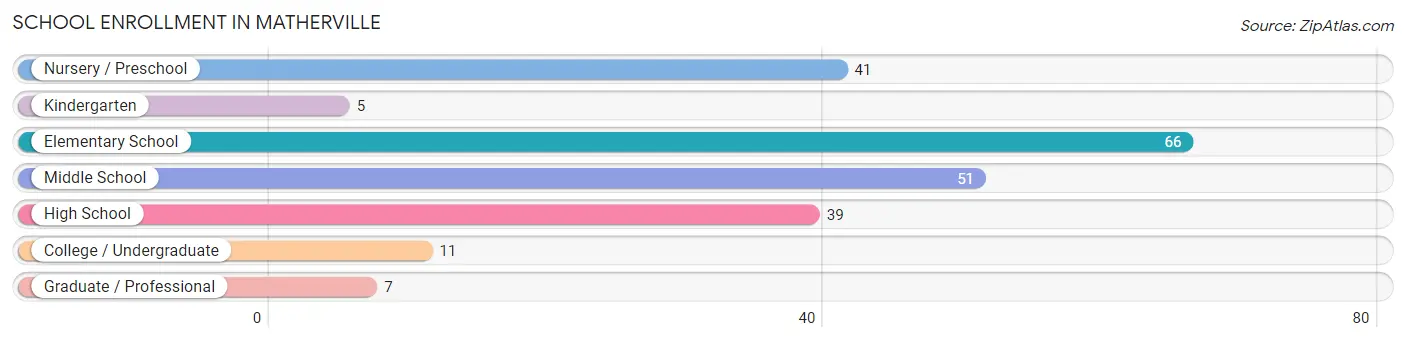
| School Level | # Students | % Students |
| Nursery / Preschool | 41 | 18.6% |
| Kindergarten | 5 | 2.3% |
| Elementary School | 66 | 30.0% |
| Middle School | 51 | 23.2% |
| High School | 39 | 17.7% |
| College / Undergraduate | 11 | 5.0% |
| Graduate / Professional | 7 | 3.2% |
| Total | 220 | 100.0% |
School Enrollment by Age by Funding Source in Matherville
Out of a total of 220 students who are enrolled in schools in Matherville, 32 (14.5%) attend a private institution, while the remaining 188 (85.5%) are enrolled in public schools. The age group of 20 to 24 year olds has the highest likelihood of being enrolled in private schools, with 5 (100.0% in the age bracket) enrolled. Conversely, the age group of 3 to 4 year olds has the lowest likelihood of being enrolled in a private school, with 21 (100.0% in the age bracket) attending a public institution.
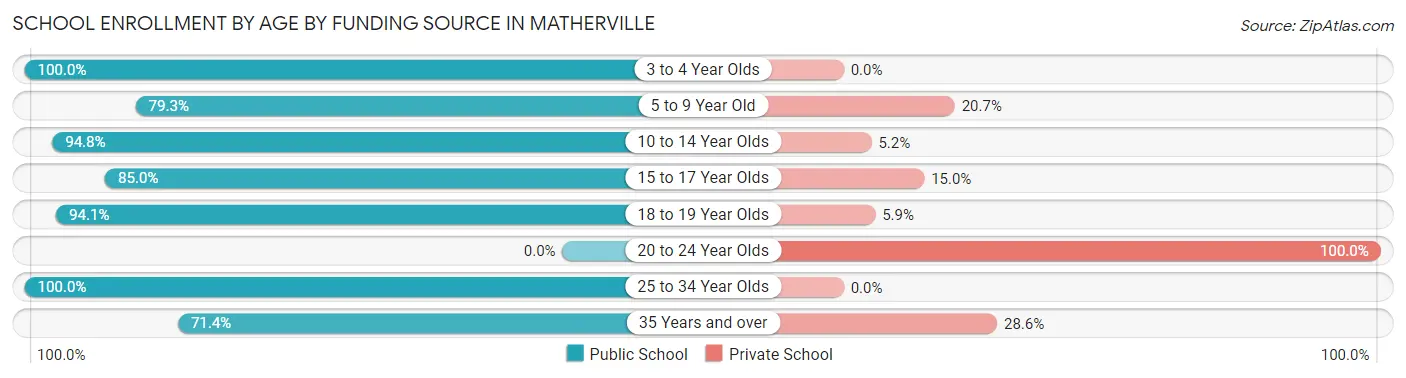
| Age Bracket | Public School | Private School |
| 3 to 4 Year Olds | 21 (100.0%) | 0 (0.0%) |
| 5 to 9 Year Old | 69 (79.3%) | 18 (20.7%) |
| 10 to 14 Year Olds | 55 (94.8%) | 3 (5.2%) |
| 15 to 17 Year Olds | 17 (85.0%) | 3 (15.0%) |
| 18 to 19 Year Olds | 16 (94.1%) | 1 (5.9%) |
| 20 to 24 Year Olds | 0 (0.0%) | 5 (100.0%) |
| 25 to 34 Year Olds | 5 (100.0%) | 0 (0.0%) |
| 35 Years and over | 5 (71.4%) | 2 (28.6%) |
| Total | 188 (85.5%) | 32 (14.5%) |
Educational Attainment by Field of Study in Matherville
Engineering (28 | 28.9%), education (26 | 26.8%), science & technology (21 | 21.6%), business (10 | 10.3%), and communications (10 | 10.3%) are the most common fields of study among 97 individuals in Matherville who have obtained a bachelor's degree or higher.
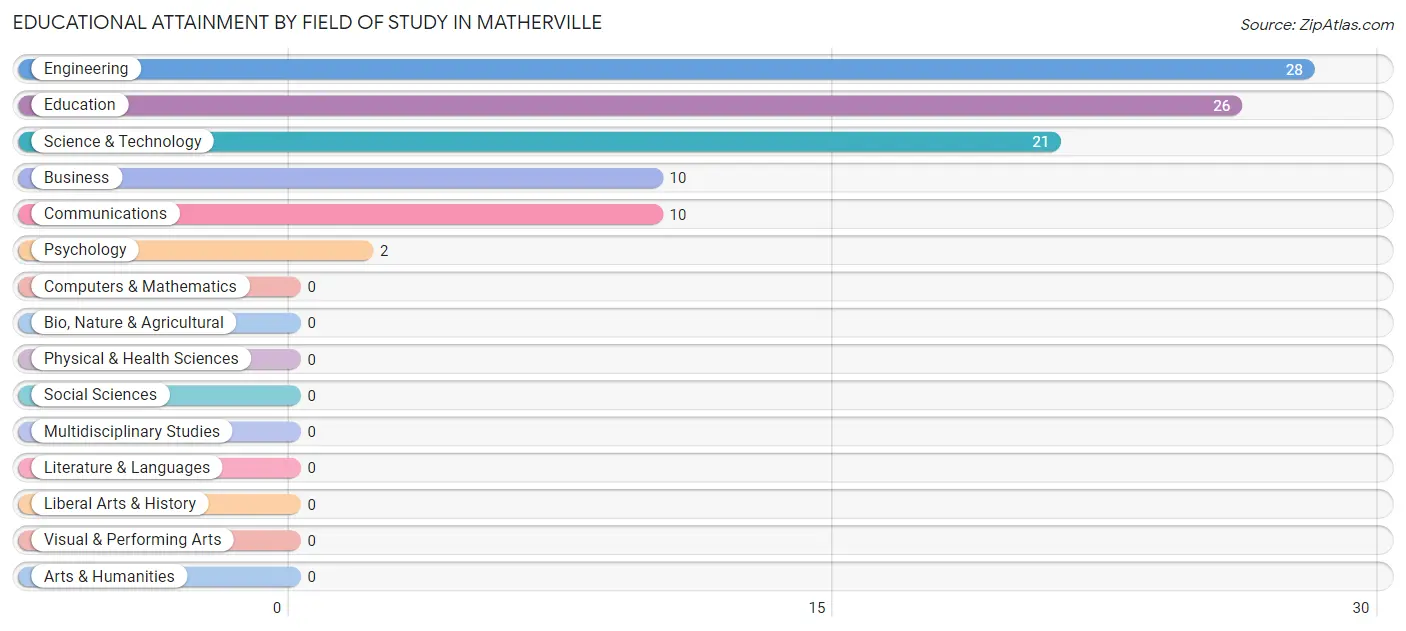
| Field of Study | # Graduates | % Graduates |
| Computers & Mathematics | 0 | 0.0% |
| Bio, Nature & Agricultural | 0 | 0.0% |
| Physical & Health Sciences | 0 | 0.0% |
| Psychology | 2 | 2.1% |
| Social Sciences | 0 | 0.0% |
| Engineering | 28 | 28.9% |
| Multidisciplinary Studies | 0 | 0.0% |
| Science & Technology | 21 | 21.6% |
| Business | 10 | 10.3% |
| Education | 26 | 26.8% |
| Literature & Languages | 0 | 0.0% |
| Liberal Arts & History | 0 | 0.0% |
| Visual & Performing Arts | 0 | 0.0% |
| Communications | 10 | 10.3% |
| Arts & Humanities | 0 | 0.0% |
| Total | 97 | 100.0% |
Transportation & Commute in Matherville
Vehicle Availability by Sex in Matherville
The most prevalent vehicle ownership categories in Matherville are males with 2 vehicles (85, accounting for 64.4%) and females with 2 vehicles (68, making up 56.7%).
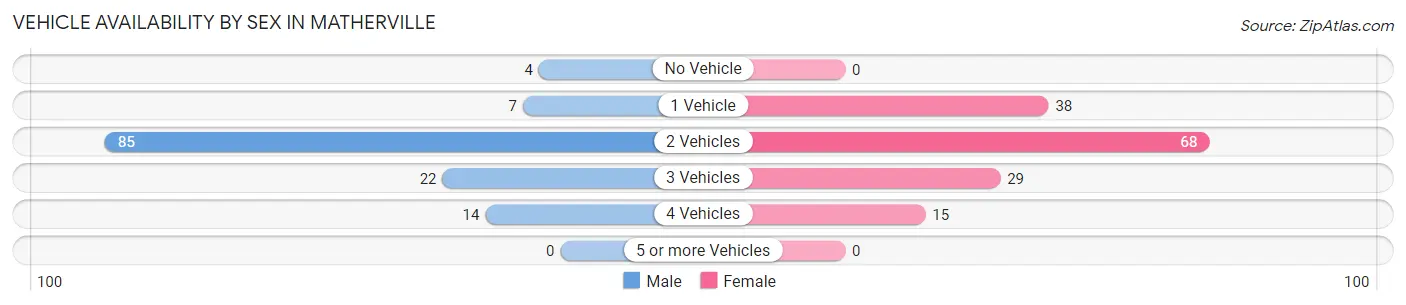
| Vehicles Available | Male | Female |
| No Vehicle | 4 (3.0%) | 0 (0.0%) |
| 1 Vehicle | 7 (5.3%) | 38 (25.3%) |
| 2 Vehicles | 85 (64.4%) | 68 (45.3%) |
| 3 Vehicles | 22 (16.7%) | 29 (19.3%) |
| 4 Vehicles | 14 (10.6%) | 15 (10.0%) |
| 5 or more Vehicles | 0 (0.0%) | 0 (0.0%) |
| Total | 132 (100.0%) | 150 (100.0%) |
Commute Time in Matherville
The most frequently occuring commute durations in Matherville are 20 to 24 minutes (71 commuters, 27.3%), 30 to 34 minutes (37 commuters, 14.2%), and 25 to 29 minutes (35 commuters, 13.5%).
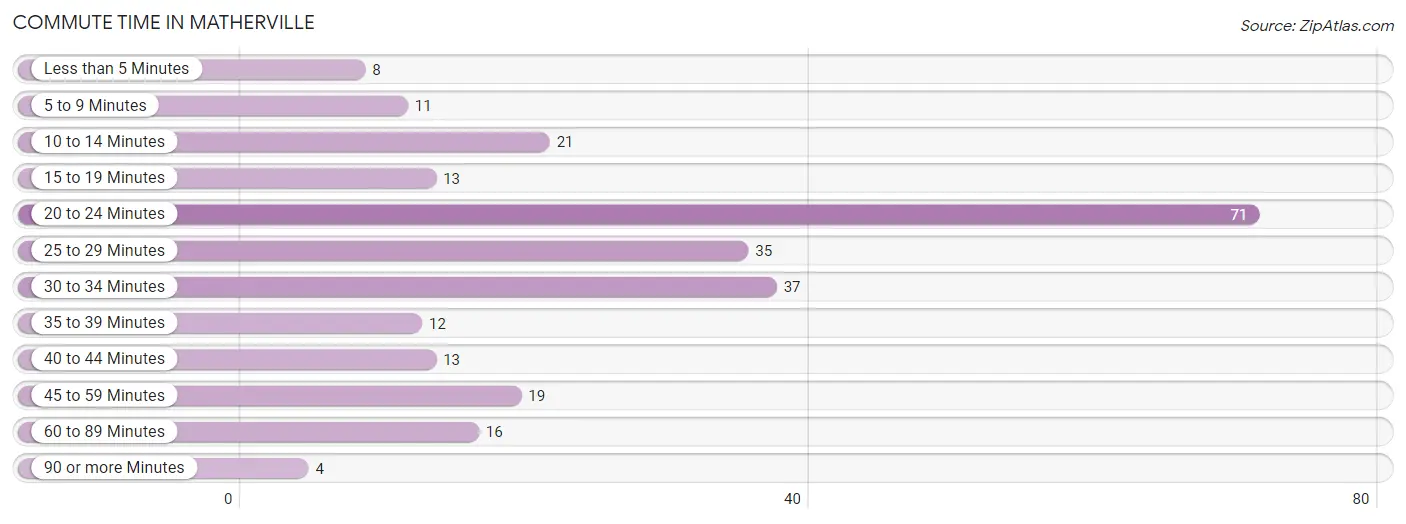
| Commute Time | # Commuters | % Commuters |
| Less than 5 Minutes | 8 | 3.1% |
| 5 to 9 Minutes | 11 | 4.2% |
| 10 to 14 Minutes | 21 | 8.1% |
| 15 to 19 Minutes | 13 | 5.0% |
| 20 to 24 Minutes | 71 | 27.3% |
| 25 to 29 Minutes | 35 | 13.5% |
| 30 to 34 Minutes | 37 | 14.2% |
| 35 to 39 Minutes | 12 | 4.6% |
| 40 to 44 Minutes | 13 | 5.0% |
| 45 to 59 Minutes | 19 | 7.3% |
| 60 to 89 Minutes | 16 | 6.1% |
| 90 or more Minutes | 4 | 1.5% |
Commute Time by Sex in Matherville
The most common commute times in Matherville are 30 to 34 minutes (24 commuters, 18.6%) for males and 20 to 24 minutes (52 commuters, 39.7%) for females.
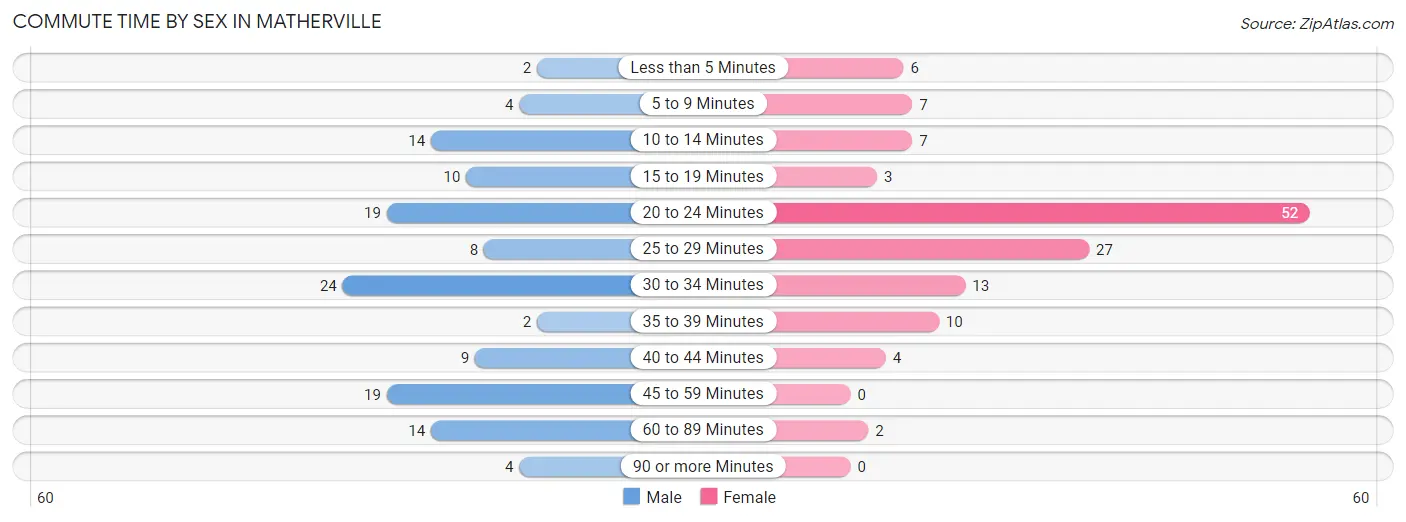
| Commute Time | Male | Female |
| Less than 5 Minutes | 2 (1.5%) | 6 (4.6%) |
| 5 to 9 Minutes | 4 (3.1%) | 7 (5.3%) |
| 10 to 14 Minutes | 14 (10.8%) | 7 (5.3%) |
| 15 to 19 Minutes | 10 (7.7%) | 3 (2.3%) |
| 20 to 24 Minutes | 19 (14.7%) | 52 (39.7%) |
| 25 to 29 Minutes | 8 (6.2%) | 27 (20.6%) |
| 30 to 34 Minutes | 24 (18.6%) | 13 (9.9%) |
| 35 to 39 Minutes | 2 (1.5%) | 10 (7.6%) |
| 40 to 44 Minutes | 9 (7.0%) | 4 (3.0%) |
| 45 to 59 Minutes | 19 (14.7%) | 0 (0.0%) |
| 60 to 89 Minutes | 14 (10.8%) | 2 (1.5%) |
| 90 or more Minutes | 4 (3.1%) | 0 (0.0%) |
Time of Departure to Work by Sex in Matherville
The most frequent times of departure to work in Matherville are 6:00 AM to 6:29 AM (37, 28.7%) for males and 5:30 AM to 5:59 AM (37, 28.2%) for females.
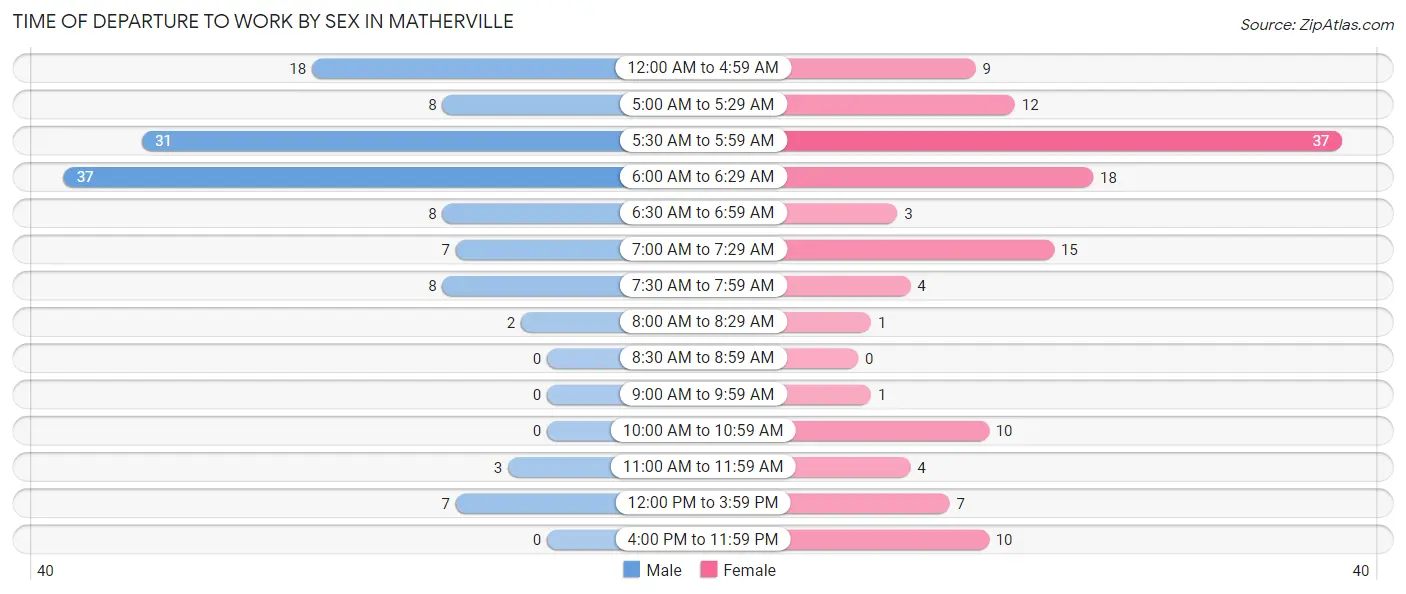
| Time of Departure | Male | Female |
| 12:00 AM to 4:59 AM | 18 (14.0%) | 9 (6.9%) |
| 5:00 AM to 5:29 AM | 8 (6.2%) | 12 (9.2%) |
| 5:30 AM to 5:59 AM | 31 (24.0%) | 37 (28.2%) |
| 6:00 AM to 6:29 AM | 37 (28.7%) | 18 (13.7%) |
| 6:30 AM to 6:59 AM | 8 (6.2%) | 3 (2.3%) |
| 7:00 AM to 7:29 AM | 7 (5.4%) | 15 (11.5%) |
| 7:30 AM to 7:59 AM | 8 (6.2%) | 4 (3.0%) |
| 8:00 AM to 8:29 AM | 2 (1.5%) | 1 (0.8%) |
| 8:30 AM to 8:59 AM | 0 (0.0%) | 0 (0.0%) |
| 9:00 AM to 9:59 AM | 0 (0.0%) | 1 (0.8%) |
| 10:00 AM to 10:59 AM | 0 (0.0%) | 10 (7.6%) |
| 11:00 AM to 11:59 AM | 3 (2.3%) | 4 (3.0%) |
| 12:00 PM to 3:59 PM | 7 (5.4%) | 7 (5.3%) |
| 4:00 PM to 11:59 PM | 0 (0.0%) | 10 (7.6%) |
| Total | 129 (100.0%) | 131 (100.0%) |
Housing Occupancy in Matherville
Occupancy by Ownership in Matherville
Of the total 274 dwellings in Matherville, owner-occupied units account for 203 (74.1%), while renter-occupied units make up 71 (25.9%).
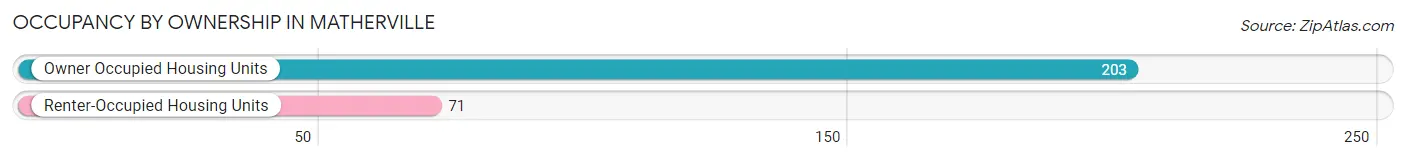
| Occupancy | # Housing Units | % Housing Units |
| Owner Occupied Housing Units | 203 | 74.1% |
| Renter-Occupied Housing Units | 71 | 25.9% |
| Total Occupied Housing Units | 274 | 100.0% |
Occupancy by Household Size in Matherville
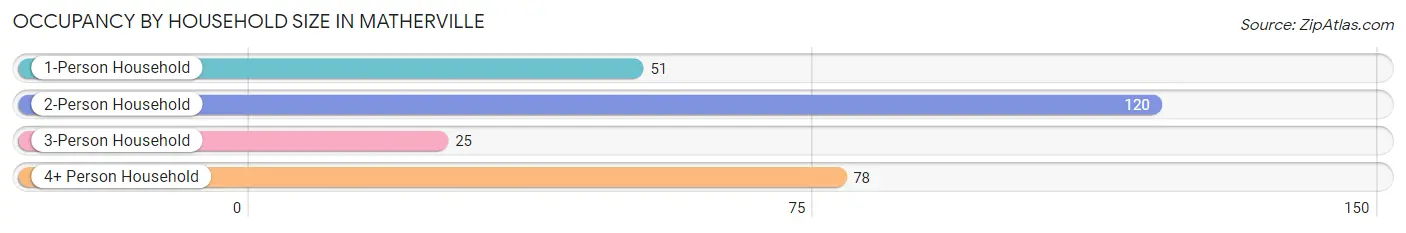
| Household Size | # Housing Units | % Housing Units |
| 1-Person Household | 51 | 18.6% |
| 2-Person Household | 120 | 43.8% |
| 3-Person Household | 25 | 9.1% |
| 4+ Person Household | 78 | 28.5% |
| Total Housing Units | 274 | 100.0% |
Occupancy by Ownership by Household Size in Matherville
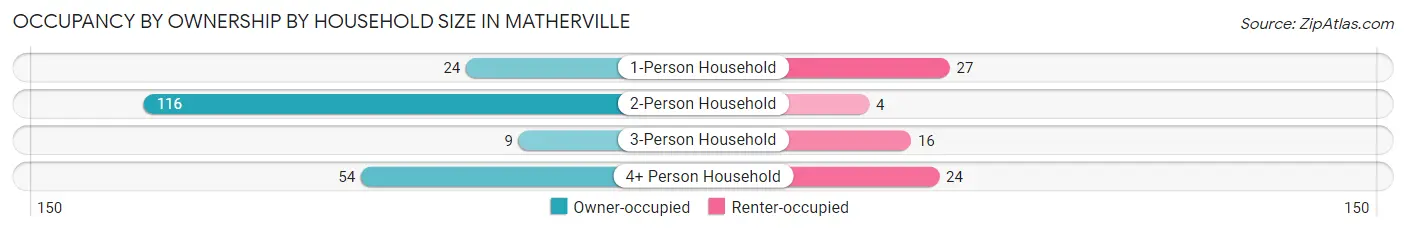
| Household Size | Owner-occupied | Renter-occupied |
| 1-Person Household | 24 (47.1%) | 27 (52.9%) |
| 2-Person Household | 116 (96.7%) | 4 (3.3%) |
| 3-Person Household | 9 (36.0%) | 16 (64.0%) |
| 4+ Person Household | 54 (69.2%) | 24 (30.8%) |
| Total Housing Units | 203 (74.1%) | 71 (25.9%) |
Occupancy by Educational Attainment in Matherville
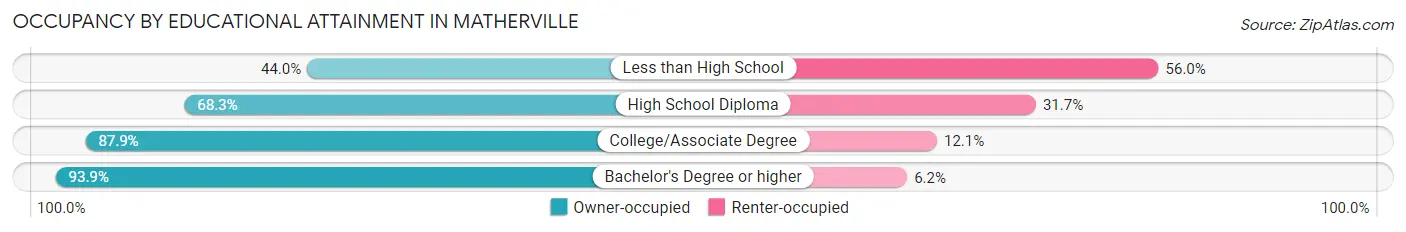
| Household Size | Owner-occupied | Renter-occupied |
| Less than High School | 22 (44.0%) | 28 (56.0%) |
| High School Diploma | 69 (68.3%) | 32 (31.7%) |
| College/Associate Degree | 51 (87.9%) | 7 (12.1%) |
| Bachelor's Degree or higher | 61 (93.9%) | 4 (6.1%) |
Occupancy by Age of Householder in Matherville
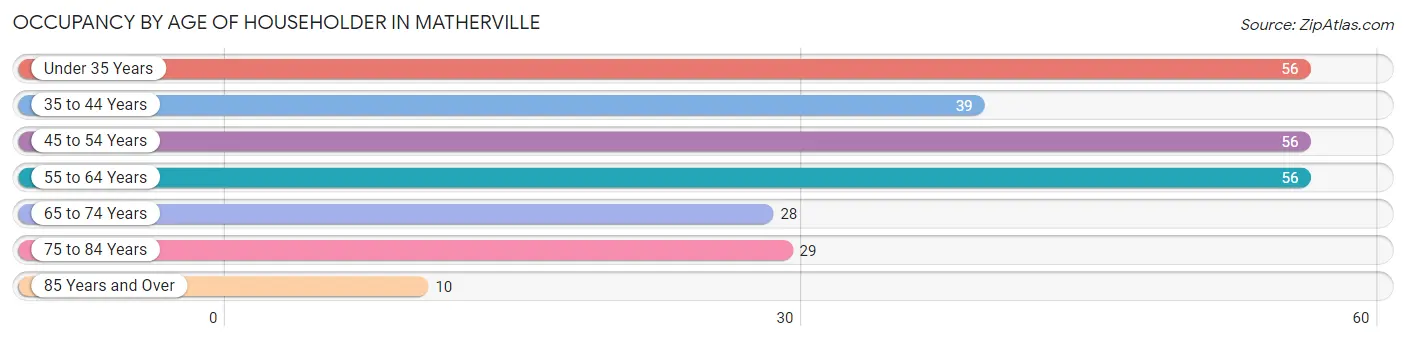
| Age Bracket | # Households | % Households |
| Under 35 Years | 56 | 20.4% |
| 35 to 44 Years | 39 | 14.2% |
| 45 to 54 Years | 56 | 20.4% |
| 55 to 64 Years | 56 | 20.4% |
| 65 to 74 Years | 28 | 10.2% |
| 75 to 84 Years | 29 | 10.6% |
| 85 Years and Over | 10 | 3.6% |
| Total | 274 | 100.0% |
Housing Finances in Matherville
Median Income by Occupancy in Matherville
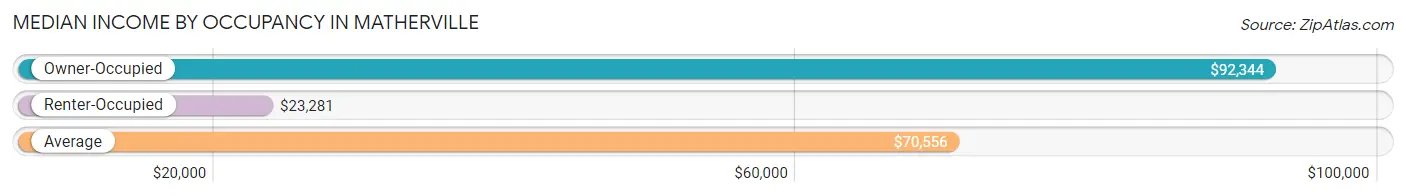
| Occupancy Type | # Households | Median Income |
| Owner-Occupied | 203 (74.1%) | $92,344 |
| Renter-Occupied | 71 (25.9%) | $23,281 |
| Average | 274 (100.0%) | $70,556 |
Occupancy by Householder Income Bracket in Matherville
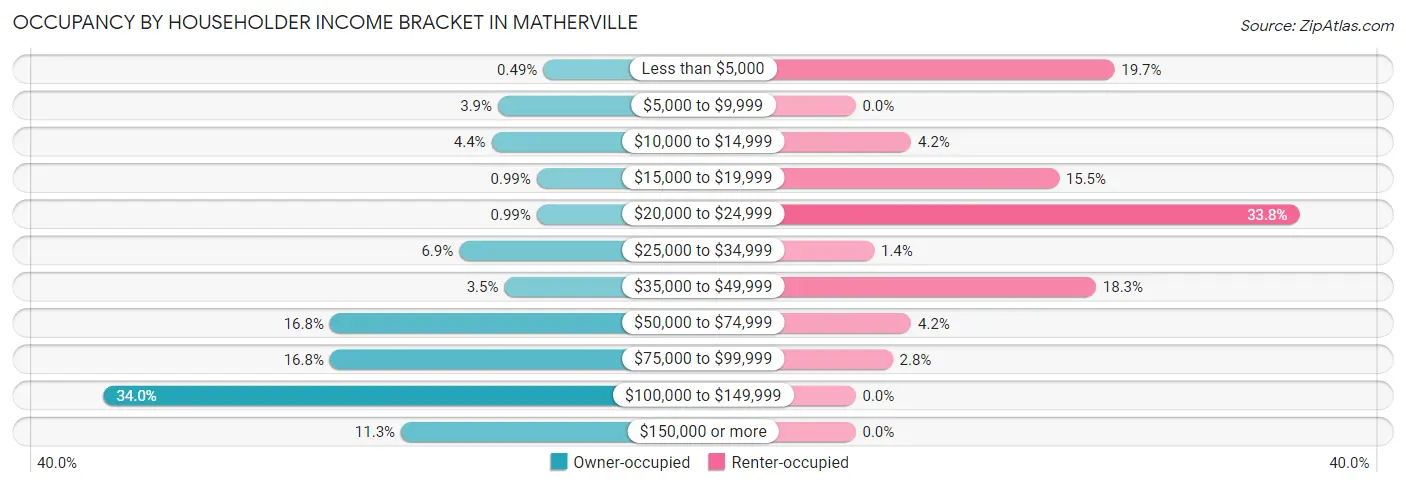
| Income Bracket | Owner-occupied | Renter-occupied |
| Less than $5,000 | 1 (0.5%) | 14 (19.7%) |
| $5,000 to $9,999 | 8 (3.9%) | 0 (0.0%) |
| $10,000 to $14,999 | 9 (4.4%) | 3 (4.2%) |
| $15,000 to $19,999 | 2 (1.0%) | 11 (15.5%) |
| $20,000 to $24,999 | 2 (1.0%) | 24 (33.8%) |
| $25,000 to $34,999 | 14 (6.9%) | 1 (1.4%) |
| $35,000 to $49,999 | 7 (3.5%) | 13 (18.3%) |
| $50,000 to $74,999 | 34 (16.8%) | 3 (4.2%) |
| $75,000 to $99,999 | 34 (16.8%) | 2 (2.8%) |
| $100,000 to $149,999 | 69 (34.0%) | 0 (0.0%) |
| $150,000 or more | 23 (11.3%) | 0 (0.0%) |
| Total | 203 (100.0%) | 71 (100.0%) |
Monthly Housing Cost Tiers in Matherville
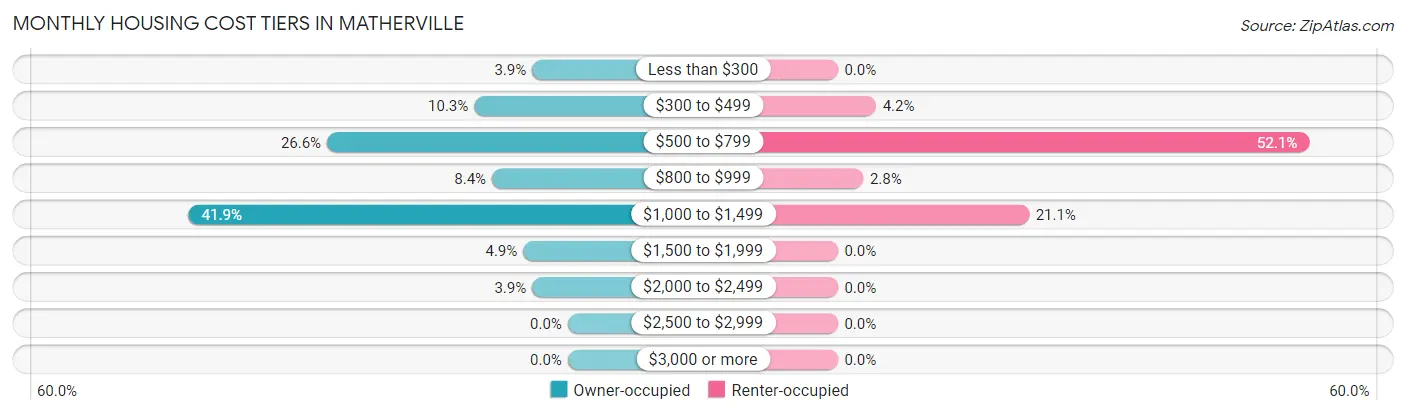
| Monthly Cost | Owner-occupied | Renter-occupied |
| Less than $300 | 8 (3.9%) | 0 (0.0%) |
| $300 to $499 | 21 (10.3%) | 3 (4.2%) |
| $500 to $799 | 54 (26.6%) | 37 (52.1%) |
| $800 to $999 | 17 (8.4%) | 2 (2.8%) |
| $1,000 to $1,499 | 85 (41.9%) | 15 (21.1%) |
| $1,500 to $1,999 | 10 (4.9%) | 0 (0.0%) |
| $2,000 to $2,499 | 8 (3.9%) | 0 (0.0%) |
| $2,500 to $2,999 | 0 (0.0%) | 0 (0.0%) |
| $3,000 or more | 0 (0.0%) | 0 (0.0%) |
| Total | 203 (100.0%) | 71 (100.0%) |
Physical Housing Characteristics in Matherville
Housing Structures in Matherville
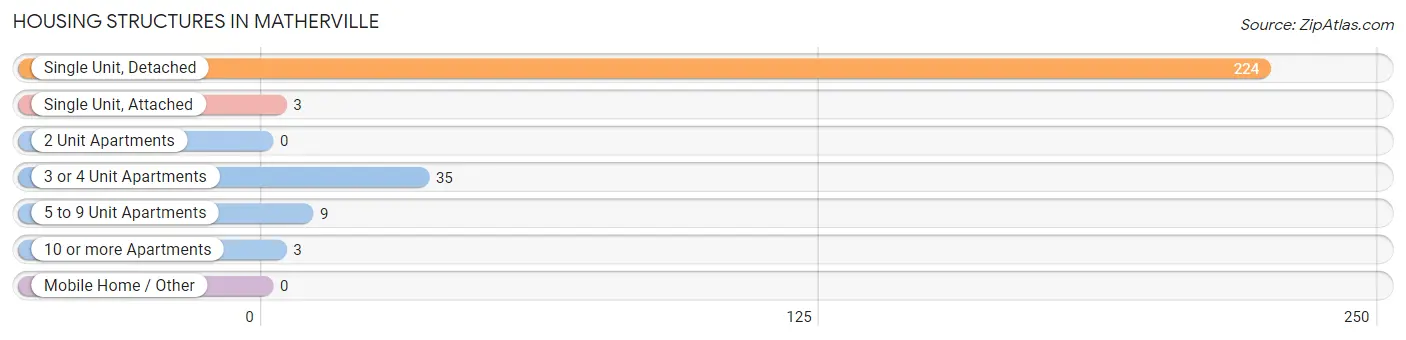
| Structure Type | # Housing Units | % Housing Units |
| Single Unit, Detached | 224 | 81.8% |
| Single Unit, Attached | 3 | 1.1% |
| 2 Unit Apartments | 0 | 0.0% |
| 3 or 4 Unit Apartments | 35 | 12.8% |
| 5 to 9 Unit Apartments | 9 | 3.3% |
| 10 or more Apartments | 3 | 1.1% |
| Mobile Home / Other | 0 | 0.0% |
| Total | 274 | 100.0% |
Housing Structures by Occupancy in Matherville
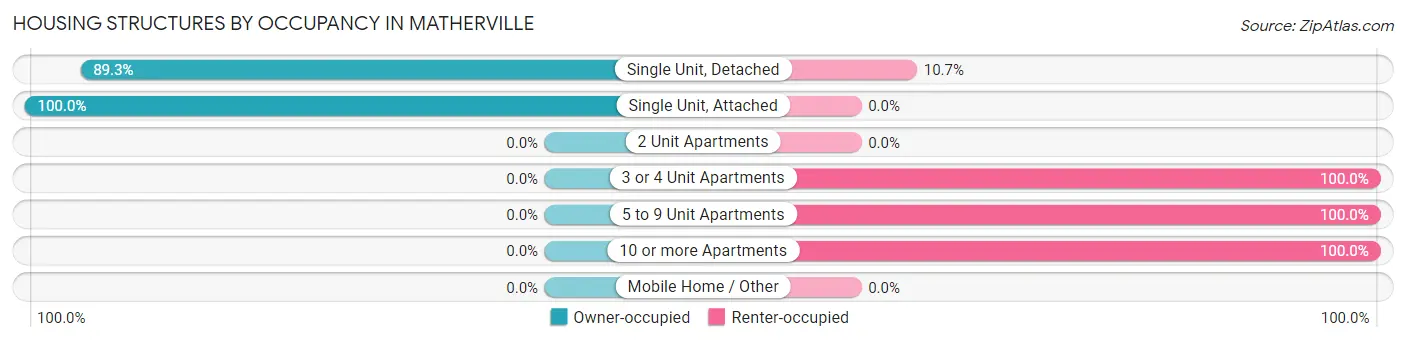
| Structure Type | Owner-occupied | Renter-occupied |
| Single Unit, Detached | 200 (89.3%) | 24 (10.7%) |
| Single Unit, Attached | 3 (100.0%) | 0 (0.0%) |
| 2 Unit Apartments | 0 (0.0%) | 0 (0.0%) |
| 3 or 4 Unit Apartments | 0 (0.0%) | 35 (100.0%) |
| 5 to 9 Unit Apartments | 0 (0.0%) | 9 (100.0%) |
| 10 or more Apartments | 0 (0.0%) | 3 (100.0%) |
| Mobile Home / Other | 0 (0.0%) | 0 (0.0%) |
| Total | 203 (74.1%) | 71 (25.9%) |
Housing Structures by Number of Rooms in Matherville
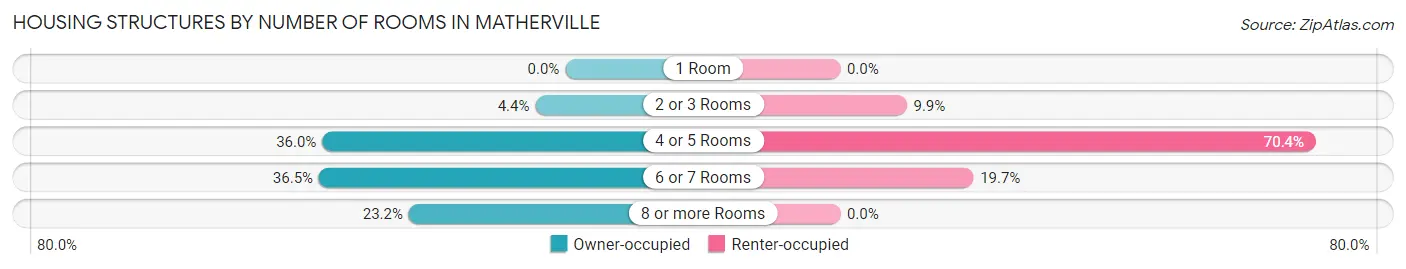
| Number of Rooms | Owner-occupied | Renter-occupied |
| 1 Room | 0 (0.0%) | 0 (0.0%) |
| 2 or 3 Rooms | 9 (4.4%) | 7 (9.9%) |
| 4 or 5 Rooms | 73 (36.0%) | 50 (70.4%) |
| 6 or 7 Rooms | 74 (36.4%) | 14 (19.7%) |
| 8 or more Rooms | 47 (23.2%) | 0 (0.0%) |
| Total | 203 (100.0%) | 71 (100.0%) |
Housing Structure by Heating Type in Matherville
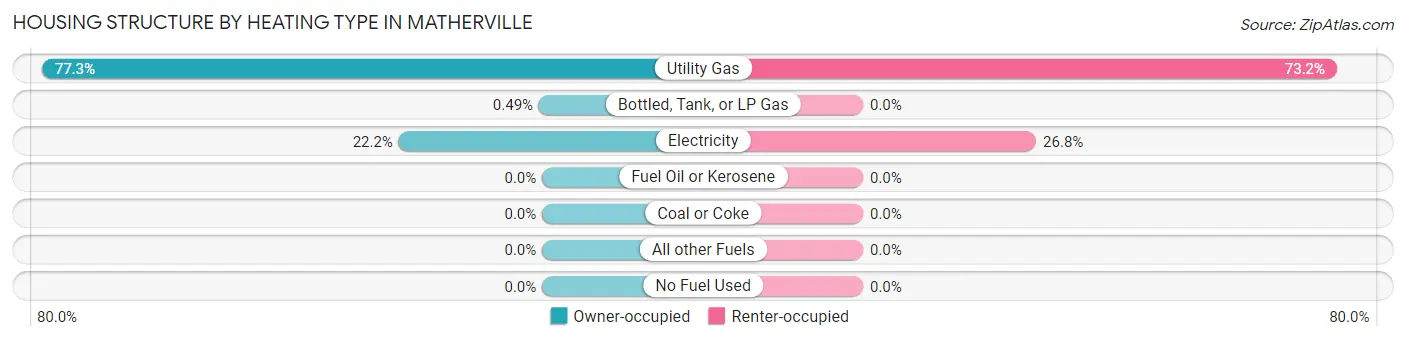
| Heating Type | Owner-occupied | Renter-occupied |
| Utility Gas | 157 (77.3%) | 52 (73.2%) |
| Bottled, Tank, or LP Gas | 1 (0.5%) | 0 (0.0%) |
| Electricity | 45 (22.2%) | 19 (26.8%) |
| Fuel Oil or Kerosene | 0 (0.0%) | 0 (0.0%) |
| Coal or Coke | 0 (0.0%) | 0 (0.0%) |
| All other Fuels | 0 (0.0%) | 0 (0.0%) |
| No Fuel Used | 0 (0.0%) | 0 (0.0%) |
| Total | 203 (100.0%) | 71 (100.0%) |
Household Vehicle Usage in Matherville
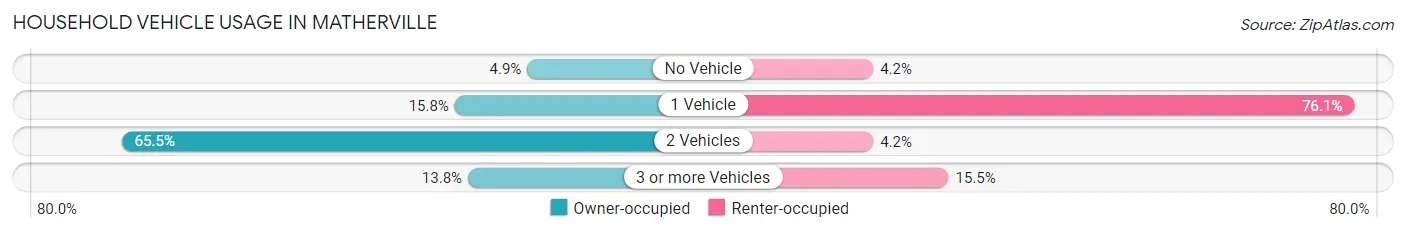
| Vehicles per Household | Owner-occupied | Renter-occupied |
| No Vehicle | 10 (4.9%) | 3 (4.2%) |
| 1 Vehicle | 32 (15.8%) | 54 (76.1%) |
| 2 Vehicles | 133 (65.5%) | 3 (4.2%) |
| 3 or more Vehicles | 28 (13.8%) | 11 (15.5%) |
| Total | 203 (100.0%) | 71 (100.0%) |
Real Estate & Mortgages in Matherville
Real Estate and Mortgage Overview in Matherville
| Characteristic | Without Mortgage | With Mortgage |
| Housing Units | 77 | 126 |
| Median Property Value | $131,700 | $131,000 |
| Median Household Income | $83,125 | $18 |
| Monthly Housing Costs | $556 | $0 |
| Real Estate Taxes | $2,638 | $0 |
Property Value by Mortgage Status in Matherville
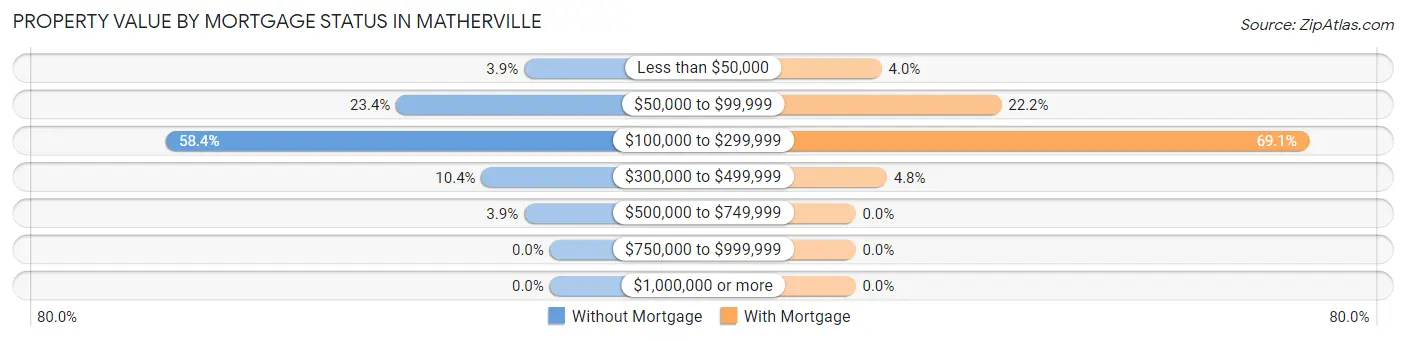
| Property Value | Without Mortgage | With Mortgage |
| Less than $50,000 | 3 (3.9%) | 5 (4.0%) |
| $50,000 to $99,999 | 18 (23.4%) | 28 (22.2%) |
| $100,000 to $299,999 | 45 (58.4%) | 87 (69.1%) |
| $300,000 to $499,999 | 8 (10.4%) | 6 (4.8%) |
| $500,000 to $749,999 | 3 (3.9%) | 0 (0.0%) |
| $750,000 to $999,999 | 0 (0.0%) | 0 (0.0%) |
| $1,000,000 or more | 0 (0.0%) | 0 (0.0%) |
| Total | 77 (100.0%) | 126 (100.0%) |
Household Income by Mortgage Status in Matherville
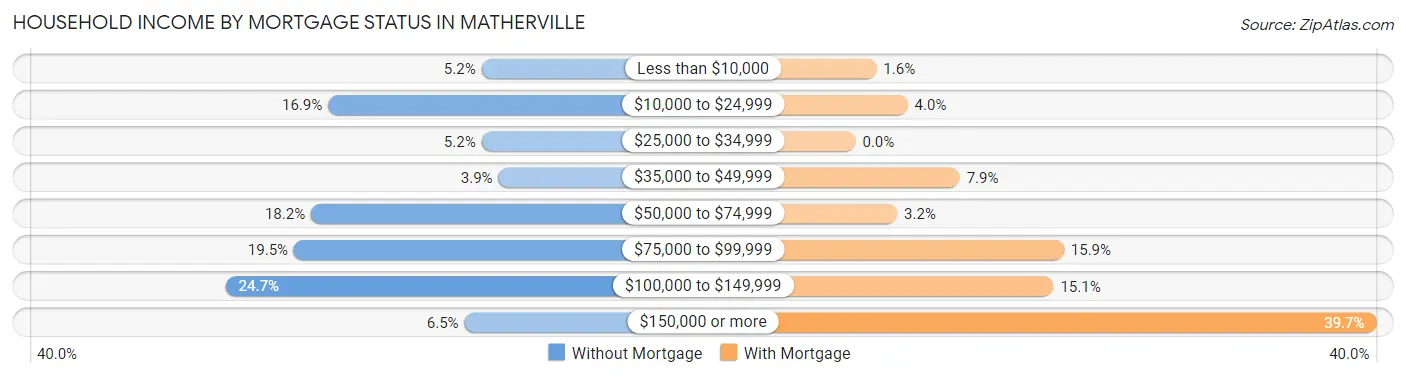
| Household Income | Without Mortgage | With Mortgage |
| Less than $10,000 | 4 (5.2%) | 2 (1.6%) |
| $10,000 to $24,999 | 13 (16.9%) | 5 (4.0%) |
| $25,000 to $34,999 | 4 (5.2%) | 0 (0.0%) |
| $35,000 to $49,999 | 3 (3.9%) | 10 (7.9%) |
| $50,000 to $74,999 | 14 (18.2%) | 4 (3.2%) |
| $75,000 to $99,999 | 15 (19.5%) | 20 (15.9%) |
| $100,000 to $149,999 | 19 (24.7%) | 19 (15.1%) |
| $150,000 or more | 5 (6.5%) | 50 (39.7%) |
| Total | 77 (100.0%) | 126 (100.0%) |
Property Value to Household Income Ratio in Matherville
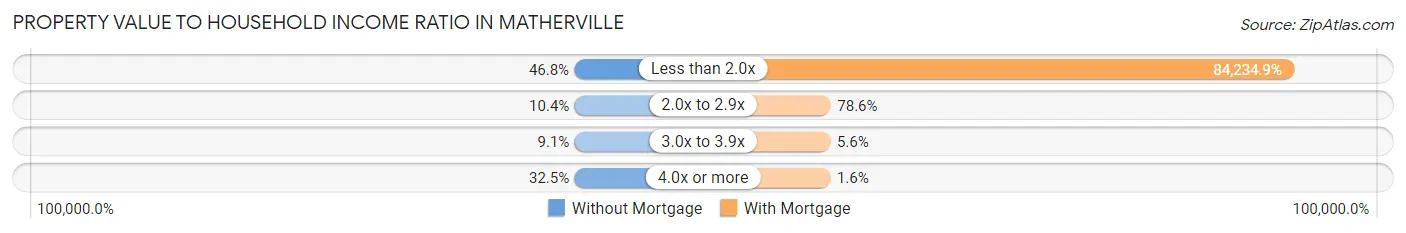
| Value-to-Income Ratio | Without Mortgage | With Mortgage |
| Less than 2.0x | 36 (46.8%) | 106,136 (84,234.9%) |
| 2.0x to 2.9x | 8 (10.4%) | 99 (78.6%) |
| 3.0x to 3.9x | 7 (9.1%) | 7 (5.6%) |
| 4.0x or more | 25 (32.5%) | 2 (1.6%) |
| Total | 77 (100.0%) | 126 (100.0%) |
Real Estate Taxes by Mortgage Status in Matherville
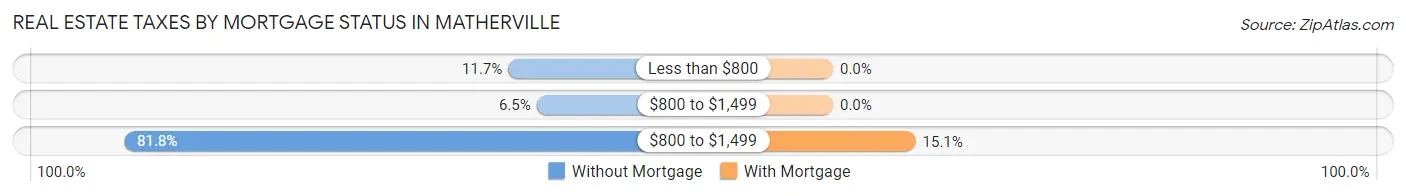
| Property Taxes | Without Mortgage | With Mortgage |
| Less than $800 | 9 (11.7%) | 0 (0.0%) |
| $800 to $1,499 | 5 (6.5%) | 0 (0.0%) |
| $800 to $1,499 | 63 (81.8%) | 19 (15.1%) |
| Total | 77 (100.0%) | 126 (100.0%) |
Health & Disability in Matherville
Health Insurance Coverage by Age in Matherville
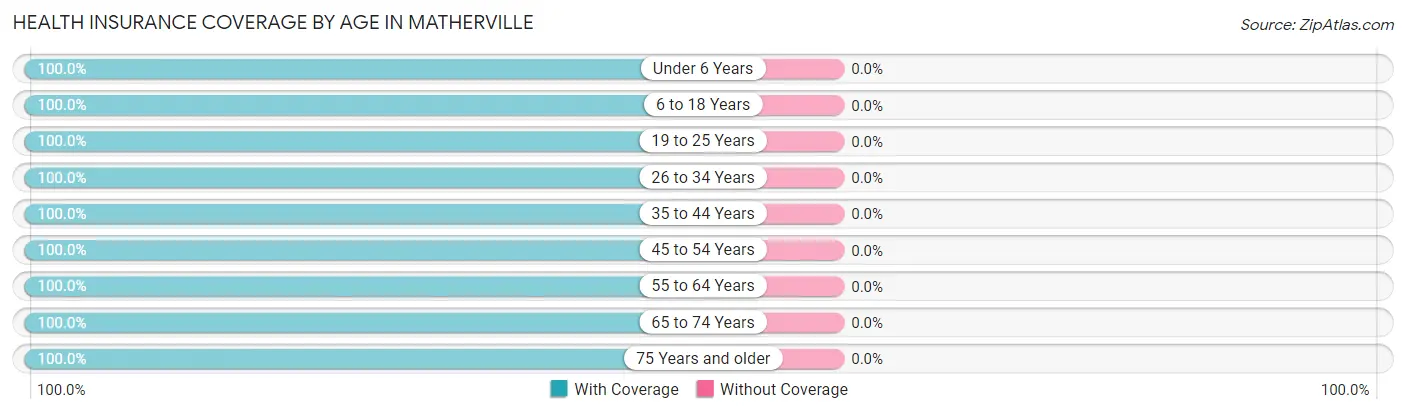
| Age Bracket | With Coverage | Without Coverage |
| Under 6 Years | 108 (100.0%) | 0 (0.0%) |
| 6 to 18 Years | 166 (100.0%) | 0 (0.0%) |
| 19 to 25 Years | 46 (100.0%) | 0 (0.0%) |
| 26 to 34 Years | 90 (100.0%) | 0 (0.0%) |
| 35 to 44 Years | 78 (100.0%) | 0 (0.0%) |
| 45 to 54 Years | 87 (100.0%) | 0 (0.0%) |
| 55 to 64 Years | 92 (100.0%) | 0 (0.0%) |
| 65 to 74 Years | 51 (100.0%) | 0 (0.0%) |
| 75 Years and older | 76 (100.0%) | 0 (0.0%) |
| Total | 794 (100.0%) | 0 (0.0%) |
Health Insurance Coverage by Citizenship Status in Matherville
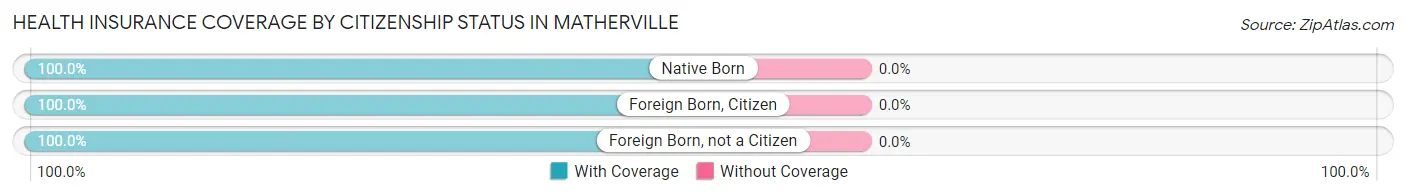
| Citizenship Status | With Coverage | Without Coverage |
| Native Born | 108 (100.0%) | 0 (0.0%) |
| Foreign Born, Citizen | 166 (100.0%) | 0 (0.0%) |
| Foreign Born, not a Citizen | 46 (100.0%) | 0 (0.0%) |
Health Insurance Coverage by Household Income in Matherville
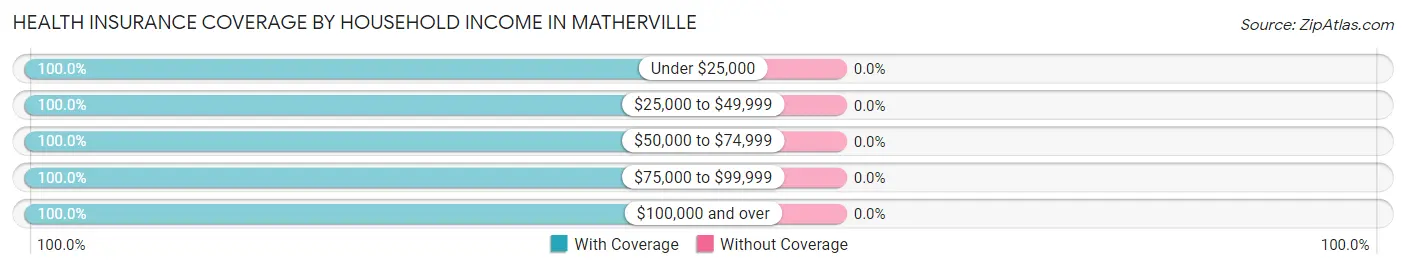
| Household Income | With Coverage | Without Coverage |
| Under $25,000 | 171 (100.0%) | 0 (0.0%) |
| $25,000 to $49,999 | 102 (100.0%) | 0 (0.0%) |
| $50,000 to $74,999 | 97 (100.0%) | 0 (0.0%) |
| $75,000 to $99,999 | 105 (100.0%) | 0 (0.0%) |
| $100,000 and over | 319 (100.0%) | 0 (0.0%) |
Public vs Private Health Insurance Coverage by Age in Matherville
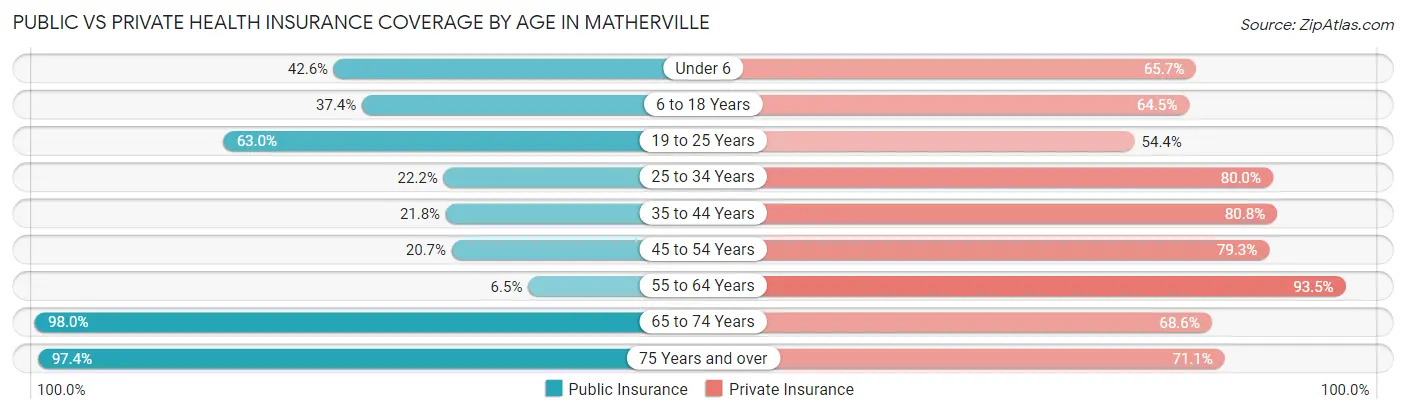
| Age Bracket | Public Insurance | Private Insurance |
| Under 6 | 46 (42.6%) | 71 (65.7%) |
| 6 to 18 Years | 62 (37.3%) | 107 (64.5%) |
| 19 to 25 Years | 29 (63.0%) | 25 (54.3%) |
| 25 to 34 Years | 20 (22.2%) | 72 (80.0%) |
| 35 to 44 Years | 17 (21.8%) | 63 (80.8%) |
| 45 to 54 Years | 18 (20.7%) | 69 (79.3%) |
| 55 to 64 Years | 6 (6.5%) | 86 (93.5%) |
| 65 to 74 Years | 50 (98.0%) | 35 (68.6%) |
| 75 Years and over | 74 (97.4%) | 54 (71.1%) |
| Total | 322 (40.6%) | 582 (73.3%) |
Disability Status by Sex by Age in Matherville
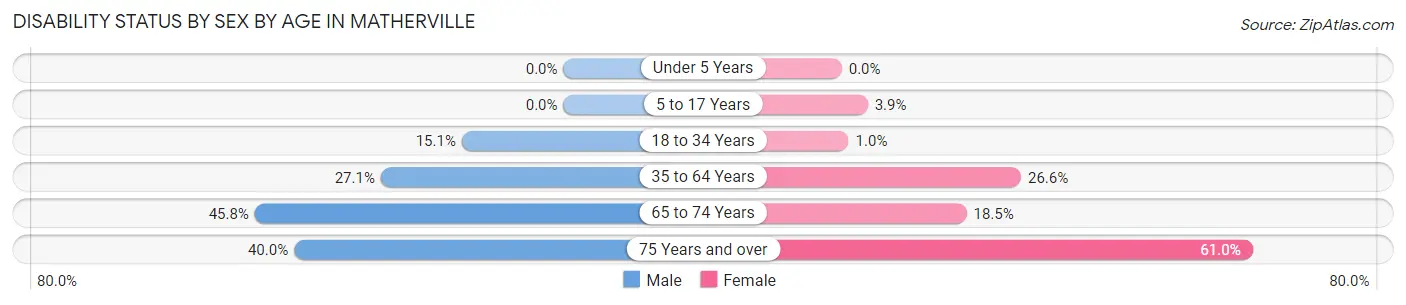
| Age Bracket | Male | Female |
| Under 5 Years | 0 (0.0%) | 0 (0.0%) |
| 5 to 17 Years | 0 (0.0%) | 4 (3.8%) |
| 18 to 34 Years | 8 (15.1%) | 1 (1.0%) |
| 35 to 64 Years | 32 (27.1%) | 37 (26.6%) |
| 65 to 74 Years | 11 (45.8%) | 5 (18.5%) |
| 75 Years and over | 14 (40.0%) | 25 (61.0%) |
Disability Class by Sex by Age in Matherville
Disability Class: Hearing Difficulty
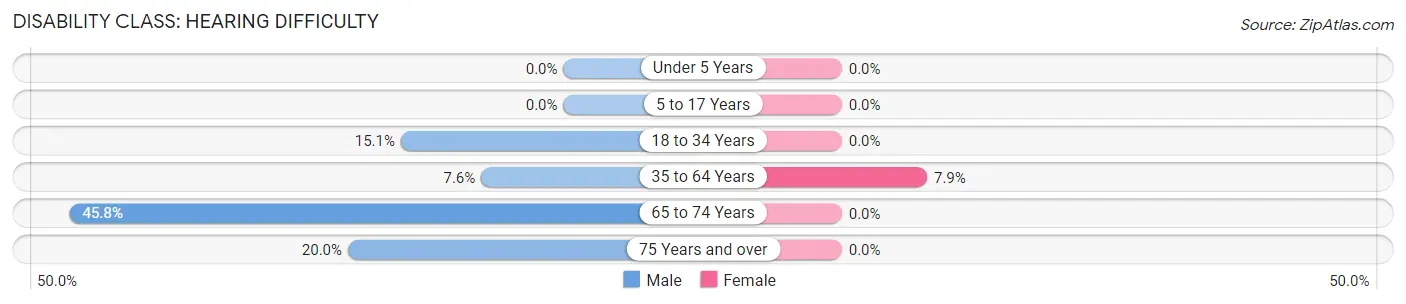
| Age Bracket | Male | Female |
| Under 5 Years | 0 (0.0%) | 0 (0.0%) |
| 5 to 17 Years | 0 (0.0%) | 0 (0.0%) |
| 18 to 34 Years | 8 (15.1%) | 0 (0.0%) |
| 35 to 64 Years | 9 (7.6%) | 11 (7.9%) |
| 65 to 74 Years | 11 (45.8%) | 0 (0.0%) |
| 75 Years and over | 7 (20.0%) | 0 (0.0%) |
Disability Class: Vision Difficulty
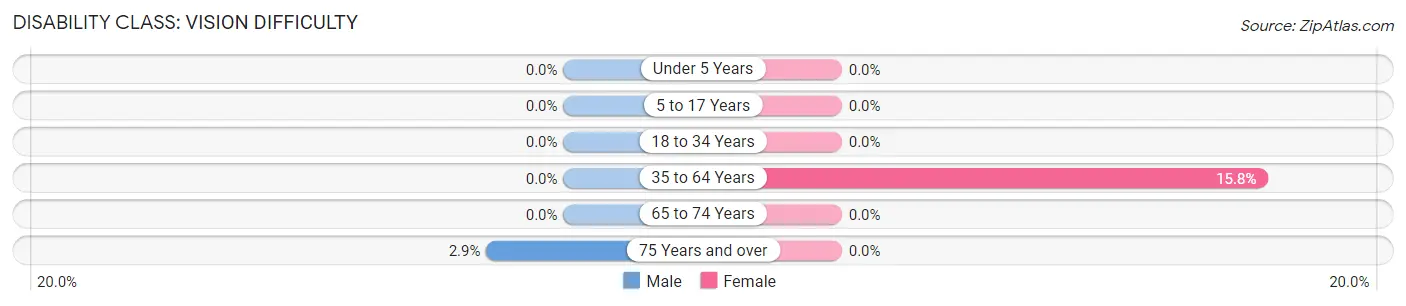
| Age Bracket | Male | Female |
| Under 5 Years | 0 (0.0%) | 0 (0.0%) |
| 5 to 17 Years | 0 (0.0%) | 0 (0.0%) |
| 18 to 34 Years | 0 (0.0%) | 0 (0.0%) |
| 35 to 64 Years | 0 (0.0%) | 22 (15.8%) |
| 65 to 74 Years | 0 (0.0%) | 0 (0.0%) |
| 75 Years and over | 1 (2.9%) | 0 (0.0%) |
Disability Class: Cognitive Difficulty
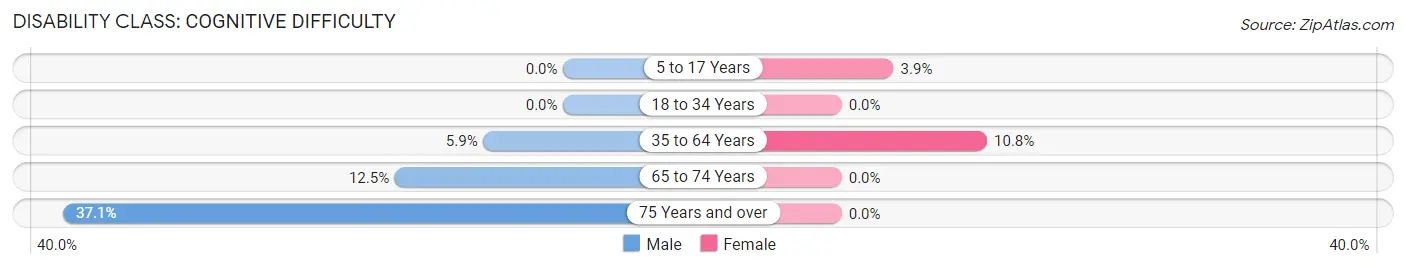
| Age Bracket | Male | Female |
| 5 to 17 Years | 0 (0.0%) | 4 (3.8%) |
| 18 to 34 Years | 0 (0.0%) | 0 (0.0%) |
| 35 to 64 Years | 7 (5.9%) | 15 (10.8%) |
| 65 to 74 Years | 3 (12.5%) | 0 (0.0%) |
| 75 Years and over | 13 (37.1%) | 0 (0.0%) |
Disability Class: Ambulatory Difficulty
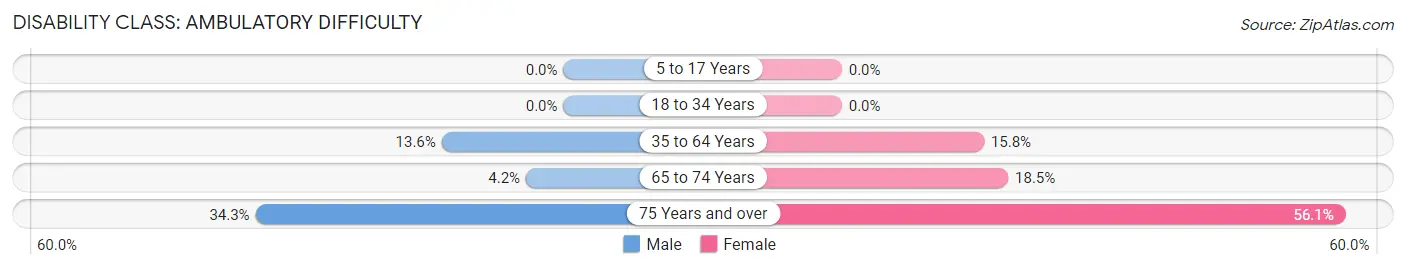
| Age Bracket | Male | Female |
| 5 to 17 Years | 0 (0.0%) | 0 (0.0%) |
| 18 to 34 Years | 0 (0.0%) | 0 (0.0%) |
| 35 to 64 Years | 16 (13.6%) | 22 (15.8%) |
| 65 to 74 Years | 1 (4.2%) | 5 (18.5%) |
| 75 Years and over | 12 (34.3%) | 23 (56.1%) |
Disability Class: Self-Care Difficulty
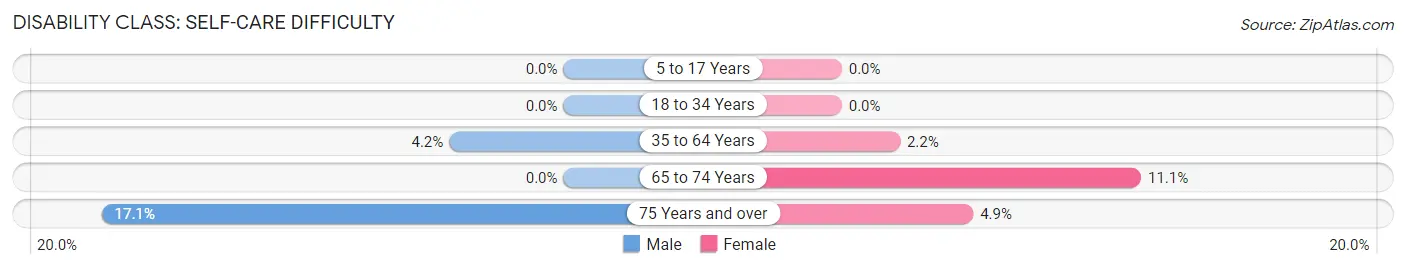
| Age Bracket | Male | Female |
| 5 to 17 Years | 0 (0.0%) | 0 (0.0%) |
| 18 to 34 Years | 0 (0.0%) | 0 (0.0%) |
| 35 to 64 Years | 5 (4.2%) | 3 (2.2%) |
| 65 to 74 Years | 0 (0.0%) | 3 (11.1%) |
| 75 Years and over | 6 (17.1%) | 2 (4.9%) |
Technology Access in Matherville
Computing Device Access in Matherville
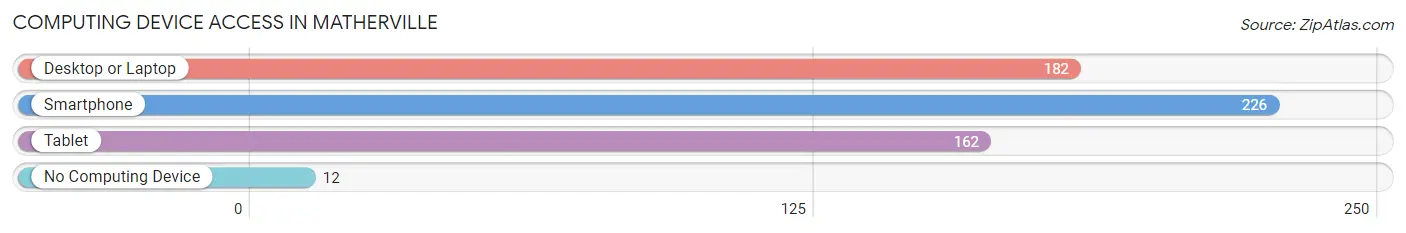
| Device Type | # Households | % Households |
| Desktop or Laptop | 182 | 66.4% |
| Smartphone | 226 | 82.5% |
| Tablet | 162 | 59.1% |
| No Computing Device | 12 | 4.4% |
| Total | 274 | 100.0% |
Internet Access in Matherville
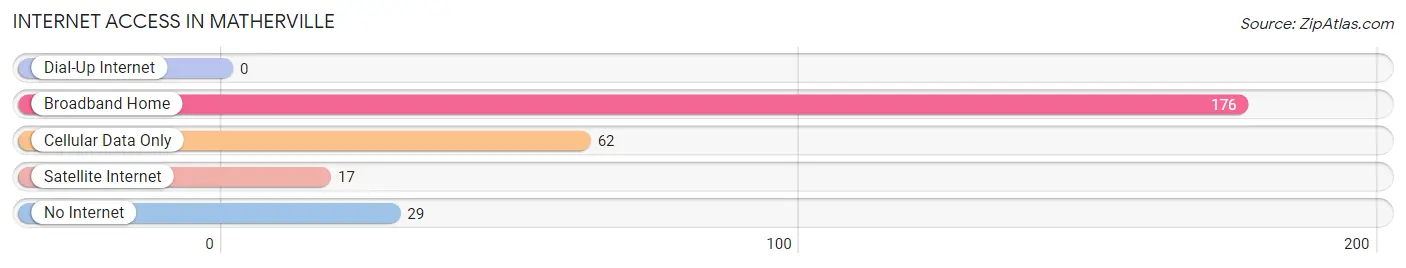
| Internet Type | # Households | % Households |
| Dial-Up Internet | 0 | 0.0% |
| Broadband Home | 176 | 64.2% |
| Cellular Data Only | 62 | 22.6% |
| Satellite Internet | 17 | 6.2% |
| No Internet | 29 | 10.6% |
| Total | 274 | 100.0% |
Matherville Summary
Matherville is a small village located in Rock Island County, Illinois. It is situated on the banks of the Mississippi River, just south of the Quad Cities. The village has a population of just over 500 people, and is part of the Quad Cities Metropolitan Statistical Area.
History
Matherville was founded in 1836 by William Mather, a prominent local businessman. He purchased the land from the local Native American tribes and named the village after himself. The village was incorporated in 1854, and the first post office was established in 1855.
In the late 19th century, Matherville was a thriving agricultural community. The village was home to several grain elevators, a flour mill, and a sawmill. The village also had a hotel, a general store, and a blacksmith shop.
In the early 20th century, Matherville began to decline. The Great Depression hit the village hard, and many of the businesses closed. The population decreased, and the village became a quiet, rural community.
Geography
Matherville is located in the northwest corner of Rock Island County, Illinois. It is situated on the banks of the Mississippi River, just south of the Quad Cities. The village is bordered by the cities of Milan and Carbon Cliff to the north, and the city of Rock Island to the south.
The village has a total area of 0.6 square miles, all of which is land. The terrain is mostly flat, with some rolling hills. The climate is humid continental, with hot, humid summers and cold, snowy winters.
Economy
Matherville’s economy is largely based on agriculture. The village is home to several grain elevators, a flour mill, and a sawmill. The village also has a few small businesses, including a general store, a gas station, and a restaurant.
The village is also home to a few manufacturing companies, including a plastics factory and a metal fabrication plant. The village is also home to a few small service businesses, including a landscaping company and a plumbing business.
Demographics
As of the 2010 census, Matherville had a population of 514 people. The racial makeup of the village was 97.3% White, 0.6% African American, 0.2% Native American, 0.2% Asian, 0.4% from other races, and 1.3% from two or more races. Hispanic or Latino of any race were 1.2% of the population.
The median household income in Matherville was $45,000, and the median family income was $50,000. The per capita income was $20,000. About 8.3% of families and 10.2% of the population were below the poverty line, including 14.3% of those under age 18 and none of those age 65 or over.
Matherville is a small, rural village with a rich history and a strong agricultural economy. The village is home to a few small businesses, and the population is largely white. The village is a quiet, peaceful place to live, and is a great place to raise a family.
Common Questions
What is Per Capita Income in Matherville?
Per Capita income in Matherville is $25,986.
What is the Median Family Income in Matherville?
Median Family Income in Matherville is $87,250.
What is the Median Household income in Matherville?
Median Household Income in Matherville is $70,556.
What is Income or Wage Gap in Matherville?
Income or Wage Gap in Matherville is 48.7%.
Women in Matherville earn 51.3 cents for every dollar earned by a man.
What is Inequality or Gini Index in Matherville?
Inequality or Gini Index in Matherville is 0.39.
What is the Total Population of Matherville?
Total Population of Matherville is 794.
What is the Total Male Population of Matherville?
Total Male Population of Matherville is 337.
What is the Total Female Population of Matherville?
Total Female Population of Matherville is 457.
What is the Ratio of Males per 100 Females in Matherville?
There are 73.74 Males per 100 Females in Matherville.
What is the Ratio of Females per 100 Males in Matherville?
There are 135.61 Females per 100 Males in Matherville.
What is the Median Population Age in Matherville?
Median Population Age in Matherville is 34.4 Years.
What is the Average Family Size in Matherville
Average Family Size in Matherville is 3.3 People.
What is the Average Household Size in Matherville
Average Household Size in Matherville is 2.9 People.
How Large is the Labor Force in Matherville?
There are 320 People in the Labor Forcein in Matherville.
What is the Percentage of People in the Labor Force in Matherville?
58.7% of People are in the Labor Force in Matherville.
What is the Unemployment Rate in Matherville?
Unemployment Rate in Matherville is 5.9%.