Manito, IL Map & Demographics
Manito Map
Manito Overview
$34,314
PER CAPITA INCOME
$80,833
AVG FAMILY INCOME
$65,066
AVG HOUSEHOLD INCOME
32.1%
WAGE / INCOME GAP [ % ]
67.9¢/ $1
WAGE / INCOME GAP [ $ ]
0.45
INEQUALITY / GINI INDEX
1,719
TOTAL POPULATION
815
MALE POPULATION
904
FEMALE POPULATION
90.15
MALES / 100 FEMALES
110.92
FEMALES / 100 MALES
44.5
MEDIAN AGE
2.7
AVG FAMILY SIZE
2.3
AVG HOUSEHOLD SIZE
806
LABOR FORCE [ PEOPLE ]
56.9%
PERCENT IN LABOR FORCE
2.4%
UNEMPLOYMENT RATE
Manito Zip Codes
Manito Area Codes
Income in Manito
Income Overview in Manito
Per Capita Income in Manito is $34,314, while median incomes of families and households are $80,833 and $65,066 respectively.
| Characteristic | Number | Measure |
| Per Capita Income | 1,719 | $34,314 |
| Median Family Income | 468 | $80,833 |
| Mean Family Income | 468 | $91,084 |
| Median Household Income | 741 | $65,066 |
| Mean Household Income | 741 | $80,236 |
| Income Deficit | 468 | $0 |
| Wage / Income Gap (%) | 1,719 | 32.13% |
| Wage / Income Gap ($) | 1,719 | 67.87¢ per $1 |
| Gini / Inequality Index | 1,719 | 0.45 |
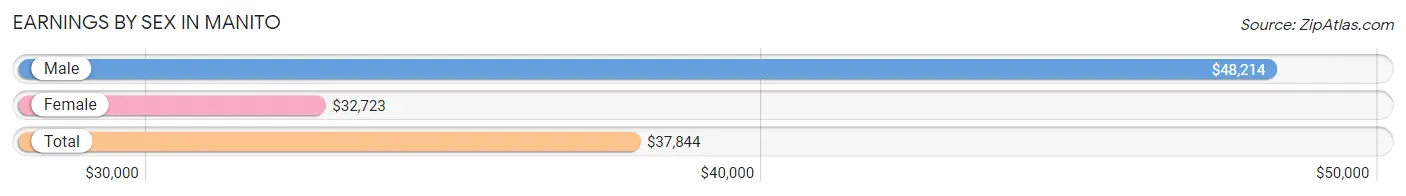
Earnings by Sex in Manito
Average Earnings in Manito are $37,844, $48,214 for men and $32,723 for women, a difference of 32.1%.
| Sex | Number | Average Earnings |
| Male | 442 (52.4%) | $48,214 |
| Female | 401 (47.6%) | $32,723 |
| Total | 843 (100.0%) | $37,844 |
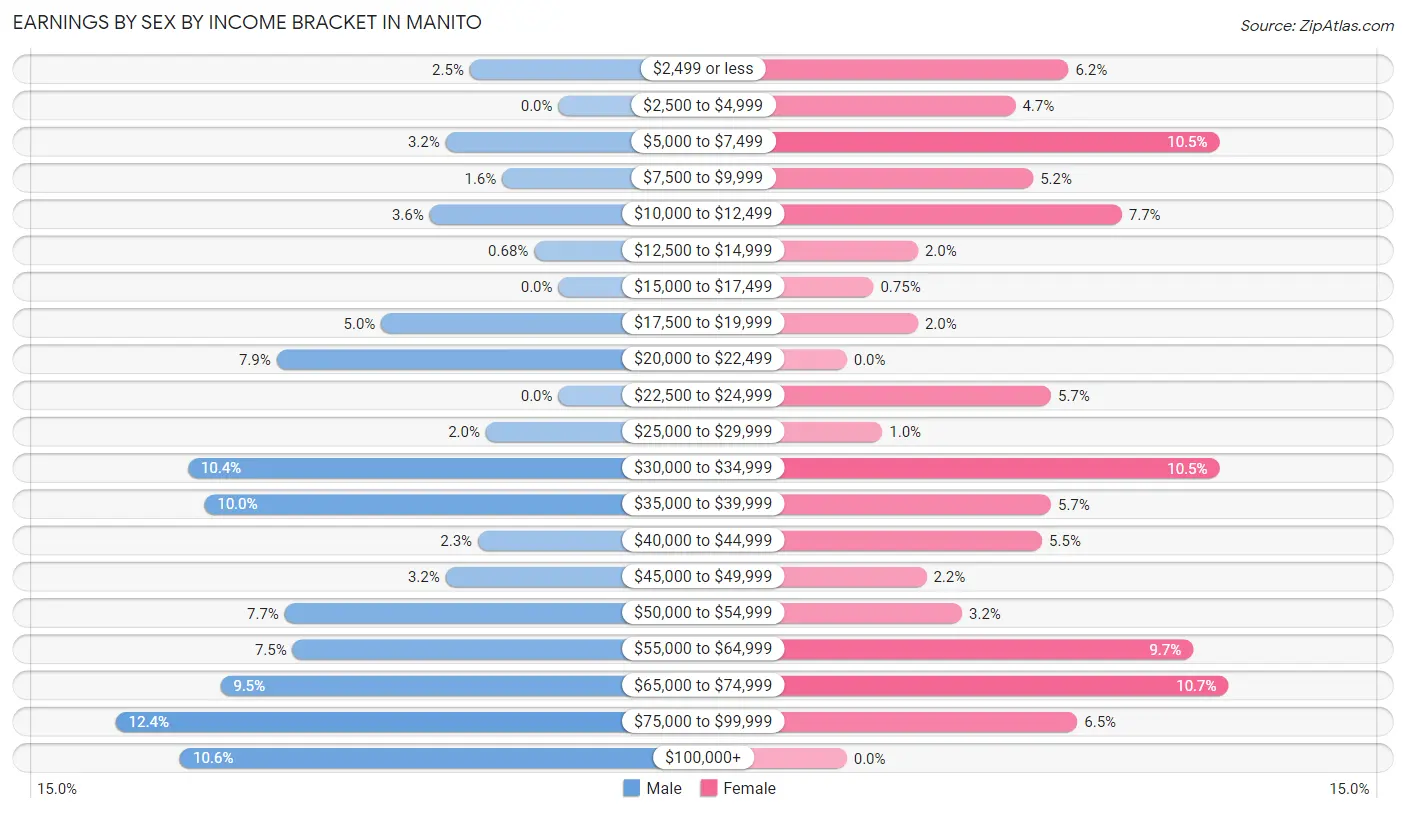
Earnings by Sex by Income Bracket in Manito
The most common earnings brackets in Manito are $75,000 to $99,999 for men (55 | 12.4%) and $65,000 to $74,999 for women (43 | 10.7%).
| Income | Male | Female |
| $2,499 or less | 11 (2.5%) | 25 (6.2%) |
| $2,500 to $4,999 | 0 (0.0%) | 19 (4.7%) |
| $5,000 to $7,499 | 14 (3.2%) | 42 (10.5%) |
| $7,500 to $9,999 | 7 (1.6%) | 21 (5.2%) |
| $10,000 to $12,499 | 16 (3.6%) | 31 (7.7%) |
| $12,500 to $14,999 | 3 (0.7%) | 8 (2.0%) |
| $15,000 to $17,499 | 0 (0.0%) | 3 (0.7%) |
| $17,500 to $19,999 | 22 (5.0%) | 8 (2.0%) |
| $20,000 to $22,499 | 35 (7.9%) | 0 (0.0%) |
| $22,500 to $24,999 | 0 (0.0%) | 23 (5.7%) |
| $25,000 to $29,999 | 9 (2.0%) | 4 (1.0%) |
| $30,000 to $34,999 | 46 (10.4%) | 42 (10.5%) |
| $35,000 to $39,999 | 44 (10.0%) | 23 (5.7%) |
| $40,000 to $44,999 | 10 (2.3%) | 22 (5.5%) |
| $45,000 to $49,999 | 14 (3.2%) | 9 (2.2%) |
| $50,000 to $54,999 | 34 (7.7%) | 13 (3.2%) |
| $55,000 to $64,999 | 33 (7.5%) | 39 (9.7%) |
| $65,000 to $74,999 | 42 (9.5%) | 43 (10.7%) |
| $75,000 to $99,999 | 55 (12.4%) | 26 (6.5%) |
| $100,000+ | 47 (10.6%) | 0 (0.0%) |
| Total | 442 (100.0%) | 401 (100.0%) |
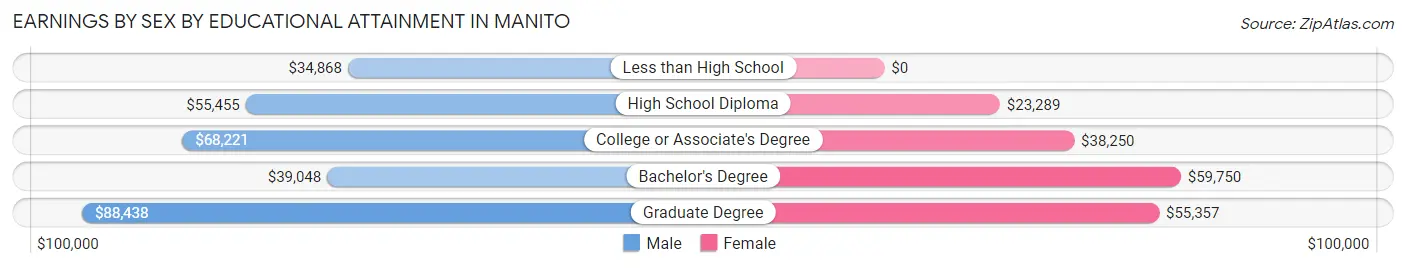
Earnings by Sex by Educational Attainment in Manito
Average earnings in Manito are $52,333 for men and $34,955 for women, a difference of 33.2%. Men with an educational attainment of graduate degree enjoy the highest average annual earnings of $88,438, while those with less than high school education earn the least with $34,868. Women with an educational attainment of bachelor's degree earn the most with the average annual earnings of $59,750, while those with high school diploma education have the smallest earnings of $23,289.
| Educational Attainment | Male Income | Female Income |
| Less than High School | $34,868 | $0 |
| High School Diploma | $55,455 | $23,289 |
| College or Associate's Degree | $68,221 | $38,250 |
| Bachelor's Degree | $39,048 | $59,750 |
| Graduate Degree | $88,438 | $55,357 |
| Total | $52,333 | $34,955 |
Family Income in Manito
Family Income Brackets in Manito
According to the Manito family income data, there are 103 families falling into the $75,000 to $99,999 income range, which is the most common income bracket and makes up 22.0% of all families.
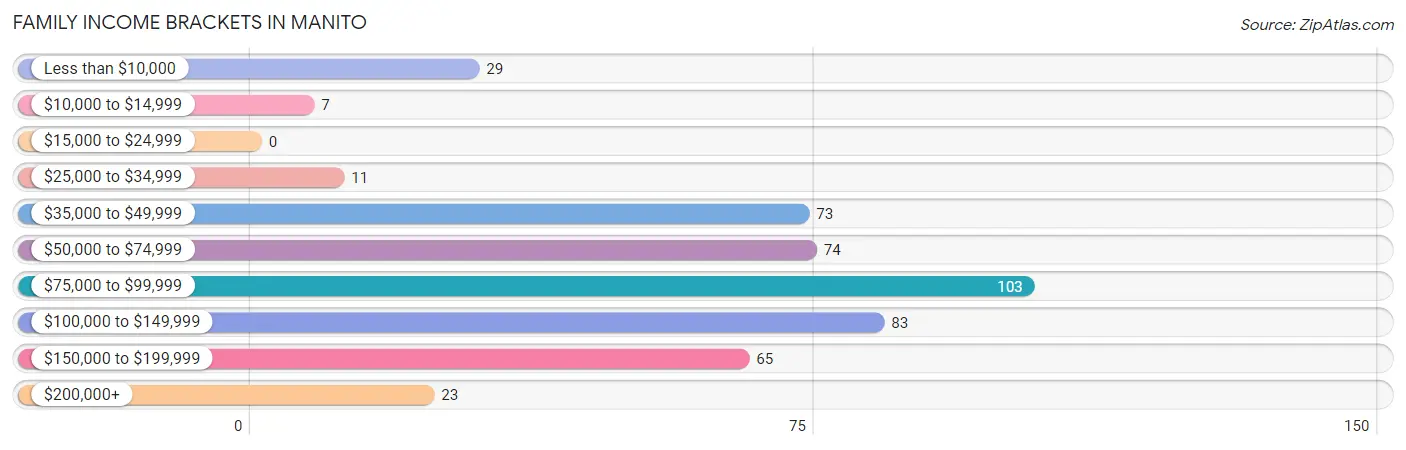
| Income Bracket | # Families | % Families |
| Less than $10,000 | 29 | 6.2% |
| $10,000 to $14,999 | 7 | 1.5% |
| $15,000 to $24,999 | 0 | 0.0% |
| $25,000 to $34,999 | 11 | 2.4% |
| $35,000 to $49,999 | 73 | 15.6% |
| $50,000 to $74,999 | 74 | 15.8% |
| $75,000 to $99,999 | 103 | 22.0% |
| $100,000 to $149,999 | 83 | 17.7% |
| $150,000 to $199,999 | 65 | 13.9% |
| $200,000+ | 23 | 4.9% |
Family Income by Famaliy Size in Manito
3-person families (117 | 25.0%) account for the highest median family income in Manito with $103,661 per family, while 3-person families (117 | 25.0%) have the highest median income of $34,554 per family member.
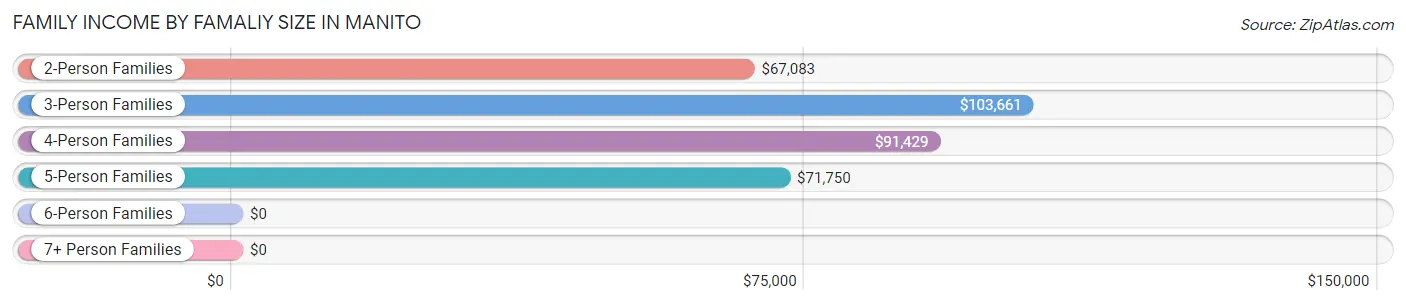
| Income Bracket | # Families | Median Income |
| 2-Person Families | 242 (51.7%) | $67,083 |
| 3-Person Families | 117 (25.0%) | $103,661 |
| 4-Person Families | 76 (16.2%) | $91,429 |
| 5-Person Families | 27 (5.8%) | $71,750 |
| 6-Person Families | 3 (0.6%) | $0 |
| 7+ Person Families | 3 (0.6%) | $0 |
| Total | 468 (100.0%) | $80,833 |
Family Income by Number of Earners in Manito
The median family income in Manito is $80,833, with families comprising 3+ earners (52) having the highest median family income of $132,500, while families with 1 earner (134) have the lowest median family income of $46,742, accounting for 11.1% and 28.6% of families, respectively.
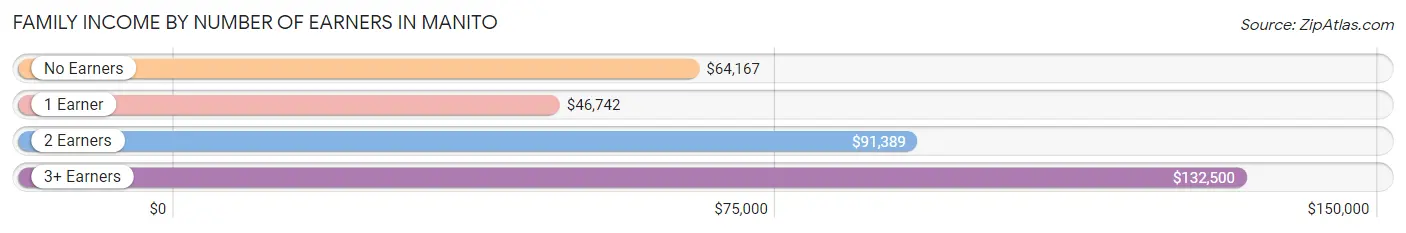
| Number of Earners | # Families | Median Income |
| No Earners | 74 (15.8%) | $64,167 |
| 1 Earner | 134 (28.6%) | $46,742 |
| 2 Earners | 208 (44.4%) | $91,389 |
| 3+ Earners | 52 (11.1%) | $132,500 |
| Total | 468 (100.0%) | $80,833 |
Household Income in Manito
Household Income Brackets in Manito
With 158 households falling in the category, the $50,000 to $74,999 income range is the most frequent in Manito, accounting for 21.3% of all households. In contrast, only 29 households (3.9%) fall into the $10,000 to $14,999 income bracket, making it the least populous group.
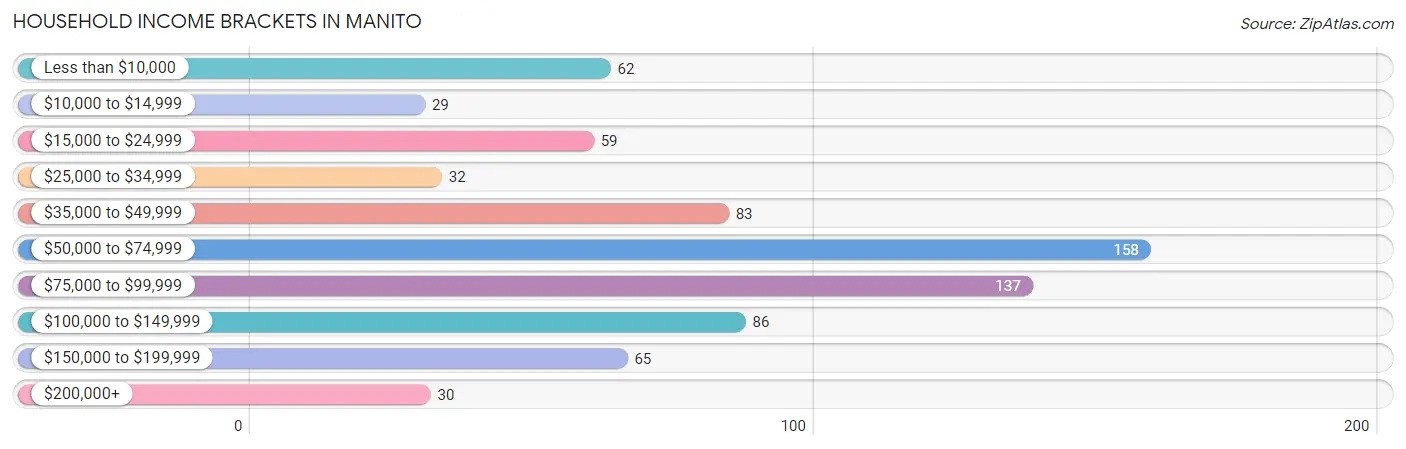
| Income Bracket | # Households | % Households |
| Less than $10,000 | 62 | 8.4% |
| $10,000 to $14,999 | 29 | 3.9% |
| $15,000 to $24,999 | 59 | 8.0% |
| $25,000 to $34,999 | 32 | 4.3% |
| $35,000 to $49,999 | 83 | 11.2% |
| $50,000 to $74,999 | 158 | 21.3% |
| $75,000 to $99,999 | 137 | 18.5% |
| $100,000 to $149,999 | 86 | 11.6% |
| $150,000 to $199,999 | 65 | 8.8% |
| $200,000+ | 30 | 4.0% |
Household Income by Householder Age in Manito
The median household income in Manito is $65,066, with the highest median household income of $86,625 found in the 45 to 64 years age bracket for the primary householder. A total of 207 households (27.9%) fall into this category. Meanwhile, the 15 to 24 years age bracket for the primary householder has the lowest median household income of $41,607, with 55 households (7.4%) in this group.
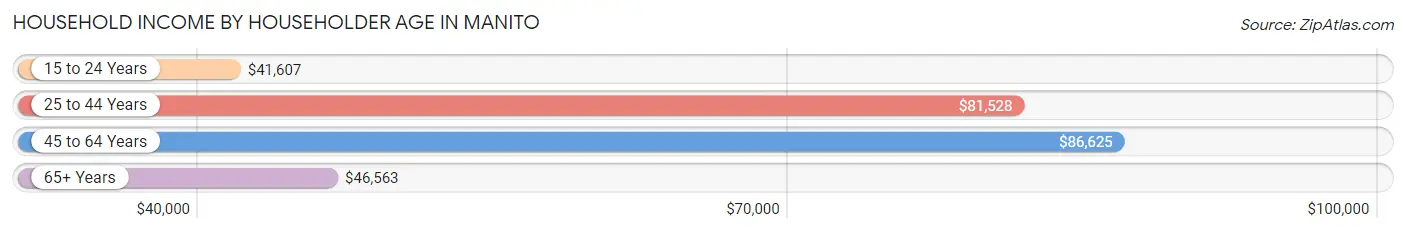
| Income Bracket | # Households | Median Income |
| 15 to 24 Years | 55 (7.4%) | $41,607 |
| 25 to 44 Years | 185 (25.0%) | $81,528 |
| 45 to 64 Years | 207 (27.9%) | $86,625 |
| 65+ Years | 294 (39.7%) | $46,563 |
| Total | 741 (100.0%) | $65,066 |
Poverty in Manito
Income Below Poverty by Sex and Age in Manito
With 13.2% poverty level for males and 12.8% for females among the residents of Manito, 5 year old males and 18 to 24 year old females are the most vulnerable to poverty, with 3 males (100.0%) and 24 females (37.5%) in their respective age groups living below the poverty level.
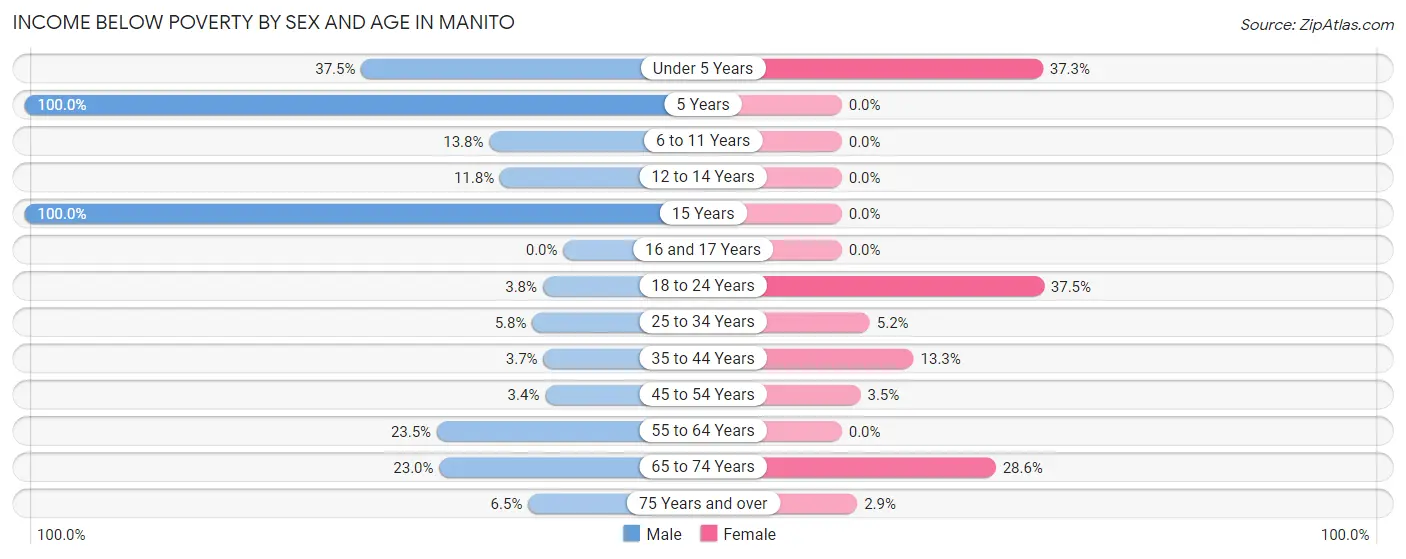
| Age Bracket | Male | Female |
| Under 5 Years | 21 (37.5%) | 25 (37.3%) |
| 5 Years | 3 (100.0%) | 0 (0.0%) |
| 6 to 11 Years | 11 (13.8%) | 0 (0.0%) |
| 12 to 14 Years | 2 (11.8%) | 0 (0.0%) |
| 15 Years | 2 (100.0%) | 0 (0.0%) |
| 16 and 17 Years | 0 (0.0%) | 0 (0.0%) |
| 18 to 24 Years | 3 (3.8%) | 24 (37.5%) |
| 25 to 34 Years | 6 (5.8%) | 5 (5.2%) |
| 35 to 44 Years | 3 (3.7%) | 12 (13.3%) |
| 45 to 54 Years | 4 (3.4%) | 4 (3.5%) |
| 55 to 64 Years | 19 (23.5%) | 0 (0.0%) |
| 65 to 74 Years | 29 (23.0%) | 38 (28.6%) |
| 75 Years and over | 3 (6.5%) | 4 (2.9%) |
| Total | 106 (13.2%) | 112 (12.8%) |
Income Above Poverty by Sex and Age in Manito
According to the poverty statistics in Manito, males aged 16 and 17 years and females aged 5 years are the age groups that are most secure financially, with 100.0% of males and 100.0% of females in these age groups living above the poverty line.
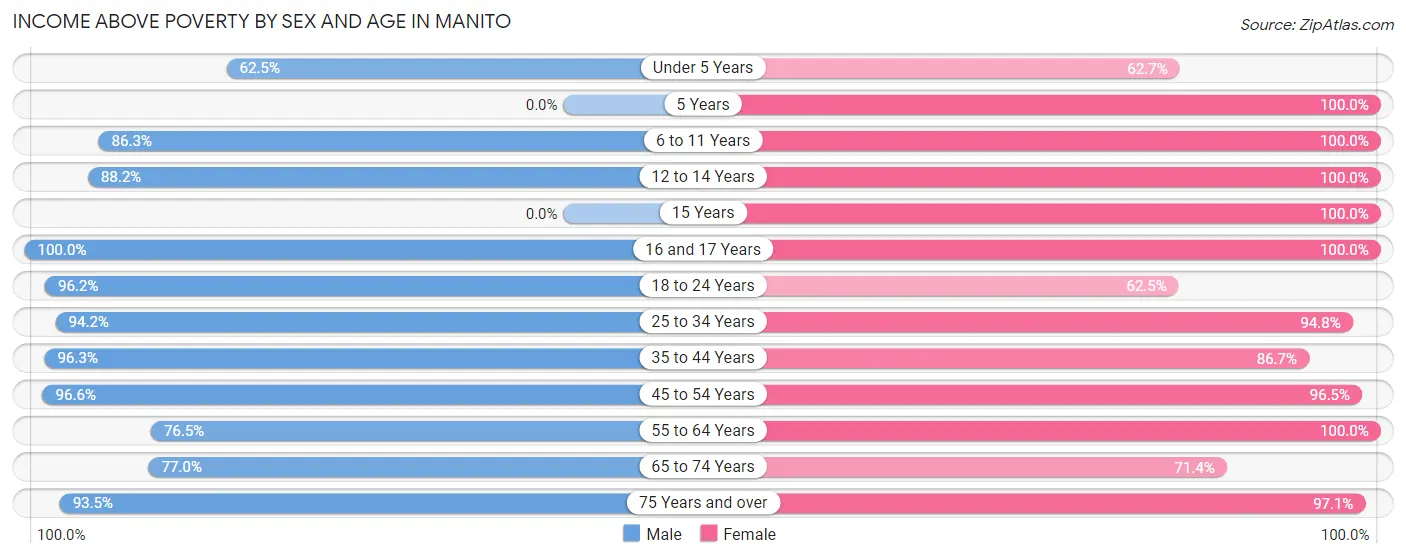
| Age Bracket | Male | Female |
| Under 5 Years | 35 (62.5%) | 42 (62.7%) |
| 5 Years | 0 (0.0%) | 4 (100.0%) |
| 6 to 11 Years | 69 (86.3%) | 38 (100.0%) |
| 12 to 14 Years | 15 (88.2%) | 30 (100.0%) |
| 15 Years | 0 (0.0%) | 3 (100.0%) |
| 16 and 17 Years | 8 (100.0%) | 34 (100.0%) |
| 18 to 24 Years | 76 (96.2%) | 40 (62.5%) |
| 25 to 34 Years | 98 (94.2%) | 91 (94.8%) |
| 35 to 44 Years | 78 (96.3%) | 78 (86.7%) |
| 45 to 54 Years | 115 (96.6%) | 111 (96.5%) |
| 55 to 64 Years | 62 (76.5%) | 60 (100.0%) |
| 65 to 74 Years | 97 (77.0%) | 95 (71.4%) |
| 75 Years and over | 43 (93.5%) | 136 (97.1%) |
| Total | 696 (86.8%) | 762 (87.2%) |
Income Below Poverty Among Married-Couple Families in Manito
The poverty statistics for married-couple families in Manito show that 1.1% or 4 of the total 354 families live below the poverty line. Families with 3 or 4 children have the highest poverty rate of 6.9%, comprising of 2 families. On the other hand, families with 1 or 2 children have the lowest poverty rate of 0.0%, which includes 0 families.
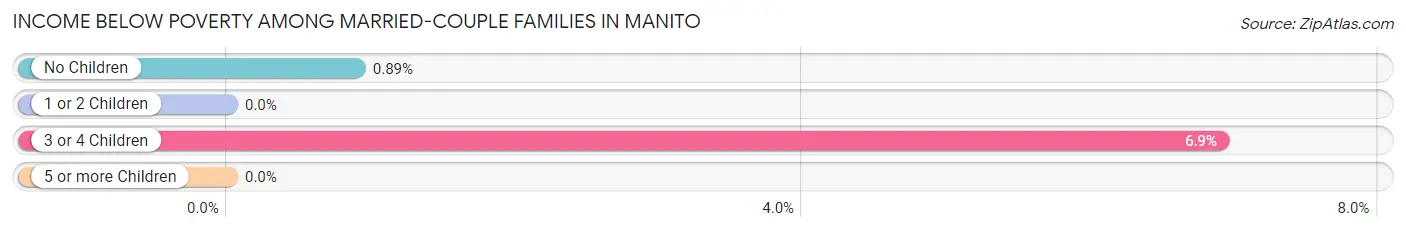
| Children | Above Poverty | Below Poverty |
| No Children | 222 (99.1%) | 2 (0.9%) |
| 1 or 2 Children | 101 (100.0%) | 0 (0.0%) |
| 3 or 4 Children | 27 (93.1%) | 2 (6.9%) |
| 5 or more Children | 0 (0.0%) | 0 (0.0%) |
| Total | 350 (98.9%) | 4 (1.1%) |
Income Below Poverty Among Single-Parent Households in Manito
According to the poverty data in Manito, 6.2% or 3 single-father households and 43.9% or 29 single-mother households are living below the poverty line. Among single-father households, those with no children have the highest poverty rate, with 3 households (8.6%) experiencing poverty. Likewise, among single-mother households, those with 3 or 4 children have the highest poverty rate, with 18 households (100.0%) falling below the poverty line.
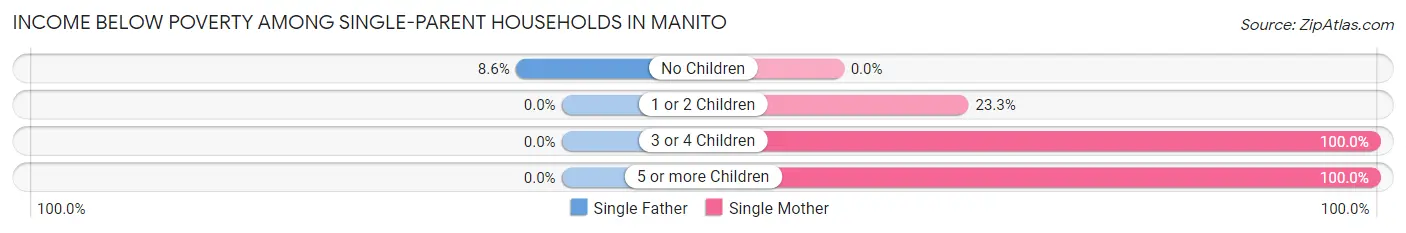
| Children | Single Father | Single Mother |
| No Children | 3 (8.6%) | 0 (0.0%) |
| 1 or 2 Children | 0 (0.0%) | 10 (23.3%) |
| 3 or 4 Children | 0 (0.0%) | 18 (100.0%) |
| 5 or more Children | 0 (0.0%) | 1 (100.0%) |
| Total | 3 (6.2%) | 29 (43.9%) |
Income Below Poverty Among Married-Couple vs Single-Parent Households in Manito
The poverty data for Manito shows that 4 of the married-couple family households (1.1%) and 32 of the single-parent households (28.1%) are living below the poverty level. Within the married-couple family households, those with 3 or 4 children have the highest poverty rate, with 2 households (6.9%) falling below the poverty line. Among the single-parent households, those with 3 or 4 children have the highest poverty rate, with 18 household (100.0%) living below poverty.
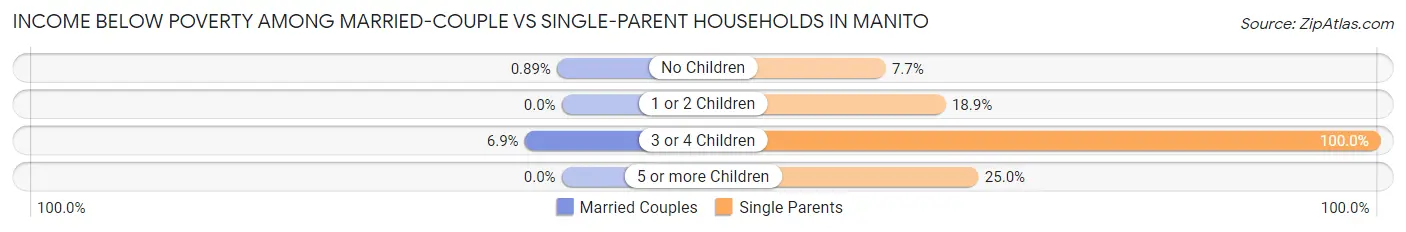
| Children | Married-Couple Families | Single-Parent Households |
| No Children | 2 (0.9%) | 3 (7.7%) |
| 1 or 2 Children | 0 (0.0%) | 10 (18.9%) |
| 3 or 4 Children | 2 (6.9%) | 18 (100.0%) |
| 5 or more Children | 0 (0.0%) | 1 (25.0%) |
| Total | 4 (1.1%) | 32 (28.1%) |
Race in Manito
The most populous races in Manito are White / Caucasian (1,671 | 97.2%), Hispanic or Latino (61 | 3.5%), and Two or more Races (19 | 1.1%).
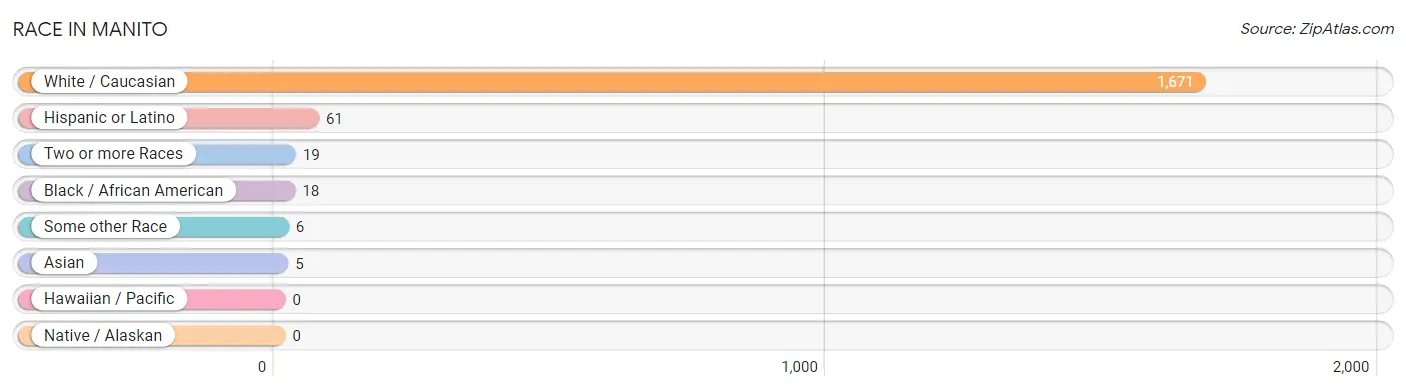
| Race | # Population | % Population |
| Asian | 5 | 0.3% |
| Black / African American | 18 | 1.1% |
| Hawaiian / Pacific | 0 | 0.0% |
| Hispanic or Latino | 61 | 3.5% |
| Native / Alaskan | 0 | 0.0% |
| White / Caucasian | 1,671 | 97.2% |
| Two or more Races | 19 | 1.1% |
| Some other Race | 6 | 0.4% |
| Total | 1,719 | 100.0% |
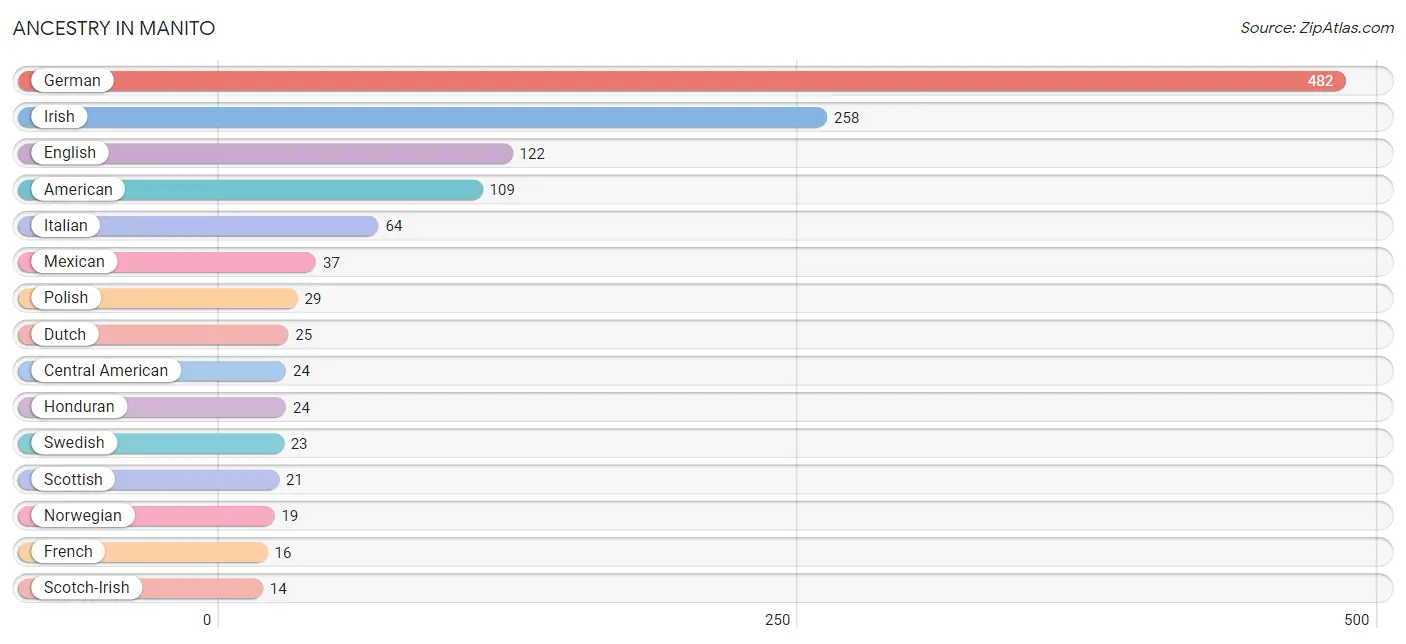
Ancestry in Manito
The most populous ancestries reported in Manito are German (482 | 28.0%), Irish (258 | 15.0%), English (122 | 7.1%), American (109 | 6.3%), and Italian (64 | 3.7%), together accounting for 60.2% of all Manito residents.
| Ancestry | # Population | % Population |
| American | 109 | 6.3% |
| Belgian | 4 | 0.2% |
| British | 3 | 0.2% |
| Central American | 24 | 1.4% |
| Cherokee | 5 | 0.3% |
| Czech | 4 | 0.2% |
| Danish | 6 | 0.4% |
| Dutch | 25 | 1.5% |
| English | 122 | 7.1% |
| European | 7 | 0.4% |
| French | 16 | 0.9% |
| German | 482 | 28.0% |
| Honduran | 24 | 1.4% |
| Irish | 258 | 15.0% |
| Italian | 64 | 3.7% |
| Korean | 5 | 0.3% |
| Lithuanian | 2 | 0.1% |
| Mexican | 37 | 2.1% |
| Northern European | 3 | 0.2% |
| Norwegian | 19 | 1.1% |
| Polish | 29 | 1.7% |
| Scandinavian | 3 | 0.2% |
| Scotch-Irish | 14 | 0.8% |
| Scottish | 21 | 1.2% |
| Swedish | 23 | 1.3% |
| Swiss | 4 | 0.2% |
| Welsh | 2 | 0.1% | View All 27 Rows |
Immigrants in Manito
The most numerous immigrant groups reported in Manito came from Central America (12 | 0.7%), Latin America (12 | 0.7%), Mexico (12 | 0.7%), Asia (5 | 0.3%), and Philippines (5 | 0.3%), together accounting for 2.7% of all Manito residents.
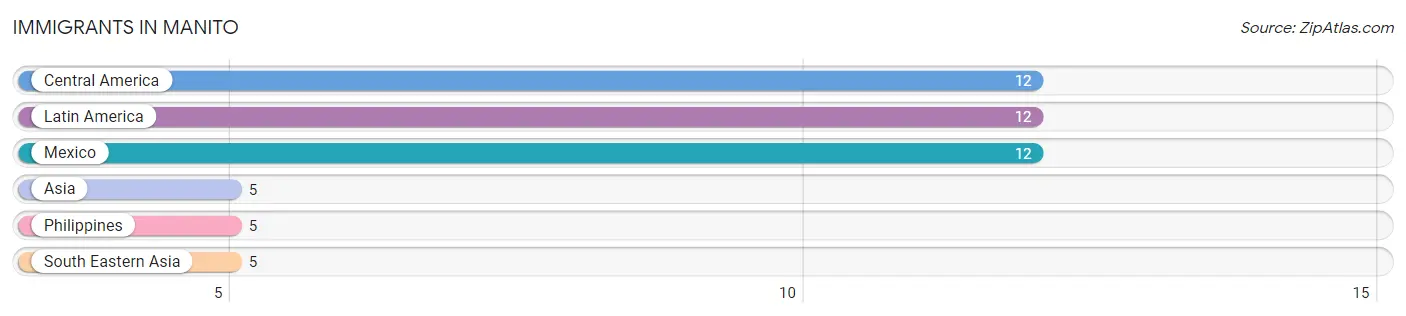
| Immigration Origin | # Population | % Population |
| Asia | 5 | 0.3% |
| Central America | 12 | 0.7% |
| Latin America | 12 | 0.7% |
| Mexico | 12 | 0.7% |
| Philippines | 5 | 0.3% |
| South Eastern Asia | 5 | 0.3% | View All 6 Rows |
Sex and Age in Manito
Sex and Age in Manito
The most populous age groups in Manito are 45 to 49 Years (85 | 10.4%) for men and 45 to 49 Years (95 | 10.5%) for women.
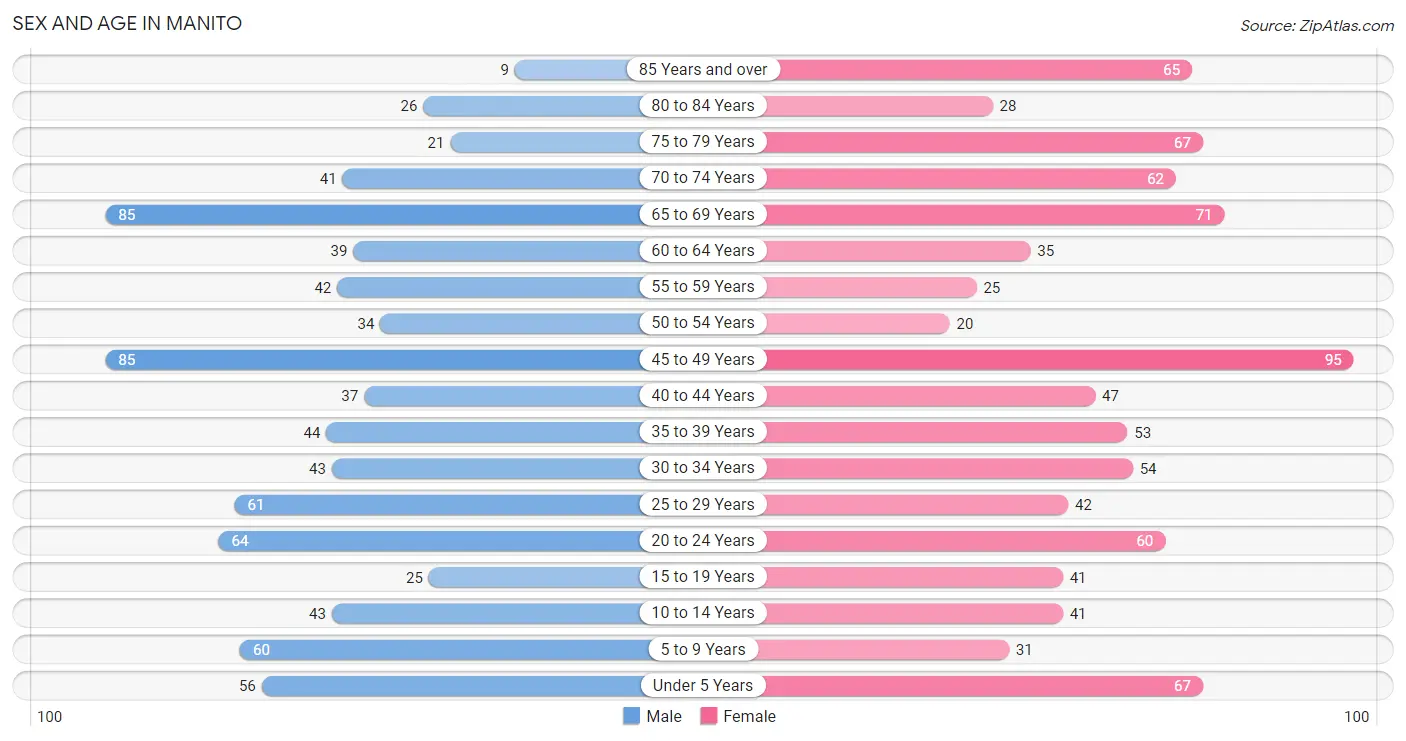
| Age Bracket | Male | Female |
| Under 5 Years | 56 (6.9%) | 67 (7.4%) |
| 5 to 9 Years | 60 (7.4%) | 31 (3.4%) |
| 10 to 14 Years | 43 (5.3%) | 41 (4.5%) |
| 15 to 19 Years | 25 (3.1%) | 41 (4.5%) |
| 20 to 24 Years | 64 (7.9%) | 60 (6.6%) |
| 25 to 29 Years | 61 (7.5%) | 42 (4.6%) |
| 30 to 34 Years | 43 (5.3%) | 54 (6.0%) |
| 35 to 39 Years | 44 (5.4%) | 53 (5.9%) |
| 40 to 44 Years | 37 (4.5%) | 47 (5.2%) |
| 45 to 49 Years | 85 (10.4%) | 95 (10.5%) |
| 50 to 54 Years | 34 (4.2%) | 20 (2.2%) |
| 55 to 59 Years | 42 (5.1%) | 25 (2.8%) |
| 60 to 64 Years | 39 (4.8%) | 35 (3.9%) |
| 65 to 69 Years | 85 (10.4%) | 71 (7.9%) |
| 70 to 74 Years | 41 (5.0%) | 62 (6.9%) |
| 75 to 79 Years | 21 (2.6%) | 67 (7.4%) |
| 80 to 84 Years | 26 (3.2%) | 28 (3.1%) |
| 85 Years and over | 9 (1.1%) | 65 (7.2%) |
| Total | 815 (100.0%) | 904 (100.0%) |
Families and Households in Manito
Median Family Size in Manito
The median family size in Manito is 2.74 persons per family, with single female/mother families (66 | 14.1%) accounting for the largest median family size of 2.82 persons per family. On the other hand, single male/father families (48 | 10.3%) represent the smallest median family size with 2.44 persons per family.
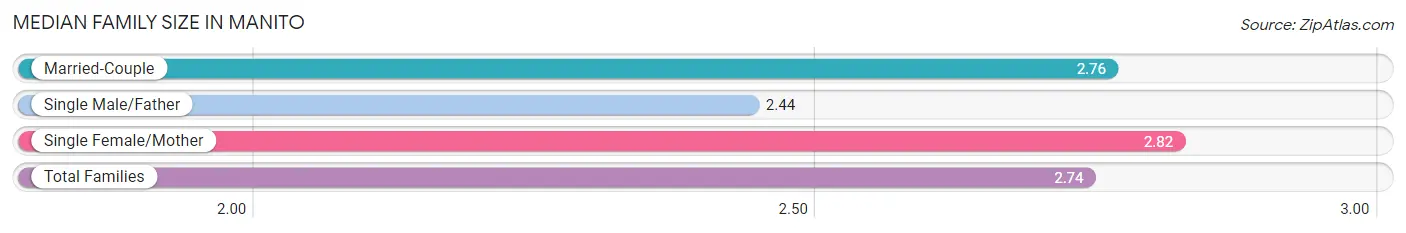
| Family Type | # Families | Family Size |
| Married-Couple | 354 (75.6%) | 2.76 |
| Single Male/Father | 48 (10.3%) | 2.44 |
| Single Female/Mother | 66 (14.1%) | 2.82 |
| Total Families | 468 (100.0%) | 2.74 |
Median Household Size in Manito
The median household size in Manito is 2.27 persons per household, with single female/mother households (66 | 8.9%) accounting for the largest median household size of 3.32 persons per household. non-family households (273 | 36.8%) represent the smallest median household size with 1.21 persons per household.
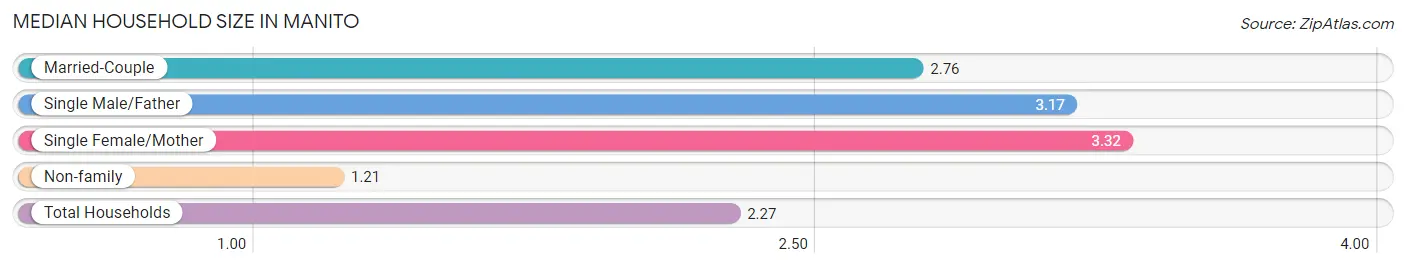
| Household Type | # Households | Household Size |
| Married-Couple | 354 (47.8%) | 2.76 |
| Single Male/Father | 48 (6.5%) | 3.17 |
| Single Female/Mother | 66 (8.9%) | 3.32 |
| Non-family | 273 (36.8%) | 1.21 |
| Total Households | 741 (100.0%) | 2.27 |
Household Size by Marriage Status in Manito
Out of a total of 741 households in Manito, 468 (63.2%) are family households, while 273 (36.8%) are nonfamily households. The most numerous type of family households are 2-person households, comprising 199, and the most common type of nonfamily households are 1-person households, comprising 216.
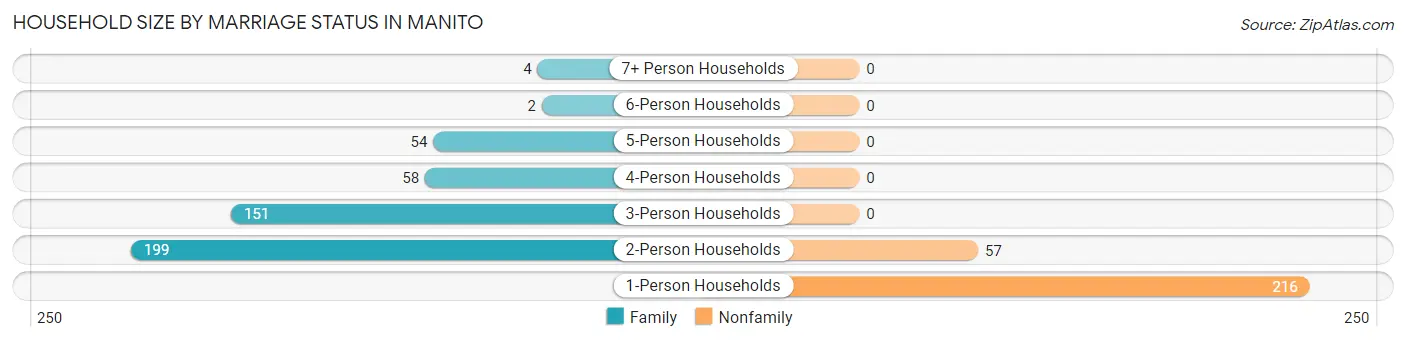
| Household Size | Family Households | Nonfamily Households |
| 1-Person Households | - | 216 (29.1%) |
| 2-Person Households | 199 (26.9%) | 57 (7.7%) |
| 3-Person Households | 151 (20.4%) | 0 (0.0%) |
| 4-Person Households | 58 (7.8%) | 0 (0.0%) |
| 5-Person Households | 54 (7.3%) | 0 (0.0%) |
| 6-Person Households | 2 (0.3%) | 0 (0.0%) |
| 7+ Person Households | 4 (0.5%) | 0 (0.0%) |
| Total | 468 (63.2%) | 273 (36.8%) |
Female Fertility in Manito
Fertility by Age in Manito
Average fertility rate in Manito is 96.0 births per 1,000 women. Women in the age bracket of 20 to 34 years have the highest fertility rate with 192.0 births per 1,000 women. Women in the age bracket of 20 to 34 years acount for 78.9% of all women with births.
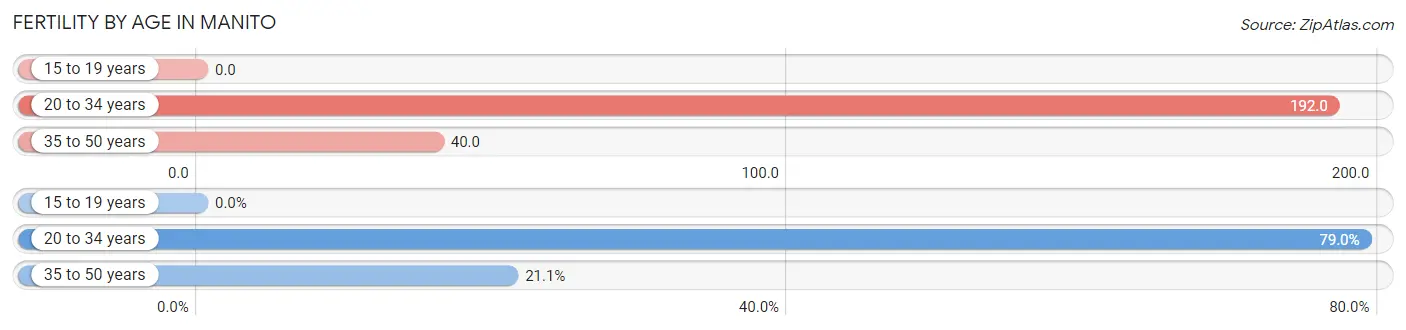
| Age Bracket | Women with Births | Births / 1,000 Women |
| 15 to 19 years | 0 (0.0%) | 0.0 |
| 20 to 34 years | 30 (78.9%) | 192.0 |
| 35 to 50 years | 8 (21.0%) | 40.0 |
| Total | 38 (100.0%) | 96.0 |
Fertility by Age by Marriage Status in Manito
52.6% of women with births (38) in Manito are married. The highest percentage of unmarried women with births falls into 20 to 34 years age bracket with 60.0% of them unmarried at the time of birth, while the lowest percentage of unmarried women with births belong to 35 to 50 years age bracket with 0.0% of them unmarried.
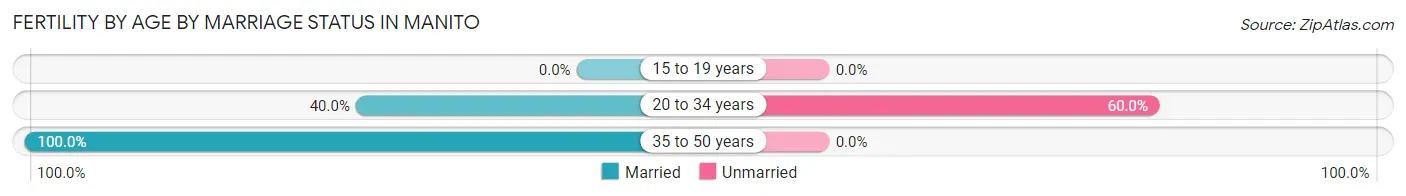
| Age Bracket | Married | Unmarried |
| 15 to 19 years | 0 (0.0%) | 0 (0.0%) |
| 20 to 34 years | 12 (40.0%) | 18 (60.0%) |
| 35 to 50 years | 8 (100.0%) | 0 (0.0%) |
| Total | 20 (52.6%) | 18 (47.4%) |
Fertility by Education in Manito
Average fertility rate in Manito is 96.0 births per 1,000 women. Women with the education attainment of high school diploma have the highest fertility rate of 279.0 births per 1,000 women, while women with the education attainment of college or associate's degree have the lowest fertility at 31.0 births per 1,000 women. Women with the education attainment of high school diploma represent 63.2% of all women with births.
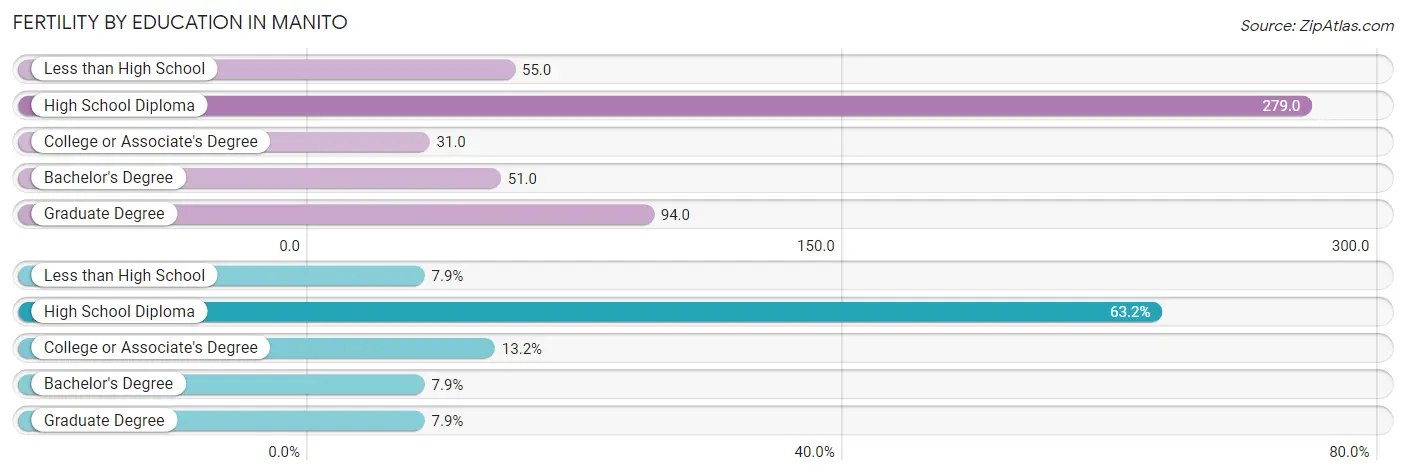
| Educational Attainment | Women with Births | Births / 1,000 Women |
| Less than High School | 3 (7.9%) | 55.0 |
| High School Diploma | 24 (63.2%) | 279.0 |
| College or Associate's Degree | 5 (13.2%) | 31.0 |
| Bachelor's Degree | 3 (7.9%) | 51.0 |
| Graduate Degree | 3 (7.9%) | 94.0 |
| Total | 38 (100.0%) | 96.0 |
Fertility by Education by Marriage Status in Manito
47.4% of women with births in Manito are unmarried. Women with the educational attainment of less than high school are most likely to be married with 100.0% of them married at childbirth, while women with the educational attainment of high school diploma are least likely to be married with 75.0% of them unmarried at childbirth.
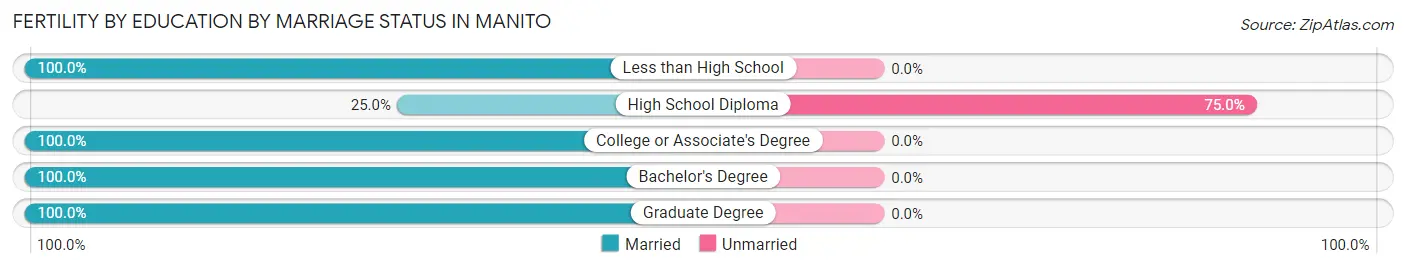
| Educational Attainment | Married | Unmarried |
| Less than High School | 3 (100.0%) | 0 (0.0%) |
| High School Diploma | 6 (25.0%) | 18 (75.0%) |
| College or Associate's Degree | 5 (100.0%) | 0 (0.0%) |
| Bachelor's Degree | 3 (100.0%) | 0 (0.0%) |
| Graduate Degree | 3 (100.0%) | 0 (0.0%) |
| Total | 20 (52.6%) | 18 (47.4%) |
Employment Characteristics in Manito
Employment by Class of Employer in Manito
Among the 785 employed individuals in Manito, private company employees (629 | 80.1%), not-for-profit organizations (53 | 6.8%), and local government employees (47 | 6.0%) make up the most common classes of employment.
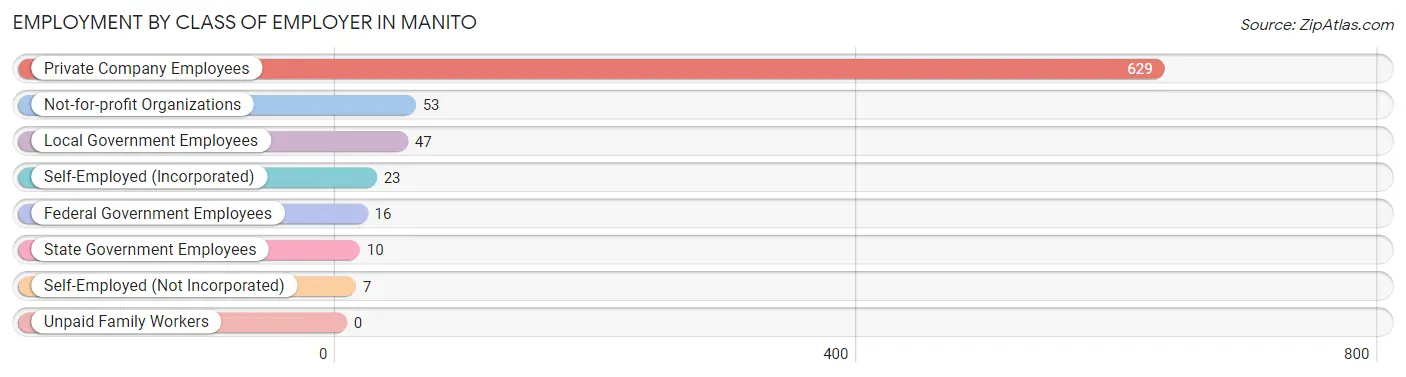
| Employer Class | # Employees | % Employees |
| Private Company Employees | 629 | 80.1% |
| Self-Employed (Incorporated) | 23 | 2.9% |
| Self-Employed (Not Incorporated) | 7 | 0.9% |
| Not-for-profit Organizations | 53 | 6.8% |
| Local Government Employees | 47 | 6.0% |
| State Government Employees | 10 | 1.3% |
| Federal Government Employees | 16 | 2.0% |
| Unpaid Family Workers | 0 | 0.0% |
| Total | 785 | 100.0% |
Employment Status by Age in Manito
According to the labor force statistics for Manito, out of the total population over 16 years of age (1,416), 56.9% or 806 individuals are in the labor force, with 2.4% or 19 of them unemployed. The age group with the highest labor force participation rate is 25 to 29 years, with 100.0% or 103 individuals in the labor force. Within the labor force, the 16 to 19 years age range has the highest percentage of unemployed individuals, with 18.2% or 4 of them being unemployed.
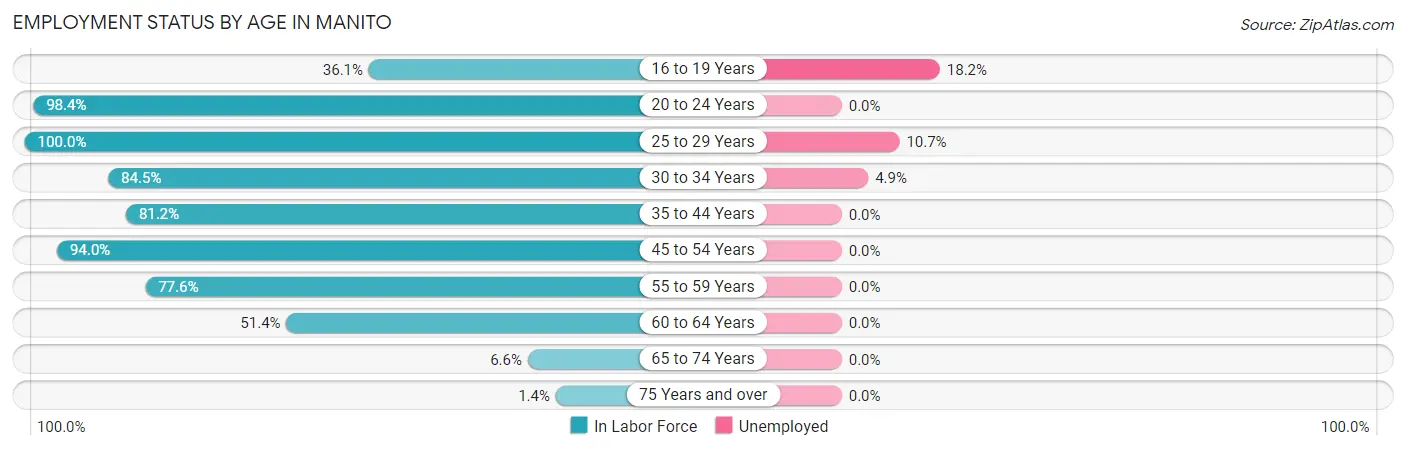
| Age Bracket | In Labor Force | Unemployed |
| 16 to 19 Years | 22 (36.1%) | 4 (18.2%) |
| 20 to 24 Years | 122 (98.4%) | 0 (0.0%) |
| 25 to 29 Years | 103 (100.0%) | 11 (10.7%) |
| 30 to 34 Years | 82 (84.5%) | 4 (4.9%) |
| 35 to 44 Years | 147 (81.2%) | 0 (0.0%) |
| 45 to 54 Years | 220 (94.0%) | 0 (0.0%) |
| 55 to 59 Years | 52 (77.6%) | 0 (0.0%) |
| 60 to 64 Years | 38 (51.4%) | 0 (0.0%) |
| 65 to 74 Years | 17 (6.6%) | 0 (0.0%) |
| 75 Years and over | 3 (1.4%) | 0 (0.0%) |
| Total | 806 (56.9%) | 19 (2.4%) |
Employment Status by Educational Attainment in Manito
According to labor force statistics for Manito, 84.9% of individuals (642) out of the total population between 25 and 64 years of age (756) are in the labor force, with 2.3% or 15 of them being unemployed. The group with the highest labor force participation rate are those with the educational attainment of college / associate degree, with 88.7% or 282 individuals in the labor force. Within the labor force, individuals with less than high school education have the highest percentage of unemployment, with 11.5% or 6 of them being unemployed.
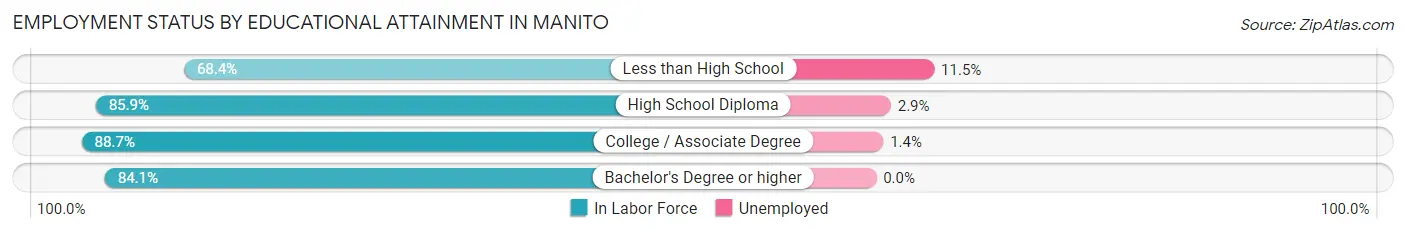
| Educational Attainment | In Labor Force | Unemployed |
| Less than High School | 52 (68.4%) | 9 (11.5%) |
| High School Diploma | 170 (85.9%) | 6 (2.9%) |
| College / Associate Degree | 282 (88.7%) | 4 (1.4%) |
| Bachelor's Degree or higher | 138 (84.1%) | 0 (0.0%) |
| Total | 642 (84.9%) | 17 (2.3%) |
Employment Occupations by Sex in Manito
Management, Business, Science and Arts Occupations
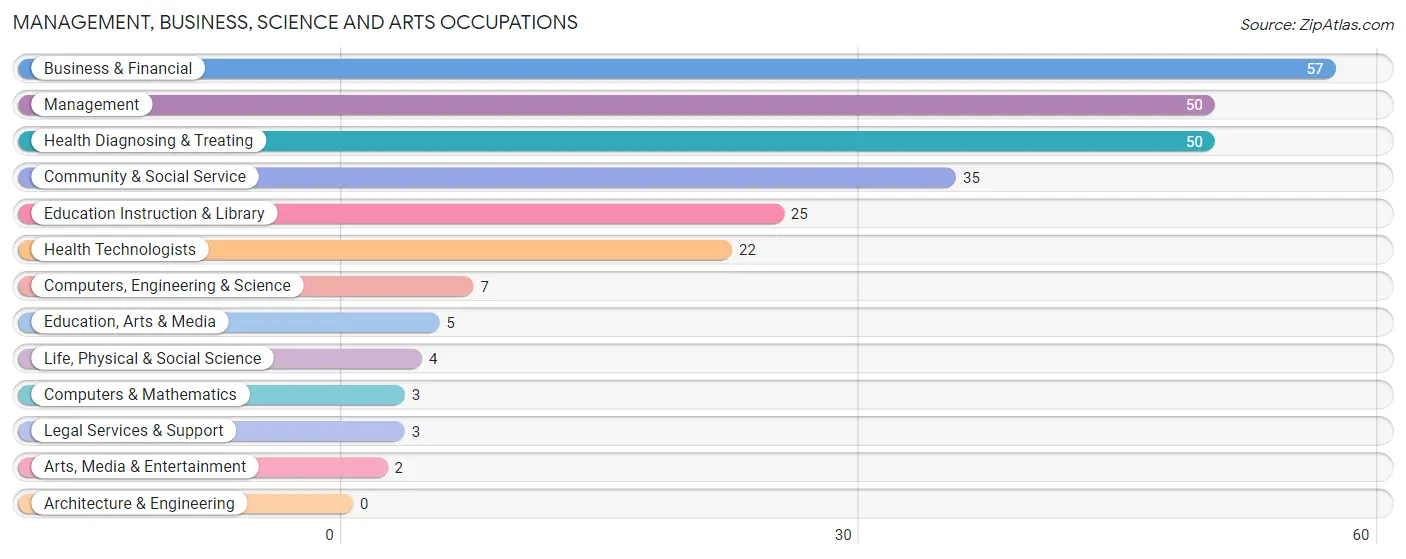
The most common Management, Business, Science and Arts occupations in Manito are Business & Financial (57 | 7.2%), Management (50 | 6.4%), Health Diagnosing & Treating (50 | 6.4%), Community & Social Service (35 | 4.4%), and Education Instruction & Library (25 | 3.2%).
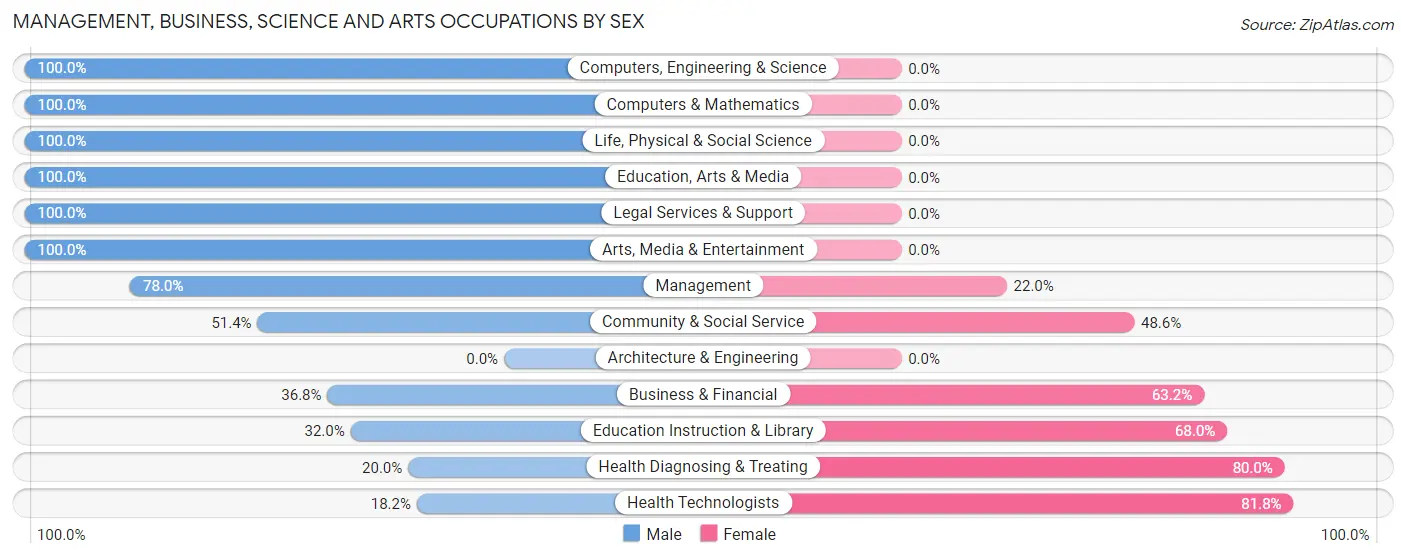
Management, Business, Science and Arts Occupations by Sex
Within the Management, Business, Science and Arts occupations in Manito, the most male-oriented occupations are Computers, Engineering & Science (100.0%), Computers & Mathematics (100.0%), and Life, Physical & Social Science (100.0%), while the most female-oriented occupations are Health Technologists (81.8%), Health Diagnosing & Treating (80.0%), and Education Instruction & Library (68.0%).
| Occupation | Male | Female |
| Management | 39 (78.0%) | 11 (22.0%) |
| Business & Financial | 21 (36.8%) | 36 (63.2%) |
| Computers, Engineering & Science | 7 (100.0%) | 0 (0.0%) |
| Computers & Mathematics | 3 (100.0%) | 0 (0.0%) |
| Architecture & Engineering | 0 (0.0%) | 0 (0.0%) |
| Life, Physical & Social Science | 4 (100.0%) | 0 (0.0%) |
| Community & Social Service | 18 (51.4%) | 17 (48.6%) |
| Education, Arts & Media | 5 (100.0%) | 0 (0.0%) |
| Legal Services & Support | 3 (100.0%) | 0 (0.0%) |
| Education Instruction & Library | 8 (32.0%) | 17 (68.0%) |
| Arts, Media & Entertainment | 2 (100.0%) | 0 (0.0%) |
| Health Diagnosing & Treating | 10 (20.0%) | 40 (80.0%) |
| Health Technologists | 4 (18.2%) | 18 (81.8%) |
| Total (Category) | 95 (47.7%) | 104 (52.3%) |
| Total (Overall) | 413 (52.5%) | 374 (47.5%) |
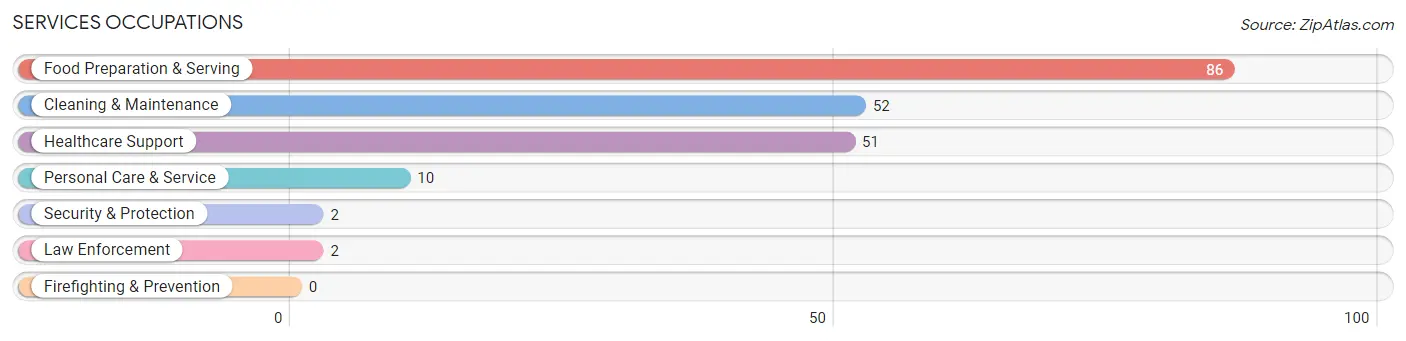
Services Occupations
The most common Services occupations in Manito are Food Preparation & Serving (86 | 10.9%), Cleaning & Maintenance (52 | 6.6%), Healthcare Support (51 | 6.5%), Personal Care & Service (10 | 1.3%), and Security & Protection (2 | 0.3%).
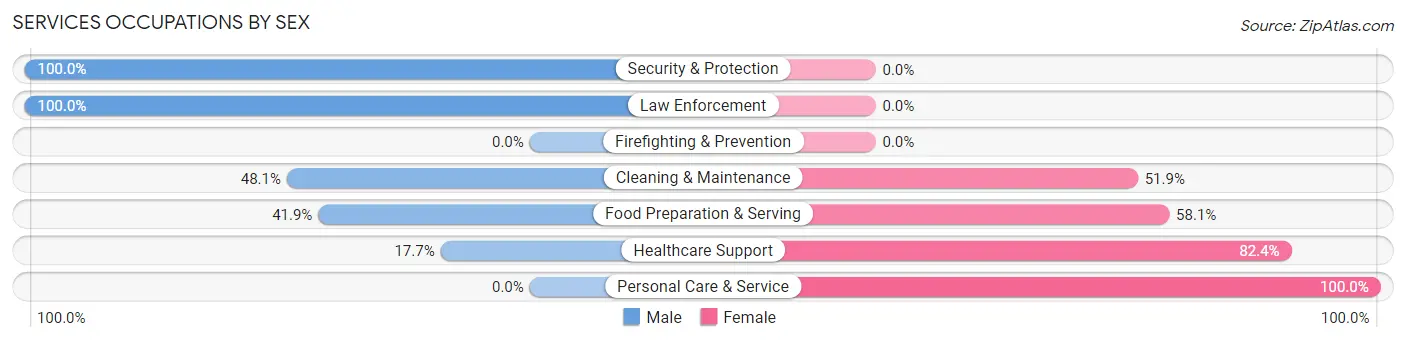
Services Occupations by Sex
Within the Services occupations in Manito, the most male-oriented occupations are Security & Protection (100.0%), Law Enforcement (100.0%), and Cleaning & Maintenance (48.1%), while the most female-oriented occupations are Personal Care & Service (100.0%), Healthcare Support (82.4%), and Food Preparation & Serving (58.1%).
| Occupation | Male | Female |
| Healthcare Support | 9 (17.6%) | 42 (82.4%) |
| Security & Protection | 2 (100.0%) | 0 (0.0%) |
| Firefighting & Prevention | 0 (0.0%) | 0 (0.0%) |
| Law Enforcement | 2 (100.0%) | 0 (0.0%) |
| Food Preparation & Serving | 36 (41.9%) | 50 (58.1%) |
| Cleaning & Maintenance | 25 (48.1%) | 27 (51.9%) |
| Personal Care & Service | 0 (0.0%) | 10 (100.0%) |
| Total (Category) | 72 (35.8%) | 129 (64.2%) |
| Total (Overall) | 413 (52.5%) | 374 (47.5%) |
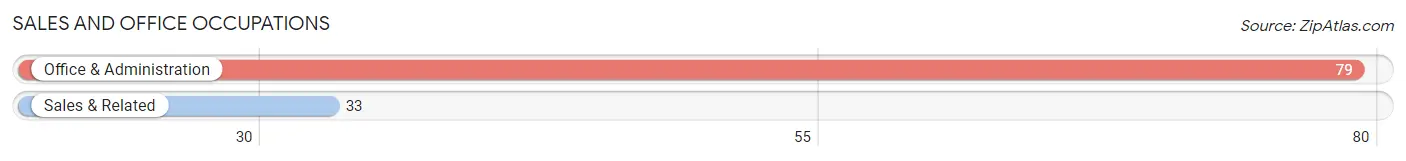
Sales and Office Occupations
The most common Sales and Office occupations in Manito are Office & Administration (79 | 10.0%), and Sales & Related (33 | 4.2%).
Sales and Office Occupations by Sex
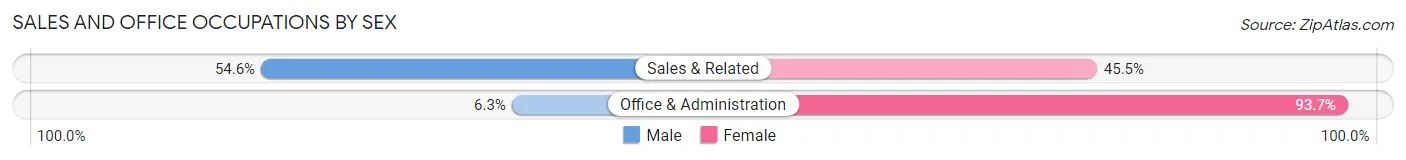
| Occupation | Male | Female |
| Sales & Related | 18 (54.5%) | 15 (45.5%) |
| Office & Administration | 5 (6.3%) | 74 (93.7%) |
| Total (Category) | 23 (20.5%) | 89 (79.5%) |
| Total (Overall) | 413 (52.5%) | 374 (47.5%) |
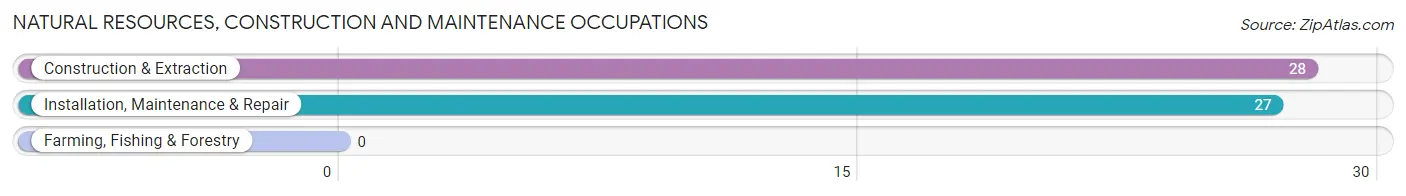
Natural Resources, Construction and Maintenance Occupations
The most common Natural Resources, Construction and Maintenance occupations in Manito are Construction & Extraction (28 | 3.6%), and Installation, Maintenance & Repair (27 | 3.4%).
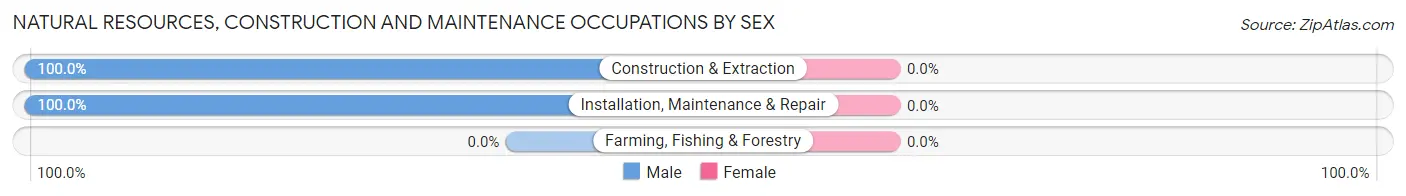
Natural Resources, Construction and Maintenance Occupations by Sex
| Occupation | Male | Female |
| Farming, Fishing & Forestry | 0 (0.0%) | 0 (0.0%) |
| Construction & Extraction | 28 (100.0%) | 0 (0.0%) |
| Installation, Maintenance & Repair | 27 (100.0%) | 0 (0.0%) |
| Total (Category) | 55 (100.0%) | 0 (0.0%) |
| Total (Overall) | 413 (52.5%) | 374 (47.5%) |
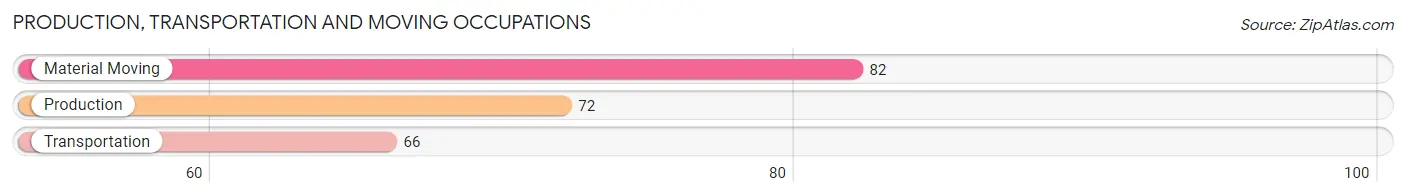
Production, Transportation and Moving Occupations
The most common Production, Transportation and Moving occupations in Manito are Material Moving (82 | 10.4%), Production (72 | 9.1%), and Transportation (66 | 8.4%).
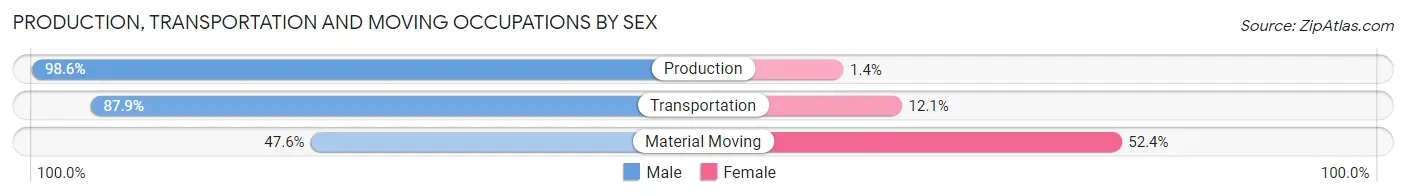
Production, Transportation and Moving Occupations by Sex
| Occupation | Male | Female |
| Production | 71 (98.6%) | 1 (1.4%) |
| Transportation | 58 (87.9%) | 8 (12.1%) |
| Material Moving | 39 (47.6%) | 43 (52.4%) |
| Total (Category) | 168 (76.4%) | 52 (23.6%) |
| Total (Overall) | 413 (52.5%) | 374 (47.5%) |
Employment Industries by Sex in Manito
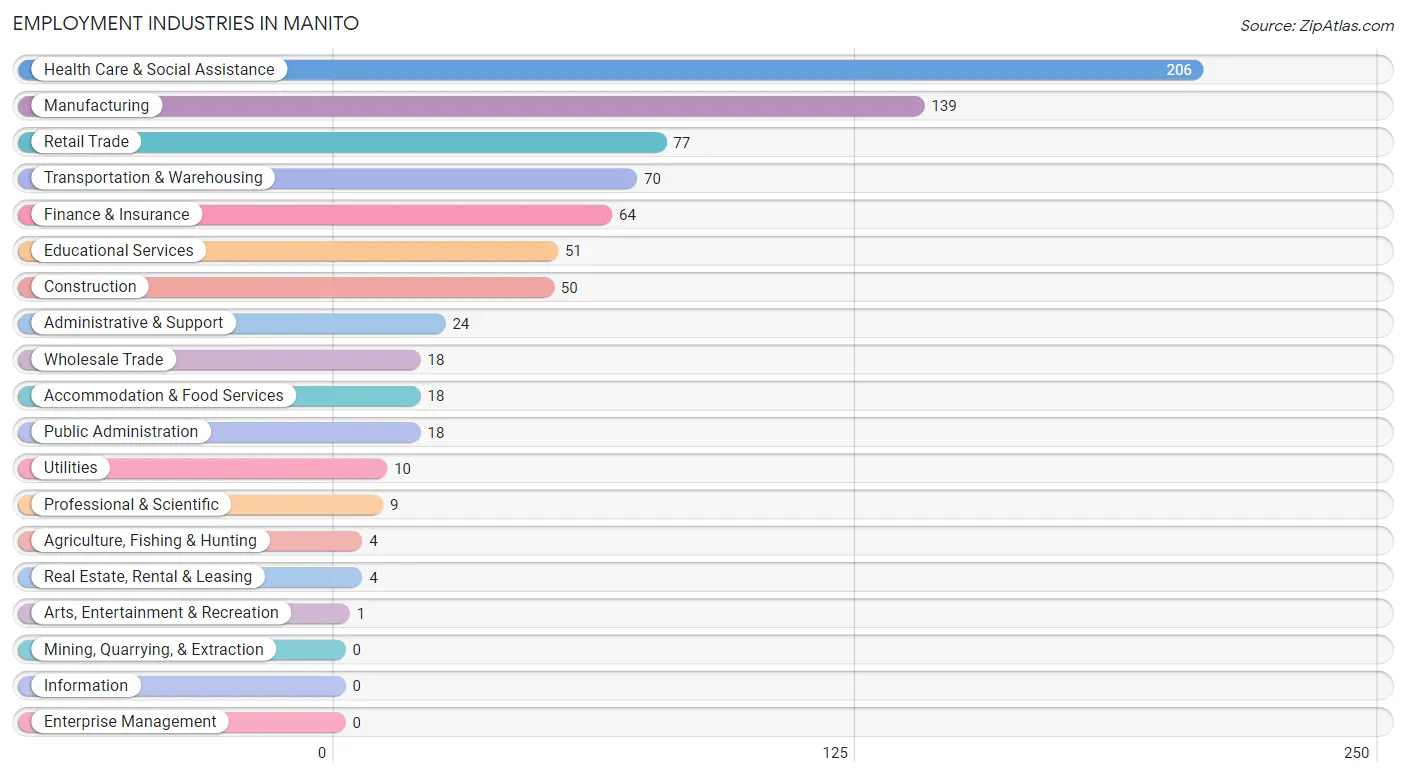
Employment Industries in Manito
The major employment industries in Manito include Health Care & Social Assistance (206 | 26.2%), Manufacturing (139 | 17.7%), Retail Trade (77 | 9.8%), Transportation & Warehousing (70 | 8.9%), and Finance & Insurance (64 | 8.1%).
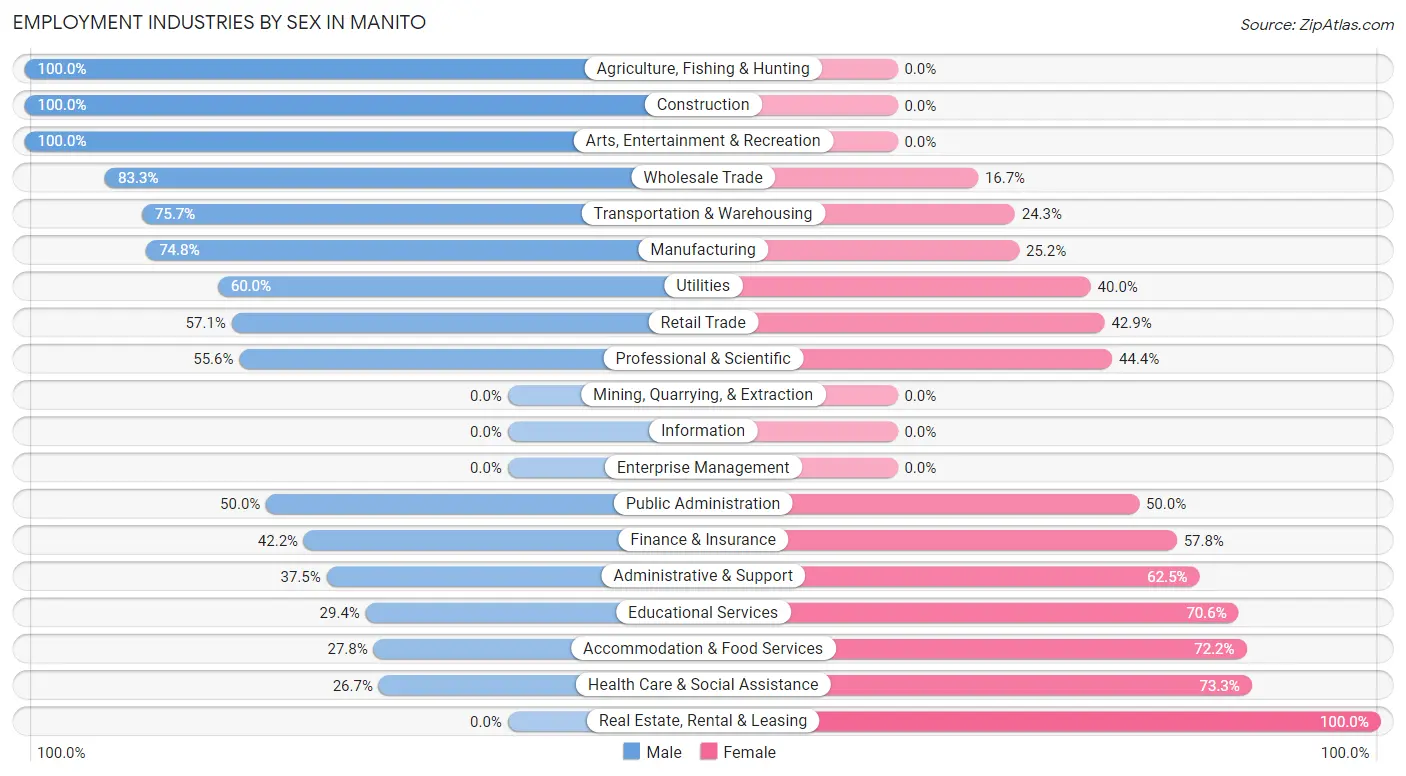
Employment Industries by Sex in Manito
The Manito industries that see more men than women are Agriculture, Fishing & Hunting (100.0%), Construction (100.0%), and Arts, Entertainment & Recreation (100.0%), whereas the industries that tend to have a higher number of women are Real Estate, Rental & Leasing (100.0%), Health Care & Social Assistance (73.3%), and Accommodation & Food Services (72.2%).
| Industry | Male | Female |
| Agriculture, Fishing & Hunting | 4 (100.0%) | 0 (0.0%) |
| Mining, Quarrying, & Extraction | 0 (0.0%) | 0 (0.0%) |
| Construction | 50 (100.0%) | 0 (0.0%) |
| Manufacturing | 104 (74.8%) | 35 (25.2%) |
| Wholesale Trade | 15 (83.3%) | 3 (16.7%) |
| Retail Trade | 44 (57.1%) | 33 (42.9%) |
| Transportation & Warehousing | 53 (75.7%) | 17 (24.3%) |
| Utilities | 6 (60.0%) | 4 (40.0%) |
| Information | 0 (0.0%) | 0 (0.0%) |
| Finance & Insurance | 27 (42.2%) | 37 (57.8%) |
| Real Estate, Rental & Leasing | 0 (0.0%) | 4 (100.0%) |
| Professional & Scientific | 5 (55.6%) | 4 (44.4%) |
| Enterprise Management | 0 (0.0%) | 0 (0.0%) |
| Administrative & Support | 9 (37.5%) | 15 (62.5%) |
| Educational Services | 15 (29.4%) | 36 (70.6%) |
| Health Care & Social Assistance | 55 (26.7%) | 151 (73.3%) |
| Arts, Entertainment & Recreation | 1 (100.0%) | 0 (0.0%) |
| Accommodation & Food Services | 5 (27.8%) | 13 (72.2%) |
| Public Administration | 9 (50.0%) | 9 (50.0%) |
| Total | 413 (52.5%) | 374 (47.5%) |
Education in Manito
School Enrollment in Manito
The most common levels of schooling among the 315 students in Manito are elementary school (72 | 22.9%), middle school (69 | 21.9%), and high school (60 | 19.1%).
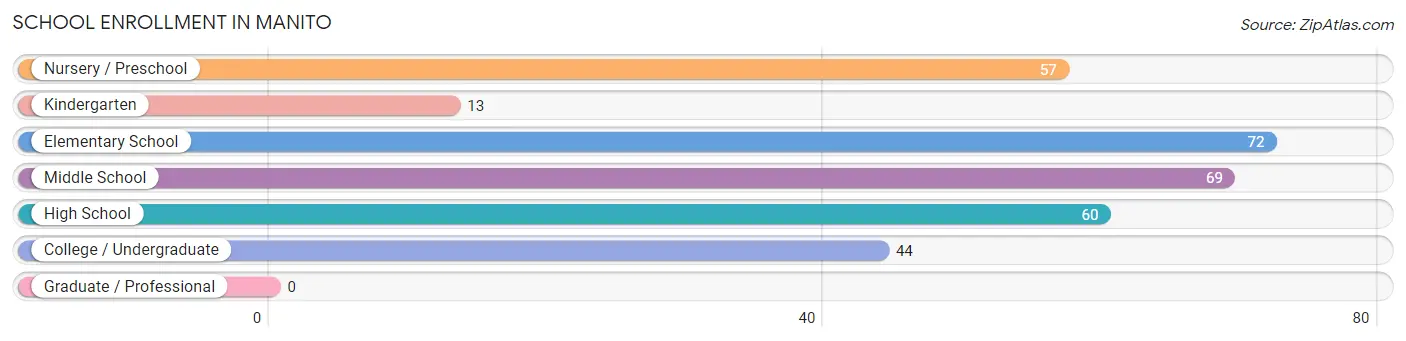
| School Level | # Students | % Students |
| Nursery / Preschool | 57 | 18.1% |
| Kindergarten | 13 | 4.1% |
| Elementary School | 72 | 22.9% |
| Middle School | 69 | 21.9% |
| High School | 60 | 19.1% |
| College / Undergraduate | 44 | 14.0% |
| Graduate / Professional | 0 | 0.0% |
| Total | 315 | 100.0% |
School Enrollment by Age by Funding Source in Manito
Out of a total of 315 students who are enrolled in schools in Manito, 41 (13.0%) attend a private institution, while the remaining 274 (87.0%) are enrolled in public schools. The age group of 3 to 4 year olds has the highest likelihood of being enrolled in private schools, with 18 (32.7% in the age bracket) enrolled. Conversely, the age group of 18 to 19 year olds has the lowest likelihood of being enrolled in a private school, with 9 (100.0% in the age bracket) attending a public institution.
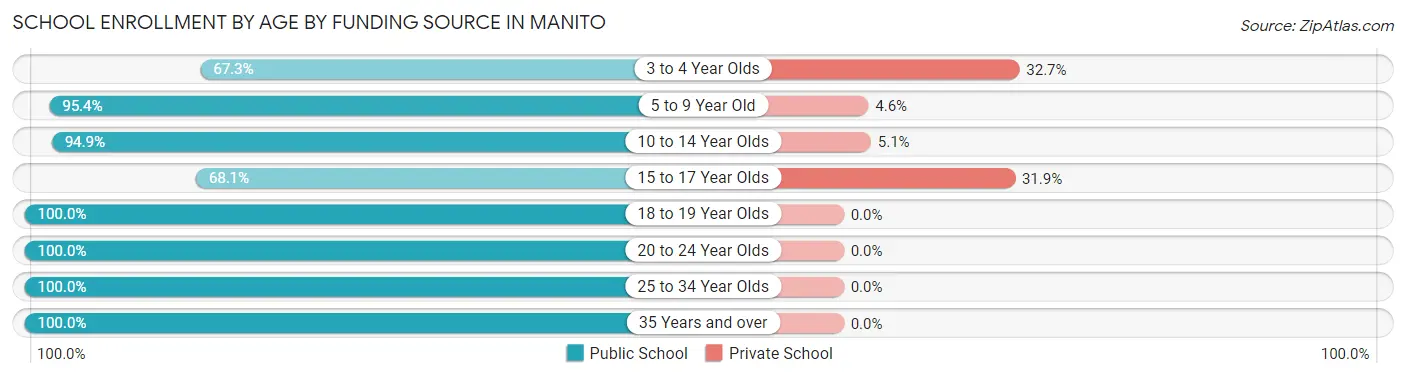
| Age Bracket | Public School | Private School |
| 3 to 4 Year Olds | 37 (67.3%) | 18 (32.7%) |
| 5 to 9 Year Old | 83 (95.4%) | 4 (4.6%) |
| 10 to 14 Year Olds | 75 (94.9%) | 4 (5.1%) |
| 15 to 17 Year Olds | 32 (68.1%) | 15 (31.9%) |
| 18 to 19 Year Olds | 9 (100.0%) | 0 (0.0%) |
| 20 to 24 Year Olds | 29 (100.0%) | 0 (0.0%) |
| 25 to 34 Year Olds | 3 (100.0%) | 0 (0.0%) |
| 35 Years and over | 6 (100.0%) | 0 (0.0%) |
| Total | 274 (87.0%) | 41 (13.0%) |
Educational Attainment by Field of Study in Manito
Business (53 | 22.0%), education (39 | 16.2%), science & technology (38 | 15.8%), bio, nature & agricultural (32 | 13.3%), and arts & humanities (19 | 7.9%) are the most common fields of study among 241 individuals in Manito who have obtained a bachelor's degree or higher.
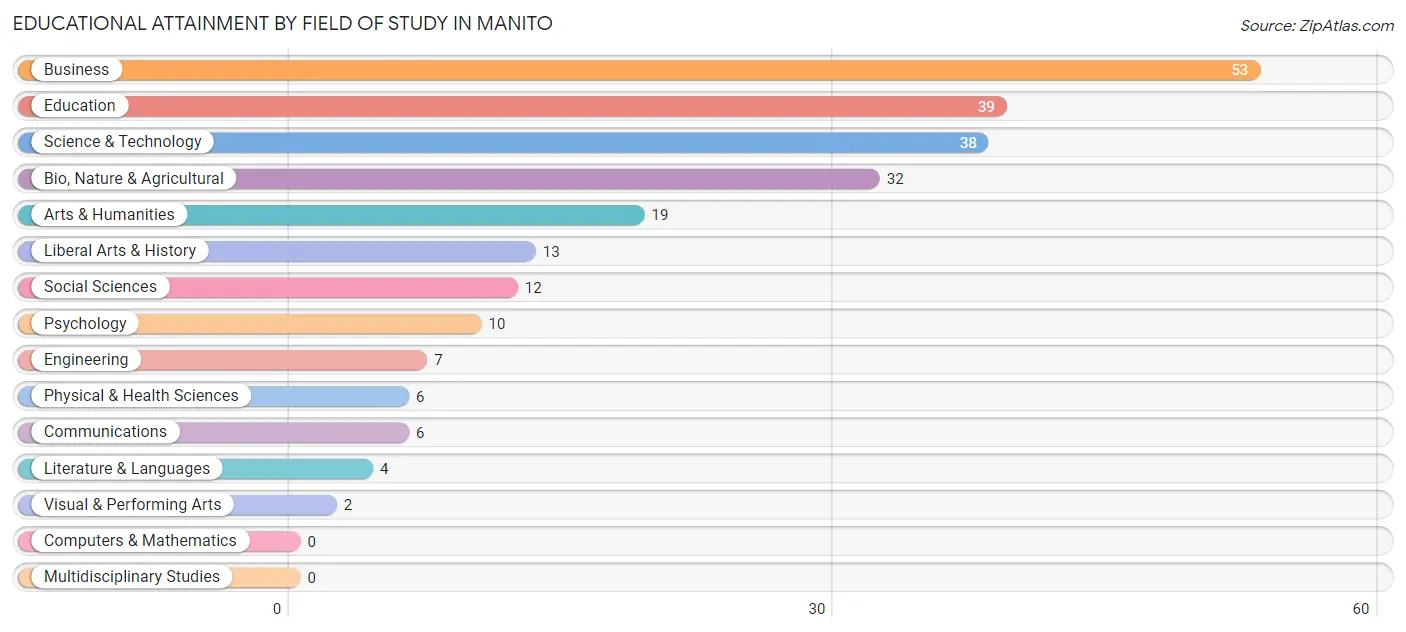
| Field of Study | # Graduates | % Graduates |
| Computers & Mathematics | 0 | 0.0% |
| Bio, Nature & Agricultural | 32 | 13.3% |
| Physical & Health Sciences | 6 | 2.5% |
| Psychology | 10 | 4.2% |
| Social Sciences | 12 | 5.0% |
| Engineering | 7 | 2.9% |
| Multidisciplinary Studies | 0 | 0.0% |
| Science & Technology | 38 | 15.8% |
| Business | 53 | 22.0% |
| Education | 39 | 16.2% |
| Literature & Languages | 4 | 1.7% |
| Liberal Arts & History | 13 | 5.4% |
| Visual & Performing Arts | 2 | 0.8% |
| Communications | 6 | 2.5% |
| Arts & Humanities | 19 | 7.9% |
| Total | 241 | 100.0% |
Transportation & Commute in Manito
Vehicle Availability by Sex in Manito
The most prevalent vehicle ownership categories in Manito are males with 2 vehicles (200, accounting for 48.7%) and females with 2 vehicles (192, making up 53.5%).
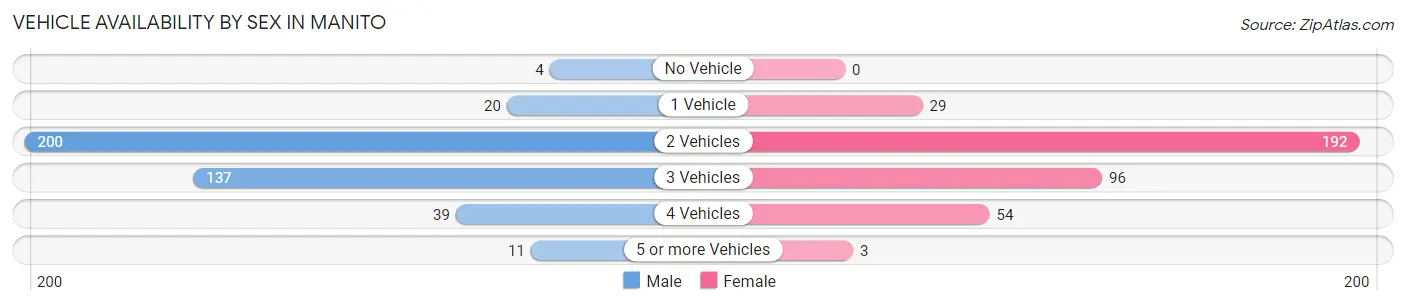
| Vehicles Available | Male | Female |
| No Vehicle | 4 (1.0%) | 0 (0.0%) |
| 1 Vehicle | 20 (4.9%) | 29 (7.7%) |
| 2 Vehicles | 200 (48.7%) | 192 (51.3%) |
| 3 Vehicles | 137 (33.3%) | 96 (25.7%) |
| 4 Vehicles | 39 (9.5%) | 54 (14.4%) |
| 5 or more Vehicles | 11 (2.7%) | 3 (0.8%) |
| Total | 411 (100.0%) | 374 (100.0%) |
Commute Time in Manito
The most frequently occuring commute durations in Manito are 45 to 59 minutes (149 commuters, 20.8%), 5 to 9 minutes (122 commuters, 17.1%), and 25 to 29 minutes (91 commuters, 12.7%).
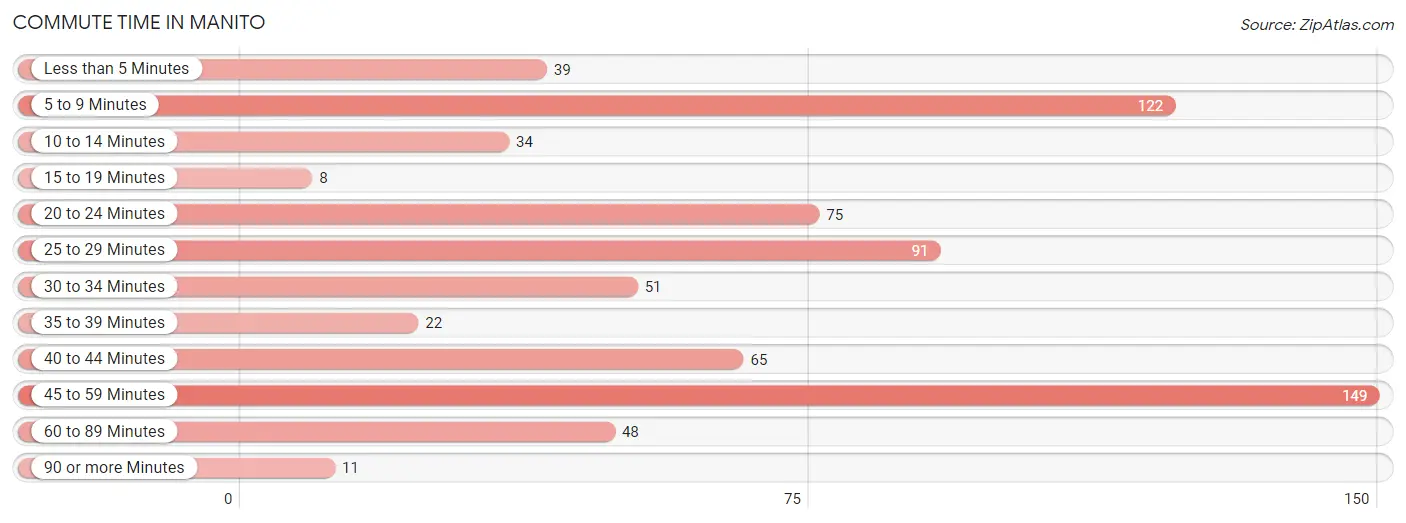
| Commute Time | # Commuters | % Commuters |
| Less than 5 Minutes | 39 | 5.4% |
| 5 to 9 Minutes | 122 | 17.1% |
| 10 to 14 Minutes | 34 | 4.8% |
| 15 to 19 Minutes | 8 | 1.1% |
| 20 to 24 Minutes | 75 | 10.5% |
| 25 to 29 Minutes | 91 | 12.7% |
| 30 to 34 Minutes | 51 | 7.1% |
| 35 to 39 Minutes | 22 | 3.1% |
| 40 to 44 Minutes | 65 | 9.1% |
| 45 to 59 Minutes | 149 | 20.8% |
| 60 to 89 Minutes | 48 | 6.7% |
| 90 or more Minutes | 11 | 1.5% |
Commute Time by Sex in Manito
The most common commute times in Manito are 45 to 59 minutes (93 commuters, 24.3%) for males and 45 to 59 minutes (56 commuters, 16.9%) for females.
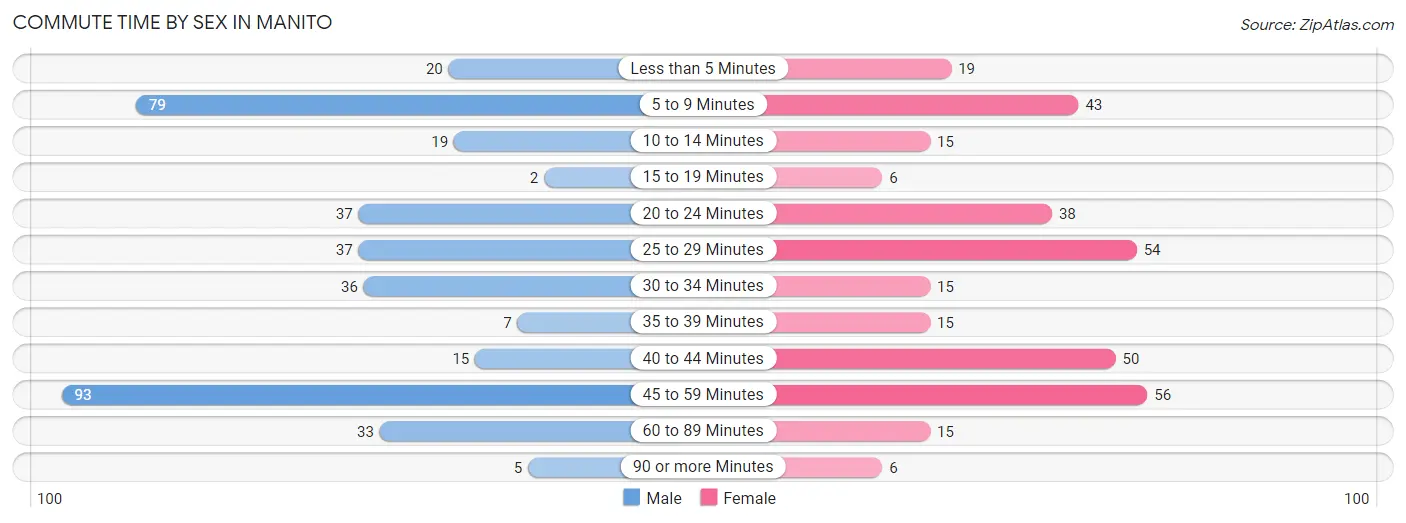
| Commute Time | Male | Female |
| Less than 5 Minutes | 20 (5.2%) | 19 (5.7%) |
| 5 to 9 Minutes | 79 (20.6%) | 43 (13.0%) |
| 10 to 14 Minutes | 19 (5.0%) | 15 (4.5%) |
| 15 to 19 Minutes | 2 (0.5%) | 6 (1.8%) |
| 20 to 24 Minutes | 37 (9.7%) | 38 (11.5%) |
| 25 to 29 Minutes | 37 (9.7%) | 54 (16.3%) |
| 30 to 34 Minutes | 36 (9.4%) | 15 (4.5%) |
| 35 to 39 Minutes | 7 (1.8%) | 15 (4.5%) |
| 40 to 44 Minutes | 15 (3.9%) | 50 (15.1%) |
| 45 to 59 Minutes | 93 (24.3%) | 56 (16.9%) |
| 60 to 89 Minutes | 33 (8.6%) | 15 (4.5%) |
| 90 or more Minutes | 5 (1.3%) | 6 (1.8%) |
Time of Departure to Work by Sex in Manito
The most frequent times of departure to work in Manito are 5:30 AM to 5:59 AM (62, 16.2%) for males and 7:30 AM to 7:59 AM (57, 17.2%) for females.
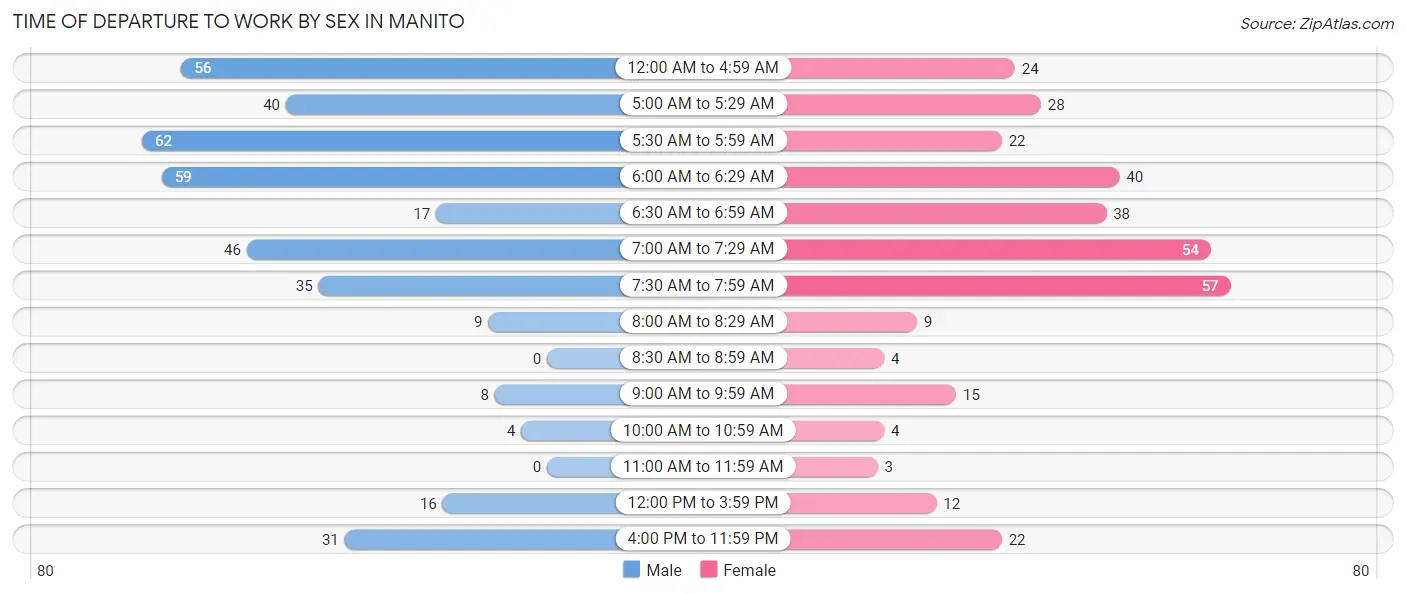
| Time of Departure | Male | Female |
| 12:00 AM to 4:59 AM | 56 (14.6%) | 24 (7.2%) |
| 5:00 AM to 5:29 AM | 40 (10.4%) | 28 (8.4%) |
| 5:30 AM to 5:59 AM | 62 (16.2%) | 22 (6.6%) |
| 6:00 AM to 6:29 AM | 59 (15.4%) | 40 (12.0%) |
| 6:30 AM to 6:59 AM | 17 (4.4%) | 38 (11.5%) |
| 7:00 AM to 7:29 AM | 46 (12.0%) | 54 (16.3%) |
| 7:30 AM to 7:59 AM | 35 (9.1%) | 57 (17.2%) |
| 8:00 AM to 8:29 AM | 9 (2.4%) | 9 (2.7%) |
| 8:30 AM to 8:59 AM | 0 (0.0%) | 4 (1.2%) |
| 9:00 AM to 9:59 AM | 8 (2.1%) | 15 (4.5%) |
| 10:00 AM to 10:59 AM | 4 (1.0%) | 4 (1.2%) |
| 11:00 AM to 11:59 AM | 0 (0.0%) | 3 (0.9%) |
| 12:00 PM to 3:59 PM | 16 (4.2%) | 12 (3.6%) |
| 4:00 PM to 11:59 PM | 31 (8.1%) | 22 (6.6%) |
| Total | 383 (100.0%) | 332 (100.0%) |
Housing Occupancy in Manito
Occupancy by Ownership in Manito
Of the total 741 dwellings in Manito, owner-occupied units account for 591 (79.8%), while renter-occupied units make up 150 (20.2%).
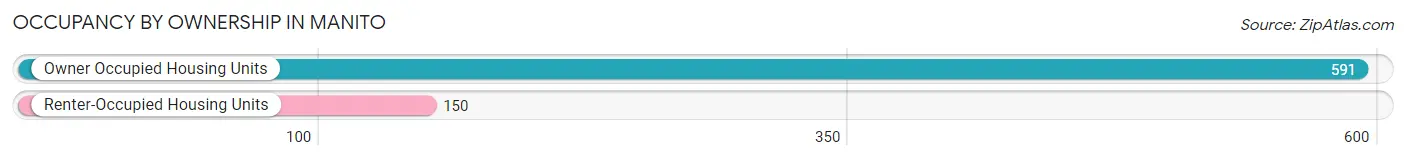
| Occupancy | # Housing Units | % Housing Units |
| Owner Occupied Housing Units | 591 | 79.8% |
| Renter-Occupied Housing Units | 150 | 20.2% |
| Total Occupied Housing Units | 741 | 100.0% |
Occupancy by Household Size in Manito
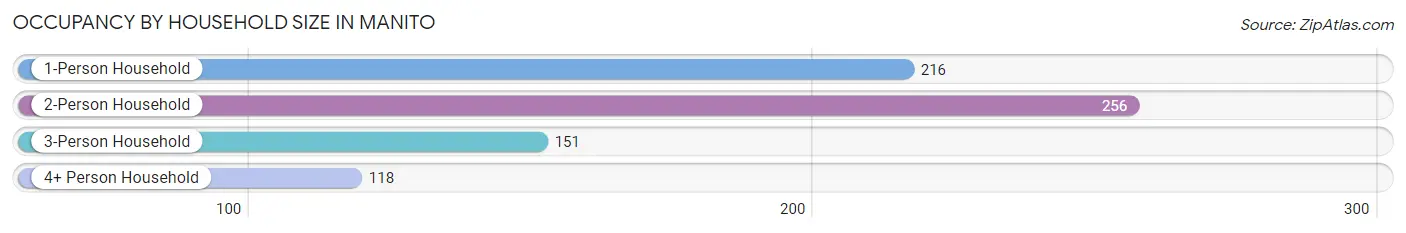
| Household Size | # Housing Units | % Housing Units |
| 1-Person Household | 216 | 29.1% |
| 2-Person Household | 256 | 34.5% |
| 3-Person Household | 151 | 20.4% |
| 4+ Person Household | 118 | 15.9% |
| Total Housing Units | 741 | 100.0% |
Occupancy by Ownership by Household Size in Manito
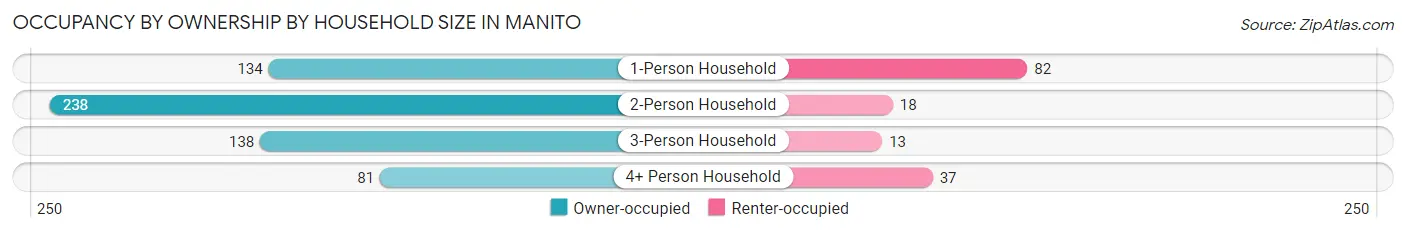
| Household Size | Owner-occupied | Renter-occupied |
| 1-Person Household | 134 (62.0%) | 82 (38.0%) |
| 2-Person Household | 238 (93.0%) | 18 (7.0%) |
| 3-Person Household | 138 (91.4%) | 13 (8.6%) |
| 4+ Person Household | 81 (68.6%) | 37 (31.4%) |
| Total Housing Units | 591 (79.8%) | 150 (20.2%) |
Occupancy by Educational Attainment in Manito
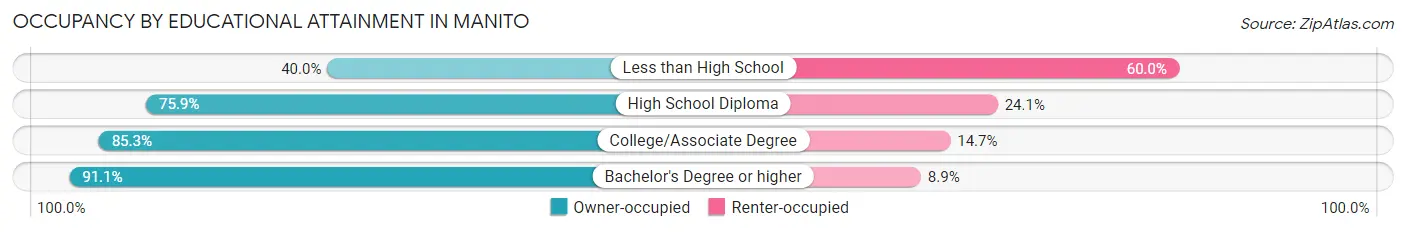
| Household Size | Owner-occupied | Renter-occupied |
| Less than High School | 22 (40.0%) | 33 (60.0%) |
| High School Diploma | 189 (75.9%) | 60 (24.1%) |
| College/Associate Degree | 267 (85.3%) | 46 (14.7%) |
| Bachelor's Degree or higher | 113 (91.1%) | 11 (8.9%) |
Occupancy by Age of Householder in Manito
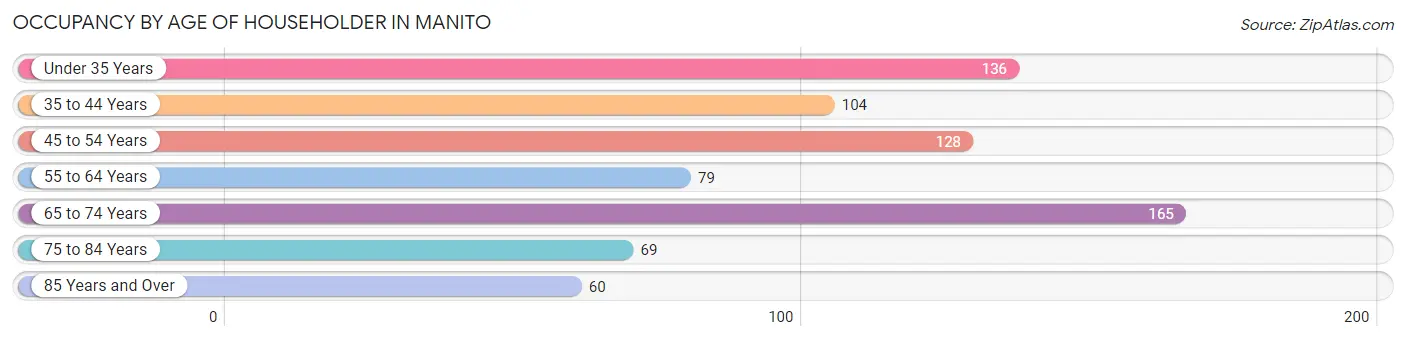
| Age Bracket | # Households | % Households |
| Under 35 Years | 136 | 18.3% |
| 35 to 44 Years | 104 | 14.0% |
| 45 to 54 Years | 128 | 17.3% |
| 55 to 64 Years | 79 | 10.7% |
| 65 to 74 Years | 165 | 22.3% |
| 75 to 84 Years | 69 | 9.3% |
| 85 Years and Over | 60 | 8.1% |
| Total | 741 | 100.0% |
Housing Finances in Manito
Median Income by Occupancy in Manito
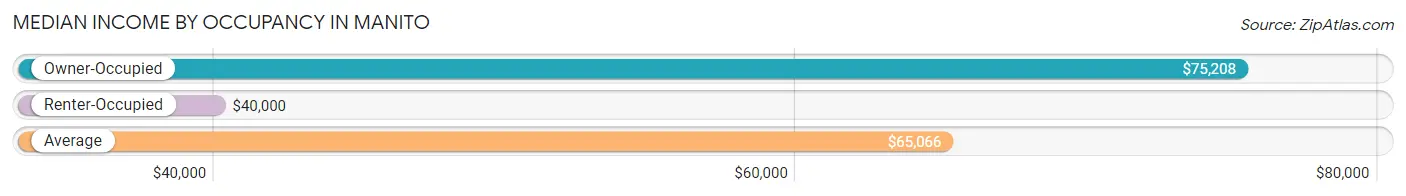
| Occupancy Type | # Households | Median Income |
| Owner-Occupied | 591 (79.8%) | $75,208 |
| Renter-Occupied | 150 (20.2%) | $40,000 |
| Average | 741 (100.0%) | $65,066 |
Occupancy by Householder Income Bracket in Manito
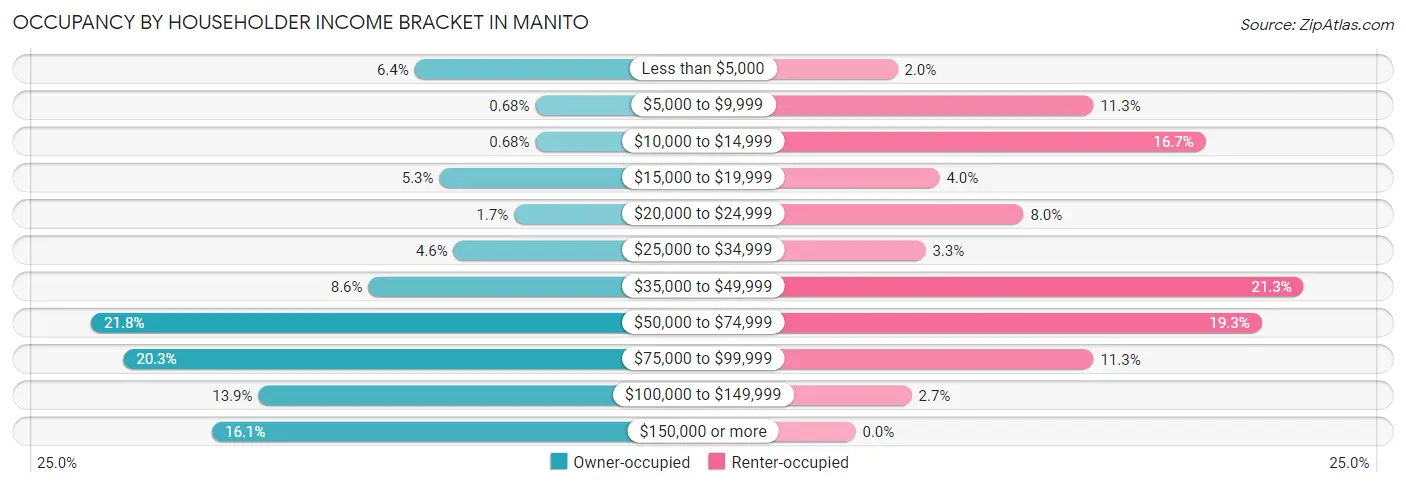
| Income Bracket | Owner-occupied | Renter-occupied |
| Less than $5,000 | 38 (6.4%) | 3 (2.0%) |
| $5,000 to $9,999 | 4 (0.7%) | 17 (11.3%) |
| $10,000 to $14,999 | 4 (0.7%) | 25 (16.7%) |
| $15,000 to $19,999 | 31 (5.2%) | 6 (4.0%) |
| $20,000 to $24,999 | 10 (1.7%) | 12 (8.0%) |
| $25,000 to $34,999 | 27 (4.6%) | 5 (3.3%) |
| $35,000 to $49,999 | 51 (8.6%) | 32 (21.3%) |
| $50,000 to $74,999 | 129 (21.8%) | 29 (19.3%) |
| $75,000 to $99,999 | 120 (20.3%) | 17 (11.3%) |
| $100,000 to $149,999 | 82 (13.9%) | 4 (2.7%) |
| $150,000 or more | 95 (16.1%) | 0 (0.0%) |
| Total | 591 (100.0%) | 150 (100.0%) |
Monthly Housing Cost Tiers in Manito
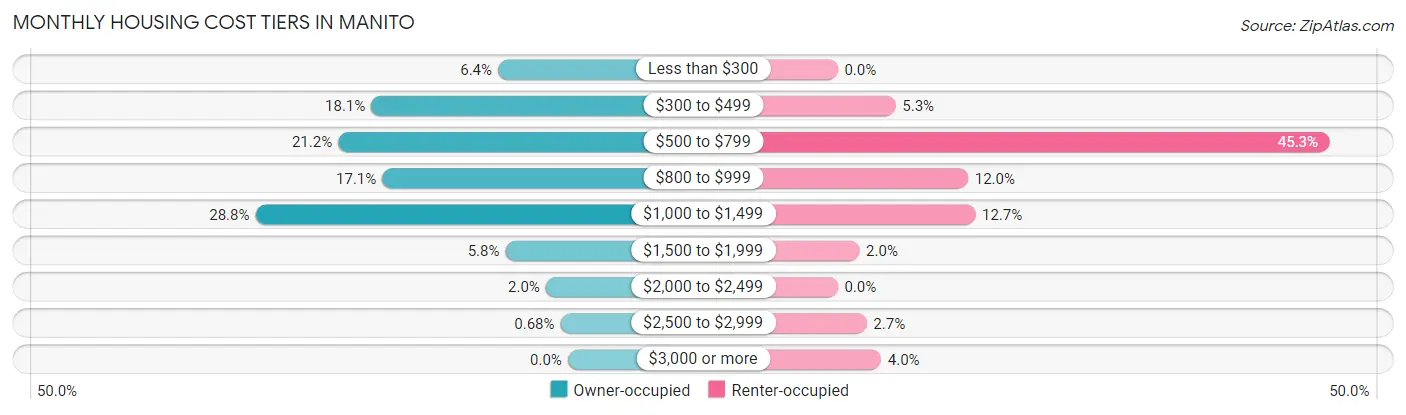
| Monthly Cost | Owner-occupied | Renter-occupied |
| Less than $300 | 38 (6.4%) | 0 (0.0%) |
| $300 to $499 | 107 (18.1%) | 8 (5.3%) |
| $500 to $799 | 125 (21.1%) | 68 (45.3%) |
| $800 to $999 | 101 (17.1%) | 18 (12.0%) |
| $1,000 to $1,499 | 170 (28.8%) | 19 (12.7%) |
| $1,500 to $1,999 | 34 (5.8%) | 3 (2.0%) |
| $2,000 to $2,499 | 12 (2.0%) | 0 (0.0%) |
| $2,500 to $2,999 | 4 (0.7%) | 4 (2.7%) |
| $3,000 or more | 0 (0.0%) | 6 (4.0%) |
| Total | 591 (100.0%) | 150 (100.0%) |
Physical Housing Characteristics in Manito
Housing Structures in Manito
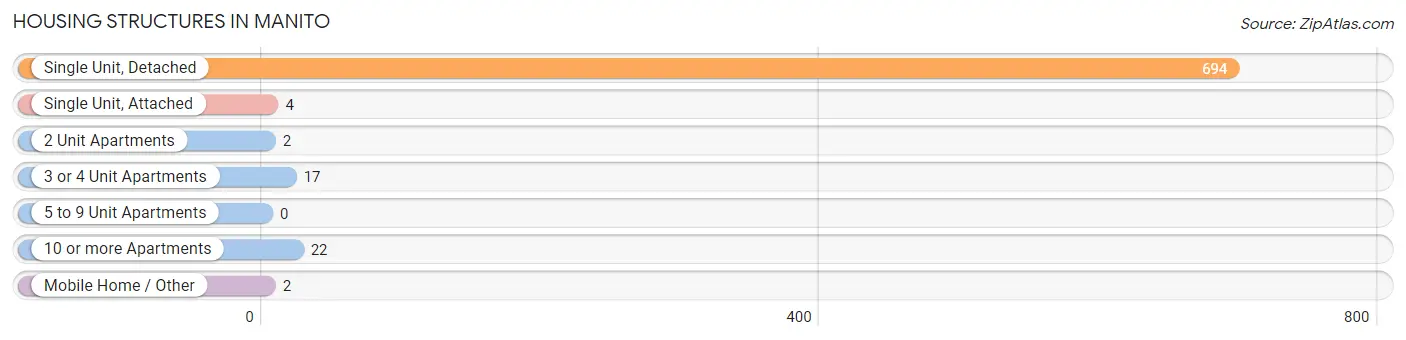
| Structure Type | # Housing Units | % Housing Units |
| Single Unit, Detached | 694 | 93.7% |
| Single Unit, Attached | 4 | 0.5% |
| 2 Unit Apartments | 2 | 0.3% |
| 3 or 4 Unit Apartments | 17 | 2.3% |
| 5 to 9 Unit Apartments | 0 | 0.0% |
| 10 or more Apartments | 22 | 3.0% |
| Mobile Home / Other | 2 | 0.3% |
| Total | 741 | 100.0% |
Housing Structures by Occupancy in Manito
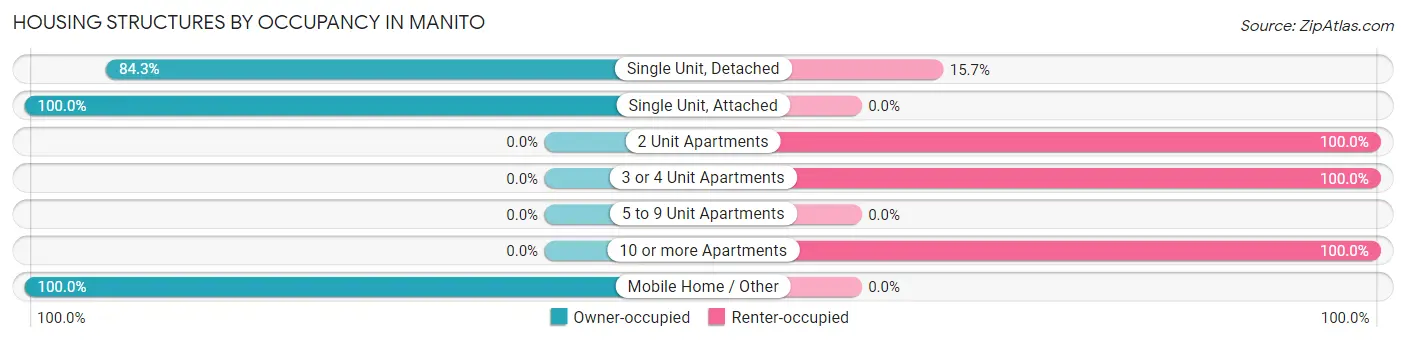
| Structure Type | Owner-occupied | Renter-occupied |
| Single Unit, Detached | 585 (84.3%) | 109 (15.7%) |
| Single Unit, Attached | 4 (100.0%) | 0 (0.0%) |
| 2 Unit Apartments | 0 (0.0%) | 2 (100.0%) |
| 3 or 4 Unit Apartments | 0 (0.0%) | 17 (100.0%) |
| 5 to 9 Unit Apartments | 0 (0.0%) | 0 (0.0%) |
| 10 or more Apartments | 0 (0.0%) | 22 (100.0%) |
| Mobile Home / Other | 2 (100.0%) | 0 (0.0%) |
| Total | 591 (79.8%) | 150 (20.2%) |
Housing Structures by Number of Rooms in Manito
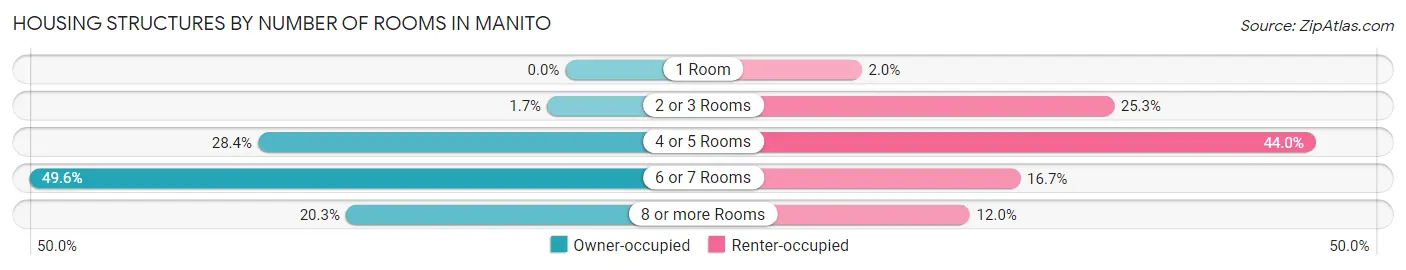
| Number of Rooms | Owner-occupied | Renter-occupied |
| 1 Room | 0 (0.0%) | 3 (2.0%) |
| 2 or 3 Rooms | 10 (1.7%) | 38 (25.3%) |
| 4 or 5 Rooms | 168 (28.4%) | 66 (44.0%) |
| 6 or 7 Rooms | 293 (49.6%) | 25 (16.7%) |
| 8 or more Rooms | 120 (20.3%) | 18 (12.0%) |
| Total | 591 (100.0%) | 150 (100.0%) |
Housing Structure by Heating Type in Manito
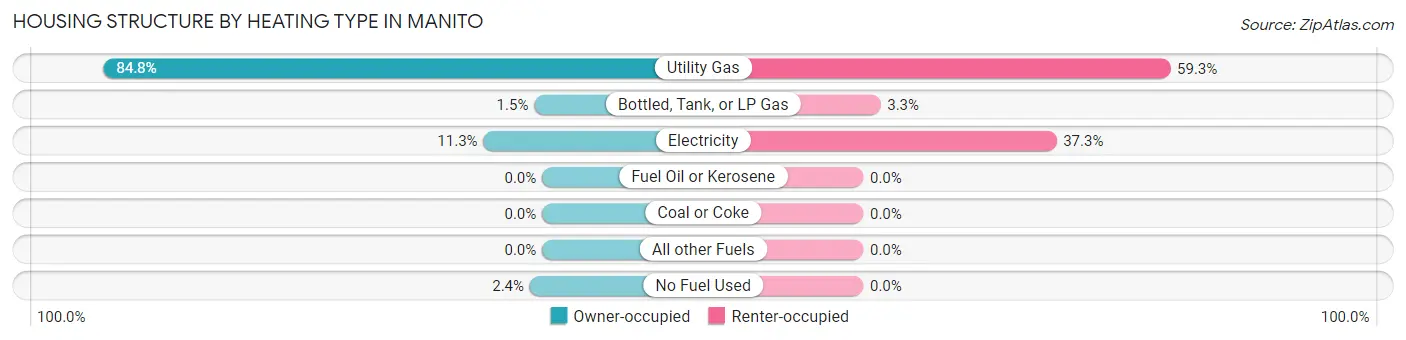
| Heating Type | Owner-occupied | Renter-occupied |
| Utility Gas | 501 (84.8%) | 89 (59.3%) |
| Bottled, Tank, or LP Gas | 9 (1.5%) | 5 (3.3%) |
| Electricity | 67 (11.3%) | 56 (37.3%) |
| Fuel Oil or Kerosene | 0 (0.0%) | 0 (0.0%) |
| Coal or Coke | 0 (0.0%) | 0 (0.0%) |
| All other Fuels | 0 (0.0%) | 0 (0.0%) |
| No Fuel Used | 14 (2.4%) | 0 (0.0%) |
| Total | 591 (100.0%) | 150 (100.0%) |
Household Vehicle Usage in Manito
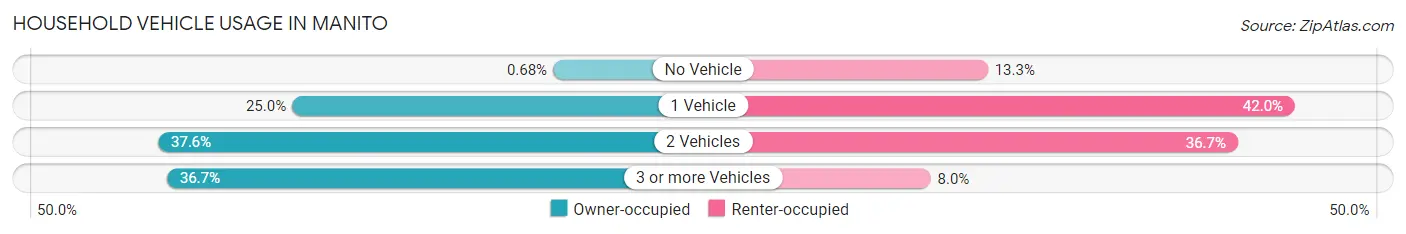
| Vehicles per Household | Owner-occupied | Renter-occupied |
| No Vehicle | 4 (0.7%) | 20 (13.3%) |
| 1 Vehicle | 148 (25.0%) | 63 (42.0%) |
| 2 Vehicles | 222 (37.6%) | 55 (36.7%) |
| 3 or more Vehicles | 217 (36.7%) | 12 (8.0%) |
| Total | 591 (100.0%) | 150 (100.0%) |
Real Estate & Mortgages in Manito
Real Estate and Mortgage Overview in Manito
| Characteristic | Without Mortgage | With Mortgage |
| Housing Units | 229 | 362 |
| Median Property Value | $86,200 | $113,200 |
| Median Household Income | $56,406 | $72 |
| Monthly Housing Costs | $465 | $0 |
| Real Estate Taxes | $2,439 | $0 |
Property Value by Mortgage Status in Manito
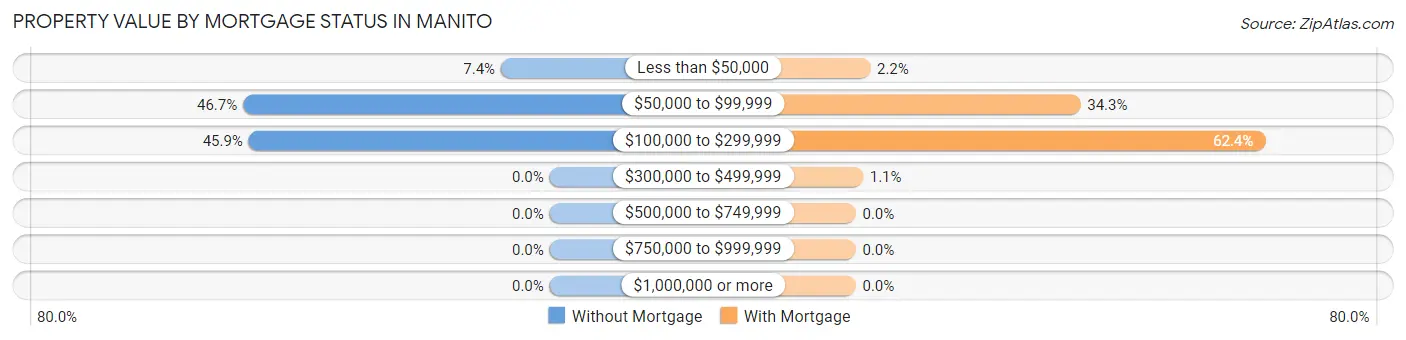
| Property Value | Without Mortgage | With Mortgage |
| Less than $50,000 | 17 (7.4%) | 8 (2.2%) |
| $50,000 to $99,999 | 107 (46.7%) | 124 (34.3%) |
| $100,000 to $299,999 | 105 (45.9%) | 226 (62.4%) |
| $300,000 to $499,999 | 0 (0.0%) | 4 (1.1%) |
| $500,000 to $749,999 | 0 (0.0%) | 0 (0.0%) |
| $750,000 to $999,999 | 0 (0.0%) | 0 (0.0%) |
| $1,000,000 or more | 0 (0.0%) | 0 (0.0%) |
| Total | 229 (100.0%) | 362 (100.0%) |
Household Income by Mortgage Status in Manito
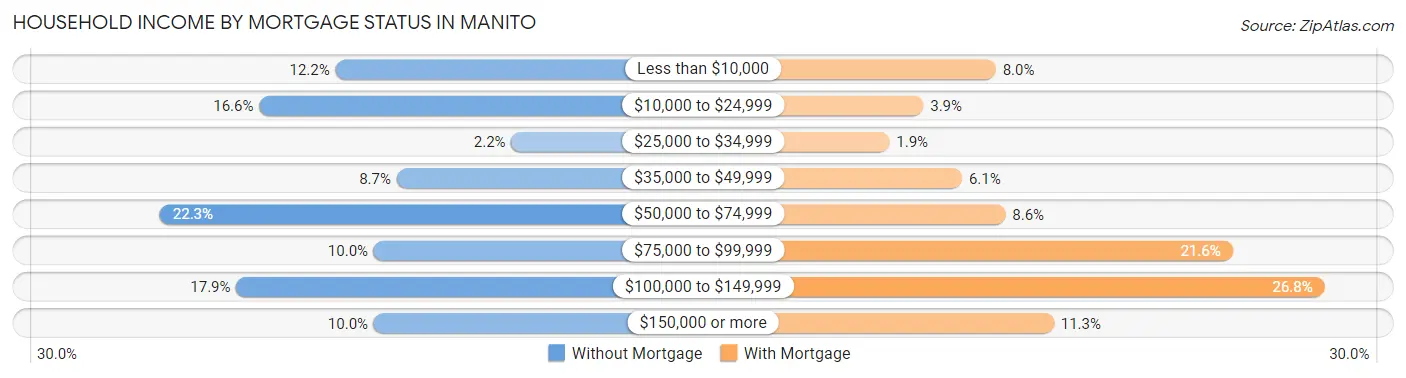
| Household Income | Without Mortgage | With Mortgage |
| Less than $10,000 | 28 (12.2%) | 29 (8.0%) |
| $10,000 to $24,999 | 38 (16.6%) | 14 (3.9%) |
| $25,000 to $34,999 | 5 (2.2%) | 7 (1.9%) |
| $35,000 to $49,999 | 20 (8.7%) | 22 (6.1%) |
| $50,000 to $74,999 | 51 (22.3%) | 31 (8.6%) |
| $75,000 to $99,999 | 23 (10.0%) | 78 (21.5%) |
| $100,000 to $149,999 | 41 (17.9%) | 97 (26.8%) |
| $150,000 or more | 23 (10.0%) | 41 (11.3%) |
| Total | 229 (100.0%) | 362 (100.0%) |
Property Value to Household Income Ratio in Manito
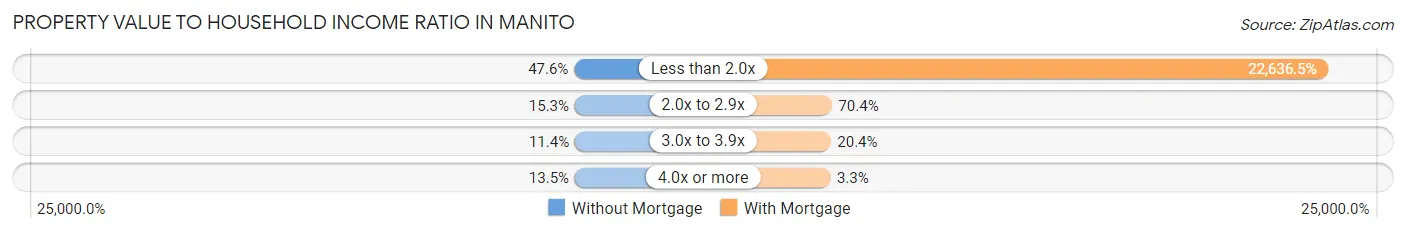
| Value-to-Income Ratio | Without Mortgage | With Mortgage |
| Less than 2.0x | 109 (47.6%) | 81,944 (22,636.5%) |
| 2.0x to 2.9x | 35 (15.3%) | 255 (70.4%) |
| 3.0x to 3.9x | 26 (11.4%) | 74 (20.4%) |
| 4.0x or more | 31 (13.5%) | 12 (3.3%) |
| Total | 229 (100.0%) | 362 (100.0%) |
Real Estate Taxes by Mortgage Status in Manito
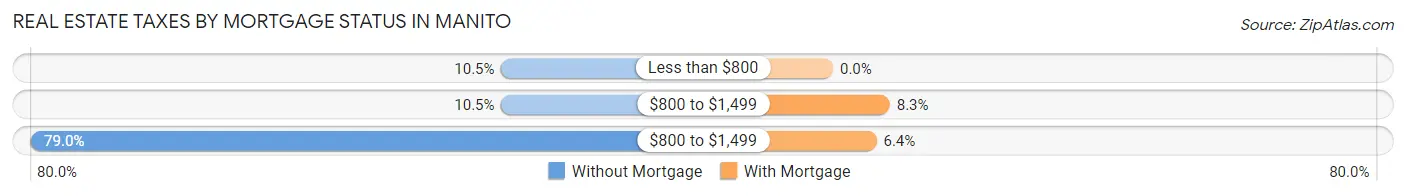
| Property Taxes | Without Mortgage | With Mortgage |
| Less than $800 | 24 (10.5%) | 0 (0.0%) |
| $800 to $1,499 | 24 (10.5%) | 30 (8.3%) |
| $800 to $1,499 | 181 (79.0%) | 23 (6.4%) |
| Total | 229 (100.0%) | 362 (100.0%) |
Health & Disability in Manito
Health Insurance Coverage by Age in Manito
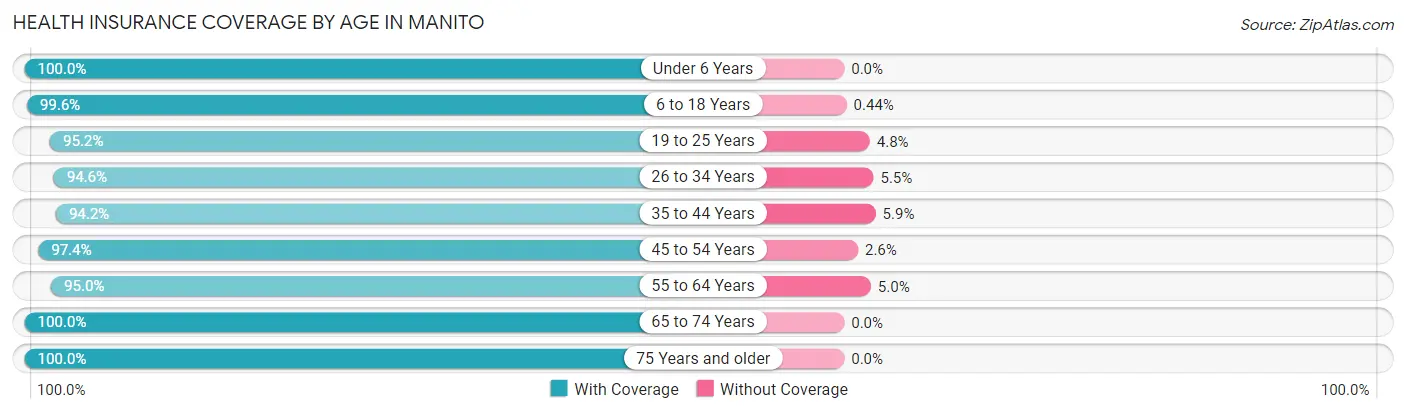
| Age Bracket | With Coverage | Without Coverage |
| Under 6 Years | 130 (100.0%) | 0 (0.0%) |
| 6 to 18 Years | 224 (99.6%) | 1 (0.4%) |
| 19 to 25 Years | 160 (95.2%) | 8 (4.8%) |
| 26 to 34 Years | 156 (94.6%) | 9 (5.4%) |
| 35 to 44 Years | 161 (94.2%) | 10 (5.9%) |
| 45 to 54 Years | 228 (97.4%) | 6 (2.6%) |
| 55 to 64 Years | 134 (95.0%) | 7 (5.0%) |
| 65 to 74 Years | 259 (100.0%) | 0 (0.0%) |
| 75 Years and older | 186 (100.0%) | 0 (0.0%) |
| Total | 1,638 (97.6%) | 41 (2.4%) |
Health Insurance Coverage by Citizenship Status in Manito
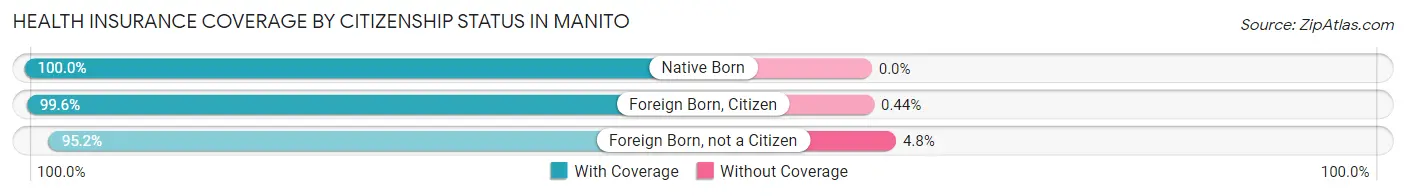
| Citizenship Status | With Coverage | Without Coverage |
| Native Born | 130 (100.0%) | 0 (0.0%) |
| Foreign Born, Citizen | 224 (99.6%) | 1 (0.4%) |
| Foreign Born, not a Citizen | 160 (95.2%) | 8 (4.8%) |
Health Insurance Coverage by Household Income in Manito
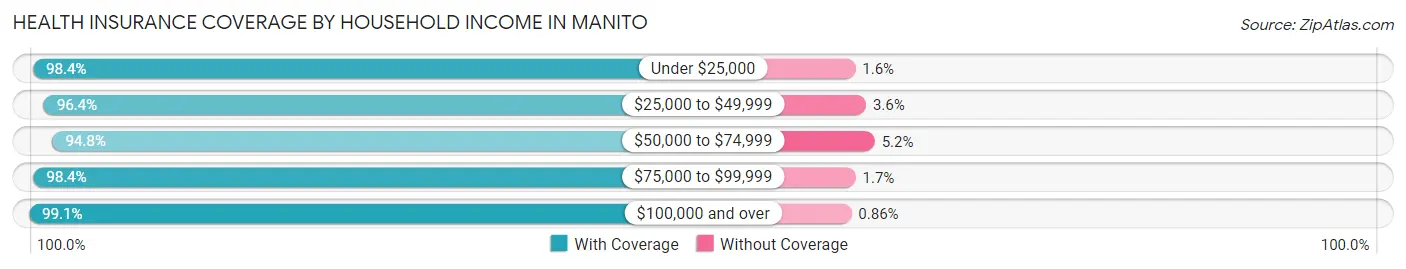
| Household Income | With Coverage | Without Coverage |
| Under $25,000 | 183 (98.4%) | 3 (1.6%) |
| $25,000 to $49,999 | 268 (96.4%) | 10 (3.6%) |
| $50,000 to $74,999 | 308 (94.8%) | 17 (5.2%) |
| $75,000 to $99,999 | 418 (98.4%) | 7 (1.7%) |
| $100,000 and over | 461 (99.1%) | 4 (0.9%) |
Public vs Private Health Insurance Coverage by Age in Manito
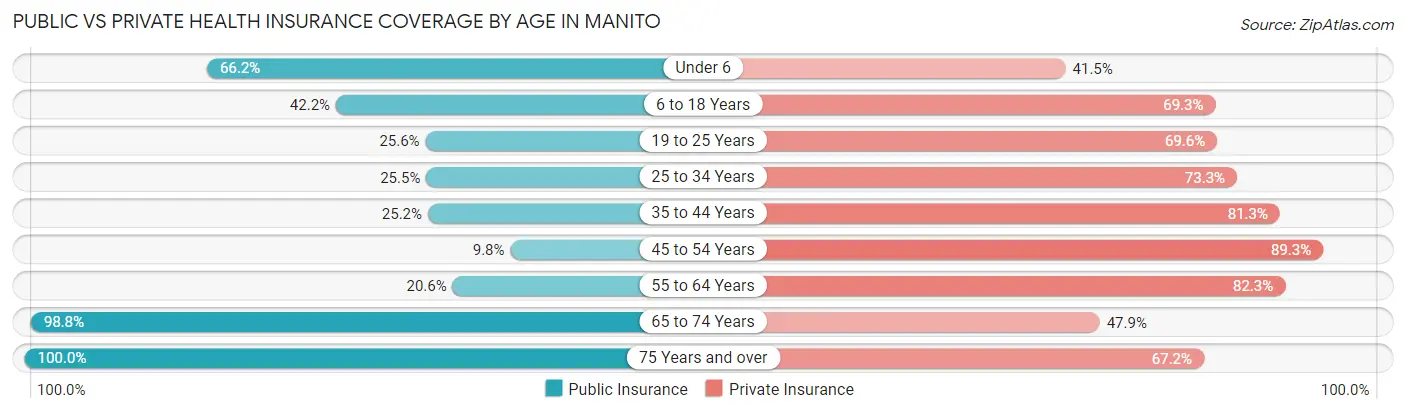
| Age Bracket | Public Insurance | Private Insurance |
| Under 6 | 86 (66.1%) | 54 (41.5%) |
| 6 to 18 Years | 95 (42.2%) | 156 (69.3%) |
| 19 to 25 Years | 43 (25.6%) | 117 (69.6%) |
| 25 to 34 Years | 42 (25.5%) | 121 (73.3%) |
| 35 to 44 Years | 43 (25.2%) | 139 (81.3%) |
| 45 to 54 Years | 23 (9.8%) | 209 (89.3%) |
| 55 to 64 Years | 29 (20.6%) | 116 (82.3%) |
| 65 to 74 Years | 256 (98.8%) | 124 (47.9%) |
| 75 Years and over | 186 (100.0%) | 125 (67.2%) |
| Total | 803 (47.8%) | 1,161 (69.2%) |
Disability Status by Sex by Age in Manito
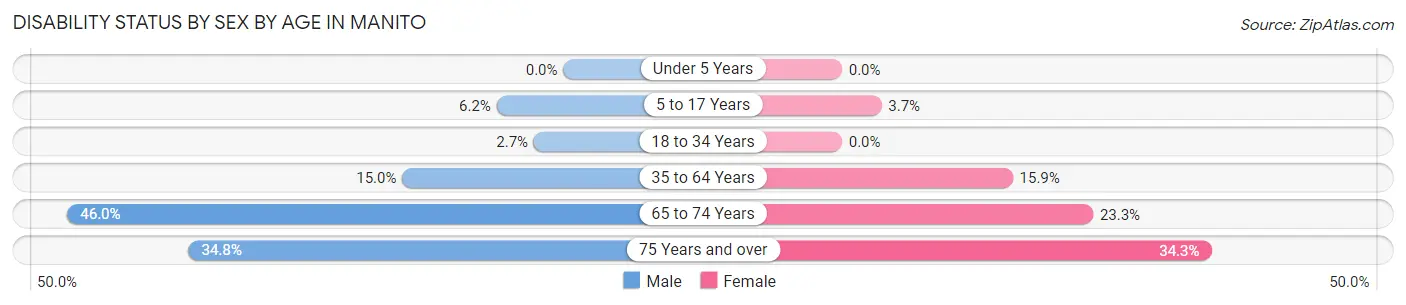
| Age Bracket | Male | Female |
| Under 5 Years | 0 (0.0%) | 0 (0.0%) |
| 5 to 17 Years | 7 (6.2%) | 4 (3.7%) |
| 18 to 34 Years | 5 (2.7%) | 0 (0.0%) |
| 35 to 64 Years | 42 (14.9%) | 42 (15.9%) |
| 65 to 74 Years | 58 (46.0%) | 31 (23.3%) |
| 75 Years and over | 16 (34.8%) | 48 (34.3%) |
Disability Class by Sex by Age in Manito
Disability Class: Hearing Difficulty
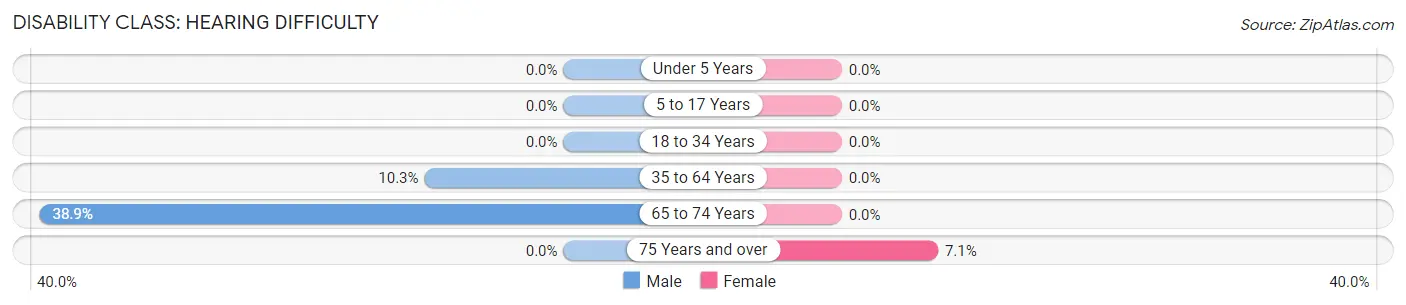
| Age Bracket | Male | Female |
| Under 5 Years | 0 (0.0%) | 0 (0.0%) |
| 5 to 17 Years | 0 (0.0%) | 0 (0.0%) |
| 18 to 34 Years | 0 (0.0%) | 0 (0.0%) |
| 35 to 64 Years | 29 (10.3%) | 0 (0.0%) |
| 65 to 74 Years | 49 (38.9%) | 0 (0.0%) |
| 75 Years and over | 0 (0.0%) | 10 (7.1%) |
Disability Class: Vision Difficulty
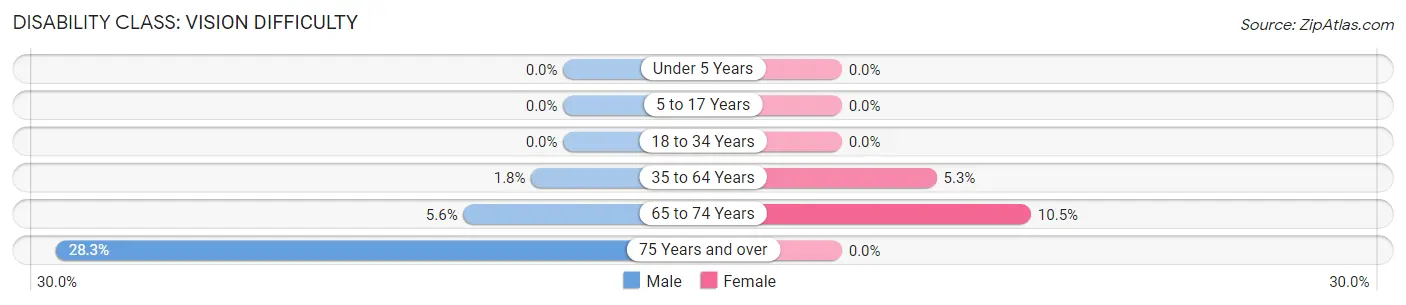
| Age Bracket | Male | Female |
| Under 5 Years | 0 (0.0%) | 0 (0.0%) |
| 5 to 17 Years | 0 (0.0%) | 0 (0.0%) |
| 18 to 34 Years | 0 (0.0%) | 0 (0.0%) |
| 35 to 64 Years | 5 (1.8%) | 14 (5.3%) |
| 65 to 74 Years | 7 (5.6%) | 14 (10.5%) |
| 75 Years and over | 13 (28.3%) | 0 (0.0%) |
Disability Class: Cognitive Difficulty
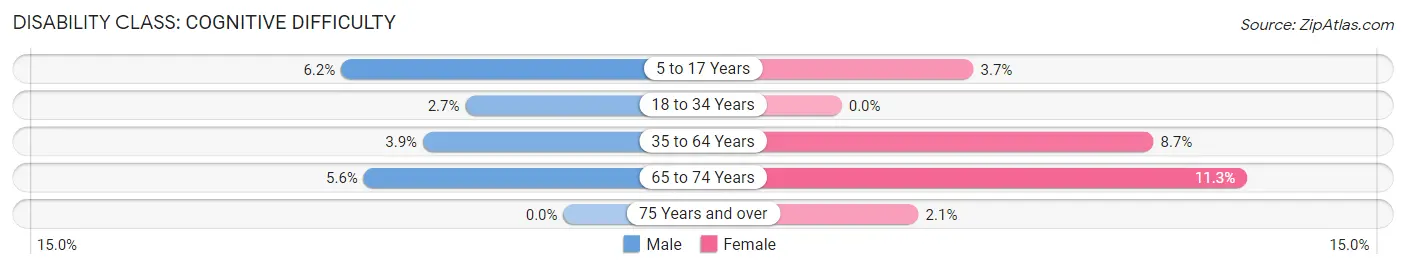
| Age Bracket | Male | Female |
| 5 to 17 Years | 7 (6.2%) | 4 (3.7%) |
| 18 to 34 Years | 5 (2.7%) | 0 (0.0%) |
| 35 to 64 Years | 11 (3.9%) | 23 (8.7%) |
| 65 to 74 Years | 7 (5.6%) | 15 (11.3%) |
| 75 Years and over | 0 (0.0%) | 3 (2.1%) |
Disability Class: Ambulatory Difficulty
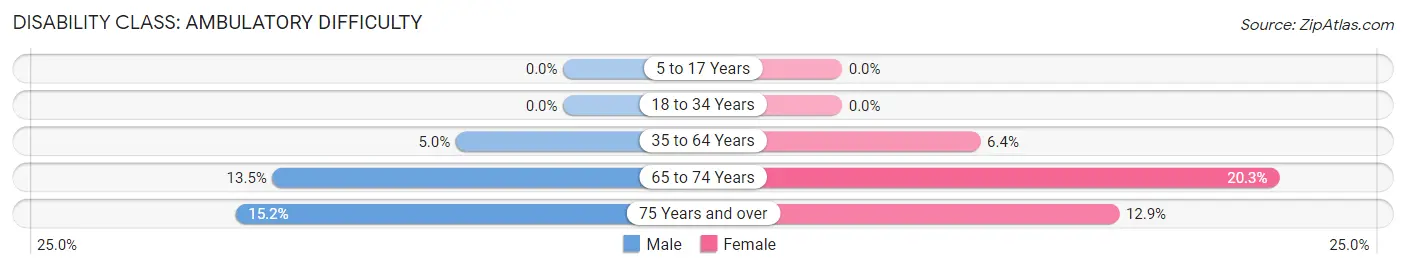
| Age Bracket | Male | Female |
| 5 to 17 Years | 0 (0.0%) | 0 (0.0%) |
| 18 to 34 Years | 0 (0.0%) | 0 (0.0%) |
| 35 to 64 Years | 14 (5.0%) | 17 (6.4%) |
| 65 to 74 Years | 17 (13.5%) | 27 (20.3%) |
| 75 Years and over | 7 (15.2%) | 18 (12.9%) |
Disability Class: Self-Care Difficulty
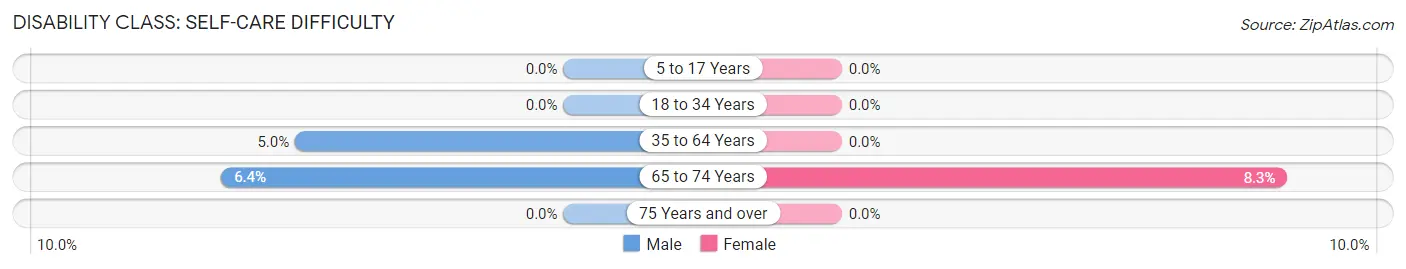
| Age Bracket | Male | Female |
| 5 to 17 Years | 0 (0.0%) | 0 (0.0%) |
| 18 to 34 Years | 0 (0.0%) | 0 (0.0%) |
| 35 to 64 Years | 14 (5.0%) | 0 (0.0%) |
| 65 to 74 Years | 8 (6.4%) | 11 (8.3%) |
| 75 Years and over | 0 (0.0%) | 0 (0.0%) |
Technology Access in Manito
Computing Device Access in Manito
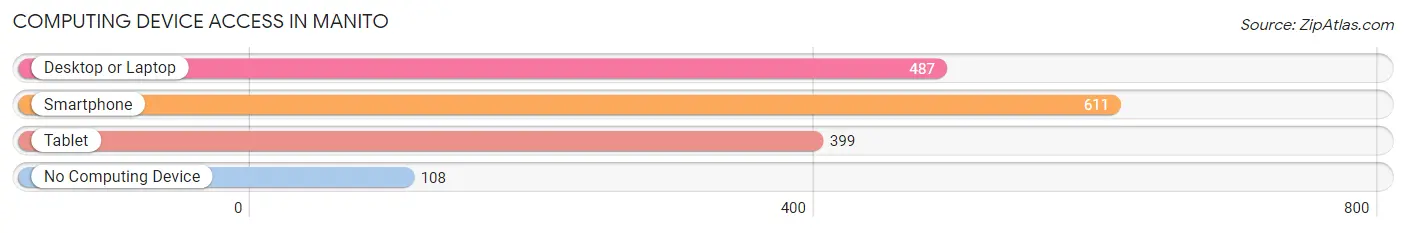
| Device Type | # Households | % Households |
| Desktop or Laptop | 487 | 65.7% |
| Smartphone | 611 | 82.5% |
| Tablet | 399 | 53.8% |
| No Computing Device | 108 | 14.6% |
| Total | 741 | 100.0% |
Internet Access in Manito
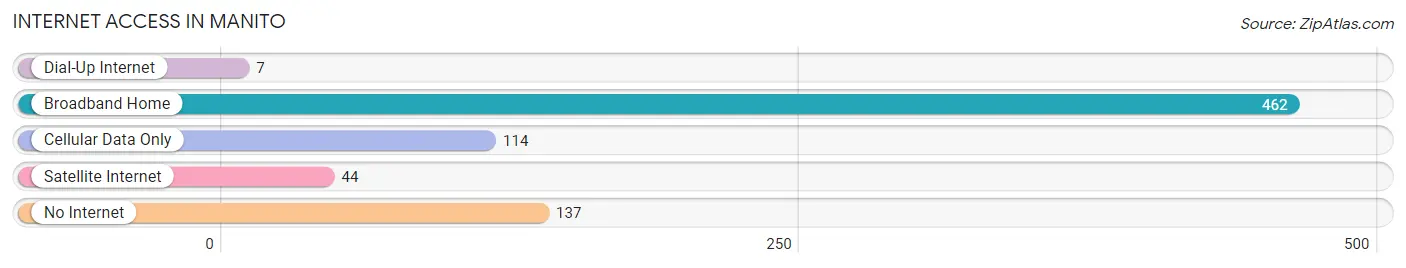
| Internet Type | # Households | % Households |
| Dial-Up Internet | 7 | 0.9% |
| Broadband Home | 462 | 62.4% |
| Cellular Data Only | 114 | 15.4% |
| Satellite Internet | 44 | 5.9% |
| No Internet | 137 | 18.5% |
| Total | 741 | 100.0% |
Manito Summary
Manito, Illinois is a small village located in Mason County, Illinois. It is situated on the banks of the Sangamon River, about 25 miles south of Peoria. The village has a population of 1,717 people, according to the 2010 census.
History
Manito was founded in 1836 by a group of settlers from New York. The village was named after the Manito River, which runs through the area. The first settlers were mostly farmers, and the village grew slowly over the years. In 1854, the first post office was established in Manito.
In 1867, the Chicago, Burlington & Quincy Railroad was built through Manito, connecting the village to the larger cities of Peoria and Chicago. This allowed for the growth of the village, as it became a stop for travelers and goods.
In 1872, the village was incorporated, and the first mayor was elected. The village continued to grow, and by the early 1900s, it had a population of over 1,000 people.
Geography
Manito is located in Mason County, Illinois, about 25 miles south of Peoria. The village is situated on the banks of the Sangamon River, and is surrounded by rolling hills and farmland. The village is located in the Central Till Plain region of Illinois, which is characterized by flat terrain and fertile soil.
The climate in Manito is typical of the Midwest, with hot summers and cold winters. The average temperature in the summer is around 80 degrees Fahrenheit, and the average temperature in the winter is around 30 degrees Fahrenheit.
Economy
The economy of Manito is largely based on agriculture. The village is surrounded by farmland, and many of the residents are employed in the agricultural industry. The village also has a few small businesses, including a grocery store, a hardware store, and a few restaurants.
The village is also home to a few manufacturing companies, including a plastics factory and a metal fabrication plant. These companies provide employment for many of the residents of Manito.
Demographics
According to the 2010 census, the population of Manito is 1,717 people. The racial makeup of the village is 97.3% White, 0.7% African American, 0.3% Native American, 0.2% Asian, and 1.5% from other races.
The median household income in Manito is $45,000, and the median age is 40 years old. The village has a high rate of homeownership, with over 80% of the population owning their own homes.
Conclusion
Manito, Illinois is a small village located in Mason County, Illinois. It is situated on the banks of the Sangamon River, about 25 miles south of Peoria. The village has a population of 1,717 people, according to the 2010 census. The economy of Manito is largely based on agriculture, and the village is also home to a few manufacturing companies. The racial makeup of the village is 97.3% White, 0.7% African American, 0.3% Native American, 0.2% Asian, and 1.5% from other races. The median household income in Manito is $45,000, and the median age is 40 years old.
Common Questions
What is Per Capita Income in Manito?
Per Capita income in Manito is $34,314.
What is the Median Family Income in Manito?
Median Family Income in Manito is $80,833.
What is the Median Household income in Manito?
Median Household Income in Manito is $65,066.
What is Income or Wage Gap in Manito?
Income or Wage Gap in Manito is 32.1%.
Women in Manito earn 67.9 cents for every dollar earned by a man.
What is Inequality or Gini Index in Manito?
Inequality or Gini Index in Manito is 0.45.
What is the Total Population of Manito?
Total Population of Manito is 1,719.
What is the Total Male Population of Manito?
Total Male Population of Manito is 815.
What is the Total Female Population of Manito?
Total Female Population of Manito is 904.
What is the Ratio of Males per 100 Females in Manito?
There are 90.15 Males per 100 Females in Manito.
What is the Ratio of Females per 100 Males in Manito?
There are 110.92 Females per 100 Males in Manito.
What is the Median Population Age in Manito?
Median Population Age in Manito is 44.5 Years.
What is the Average Family Size in Manito
Average Family Size in Manito is 2.7 People.
What is the Average Household Size in Manito
Average Household Size in Manito is 2.3 People.
How Large is the Labor Force in Manito?
There are 806 People in the Labor Forcein in Manito.
What is the Percentage of People in the Labor Force in Manito?
56.9% of People are in the Labor Force in Manito.
What is the Unemployment Rate in Manito?
Unemployment Rate in Manito is 2.4%.