Lynwood, IL Map & Demographics
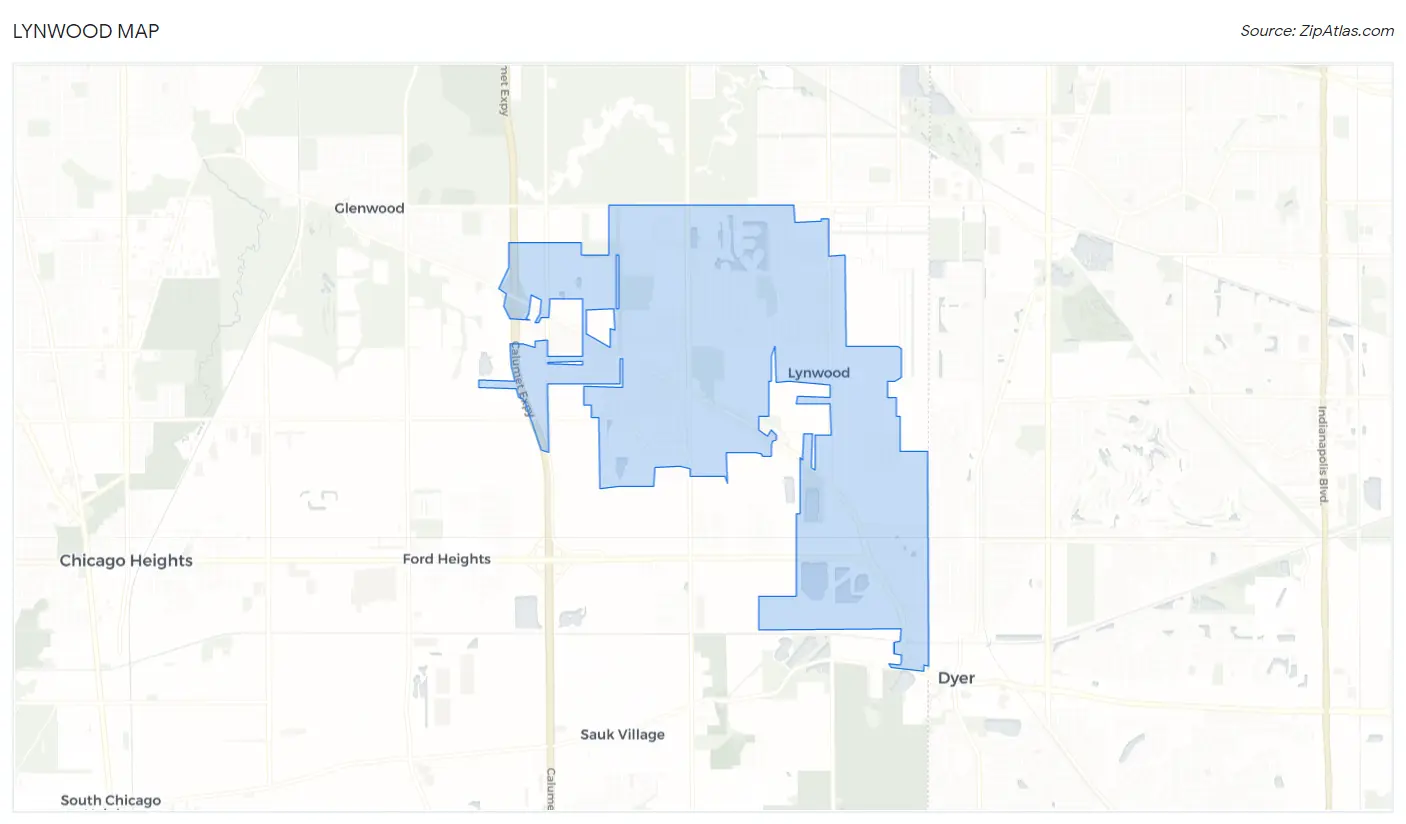
Lynwood Map
Lynwood Overview
$38,753
PER CAPITA INCOME
$107,436
AVG FAMILY INCOME
$80,789
AVG HOUSEHOLD INCOME
15.4%
WAGE / INCOME GAP [ % ]
84.6¢/ $1
WAGE / INCOME GAP [ $ ]
0.44
INEQUALITY / GINI INDEX
9,087
TOTAL POPULATION
4,269
MALE POPULATION
4,818
FEMALE POPULATION
88.61
MALES / 100 FEMALES
112.86
FEMALES / 100 MALES
43.1
MEDIAN AGE
3.4
AVG FAMILY SIZE
2.8
AVG HOUSEHOLD SIZE
4,510
LABOR FORCE [ PEOPLE ]
62.4%
PERCENT IN LABOR FORCE
5.0%
UNEMPLOYMENT RATE
Lynwood Area Codes
Income in Lynwood
Income Overview in Lynwood
Per Capita Income in Lynwood is $38,753, while median incomes of families and households are $107,436 and $80,789 respectively.
| Characteristic | Number | Measure |
| Per Capita Income | 9,087 | $38,753 |
| Median Family Income | 2,331 | $107,436 |
| Mean Family Income | 2,331 | $124,196 |
| Median Household Income | 3,282 | $80,789 |
| Mean Household Income | 3,282 | $102,994 |
| Income Deficit | 2,331 | $0 |
| Wage / Income Gap (%) | 9,087 | 15.41% |
| Wage / Income Gap ($) | 9,087 | 84.59¢ per $1 |
| Gini / Inequality Index | 9,087 | 0.44 |
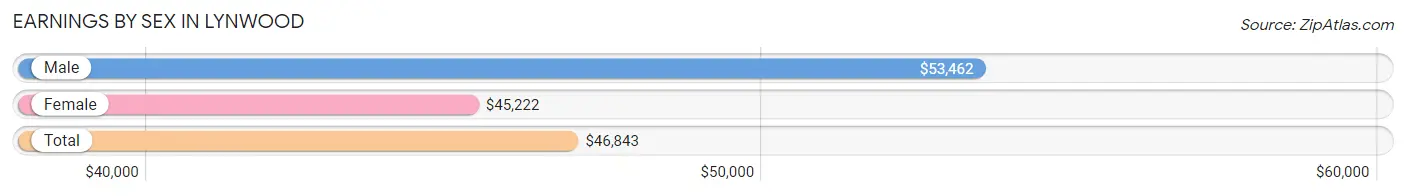
Earnings by Sex in Lynwood
Average Earnings in Lynwood are $46,843, $53,462 for men and $45,222 for women, a difference of 15.4%.
| Sex | Number | Average Earnings |
| Male | 2,506 (52.4%) | $53,462 |
| Female | 2,280 (47.6%) | $45,222 |
| Total | 4,786 (100.0%) | $46,843 |
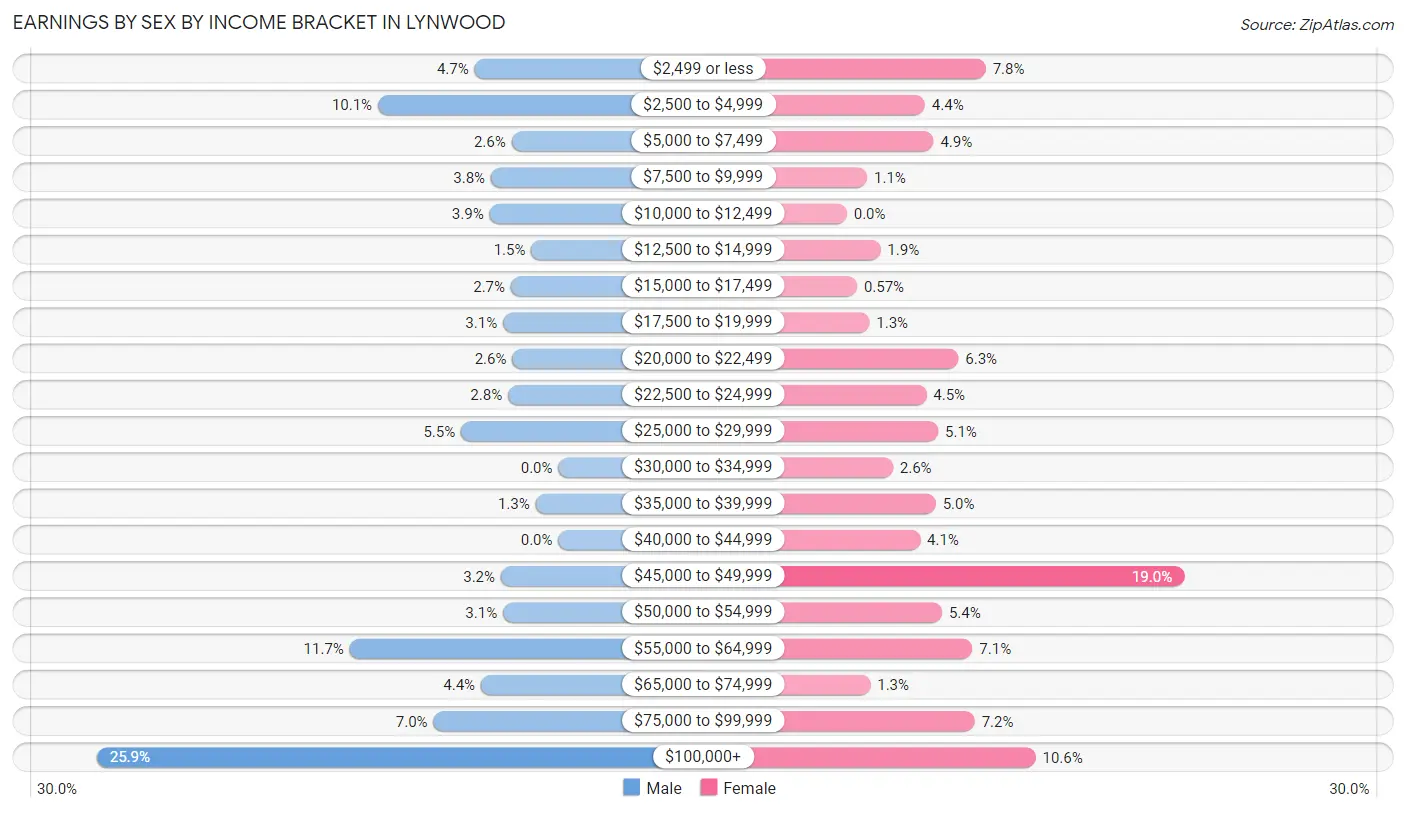
Earnings by Sex by Income Bracket in Lynwood
The most common earnings brackets in Lynwood are $100,000+ for men (650 | 25.9%) and $45,000 to $49,999 for women (432 | 19.0%).
| Income | Male | Female |
| $2,499 or less | 118 (4.7%) | 178 (7.8%) |
| $2,500 to $4,999 | 254 (10.1%) | 100 (4.4%) |
| $5,000 to $7,499 | 66 (2.6%) | 111 (4.9%) |
| $7,500 to $9,999 | 95 (3.8%) | 26 (1.1%) |
| $10,000 to $12,499 | 97 (3.9%) | 0 (0.0%) |
| $12,500 to $14,999 | 38 (1.5%) | 43 (1.9%) |
| $15,000 to $17,499 | 67 (2.7%) | 13 (0.6%) |
| $17,500 to $19,999 | 78 (3.1%) | 29 (1.3%) |
| $20,000 to $22,499 | 65 (2.6%) | 143 (6.3%) |
| $22,500 to $24,999 | 71 (2.8%) | 102 (4.5%) |
| $25,000 to $29,999 | 137 (5.5%) | 117 (5.1%) |
| $30,000 to $34,999 | 0 (0.0%) | 59 (2.6%) |
| $35,000 to $39,999 | 32 (1.3%) | 114 (5.0%) |
| $40,000 to $44,999 | 0 (0.0%) | 94 (4.1%) |
| $45,000 to $49,999 | 81 (3.2%) | 432 (19.0%) |
| $50,000 to $54,999 | 78 (3.1%) | 122 (5.3%) |
| $55,000 to $64,999 | 294 (11.7%) | 161 (7.1%) |
| $65,000 to $74,999 | 109 (4.3%) | 30 (1.3%) |
| $75,000 to $99,999 | 176 (7.0%) | 164 (7.2%) |
| $100,000+ | 650 (25.9%) | 242 (10.6%) |
| Total | 2,506 (100.0%) | 2,280 (100.0%) |
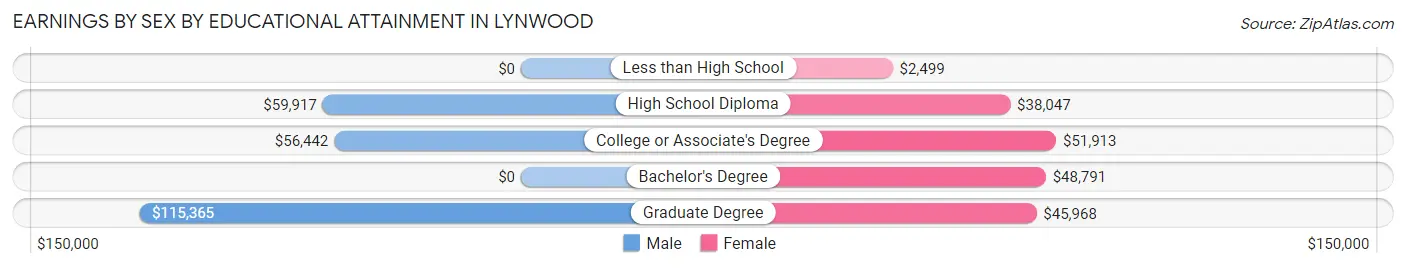
Earnings by Sex by Educational Attainment in Lynwood
Average earnings in Lynwood are $62,014 for men and $47,967 for women, a difference of 22.7%. Men with an educational attainment of graduate degree enjoy the highest average annual earnings of $115,365, while those with college or associate's degree education earn the least with $56,442. Women with an educational attainment of college or associate's degree earn the most with the average annual earnings of $51,913, while those with less than high school education have the smallest earnings of $2,499.
| Educational Attainment | Male Income | Female Income |
| Less than High School | - | - |
| High School Diploma | $59,917 | $38,047 |
| College or Associate's Degree | $56,442 | $51,913 |
| Bachelor's Degree | - | - |
| Graduate Degree | $115,365 | $45,968 |
| Total | $62,014 | $47,967 |
Family Income in Lynwood
Family Income Brackets in Lynwood
According to the Lynwood family income data, there are 632 families falling into the $100,000 to $149,999 income range, which is the most common income bracket and makes up 27.1% of all families.
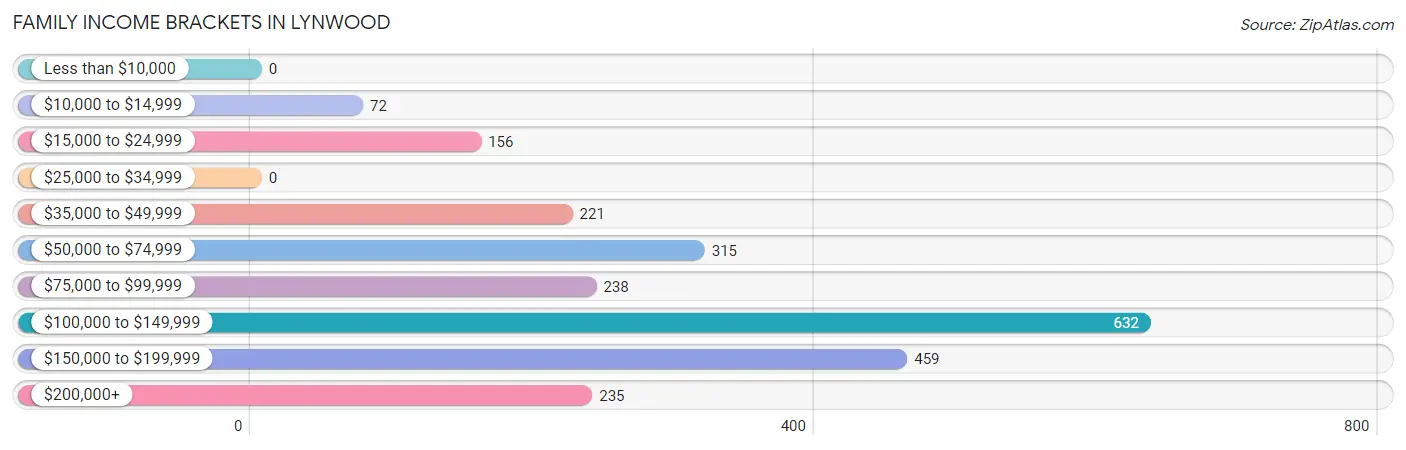
| Income Bracket | # Families | % Families |
| Less than $10,000 | 0 | 0.0% |
| $10,000 to $14,999 | 72 | 3.1% |
| $15,000 to $24,999 | 156 | 6.7% |
| $25,000 to $34,999 | 0 | 0.0% |
| $35,000 to $49,999 | 221 | 9.5% |
| $50,000 to $74,999 | 315 | 13.5% |
| $75,000 to $99,999 | 238 | 10.2% |
| $100,000 to $149,999 | 632 | 27.1% |
| $150,000 to $199,999 | 459 | 19.7% |
| $200,000+ | 235 | 10.1% |
Family Income by Famaliy Size in Lynwood
4-person families (402 | 17.2%) account for the highest median family income in Lynwood with $165,325 per family, while 2-person families (1,063 | 45.6%) have the highest median income of $47,890 per family member.
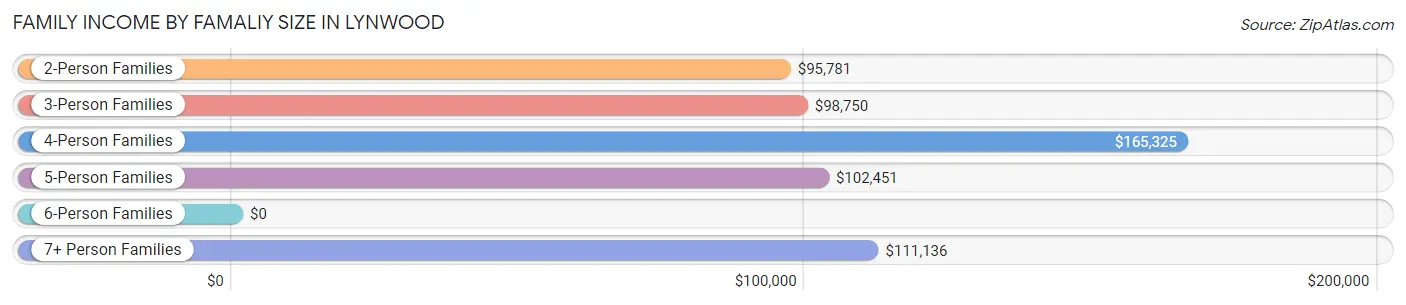
| Income Bracket | # Families | Median Income |
| 2-Person Families | 1,063 (45.6%) | $95,781 |
| 3-Person Families | 491 (21.1%) | $98,750 |
| 4-Person Families | 402 (17.2%) | $165,325 |
| 5-Person Families | 311 (13.3%) | $102,451 |
| 6-Person Families | 0 (0.0%) | $0 |
| 7+ Person Families | 64 (2.8%) | $111,136 |
| Total | 2,331 (100.0%) | $107,436 |
Family Income by Number of Earners in Lynwood
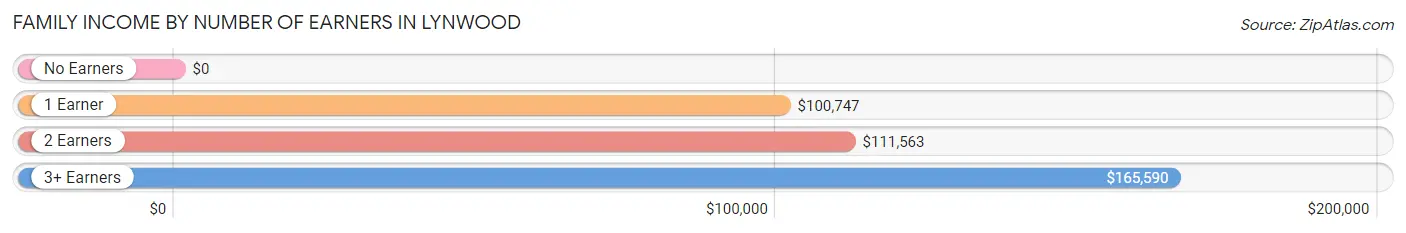
| Number of Earners | # Families | Median Income |
| No Earners | 227 (9.7%) | $0 |
| 1 Earner | 732 (31.4%) | $100,747 |
| 2 Earners | 879 (37.7%) | $111,563 |
| 3+ Earners | 493 (21.1%) | $165,590 |
| Total | 2,331 (100.0%) | $107,436 |
Household Income in Lynwood
Household Income Brackets in Lynwood
With 725 households falling in the category, the $100,000 to $149,999 income range is the most frequent in Lynwood, accounting for 22.1% of all households. In contrast, only 98 households (3.0%) fall into the $10,000 to $14,999 income bracket, making it the least populous group.
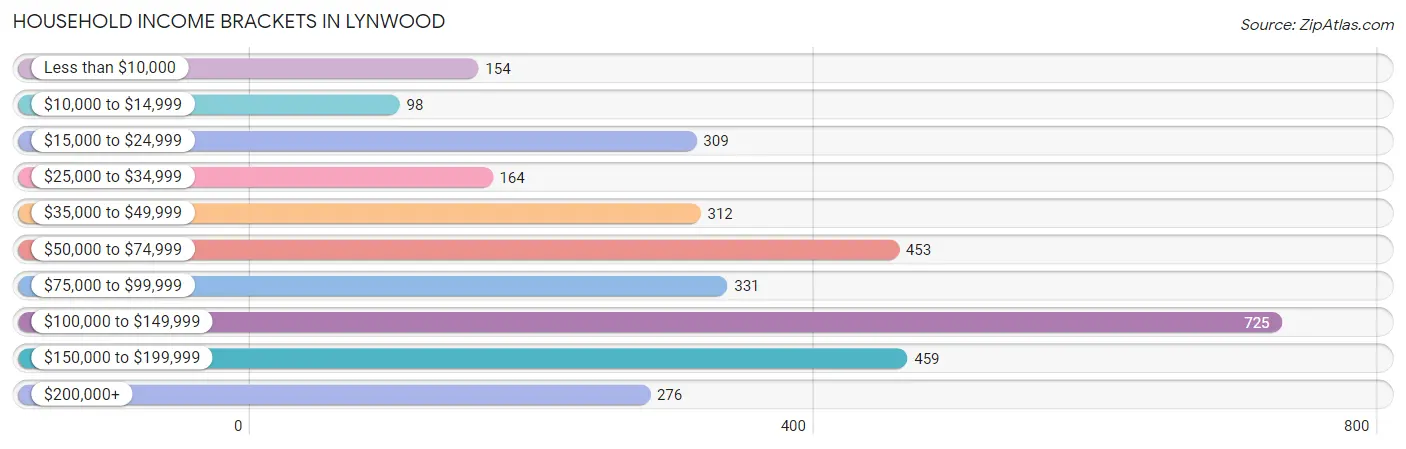
| Income Bracket | # Households | % Households |
| Less than $10,000 | 154 | 4.7% |
| $10,000 to $14,999 | 98 | 3.0% |
| $15,000 to $24,999 | 309 | 9.4% |
| $25,000 to $34,999 | 164 | 5.0% |
| $35,000 to $49,999 | 312 | 9.5% |
| $50,000 to $74,999 | 453 | 13.8% |
| $75,000 to $99,999 | 331 | 10.1% |
| $100,000 to $149,999 | 725 | 22.1% |
| $150,000 to $199,999 | 459 | 14.0% |
| $200,000+ | 276 | 8.4% |
Household Income by Householder Age in Lynwood
The median household income in Lynwood is $80,789, with the highest median household income of $122,375 found in the 45 to 64 years age bracket for the primary householder. A total of 1,300 households (39.6%) fall into this category. Meanwhile, the 15 to 24 years age bracket for the primary householder has the lowest median household income of $0, with 187 households (5.7%) in this group.
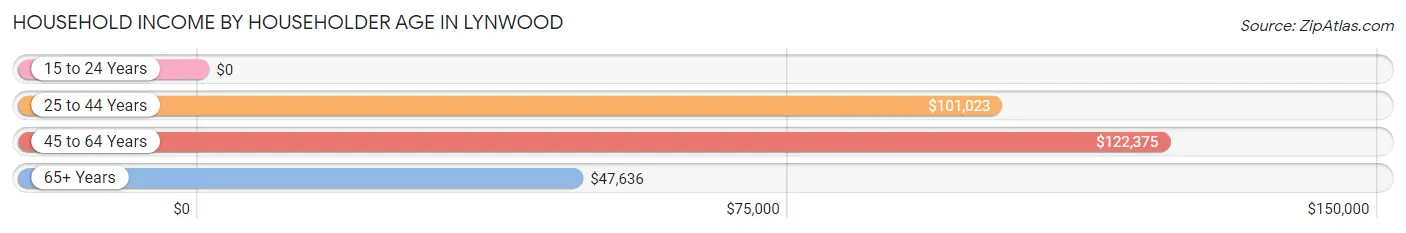
| Income Bracket | # Households | Median Income |
| 15 to 24 Years | 187 (5.7%) | $0 |
| 25 to 44 Years | 603 (18.4%) | $101,023 |
| 45 to 64 Years | 1,300 (39.6%) | $122,375 |
| 65+ Years | 1,192 (36.3%) | $47,636 |
| Total | 3,282 (100.0%) | $80,789 |
Poverty in Lynwood
Income Below Poverty by Sex and Age in Lynwood
With 6.5% poverty level for males and 7.1% for females among the residents of Lynwood, under 5 year old males and 65 to 74 year old females are the most vulnerable to poverty, with 83 males (26.9%) and 101 females (19.4%) in their respective age groups living below the poverty level.
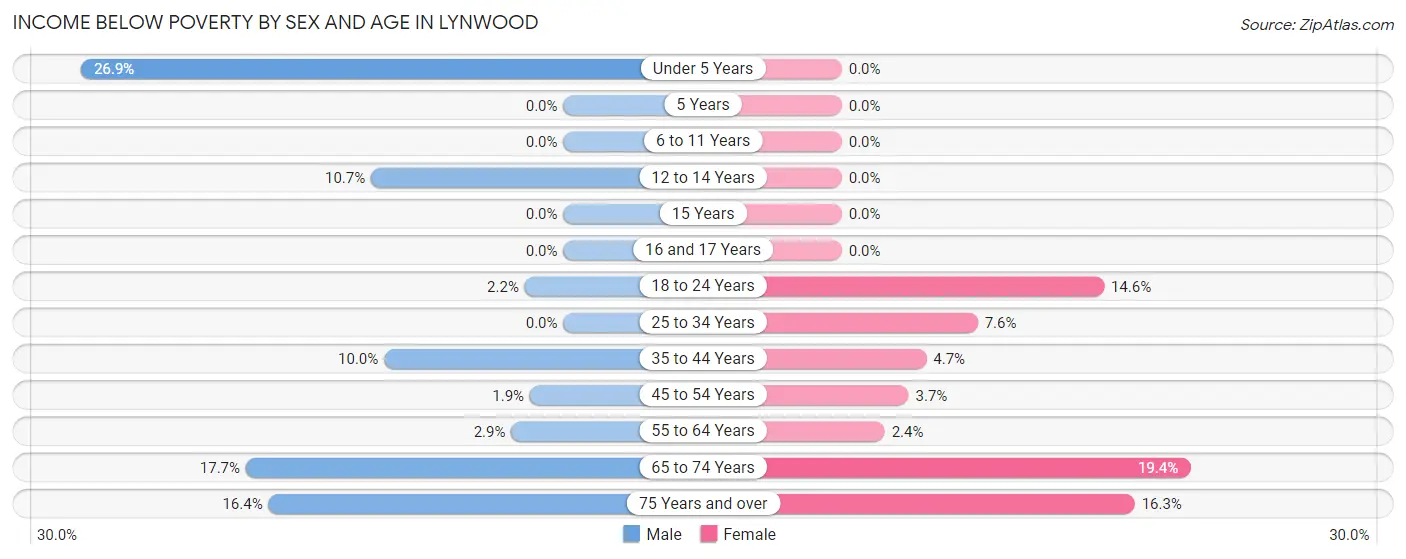
| Age Bracket | Male | Female |
| Under 5 Years | 83 (26.9%) | 0 (0.0%) |
| 5 Years | 0 (0.0%) | 0 (0.0%) |
| 6 to 11 Years | 0 (0.0%) | 0 (0.0%) |
| 12 to 14 Years | 27 (10.7%) | 0 (0.0%) |
| 15 Years | 0 (0.0%) | 0 (0.0%) |
| 16 and 17 Years | 0 (0.0%) | 0 (0.0%) |
| 18 to 24 Years | 12 (2.1%) | 59 (14.6%) |
| 25 to 34 Years | 0 (0.0%) | 23 (7.6%) |
| 35 to 44 Years | 41 (10.0%) | 29 (4.7%) |
| 45 to 54 Years | 14 (1.9%) | 25 (3.7%) |
| 55 to 64 Years | 16 (2.9%) | 18 (2.4%) |
| 65 to 74 Years | 73 (17.7%) | 101 (19.4%) |
| 75 Years and over | 11 (16.4%) | 85 (16.3%) |
| Total | 277 (6.5%) | 340 (7.1%) |
Income Above Poverty by Sex and Age in Lynwood
According to the poverty statistics in Lynwood, males aged 5 years and females aged under 5 years are the age groups that are most secure financially, with 100.0% of males and 100.0% of females in these age groups living above the poverty line.
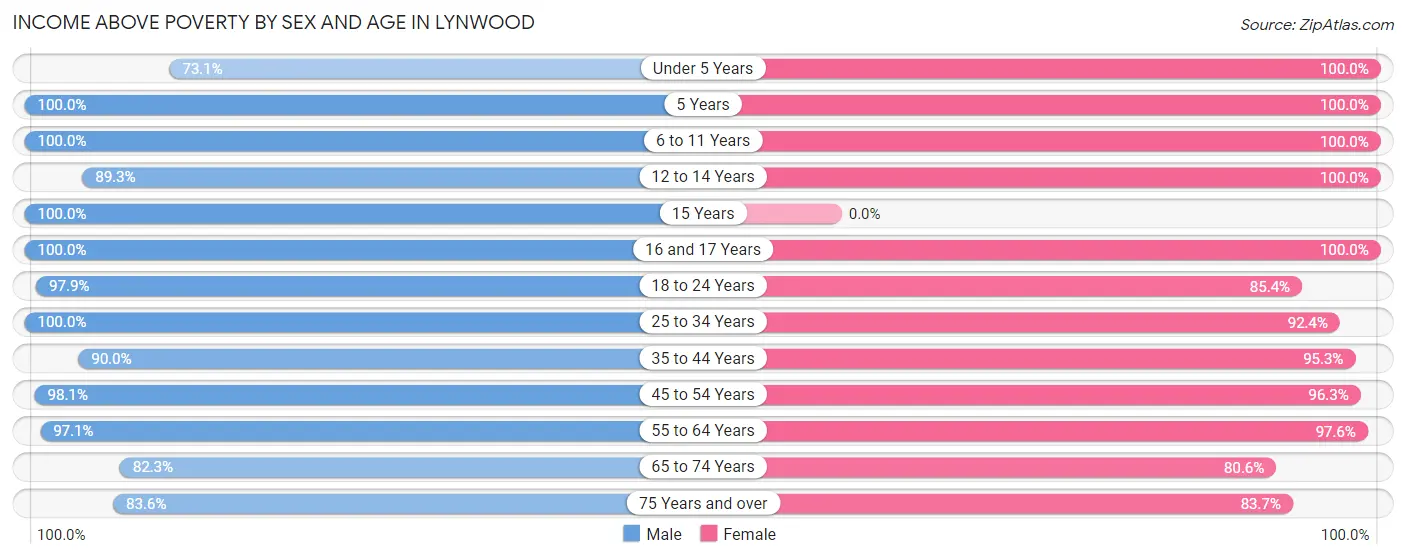
| Age Bracket | Male | Female |
| Under 5 Years | 226 (73.1%) | 276 (100.0%) |
| 5 Years | 43 (100.0%) | 15 (100.0%) |
| 6 to 11 Years | 226 (100.0%) | 222 (100.0%) |
| 12 to 14 Years | 225 (89.3%) | 452 (100.0%) |
| 15 Years | 40 (100.0%) | 0 (0.0%) |
| 16 and 17 Years | 189 (100.0%) | 38 (100.0%) |
| 18 to 24 Years | 547 (97.9%) | 345 (85.4%) |
| 25 to 34 Years | 455 (100.0%) | 281 (92.4%) |
| 35 to 44 Years | 370 (90.0%) | 587 (95.3%) |
| 45 to 54 Years | 739 (98.1%) | 647 (96.3%) |
| 55 to 64 Years | 535 (97.1%) | 736 (97.6%) |
| 65 to 74 Years | 340 (82.3%) | 420 (80.6%) |
| 75 Years and over | 56 (83.6%) | 436 (83.7%) |
| Total | 3,991 (93.5%) | 4,455 (92.9%) |
Income Below Poverty Among Married-Couple Families in Lynwood
The poverty statistics for married-couple families in Lynwood show that 5.0% or 73 of the total 1,469 families live below the poverty line. Families with no children have the highest poverty rate of 8.5%, comprising of 73 families. On the other hand, families with 1 or 2 children have the lowest poverty rate of 0.0%, which includes 0 families.
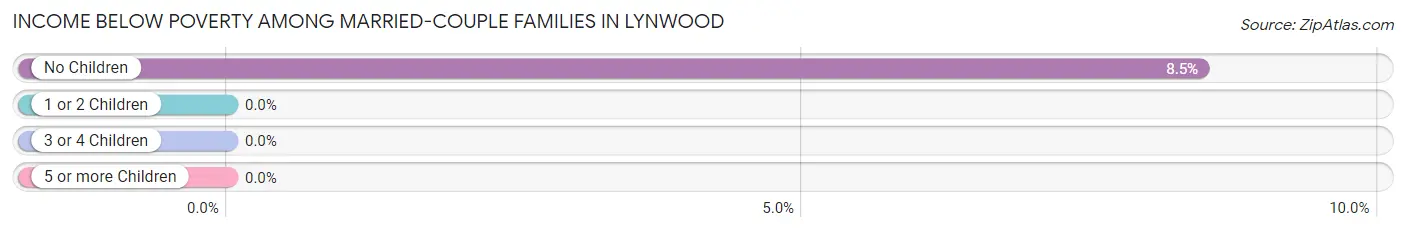
| Children | Above Poverty | Below Poverty |
| No Children | 790 (91.5%) | 73 (8.5%) |
| 1 or 2 Children | 475 (100.0%) | 0 (0.0%) |
| 3 or 4 Children | 119 (100.0%) | 0 (0.0%) |
| 5 or more Children | 12 (100.0%) | 0 (0.0%) |
| Total | 1,396 (95.0%) | 73 (5.0%) |
Income Below Poverty Among Single-Parent Households in Lynwood
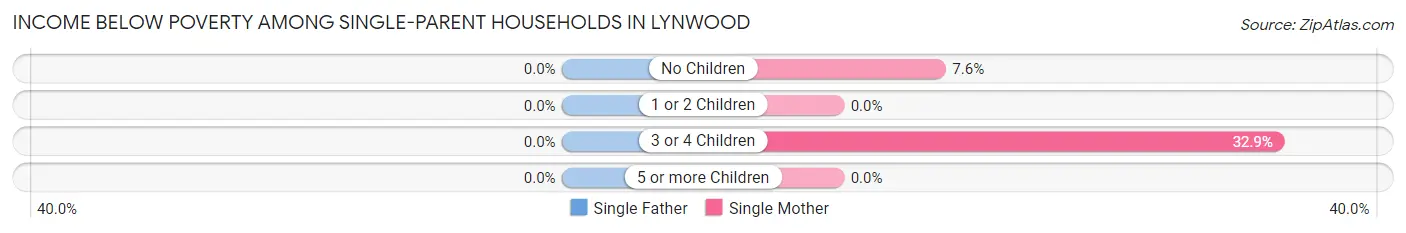
| Children | Single Father | Single Mother |
| No Children | 0 (0.0%) | 30 (7.6%) |
| 1 or 2 Children | 0 (0.0%) | 0 (0.0%) |
| 3 or 4 Children | 0 (0.0%) | 23 (32.9%) |
| 5 or more Children | 0 (0.0%) | 0 (0.0%) |
| Total | 0 (0.0%) | 53 (6.7%) |
Income Below Poverty Among Married-Couple vs Single-Parent Households in Lynwood
The poverty data for Lynwood shows that 73 of the married-couple family households (5.0%) and 53 of the single-parent households (6.1%) are living below the poverty level. Within the married-couple family households, those with no children have the highest poverty rate, with 73 households (8.5%) falling below the poverty line. Among the single-parent households, those with 3 or 4 children have the highest poverty rate, with 23 household (32.9%) living below poverty.
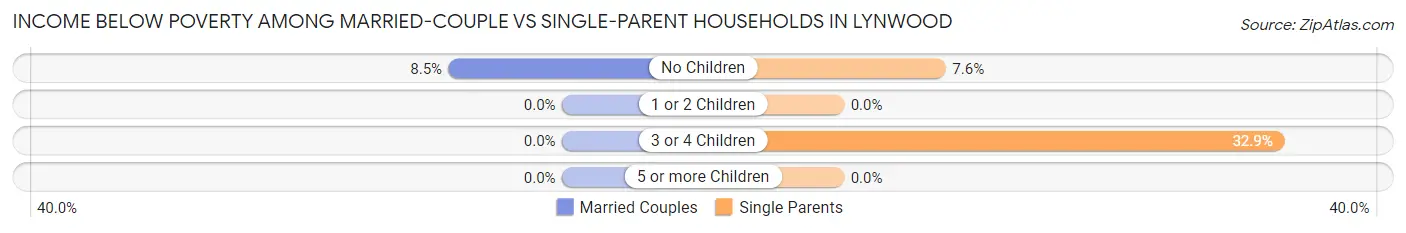
| Children | Married-Couple Families | Single-Parent Households |
| No Children | 73 (8.5%) | 30 (7.6%) |
| 1 or 2 Children | 0 (0.0%) | 0 (0.0%) |
| 3 or 4 Children | 0 (0.0%) | 23 (32.9%) |
| 5 or more Children | 0 (0.0%) | 0 (0.0%) |
| Total | 73 (5.0%) | 53 (6.1%) |
Race in Lynwood
The most populous races in Lynwood are Black / African American (6,416 | 70.6%), White / Caucasian (1,256 | 13.8%), and Some other Race (792 | 8.7%).
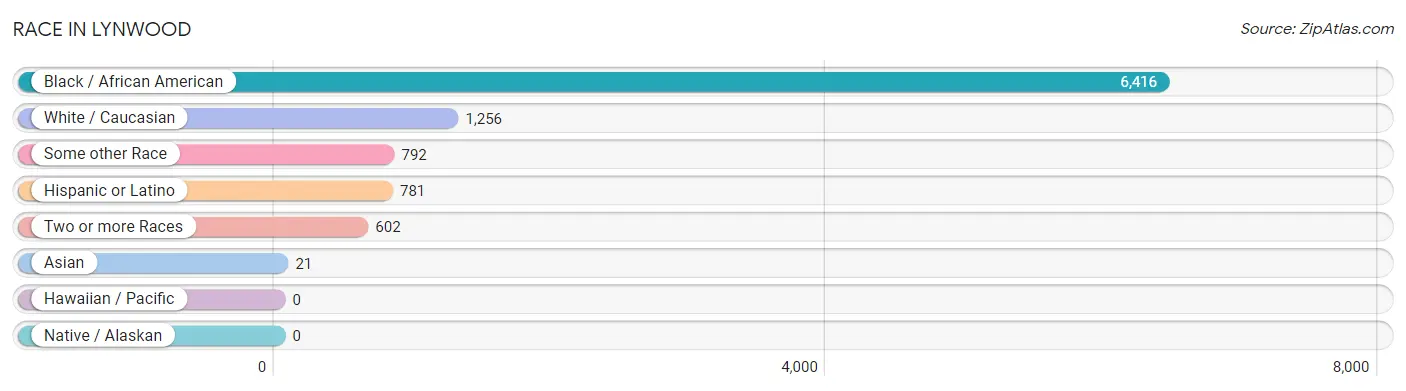
| Race | # Population | % Population |
| Asian | 21 | 0.2% |
| Black / African American | 6,416 | 70.6% |
| Hawaiian / Pacific | 0 | 0.0% |
| Hispanic or Latino | 781 | 8.6% |
| Native / Alaskan | 0 | 0.0% |
| White / Caucasian | 1,256 | 13.8% |
| Two or more Races | 602 | 6.6% |
| Some other Race | 792 | 8.7% |
| Total | 9,087 | 100.0% |
Ancestry in Lynwood
The most populous ancestries reported in Lynwood are Mexican (780 | 8.6%), American (539 | 5.9%), Polish (365 | 4.0%), German (346 | 3.8%), and Subsaharan African (289 | 3.2%), together accounting for 25.5% of all Lynwood residents.
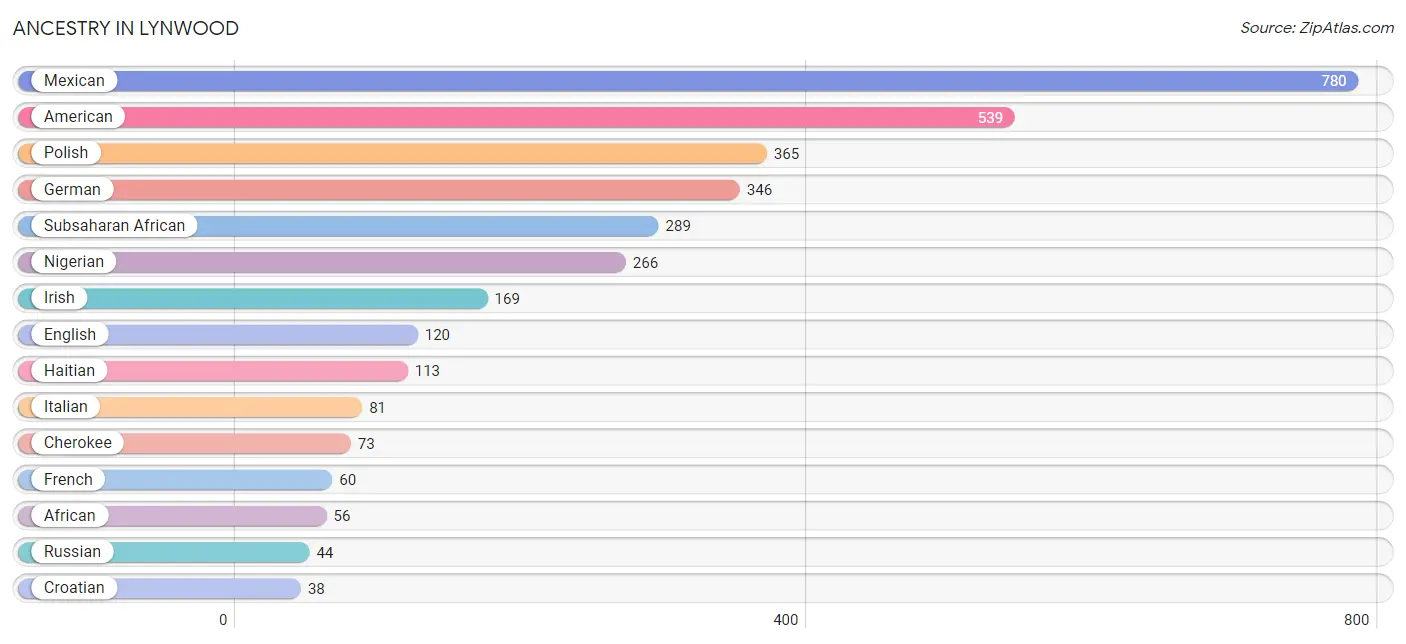
| Ancestry | # Population | % Population |
| African | 56 | 0.6% |
| American | 539 | 5.9% |
| Belgian | 18 | 0.2% |
| Burmese | 21 | 0.2% |
| Cherokee | 73 | 0.8% |
| Croatian | 38 | 0.4% |
| Czech | 22 | 0.2% |
| Dutch | 36 | 0.4% |
| English | 120 | 1.3% |
| French | 60 | 0.7% |
| German | 346 | 3.8% |
| Greek | 8 | 0.1% |
| Haitian | 113 | 1.2% |
| Irish | 169 | 1.9% |
| Italian | 81 | 0.9% |
| Kenyan | 23 | 0.3% |
| Mexican | 780 | 8.6% |
| Nigerian | 266 | 2.9% |
| Norwegian | 21 | 0.2% |
| Polish | 365 | 4.0% |
| Puerto Rican | 1 | 0.0% |
| Russian | 44 | 0.5% |
| Scotch-Irish | 22 | 0.2% |
| Scottish | 15 | 0.2% |
| Subsaharan African | 289 | 3.2% |
| Swedish | 17 | 0.2% | View All 26 Rows |
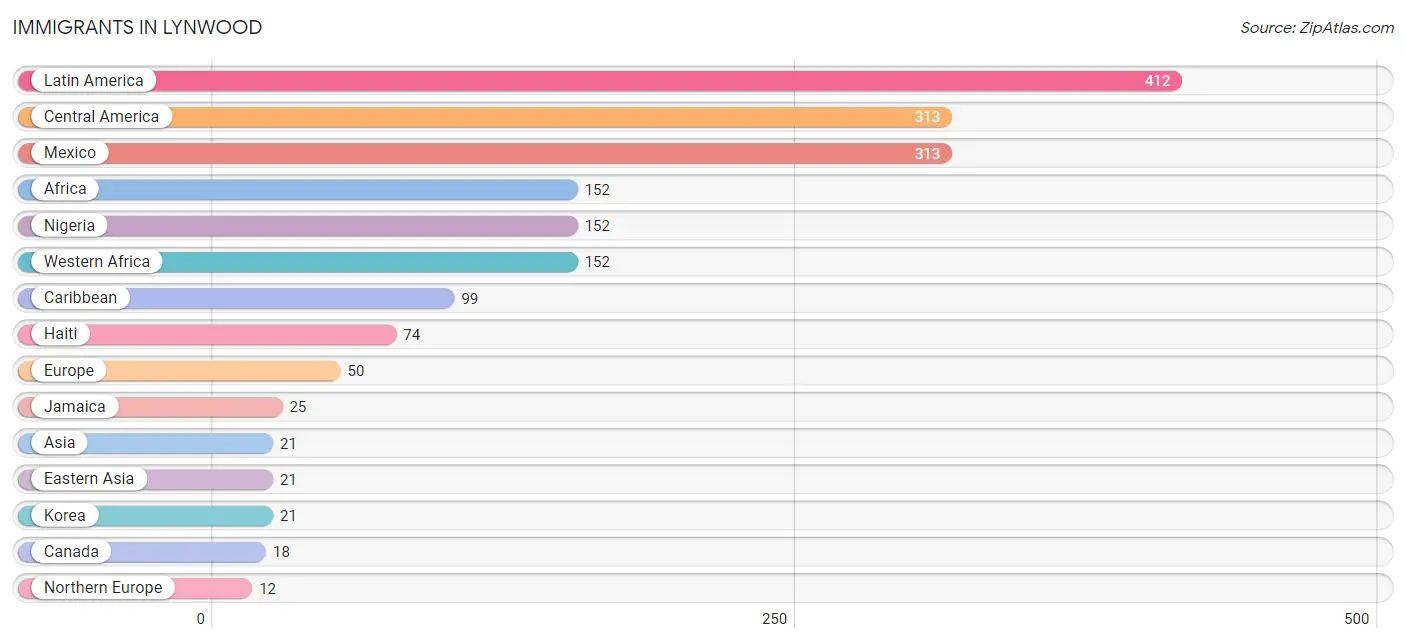
Immigrants in Lynwood
The most numerous immigrant groups reported in Lynwood came from Latin America (412 | 4.5%), Central America (313 | 3.4%), Mexico (313 | 3.4%), Africa (152 | 1.7%), and Nigeria (152 | 1.7%), together accounting for 14.7% of all Lynwood residents.
| Immigration Origin | # Population | % Population |
| Africa | 152 | 1.7% |
| Asia | 21 | 0.2% |
| Canada | 18 | 0.2% |
| Caribbean | 99 | 1.1% |
| Central America | 313 | 3.4% |
| Eastern Asia | 21 | 0.2% |
| Europe | 50 | 0.5% |
| Haiti | 74 | 0.8% |
| Jamaica | 25 | 0.3% |
| Korea | 21 | 0.2% |
| Latin America | 412 | 4.5% |
| Mexico | 313 | 3.4% |
| Nigeria | 152 | 1.7% |
| Northern Europe | 12 | 0.1% |
| Western Africa | 152 | 1.7% | View All 15 Rows |
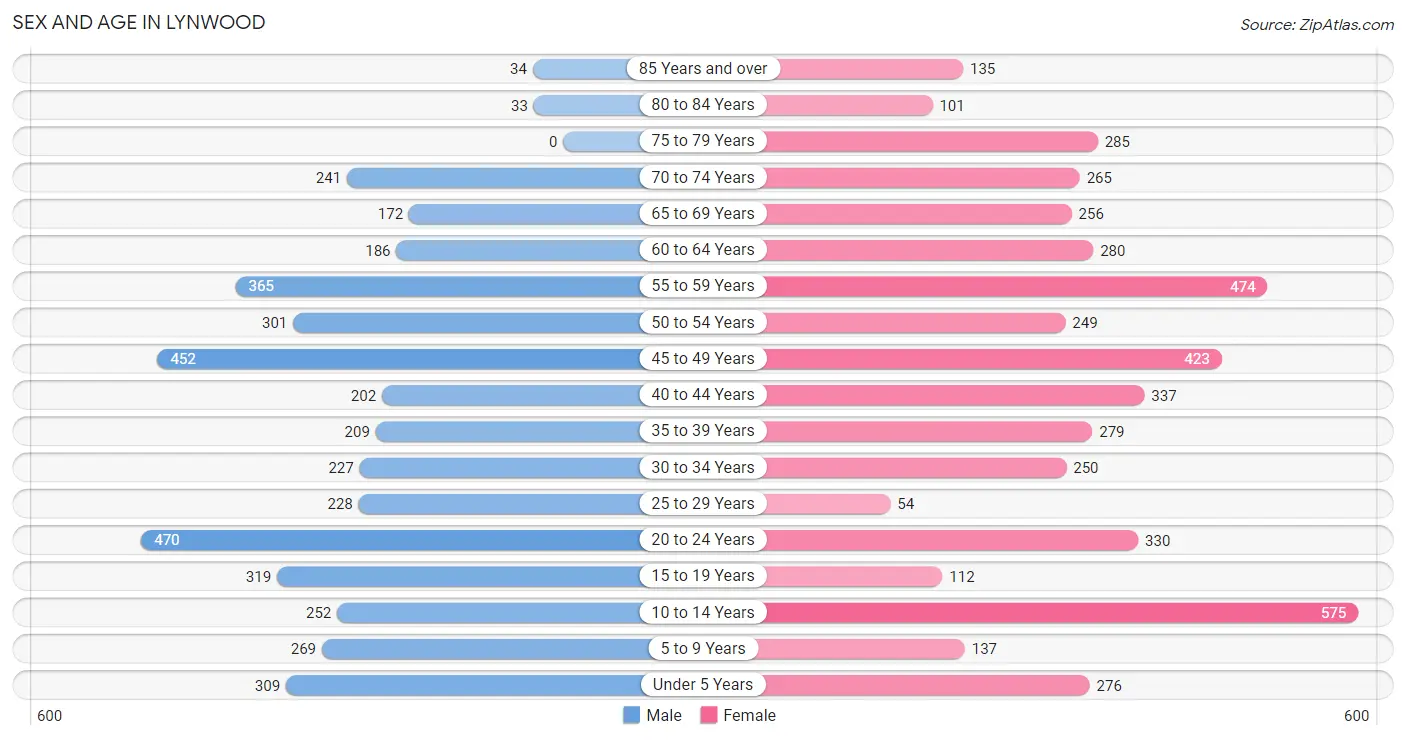
Sex and Age in Lynwood
Sex and Age in Lynwood
The most populous age groups in Lynwood are 20 to 24 Years (470 | 11.0%) for men and 10 to 14 Years (575 | 11.9%) for women.
| Age Bracket | Male | Female |
| Under 5 Years | 309 (7.2%) | 276 (5.7%) |
| 5 to 9 Years | 269 (6.3%) | 137 (2.8%) |
| 10 to 14 Years | 252 (5.9%) | 575 (11.9%) |
| 15 to 19 Years | 319 (7.5%) | 112 (2.3%) |
| 20 to 24 Years | 470 (11.0%) | 330 (6.9%) |
| 25 to 29 Years | 228 (5.3%) | 54 (1.1%) |
| 30 to 34 Years | 227 (5.3%) | 250 (5.2%) |
| 35 to 39 Years | 209 (4.9%) | 279 (5.8%) |
| 40 to 44 Years | 202 (4.7%) | 337 (7.0%) |
| 45 to 49 Years | 452 (10.6%) | 423 (8.8%) |
| 50 to 54 Years | 301 (7.0%) | 249 (5.2%) |
| 55 to 59 Years | 365 (8.6%) | 474 (9.8%) |
| 60 to 64 Years | 186 (4.4%) | 280 (5.8%) |
| 65 to 69 Years | 172 (4.0%) | 256 (5.3%) |
| 70 to 74 Years | 241 (5.7%) | 265 (5.5%) |
| 75 to 79 Years | 0 (0.0%) | 285 (5.9%) |
| 80 to 84 Years | 33 (0.8%) | 101 (2.1%) |
| 85 Years and over | 34 (0.8%) | 135 (2.8%) |
| Total | 4,269 (100.0%) | 4,818 (100.0%) |
Families and Households in Lynwood
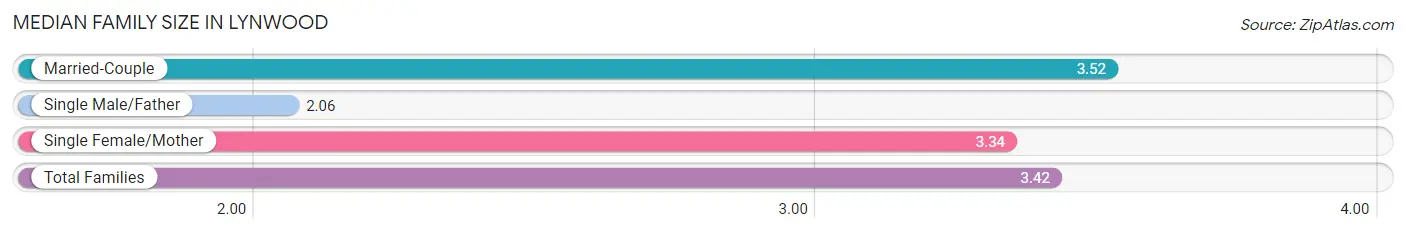
Median Family Size in Lynwood
The median family size in Lynwood is 3.42 persons per family, with married-couple families (1,469 | 63.0%) accounting for the largest median family size of 3.52 persons per family. On the other hand, single male/father families (65 | 2.8%) represent the smallest median family size with 2.06 persons per family.
| Family Type | # Families | Family Size |
| Married-Couple | 1,469 (63.0%) | 3.52 |
| Single Male/Father | 65 (2.8%) | 2.06 |
| Single Female/Mother | 797 (34.2%) | 3.34 |
| Total Families | 2,331 (100.0%) | 3.42 |
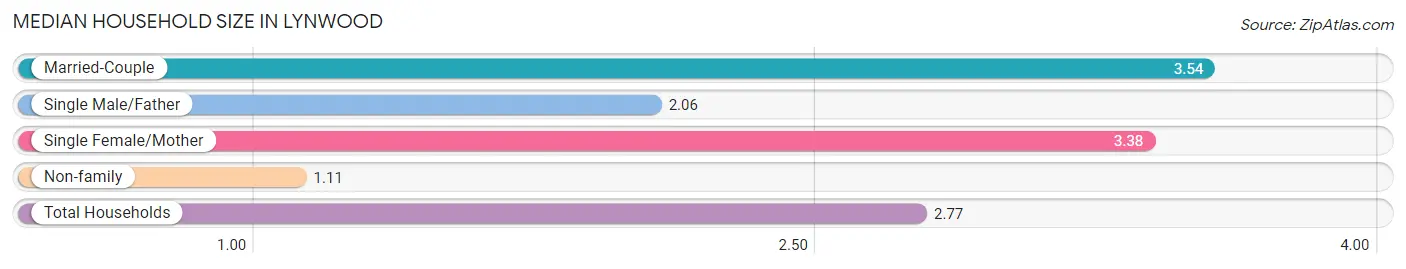
Median Household Size in Lynwood
The median household size in Lynwood is 2.77 persons per household, with married-couple households (1,469 | 44.8%) accounting for the largest median household size of 3.54 persons per household. non-family households (951 | 29.0%) represent the smallest median household size with 1.11 persons per household.
| Household Type | # Households | Household Size |
| Married-Couple | 1,469 (44.8%) | 3.54 |
| Single Male/Father | 65 (2.0%) | 2.06 |
| Single Female/Mother | 797 (24.3%) | 3.38 |
| Non-family | 951 (29.0%) | 1.11 |
| Total Households | 3,282 (100.0%) | 2.77 |
Household Size by Marriage Status in Lynwood
Out of a total of 3,282 households in Lynwood, 2,331 (71.0%) are family households, while 951 (29.0%) are nonfamily households. The most numerous type of family households are 2-person households, comprising 1,063, and the most common type of nonfamily households are 1-person households, comprising 891.
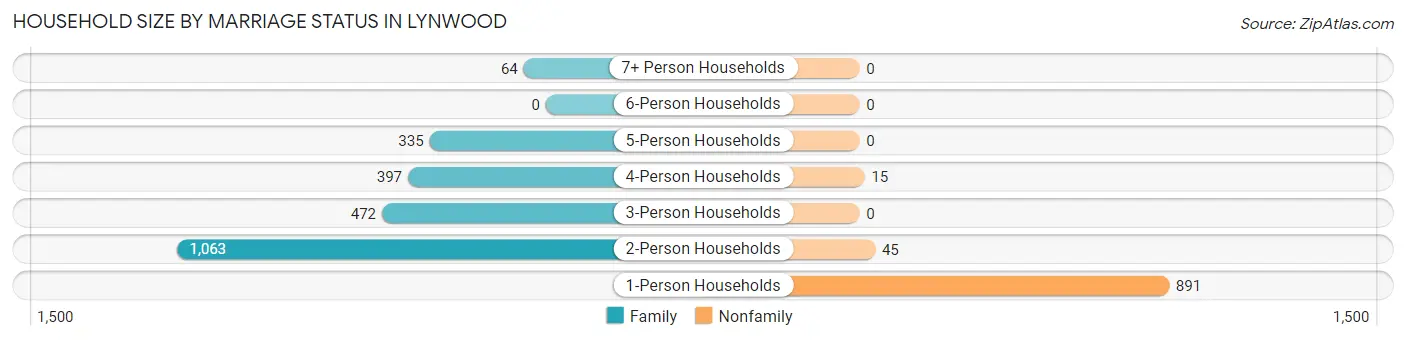
| Household Size | Family Households | Nonfamily Households |
| 1-Person Households | - | 891 (27.2%) |
| 2-Person Households | 1,063 (32.4%) | 45 (1.4%) |
| 3-Person Households | 472 (14.4%) | 0 (0.0%) |
| 4-Person Households | 397 (12.1%) | 15 (0.5%) |
| 5-Person Households | 335 (10.2%) | 0 (0.0%) |
| 6-Person Households | 0 (0.0%) | 0 (0.0%) |
| 7+ Person Households | 64 (1.9%) | 0 (0.0%) |
| Total | 2,331 (71.0%) | 951 (29.0%) |
Female Fertility in Lynwood
Fertility by Age in Lynwood
Average fertility rate in Lynwood is 44.0 births per 1,000 women. Women in the age bracket of 20 to 34 years have the highest fertility rate with 84.0 births per 1,000 women. Women in the age bracket of 20 to 34 years acount for 63.9% of all women with births.
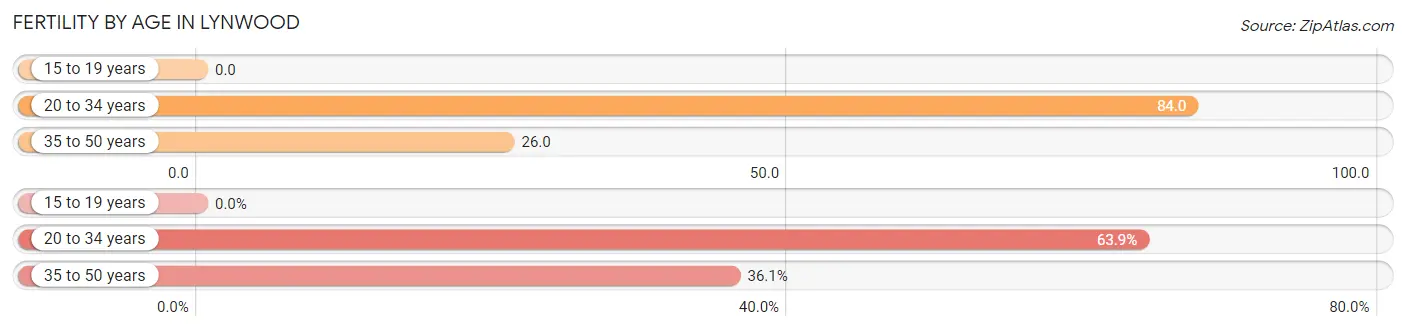
| Age Bracket | Women with Births | Births / 1,000 Women |
| 15 to 19 years | 0 (0.0%) | 0.0 |
| 20 to 34 years | 53 (63.9%) | 84.0 |
| 35 to 50 years | 30 (36.1%) | 26.0 |
| Total | 83 (100.0%) | 44.0 |
Fertility by Age by Marriage Status in Lynwood
36.1% of women with births (83) in Lynwood are married. The highest percentage of unmarried women with births falls into 20 to 34 years age bracket with 100.0% of them unmarried at the time of birth, while the lowest percentage of unmarried women with births belong to 35 to 50 years age bracket with 0.0% of them unmarried.
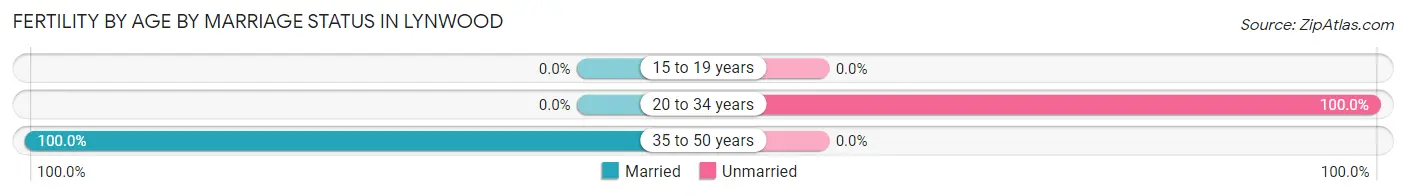
| Age Bracket | Married | Unmarried |
| 15 to 19 years | 0 (0.0%) | 0 (0.0%) |
| 20 to 34 years | 0 (0.0%) | 53 (100.0%) |
| 35 to 50 years | 30 (100.0%) | 0 (0.0%) |
| Total | 30 (36.1%) | 53 (63.9%) |
Fertility by Education in Lynwood
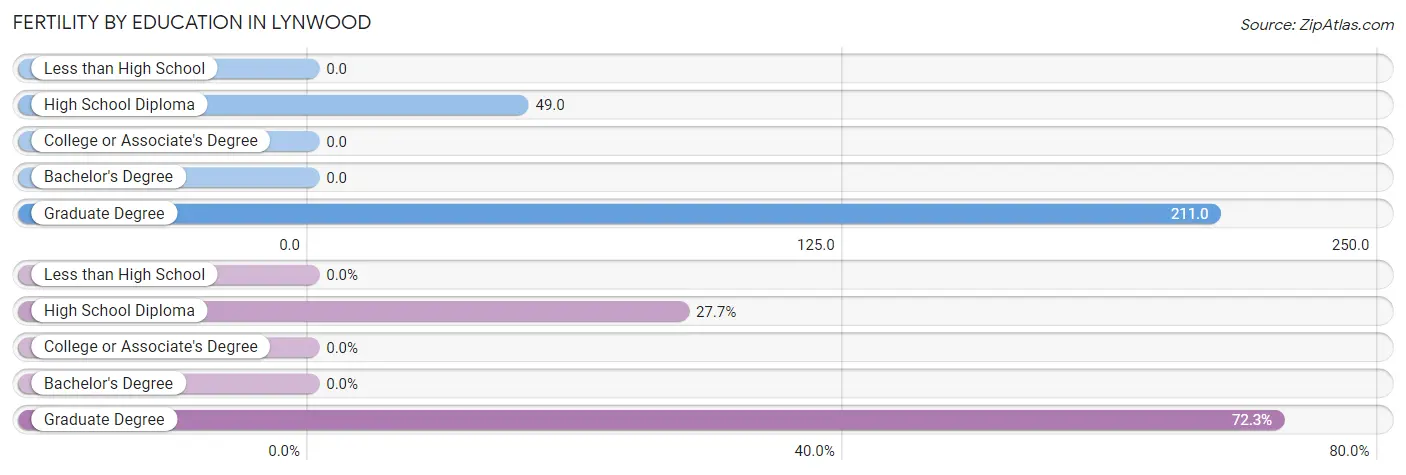
| Educational Attainment | Women with Births | Births / 1,000 Women |
| Less than High School | 0 (0.0%) | 0.0 |
| High School Diploma | 23 (27.7%) | 49.0 |
| College or Associate's Degree | 0 (0.0%) | 0.0 |
| Bachelor's Degree | 0 (0.0%) | 0.0 |
| Graduate Degree | 60 (72.3%) | 211.0 |
| Total | 83 (100.0%) | 44.0 |
Fertility by Education by Marriage Status in Lynwood
63.9% of women with births in Lynwood are unmarried. Women with the educational attainment of graduate degree are most likely to be married with 50.0% of them married at childbirth, while women with the educational attainment of high school diploma are least likely to be married with 100.0% of them unmarried at childbirth.
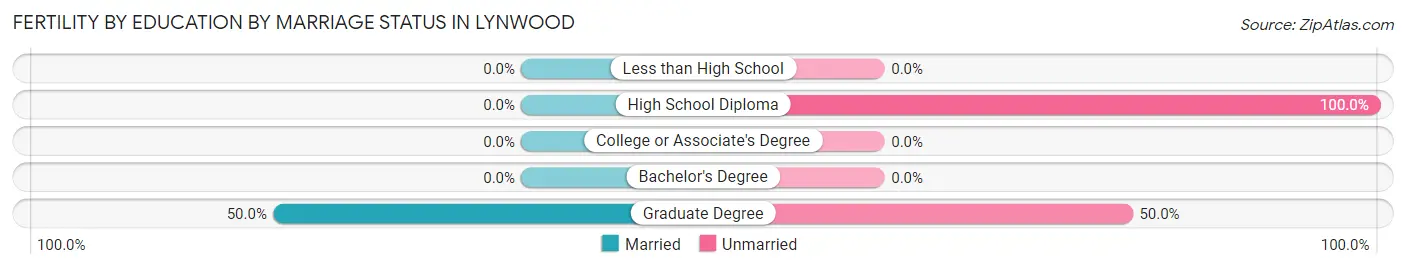
| Educational Attainment | Married | Unmarried |
| Less than High School | 0 (0.0%) | 0 (0.0%) |
| High School Diploma | 0 (0.0%) | 23 (100.0%) |
| College or Associate's Degree | 0 (0.0%) | 0 (0.0%) |
| Bachelor's Degree | 0 (0.0%) | 0 (0.0%) |
| Graduate Degree | 30 (50.0%) | 30 (50.0%) |
| Total | 30 (36.1%) | 53 (63.9%) |
Employment Characteristics in Lynwood
Employment by Class of Employer in Lynwood
Among the 3,989 employed individuals in Lynwood, private company employees (2,272 | 57.0%), state government employees (531 | 13.3%), and not-for-profit organizations (520 | 13.0%) make up the most common classes of employment.
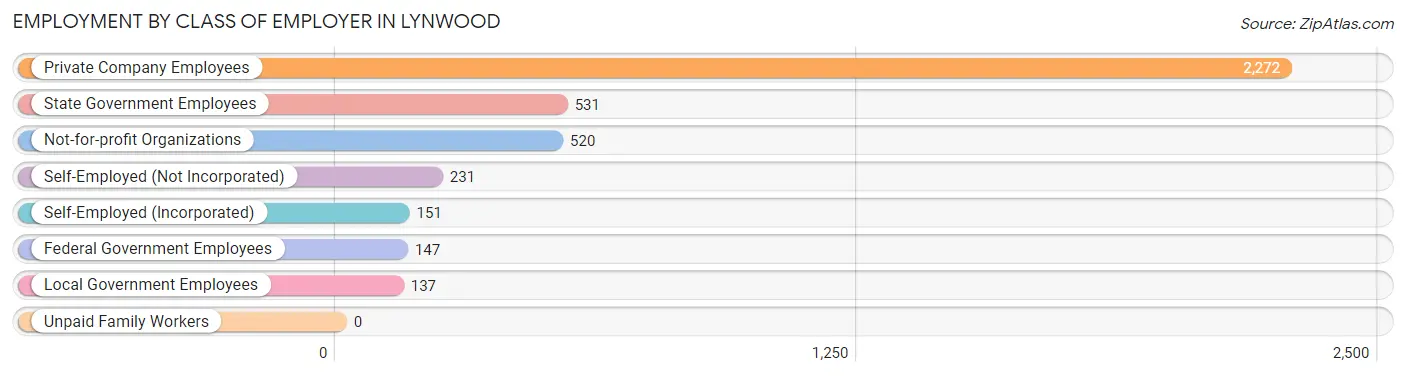
| Employer Class | # Employees | % Employees |
| Private Company Employees | 2,272 | 57.0% |
| Self-Employed (Incorporated) | 151 | 3.8% |
| Self-Employed (Not Incorporated) | 231 | 5.8% |
| Not-for-profit Organizations | 520 | 13.0% |
| Local Government Employees | 137 | 3.4% |
| State Government Employees | 531 | 13.3% |
| Federal Government Employees | 147 | 3.7% |
| Unpaid Family Workers | 0 | 0.0% |
| Total | 3,989 | 100.0% |
Employment Status by Age in Lynwood
According to the labor force statistics for Lynwood, out of the total population over 16 years of age (7,228), 62.4% or 4,510 individuals are in the labor force, with 5.0% or 226 of them unemployed. The age group with the highest labor force participation rate is 45 to 54 years, with 87.2% or 1,243 individuals in the labor force. Within the labor force, the 60 to 64 years age range has the highest percentage of unemployed individuals, with 20.3% or 49 of them being unemployed.
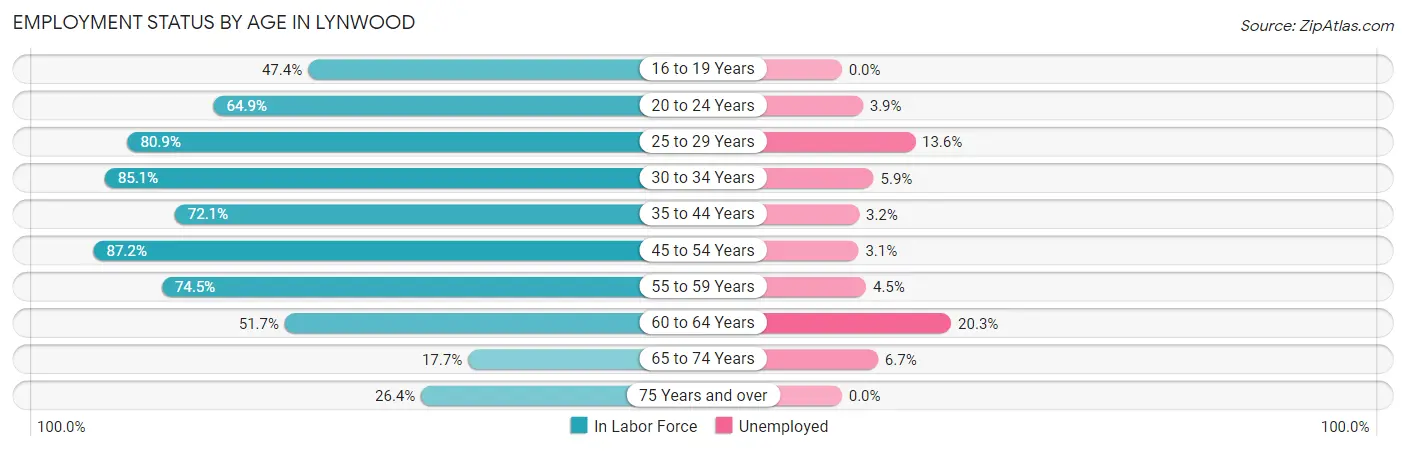
| Age Bracket | In Labor Force | Unemployed |
| 16 to 19 Years | 185 (47.4%) | 0 (0.0%) |
| 20 to 24 Years | 519 (64.9%) | 20 (3.9%) |
| 25 to 29 Years | 228 (80.9%) | 31 (13.6%) |
| 30 to 34 Years | 406 (85.1%) | 24 (5.9%) |
| 35 to 44 Years | 740 (72.1%) | 24 (3.2%) |
| 45 to 54 Years | 1,243 (87.2%) | 39 (3.1%) |
| 55 to 59 Years | 625 (74.5%) | 28 (4.5%) |
| 60 to 64 Years | 241 (51.7%) | 49 (20.3%) |
| 65 to 74 Years | 165 (17.7%) | 11 (6.7%) |
| 75 Years and over | 155 (26.4%) | 0 (0.0%) |
| Total | 4,510 (62.4%) | 226 (5.0%) |
Employment Status by Educational Attainment in Lynwood
According to labor force statistics for Lynwood, 77.1% of individuals (3,482) out of the total population between 25 and 64 years of age (4,516) are in the labor force, with 5.6% or 195 of them being unemployed. The group with the highest labor force participation rate are those with the educational attainment of bachelor's degree or higher, with 91.9% or 2,002 individuals in the labor force. Within the labor force, individuals with less than high school education have the highest percentage of unemployment, with 15.4% or 12 of them being unemployed.
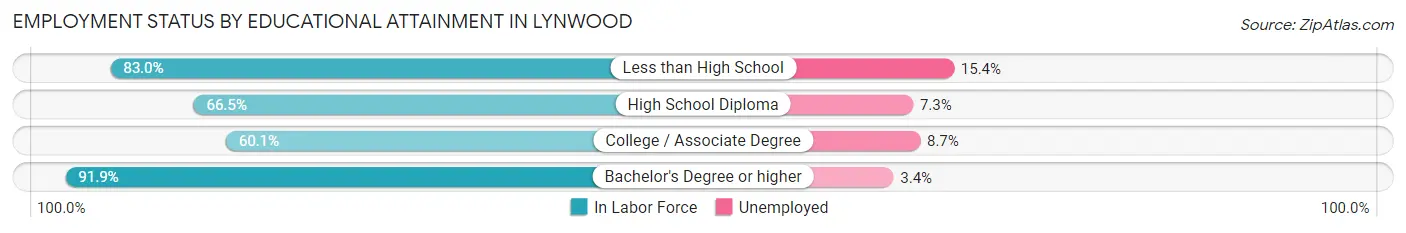
| Educational Attainment | In Labor Force | Unemployed |
| Less than High School | 78 (83.0%) | 14 (15.4%) |
| High School Diploma | 579 (66.5%) | 64 (7.3%) |
| College / Associate Degree | 825 (60.1%) | 119 (8.7%) |
| Bachelor's Degree or higher | 2,002 (91.9%) | 74 (3.4%) |
| Total | 3,482 (77.1%) | 253 (5.6%) |
Employment Occupations by Sex in Lynwood
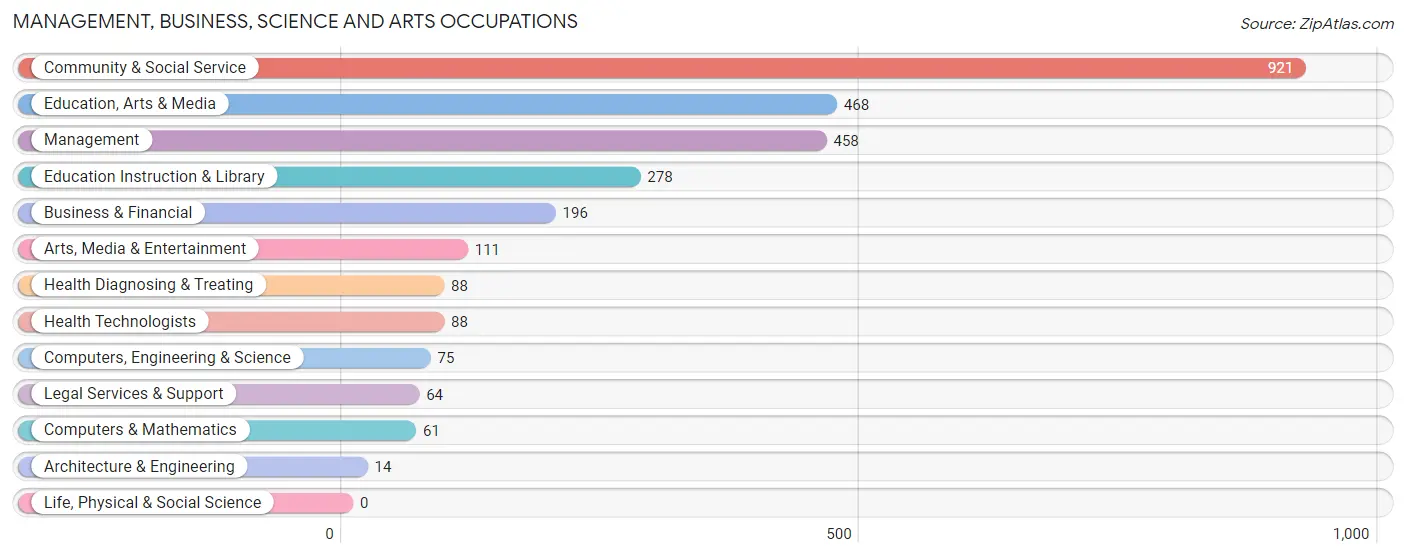
Management, Business, Science and Arts Occupations
The most common Management, Business, Science and Arts occupations in Lynwood are Community & Social Service (921 | 21.5%), Education, Arts & Media (468 | 10.9%), Management (458 | 10.7%), Education Instruction & Library (278 | 6.5%), and Business & Financial (196 | 4.6%).
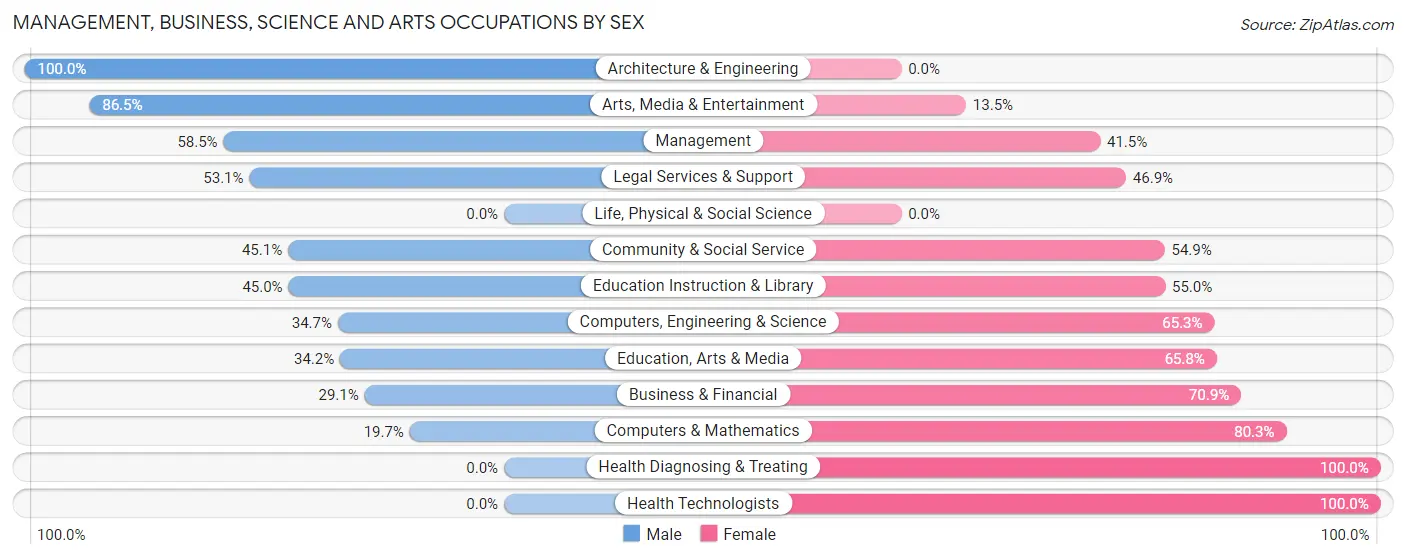
Management, Business, Science and Arts Occupations by Sex
Within the Management, Business, Science and Arts occupations in Lynwood, the most male-oriented occupations are Architecture & Engineering (100.0%), Arts, Media & Entertainment (86.5%), and Management (58.5%), while the most female-oriented occupations are Health Diagnosing & Treating (100.0%), Health Technologists (100.0%), and Computers & Mathematics (80.3%).
| Occupation | Male | Female |
| Management | 268 (58.5%) | 190 (41.5%) |
| Business & Financial | 57 (29.1%) | 139 (70.9%) |
| Computers, Engineering & Science | 26 (34.7%) | 49 (65.3%) |
| Computers & Mathematics | 12 (19.7%) | 49 (80.3%) |
| Architecture & Engineering | 14 (100.0%) | 0 (0.0%) |
| Life, Physical & Social Science | 0 (0.0%) | 0 (0.0%) |
| Community & Social Service | 415 (45.1%) | 506 (54.9%) |
| Education, Arts & Media | 160 (34.2%) | 308 (65.8%) |
| Legal Services & Support | 34 (53.1%) | 30 (46.9%) |
| Education Instruction & Library | 125 (45.0%) | 153 (55.0%) |
| Arts, Media & Entertainment | 96 (86.5%) | 15 (13.5%) |
| Health Diagnosing & Treating | 0 (0.0%) | 88 (100.0%) |
| Health Technologists | 0 (0.0%) | 88 (100.0%) |
| Total (Category) | 766 (44.1%) | 972 (55.9%) |
| Total (Overall) | 2,112 (49.3%) | 2,169 (50.7%) |
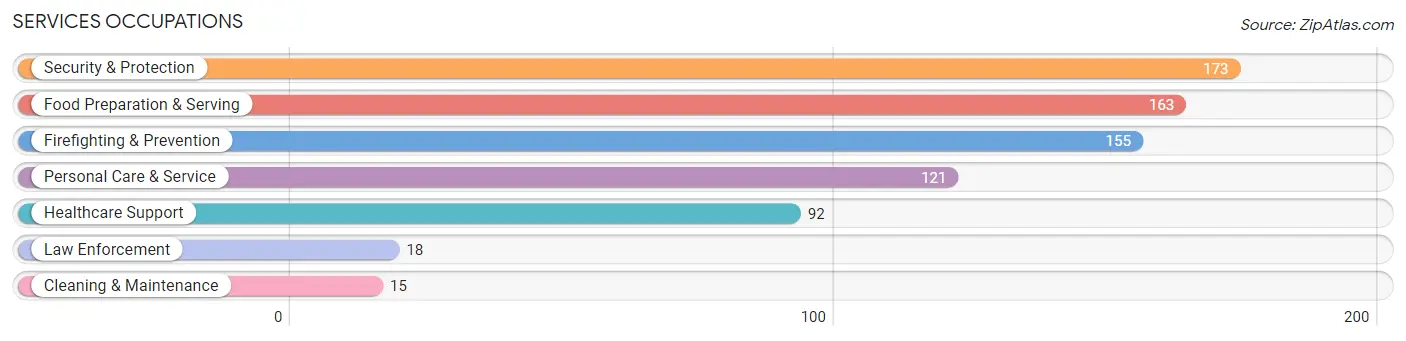
Services Occupations
The most common Services occupations in Lynwood are Security & Protection (173 | 4.0%), Food Preparation & Serving (163 | 3.8%), Firefighting & Prevention (155 | 3.6%), Personal Care & Service (121 | 2.8%), and Healthcare Support (92 | 2.1%).
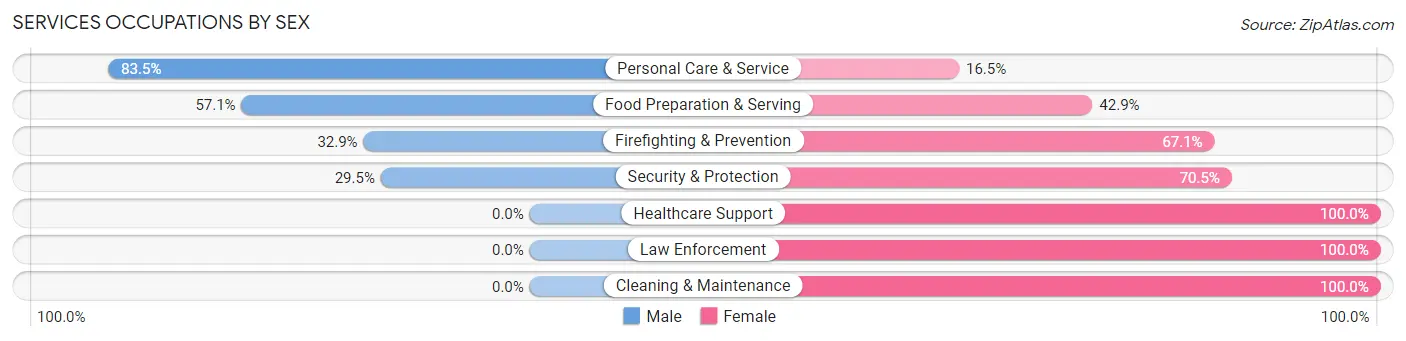
Services Occupations by Sex
Within the Services occupations in Lynwood, the most male-oriented occupations are Personal Care & Service (83.5%), Food Preparation & Serving (57.1%), and Firefighting & Prevention (32.9%), while the most female-oriented occupations are Healthcare Support (100.0%), Law Enforcement (100.0%), and Cleaning & Maintenance (100.0%).
| Occupation | Male | Female |
| Healthcare Support | 0 (0.0%) | 92 (100.0%) |
| Security & Protection | 51 (29.5%) | 122 (70.5%) |
| Firefighting & Prevention | 51 (32.9%) | 104 (67.1%) |
| Law Enforcement | 0 (0.0%) | 18 (100.0%) |
| Food Preparation & Serving | 93 (57.1%) | 70 (42.9%) |
| Cleaning & Maintenance | 0 (0.0%) | 15 (100.0%) |
| Personal Care & Service | 101 (83.5%) | 20 (16.5%) |
| Total (Category) | 245 (43.4%) | 319 (56.6%) |
| Total (Overall) | 2,112 (49.3%) | 2,169 (50.7%) |
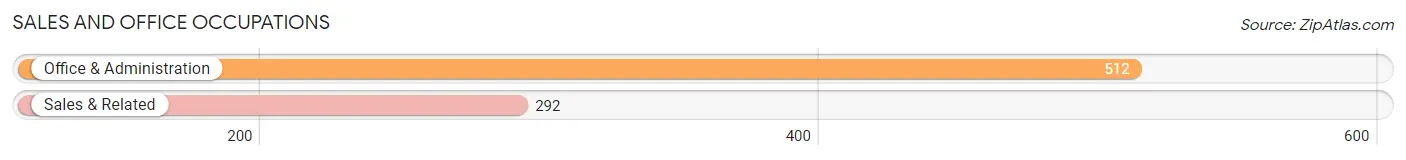
Sales and Office Occupations
The most common Sales and Office occupations in Lynwood are Office & Administration (512 | 12.0%), and Sales & Related (292 | 6.8%).
Sales and Office Occupations by Sex
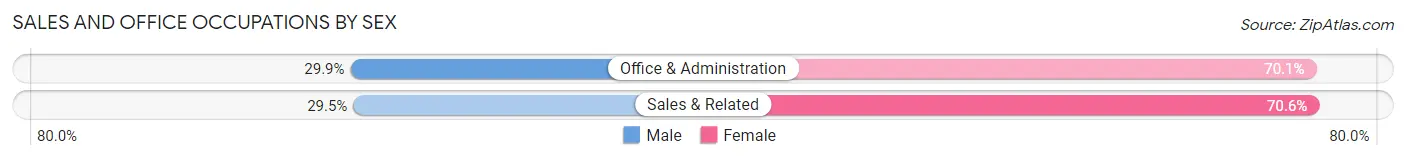
| Occupation | Male | Female |
| Sales & Related | 86 (29.4%) | 206 (70.6%) |
| Office & Administration | 153 (29.9%) | 359 (70.1%) |
| Total (Category) | 239 (29.7%) | 565 (70.3%) |
| Total (Overall) | 2,112 (49.3%) | 2,169 (50.7%) |
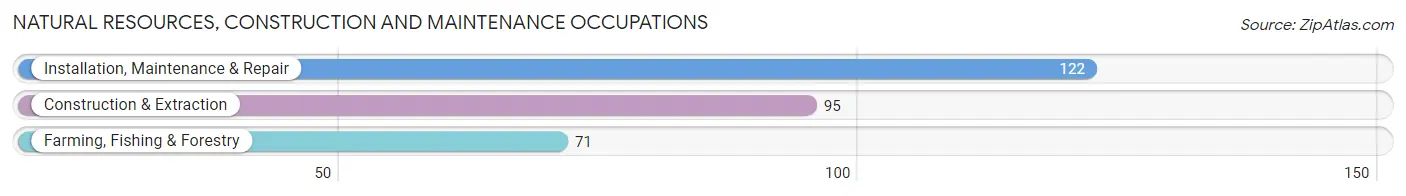
Natural Resources, Construction and Maintenance Occupations
The most common Natural Resources, Construction and Maintenance occupations in Lynwood are Installation, Maintenance & Repair (122 | 2.9%), Construction & Extraction (95 | 2.2%), and Farming, Fishing & Forestry (71 | 1.7%).
Natural Resources, Construction and Maintenance Occupations by Sex
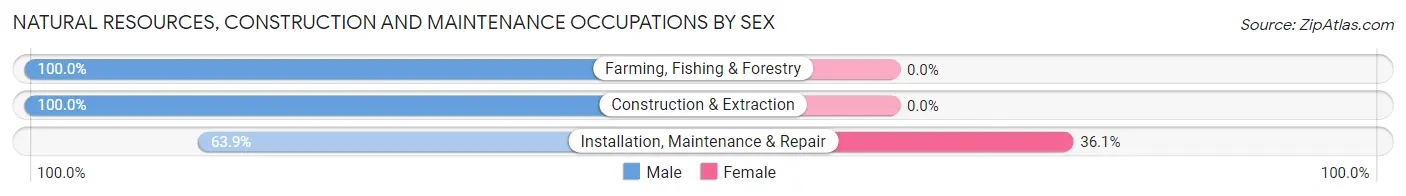
| Occupation | Male | Female |
| Farming, Fishing & Forestry | 71 (100.0%) | 0 (0.0%) |
| Construction & Extraction | 95 (100.0%) | 0 (0.0%) |
| Installation, Maintenance & Repair | 78 (63.9%) | 44 (36.1%) |
| Total (Category) | 244 (84.7%) | 44 (15.3%) |
| Total (Overall) | 2,112 (49.3%) | 2,169 (50.7%) |
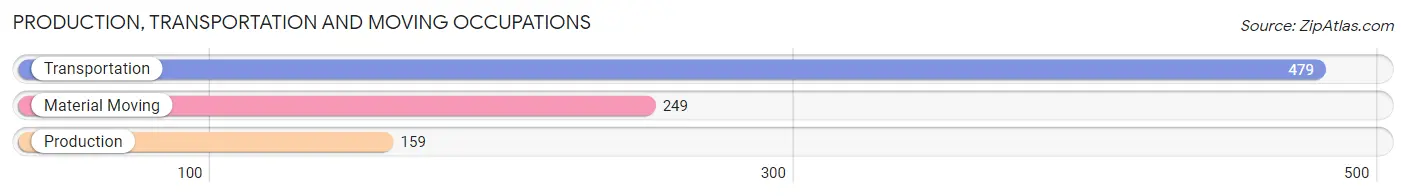
Production, Transportation and Moving Occupations
The most common Production, Transportation and Moving occupations in Lynwood are Transportation (479 | 11.2%), Material Moving (249 | 5.8%), and Production (159 | 3.7%).
Production, Transportation and Moving Occupations by Sex
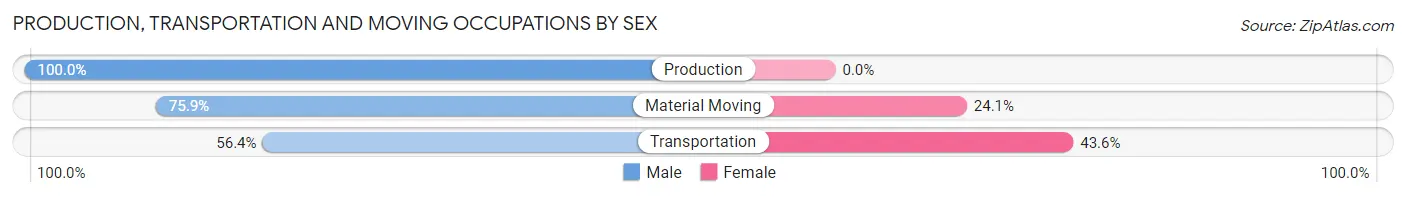
| Occupation | Male | Female |
| Production | 159 (100.0%) | 0 (0.0%) |
| Transportation | 270 (56.4%) | 209 (43.6%) |
| Material Moving | 189 (75.9%) | 60 (24.1%) |
| Total (Category) | 618 (69.7%) | 269 (30.3%) |
| Total (Overall) | 2,112 (49.3%) | 2,169 (50.7%) |
Employment Industries by Sex in Lynwood
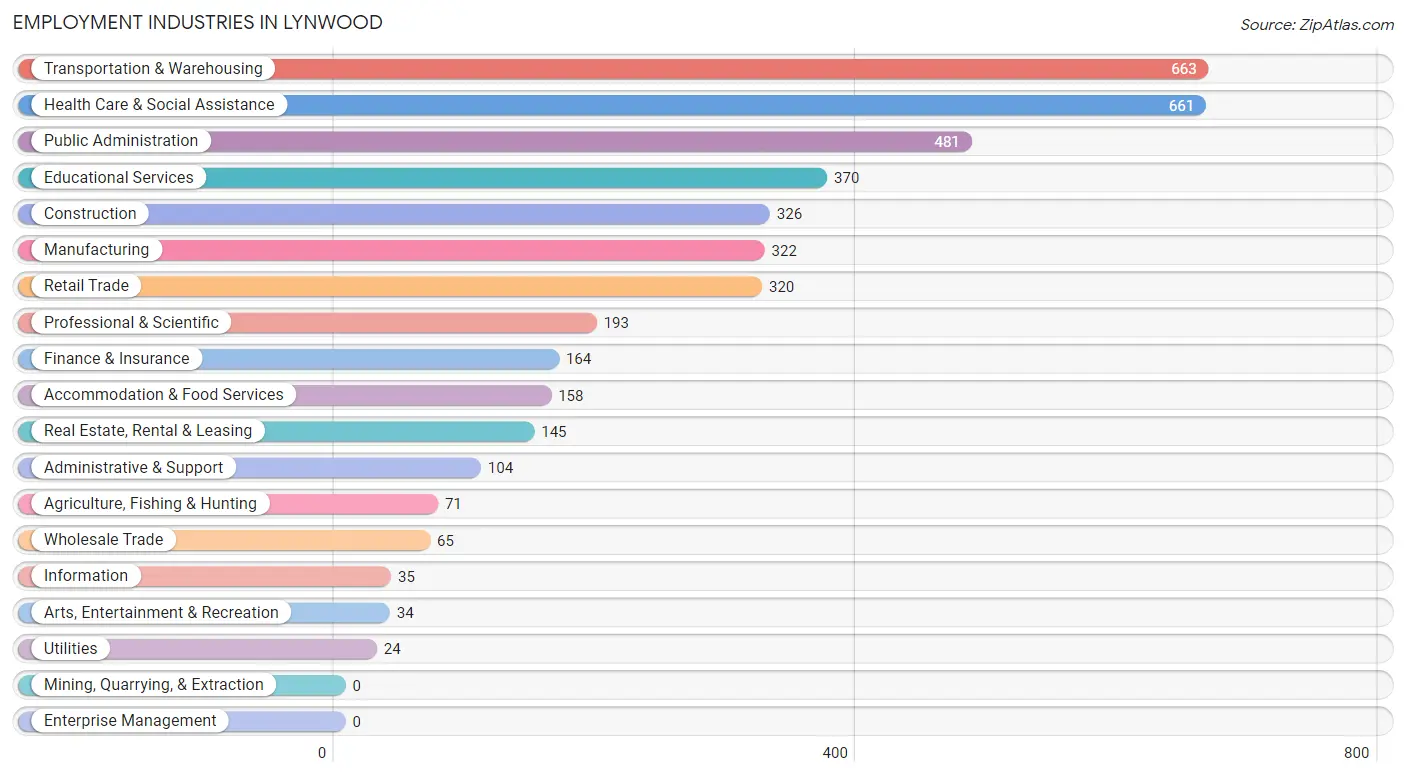
Employment Industries in Lynwood
The major employment industries in Lynwood include Transportation & Warehousing (663 | 15.5%), Health Care & Social Assistance (661 | 15.4%), Public Administration (481 | 11.2%), Educational Services (370 | 8.6%), and Construction (326 | 7.6%).
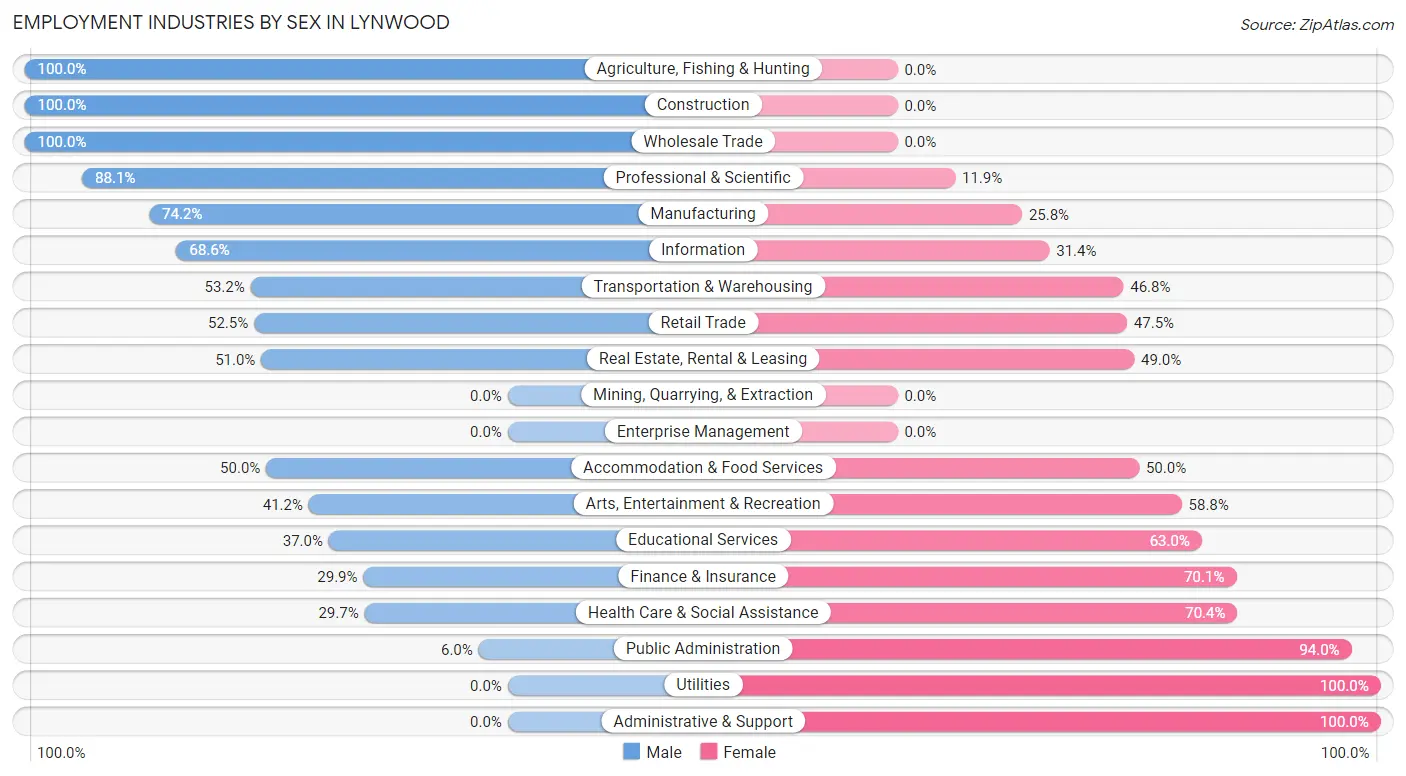
Employment Industries by Sex in Lynwood
The Lynwood industries that see more men than women are Agriculture, Fishing & Hunting (100.0%), Construction (100.0%), and Wholesale Trade (100.0%), whereas the industries that tend to have a higher number of women are Utilities (100.0%), Administrative & Support (100.0%), and Public Administration (94.0%).
| Industry | Male | Female |
| Agriculture, Fishing & Hunting | 71 (100.0%) | 0 (0.0%) |
| Mining, Quarrying, & Extraction | 0 (0.0%) | 0 (0.0%) |
| Construction | 326 (100.0%) | 0 (0.0%) |
| Manufacturing | 239 (74.2%) | 83 (25.8%) |
| Wholesale Trade | 65 (100.0%) | 0 (0.0%) |
| Retail Trade | 168 (52.5%) | 152 (47.5%) |
| Transportation & Warehousing | 353 (53.2%) | 310 (46.8%) |
| Utilities | 0 (0.0%) | 24 (100.0%) |
| Information | 24 (68.6%) | 11 (31.4%) |
| Finance & Insurance | 49 (29.9%) | 115 (70.1%) |
| Real Estate, Rental & Leasing | 74 (51.0%) | 71 (49.0%) |
| Professional & Scientific | 170 (88.1%) | 23 (11.9%) |
| Enterprise Management | 0 (0.0%) | 0 (0.0%) |
| Administrative & Support | 0 (0.0%) | 104 (100.0%) |
| Educational Services | 137 (37.0%) | 233 (63.0%) |
| Health Care & Social Assistance | 196 (29.6%) | 465 (70.4%) |
| Arts, Entertainment & Recreation | 14 (41.2%) | 20 (58.8%) |
| Accommodation & Food Services | 79 (50.0%) | 79 (50.0%) |
| Public Administration | 29 (6.0%) | 452 (94.0%) |
| Total | 2,112 (49.3%) | 2,169 (50.7%) |
Education in Lynwood
School Enrollment in Lynwood
The most common levels of schooling among the 2,373 students in Lynwood are middle school (756 | 31.9%), college / undergraduate (529 | 22.3%), and high school (400 | 16.9%).
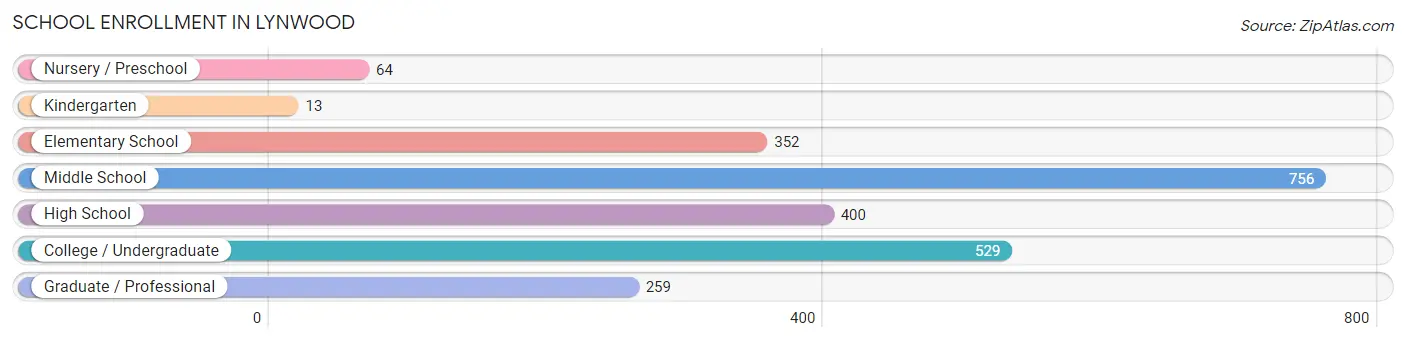
| School Level | # Students | % Students |
| Nursery / Preschool | 64 | 2.7% |
| Kindergarten | 13 | 0.5% |
| Elementary School | 352 | 14.8% |
| Middle School | 756 | 31.9% |
| High School | 400 | 16.9% |
| College / Undergraduate | 529 | 22.3% |
| Graduate / Professional | 259 | 10.9% |
| Total | 2,373 | 100.0% |
School Enrollment by Age by Funding Source in Lynwood
Out of a total of 2,373 students who are enrolled in schools in Lynwood, 354 (14.9%) attend a private institution, while the remaining 2,019 (85.1%) are enrolled in public schools. The age group of 35 years and over has the highest likelihood of being enrolled in private schools, with 159 (57.2% in the age bracket) enrolled. Conversely, the age group of 18 to 19 year olds has the lowest likelihood of being enrolled in a private school, with 163 (100.0% in the age bracket) attending a public institution.
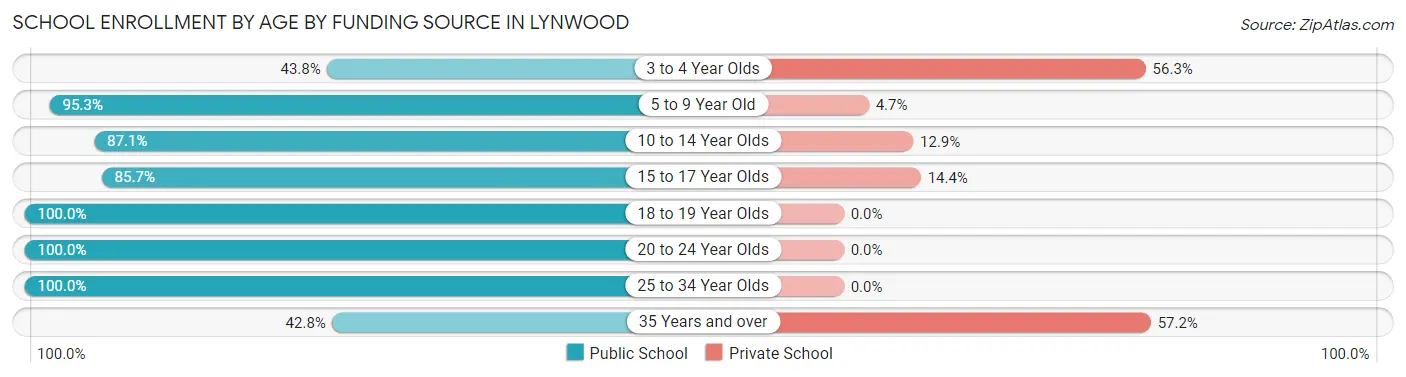
| Age Bracket | Public School | Private School |
| 3 to 4 Year Olds | 28 (43.8%) | 36 (56.2%) |
| 5 to 9 Year Old | 348 (95.3%) | 17 (4.7%) |
| 10 to 14 Year Olds | 720 (87.1%) | 107 (12.9%) |
| 15 to 17 Year Olds | 203 (85.7%) | 34 (14.3%) |
| 18 to 19 Year Olds | 163 (100.0%) | 0 (0.0%) |
| 20 to 24 Year Olds | 385 (100.0%) | 0 (0.0%) |
| 25 to 34 Year Olds | 54 (100.0%) | 0 (0.0%) |
| 35 Years and over | 119 (42.8%) | 159 (57.2%) |
| Total | 2,019 (85.1%) | 354 (14.9%) |
Educational Attainment by Field of Study in Lynwood
Social sciences (620 | 24.0%), business (371 | 14.4%), science & technology (321 | 12.4%), education (246 | 9.5%), and psychology (216 | 8.4%) are the most common fields of study among 2,578 individuals in Lynwood who have obtained a bachelor's degree or higher.
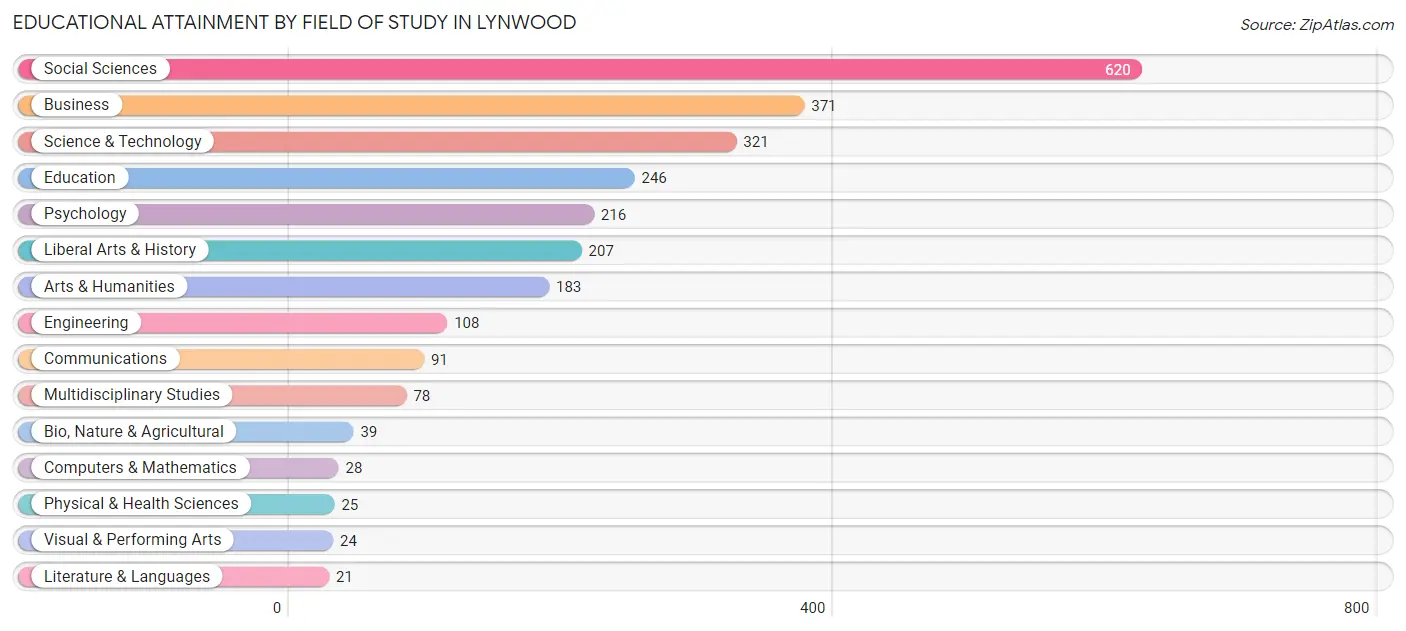
| Field of Study | # Graduates | % Graduates |
| Computers & Mathematics | 28 | 1.1% |
| Bio, Nature & Agricultural | 39 | 1.5% |
| Physical & Health Sciences | 25 | 1.0% |
| Psychology | 216 | 8.4% |
| Social Sciences | 620 | 24.0% |
| Engineering | 108 | 4.2% |
| Multidisciplinary Studies | 78 | 3.0% |
| Science & Technology | 321 | 12.4% |
| Business | 371 | 14.4% |
| Education | 246 | 9.5% |
| Literature & Languages | 21 | 0.8% |
| Liberal Arts & History | 207 | 8.0% |
| Visual & Performing Arts | 24 | 0.9% |
| Communications | 91 | 3.5% |
| Arts & Humanities | 183 | 7.1% |
| Total | 2,578 | 100.0% |
Transportation & Commute in Lynwood
Vehicle Availability by Sex in Lynwood
The most prevalent vehicle ownership categories in Lynwood are males with 2 vehicles (912, accounting for 43.9%) and females with 2 vehicles (718, making up 47.7%).
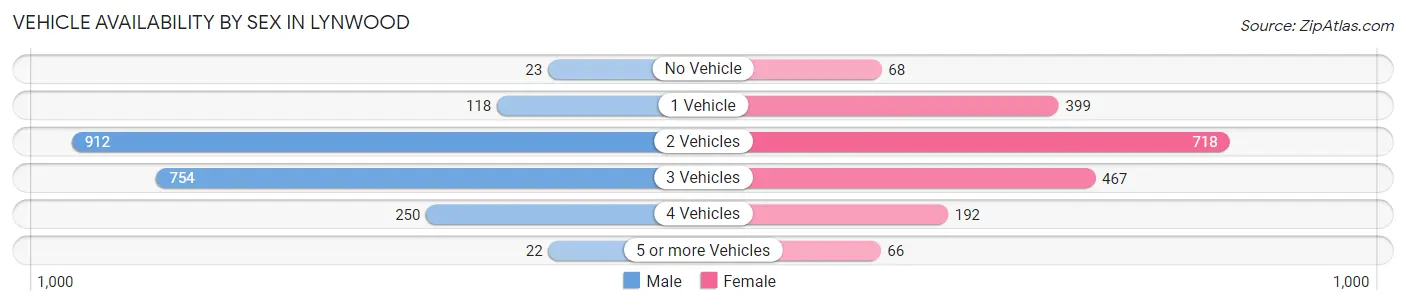
| Vehicles Available | Male | Female |
| No Vehicle | 23 (1.1%) | 68 (3.6%) |
| 1 Vehicle | 118 (5.7%) | 399 (20.9%) |
| 2 Vehicles | 912 (43.9%) | 718 (37.6%) |
| 3 Vehicles | 754 (36.3%) | 467 (24.4%) |
| 4 Vehicles | 250 (12.0%) | 192 (10.1%) |
| 5 or more Vehicles | 22 (1.1%) | 66 (3.5%) |
| Total | 2,079 (100.0%) | 1,910 (100.0%) |
Commute Time in Lynwood
The most frequently occuring commute durations in Lynwood are 20 to 24 minutes (550 commuters, 17.2%), 15 to 19 minutes (513 commuters, 16.1%), and 90 or more minutes (463 commuters, 14.5%).
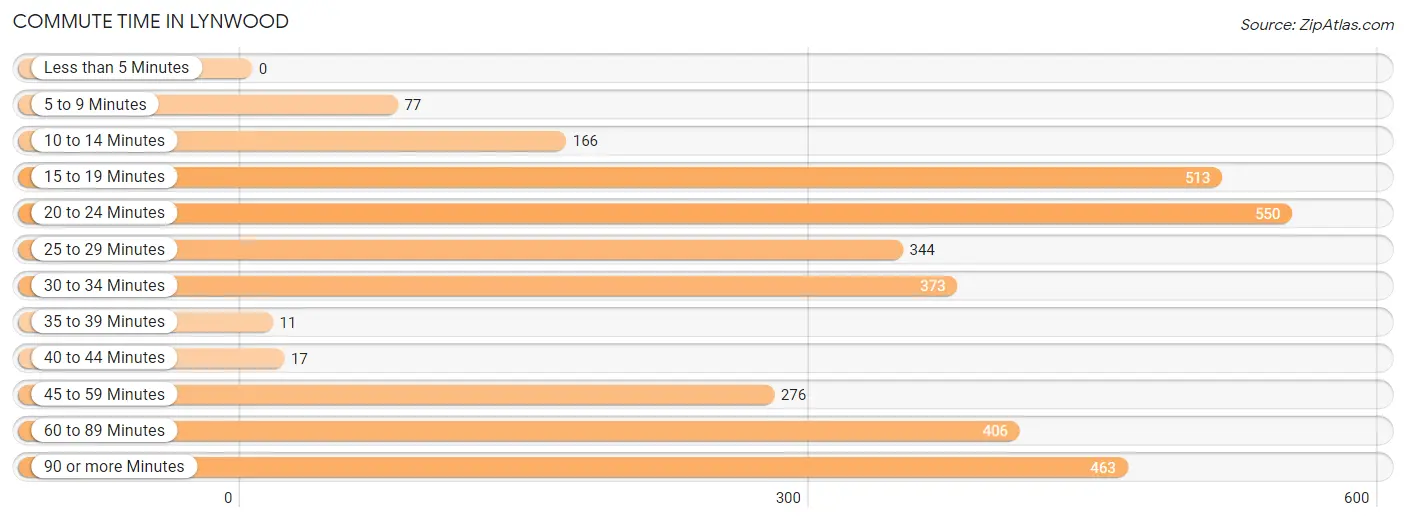
| Commute Time | # Commuters | % Commuters |
| Less than 5 Minutes | 0 | 0.0% |
| 5 to 9 Minutes | 77 | 2.4% |
| 10 to 14 Minutes | 166 | 5.2% |
| 15 to 19 Minutes | 513 | 16.1% |
| 20 to 24 Minutes | 550 | 17.2% |
| 25 to 29 Minutes | 344 | 10.8% |
| 30 to 34 Minutes | 373 | 11.7% |
| 35 to 39 Minutes | 11 | 0.3% |
| 40 to 44 Minutes | 17 | 0.5% |
| 45 to 59 Minutes | 276 | 8.6% |
| 60 to 89 Minutes | 406 | 12.7% |
| 90 or more Minutes | 463 | 14.5% |
Commute Time by Sex in Lynwood
The most common commute times in Lynwood are 20 to 24 minutes (443 commuters, 23.9%) for males and 15 to 19 minutes (249 commuters, 18.5%) for females.
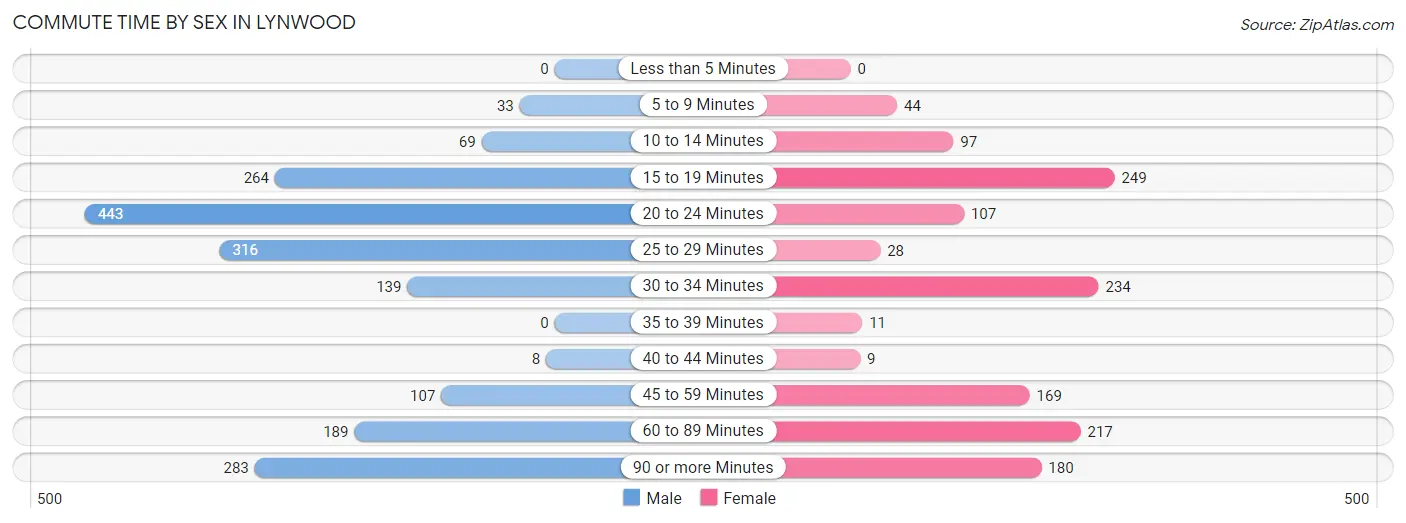
| Commute Time | Male | Female |
| Less than 5 Minutes | 0 (0.0%) | 0 (0.0%) |
| 5 to 9 Minutes | 33 (1.8%) | 44 (3.3%) |
| 10 to 14 Minutes | 69 (3.7%) | 97 (7.2%) |
| 15 to 19 Minutes | 264 (14.3%) | 249 (18.5%) |
| 20 to 24 Minutes | 443 (23.9%) | 107 (8.0%) |
| 25 to 29 Minutes | 316 (17.1%) | 28 (2.1%) |
| 30 to 34 Minutes | 139 (7.5%) | 234 (17.4%) |
| 35 to 39 Minutes | 0 (0.0%) | 11 (0.8%) |
| 40 to 44 Minutes | 8 (0.4%) | 9 (0.7%) |
| 45 to 59 Minutes | 107 (5.8%) | 169 (12.6%) |
| 60 to 89 Minutes | 189 (10.2%) | 217 (16.1%) |
| 90 or more Minutes | 283 (15.3%) | 180 (13.4%) |
Time of Departure to Work by Sex in Lynwood
The most frequent times of departure to work in Lynwood are 12:00 AM to 4:59 AM (378, 20.4%) for males and 6:00 AM to 6:29 AM (260, 19.3%) for females.
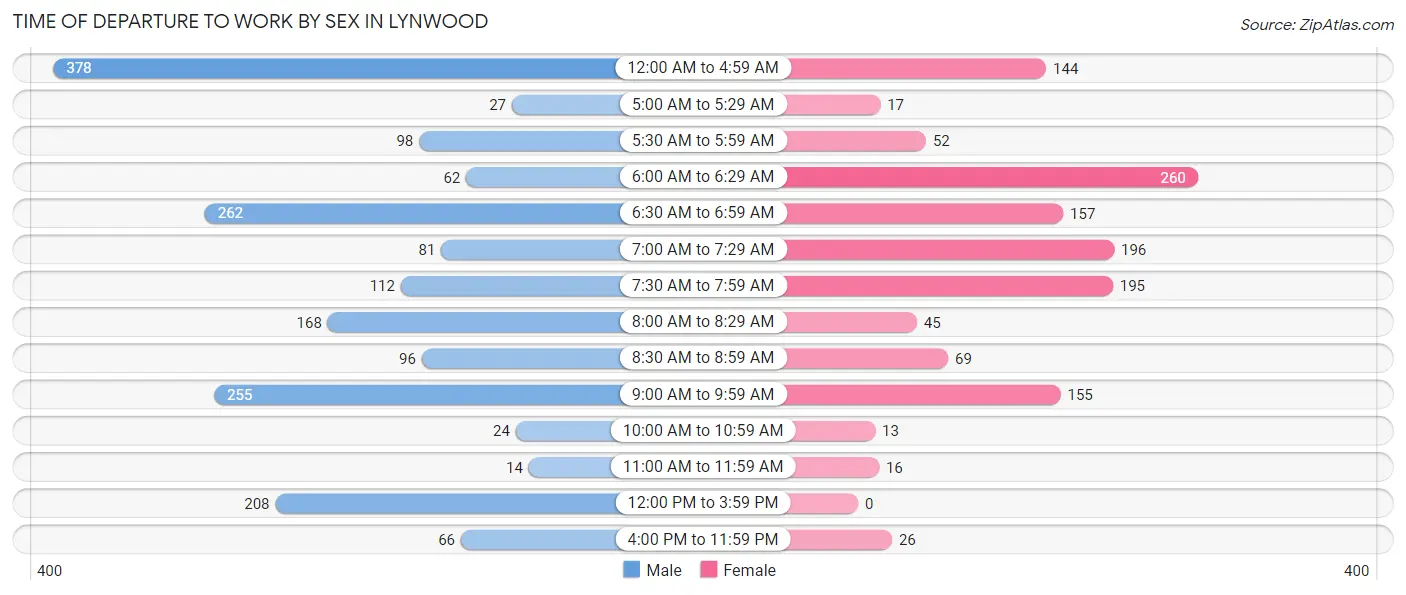
| Time of Departure | Male | Female |
| 12:00 AM to 4:59 AM | 378 (20.4%) | 144 (10.7%) |
| 5:00 AM to 5:29 AM | 27 (1.5%) | 17 (1.3%) |
| 5:30 AM to 5:59 AM | 98 (5.3%) | 52 (3.9%) |
| 6:00 AM to 6:29 AM | 62 (3.4%) | 260 (19.3%) |
| 6:30 AM to 6:59 AM | 262 (14.1%) | 157 (11.7%) |
| 7:00 AM to 7:29 AM | 81 (4.4%) | 196 (14.6%) |
| 7:30 AM to 7:59 AM | 112 (6.0%) | 195 (14.5%) |
| 8:00 AM to 8:29 AM | 168 (9.1%) | 45 (3.4%) |
| 8:30 AM to 8:59 AM | 96 (5.2%) | 69 (5.1%) |
| 9:00 AM to 9:59 AM | 255 (13.8%) | 155 (11.5%) |
| 10:00 AM to 10:59 AM | 24 (1.3%) | 13 (1.0%) |
| 11:00 AM to 11:59 AM | 14 (0.8%) | 16 (1.2%) |
| 12:00 PM to 3:59 PM | 208 (11.2%) | 0 (0.0%) |
| 4:00 PM to 11:59 PM | 66 (3.6%) | 26 (1.9%) |
| Total | 1,851 (100.0%) | 1,345 (100.0%) |
Housing Occupancy in Lynwood
Occupancy by Ownership in Lynwood
Of the total 3,282 dwellings in Lynwood, owner-occupied units account for 2,565 (78.1%), while renter-occupied units make up 717 (21.8%).
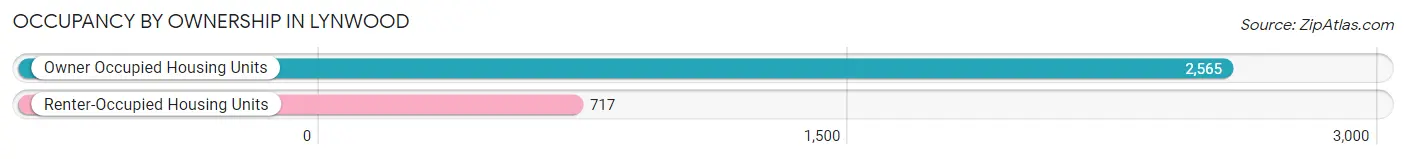
| Occupancy | # Housing Units | % Housing Units |
| Owner Occupied Housing Units | 2,565 | 78.1% |
| Renter-Occupied Housing Units | 717 | 21.8% |
| Total Occupied Housing Units | 3,282 | 100.0% |
Occupancy by Household Size in Lynwood
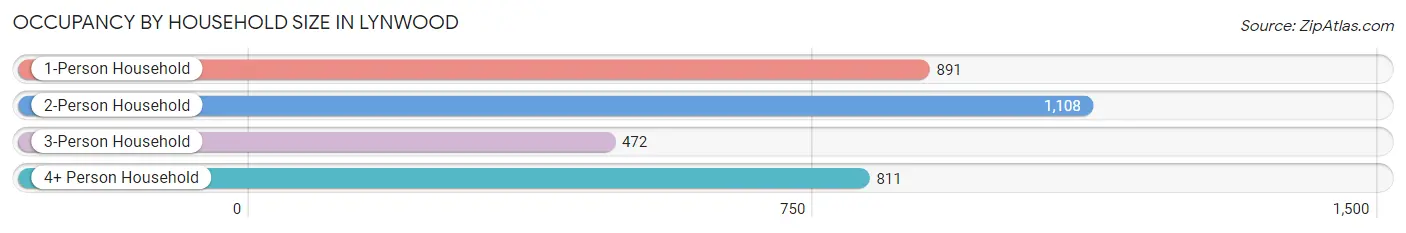
| Household Size | # Housing Units | % Housing Units |
| 1-Person Household | 891 | 27.2% |
| 2-Person Household | 1,108 | 33.8% |
| 3-Person Household | 472 | 14.4% |
| 4+ Person Household | 811 | 24.7% |
| Total Housing Units | 3,282 | 100.0% |
Occupancy by Ownership by Household Size in Lynwood
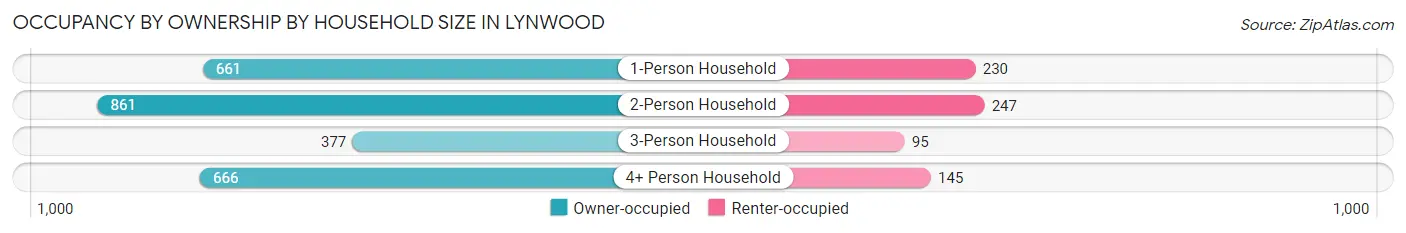
| Household Size | Owner-occupied | Renter-occupied |
| 1-Person Household | 661 (74.2%) | 230 (25.8%) |
| 2-Person Household | 861 (77.7%) | 247 (22.3%) |
| 3-Person Household | 377 (79.9%) | 95 (20.1%) |
| 4+ Person Household | 666 (82.1%) | 145 (17.9%) |
| Total Housing Units | 2,565 (78.1%) | 717 (21.8%) |
Occupancy by Educational Attainment in Lynwood
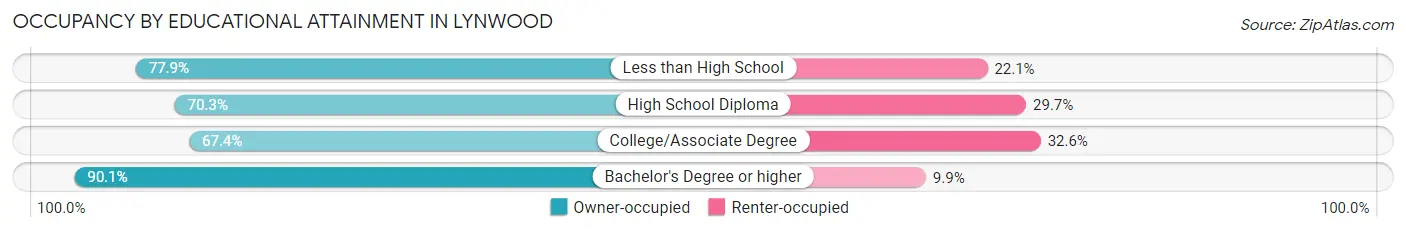
| Household Size | Owner-occupied | Renter-occupied |
| Less than High School | 265 (77.9%) | 75 (22.1%) |
| High School Diploma | 487 (70.3%) | 206 (29.7%) |
| College/Associate Degree | 634 (67.4%) | 307 (32.6%) |
| Bachelor's Degree or higher | 1,179 (90.1%) | 129 (9.9%) |
Occupancy by Age of Householder in Lynwood
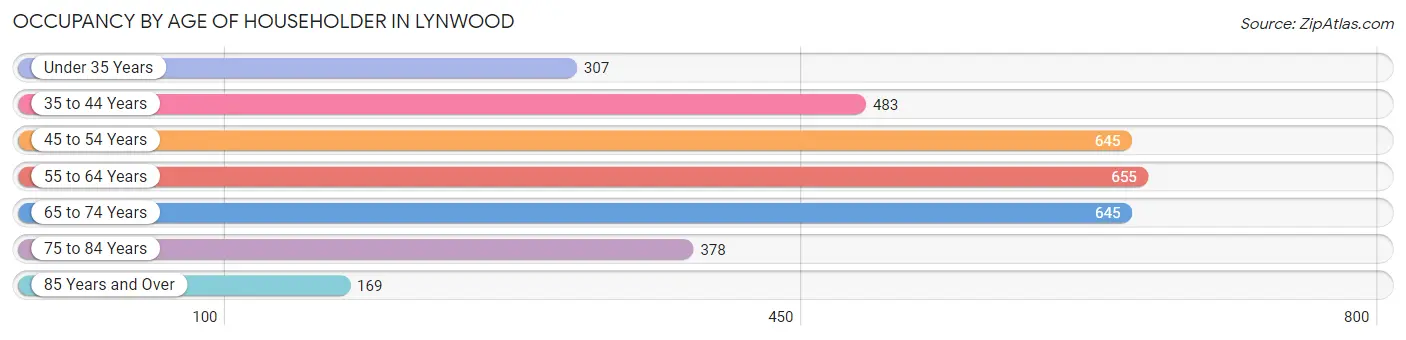
| Age Bracket | # Households | % Households |
| Under 35 Years | 307 | 9.3% |
| 35 to 44 Years | 483 | 14.7% |
| 45 to 54 Years | 645 | 19.7% |
| 55 to 64 Years | 655 | 20.0% |
| 65 to 74 Years | 645 | 19.7% |
| 75 to 84 Years | 378 | 11.5% |
| 85 Years and Over | 169 | 5.1% |
| Total | 3,282 | 100.0% |
Housing Finances in Lynwood
Median Income by Occupancy in Lynwood
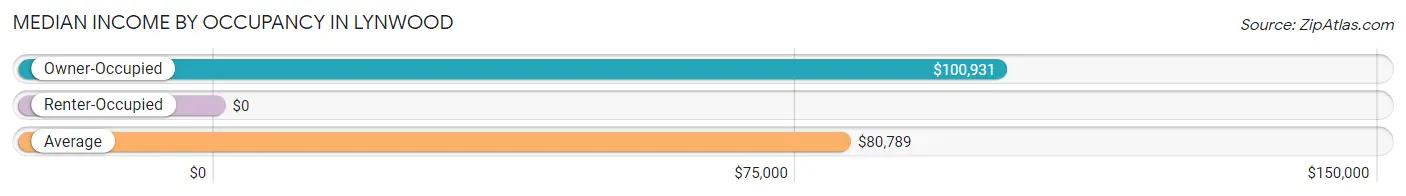
| Occupancy Type | # Households | Median Income |
| Owner-Occupied | 2,565 (78.1%) | $100,931 |
| Renter-Occupied | 717 (21.8%) | $0 |
| Average | 3,282 (100.0%) | $80,789 |
Occupancy by Householder Income Bracket in Lynwood
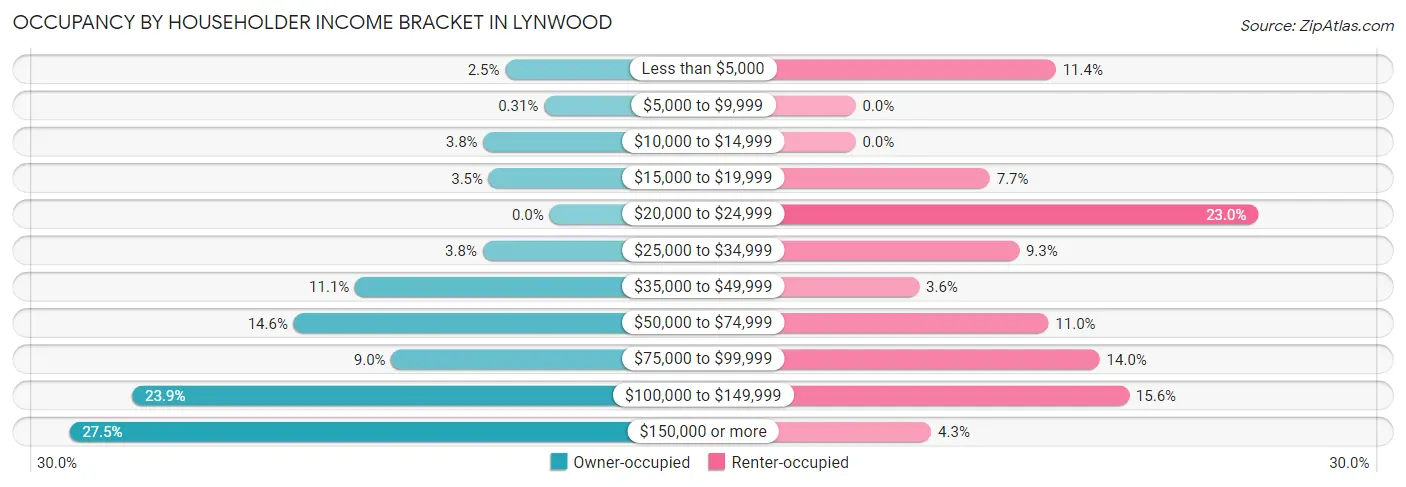
| Income Bracket | Owner-occupied | Renter-occupied |
| Less than $5,000 | 65 (2.5%) | 82 (11.4%) |
| $5,000 to $9,999 | 8 (0.3%) | 0 (0.0%) |
| $10,000 to $14,999 | 97 (3.8%) | 0 (0.0%) |
| $15,000 to $19,999 | 89 (3.5%) | 55 (7.7%) |
| $20,000 to $24,999 | 0 (0.0%) | 165 (23.0%) |
| $25,000 to $34,999 | 98 (3.8%) | 67 (9.3%) |
| $35,000 to $49,999 | 285 (11.1%) | 26 (3.6%) |
| $50,000 to $74,999 | 375 (14.6%) | 79 (11.0%) |
| $75,000 to $99,999 | 232 (9.0%) | 100 (14.0%) |
| $100,000 to $149,999 | 612 (23.9%) | 112 (15.6%) |
| $150,000 or more | 704 (27.5%) | 31 (4.3%) |
| Total | 2,565 (100.0%) | 717 (100.0%) |
Monthly Housing Cost Tiers in Lynwood
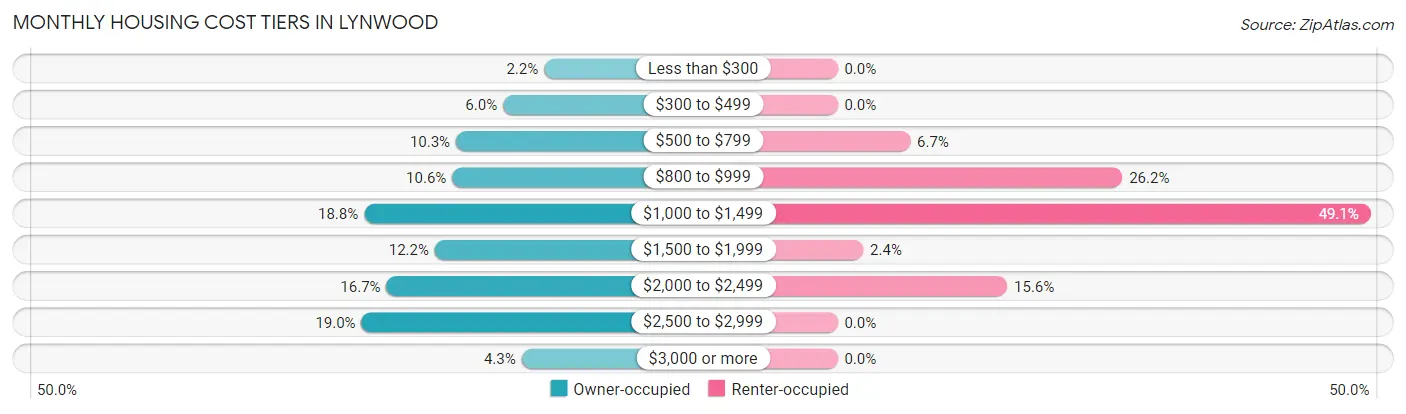
| Monthly Cost | Owner-occupied | Renter-occupied |
| Less than $300 | 56 (2.2%) | 0 (0.0%) |
| $300 to $499 | 153 (6.0%) | 0 (0.0%) |
| $500 to $799 | 264 (10.3%) | 48 (6.7%) |
| $800 to $999 | 273 (10.6%) | 188 (26.2%) |
| $1,000 to $1,499 | 481 (18.8%) | 352 (49.1%) |
| $1,500 to $1,999 | 314 (12.2%) | 17 (2.4%) |
| $2,000 to $2,499 | 428 (16.7%) | 112 (15.6%) |
| $2,500 to $2,999 | 487 (19.0%) | 0 (0.0%) |
| $3,000 or more | 109 (4.3%) | 0 (0.0%) |
| Total | 2,565 (100.0%) | 717 (100.0%) |
Physical Housing Characteristics in Lynwood
Housing Structures in Lynwood
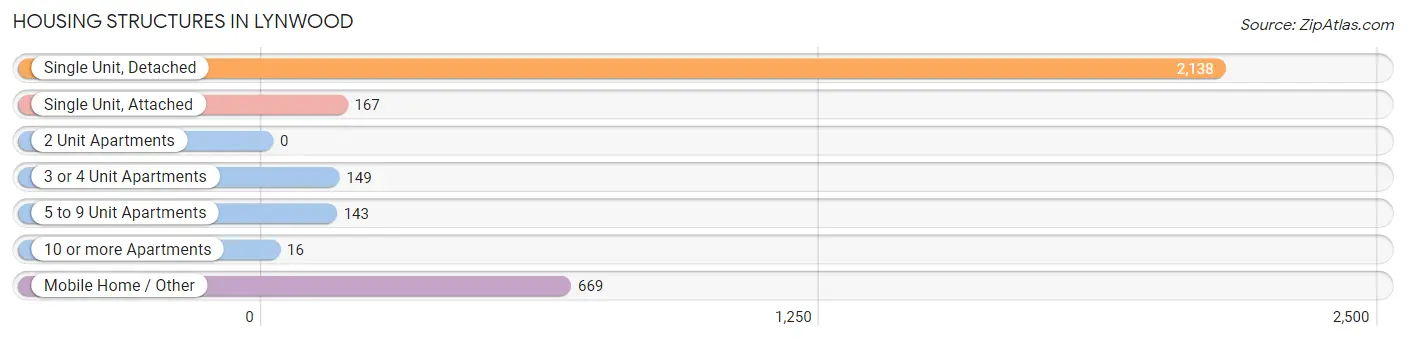
| Structure Type | # Housing Units | % Housing Units |
| Single Unit, Detached | 2,138 | 65.1% |
| Single Unit, Attached | 167 | 5.1% |
| 2 Unit Apartments | 0 | 0.0% |
| 3 or 4 Unit Apartments | 149 | 4.5% |
| 5 to 9 Unit Apartments | 143 | 4.4% |
| 10 or more Apartments | 16 | 0.5% |
| Mobile Home / Other | 669 | 20.4% |
| Total | 3,282 | 100.0% |
Housing Structures by Occupancy in Lynwood
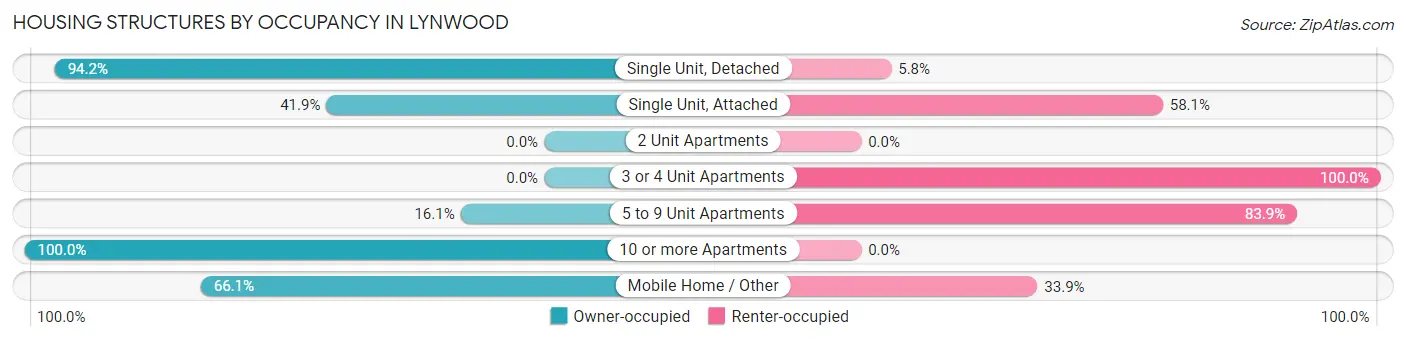
| Structure Type | Owner-occupied | Renter-occupied |
| Single Unit, Detached | 2,014 (94.2%) | 124 (5.8%) |
| Single Unit, Attached | 70 (41.9%) | 97 (58.1%) |
| 2 Unit Apartments | 0 (0.0%) | 0 (0.0%) |
| 3 or 4 Unit Apartments | 0 (0.0%) | 149 (100.0%) |
| 5 to 9 Unit Apartments | 23 (16.1%) | 120 (83.9%) |
| 10 or more Apartments | 16 (100.0%) | 0 (0.0%) |
| Mobile Home / Other | 442 (66.1%) | 227 (33.9%) |
| Total | 2,565 (78.1%) | 717 (21.8%) |
Housing Structures by Number of Rooms in Lynwood
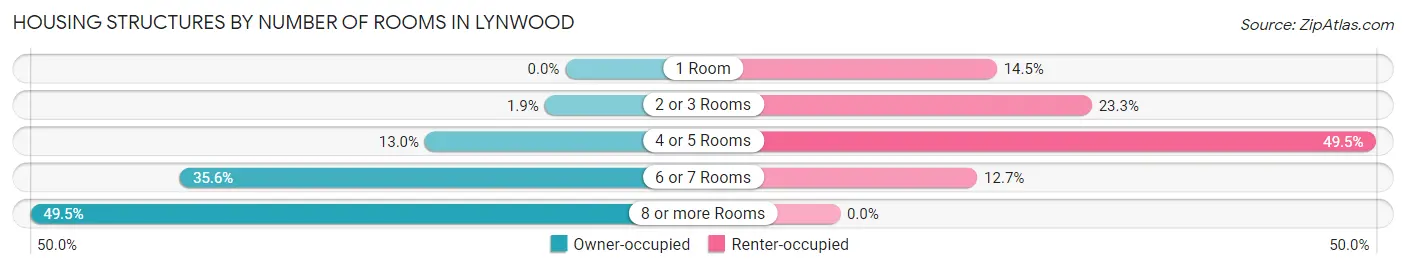
| Number of Rooms | Owner-occupied | Renter-occupied |
| 1 Room | 0 (0.0%) | 104 (14.5%) |
| 2 or 3 Rooms | 49 (1.9%) | 167 (23.3%) |
| 4 or 5 Rooms | 333 (13.0%) | 355 (49.5%) |
| 6 or 7 Rooms | 914 (35.6%) | 91 (12.7%) |
| 8 or more Rooms | 1,269 (49.5%) | 0 (0.0%) |
| Total | 2,565 (100.0%) | 717 (100.0%) |
Housing Structure by Heating Type in Lynwood
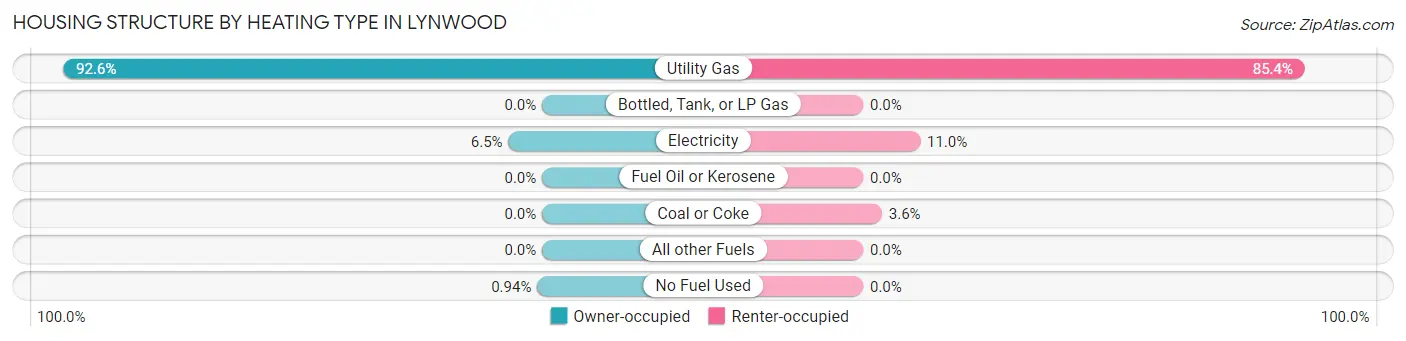
| Heating Type | Owner-occupied | Renter-occupied |
| Utility Gas | 2,374 (92.5%) | 612 (85.4%) |
| Bottled, Tank, or LP Gas | 0 (0.0%) | 0 (0.0%) |
| Electricity | 167 (6.5%) | 79 (11.0%) |
| Fuel Oil or Kerosene | 0 (0.0%) | 0 (0.0%) |
| Coal or Coke | 0 (0.0%) | 26 (3.6%) |
| All other Fuels | 0 (0.0%) | 0 (0.0%) |
| No Fuel Used | 24 (0.9%) | 0 (0.0%) |
| Total | 2,565 (100.0%) | 717 (100.0%) |
Household Vehicle Usage in Lynwood
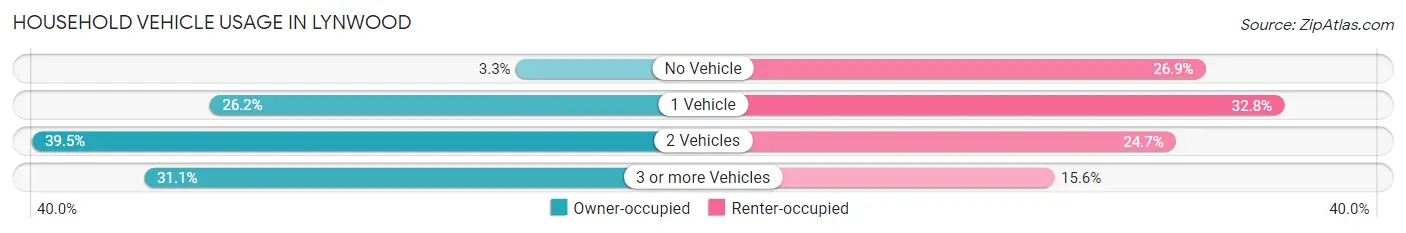
| Vehicles per Household | Owner-occupied | Renter-occupied |
| No Vehicle | 84 (3.3%) | 193 (26.9%) |
| 1 Vehicle | 672 (26.2%) | 235 (32.8%) |
| 2 Vehicles | 1,012 (39.5%) | 177 (24.7%) |
| 3 or more Vehicles | 797 (31.1%) | 112 (15.6%) |
| Total | 2,565 (100.0%) | 717 (100.0%) |
Real Estate & Mortgages in Lynwood
Real Estate and Mortgage Overview in Lynwood
| Characteristic | Without Mortgage | With Mortgage |
| Housing Units | 839 | 1,726 |
| Median Property Value | - | - |
| Median Household Income | $61,373 | $603 |
| Monthly Housing Costs | $770 | $109 |
| Real Estate Taxes | $5,298 | $124 |
Property Value by Mortgage Status in Lynwood
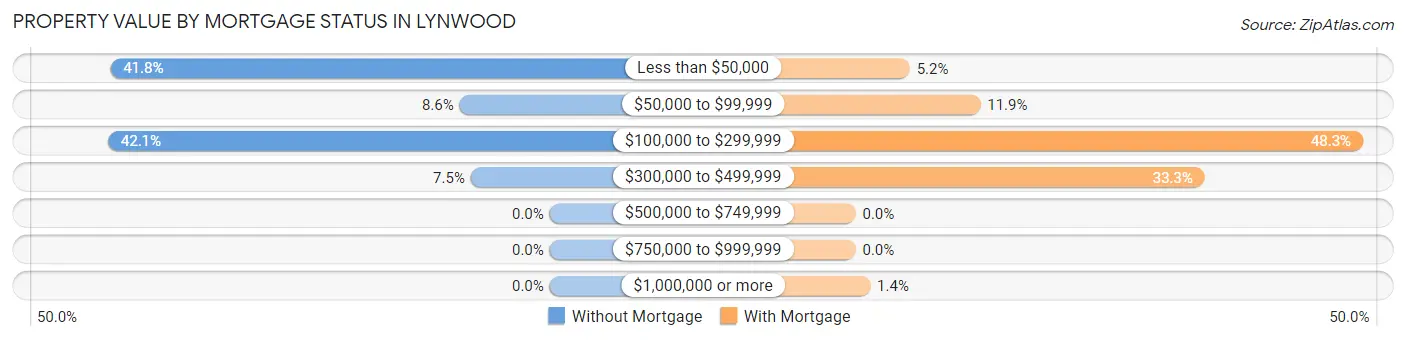
| Property Value | Without Mortgage | With Mortgage |
| Less than $50,000 | 351 (41.8%) | 89 (5.2%) |
| $50,000 to $99,999 | 72 (8.6%) | 205 (11.9%) |
| $100,000 to $299,999 | 353 (42.1%) | 834 (48.3%) |
| $300,000 to $499,999 | 63 (7.5%) | 574 (33.3%) |
| $500,000 to $749,999 | 0 (0.0%) | 0 (0.0%) |
| $750,000 to $999,999 | 0 (0.0%) | 0 (0.0%) |
| $1,000,000 or more | 0 (0.0%) | 24 (1.4%) |
| Total | 839 (100.0%) | 1,726 (100.0%) |
Household Income by Mortgage Status in Lynwood
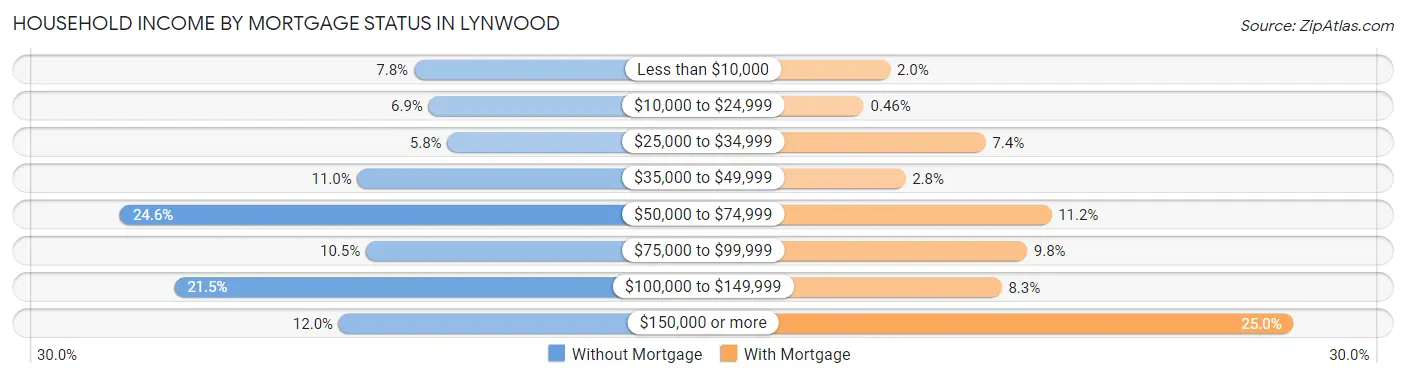
| Household Income | Without Mortgage | With Mortgage |
| Less than $10,000 | 65 (7.7%) | 34 (2.0%) |
| $10,000 to $24,999 | 58 (6.9%) | 8 (0.5%) |
| $25,000 to $34,999 | 49 (5.8%) | 128 (7.4%) |
| $35,000 to $49,999 | 92 (11.0%) | 49 (2.8%) |
| $50,000 to $74,999 | 206 (24.5%) | 193 (11.2%) |
| $75,000 to $99,999 | 88 (10.5%) | 169 (9.8%) |
| $100,000 to $149,999 | 180 (21.4%) | 144 (8.3%) |
| $150,000 or more | 101 (12.0%) | 432 (25.0%) |
| Total | 839 (100.0%) | 1,726 (100.0%) |
Property Value to Household Income Ratio in Lynwood
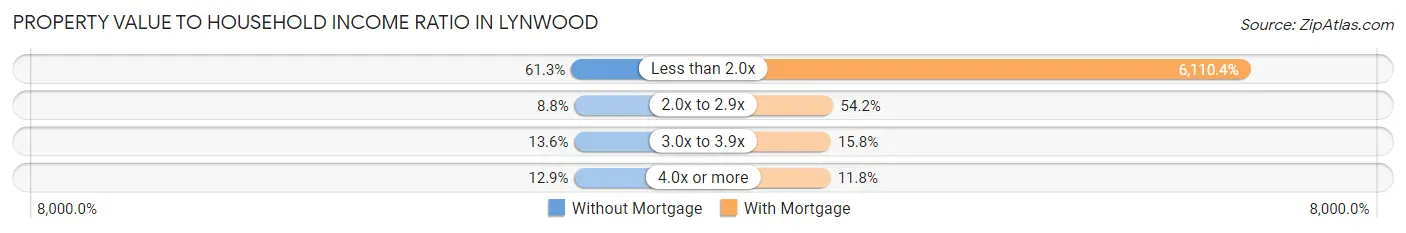
| Value-to-Income Ratio | Without Mortgage | With Mortgage |
| Less than 2.0x | 514 (61.3%) | 105,466 (6,110.4%) |
| 2.0x to 2.9x | 74 (8.8%) | 935 (54.2%) |
| 3.0x to 3.9x | 114 (13.6%) | 273 (15.8%) |
| 4.0x or more | 108 (12.9%) | 203 (11.8%) |
| Total | 839 (100.0%) | 1,726 (100.0%) |
Real Estate Taxes by Mortgage Status in Lynwood
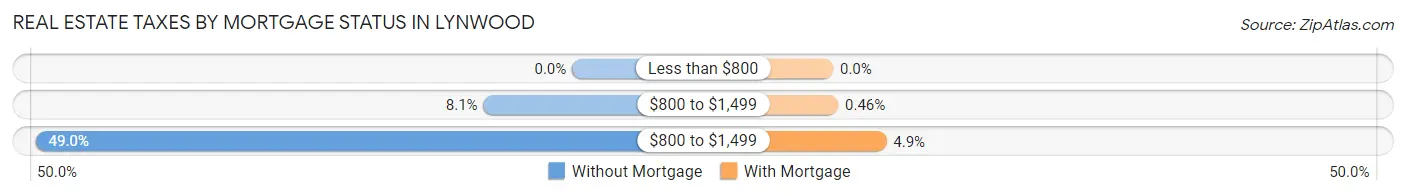
| Property Taxes | Without Mortgage | With Mortgage |
| Less than $800 | 0 (0.0%) | 0 (0.0%) |
| $800 to $1,499 | 68 (8.1%) | 8 (0.5%) |
| $800 to $1,499 | 411 (49.0%) | 84 (4.9%) |
| Total | 839 (100.0%) | 1,726 (100.0%) |
Health & Disability in Lynwood
Health Insurance Coverage by Age in Lynwood
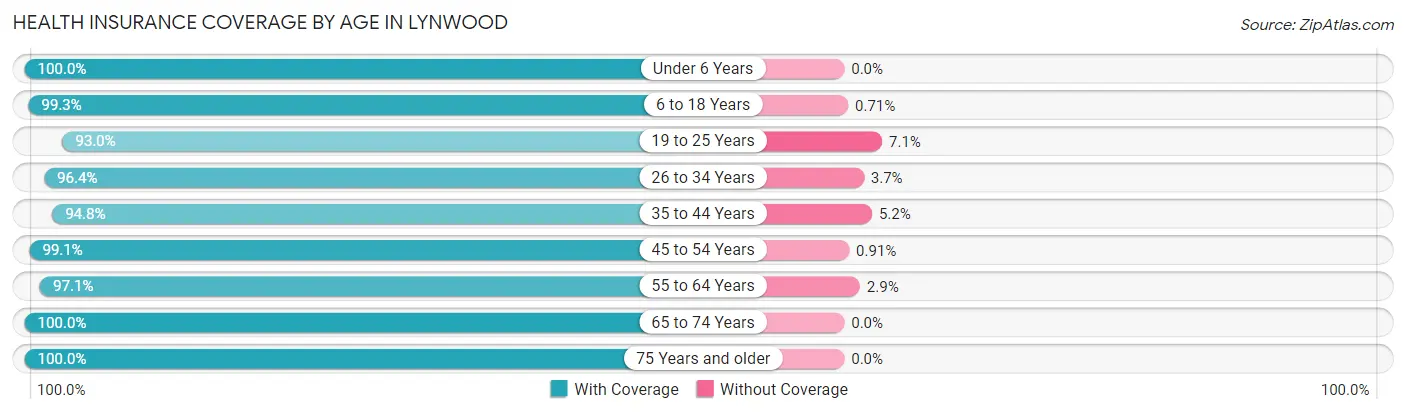
| Age Bracket | With Coverage | Without Coverage |
| Under 6 Years | 643 (100.0%) | 0 (0.0%) |
| 6 to 18 Years | 1,545 (99.3%) | 11 (0.7%) |
| 19 to 25 Years | 883 (92.9%) | 67 (7.0%) |
| 26 to 34 Years | 634 (96.4%) | 24 (3.6%) |
| 35 to 44 Years | 974 (94.8%) | 53 (5.2%) |
| 45 to 54 Years | 1,412 (99.1%) | 13 (0.9%) |
| 55 to 64 Years | 1,267 (97.1%) | 38 (2.9%) |
| 65 to 74 Years | 934 (100.0%) | 0 (0.0%) |
| 75 Years and older | 588 (100.0%) | 0 (0.0%) |
| Total | 8,880 (97.7%) | 206 (2.3%) |
Health Insurance Coverage by Citizenship Status in Lynwood
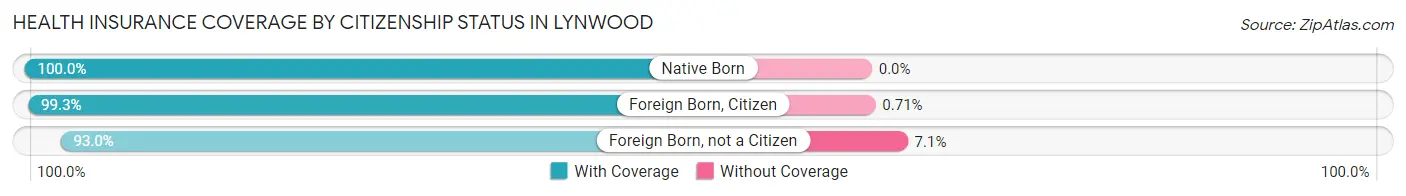
| Citizenship Status | With Coverage | Without Coverage |
| Native Born | 643 (100.0%) | 0 (0.0%) |
| Foreign Born, Citizen | 1,545 (99.3%) | 11 (0.7%) |
| Foreign Born, not a Citizen | 883 (92.9%) | 67 (7.0%) |
Health Insurance Coverage by Household Income in Lynwood
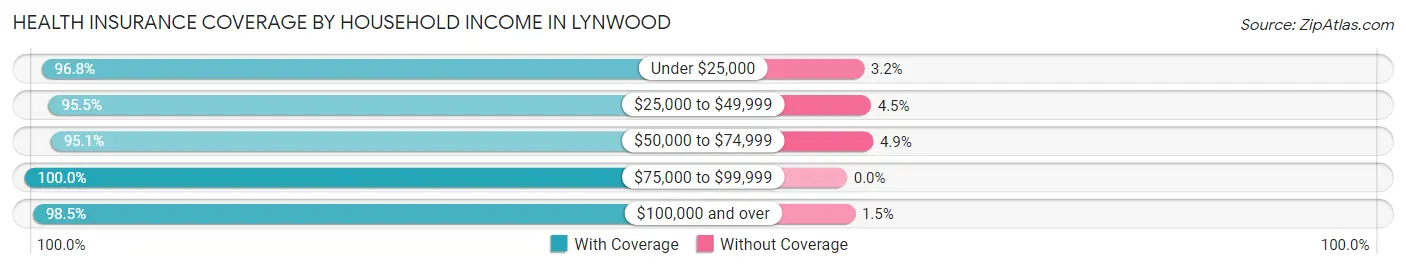
| Household Income | With Coverage | Without Coverage |
| Under $25,000 | 876 (96.8%) | 29 (3.2%) |
| $25,000 to $49,999 | 702 (95.5%) | 33 (4.5%) |
| $50,000 to $74,999 | 1,203 (95.1%) | 62 (4.9%) |
| $75,000 to $99,999 | 824 (100.0%) | 0 (0.0%) |
| $100,000 and over | 5,267 (98.5%) | 82 (1.5%) |
Public vs Private Health Insurance Coverage by Age in Lynwood
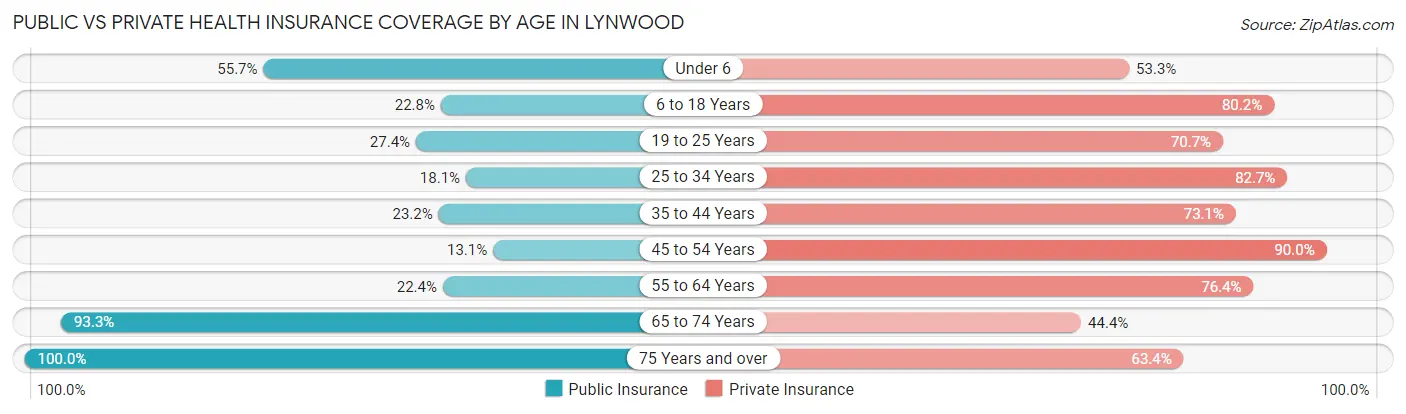
| Age Bracket | Public Insurance | Private Insurance |
| Under 6 | 358 (55.7%) | 343 (53.3%) |
| 6 to 18 Years | 354 (22.8%) | 1,248 (80.2%) |
| 19 to 25 Years | 260 (27.4%) | 672 (70.7%) |
| 25 to 34 Years | 119 (18.1%) | 544 (82.7%) |
| 35 to 44 Years | 238 (23.2%) | 751 (73.1%) |
| 45 to 54 Years | 186 (13.1%) | 1,282 (90.0%) |
| 55 to 64 Years | 292 (22.4%) | 997 (76.4%) |
| 65 to 74 Years | 871 (93.2%) | 415 (44.4%) |
| 75 Years and over | 588 (100.0%) | 373 (63.4%) |
| Total | 3,266 (35.9%) | 6,625 (72.9%) |
Disability Status by Sex by Age in Lynwood
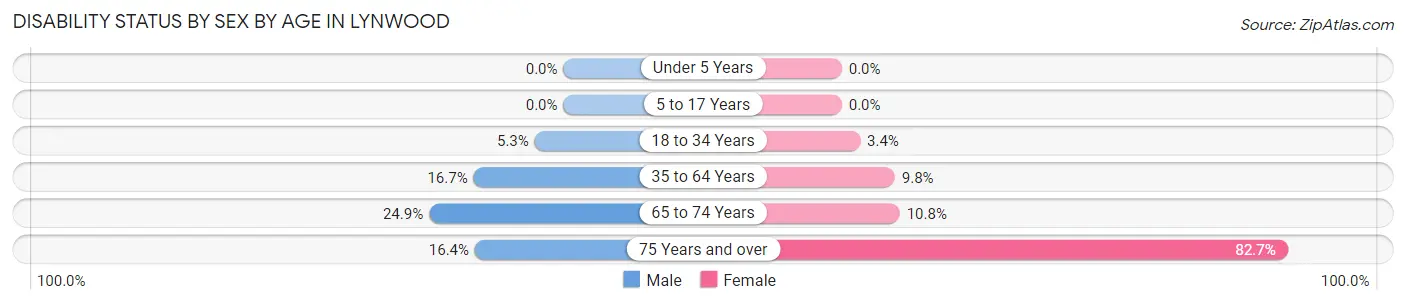
| Age Bracket | Male | Female |
| Under 5 Years | 0 (0.0%) | 0 (0.0%) |
| 5 to 17 Years | 0 (0.0%) | 0 (0.0%) |
| 18 to 34 Years | 54 (5.3%) | 24 (3.4%) |
| 35 to 64 Years | 286 (16.7%) | 201 (9.8%) |
| 65 to 74 Years | 103 (24.9%) | 56 (10.7%) |
| 75 Years and over | 11 (16.4%) | 431 (82.7%) |
Disability Class by Sex by Age in Lynwood
Disability Class: Hearing Difficulty
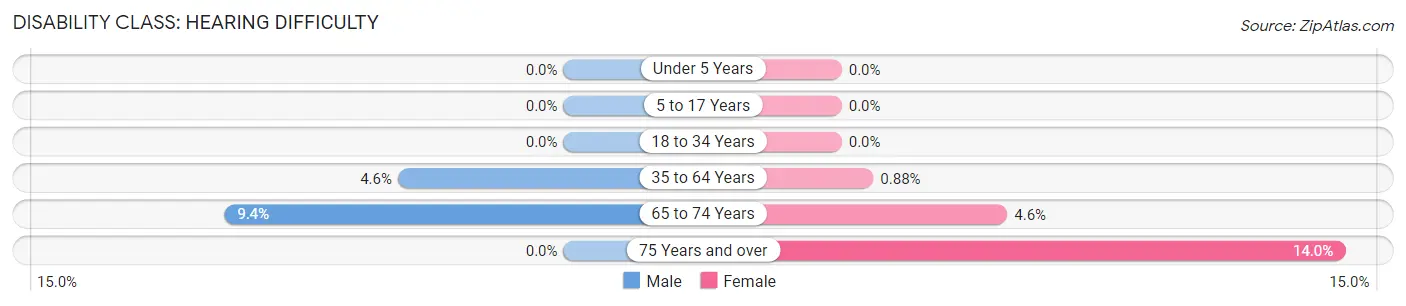
| Age Bracket | Male | Female |
| Under 5 Years | 0 (0.0%) | 0 (0.0%) |
| 5 to 17 Years | 0 (0.0%) | 0 (0.0%) |
| 18 to 34 Years | 0 (0.0%) | 0 (0.0%) |
| 35 to 64 Years | 79 (4.6%) | 18 (0.9%) |
| 65 to 74 Years | 39 (9.4%) | 24 (4.6%) |
| 75 Years and over | 0 (0.0%) | 73 (14.0%) |
Disability Class: Vision Difficulty
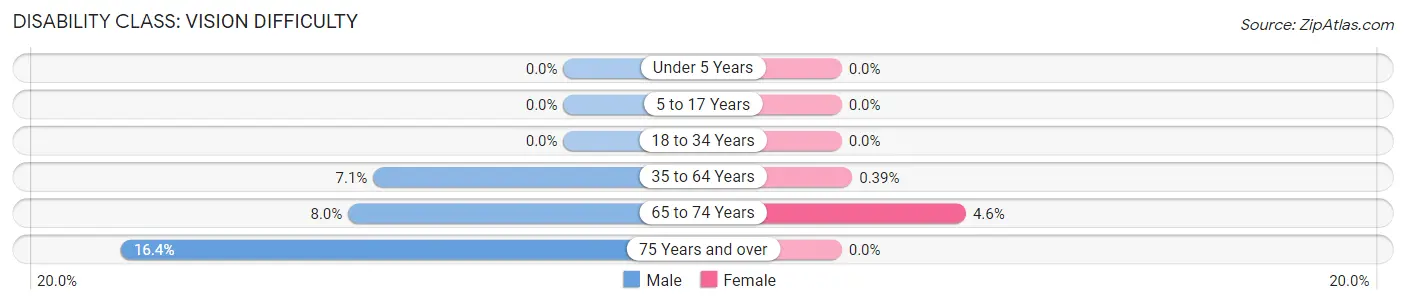
| Age Bracket | Male | Female |
| Under 5 Years | 0 (0.0%) | 0 (0.0%) |
| 5 to 17 Years | 0 (0.0%) | 0 (0.0%) |
| 18 to 34 Years | 0 (0.0%) | 0 (0.0%) |
| 35 to 64 Years | 121 (7.1%) | 8 (0.4%) |
| 65 to 74 Years | 33 (8.0%) | 24 (4.6%) |
| 75 Years and over | 11 (16.4%) | 0 (0.0%) |
Disability Class: Cognitive Difficulty
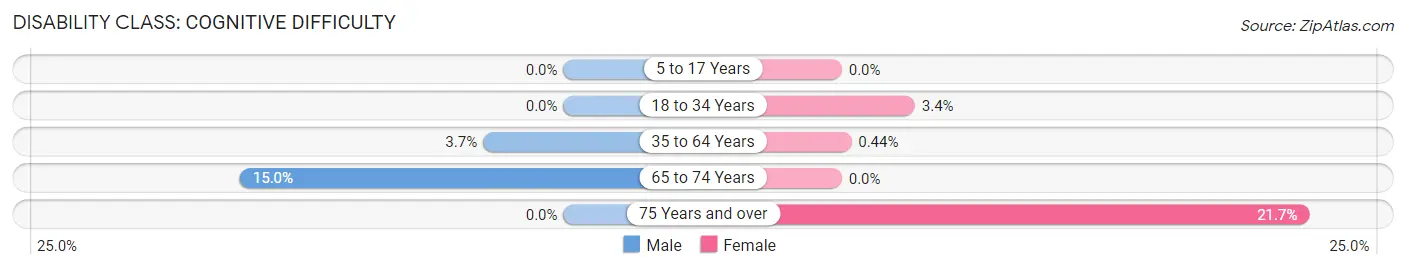
| Age Bracket | Male | Female |
| 5 to 17 Years | 0 (0.0%) | 0 (0.0%) |
| 18 to 34 Years | 0 (0.0%) | 24 (3.4%) |
| 35 to 64 Years | 64 (3.7%) | 9 (0.4%) |
| 65 to 74 Years | 62 (15.0%) | 0 (0.0%) |
| 75 Years and over | 0 (0.0%) | 113 (21.7%) |
Disability Class: Ambulatory Difficulty
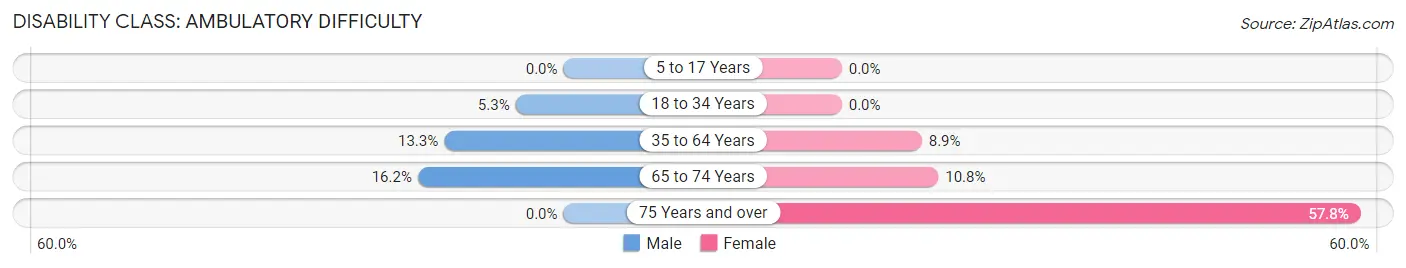
| Age Bracket | Male | Female |
| 5 to 17 Years | 0 (0.0%) | 0 (0.0%) |
| 18 to 34 Years | 54 (5.3%) | 0 (0.0%) |
| 35 to 64 Years | 228 (13.3%) | 182 (8.9%) |
| 65 to 74 Years | 67 (16.2%) | 56 (10.7%) |
| 75 Years and over | 0 (0.0%) | 301 (57.8%) |
Disability Class: Self-Care Difficulty
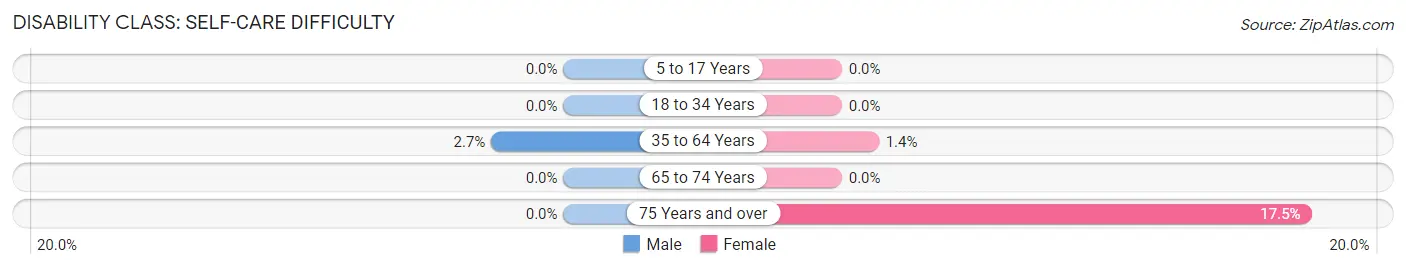
| Age Bracket | Male | Female |
| 5 to 17 Years | 0 (0.0%) | 0 (0.0%) |
| 18 to 34 Years | 0 (0.0%) | 0 (0.0%) |
| 35 to 64 Years | 46 (2.7%) | 28 (1.4%) |
| 65 to 74 Years | 0 (0.0%) | 0 (0.0%) |
| 75 Years and over | 0 (0.0%) | 91 (17.5%) |
Technology Access in Lynwood
Computing Device Access in Lynwood
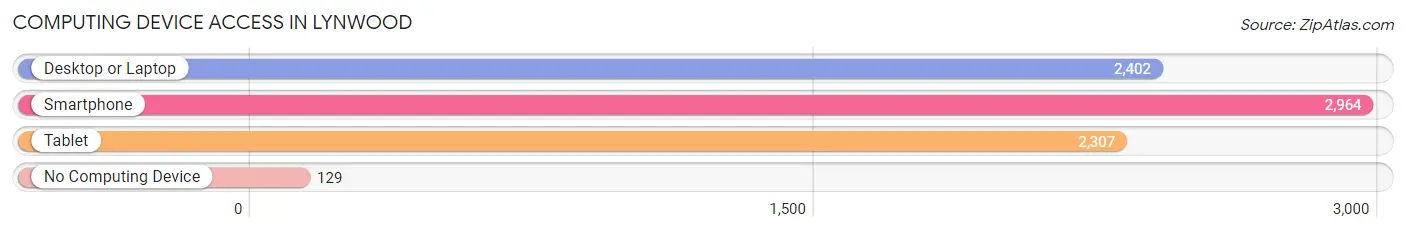
| Device Type | # Households | % Households |
| Desktop or Laptop | 2,402 | 73.2% |
| Smartphone | 2,964 | 90.3% |
| Tablet | 2,307 | 70.3% |
| No Computing Device | 129 | 3.9% |
| Total | 3,282 | 100.0% |
Internet Access in Lynwood
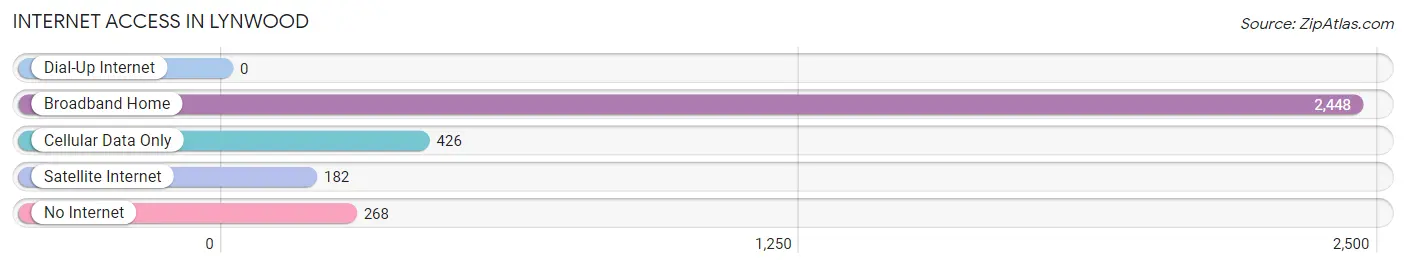
| Internet Type | # Households | % Households |
| Dial-Up Internet | 0 | 0.0% |
| Broadband Home | 2,448 | 74.6% |
| Cellular Data Only | 426 | 13.0% |
| Satellite Internet | 182 | 5.6% |
| No Internet | 268 | 8.2% |
| Total | 3,282 | 100.0% |
Lynwood Summary
Lynwood, Illinois is a village located in Cook County, Illinois, United States. The village is located approximately 25 miles south of Chicago and is part of the Chicago metropolitan area. As of the 2010 census, the village had a population of 10,834.
History
The area that is now Lynwood was first settled in the early 1800s by German immigrants. The village was originally known as "Hardscrabble" and was later renamed "Lynwood" in 1891. The name was chosen to honor a local resident, John Lynch, who had served in the Civil War.
The village was incorporated in 1895 and was primarily a farming community until the 1950s. During this time, the village experienced a population boom as many people moved to the area from Chicago. This influx of people led to the development of new businesses and industries, including a steel mill and a brickyard.
Geography
Lynwood is located in northeastern Illinois, approximately 25 miles south of Chicago. The village is situated on the banks of the Calumet River and is bordered by the cities of Lansing and South Holland to the north, and the villages of Sauk Village and Ford Heights to the south.
The village has a total area of 3.2 square miles, all of which is land. The terrain is mostly flat, with some rolling hills in the northern part of the village.
Economy
The economy of Lynwood is largely based on manufacturing and retail. The village is home to several factories, including a steel mill and a brickyard. There are also several retail stores in the village, including a grocery store, a hardware store, and a variety of restaurants.
The village also has a number of small businesses, including auto repair shops, beauty salons, and other service-oriented businesses.
Demographics
As of the 2010 census, the population of Lynwood was 10,834. The racial makeup of the village was 79.3% White, 15.2% African American, 0.7% Native American, 0.7% Asian, 0.1% Pacific Islander, 1.7% from other races, and 2.2% from two or more races. Hispanic or Latino of any race were 5.2% of the population.
The median household income in Lynwood was $50,945, and the median family income was $60,945. The per capita income for the village was $22,845. About 8.3% of families and 10.2% of the population were below the poverty line, including 14.2% of those under age 18 and 6.2% of those age 65 or over.
Common Questions
What is Per Capita Income in Lynwood?
Per Capita income in Lynwood is $38,753.
What is the Median Family Income in Lynwood?
Median Family Income in Lynwood is $107,436.
What is the Median Household income in Lynwood?
Median Household Income in Lynwood is $80,789.
What is Income or Wage Gap in Lynwood?
Income or Wage Gap in Lynwood is 15.4%.
Women in Lynwood earn 84.6 cents for every dollar earned by a man.
What is Inequality or Gini Index in Lynwood?
Inequality or Gini Index in Lynwood is 0.44.
What is the Total Population of Lynwood?
Total Population of Lynwood is 9,087.
What is the Total Male Population of Lynwood?
Total Male Population of Lynwood is 4,269.
What is the Total Female Population of Lynwood?
Total Female Population of Lynwood is 4,818.
What is the Ratio of Males per 100 Females in Lynwood?
There are 88.61 Males per 100 Females in Lynwood.
What is the Ratio of Females per 100 Males in Lynwood?
There are 112.86 Females per 100 Males in Lynwood.
What is the Median Population Age in Lynwood?
Median Population Age in Lynwood is 43.1 Years.
What is the Average Family Size in Lynwood
Average Family Size in Lynwood is 3.4 People.
What is the Average Household Size in Lynwood
Average Household Size in Lynwood is 2.8 People.
How Large is the Labor Force in Lynwood?
There are 4,510 People in the Labor Forcein in Lynwood.
What is the Percentage of People in the Labor Force in Lynwood?
62.4% of People are in the Labor Force in Lynwood.
What is the Unemployment Rate in Lynwood?
Unemployment Rate in Lynwood is 5.0%.