Knoxville, IL Map & Demographics
Knoxville Map
Knoxville Overview
$30,536
PER CAPITA INCOME
$89,211
AVG FAMILY INCOME
$76,161
AVG HOUSEHOLD INCOME
38.6%
WAGE / INCOME GAP [ % ]
61.4¢/ $1
WAGE / INCOME GAP [ $ ]
0.38
INEQUALITY / GINI INDEX
3,318
TOTAL POPULATION
1,434
MALE POPULATION
1,884
FEMALE POPULATION
76.11
MALES / 100 FEMALES
131.38
FEMALES / 100 MALES
41.6
MEDIAN AGE
3.1
AVG FAMILY SIZE
2.6
AVG HOUSEHOLD SIZE
1,462
LABOR FORCE [ PEOPLE ]
58.7%
PERCENT IN LABOR FORCE
4.6%
UNEMPLOYMENT RATE
Knoxville Zip Codes
Knoxville Area Codes
Income in Knoxville
Income Overview in Knoxville
Per Capita Income in Knoxville is $30,536, while median incomes of families and households are $89,211 and $76,161 respectively.
| Characteristic | Number | Measure |
| Per Capita Income | 3,318 | $30,536 |
| Median Family Income | 856 | $89,211 |
| Mean Family Income | 856 | $97,759 |
| Median Household Income | 1,221 | $76,161 |
| Mean Household Income | 1,221 | $83,905 |
| Income Deficit | 856 | $0 |
| Wage / Income Gap (%) | 3,318 | 38.62% |
| Wage / Income Gap ($) | 3,318 | 61.38¢ per $1 |
| Gini / Inequality Index | 3,318 | 0.38 |
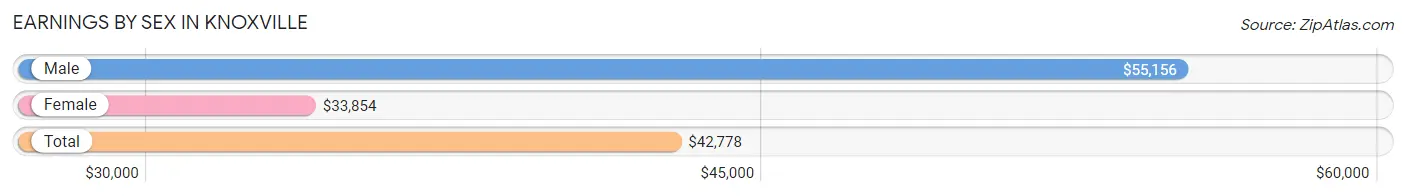
Earnings by Sex in Knoxville
Average Earnings in Knoxville are $42,778, $55,156 for men and $33,854 for women, a difference of 38.6%.
| Sex | Number | Average Earnings |
| Male | 711 (46.4%) | $55,156 |
| Female | 821 (53.6%) | $33,854 |
| Total | 1,532 (100.0%) | $42,778 |
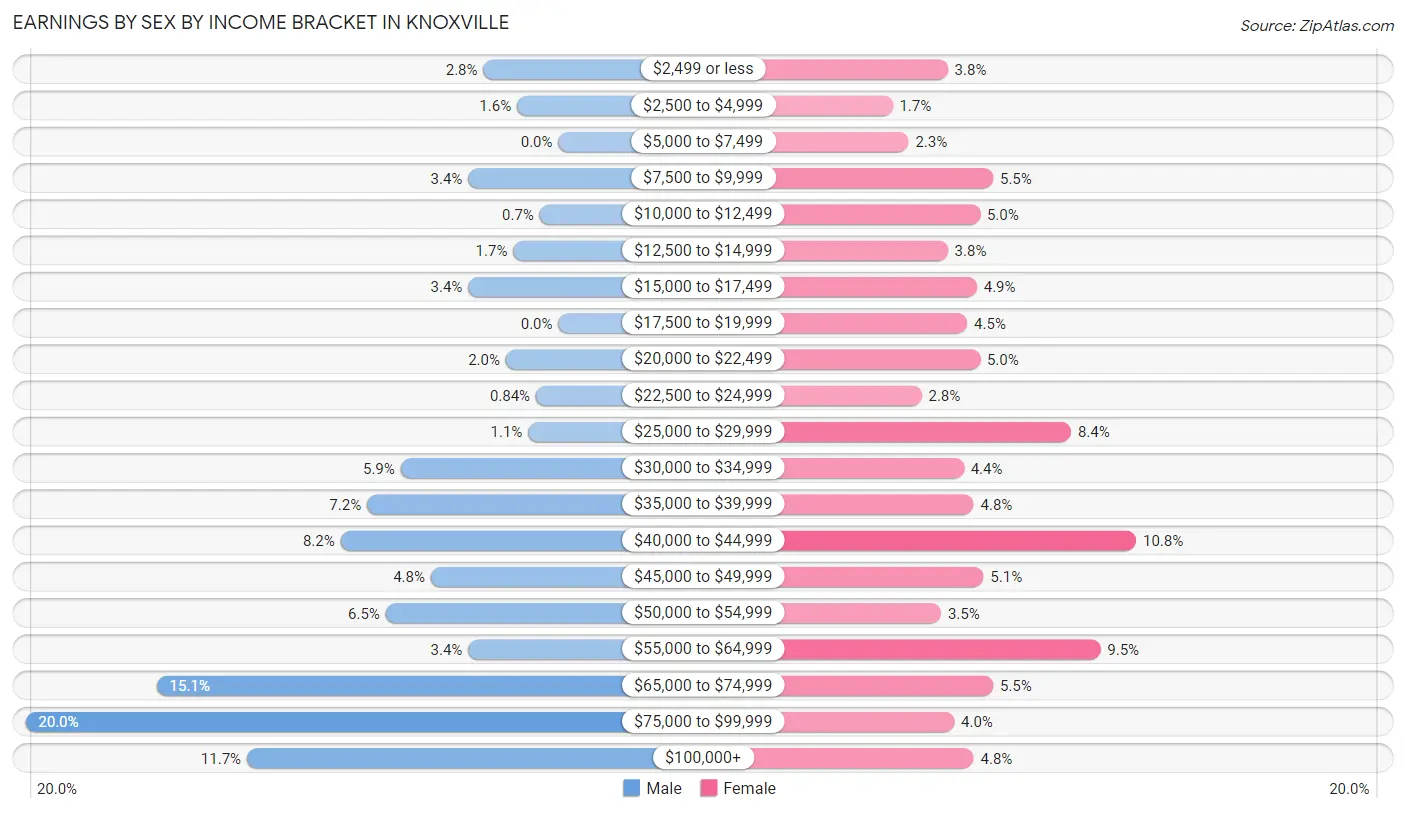
Earnings by Sex by Income Bracket in Knoxville
The most common earnings brackets in Knoxville are $75,000 to $99,999 for men (142 | 20.0%) and $40,000 to $44,999 for women (89 | 10.8%).
| Income | Male | Female |
| $2,499 or less | 20 (2.8%) | 31 (3.8%) |
| $2,500 to $4,999 | 11 (1.5%) | 14 (1.7%) |
| $5,000 to $7,499 | 0 (0.0%) | 19 (2.3%) |
| $7,500 to $9,999 | 24 (3.4%) | 45 (5.5%) |
| $10,000 to $12,499 | 5 (0.7%) | 41 (5.0%) |
| $12,500 to $14,999 | 12 (1.7%) | 31 (3.8%) |
| $15,000 to $17,499 | 24 (3.4%) | 40 (4.9%) |
| $17,500 to $19,999 | 0 (0.0%) | 37 (4.5%) |
| $20,000 to $22,499 | 14 (2.0%) | 41 (5.0%) |
| $22,500 to $24,999 | 6 (0.8%) | 23 (2.8%) |
| $25,000 to $29,999 | 8 (1.1%) | 69 (8.4%) |
| $30,000 to $34,999 | 42 (5.9%) | 36 (4.4%) |
| $35,000 to $39,999 | 51 (7.2%) | 39 (4.8%) |
| $40,000 to $44,999 | 58 (8.2%) | 89 (10.8%) |
| $45,000 to $49,999 | 34 (4.8%) | 42 (5.1%) |
| $50,000 to $54,999 | 46 (6.5%) | 29 (3.5%) |
| $55,000 to $64,999 | 24 (3.4%) | 78 (9.5%) |
| $65,000 to $74,999 | 107 (15.0%) | 45 (5.5%) |
| $75,000 to $99,999 | 142 (20.0%) | 33 (4.0%) |
| $100,000+ | 83 (11.7%) | 39 (4.8%) |
| Total | 711 (100.0%) | 821 (100.0%) |
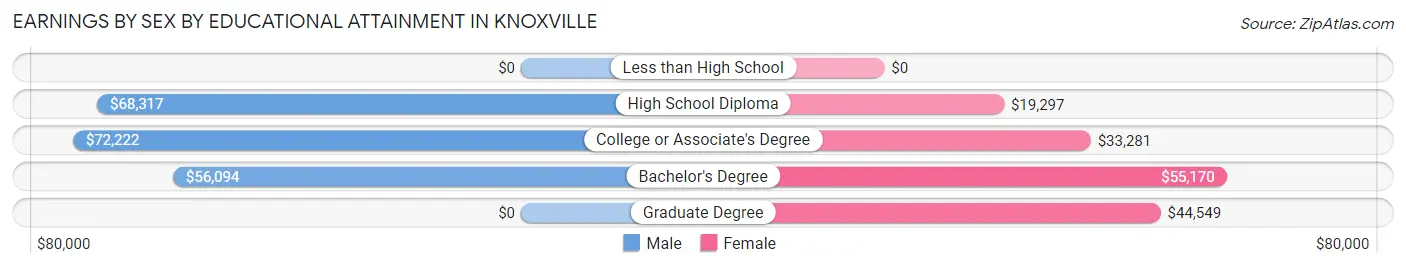
Earnings by Sex by Educational Attainment in Knoxville
Average earnings in Knoxville are $68,018 for men and $37,277 for women, a difference of 45.2%. Men with an educational attainment of college or associate's degree enjoy the highest average annual earnings of $72,222, while those with bachelor's degree education earn the least with $56,094. Women with an educational attainment of bachelor's degree earn the most with the average annual earnings of $55,170, while those with high school diploma education have the smallest earnings of $19,297.
| Educational Attainment | Male Income | Female Income |
| Less than High School | - | - |
| High School Diploma | $68,317 | $19,297 |
| College or Associate's Degree | $72,222 | $33,281 |
| Bachelor's Degree | $56,094 | $55,170 |
| Graduate Degree | - | - |
| Total | $68,018 | $37,277 |
Family Income in Knoxville
Family Income Brackets in Knoxville
According to the Knoxville family income data, there are 219 families falling into the $100,000 to $149,999 income range, which is the most common income bracket and makes up 25.6% of all families. Conversely, the less than $10,000 income bracket is the least frequent group with only 8 families (0.9%) belonging to this category.
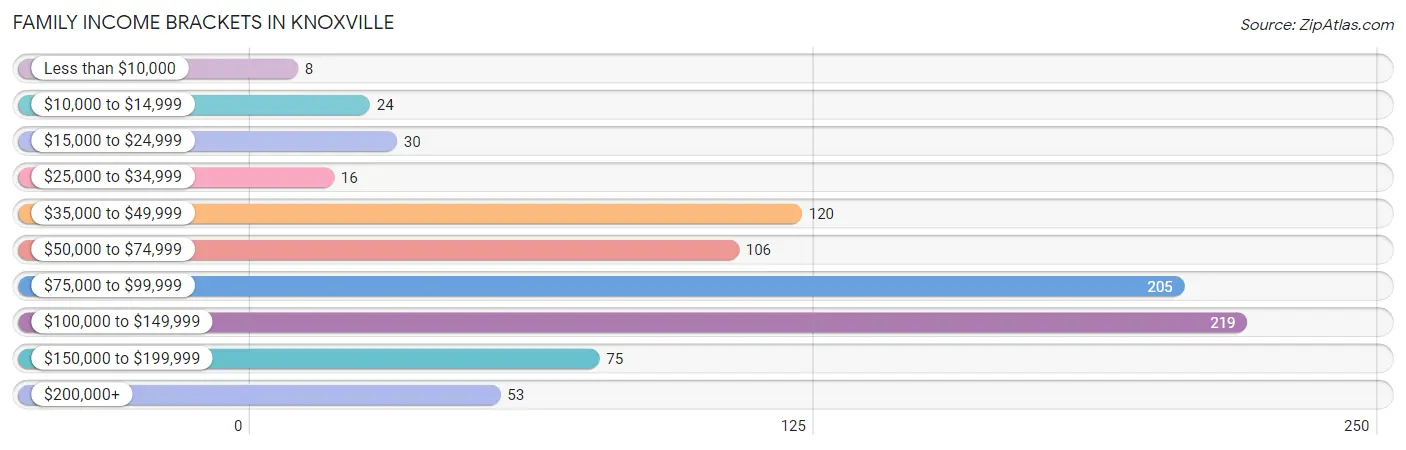
| Income Bracket | # Families | % Families |
| Less than $10,000 | 8 | 0.9% |
| $10,000 to $14,999 | 24 | 2.8% |
| $15,000 to $24,999 | 30 | 3.5% |
| $25,000 to $34,999 | 16 | 1.9% |
| $35,000 to $49,999 | 120 | 14.0% |
| $50,000 to $74,999 | 106 | 12.4% |
| $75,000 to $99,999 | 205 | 23.9% |
| $100,000 to $149,999 | 219 | 25.6% |
| $150,000 to $199,999 | 75 | 8.8% |
| $200,000+ | 53 | 6.2% |
Family Income by Famaliy Size in Knoxville
5-person families (63 | 7.4%) account for the highest median family income in Knoxville with $126,307 per family, while 2-person families (377 | 44.0%) have the highest median income of $41,066 per family member.
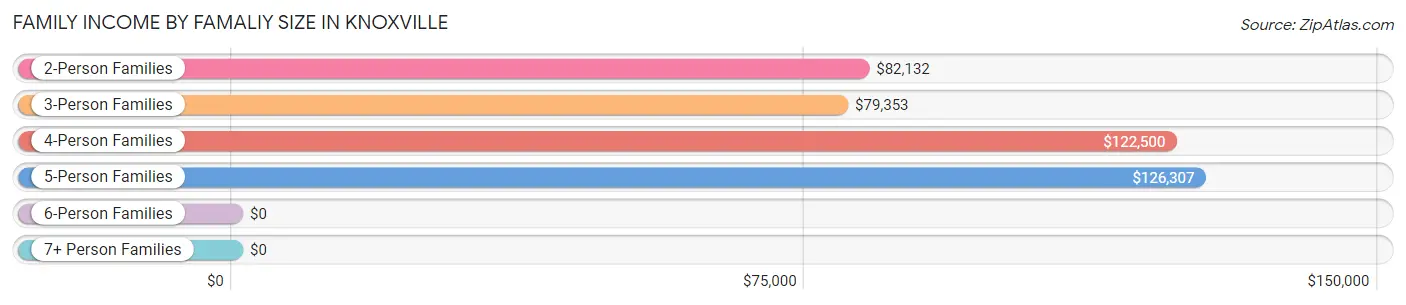
| Income Bracket | # Families | Median Income |
| 2-Person Families | 377 (44.0%) | $82,132 |
| 3-Person Families | 229 (26.8%) | $79,353 |
| 4-Person Families | 136 (15.9%) | $122,500 |
| 5-Person Families | 63 (7.4%) | $126,307 |
| 6-Person Families | 11 (1.3%) | $0 |
| 7+ Person Families | 40 (4.7%) | $0 |
| Total | 856 (100.0%) | $89,211 |
Family Income by Number of Earners in Knoxville
The median family income in Knoxville is $89,211, with families comprising 3+ earners (83) having the highest median family income of $142,109, while families with 1 earner (290) have the lowest median family income of $53,833, accounting for 9.7% and 33.9% of families, respectively.
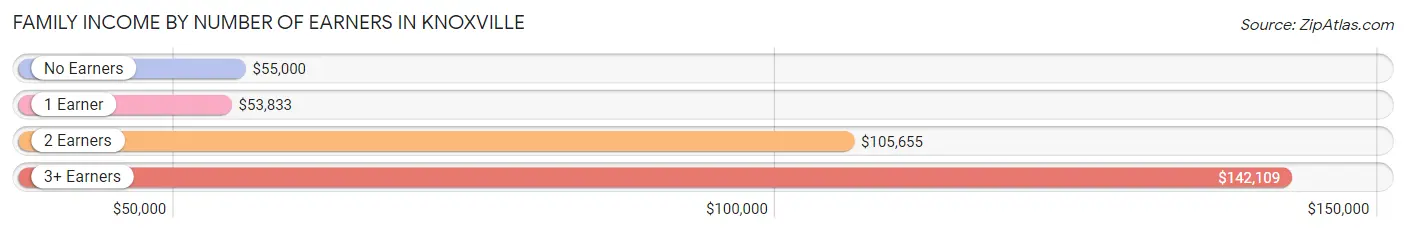
| Number of Earners | # Families | Median Income |
| No Earners | 114 (13.3%) | $55,000 |
| 1 Earner | 290 (33.9%) | $53,833 |
| 2 Earners | 369 (43.1%) | $105,655 |
| 3+ Earners | 83 (9.7%) | $142,109 |
| Total | 856 (100.0%) | $89,211 |
Household Income in Knoxville
Household Income Brackets in Knoxville
With 272 households falling in the category, the $100,000 to $149,999 income range is the most frequent in Knoxville, accounting for 22.3% of all households. In contrast, only 33 households (2.7%) fall into the less than $10,000 income bracket, making it the least populous group.
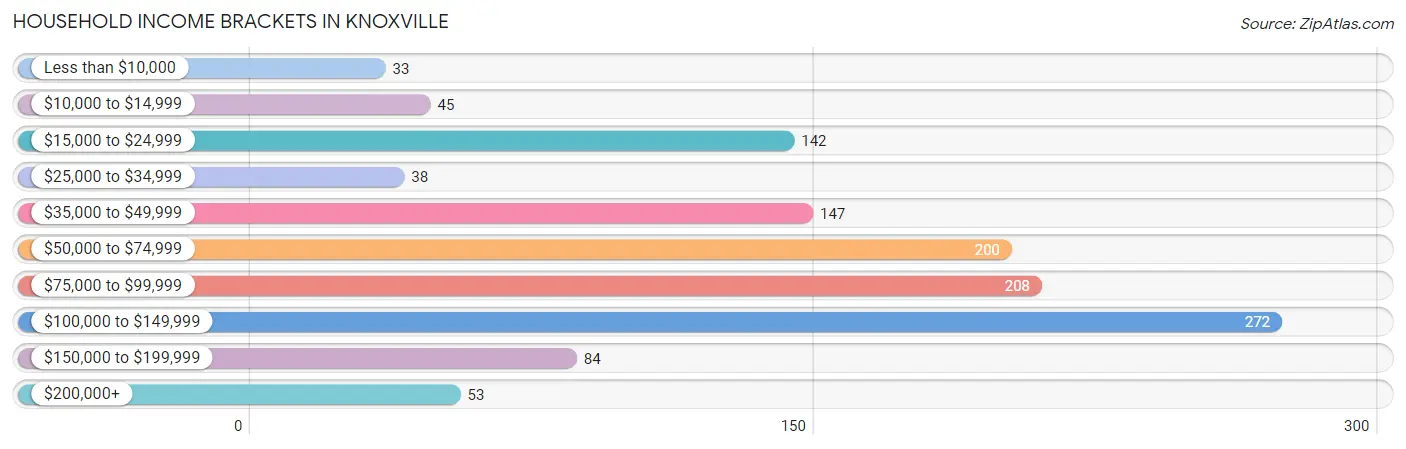
| Income Bracket | # Households | % Households |
| Less than $10,000 | 33 | 2.7% |
| $10,000 to $14,999 | 45 | 3.7% |
| $15,000 to $24,999 | 142 | 11.6% |
| $25,000 to $34,999 | 38 | 3.1% |
| $35,000 to $49,999 | 147 | 12.0% |
| $50,000 to $74,999 | 200 | 16.4% |
| $75,000 to $99,999 | 208 | 17.0% |
| $100,000 to $149,999 | 272 | 22.3% |
| $150,000 to $199,999 | 84 | 6.9% |
| $200,000+ | 53 | 4.3% |
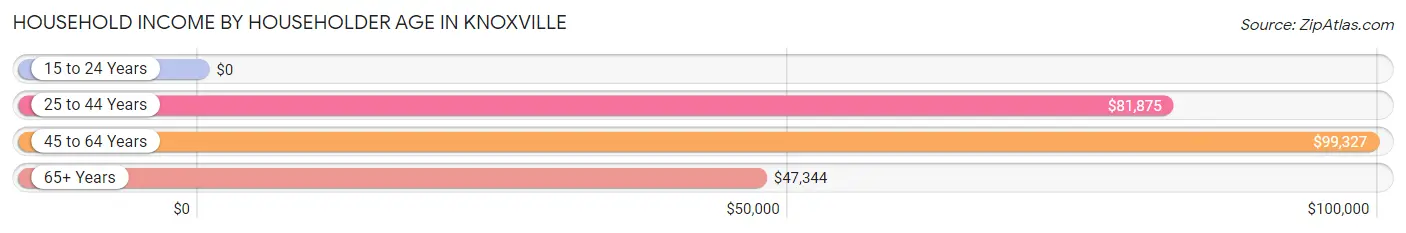
Household Income by Householder Age in Knoxville
The median household income in Knoxville is $76,161, with the highest median household income of $99,327 found in the 45 to 64 years age bracket for the primary householder. A total of 453 households (37.1%) fall into this category. Meanwhile, the 15 to 24 years age bracket for the primary householder has the lowest median household income of $0, with 8 households (0.7%) in this group.
| Income Bracket | # Households | Median Income |
| 15 to 24 Years | 8 (0.7%) | $0 |
| 25 to 44 Years | 377 (30.9%) | $81,875 |
| 45 to 64 Years | 453 (37.1%) | $99,327 |
| 65+ Years | 383 (31.4%) | $47,344 |
| Total | 1,221 (100.0%) | $76,161 |
Poverty in Knoxville
Income Below Poverty by Sex and Age in Knoxville
With 6.4% poverty level for males and 7.0% for females among the residents of Knoxville, 6 to 11 year old males and 25 to 34 year old females are the most vulnerable to poverty, with 46 males (22.9%) and 33 females (18.2%) in their respective age groups living below the poverty level.
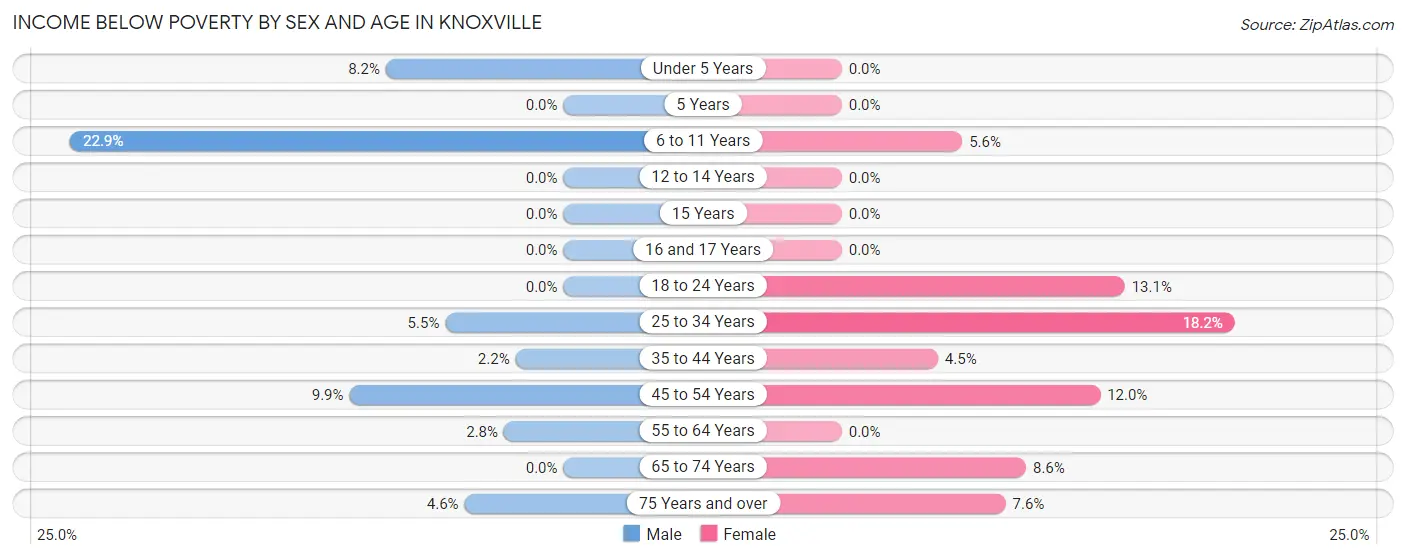
| Age Bracket | Male | Female |
| Under 5 Years | 7 (8.2%) | 0 (0.0%) |
| 5 Years | 0 (0.0%) | 0 (0.0%) |
| 6 to 11 Years | 46 (22.9%) | 8 (5.6%) |
| 12 to 14 Years | 0 (0.0%) | 0 (0.0%) |
| 15 Years | 0 (0.0%) | 0 (0.0%) |
| 16 and 17 Years | 0 (0.0%) | 0 (0.0%) |
| 18 to 24 Years | 0 (0.0%) | 13 (13.1%) |
| 25 to 34 Years | 8 (5.5%) | 33 (18.2%) |
| 35 to 44 Years | 4 (2.2%) | 9 (4.5%) |
| 45 to 54 Years | 15 (9.9%) | 32 (12.0%) |
| 55 to 64 Years | 4 (2.8%) | 0 (0.0%) |
| 65 to 74 Years | 0 (0.0%) | 13 (8.6%) |
| 75 Years and over | 5 (4.6%) | 13 (7.6%) |
| Total | 89 (6.4%) | 121 (7.0%) |
Income Above Poverty by Sex and Age in Knoxville
According to the poverty statistics in Knoxville, males aged 5 years and females aged under 5 years are the age groups that are most secure financially, with 100.0% of males and 100.0% of females in these age groups living above the poverty line.
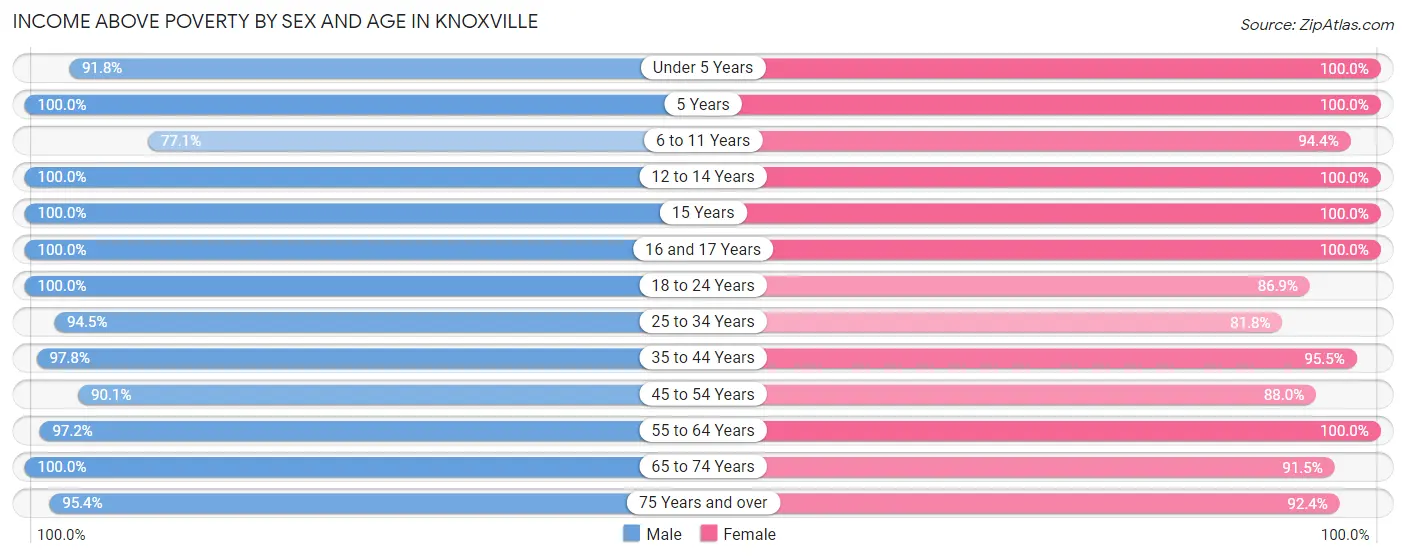
| Age Bracket | Male | Female |
| Under 5 Years | 78 (91.8%) | 172 (100.0%) |
| 5 Years | 20 (100.0%) | 22 (100.0%) |
| 6 to 11 Years | 155 (77.1%) | 135 (94.4%) |
| 12 to 14 Years | 82 (100.0%) | 38 (100.0%) |
| 15 Years | 34 (100.0%) | 23 (100.0%) |
| 16 and 17 Years | 59 (100.0%) | 39 (100.0%) |
| 18 to 24 Years | 77 (100.0%) | 86 (86.9%) |
| 25 to 34 Years | 138 (94.5%) | 148 (81.8%) |
| 35 to 44 Years | 176 (97.8%) | 193 (95.5%) |
| 45 to 54 Years | 136 (90.1%) | 235 (88.0%) |
| 55 to 64 Years | 141 (97.2%) | 233 (100.0%) |
| 65 to 74 Years | 107 (100.0%) | 139 (91.4%) |
| 75 Years and over | 104 (95.4%) | 158 (92.4%) |
| Total | 1,307 (93.6%) | 1,621 (93.0%) |
Income Below Poverty Among Married-Couple Families in Knoxville
The poverty statistics for married-couple families in Knoxville show that 2.4% or 15 of the total 637 families live below the poverty line. Families with no children have the highest poverty rate of 3.9%, comprising of 15 families. On the other hand, families with 1 or 2 children have the lowest poverty rate of 0.0%, which includes 0 families.
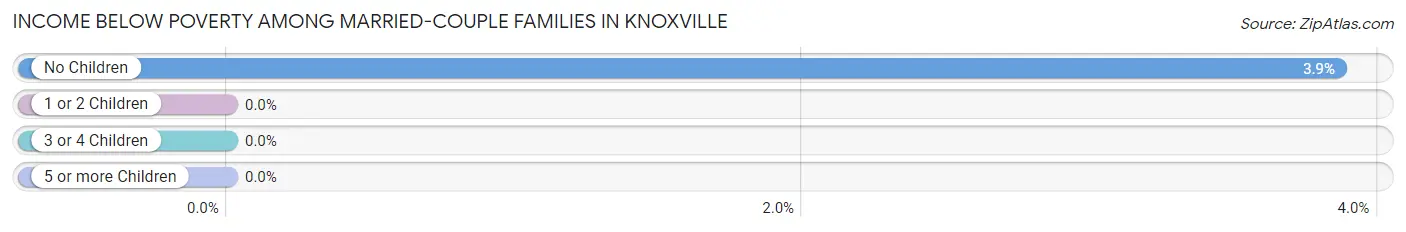
| Children | Above Poverty | Below Poverty |
| No Children | 374 (96.1%) | 15 (3.9%) |
| 1 or 2 Children | 157 (100.0%) | 0 (0.0%) |
| 3 or 4 Children | 66 (100.0%) | 0 (0.0%) |
| 5 or more Children | 25 (100.0%) | 0 (0.0%) |
| Total | 622 (97.7%) | 15 (2.4%) |
Income Below Poverty Among Single-Parent Households in Knoxville
According to the poverty data in Knoxville, 16.7% or 8 single-father households and 19.3% or 33 single-mother households are living below the poverty line. Among single-father households, those with 1 or 2 children have the highest poverty rate, with 8 households (16.7%) experiencing poverty. Likewise, among single-mother households, those with 1 or 2 children have the highest poverty rate, with 33 households (28.2%) falling below the poverty line.
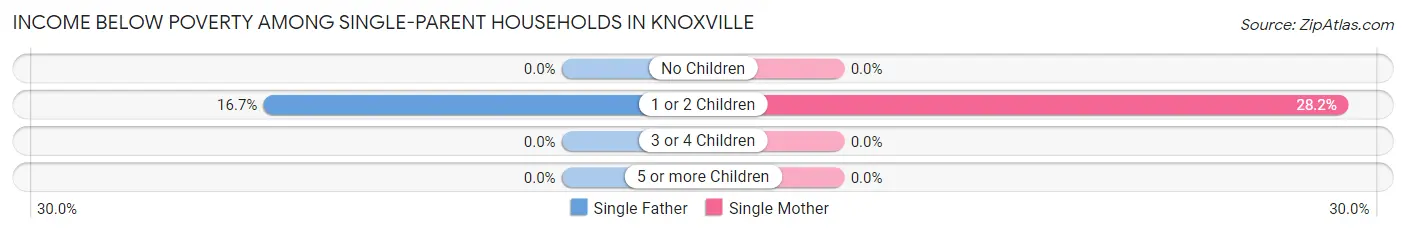
| Children | Single Father | Single Mother |
| No Children | 0 (0.0%) | 0 (0.0%) |
| 1 or 2 Children | 8 (16.7%) | 33 (28.2%) |
| 3 or 4 Children | 0 (0.0%) | 0 (0.0%) |
| 5 or more Children | 0 (0.0%) | 0 (0.0%) |
| Total | 8 (16.7%) | 33 (19.3%) |
Income Below Poverty Among Married-Couple vs Single-Parent Households in Knoxville
The poverty data for Knoxville shows that 15 of the married-couple family households (2.4%) and 41 of the single-parent households (18.7%) are living below the poverty level. Within the married-couple family households, those with no children have the highest poverty rate, with 15 households (3.9%) falling below the poverty line. Among the single-parent households, those with 1 or 2 children have the highest poverty rate, with 41 household (24.8%) living below poverty.
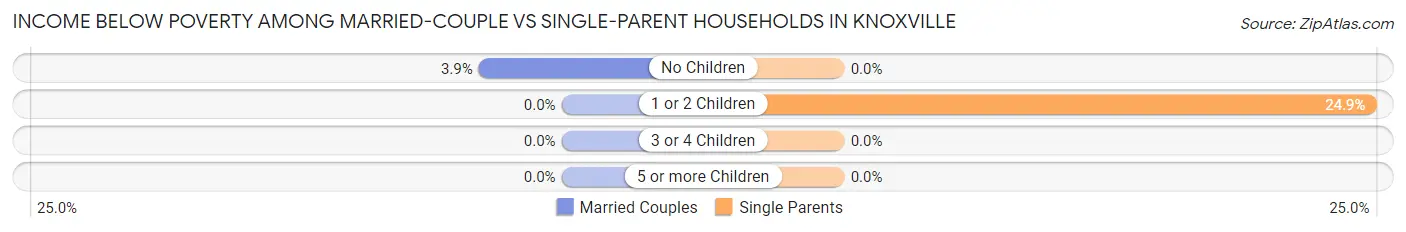
| Children | Married-Couple Families | Single-Parent Households |
| No Children | 15 (3.9%) | 0 (0.0%) |
| 1 or 2 Children | 0 (0.0%) | 41 (24.8%) |
| 3 or 4 Children | 0 (0.0%) | 0 (0.0%) |
| 5 or more Children | 0 (0.0%) | 0 (0.0%) |
| Total | 15 (2.4%) | 41 (18.7%) |
Race in Knoxville
The most populous races in Knoxville are White / Caucasian (3,200 | 96.4%), Two or more Races (98 | 2.9%), and Hispanic or Latino (70 | 2.1%).
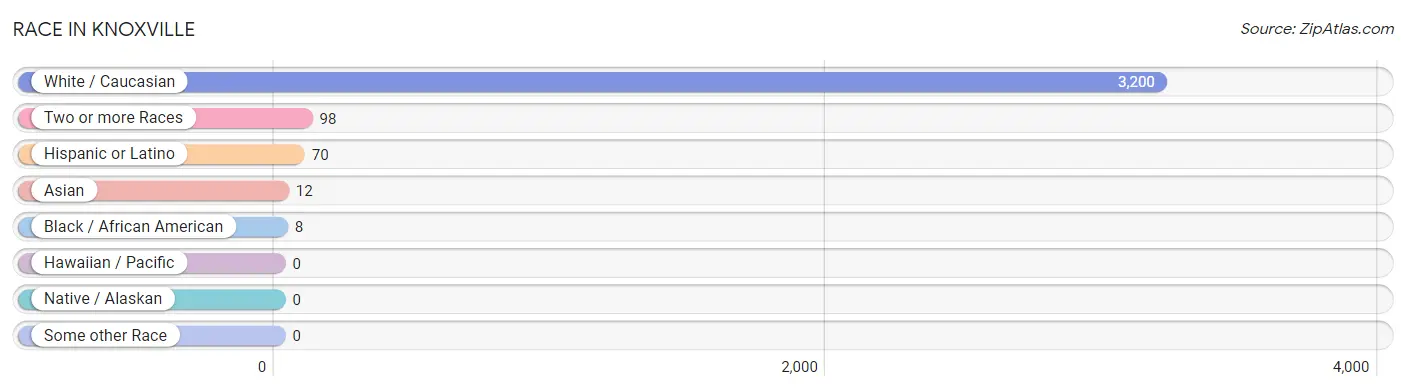
| Race | # Population | % Population |
| Asian | 12 | 0.4% |
| Black / African American | 8 | 0.2% |
| Hawaiian / Pacific | 0 | 0.0% |
| Hispanic or Latino | 70 | 2.1% |
| Native / Alaskan | 0 | 0.0% |
| White / Caucasian | 3,200 | 96.4% |
| Two or more Races | 98 | 2.9% |
| Some other Race | 0 | 0.0% |
| Total | 3,318 | 100.0% |
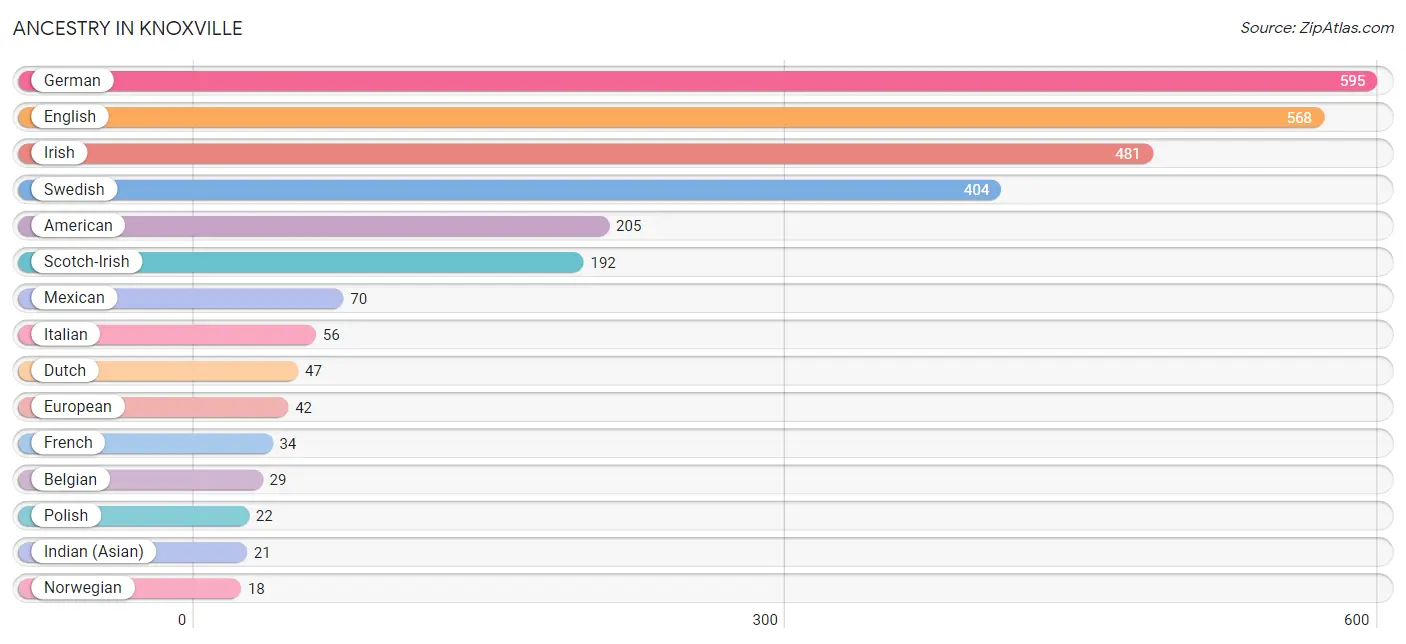
Ancestry in Knoxville
The most populous ancestries reported in Knoxville are German (595 | 17.9%), English (568 | 17.1%), Irish (481 | 14.5%), Swedish (404 | 12.2%), and American (205 | 6.2%), together accounting for 67.9% of all Knoxville residents.
| Ancestry | # Population | % Population |
| American | 205 | 6.2% |
| Australian | 7 | 0.2% |
| Austrian | 4 | 0.1% |
| Belgian | 29 | 0.9% |
| Bhutanese | 8 | 0.2% |
| British | 11 | 0.3% |
| Croatian | 4 | 0.1% |
| Czech | 10 | 0.3% |
| Dutch | 47 | 1.4% |
| Eastern European | 6 | 0.2% |
| English | 568 | 17.1% |
| European | 42 | 1.3% |
| French | 34 | 1.0% |
| German | 595 | 17.9% |
| Hungarian | 3 | 0.1% |
| Indian (Asian) | 21 | 0.6% |
| Irish | 481 | 14.5% |
| Italian | 56 | 1.7% |
| Korean | 4 | 0.1% |
| Mexican | 70 | 2.1% |
| Northern European | 4 | 0.1% |
| Norwegian | 18 | 0.5% |
| Polish | 22 | 0.7% |
| Scandinavian | 8 | 0.2% |
| Scotch-Irish | 192 | 5.8% |
| Scottish | 17 | 0.5% |
| Swedish | 404 | 12.2% |
| Swiss | 6 | 0.2% |
| Welsh | 17 | 0.5% | View All 29 Rows |
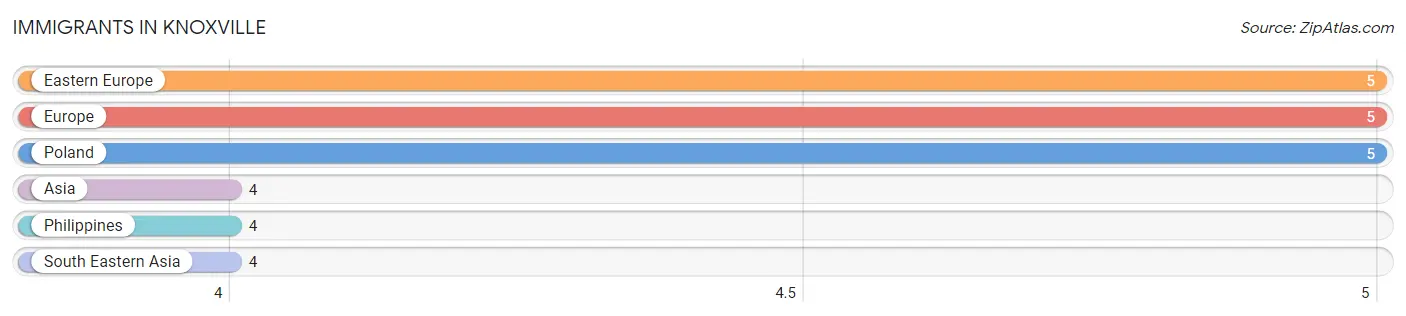
Immigrants in Knoxville
The most numerous immigrant groups reported in Knoxville came from Eastern Europe (5 | 0.2%), Europe (5 | 0.2%), Poland (5 | 0.2%), Asia (4 | 0.1%), and Philippines (4 | 0.1%), together accounting for 0.7% of all Knoxville residents.
| Immigration Origin | # Population | % Population |
| Asia | 4 | 0.1% |
| Eastern Europe | 5 | 0.2% |
| Europe | 5 | 0.2% |
| Philippines | 4 | 0.1% |
| Poland | 5 | 0.2% |
| South Eastern Asia | 4 | 0.1% | View All 6 Rows |
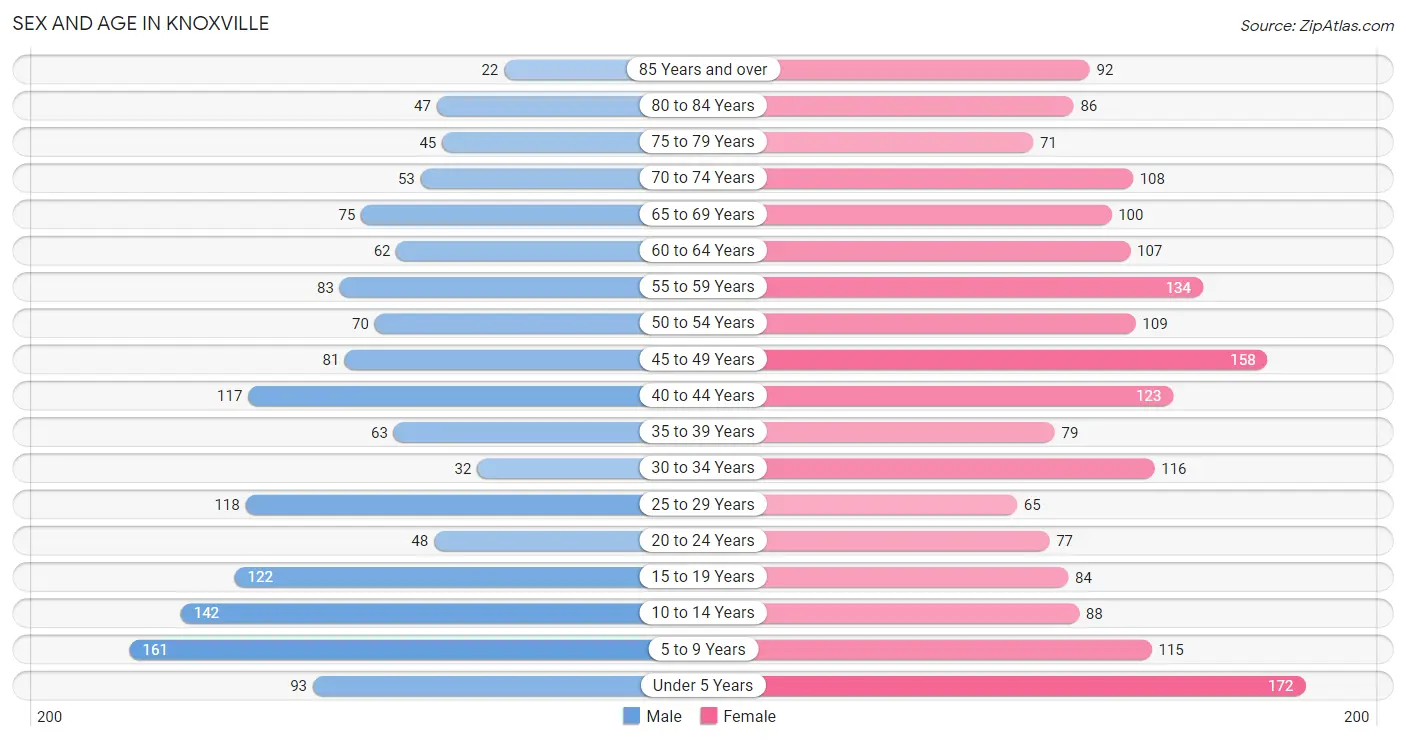
Sex and Age in Knoxville
Sex and Age in Knoxville
The most populous age groups in Knoxville are 5 to 9 Years (161 | 11.2%) for men and Under 5 Years (172 | 9.1%) for women.
| Age Bracket | Male | Female |
| Under 5 Years | 93 (6.5%) | 172 (9.1%) |
| 5 to 9 Years | 161 (11.2%) | 115 (6.1%) |
| 10 to 14 Years | 142 (9.9%) | 88 (4.7%) |
| 15 to 19 Years | 122 (8.5%) | 84 (4.5%) |
| 20 to 24 Years | 48 (3.4%) | 77 (4.1%) |
| 25 to 29 Years | 118 (8.2%) | 65 (3.5%) |
| 30 to 34 Years | 32 (2.2%) | 116 (6.2%) |
| 35 to 39 Years | 63 (4.4%) | 79 (4.2%) |
| 40 to 44 Years | 117 (8.2%) | 123 (6.5%) |
| 45 to 49 Years | 81 (5.7%) | 158 (8.4%) |
| 50 to 54 Years | 70 (4.9%) | 109 (5.8%) |
| 55 to 59 Years | 83 (5.8%) | 134 (7.1%) |
| 60 to 64 Years | 62 (4.3%) | 107 (5.7%) |
| 65 to 69 Years | 75 (5.2%) | 100 (5.3%) |
| 70 to 74 Years | 53 (3.7%) | 108 (5.7%) |
| 75 to 79 Years | 45 (3.1%) | 71 (3.8%) |
| 80 to 84 Years | 47 (3.3%) | 86 (4.6%) |
| 85 Years and over | 22 (1.5%) | 92 (4.9%) |
| Total | 1,434 (100.0%) | 1,884 (100.0%) |
Families and Households in Knoxville
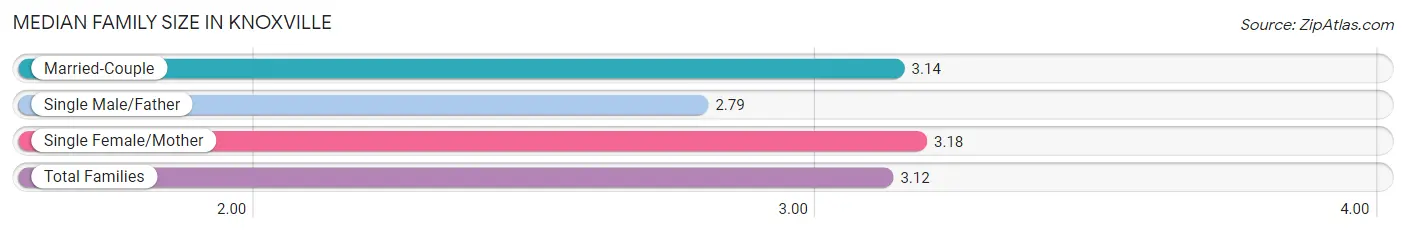
Median Family Size in Knoxville
The median family size in Knoxville is 3.12 persons per family, with single female/mother families (171 | 20.0%) accounting for the largest median family size of 3.18 persons per family. On the other hand, single male/father families (48 | 5.6%) represent the smallest median family size with 2.79 persons per family.
| Family Type | # Families | Family Size |
| Married-Couple | 637 (74.4%) | 3.14 |
| Single Male/Father | 48 (5.6%) | 2.79 |
| Single Female/Mother | 171 (20.0%) | 3.18 |
| Total Families | 856 (100.0%) | 3.12 |
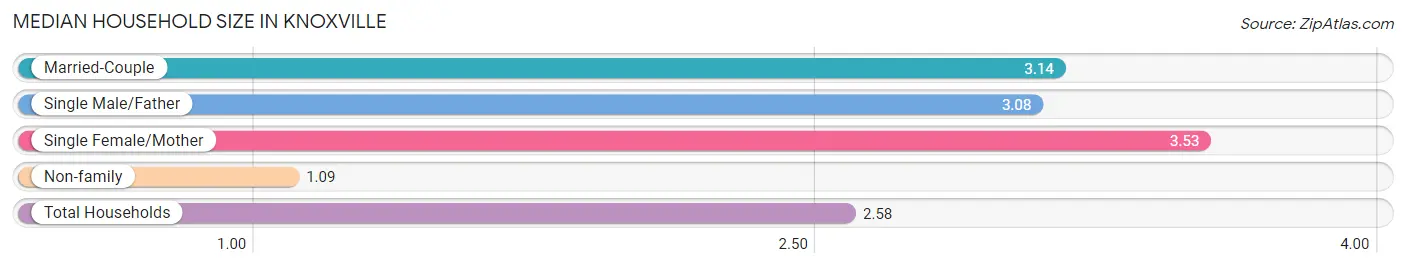
Median Household Size in Knoxville
The median household size in Knoxville is 2.58 persons per household, with single female/mother households (171 | 14.0%) accounting for the largest median household size of 3.53 persons per household. non-family households (365 | 29.9%) represent the smallest median household size with 1.09 persons per household.
| Household Type | # Households | Household Size |
| Married-Couple | 637 (52.2%) | 3.14 |
| Single Male/Father | 48 (3.9%) | 3.08 |
| Single Female/Mother | 171 (14.0%) | 3.53 |
| Non-family | 365 (29.9%) | 1.09 |
| Total Households | 1,221 (100.0%) | 2.58 |
Household Size by Marriage Status in Knoxville
Out of a total of 1,221 households in Knoxville, 856 (70.1%) are family households, while 365 (29.9%) are nonfamily households. The most numerous type of family households are 2-person households, comprising 321, and the most common type of nonfamily households are 1-person households, comprising 331.
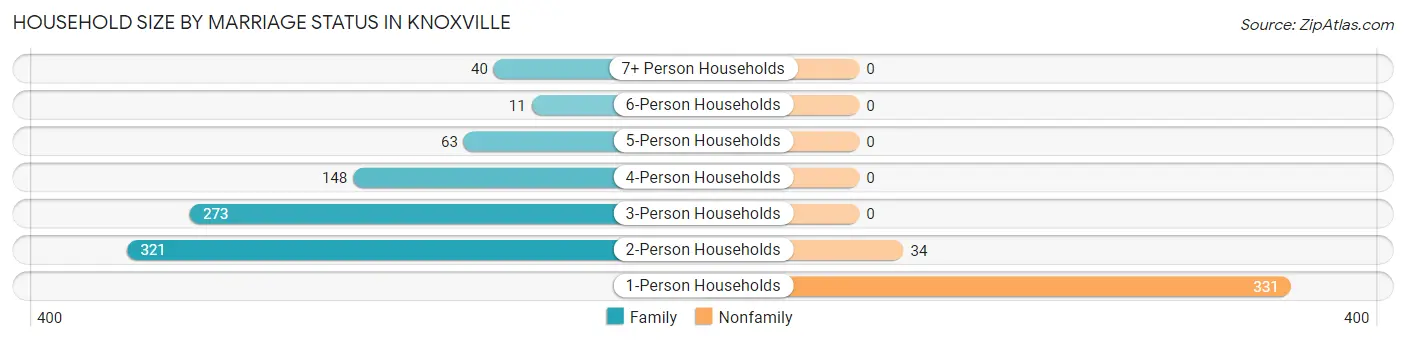
| Household Size | Family Households | Nonfamily Households |
| 1-Person Households | - | 331 (27.1%) |
| 2-Person Households | 321 (26.3%) | 34 (2.8%) |
| 3-Person Households | 273 (22.4%) | 0 (0.0%) |
| 4-Person Households | 148 (12.1%) | 0 (0.0%) |
| 5-Person Households | 63 (5.2%) | 0 (0.0%) |
| 6-Person Households | 11 (0.9%) | 0 (0.0%) |
| 7+ Person Households | 40 (3.3%) | 0 (0.0%) |
| Total | 856 (70.1%) | 365 (29.9%) |
Female Fertility in Knoxville
Fertility by Age in Knoxville
Average fertility rate in Knoxville is 95.0 births per 1,000 women. Women in the age bracket of 20 to 34 years have the highest fertility rate with 264.0 births per 1,000 women. Women in the age bracket of 20 to 34 years acount for 100.0% of all women with births.
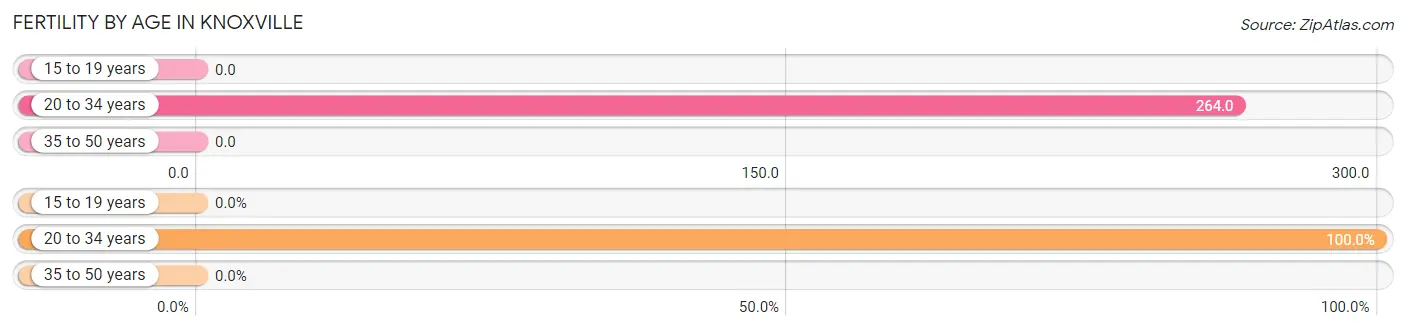
| Age Bracket | Women with Births | Births / 1,000 Women |
| 15 to 19 years | 0 (0.0%) | 0.0 |
| 20 to 34 years | 68 (100.0%) | 264.0 |
| 35 to 50 years | 0 (0.0%) | 0.0 |
| Total | 68 (100.0%) | 95.0 |
Fertility by Age by Marriage Status in Knoxville
45.6% of women with births (68) in Knoxville are married. The highest percentage of unmarried women with births falls into 20 to 34 years age bracket with 54.4% of them unmarried at the time of birth, while the lowest percentage of unmarried women with births belong to 20 to 34 years age bracket with 54.4% of them unmarried.
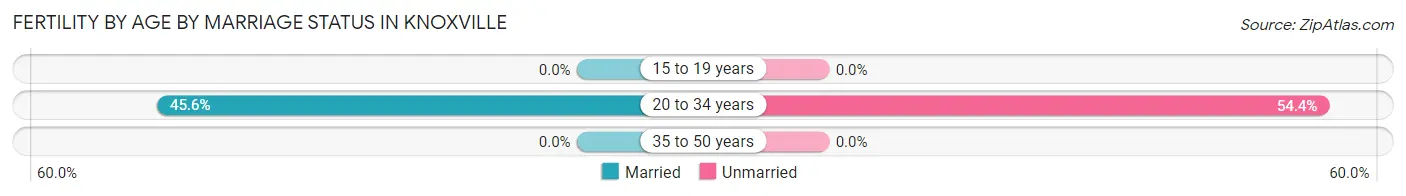
| Age Bracket | Married | Unmarried |
| 15 to 19 years | 0 (0.0%) | 0 (0.0%) |
| 20 to 34 years | 31 (45.6%) | 37 (54.4%) |
| 35 to 50 years | 0 (0.0%) | 0 (0.0%) |
| Total | 31 (45.6%) | 37 (54.4%) |
Fertility by Education in Knoxville
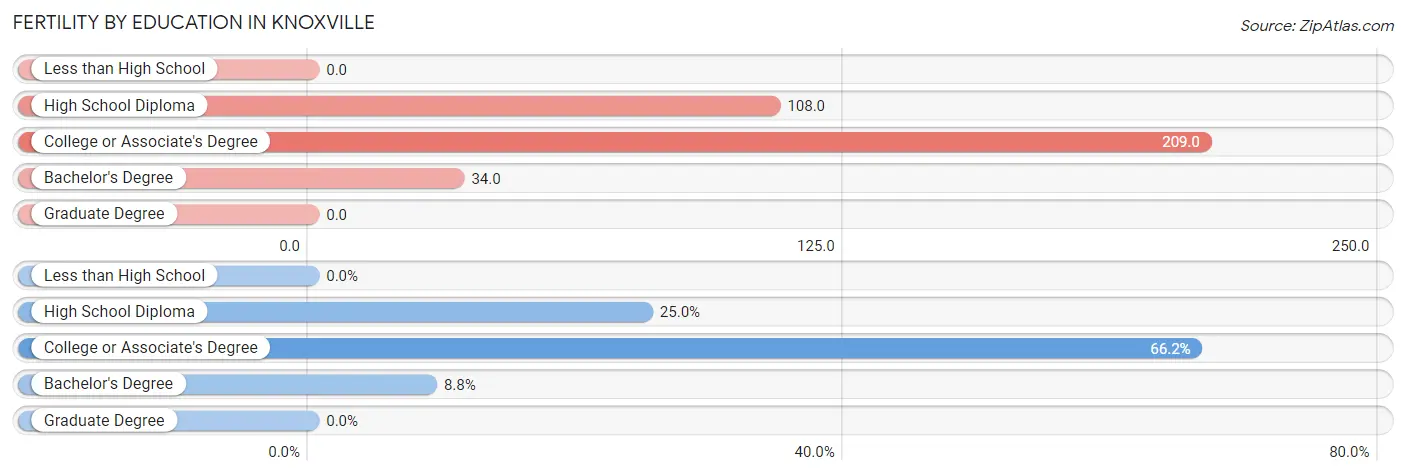
| Educational Attainment | Women with Births | Births / 1,000 Women |
| Less than High School | 0 (0.0%) | 0.0 |
| High School Diploma | 17 (25.0%) | 108.0 |
| College or Associate's Degree | 45 (66.2%) | 209.0 |
| Bachelor's Degree | 6 (8.8%) | 34.0 |
| Graduate Degree | 0 (0.0%) | 0.0 |
| Total | 68 (100.0%) | 95.0 |
Fertility by Education by Marriage Status in Knoxville
54.4% of women with births in Knoxville are unmarried. Women with the educational attainment of bachelor's degree are most likely to be married with 100.0% of them married at childbirth, while women with the educational attainment of high school diploma are least likely to be married with 100.0% of them unmarried at childbirth.
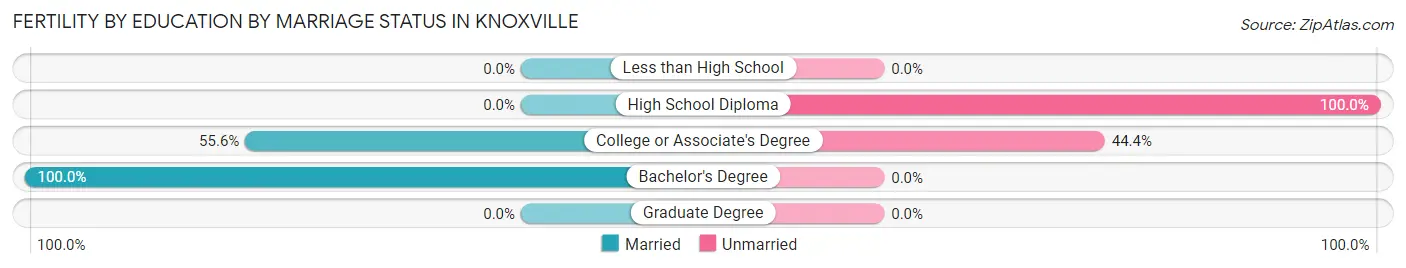
| Educational Attainment | Married | Unmarried |
| Less than High School | 0 (0.0%) | 0 (0.0%) |
| High School Diploma | 0 (0.0%) | 17 (100.0%) |
| College or Associate's Degree | 25 (55.6%) | 20 (44.4%) |
| Bachelor's Degree | 6 (100.0%) | 0 (0.0%) |
| Graduate Degree | 0 (0.0%) | 0 (0.0%) |
| Total | 31 (45.6%) | 37 (54.4%) |
Employment Characteristics in Knoxville
Employment by Class of Employer in Knoxville
Among the 1,357 employed individuals in Knoxville, private company employees (883 | 65.1%), not-for-profit organizations (150 | 11.1%), and state government employees (109 | 8.0%) make up the most common classes of employment.
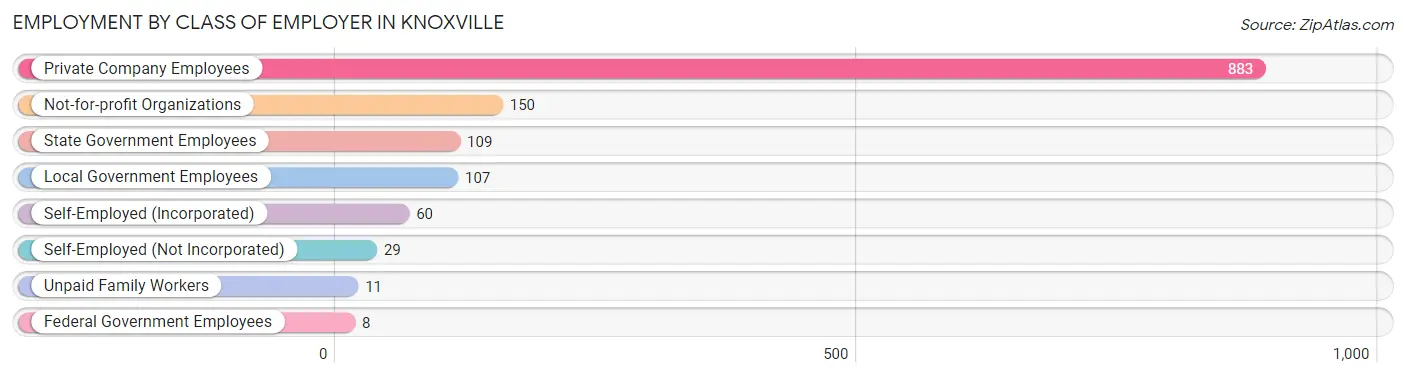
| Employer Class | # Employees | % Employees |
| Private Company Employees | 883 | 65.1% |
| Self-Employed (Incorporated) | 60 | 4.4% |
| Self-Employed (Not Incorporated) | 29 | 2.1% |
| Not-for-profit Organizations | 150 | 11.1% |
| Local Government Employees | 107 | 7.9% |
| State Government Employees | 109 | 8.0% |
| Federal Government Employees | 8 | 0.6% |
| Unpaid Family Workers | 11 | 0.8% |
| Total | 1,357 | 100.0% |
Employment Status by Age in Knoxville
According to the labor force statistics for Knoxville, out of the total population over 16 years of age (2,490), 58.7% or 1,462 individuals are in the labor force, with 4.6% or 67 of them unemployed. The age group with the highest labor force participation rate is 55 to 59 years, with 87.6% or 190 individuals in the labor force. Within the labor force, the 20 to 24 years age range has the highest percentage of unemployed individuals, with 35.6% or 36 of them being unemployed.
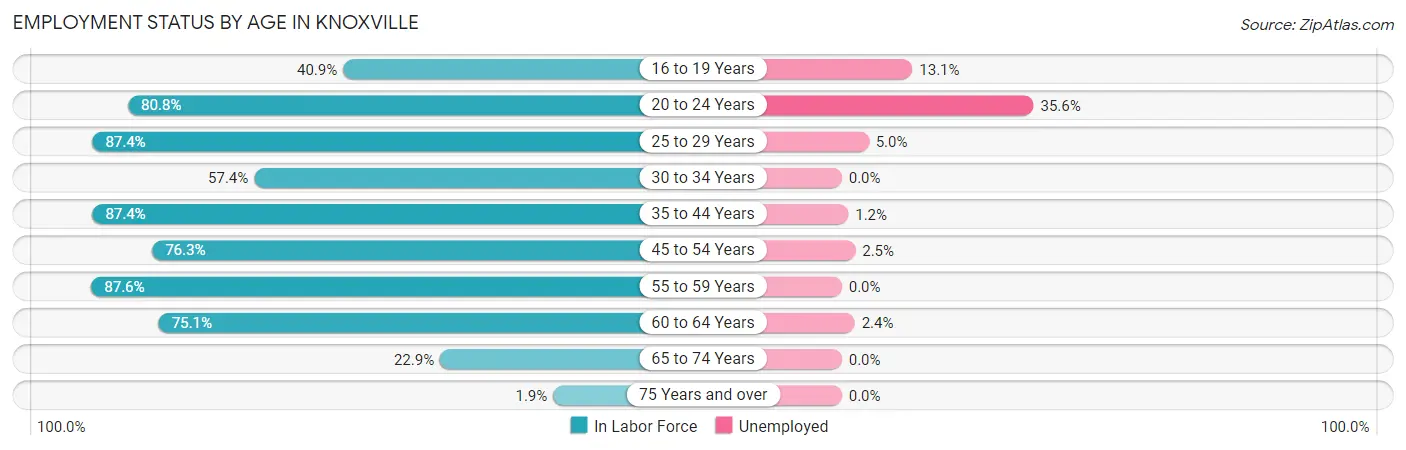
| Age Bracket | In Labor Force | Unemployed |
| 16 to 19 Years | 61 (40.9%) | 8 (13.1%) |
| 20 to 24 Years | 101 (80.8%) | 36 (35.6%) |
| 25 to 29 Years | 160 (87.4%) | 8 (5.0%) |
| 30 to 34 Years | 85 (57.4%) | 0 (0.0%) |
| 35 to 44 Years | 334 (87.4%) | 4 (1.2%) |
| 45 to 54 Years | 319 (76.3%) | 8 (2.5%) |
| 55 to 59 Years | 190 (87.6%) | 0 (0.0%) |
| 60 to 64 Years | 127 (75.1%) | 3 (2.4%) |
| 65 to 74 Years | 77 (22.9%) | 0 (0.0%) |
| 75 Years and over | 7 (1.9%) | 0 (0.0%) |
| Total | 1,462 (58.7%) | 67 (4.6%) |
Employment Status by Educational Attainment in Knoxville
According to labor force statistics for Knoxville, 80.1% of individuals (1,215) out of the total population between 25 and 64 years of age (1,517) are in the labor force, with 1.9% or 23 of them being unemployed. The group with the highest labor force participation rate are those with the educational attainment of bachelor's degree or higher, with 88.7% or 383 individuals in the labor force. Within the labor force, individuals with high school diploma education have the highest percentage of unemployment, with 2.9% or 12 of them being unemployed.
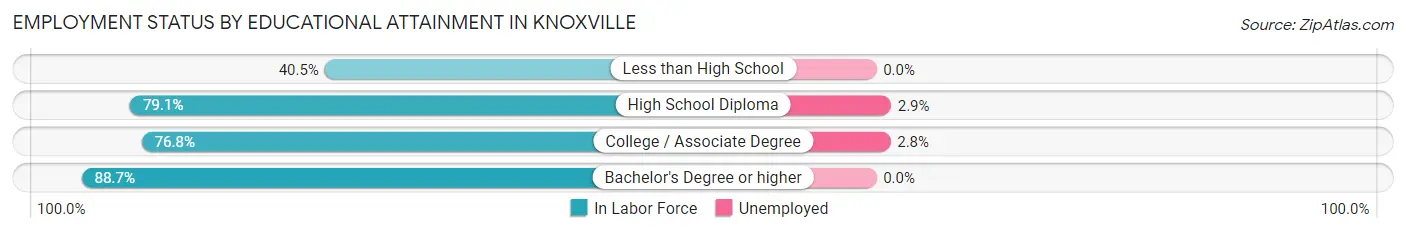
| Educational Attainment | In Labor Force | Unemployed |
| Less than High School | 15 (40.5%) | 0 (0.0%) |
| High School Diploma | 417 (79.1%) | 15 (2.9%) |
| College / Associate Degree | 400 (76.8%) | 15 (2.8%) |
| Bachelor's Degree or higher | 383 (88.7%) | 0 (0.0%) |
| Total | 1,215 (80.1%) | 29 (1.9%) |
Employment Occupations by Sex in Knoxville
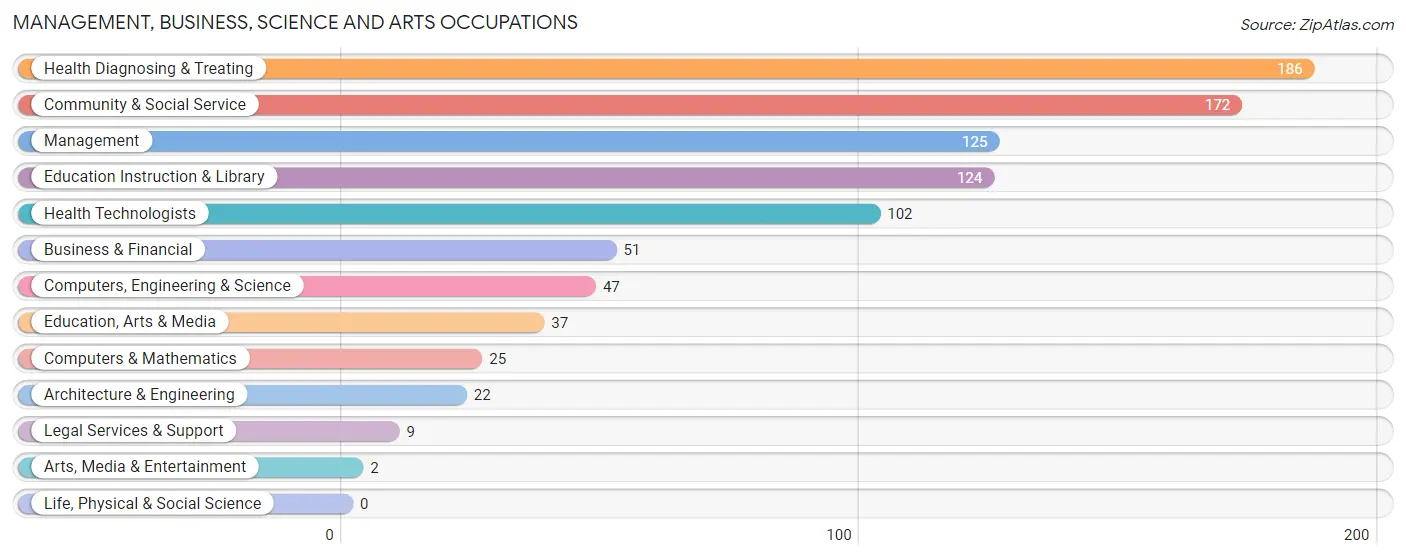
Management, Business, Science and Arts Occupations
The most common Management, Business, Science and Arts occupations in Knoxville are Health Diagnosing & Treating (186 | 13.3%), Community & Social Service (172 | 12.3%), Management (125 | 9.0%), Education Instruction & Library (124 | 8.9%), and Health Technologists (102 | 7.3%).
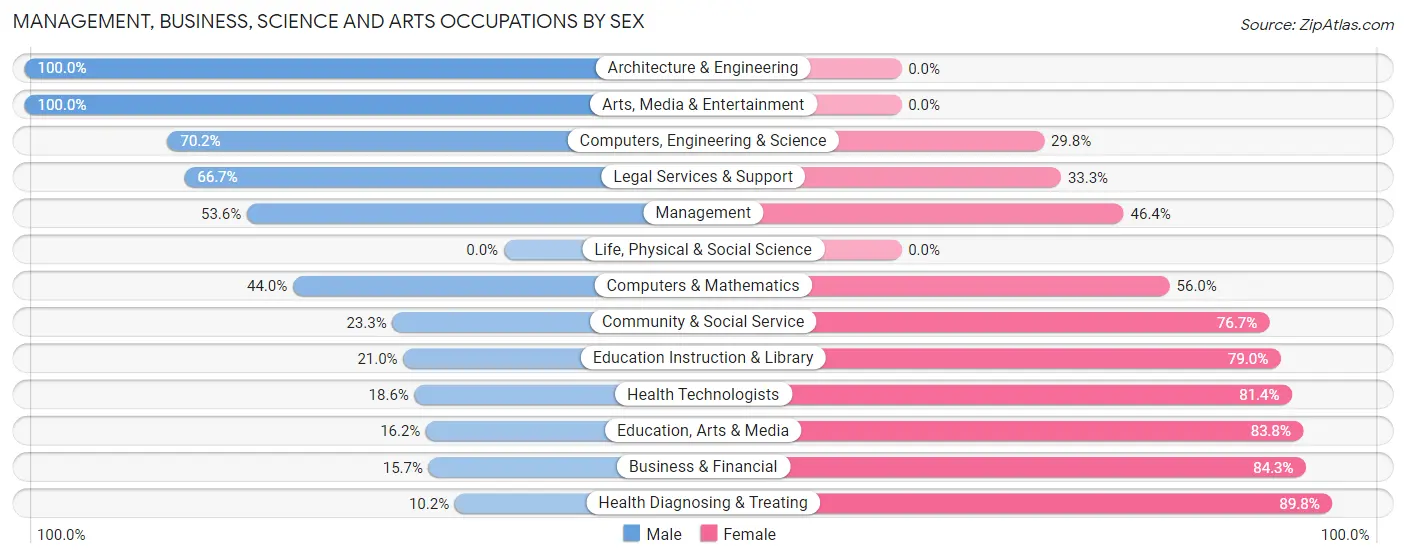
Management, Business, Science and Arts Occupations by Sex
Within the Management, Business, Science and Arts occupations in Knoxville, the most male-oriented occupations are Architecture & Engineering (100.0%), Arts, Media & Entertainment (100.0%), and Computers, Engineering & Science (70.2%), while the most female-oriented occupations are Health Diagnosing & Treating (89.8%), Business & Financial (84.3%), and Education, Arts & Media (83.8%).
| Occupation | Male | Female |
| Management | 67 (53.6%) | 58 (46.4%) |
| Business & Financial | 8 (15.7%) | 43 (84.3%) |
| Computers, Engineering & Science | 33 (70.2%) | 14 (29.8%) |
| Computers & Mathematics | 11 (44.0%) | 14 (56.0%) |
| Architecture & Engineering | 22 (100.0%) | 0 (0.0%) |
| Life, Physical & Social Science | 0 (0.0%) | 0 (0.0%) |
| Community & Social Service | 40 (23.3%) | 132 (76.7%) |
| Education, Arts & Media | 6 (16.2%) | 31 (83.8%) |
| Legal Services & Support | 6 (66.7%) | 3 (33.3%) |
| Education Instruction & Library | 26 (21.0%) | 98 (79.0%) |
| Arts, Media & Entertainment | 2 (100.0%) | 0 (0.0%) |
| Health Diagnosing & Treating | 19 (10.2%) | 167 (89.8%) |
| Health Technologists | 19 (18.6%) | 83 (81.4%) |
| Total (Category) | 167 (28.7%) | 414 (71.3%) |
| Total (Overall) | 664 (47.6%) | 730 (52.4%) |
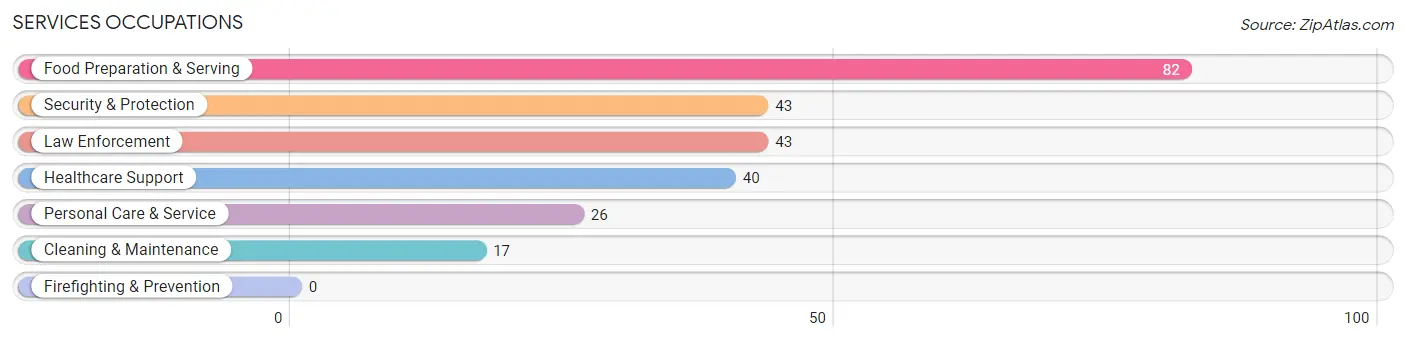
Services Occupations
The most common Services occupations in Knoxville are Food Preparation & Serving (82 | 5.9%), Security & Protection (43 | 3.1%), Law Enforcement (43 | 3.1%), Healthcare Support (40 | 2.9%), and Personal Care & Service (26 | 1.9%).
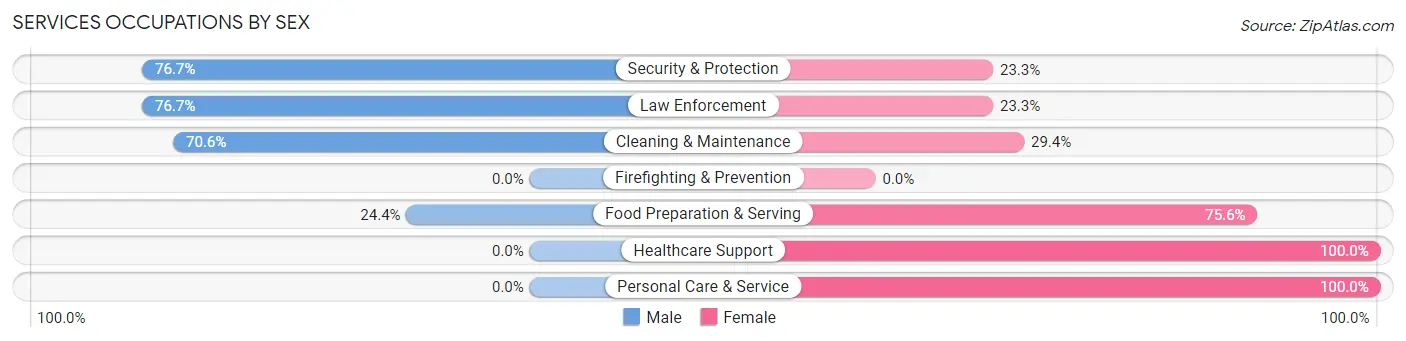
Services Occupations by Sex
Within the Services occupations in Knoxville, the most male-oriented occupations are Security & Protection (76.7%), Law Enforcement (76.7%), and Cleaning & Maintenance (70.6%), while the most female-oriented occupations are Healthcare Support (100.0%), Personal Care & Service (100.0%), and Food Preparation & Serving (75.6%).
| Occupation | Male | Female |
| Healthcare Support | 0 (0.0%) | 40 (100.0%) |
| Security & Protection | 33 (76.7%) | 10 (23.3%) |
| Firefighting & Prevention | 0 (0.0%) | 0 (0.0%) |
| Law Enforcement | 33 (76.7%) | 10 (23.3%) |
| Food Preparation & Serving | 20 (24.4%) | 62 (75.6%) |
| Cleaning & Maintenance | 12 (70.6%) | 5 (29.4%) |
| Personal Care & Service | 0 (0.0%) | 26 (100.0%) |
| Total (Category) | 65 (31.2%) | 143 (68.8%) |
| Total (Overall) | 664 (47.6%) | 730 (52.4%) |
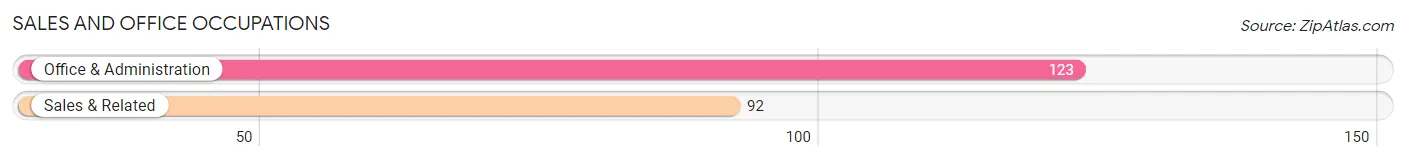
Sales and Office Occupations
The most common Sales and Office occupations in Knoxville are Office & Administration (123 | 8.8%), and Sales & Related (92 | 6.6%).
Sales and Office Occupations by Sex
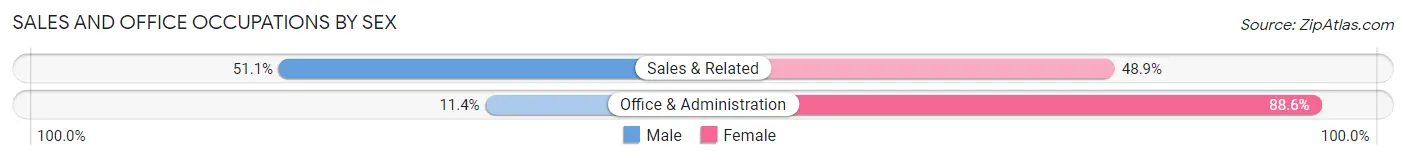
| Occupation | Male | Female |
| Sales & Related | 47 (51.1%) | 45 (48.9%) |
| Office & Administration | 14 (11.4%) | 109 (88.6%) |
| Total (Category) | 61 (28.4%) | 154 (71.6%) |
| Total (Overall) | 664 (47.6%) | 730 (52.4%) |
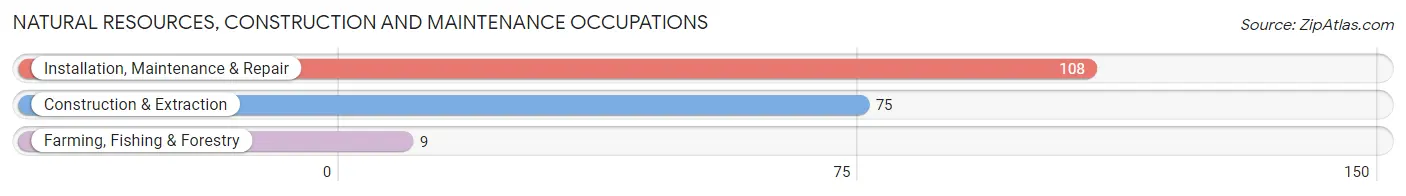
Natural Resources, Construction and Maintenance Occupations
The most common Natural Resources, Construction and Maintenance occupations in Knoxville are Installation, Maintenance & Repair (108 | 7.7%), Construction & Extraction (75 | 5.4%), and Farming, Fishing & Forestry (9 | 0.6%).
Natural Resources, Construction and Maintenance Occupations by Sex
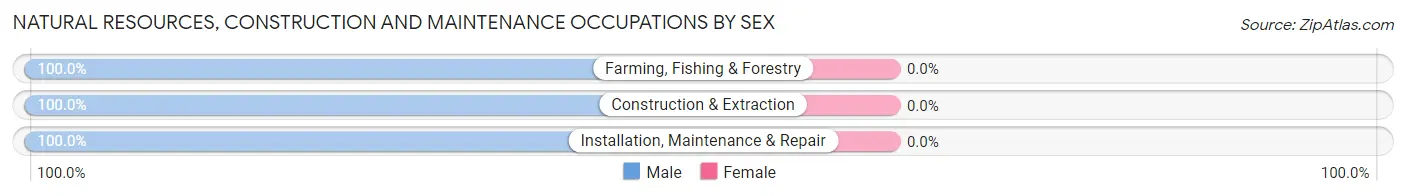
| Occupation | Male | Female |
| Farming, Fishing & Forestry | 9 (100.0%) | 0 (0.0%) |
| Construction & Extraction | 75 (100.0%) | 0 (0.0%) |
| Installation, Maintenance & Repair | 108 (100.0%) | 0 (0.0%) |
| Total (Category) | 192 (100.0%) | 0 (0.0%) |
| Total (Overall) | 664 (47.6%) | 730 (52.4%) |
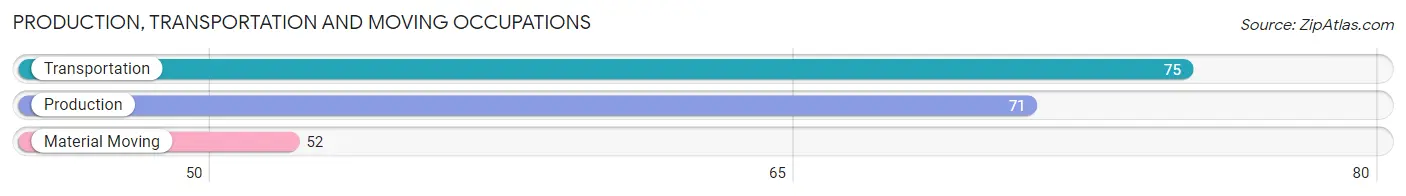
Production, Transportation and Moving Occupations
The most common Production, Transportation and Moving occupations in Knoxville are Transportation (75 | 5.4%), Production (71 | 5.1%), and Material Moving (52 | 3.7%).
Production, Transportation and Moving Occupations by Sex
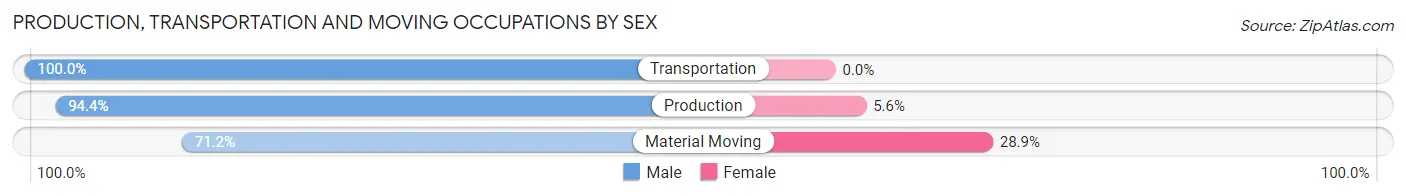
| Occupation | Male | Female |
| Production | 67 (94.4%) | 4 (5.6%) |
| Transportation | 75 (100.0%) | 0 (0.0%) |
| Material Moving | 37 (71.2%) | 15 (28.8%) |
| Total (Category) | 179 (90.4%) | 19 (9.6%) |
| Total (Overall) | 664 (47.6%) | 730 (52.4%) |
Employment Industries by Sex in Knoxville
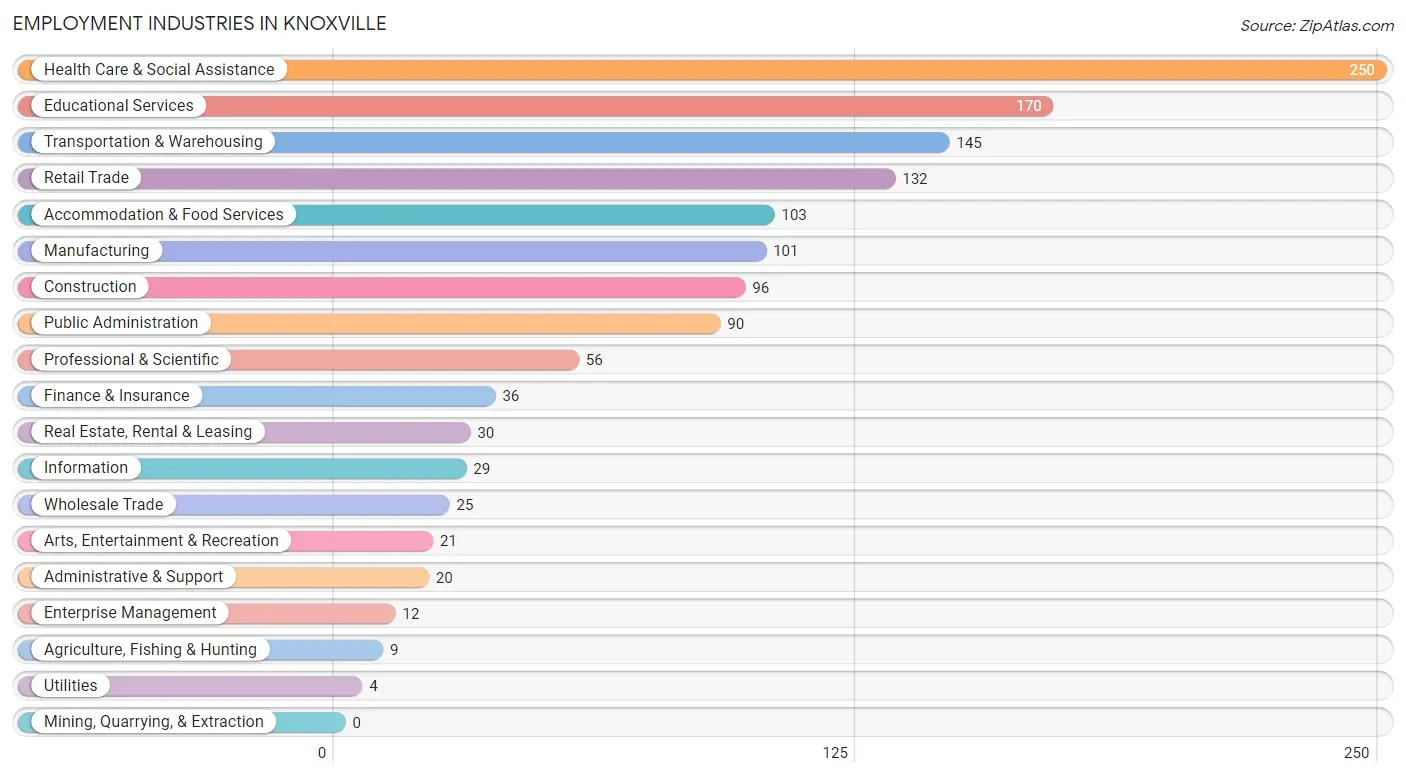
Employment Industries in Knoxville
The major employment industries in Knoxville include Health Care & Social Assistance (250 | 17.9%), Educational Services (170 | 12.2%), Transportation & Warehousing (145 | 10.4%), Retail Trade (132 | 9.5%), and Accommodation & Food Services (103 | 7.4%).
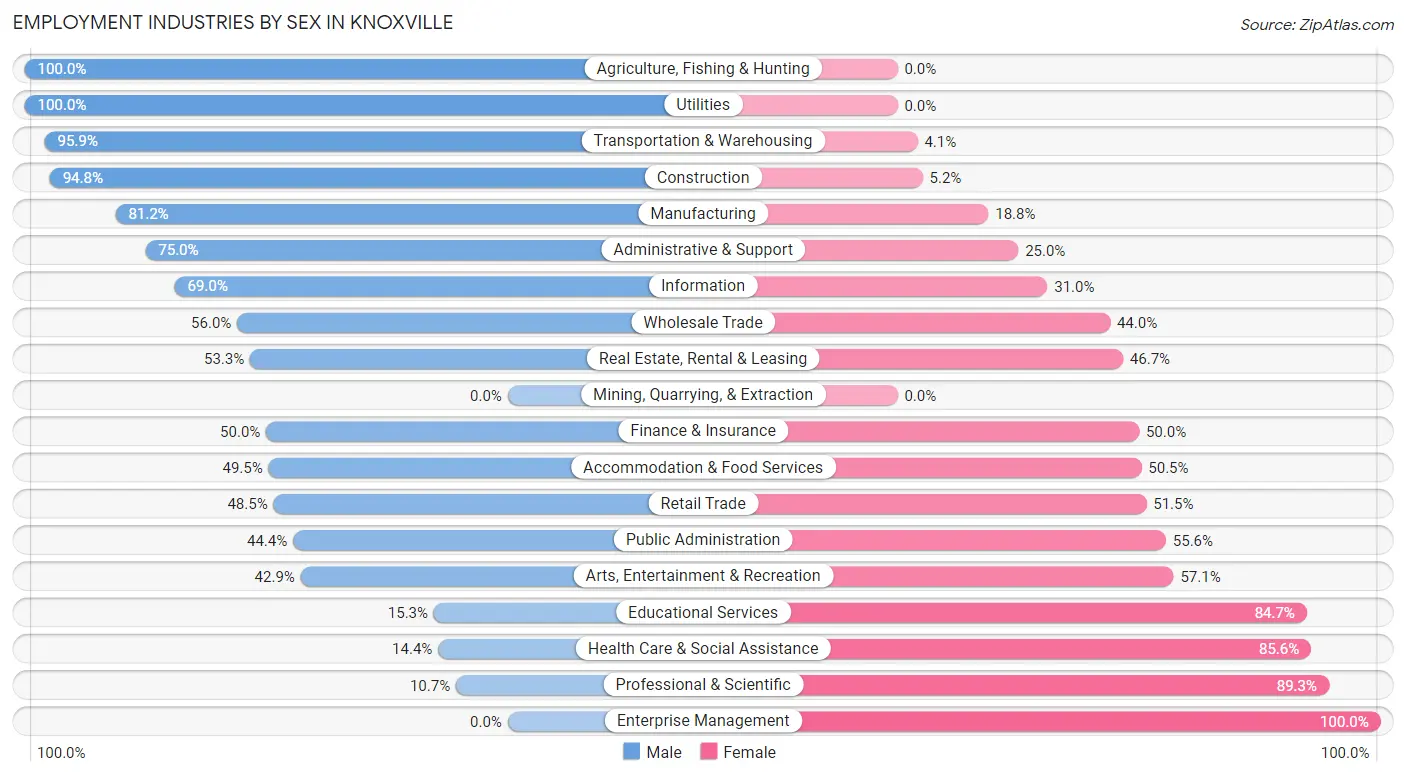
Employment Industries by Sex in Knoxville
The Knoxville industries that see more men than women are Agriculture, Fishing & Hunting (100.0%), Utilities (100.0%), and Transportation & Warehousing (95.9%), whereas the industries that tend to have a higher number of women are Enterprise Management (100.0%), Professional & Scientific (89.3%), and Health Care & Social Assistance (85.6%).
| Industry | Male | Female |
| Agriculture, Fishing & Hunting | 9 (100.0%) | 0 (0.0%) |
| Mining, Quarrying, & Extraction | 0 (0.0%) | 0 (0.0%) |
| Construction | 91 (94.8%) | 5 (5.2%) |
| Manufacturing | 82 (81.2%) | 19 (18.8%) |
| Wholesale Trade | 14 (56.0%) | 11 (44.0%) |
| Retail Trade | 64 (48.5%) | 68 (51.5%) |
| Transportation & Warehousing | 139 (95.9%) | 6 (4.1%) |
| Utilities | 4 (100.0%) | 0 (0.0%) |
| Information | 20 (69.0%) | 9 (31.0%) |
| Finance & Insurance | 18 (50.0%) | 18 (50.0%) |
| Real Estate, Rental & Leasing | 16 (53.3%) | 14 (46.7%) |
| Professional & Scientific | 6 (10.7%) | 50 (89.3%) |
| Enterprise Management | 0 (0.0%) | 12 (100.0%) |
| Administrative & Support | 15 (75.0%) | 5 (25.0%) |
| Educational Services | 26 (15.3%) | 144 (84.7%) |
| Health Care & Social Assistance | 36 (14.4%) | 214 (85.6%) |
| Arts, Entertainment & Recreation | 9 (42.9%) | 12 (57.1%) |
| Accommodation & Food Services | 51 (49.5%) | 52 (50.5%) |
| Public Administration | 40 (44.4%) | 50 (55.6%) |
| Total | 664 (47.6%) | 730 (52.4%) |
Education in Knoxville
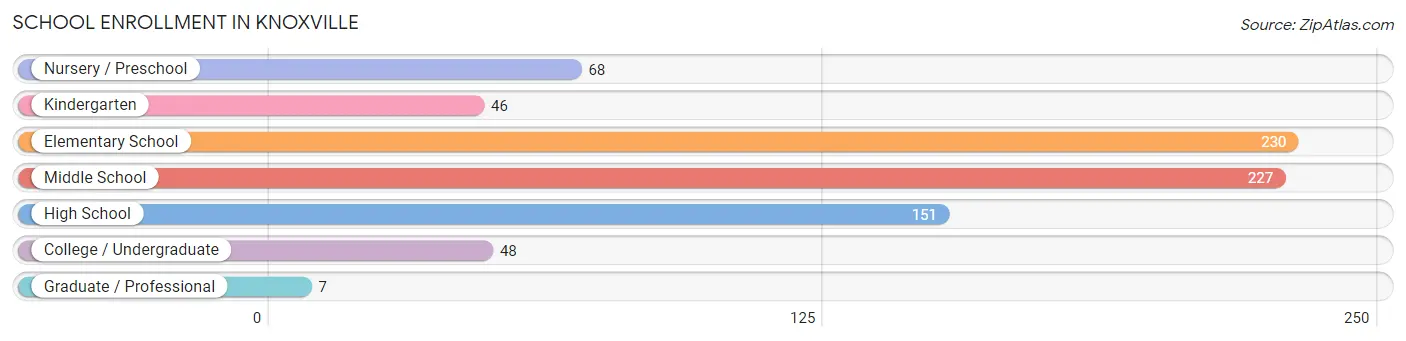
School Enrollment in Knoxville
The most common levels of schooling among the 777 students in Knoxville are elementary school (230 | 29.6%), middle school (227 | 29.2%), and high school (151 | 19.4%).
| School Level | # Students | % Students |
| Nursery / Preschool | 68 | 8.7% |
| Kindergarten | 46 | 5.9% |
| Elementary School | 230 | 29.6% |
| Middle School | 227 | 29.2% |
| High School | 151 | 19.4% |
| College / Undergraduate | 48 | 6.2% |
| Graduate / Professional | 7 | 0.9% |
| Total | 777 | 100.0% |
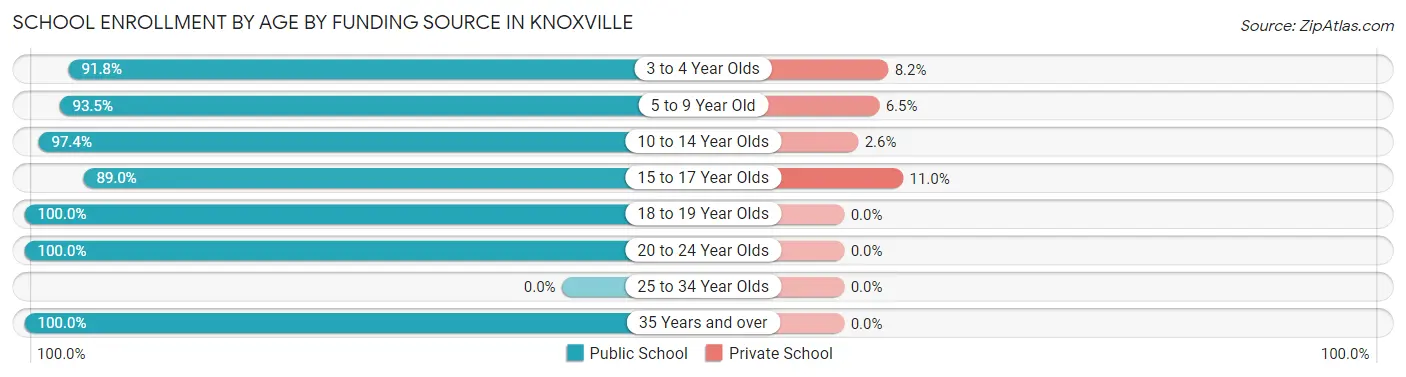
School Enrollment by Age by Funding Source in Knoxville
Out of a total of 777 students who are enrolled in schools in Knoxville, 46 (5.9%) attend a private institution, while the remaining 731 (94.1%) are enrolled in public schools. The age group of 15 to 17 year olds has the highest likelihood of being enrolled in private schools, with 17 (11.0% in the age bracket) enrolled. Conversely, the age group of 18 to 19 year olds has the lowest likelihood of being enrolled in a private school, with 9 (100.0% in the age bracket) attending a public institution.
| Age Bracket | Public School | Private School |
| 3 to 4 Year Olds | 56 (91.8%) | 5 (8.2%) |
| 5 to 9 Year Old | 258 (93.5%) | 18 (6.5%) |
| 10 to 14 Year Olds | 224 (97.4%) | 6 (2.6%) |
| 15 to 17 Year Olds | 138 (89.0%) | 17 (11.0%) |
| 18 to 19 Year Olds | 9 (100.0%) | 0 (0.0%) |
| 20 to 24 Year Olds | 15 (100.0%) | 0 (0.0%) |
| 25 to 34 Year Olds | 0 (0.0%) | 0 (0.0%) |
| 35 Years and over | 31 (100.0%) | 0 (0.0%) |
| Total | 731 (94.1%) | 46 (5.9%) |
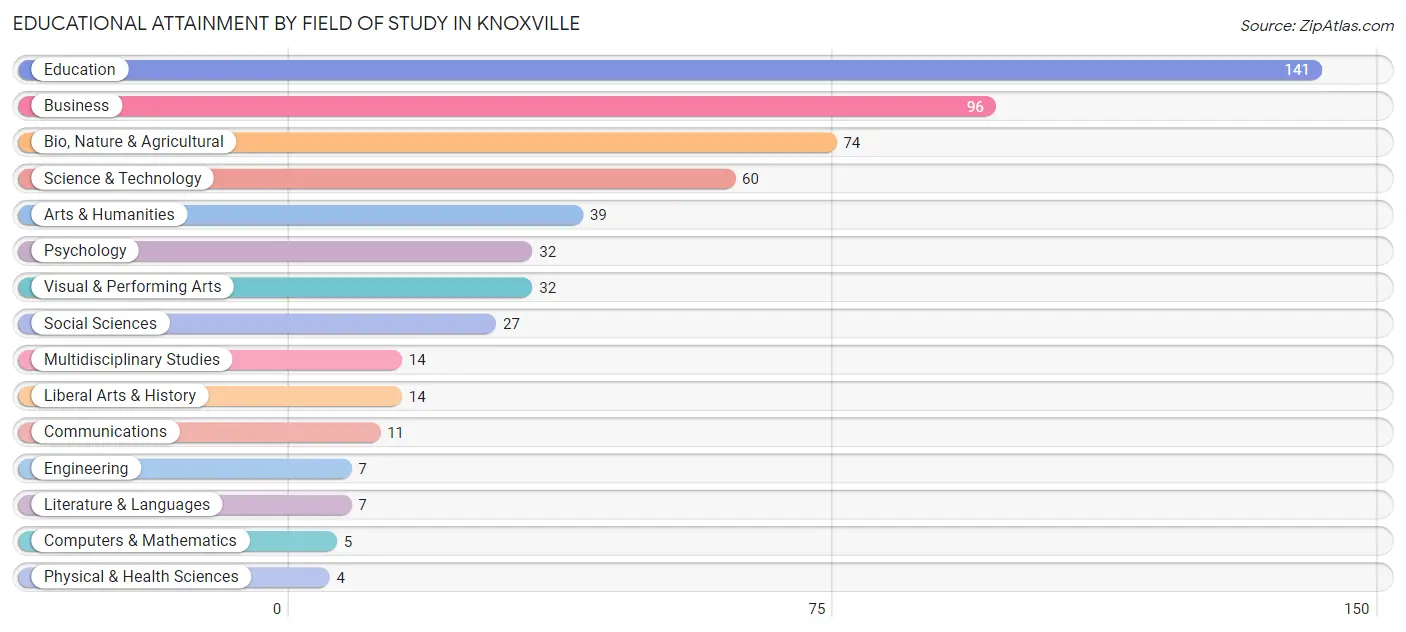
Educational Attainment by Field of Study in Knoxville
Education (141 | 25.0%), business (96 | 17.1%), bio, nature & agricultural (74 | 13.1%), science & technology (60 | 10.7%), and arts & humanities (39 | 6.9%) are the most common fields of study among 563 individuals in Knoxville who have obtained a bachelor's degree or higher.
| Field of Study | # Graduates | % Graduates |
| Computers & Mathematics | 5 | 0.9% |
| Bio, Nature & Agricultural | 74 | 13.1% |
| Physical & Health Sciences | 4 | 0.7% |
| Psychology | 32 | 5.7% |
| Social Sciences | 27 | 4.8% |
| Engineering | 7 | 1.2% |
| Multidisciplinary Studies | 14 | 2.5% |
| Science & Technology | 60 | 10.7% |
| Business | 96 | 17.1% |
| Education | 141 | 25.0% |
| Literature & Languages | 7 | 1.2% |
| Liberal Arts & History | 14 | 2.5% |
| Visual & Performing Arts | 32 | 5.7% |
| Communications | 11 | 1.9% |
| Arts & Humanities | 39 | 6.9% |
| Total | 563 | 100.0% |
Transportation & Commute in Knoxville
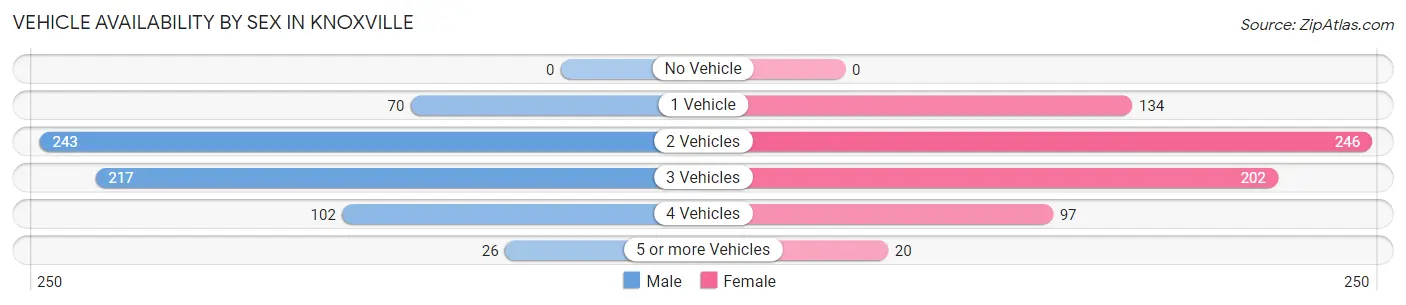
Vehicle Availability by Sex in Knoxville
The most prevalent vehicle ownership categories in Knoxville are males with 2 vehicles (243, accounting for 36.9%) and females with 2 vehicles (246, making up 34.8%).
| Vehicles Available | Male | Female |
| No Vehicle | 0 (0.0%) | 0 (0.0%) |
| 1 Vehicle | 70 (10.6%) | 134 (19.2%) |
| 2 Vehicles | 243 (36.9%) | 246 (35.2%) |
| 3 Vehicles | 217 (33.0%) | 202 (28.9%) |
| 4 Vehicles | 102 (15.5%) | 97 (13.9%) |
| 5 or more Vehicles | 26 (4.0%) | 20 (2.9%) |
| Total | 658 (100.0%) | 699 (100.0%) |
Commute Time in Knoxville
The most frequently occuring commute durations in Knoxville are 15 to 19 minutes (345 commuters, 26.6%), 5 to 9 minutes (215 commuters, 16.6%), and 10 to 14 minutes (195 commuters, 15.0%).
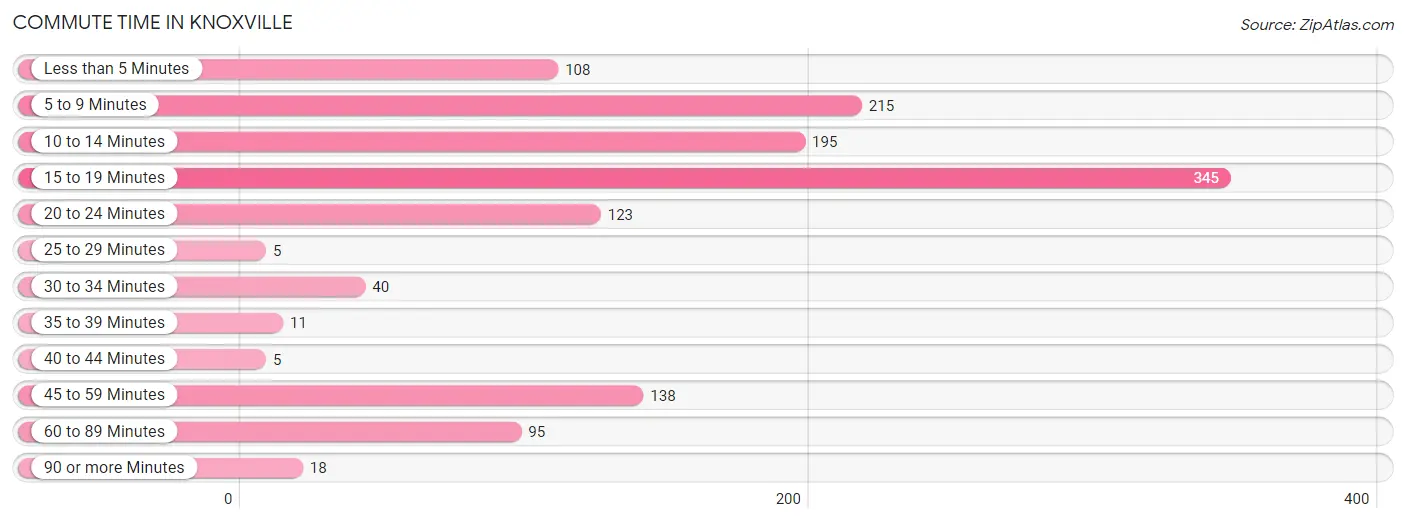
| Commute Time | # Commuters | % Commuters |
| Less than 5 Minutes | 108 | 8.3% |
| 5 to 9 Minutes | 215 | 16.6% |
| 10 to 14 Minutes | 195 | 15.0% |
| 15 to 19 Minutes | 345 | 26.6% |
| 20 to 24 Minutes | 123 | 9.5% |
| 25 to 29 Minutes | 5 | 0.4% |
| 30 to 34 Minutes | 40 | 3.1% |
| 35 to 39 Minutes | 11 | 0.9% |
| 40 to 44 Minutes | 5 | 0.4% |
| 45 to 59 Minutes | 138 | 10.6% |
| 60 to 89 Minutes | 95 | 7.3% |
| 90 or more Minutes | 18 | 1.4% |
Commute Time by Sex in Knoxville
The most common commute times in Knoxville are 15 to 19 minutes (178 commuters, 28.4%) for males and 15 to 19 minutes (167 commuters, 24.8%) for females.
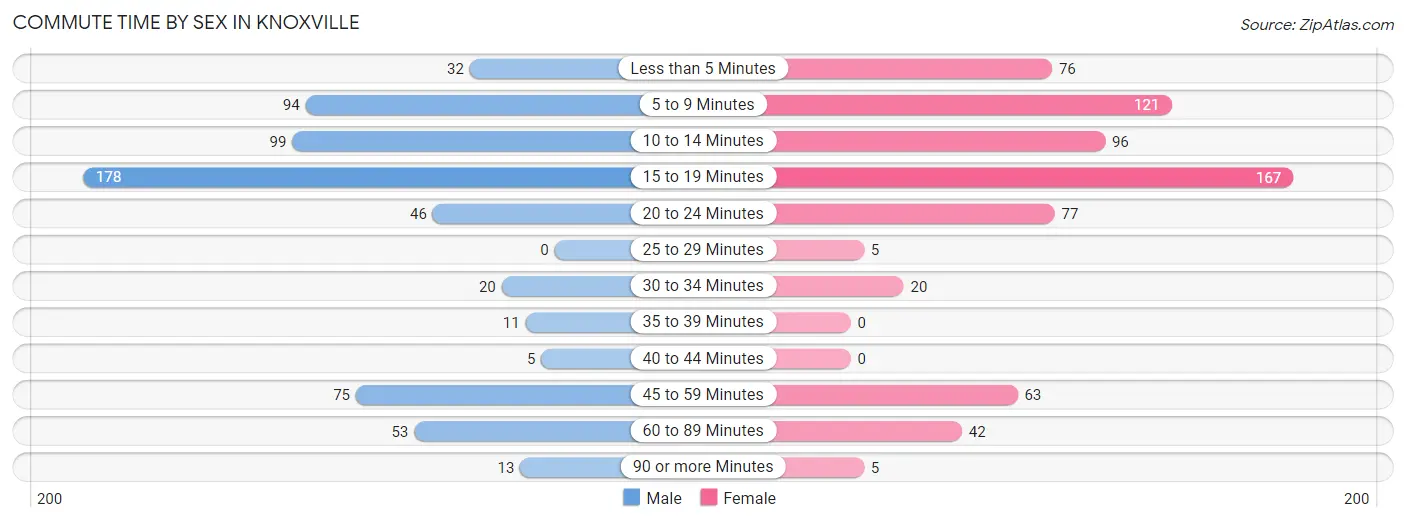
| Commute Time | Male | Female |
| Less than 5 Minutes | 32 (5.1%) | 76 (11.3%) |
| 5 to 9 Minutes | 94 (15.0%) | 121 (18.0%) |
| 10 to 14 Minutes | 99 (15.8%) | 96 (14.3%) |
| 15 to 19 Minutes | 178 (28.4%) | 167 (24.8%) |
| 20 to 24 Minutes | 46 (7.3%) | 77 (11.5%) |
| 25 to 29 Minutes | 0 (0.0%) | 5 (0.7%) |
| 30 to 34 Minutes | 20 (3.2%) | 20 (3.0%) |
| 35 to 39 Minutes | 11 (1.8%) | 0 (0.0%) |
| 40 to 44 Minutes | 5 (0.8%) | 0 (0.0%) |
| 45 to 59 Minutes | 75 (12.0%) | 63 (9.4%) |
| 60 to 89 Minutes | 53 (8.5%) | 42 (6.2%) |
| 90 or more Minutes | 13 (2.1%) | 5 (0.7%) |
Time of Departure to Work by Sex in Knoxville
The most frequent times of departure to work in Knoxville are 6:30 AM to 6:59 AM (109, 17.4%) for males and 7:00 AM to 7:29 AM (190, 28.3%) for females.
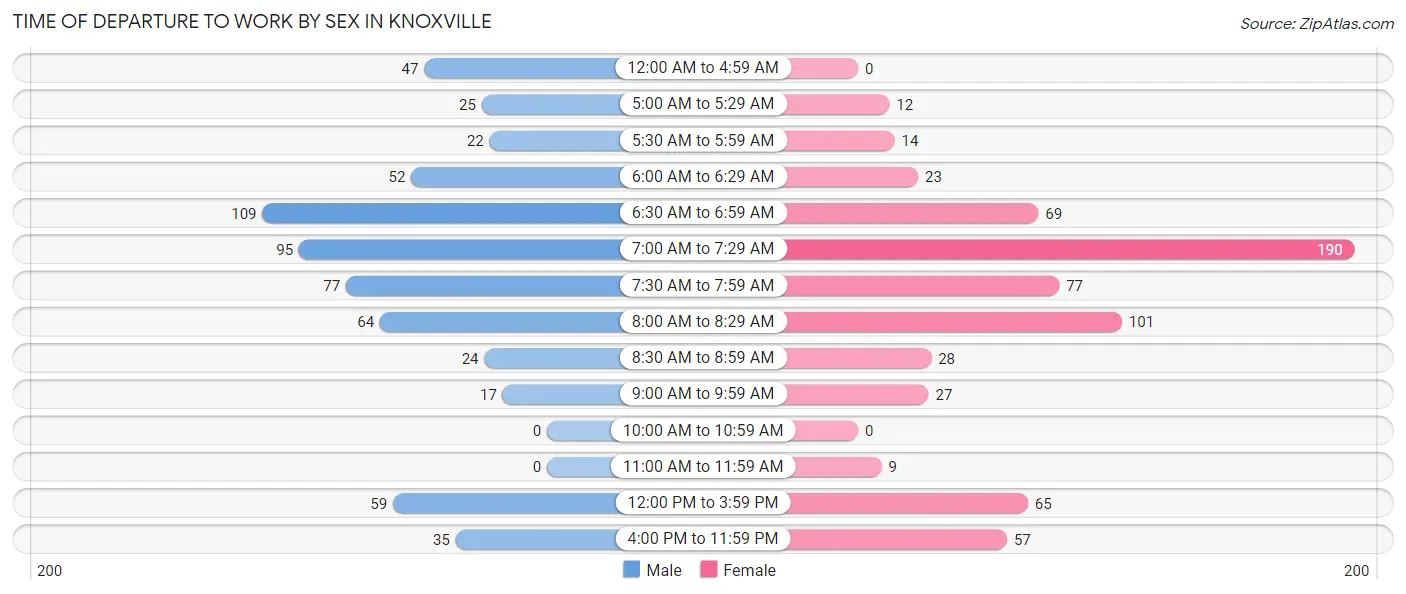
| Time of Departure | Male | Female |
| 12:00 AM to 4:59 AM | 47 (7.5%) | 0 (0.0%) |
| 5:00 AM to 5:29 AM | 25 (4.0%) | 12 (1.8%) |
| 5:30 AM to 5:59 AM | 22 (3.5%) | 14 (2.1%) |
| 6:00 AM to 6:29 AM | 52 (8.3%) | 23 (3.4%) |
| 6:30 AM to 6:59 AM | 109 (17.4%) | 69 (10.3%) |
| 7:00 AM to 7:29 AM | 95 (15.2%) | 190 (28.3%) |
| 7:30 AM to 7:59 AM | 77 (12.3%) | 77 (11.5%) |
| 8:00 AM to 8:29 AM | 64 (10.2%) | 101 (15.0%) |
| 8:30 AM to 8:59 AM | 24 (3.8%) | 28 (4.2%) |
| 9:00 AM to 9:59 AM | 17 (2.7%) | 27 (4.0%) |
| 10:00 AM to 10:59 AM | 0 (0.0%) | 0 (0.0%) |
| 11:00 AM to 11:59 AM | 0 (0.0%) | 9 (1.3%) |
| 12:00 PM to 3:59 PM | 59 (9.4%) | 65 (9.7%) |
| 4:00 PM to 11:59 PM | 35 (5.6%) | 57 (8.5%) |
| Total | 626 (100.0%) | 672 (100.0%) |
Housing Occupancy in Knoxville
Occupancy by Ownership in Knoxville
Of the total 1,221 dwellings in Knoxville, owner-occupied units account for 1,004 (82.2%), while renter-occupied units make up 217 (17.8%).
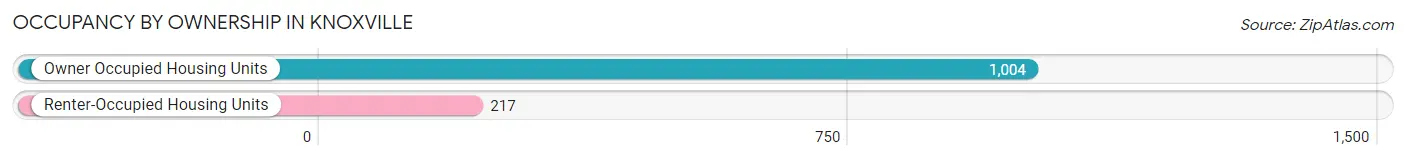
| Occupancy | # Housing Units | % Housing Units |
| Owner Occupied Housing Units | 1,004 | 82.2% |
| Renter-Occupied Housing Units | 217 | 17.8% |
| Total Occupied Housing Units | 1,221 | 100.0% |
Occupancy by Household Size in Knoxville
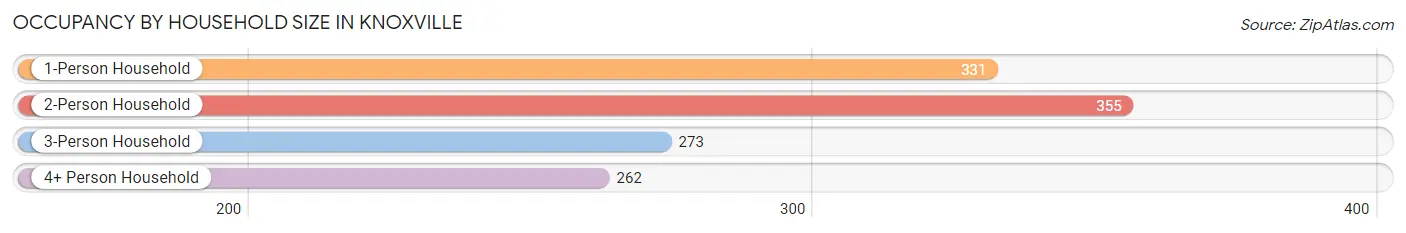
| Household Size | # Housing Units | % Housing Units |
| 1-Person Household | 331 | 27.1% |
| 2-Person Household | 355 | 29.1% |
| 3-Person Household | 273 | 22.4% |
| 4+ Person Household | 262 | 21.5% |
| Total Housing Units | 1,221 | 100.0% |
Occupancy by Ownership by Household Size in Knoxville
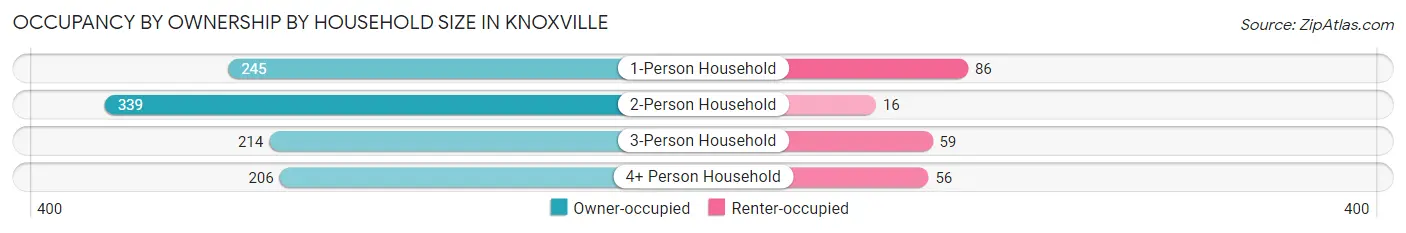
| Household Size | Owner-occupied | Renter-occupied |
| 1-Person Household | 245 (74.0%) | 86 (26.0%) |
| 2-Person Household | 339 (95.5%) | 16 (4.5%) |
| 3-Person Household | 214 (78.4%) | 59 (21.6%) |
| 4+ Person Household | 206 (78.6%) | 56 (21.4%) |
| Total Housing Units | 1,004 (82.2%) | 217 (17.8%) |
Occupancy by Educational Attainment in Knoxville
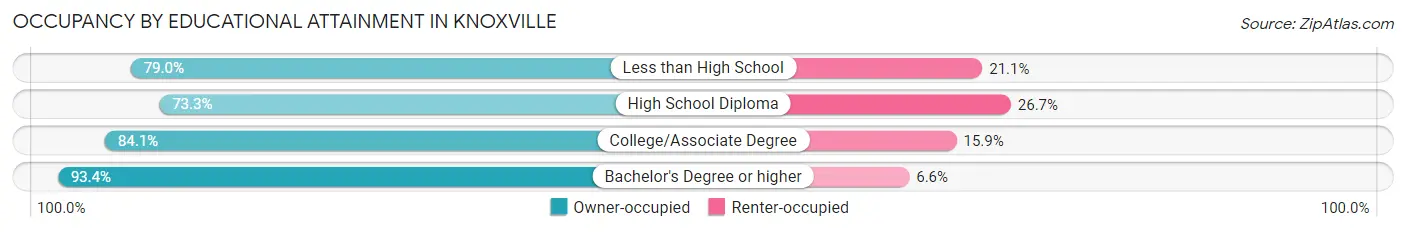
| Household Size | Owner-occupied | Renter-occupied |
| Less than High School | 30 (78.9%) | 8 (21.0%) |
| High School Diploma | 324 (73.3%) | 118 (26.7%) |
| College/Associate Degree | 380 (84.1%) | 72 (15.9%) |
| Bachelor's Degree or higher | 270 (93.4%) | 19 (6.6%) |
Occupancy by Age of Householder in Knoxville
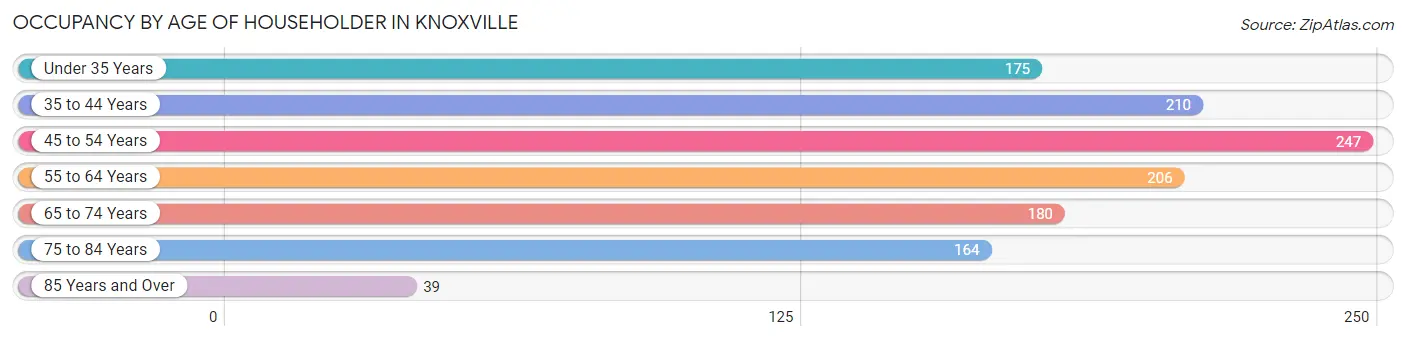
| Age Bracket | # Households | % Households |
| Under 35 Years | 175 | 14.3% |
| 35 to 44 Years | 210 | 17.2% |
| 45 to 54 Years | 247 | 20.2% |
| 55 to 64 Years | 206 | 16.9% |
| 65 to 74 Years | 180 | 14.7% |
| 75 to 84 Years | 164 | 13.4% |
| 85 Years and Over | 39 | 3.2% |
| Total | 1,221 | 100.0% |
Housing Finances in Knoxville
Median Income by Occupancy in Knoxville
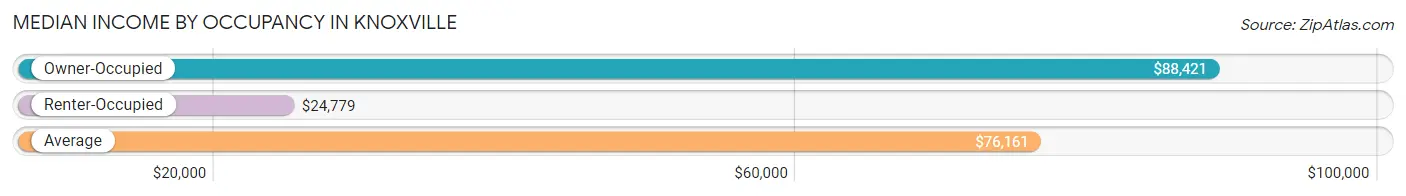
| Occupancy Type | # Households | Median Income |
| Owner-Occupied | 1,004 (82.2%) | $88,421 |
| Renter-Occupied | 217 (17.8%) | $24,779 |
| Average | 1,221 (100.0%) | $76,161 |
Occupancy by Householder Income Bracket in Knoxville
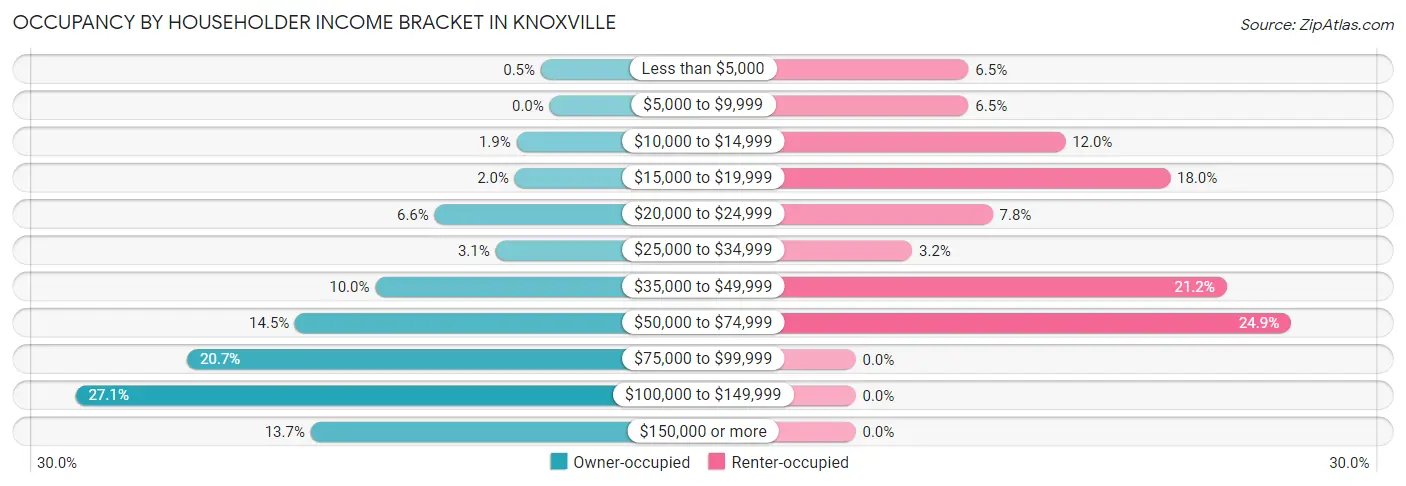
| Income Bracket | Owner-occupied | Renter-occupied |
| Less than $5,000 | 5 (0.5%) | 14 (6.5%) |
| $5,000 to $9,999 | 0 (0.0%) | 14 (6.5%) |
| $10,000 to $14,999 | 19 (1.9%) | 26 (12.0%) |
| $15,000 to $19,999 | 20 (2.0%) | 39 (18.0%) |
| $20,000 to $24,999 | 66 (6.6%) | 17 (7.8%) |
| $25,000 to $34,999 | 31 (3.1%) | 7 (3.2%) |
| $35,000 to $49,999 | 100 (10.0%) | 46 (21.2%) |
| $50,000 to $74,999 | 146 (14.5%) | 54 (24.9%) |
| $75,000 to $99,999 | 208 (20.7%) | 0 (0.0%) |
| $100,000 to $149,999 | 272 (27.1%) | 0 (0.0%) |
| $150,000 or more | 137 (13.7%) | 0 (0.0%) |
| Total | 1,004 (100.0%) | 217 (100.0%) |
Monthly Housing Cost Tiers in Knoxville
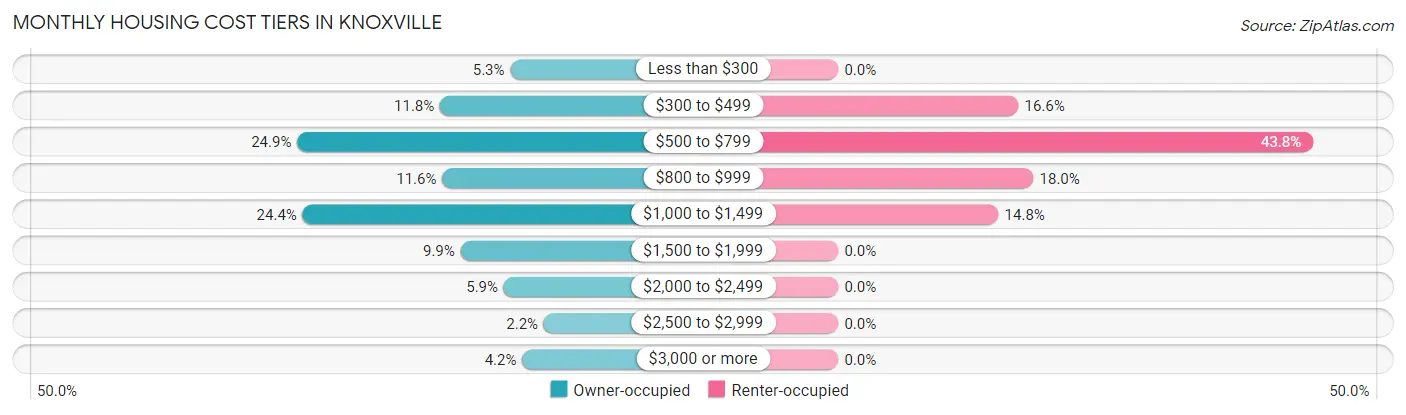
| Monthly Cost | Owner-occupied | Renter-occupied |
| Less than $300 | 53 (5.3%) | 0 (0.0%) |
| $300 to $499 | 118 (11.7%) | 36 (16.6%) |
| $500 to $799 | 250 (24.9%) | 95 (43.8%) |
| $800 to $999 | 116 (11.6%) | 39 (18.0%) |
| $1,000 to $1,499 | 245 (24.4%) | 32 (14.7%) |
| $1,500 to $1,999 | 99 (9.9%) | 0 (0.0%) |
| $2,000 to $2,499 | 59 (5.9%) | 0 (0.0%) |
| $2,500 to $2,999 | 22 (2.2%) | 0 (0.0%) |
| $3,000 or more | 42 (4.2%) | 0 (0.0%) |
| Total | 1,004 (100.0%) | 217 (100.0%) |
Physical Housing Characteristics in Knoxville
Housing Structures in Knoxville
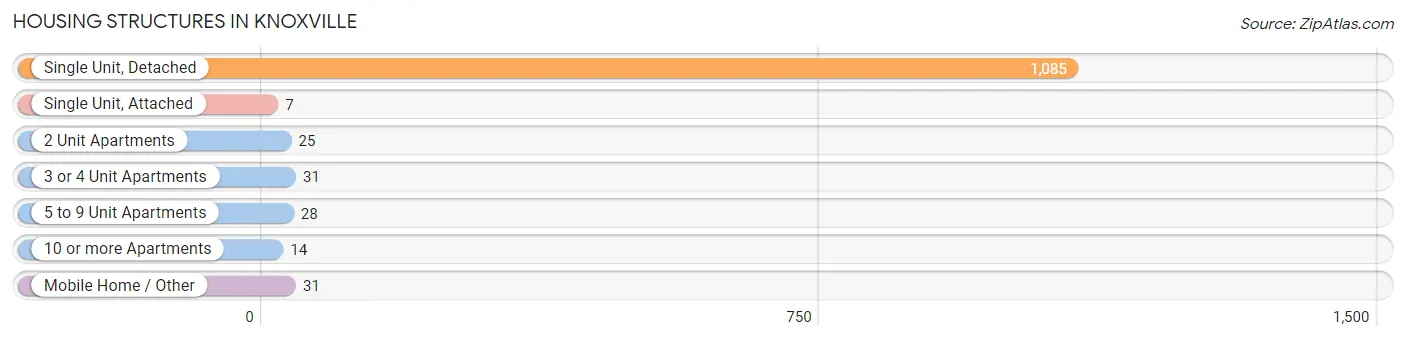
| Structure Type | # Housing Units | % Housing Units |
| Single Unit, Detached | 1,085 | 88.9% |
| Single Unit, Attached | 7 | 0.6% |
| 2 Unit Apartments | 25 | 2.1% |
| 3 or 4 Unit Apartments | 31 | 2.5% |
| 5 to 9 Unit Apartments | 28 | 2.3% |
| 10 or more Apartments | 14 | 1.1% |
| Mobile Home / Other | 31 | 2.5% |
| Total | 1,221 | 100.0% |
Housing Structures by Occupancy in Knoxville
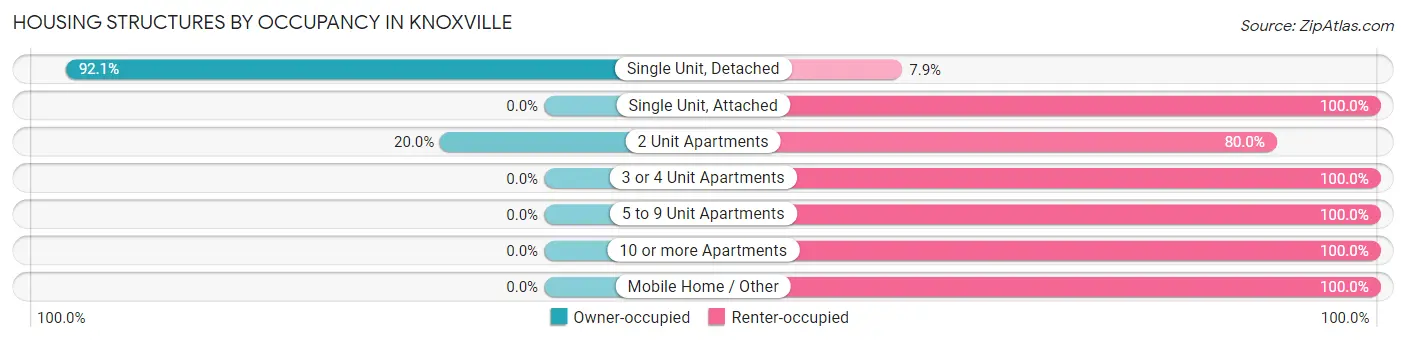
| Structure Type | Owner-occupied | Renter-occupied |
| Single Unit, Detached | 999 (92.1%) | 86 (7.9%) |
| Single Unit, Attached | 0 (0.0%) | 7 (100.0%) |
| 2 Unit Apartments | 5 (20.0%) | 20 (80.0%) |
| 3 or 4 Unit Apartments | 0 (0.0%) | 31 (100.0%) |
| 5 to 9 Unit Apartments | 0 (0.0%) | 28 (100.0%) |
| 10 or more Apartments | 0 (0.0%) | 14 (100.0%) |
| Mobile Home / Other | 0 (0.0%) | 31 (100.0%) |
| Total | 1,004 (82.2%) | 217 (17.8%) |
Housing Structures by Number of Rooms in Knoxville
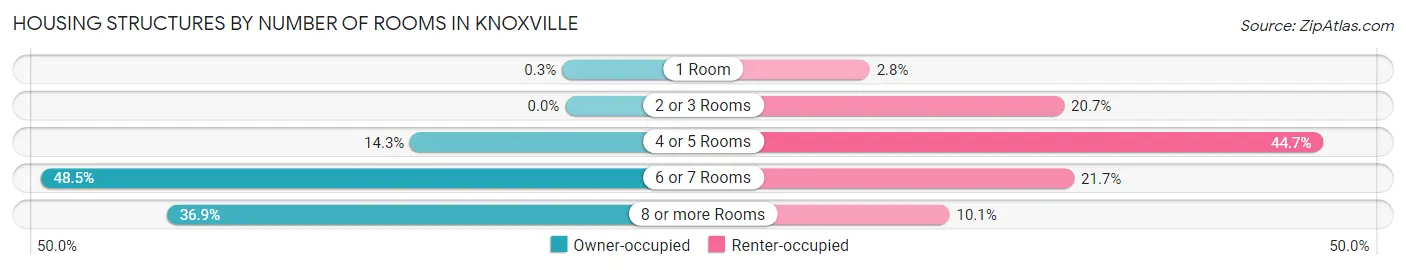
| Number of Rooms | Owner-occupied | Renter-occupied |
| 1 Room | 3 (0.3%) | 6 (2.8%) |
| 2 or 3 Rooms | 0 (0.0%) | 45 (20.7%) |
| 4 or 5 Rooms | 144 (14.3%) | 97 (44.7%) |
| 6 or 7 Rooms | 487 (48.5%) | 47 (21.7%) |
| 8 or more Rooms | 370 (36.8%) | 22 (10.1%) |
| Total | 1,004 (100.0%) | 217 (100.0%) |
Housing Structure by Heating Type in Knoxville
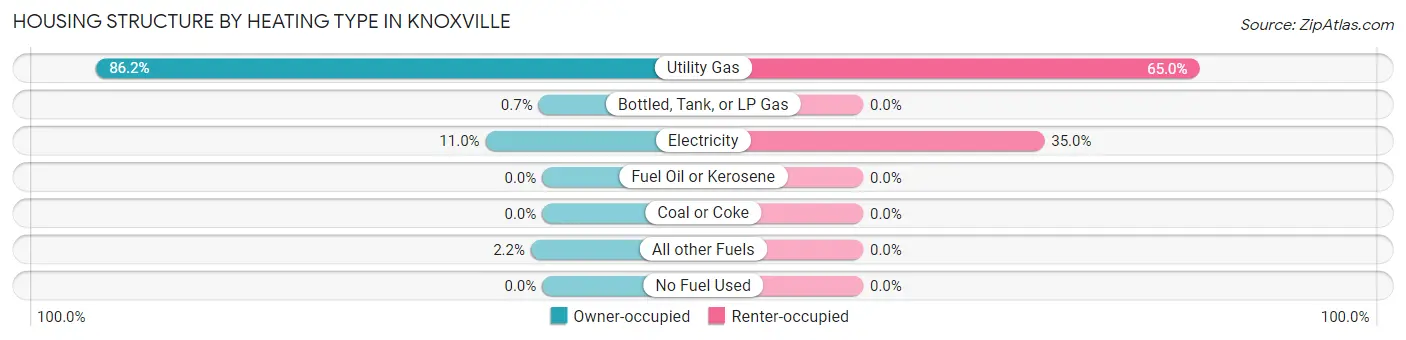
| Heating Type | Owner-occupied | Renter-occupied |
| Utility Gas | 865 (86.2%) | 141 (65.0%) |
| Bottled, Tank, or LP Gas | 7 (0.7%) | 0 (0.0%) |
| Electricity | 110 (11.0%) | 76 (35.0%) |
| Fuel Oil or Kerosene | 0 (0.0%) | 0 (0.0%) |
| Coal or Coke | 0 (0.0%) | 0 (0.0%) |
| All other Fuels | 22 (2.2%) | 0 (0.0%) |
| No Fuel Used | 0 (0.0%) | 0 (0.0%) |
| Total | 1,004 (100.0%) | 217 (100.0%) |
Household Vehicle Usage in Knoxville
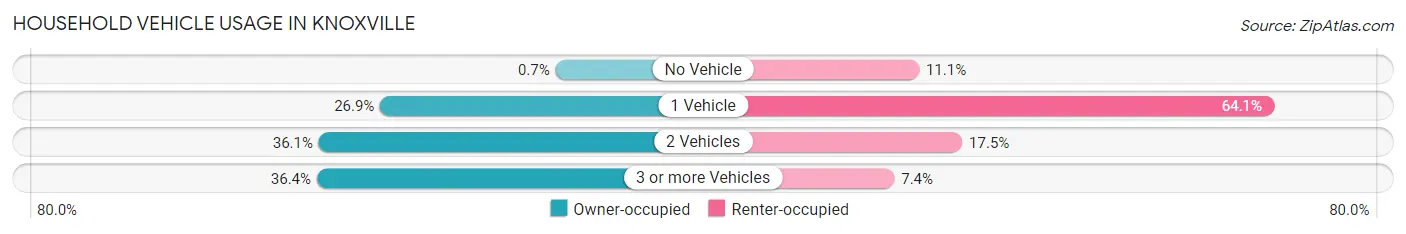
| Vehicles per Household | Owner-occupied | Renter-occupied |
| No Vehicle | 7 (0.7%) | 24 (11.1%) |
| 1 Vehicle | 270 (26.9%) | 139 (64.1%) |
| 2 Vehicles | 362 (36.1%) | 38 (17.5%) |
| 3 or more Vehicles | 365 (36.3%) | 16 (7.4%) |
| Total | 1,004 (100.0%) | 217 (100.0%) |
Real Estate & Mortgages in Knoxville
Real Estate and Mortgage Overview in Knoxville
| Characteristic | Without Mortgage | With Mortgage |
| Housing Units | 383 | 621 |
| Median Property Value | $128,000 | $132,100 |
| Median Household Income | $60,208 | $100 |
| Monthly Housing Costs | $527 | $29 |
| Real Estate Taxes | $2,346 | $25 |
Property Value by Mortgage Status in Knoxville
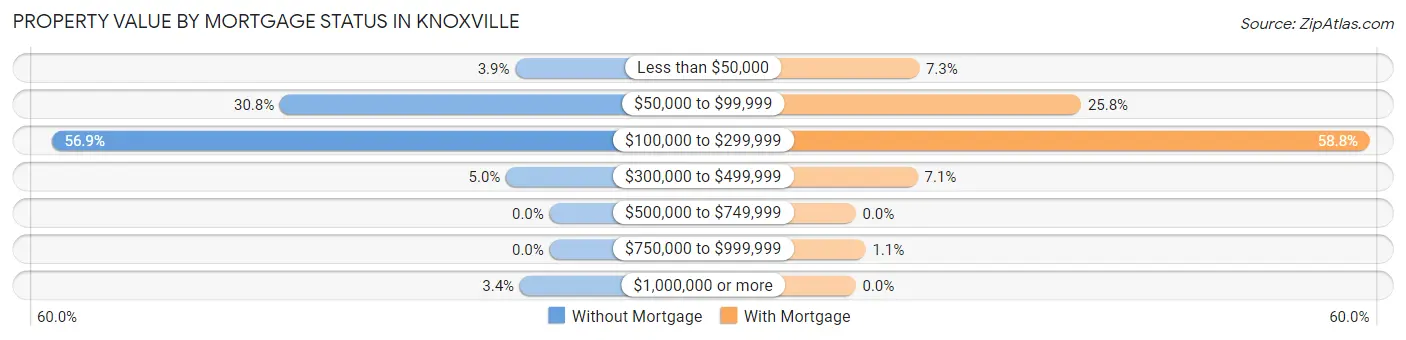
| Property Value | Without Mortgage | With Mortgage |
| Less than $50,000 | 15 (3.9%) | 45 (7.2%) |
| $50,000 to $99,999 | 118 (30.8%) | 160 (25.8%) |
| $100,000 to $299,999 | 218 (56.9%) | 365 (58.8%) |
| $300,000 to $499,999 | 19 (5.0%) | 44 (7.1%) |
| $500,000 to $749,999 | 0 (0.0%) | 0 (0.0%) |
| $750,000 to $999,999 | 0 (0.0%) | 7 (1.1%) |
| $1,000,000 or more | 13 (3.4%) | 0 (0.0%) |
| Total | 383 (100.0%) | 621 (100.0%) |
Household Income by Mortgage Status in Knoxville
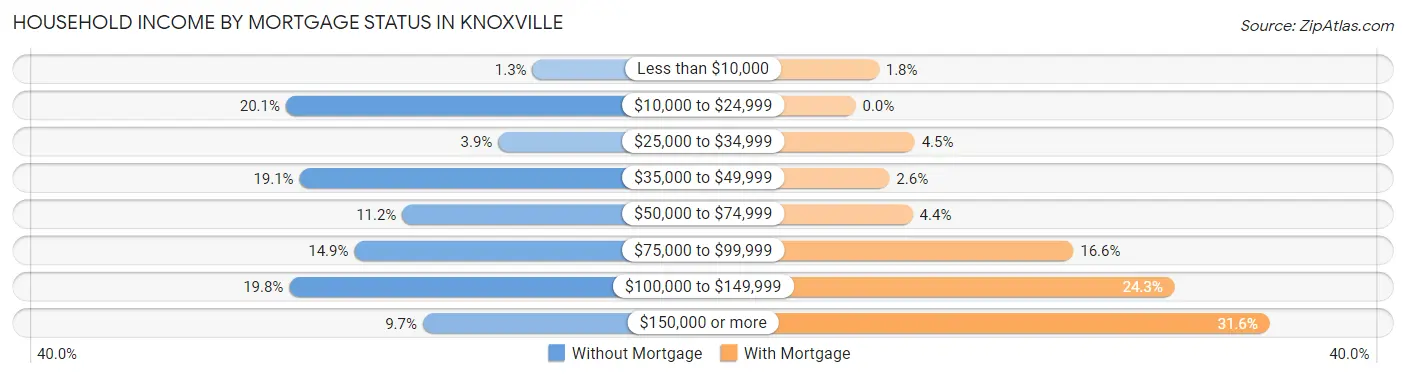
| Household Income | Without Mortgage | With Mortgage |
| Less than $10,000 | 5 (1.3%) | 11 (1.8%) |
| $10,000 to $24,999 | 77 (20.1%) | 0 (0.0%) |
| $25,000 to $34,999 | 15 (3.9%) | 28 (4.5%) |
| $35,000 to $49,999 | 73 (19.1%) | 16 (2.6%) |
| $50,000 to $74,999 | 43 (11.2%) | 27 (4.3%) |
| $75,000 to $99,999 | 57 (14.9%) | 103 (16.6%) |
| $100,000 to $149,999 | 76 (19.8%) | 151 (24.3%) |
| $150,000 or more | 37 (9.7%) | 196 (31.6%) |
| Total | 383 (100.0%) | 621 (100.0%) |
Property Value to Household Income Ratio in Knoxville
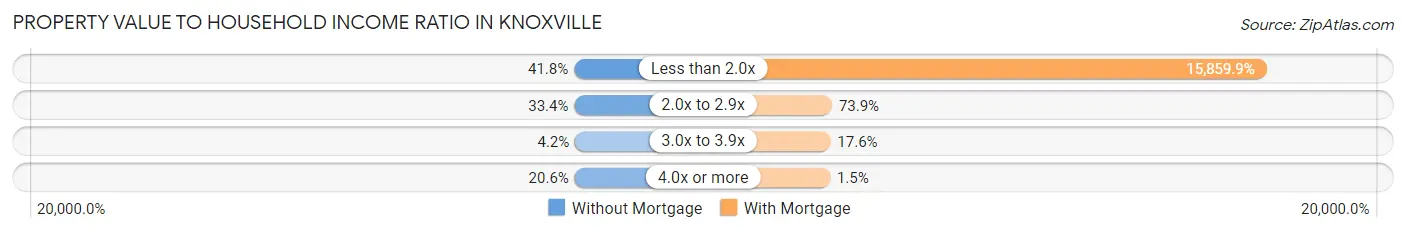
| Value-to-Income Ratio | Without Mortgage | With Mortgage |
| Less than 2.0x | 160 (41.8%) | 98,490 (15,859.9%) |
| 2.0x to 2.9x | 128 (33.4%) | 459 (73.9%) |
| 3.0x to 3.9x | 16 (4.2%) | 109 (17.5%) |
| 4.0x or more | 79 (20.6%) | 9 (1.5%) |
| Total | 383 (100.0%) | 621 (100.0%) |
Real Estate Taxes by Mortgage Status in Knoxville
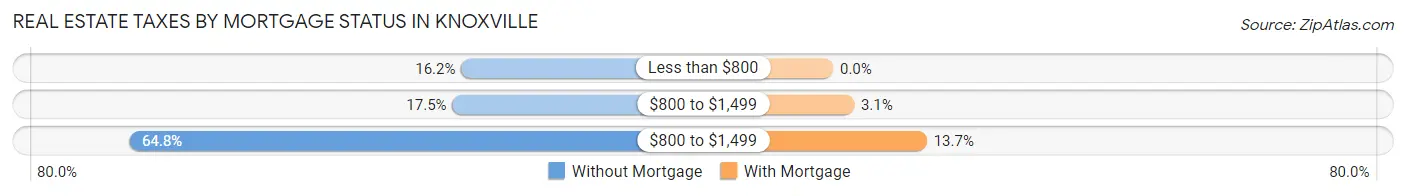
| Property Taxes | Without Mortgage | With Mortgage |
| Less than $800 | 62 (16.2%) | 0 (0.0%) |
| $800 to $1,499 | 67 (17.5%) | 19 (3.1%) |
| $800 to $1,499 | 248 (64.7%) | 85 (13.7%) |
| Total | 383 (100.0%) | 621 (100.0%) |
Health & Disability in Knoxville
Health Insurance Coverage by Age in Knoxville

| Age Bracket | With Coverage | Without Coverage |
| Under 6 Years | 307 (100.0%) | 0 (0.0%) |
| 6 to 18 Years | 627 (98.1%) | 12 (1.9%) |
| 19 to 25 Years | 163 (75.5%) | 53 (24.5%) |
| 26 to 34 Years | 267 (100.0%) | 0 (0.0%) |
| 35 to 44 Years | 369 (96.6%) | 13 (3.4%) |
| 45 to 54 Years | 418 (100.0%) | 0 (0.0%) |
| 55 to 64 Years | 348 (92.1%) | 30 (7.9%) |
| 65 to 74 Years | 259 (100.0%) | 0 (0.0%) |
| 75 Years and older | 280 (100.0%) | 0 (0.0%) |
| Total | 3,038 (96.6%) | 108 (3.4%) |
Health Insurance Coverage by Citizenship Status in Knoxville
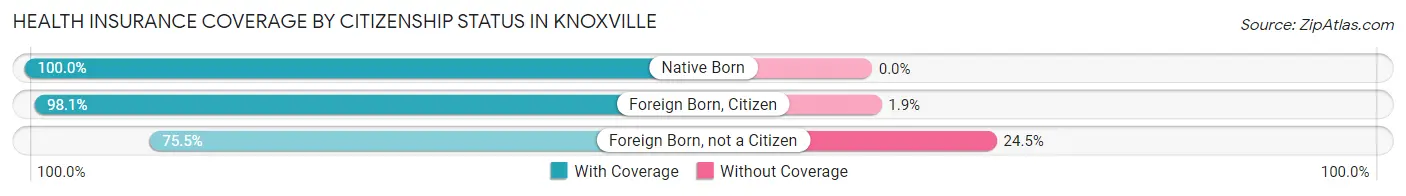
| Citizenship Status | With Coverage | Without Coverage |
| Native Born | 307 (100.0%) | 0 (0.0%) |
| Foreign Born, Citizen | 627 (98.1%) | 12 (1.9%) |
| Foreign Born, not a Citizen | 163 (75.5%) | 53 (24.5%) |
Health Insurance Coverage by Household Income in Knoxville
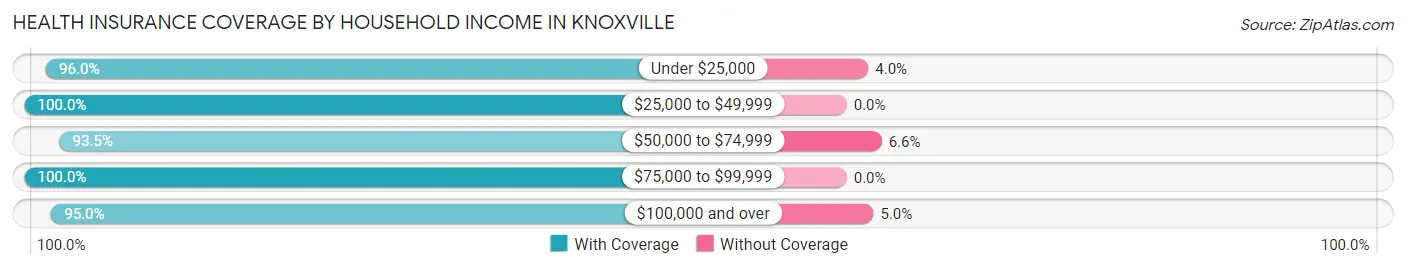
| Household Income | With Coverage | Without Coverage |
| Under $25,000 | 309 (96.0%) | 13 (4.0%) |
| $25,000 to $49,999 | 488 (100.0%) | 0 (0.0%) |
| $50,000 to $74,999 | 471 (93.4%) | 33 (6.6%) |
| $75,000 to $99,999 | 594 (100.0%) | 0 (0.0%) |
| $100,000 and over | 1,176 (95.0%) | 62 (5.0%) |
Public vs Private Health Insurance Coverage by Age in Knoxville
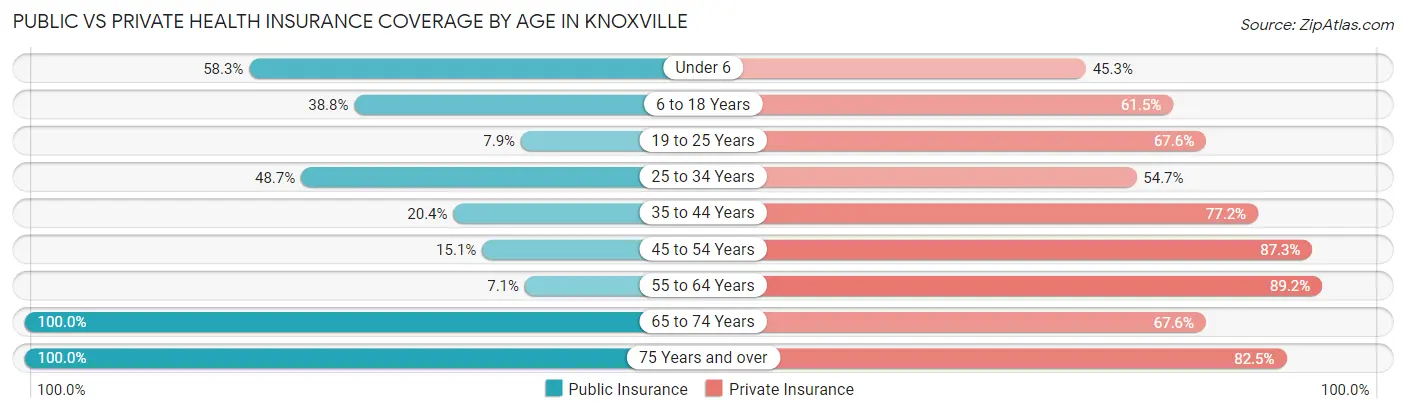
| Age Bracket | Public Insurance | Private Insurance |
| Under 6 | 179 (58.3%) | 139 (45.3%) |
| 6 to 18 Years | 248 (38.8%) | 393 (61.5%) |
| 19 to 25 Years | 17 (7.9%) | 146 (67.6%) |
| 25 to 34 Years | 130 (48.7%) | 146 (54.7%) |
| 35 to 44 Years | 78 (20.4%) | 295 (77.2%) |
| 45 to 54 Years | 63 (15.1%) | 365 (87.3%) |
| 55 to 64 Years | 27 (7.1%) | 337 (89.1%) |
| 65 to 74 Years | 259 (100.0%) | 175 (67.6%) |
| 75 Years and over | 280 (100.0%) | 231 (82.5%) |
| Total | 1,281 (40.7%) | 2,227 (70.8%) |
Disability Status by Sex by Age in Knoxville
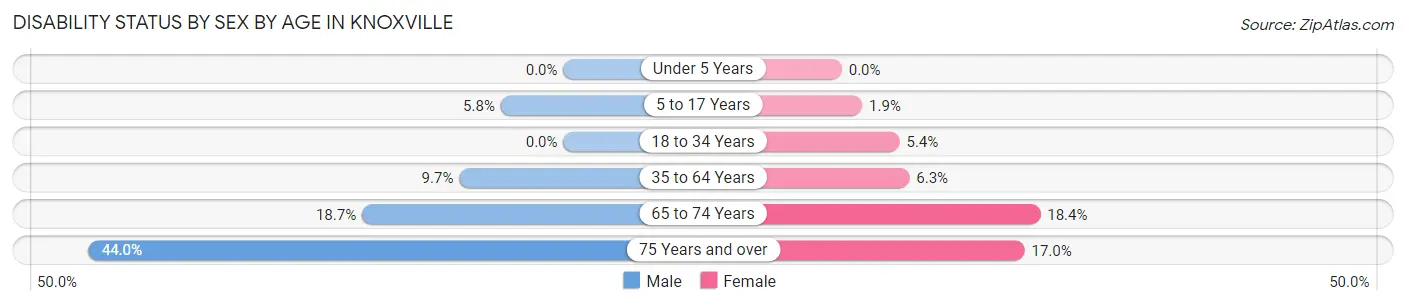
| Age Bracket | Male | Female |
| Under 5 Years | 0 (0.0%) | 0 (0.0%) |
| 5 to 17 Years | 23 (5.8%) | 5 (1.9%) |
| 18 to 34 Years | 0 (0.0%) | 15 (5.4%) |
| 35 to 64 Years | 46 (9.7%) | 44 (6.3%) |
| 65 to 74 Years | 20 (18.7%) | 28 (18.4%) |
| 75 Years and over | 48 (44.0%) | 29 (17.0%) |
Disability Class by Sex by Age in Knoxville
Disability Class: Hearing Difficulty
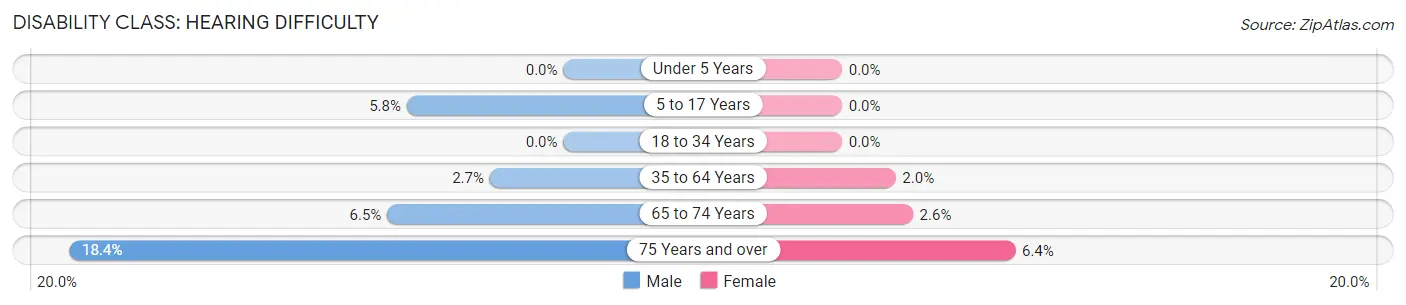
| Age Bracket | Male | Female |
| Under 5 Years | 0 (0.0%) | 0 (0.0%) |
| 5 to 17 Years | 23 (5.8%) | 0 (0.0%) |
| 18 to 34 Years | 0 (0.0%) | 0 (0.0%) |
| 35 to 64 Years | 13 (2.7%) | 14 (2.0%) |
| 65 to 74 Years | 7 (6.5%) | 4 (2.6%) |
| 75 Years and over | 20 (18.3%) | 11 (6.4%) |
Disability Class: Vision Difficulty
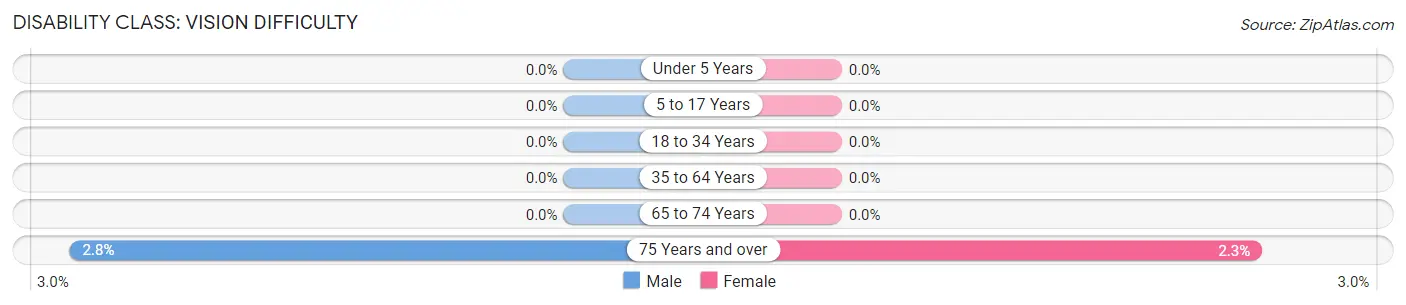
| Age Bracket | Male | Female |
| Under 5 Years | 0 (0.0%) | 0 (0.0%) |
| 5 to 17 Years | 0 (0.0%) | 0 (0.0%) |
| 18 to 34 Years | 0 (0.0%) | 0 (0.0%) |
| 35 to 64 Years | 0 (0.0%) | 0 (0.0%) |
| 65 to 74 Years | 0 (0.0%) | 0 (0.0%) |
| 75 Years and over | 3 (2.8%) | 4 (2.3%) |
Disability Class: Cognitive Difficulty
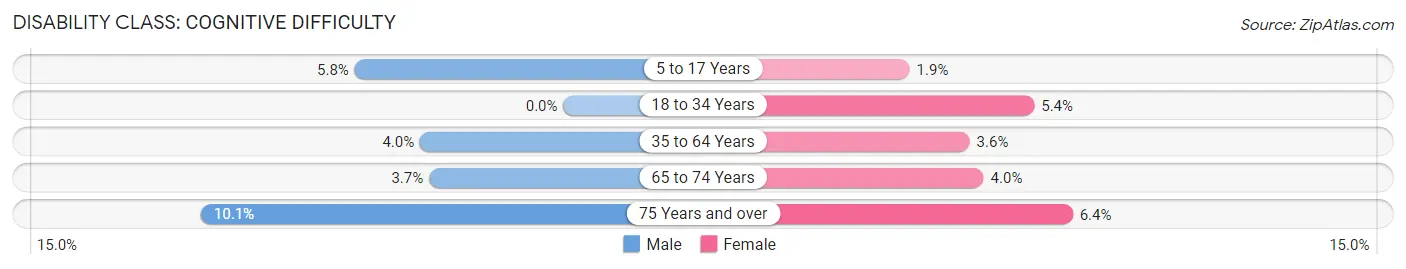
| Age Bracket | Male | Female |
| 5 to 17 Years | 23 (5.8%) | 5 (1.9%) |
| 18 to 34 Years | 0 (0.0%) | 15 (5.4%) |
| 35 to 64 Years | 19 (4.0%) | 25 (3.6%) |
| 65 to 74 Years | 4 (3.7%) | 6 (4.0%) |
| 75 Years and over | 11 (10.1%) | 11 (6.4%) |
Disability Class: Ambulatory Difficulty
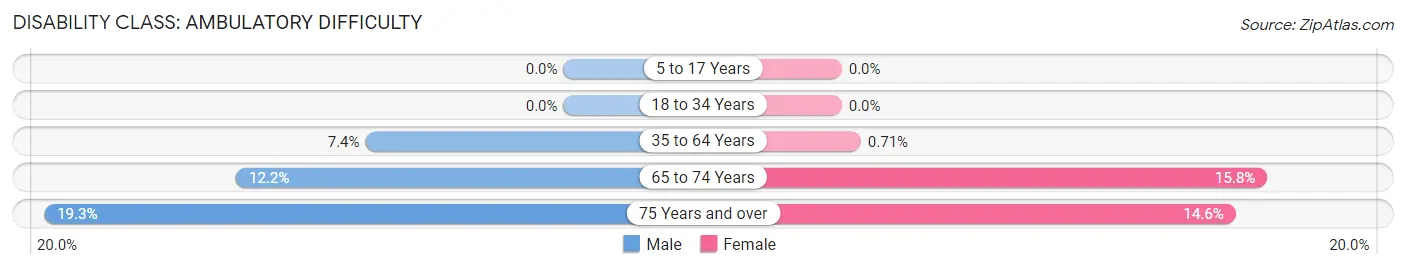
| Age Bracket | Male | Female |
| 5 to 17 Years | 0 (0.0%) | 0 (0.0%) |
| 18 to 34 Years | 0 (0.0%) | 0 (0.0%) |
| 35 to 64 Years | 35 (7.3%) | 5 (0.7%) |
| 65 to 74 Years | 13 (12.1%) | 24 (15.8%) |
| 75 Years and over | 21 (19.3%) | 25 (14.6%) |
Disability Class: Self-Care Difficulty
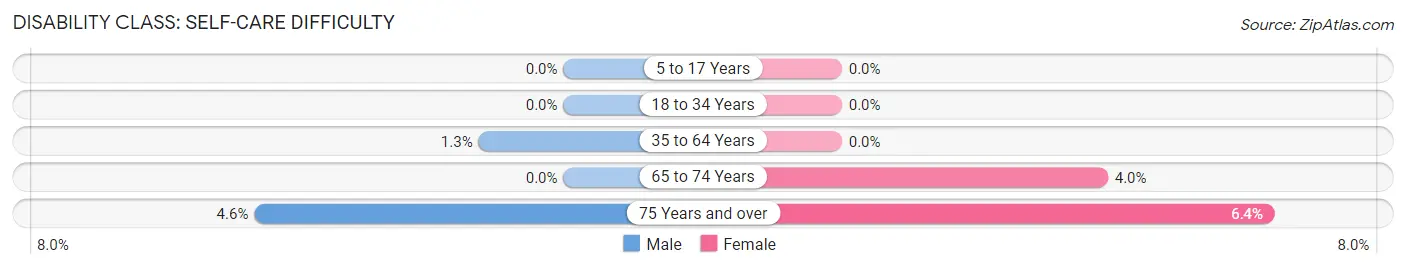
| Age Bracket | Male | Female |
| 5 to 17 Years | 0 (0.0%) | 0 (0.0%) |
| 18 to 34 Years | 0 (0.0%) | 0 (0.0%) |
| 35 to 64 Years | 6 (1.3%) | 0 (0.0%) |
| 65 to 74 Years | 0 (0.0%) | 6 (4.0%) |
| 75 Years and over | 5 (4.6%) | 11 (6.4%) |
Technology Access in Knoxville
Computing Device Access in Knoxville
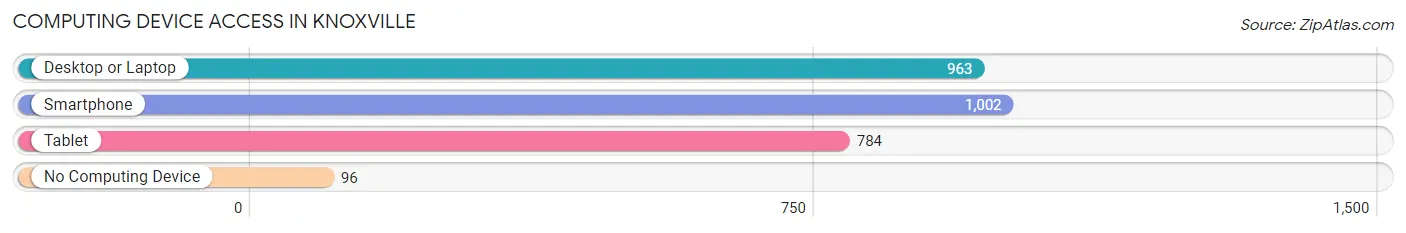
| Device Type | # Households | % Households |
| Desktop or Laptop | 963 | 78.9% |
| Smartphone | 1,002 | 82.1% |
| Tablet | 784 | 64.2% |
| No Computing Device | 96 | 7.9% |
| Total | 1,221 | 100.0% |
Internet Access in Knoxville
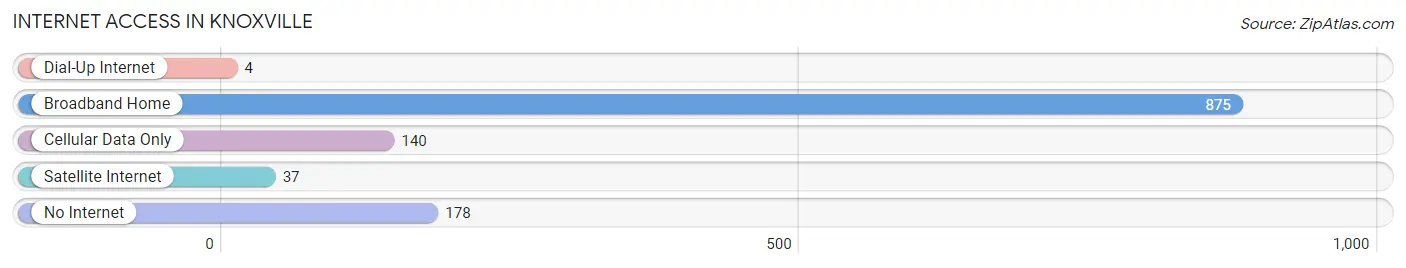
| Internet Type | # Households | % Households |
| Dial-Up Internet | 4 | 0.3% |
| Broadband Home | 875 | 71.7% |
| Cellular Data Only | 140 | 11.5% |
| Satellite Internet | 37 | 3.0% |
| No Internet | 178 | 14.6% |
| Total | 1,221 | 100.0% |
Knoxville Summary
Knoxville, Illinois is a small city located in the heart of the state, in the county of Knox. It is situated in the middle of the state, about halfway between Chicago and St. Louis. The city is home to a population of just over 3,000 people, and is the county seat of Knox County.
History
Knoxville was founded in 1831 by a group of settlers from New York. The city was named after Henry Knox, a Revolutionary War hero and the first Secretary of War. The city was incorporated in 1837, and the first mayor was elected in 1838.
The city was an important stop on the Underground Railroad, and was home to several prominent abolitionists. During the Civil War, Knoxville was a major supply center for the Union Army. After the war, the city experienced a period of growth and prosperity, and by the turn of the century, it had become a major agricultural center.
Geography
Knoxville is located in the center of the state, in the county of Knox. It is situated in the middle of the state, about halfway between Chicago and St. Louis. The city is located on the banks of the Spoon River, and is surrounded by rolling hills and farmland. The city is located in the humid continental climate zone, and experiences hot, humid summers and cold, snowy winters.
Economy
Knoxville’s economy is largely based on agriculture. The city is home to several large farms, and the surrounding area is known for its production of corn, soybeans, and other crops. The city is also home to several manufacturing companies, including a paper mill and a furniture factory.
The city is also home to several small businesses, including restaurants, shops, and other services. The city is also home to a small airport, which serves the surrounding area.
Demographics
As of the 2010 census, the population of Knoxville was 3,072. The racial makeup of the city was 97.2% White, 0.7% African American, 0.2% Native American, 0.3% Asian, 0.1% Pacific Islander, 0.7% from other races, and 0.9% from two or more races. Hispanic or Latino of any race were 1.7% of the population.
The median household income in Knoxville was $41,944, and the median family income was $50,917. The per capita income for the city was $20,845. About 11.2% of families and 14.2% of the population were below the poverty line, including 19.2% of those under age 18 and 8.2% of those age 65 or over.
Knoxville is a small city with a rich history and a diverse population. The city is home to a variety of businesses and industries, and is a major agricultural center. The city is also home to a variety of small businesses, and is a great place to live and work.
Common Questions
What is Per Capita Income in Knoxville?
Per Capita income in Knoxville is $30,536.
What is the Median Family Income in Knoxville?
Median Family Income in Knoxville is $89,211.
What is the Median Household income in Knoxville?
Median Household Income in Knoxville is $76,161.
What is Income or Wage Gap in Knoxville?
Income or Wage Gap in Knoxville is 38.6%.
Women in Knoxville earn 61.4 cents for every dollar earned by a man.
What is Inequality or Gini Index in Knoxville?
Inequality or Gini Index in Knoxville is 0.38.
What is the Total Population of Knoxville?
Total Population of Knoxville is 3,318.
What is the Total Male Population of Knoxville?
Total Male Population of Knoxville is 1,434.
What is the Total Female Population of Knoxville?
Total Female Population of Knoxville is 1,884.
What is the Ratio of Males per 100 Females in Knoxville?
There are 76.11 Males per 100 Females in Knoxville.
What is the Ratio of Females per 100 Males in Knoxville?
There are 131.38 Females per 100 Males in Knoxville.
What is the Median Population Age in Knoxville?
Median Population Age in Knoxville is 41.6 Years.
What is the Average Family Size in Knoxville
Average Family Size in Knoxville is 3.1 People.
What is the Average Household Size in Knoxville
Average Household Size in Knoxville is 2.6 People.
How Large is the Labor Force in Knoxville?
There are 1,462 People in the Labor Forcein in Knoxville.
What is the Percentage of People in the Labor Force in Knoxville?
58.7% of People are in the Labor Force in Knoxville.
What is the Unemployment Rate in Knoxville?
Unemployment Rate in Knoxville is 4.6%.