Kinmundy, IL Map & Demographics
Kinmundy Map
Kinmundy Overview
$22,192
PER CAPITA INCOME
$53,333
AVG FAMILY INCOME
$30,625
AVG HOUSEHOLD INCOME
35.6%
WAGE / INCOME GAP [ % ]
64.4¢/ $1
WAGE / INCOME GAP [ $ ]
0.44
INEQUALITY / GINI INDEX
874
TOTAL POPULATION
369
MALE POPULATION
505
FEMALE POPULATION
73.07
MALES / 100 FEMALES
136.86
FEMALES / 100 MALES
46.3
MEDIAN AGE
3.0
AVG FAMILY SIZE
2.1
AVG HOUSEHOLD SIZE
360
LABOR FORCE [ PEOPLE ]
51.6%
PERCENT IN LABOR FORCE
14.9%
UNEMPLOYMENT RATE
Kinmundy Zip Codes
Kinmundy Area Codes
Income in Kinmundy
Income Overview in Kinmundy
Per Capita Income in Kinmundy is $22,192, while median incomes of families and households are $53,333 and $30,625 respectively.
| Characteristic | Number | Measure |
| Per Capita Income | 874 | $22,192 |
| Median Family Income | 194 | $53,333 |
| Mean Family Income | 194 | $57,468 |
| Median Household Income | 413 | $30,625 |
| Mean Household Income | 413 | $42,647 |
| Income Deficit | 194 | $0 |
| Wage / Income Gap (%) | 874 | 35.56% |
| Wage / Income Gap ($) | 874 | 64.44¢ per $1 |
| Gini / Inequality Index | 874 | 0.44 |
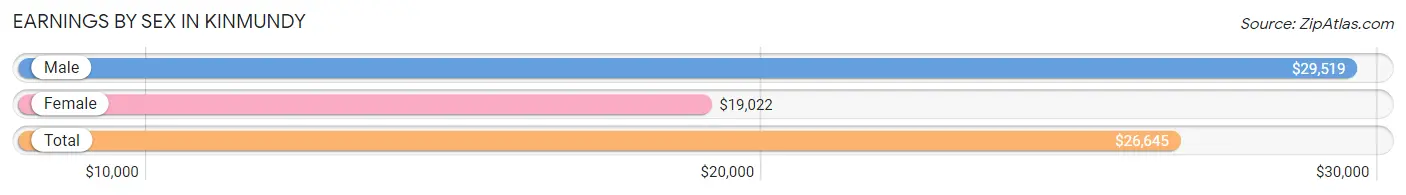
Earnings by Sex in Kinmundy
Average Earnings in Kinmundy are $26,645, $29,519 for men and $19,022 for women, a difference of 35.6%.
| Sex | Number | Average Earnings |
| Male | 176 (47.1%) | $29,519 |
| Female | 198 (52.9%) | $19,022 |
| Total | 374 (100.0%) | $26,645 |
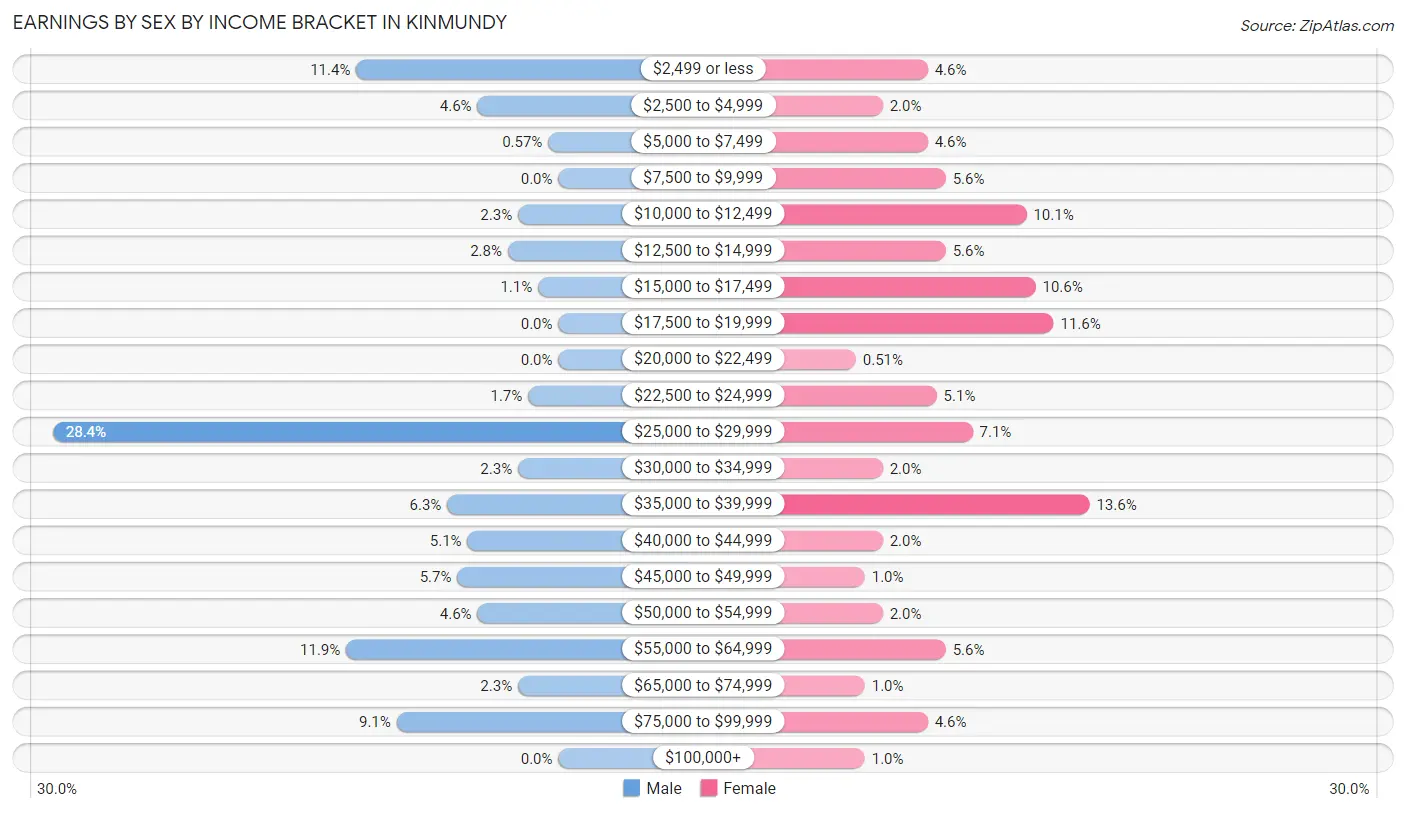
Earnings by Sex by Income Bracket in Kinmundy
The most common earnings brackets in Kinmundy are $25,000 to $29,999 for men (50 | 28.4%) and $35,000 to $39,999 for women (27 | 13.6%).
| Income | Male | Female |
| $2,499 or less | 20 (11.4%) | 9 (4.5%) |
| $2,500 to $4,999 | 8 (4.5%) | 4 (2.0%) |
| $5,000 to $7,499 | 1 (0.6%) | 9 (4.5%) |
| $7,500 to $9,999 | 0 (0.0%) | 11 (5.6%) |
| $10,000 to $12,499 | 4 (2.3%) | 20 (10.1%) |
| $12,500 to $14,999 | 5 (2.8%) | 11 (5.6%) |
| $15,000 to $17,499 | 2 (1.1%) | 21 (10.6%) |
| $17,500 to $19,999 | 0 (0.0%) | 23 (11.6%) |
| $20,000 to $22,499 | 0 (0.0%) | 1 (0.5%) |
| $22,500 to $24,999 | 3 (1.7%) | 10 (5.1%) |
| $25,000 to $29,999 | 50 (28.4%) | 14 (7.1%) |
| $30,000 to $34,999 | 4 (2.3%) | 4 (2.0%) |
| $35,000 to $39,999 | 11 (6.2%) | 27 (13.6%) |
| $40,000 to $44,999 | 9 (5.1%) | 4 (2.0%) |
| $45,000 to $49,999 | 10 (5.7%) | 2 (1.0%) |
| $50,000 to $54,999 | 8 (4.5%) | 4 (2.0%) |
| $55,000 to $64,999 | 21 (11.9%) | 11 (5.6%) |
| $65,000 to $74,999 | 4 (2.3%) | 2 (1.0%) |
| $75,000 to $99,999 | 16 (9.1%) | 9 (4.5%) |
| $100,000+ | 0 (0.0%) | 2 (1.0%) |
| Total | 176 (100.0%) | 198 (100.0%) |
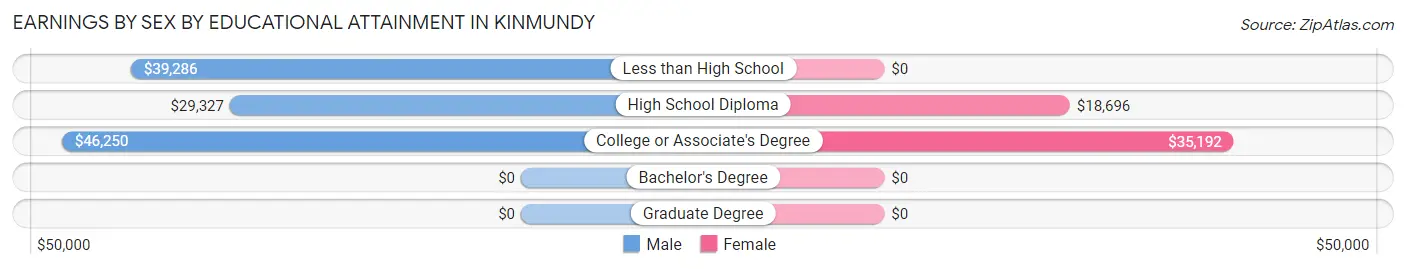
Earnings by Sex by Educational Attainment in Kinmundy
Average earnings in Kinmundy are $36,563 for men and $19,891 for women, a difference of 45.6%. Men with an educational attainment of college or associate's degree enjoy the highest average annual earnings of $46,250, while those with high school diploma education earn the least with $29,327. Women with an educational attainment of college or associate's degree earn the most with the average annual earnings of $35,192, while those with high school diploma education have the smallest earnings of $18,696.
| Educational Attainment | Male Income | Female Income |
| Less than High School | $39,286 | $0 |
| High School Diploma | $29,327 | $18,696 |
| College or Associate's Degree | $46,250 | $35,192 |
| Bachelor's Degree | - | - |
| Graduate Degree | - | - |
| Total | $36,563 | $19,891 |
Family Income in Kinmundy
Family Income Brackets in Kinmundy
According to the Kinmundy family income data, there are 41 families falling into the $50,000 to $74,999 income range, which is the most common income bracket and makes up 21.1% of all families.
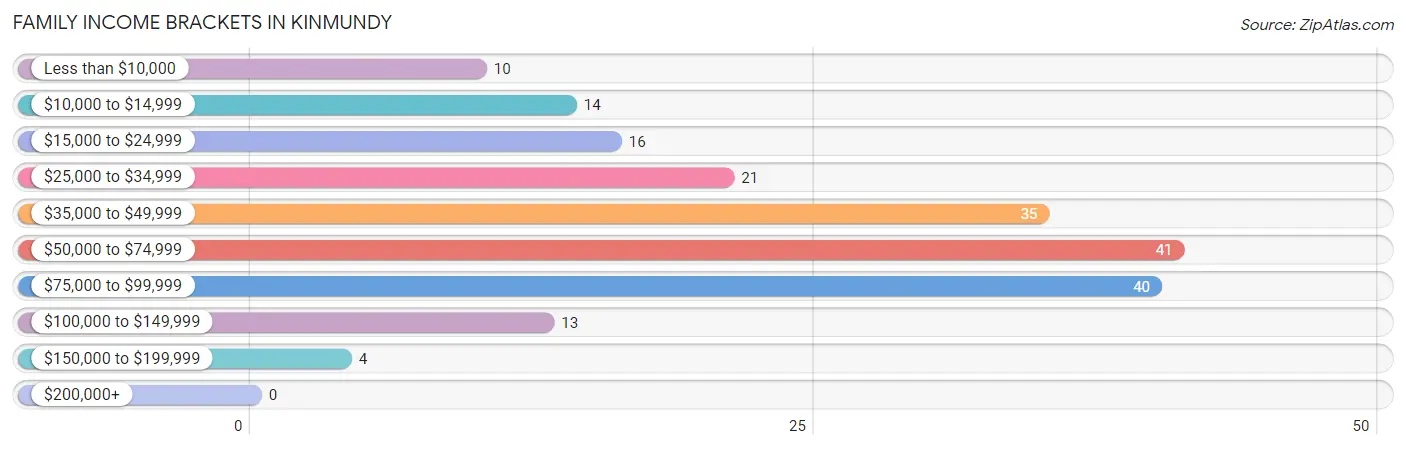
| Income Bracket | # Families | % Families |
| Less than $10,000 | 10 | 5.2% |
| $10,000 to $14,999 | 14 | 7.2% |
| $15,000 to $24,999 | 16 | 8.2% |
| $25,000 to $34,999 | 21 | 10.8% |
| $35,000 to $49,999 | 35 | 18.0% |
| $50,000 to $74,999 | 41 | 21.1% |
| $75,000 to $99,999 | 40 | 20.6% |
| $100,000 to $149,999 | 13 | 6.7% |
| $150,000 to $199,999 | 4 | 2.1% |
| $200,000+ | 0 | 0.0% |
Family Income by Famaliy Size in Kinmundy
3-person families (37 | 19.1%) account for the highest median family income in Kinmundy with $73,194 per family, while 3-person families (37 | 19.1%) have the highest median income of $24,398 per family member.
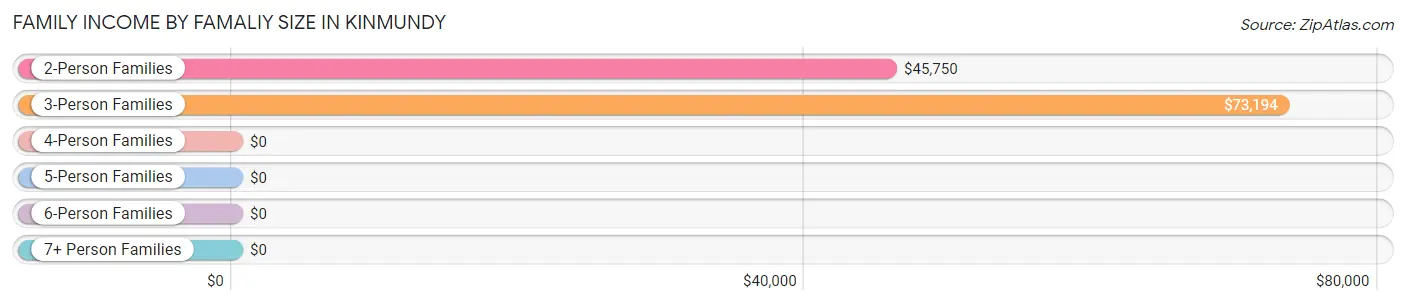
| Income Bracket | # Families | Median Income |
| 2-Person Families | 116 (59.8%) | $45,750 |
| 3-Person Families | 37 (19.1%) | $73,194 |
| 4-Person Families | 22 (11.3%) | $0 |
| 5-Person Families | 8 (4.1%) | $0 |
| 6-Person Families | 11 (5.7%) | $0 |
| 7+ Person Families | 0 (0.0%) | $0 |
| Total | 194 (100.0%) | $53,333 |
Family Income by Number of Earners in Kinmundy
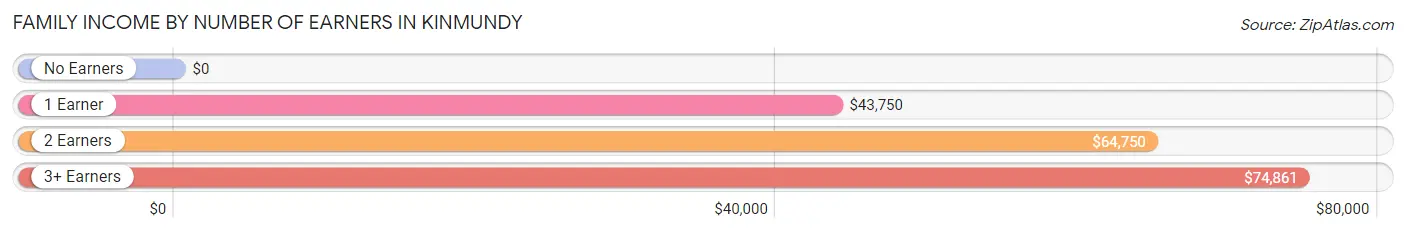
| Number of Earners | # Families | Median Income |
| No Earners | 48 (24.7%) | $0 |
| 1 Earner | 62 (32.0%) | $43,750 |
| 2 Earners | 63 (32.5%) | $64,750 |
| 3+ Earners | 21 (10.8%) | $74,861 |
| Total | 194 (100.0%) | $53,333 |
Household Income in Kinmundy
Household Income Brackets in Kinmundy
With 78 households falling in the category, the $10,000 to $14,999 income range is the most frequent in Kinmundy, accounting for 18.9% of all households.
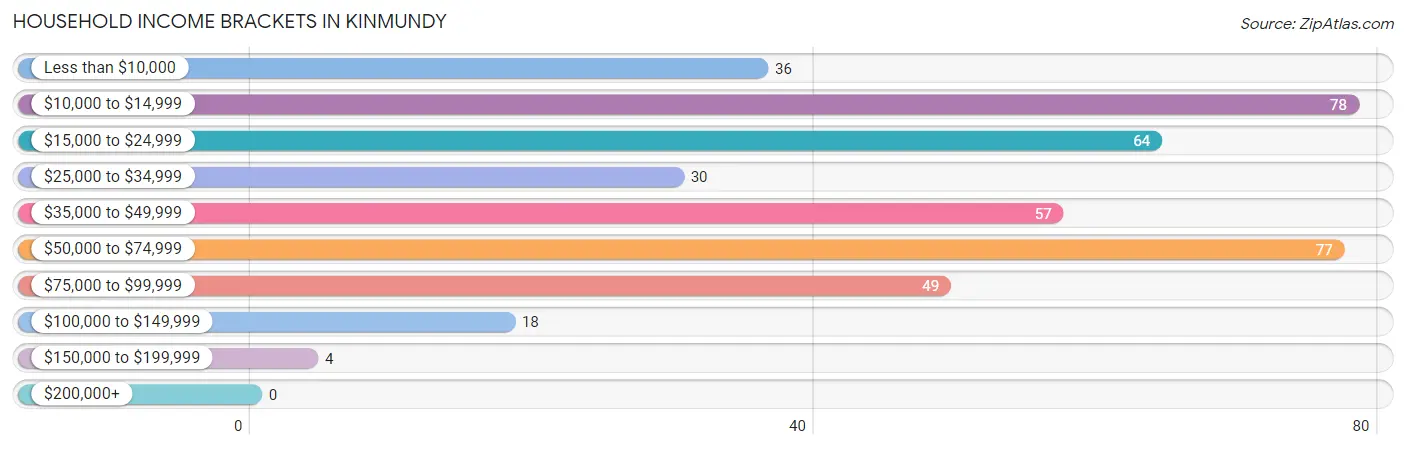
| Income Bracket | # Households | % Households |
| Less than $10,000 | 36 | 8.7% |
| $10,000 to $14,999 | 78 | 18.9% |
| $15,000 to $24,999 | 64 | 15.5% |
| $25,000 to $34,999 | 30 | 7.3% |
| $35,000 to $49,999 | 57 | 13.8% |
| $50,000 to $74,999 | 77 | 18.6% |
| $75,000 to $99,999 | 49 | 11.9% |
| $100,000 to $149,999 | 18 | 4.4% |
| $150,000 to $199,999 | 4 | 1.0% |
| $200,000+ | 0 | 0.0% |
Household Income by Householder Age in Kinmundy
The median household income in Kinmundy is $30,625, with the highest median household income of $53,250 found in the 45 to 64 years age bracket for the primary householder. A total of 127 households (30.7%) fall into this category. Meanwhile, the 65+ years age bracket for the primary householder has the lowest median household income of $0, with 164 households (39.7%) in this group.
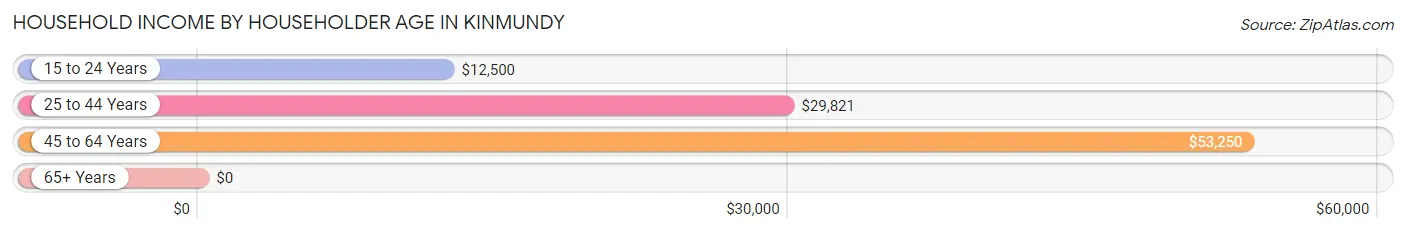
| Income Bracket | # Households | Median Income |
| 15 to 24 Years | 22 (5.3%) | $12,500 |
| 25 to 44 Years | 100 (24.2%) | $29,821 |
| 45 to 64 Years | 127 (30.7%) | $53,250 |
| 65+ Years | 164 (39.7%) | $0 |
| Total | 413 (100.0%) | $30,625 |
Poverty in Kinmundy
Income Below Poverty by Sex and Age in Kinmundy
With 22.3% poverty level for males and 28.3% for females among the residents of Kinmundy, 5 year old males and under 5 year old females are the most vulnerable to poverty, with 2 males (100.0%) and 18 females (60.0%) in their respective age groups living below the poverty level.
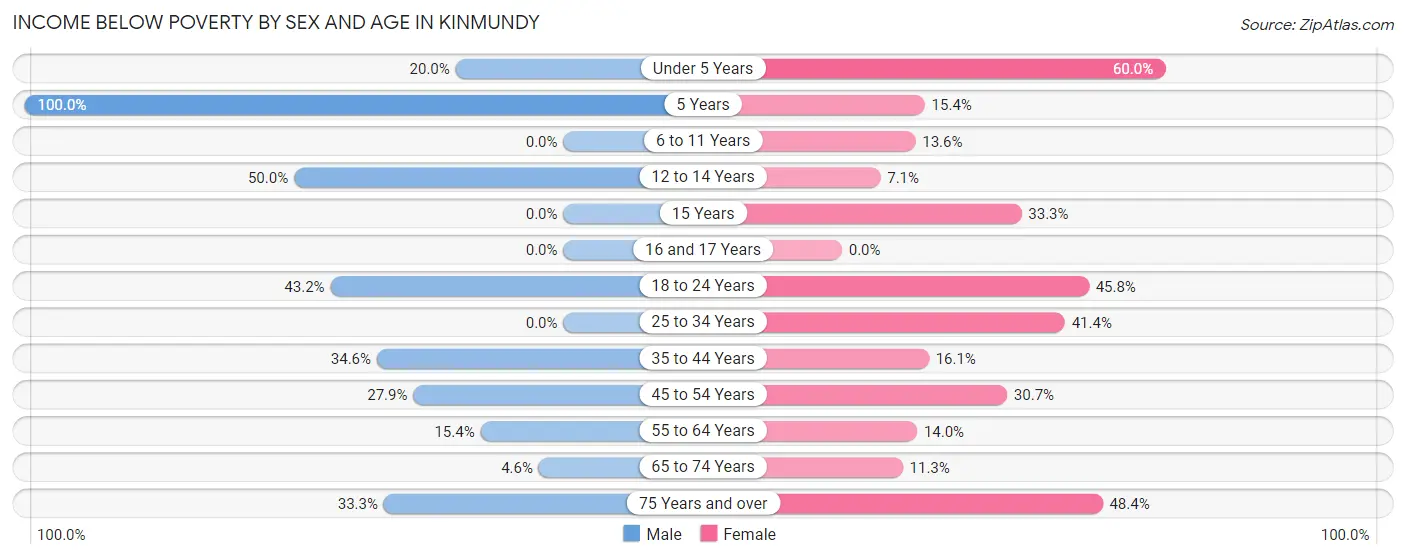
| Age Bracket | Male | Female |
| Under 5 Years | 2 (20.0%) | 18 (60.0%) |
| 5 Years | 2 (100.0%) | 2 (15.4%) |
| 6 to 11 Years | 0 (0.0%) | 3 (13.6%) |
| 12 to 14 Years | 5 (50.0%) | 3 (7.1%) |
| 15 Years | 0 (0.0%) | 2 (33.3%) |
| 16 and 17 Years | 0 (0.0%) | 0 (0.0%) |
| 18 to 24 Years | 16 (43.2%) | 11 (45.8%) |
| 25 to 34 Years | 0 (0.0%) | 12 (41.4%) |
| 35 to 44 Years | 18 (34.6%) | 10 (16.1%) |
| 45 to 54 Years | 22 (27.9%) | 19 (30.6%) |
| 55 to 64 Years | 8 (15.4%) | 6 (14.0%) |
| 65 to 74 Years | 2 (4.5%) | 7 (11.3%) |
| 75 Years and over | 7 (33.3%) | 45 (48.4%) |
| Total | 82 (22.3%) | 138 (28.3%) |
Income Above Poverty by Sex and Age in Kinmundy
According to the poverty statistics in Kinmundy, males aged 6 to 11 years and females aged 12 to 14 years are the age groups that are most secure financially, with 100.0% of males and 92.9% of females in these age groups living above the poverty line.
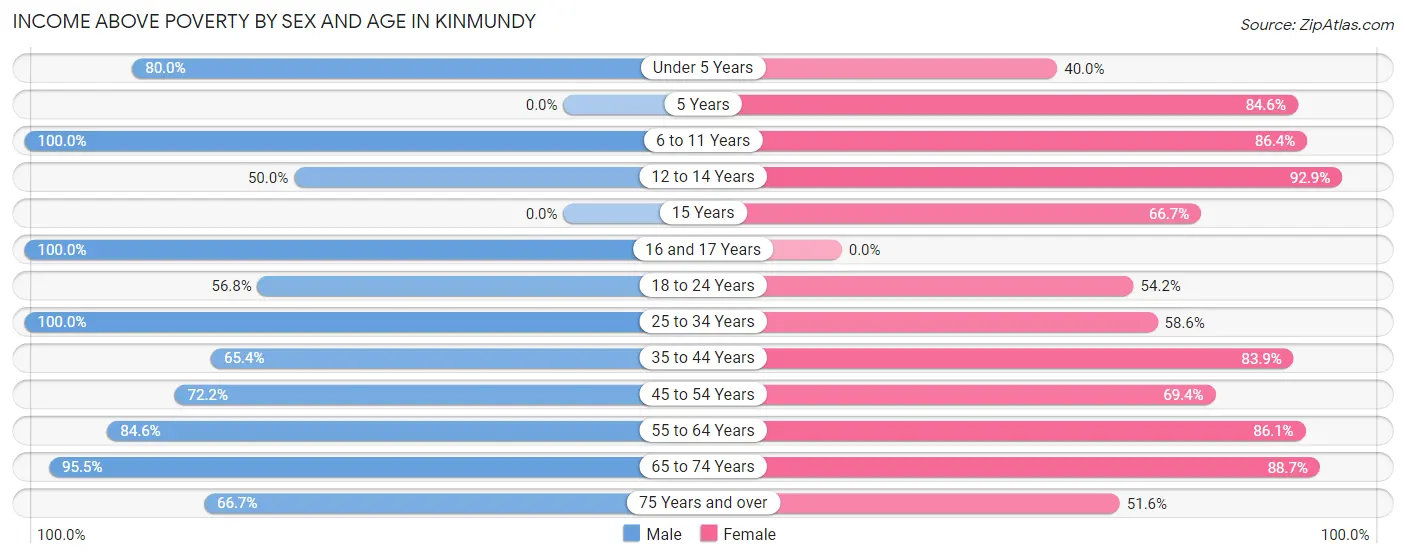
| Age Bracket | Male | Female |
| Under 5 Years | 8 (80.0%) | 12 (40.0%) |
| 5 Years | 0 (0.0%) | 11 (84.6%) |
| 6 to 11 Years | 22 (100.0%) | 19 (86.4%) |
| 12 to 14 Years | 5 (50.0%) | 39 (92.9%) |
| 15 Years | 0 (0.0%) | 4 (66.7%) |
| 16 and 17 Years | 20 (100.0%) | 0 (0.0%) |
| 18 to 24 Years | 21 (56.8%) | 13 (54.2%) |
| 25 to 34 Years | 18 (100.0%) | 17 (58.6%) |
| 35 to 44 Years | 34 (65.4%) | 52 (83.9%) |
| 45 to 54 Years | 57 (72.2%) | 43 (69.4%) |
| 55 to 64 Years | 44 (84.6%) | 37 (86.1%) |
| 65 to 74 Years | 42 (95.5%) | 55 (88.7%) |
| 75 Years and over | 14 (66.7%) | 48 (51.6%) |
| Total | 285 (77.7%) | 350 (71.7%) |
Income Below Poverty Among Married-Couple Families in Kinmundy
The poverty statistics for married-couple families in Kinmundy show that 15.6% or 19 of the total 122 families live below the poverty line. Families with no children have the highest poverty rate of 19.8%, comprising of 17 families. On the other hand, families with 1 or 2 children have the lowest poverty rate of 0.0%, which includes 0 families.
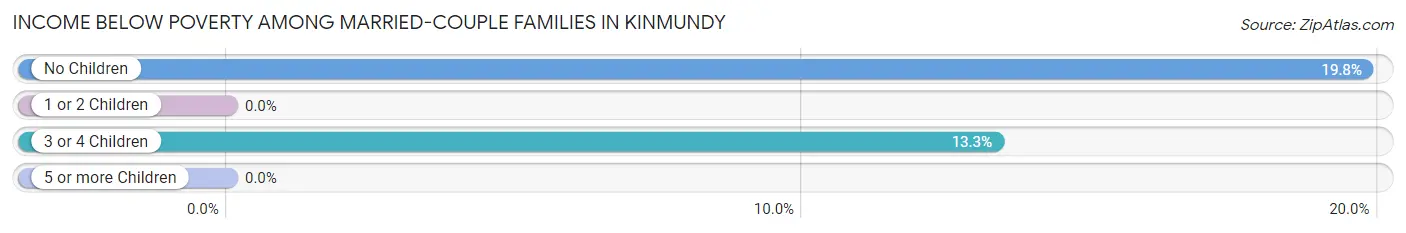
| Children | Above Poverty | Below Poverty |
| No Children | 69 (80.2%) | 17 (19.8%) |
| 1 or 2 Children | 21 (100.0%) | 0 (0.0%) |
| 3 or 4 Children | 13 (86.7%) | 2 (13.3%) |
| 5 or more Children | 0 (0.0%) | 0 (0.0%) |
| Total | 103 (84.4%) | 19 (15.6%) |
Income Below Poverty Among Single-Parent Households in Kinmundy
According to the poverty data in Kinmundy, 20.0% or 2 single-father households and 30.6% or 19 single-mother households are living below the poverty line. Among single-father households, those with no children have the highest poverty rate, with 2 households (40.0%) experiencing poverty. Likewise, among single-mother households, those with 1 or 2 children have the highest poverty rate, with 17 households (43.6%) falling below the poverty line.
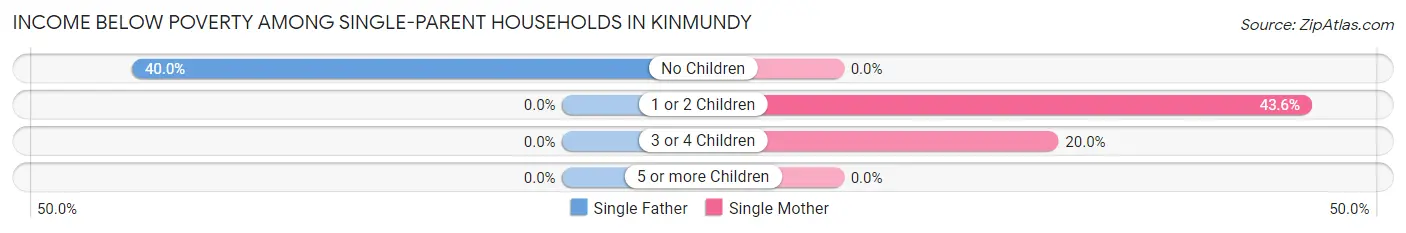
| Children | Single Father | Single Mother |
| No Children | 2 (40.0%) | 0 (0.0%) |
| 1 or 2 Children | 0 (0.0%) | 17 (43.6%) |
| 3 or 4 Children | 0 (0.0%) | 2 (20.0%) |
| 5 or more Children | 0 (0.0%) | 0 (0.0%) |
| Total | 2 (20.0%) | 19 (30.6%) |
Income Below Poverty Among Married-Couple vs Single-Parent Households in Kinmundy
The poverty data for Kinmundy shows that 19 of the married-couple family households (15.6%) and 21 of the single-parent households (29.2%) are living below the poverty level. Within the married-couple family households, those with no children have the highest poverty rate, with 17 households (19.8%) falling below the poverty line. Among the single-parent households, those with 1 or 2 children have the highest poverty rate, with 17 household (38.6%) living below poverty.
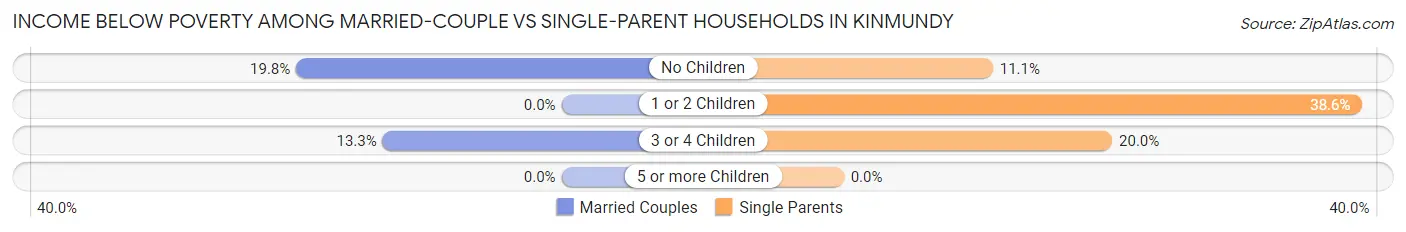
| Children | Married-Couple Families | Single-Parent Households |
| No Children | 17 (19.8%) | 2 (11.1%) |
| 1 or 2 Children | 0 (0.0%) | 17 (38.6%) |
| 3 or 4 Children | 2 (13.3%) | 2 (20.0%) |
| 5 or more Children | 0 (0.0%) | 0 (0.0%) |
| Total | 19 (15.6%) | 21 (29.2%) |
Race in Kinmundy
The most populous races in Kinmundy are White / Caucasian (845 | 96.7%), Two or more Races (22 | 2.5%), and Hispanic or Latino (15 | 1.7%).
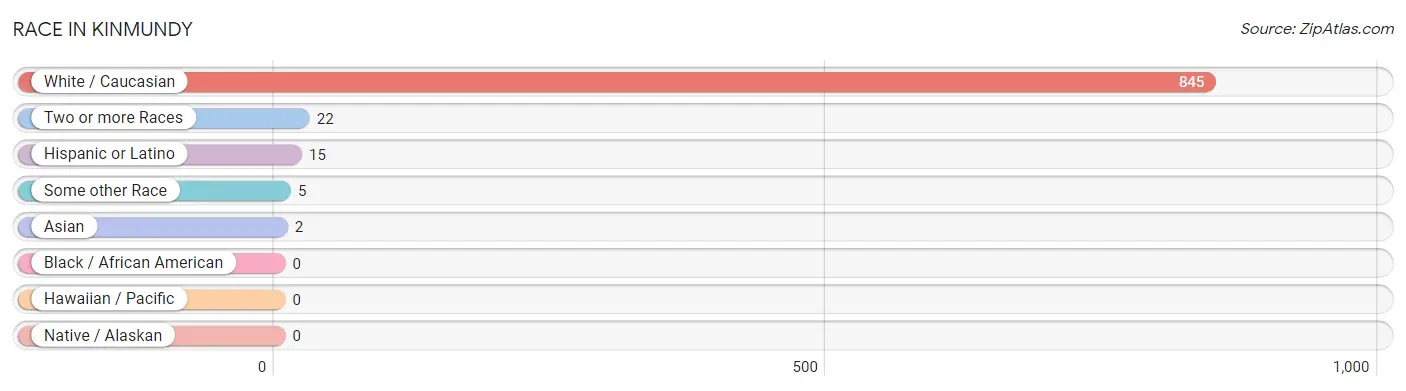
| Race | # Population | % Population |
| Asian | 2 | 0.2% |
| Black / African American | 0 | 0.0% |
| Hawaiian / Pacific | 0 | 0.0% |
| Hispanic or Latino | 15 | 1.7% |
| Native / Alaskan | 0 | 0.0% |
| White / Caucasian | 845 | 96.7% |
| Two or more Races | 22 | 2.5% |
| Some other Race | 5 | 0.6% |
| Total | 874 | 100.0% |
Ancestry in Kinmundy
The most populous ancestries reported in Kinmundy are German (185 | 21.2%), English (130 | 14.9%), Irish (115 | 13.2%), American (111 | 12.7%), and Dutch (45 | 5.1%), together accounting for 67.0% of all Kinmundy residents.
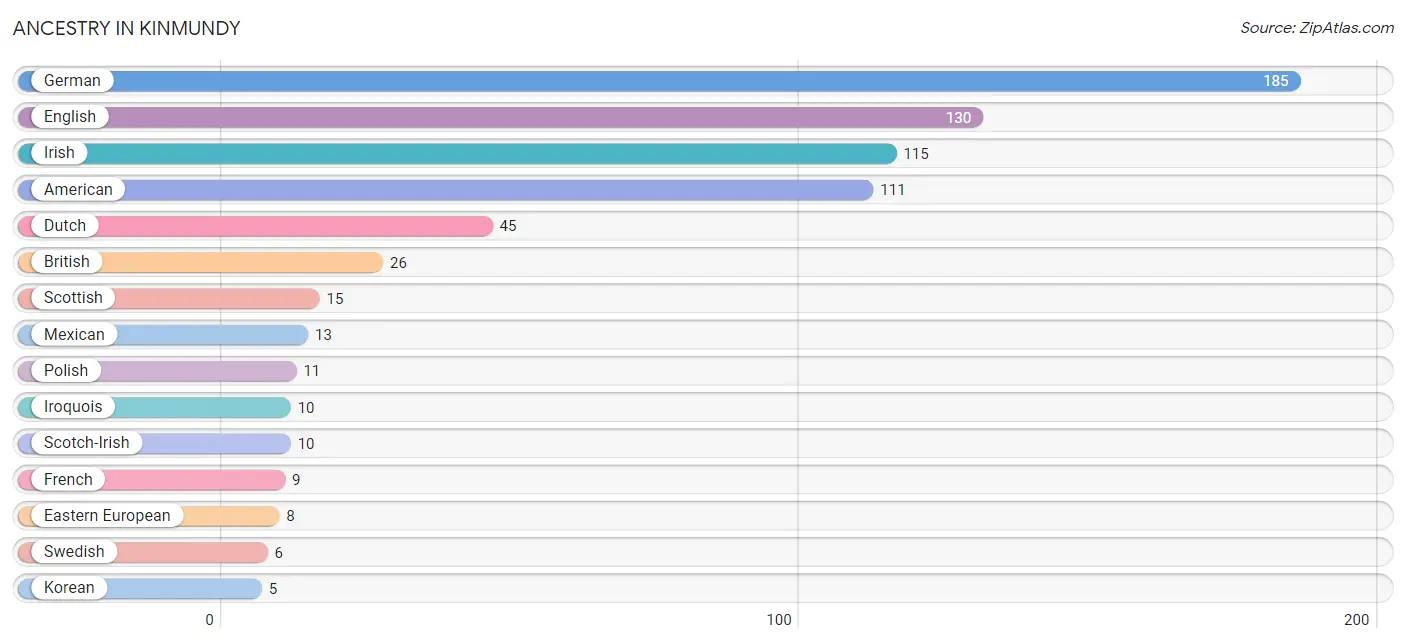
| Ancestry | # Population | % Population |
| American | 111 | 12.7% |
| British | 26 | 3.0% |
| Colombian | 2 | 0.2% |
| Dutch | 45 | 5.1% |
| Eastern European | 8 | 0.9% |
| English | 130 | 14.9% |
| French | 9 | 1.0% |
| French Canadian | 1 | 0.1% |
| German | 185 | 21.2% |
| Irish | 115 | 13.2% |
| Iroquois | 10 | 1.1% |
| Italian | 2 | 0.2% |
| Korean | 5 | 0.6% |
| Lithuanian | 2 | 0.2% |
| Mexican | 13 | 1.5% |
| Polish | 11 | 1.3% |
| Scandinavian | 2 | 0.2% |
| Scotch-Irish | 10 | 1.1% |
| Scottish | 15 | 1.7% |
| South American | 2 | 0.2% |
| Swedish | 6 | 0.7% | View All 21 Rows |
Immigrants in Kinmundy
The most numerous immigrant groups reported in Kinmundy came from Central America (5 | 0.6%), Latin America (5 | 0.6%), Mexico (5 | 0.6%), Canada (3 | 0.3%), and Asia (2 | 0.2%), together accounting for 2.3% of all Kinmundy residents.
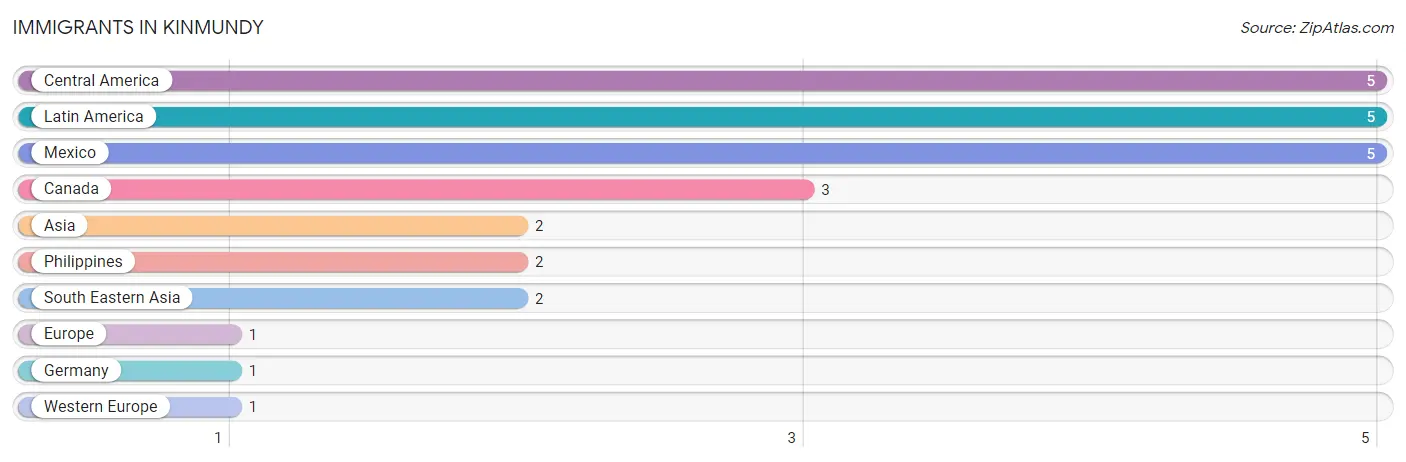
| Immigration Origin | # Population | % Population |
| Asia | 2 | 0.2% |
| Canada | 3 | 0.3% |
| Central America | 5 | 0.6% |
| Europe | 1 | 0.1% |
| Germany | 1 | 0.1% |
| Latin America | 5 | 0.6% |
| Mexico | 5 | 0.6% |
| Philippines | 2 | 0.2% |
| South Eastern Asia | 2 | 0.2% |
| Western Europe | 1 | 0.1% | View All 10 Rows |
Sex and Age in Kinmundy
Sex and Age in Kinmundy
The most populous age groups in Kinmundy are 50 to 54 Years (57 | 15.4%) for men and 10 to 14 Years (74 | 14.6%) for women.
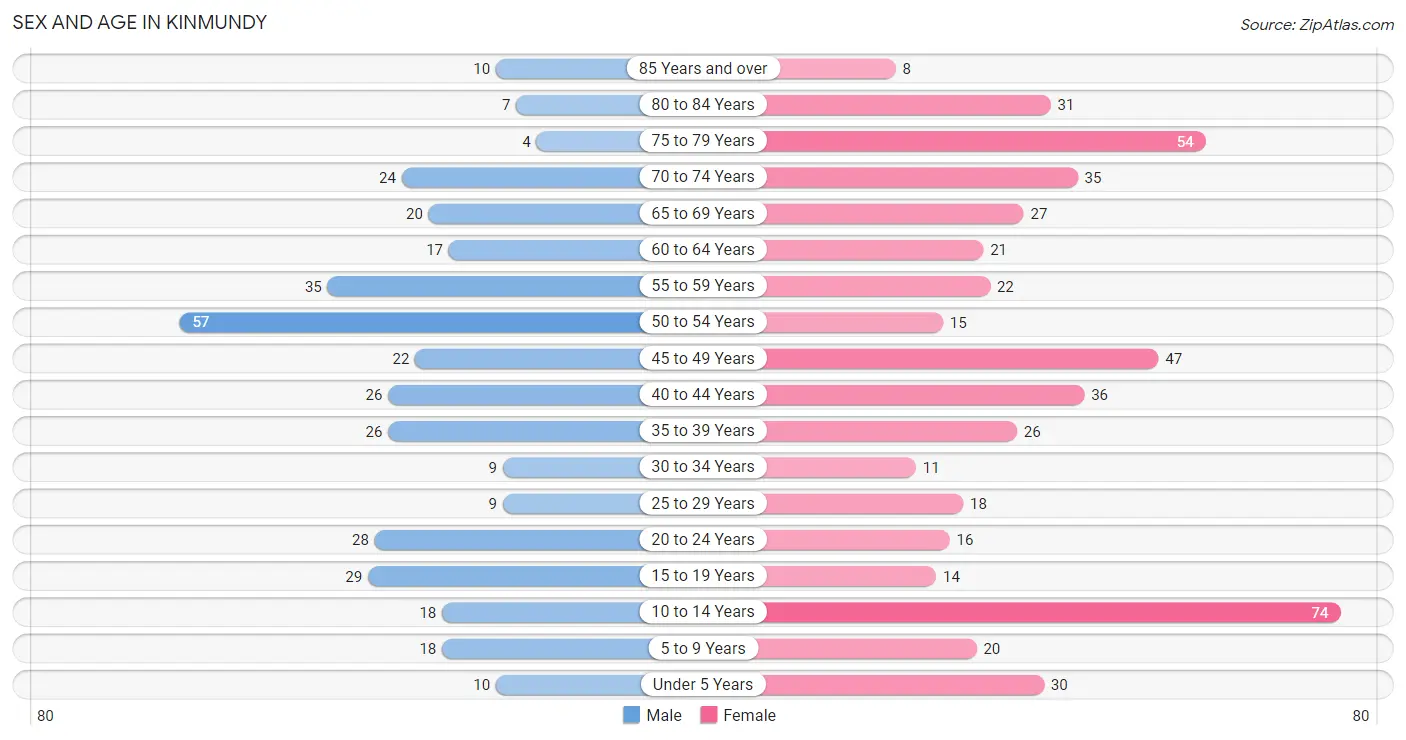
| Age Bracket | Male | Female |
| Under 5 Years | 10 (2.7%) | 30 (5.9%) |
| 5 to 9 Years | 18 (4.9%) | 20 (4.0%) |
| 10 to 14 Years | 18 (4.9%) | 74 (14.6%) |
| 15 to 19 Years | 29 (7.9%) | 14 (2.8%) |
| 20 to 24 Years | 28 (7.6%) | 16 (3.2%) |
| 25 to 29 Years | 9 (2.4%) | 18 (3.6%) |
| 30 to 34 Years | 9 (2.4%) | 11 (2.2%) |
| 35 to 39 Years | 26 (7.0%) | 26 (5.1%) |
| 40 to 44 Years | 26 (7.0%) | 36 (7.1%) |
| 45 to 49 Years | 22 (6.0%) | 47 (9.3%) |
| 50 to 54 Years | 57 (15.4%) | 15 (3.0%) |
| 55 to 59 Years | 35 (9.5%) | 22 (4.4%) |
| 60 to 64 Years | 17 (4.6%) | 21 (4.2%) |
| 65 to 69 Years | 20 (5.4%) | 27 (5.3%) |
| 70 to 74 Years | 24 (6.5%) | 35 (6.9%) |
| 75 to 79 Years | 4 (1.1%) | 54 (10.7%) |
| 80 to 84 Years | 7 (1.9%) | 31 (6.1%) |
| 85 Years and over | 10 (2.7%) | 8 (1.6%) |
| Total | 369 (100.0%) | 505 (100.0%) |
Families and Households in Kinmundy
Median Family Size in Kinmundy
The median family size in Kinmundy is 3.03 persons per family, with married-couple families (122 | 62.9%) accounting for the largest median family size of 3.32 persons per family. On the other hand, single male/father families (10 | 5.1%) represent the smallest median family size with 2.00 persons per family.
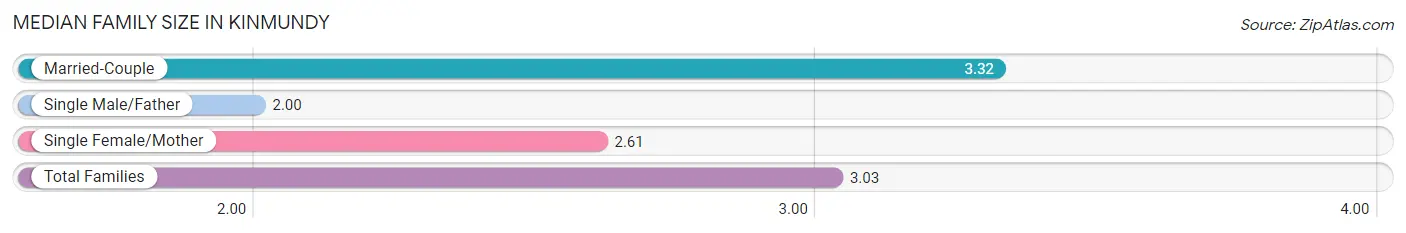
| Family Type | # Families | Family Size |
| Married-Couple | 122 (62.9%) | 3.32 |
| Single Male/Father | 10 (5.1%) | 2.00 |
| Single Female/Mother | 62 (32.0%) | 2.61 |
| Total Families | 194 (100.0%) | 3.03 |
Median Household Size in Kinmundy
The median household size in Kinmundy is 2.12 persons per household, with married-couple households (122 | 29.5%) accounting for the largest median household size of 3.4 persons per household. non-family households (219 | 53.0%) represent the smallest median household size with 1.11 persons per household.
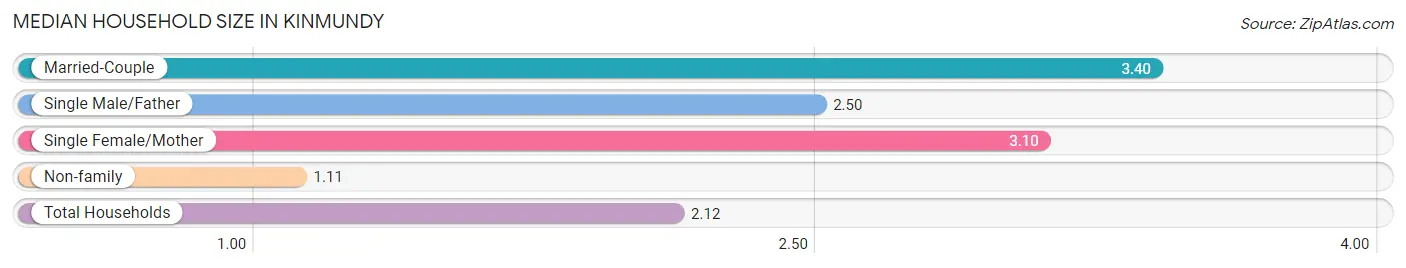
| Household Type | # Households | Household Size |
| Married-Couple | 122 (29.5%) | 3.40 |
| Single Male/Father | 10 (2.4%) | 2.50 |
| Single Female/Mother | 62 (15.0%) | 3.10 |
| Non-family | 219 (53.0%) | 1.11 |
| Total Households | 413 (100.0%) | 2.12 |
Household Size by Marriage Status in Kinmundy
Out of a total of 413 households in Kinmundy, 194 (47.0%) are family households, while 219 (53.0%) are nonfamily households. The most numerous type of family households are 2-person households, comprising 98, and the most common type of nonfamily households are 1-person households, comprising 204.
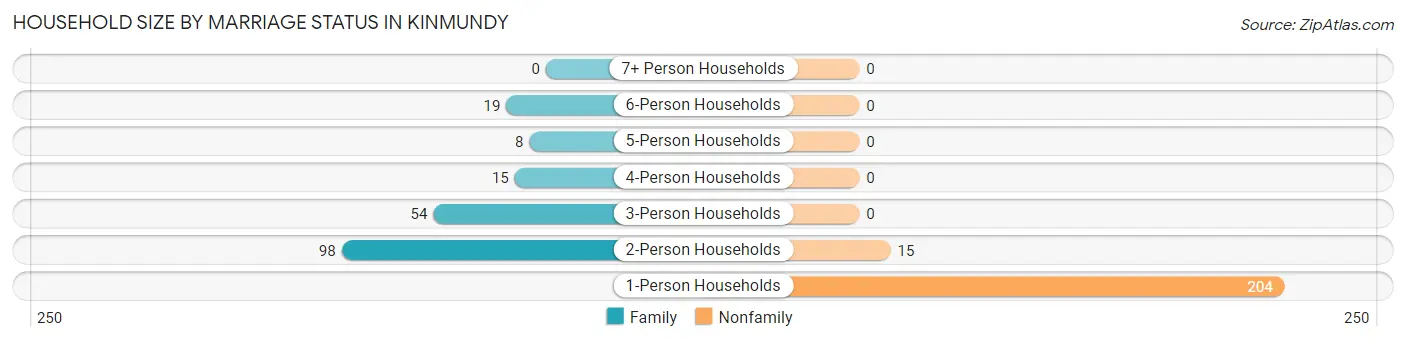
| Household Size | Family Households | Nonfamily Households |
| 1-Person Households | - | 204 (49.4%) |
| 2-Person Households | 98 (23.7%) | 15 (3.6%) |
| 3-Person Households | 54 (13.1%) | 0 (0.0%) |
| 4-Person Households | 15 (3.6%) | 0 (0.0%) |
| 5-Person Households | 8 (1.9%) | 0 (0.0%) |
| 6-Person Households | 19 (4.6%) | 0 (0.0%) |
| 7+ Person Households | 0 (0.0%) | 0 (0.0%) |
| Total | 194 (47.0%) | 219 (53.0%) |
Female Fertility in Kinmundy
Fertility by Age in Kinmundy
Average fertility rate in Kinmundy is 143.0 births per 1,000 women. Women in the age bracket of 20 to 34 years have the highest fertility rate with 311.0 births per 1,000 women. Women in the age bracket of 20 to 34 years acount for 58.3% of all women with births.
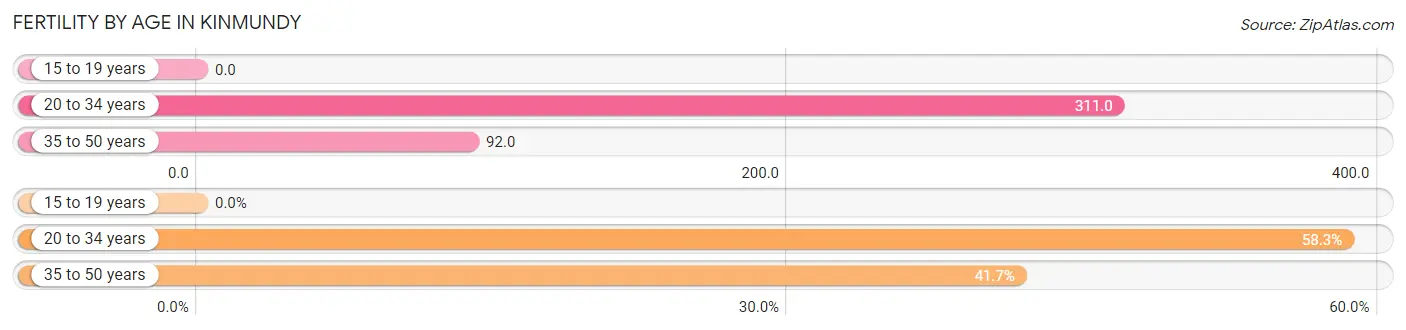
| Age Bracket | Women with Births | Births / 1,000 Women |
| 15 to 19 years | 0 (0.0%) | 0.0 |
| 20 to 34 years | 14 (58.3%) | 311.0 |
| 35 to 50 years | 10 (41.7%) | 92.0 |
| Total | 24 (100.0%) | 143.0 |
Fertility by Age by Marriage Status in Kinmundy
58.3% of women with births (24) in Kinmundy are married. The highest percentage of unmarried women with births falls into 20 to 34 years age bracket with 71.4% of them unmarried at the time of birth, while the lowest percentage of unmarried women with births belong to 35 to 50 years age bracket with 0.0% of them unmarried.
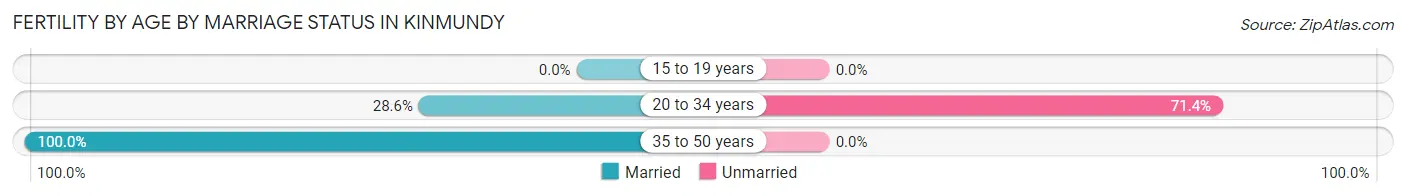
| Age Bracket | Married | Unmarried |
| 15 to 19 years | 0 (0.0%) | 0 (0.0%) |
| 20 to 34 years | 4 (28.6%) | 10 (71.4%) |
| 35 to 50 years | 10 (100.0%) | 0 (0.0%) |
| Total | 14 (58.3%) | 10 (41.7%) |
Fertility by Education in Kinmundy
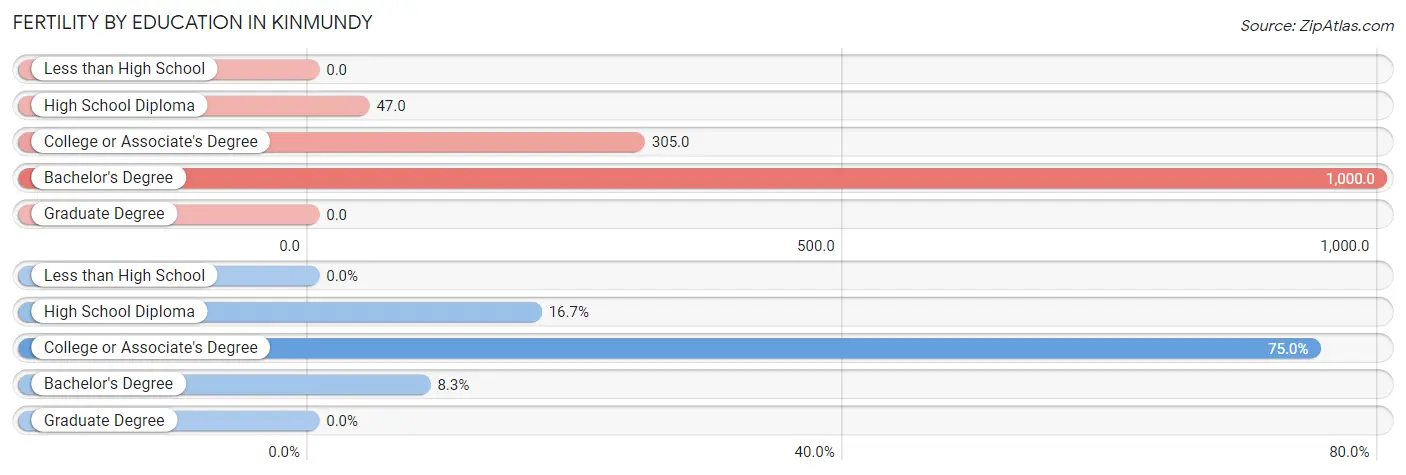
| Educational Attainment | Women with Births | Births / 1,000 Women |
| Less than High School | 0 (0.0%) | 0.0 |
| High School Diploma | 4 (16.7%) | 47.0 |
| College or Associate's Degree | 18 (75.0%) | 305.0 |
| Bachelor's Degree | 2 (8.3%) | 1,000.0 |
| Graduate Degree | 0 (0.0%) | 0.0 |
| Total | 24 (100.0%) | 143.0 |
Fertility by Education by Marriage Status in Kinmundy
41.7% of women with births in Kinmundy are unmarried. Women with the educational attainment of high school diploma are most likely to be married with 100.0% of them married at childbirth, while women with the educational attainment of college or associate's degree are least likely to be married with 55.6% of them unmarried at childbirth.
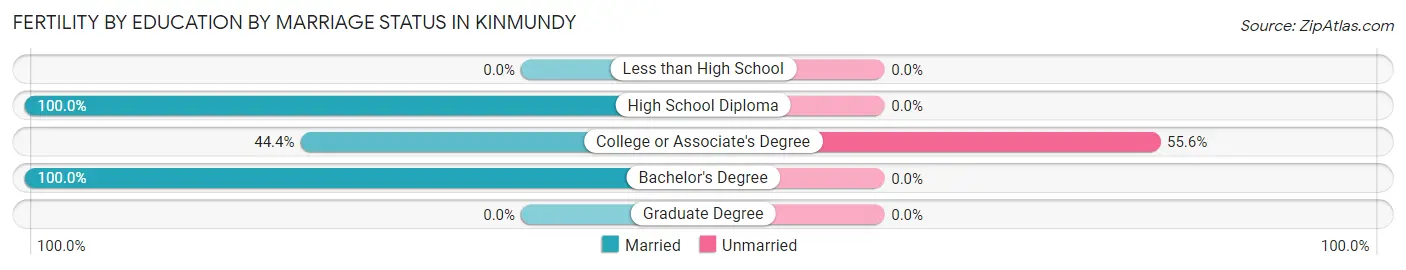
| Educational Attainment | Married | Unmarried |
| Less than High School | 0 (0.0%) | 0 (0.0%) |
| High School Diploma | 4 (100.0%) | 0 (0.0%) |
| College or Associate's Degree | 8 (44.4%) | 10 (55.6%) |
| Bachelor's Degree | 2 (100.0%) | 0 (0.0%) |
| Graduate Degree | 0 (0.0%) | 0 (0.0%) |
| Total | 14 (58.3%) | 10 (41.7%) |
Employment Characteristics in Kinmundy
Employment by Class of Employer in Kinmundy
Among the 307 employed individuals in Kinmundy, private company employees (242 | 78.8%), not-for-profit organizations (20 | 6.5%), and self-employed (not incorporated) (17 | 5.5%) make up the most common classes of employment.
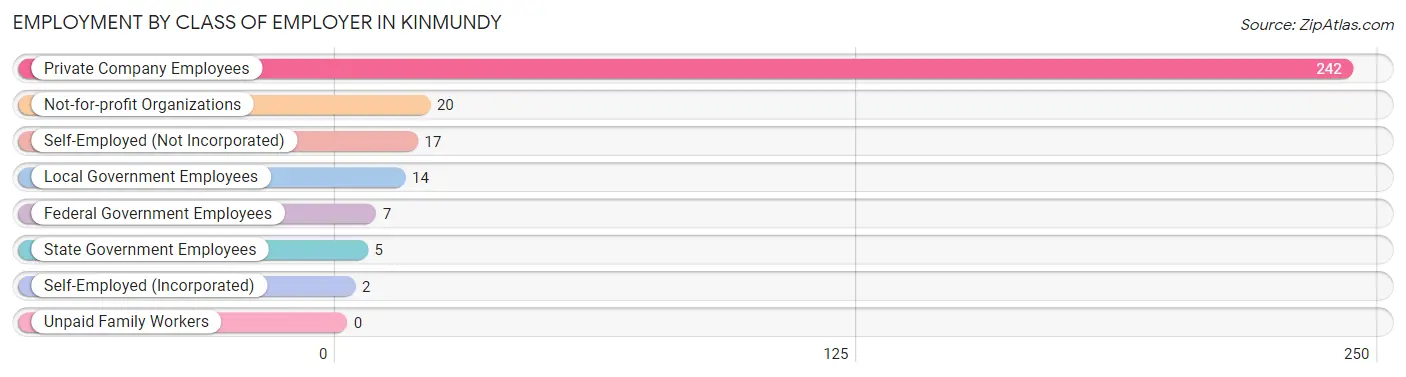
| Employer Class | # Employees | % Employees |
| Private Company Employees | 242 | 78.8% |
| Self-Employed (Incorporated) | 2 | 0.6% |
| Self-Employed (Not Incorporated) | 17 | 5.5% |
| Not-for-profit Organizations | 20 | 6.5% |
| Local Government Employees | 14 | 4.6% |
| State Government Employees | 5 | 1.6% |
| Federal Government Employees | 7 | 2.3% |
| Unpaid Family Workers | 0 | 0.0% |
| Total | 307 | 100.0% |
Employment Status by Age in Kinmundy
According to the labor force statistics for Kinmundy, out of the total population over 16 years of age (698), 51.6% or 360 individuals are in the labor force, with 14.9% or 54 of them unemployed. The age group with the highest labor force participation rate is 30 to 34 years, with 100.0% or 20 individuals in the labor force. Within the labor force, the 16 to 19 years age range has the highest percentage of unemployed individuals, with 30.3% or 10 of them being unemployed.
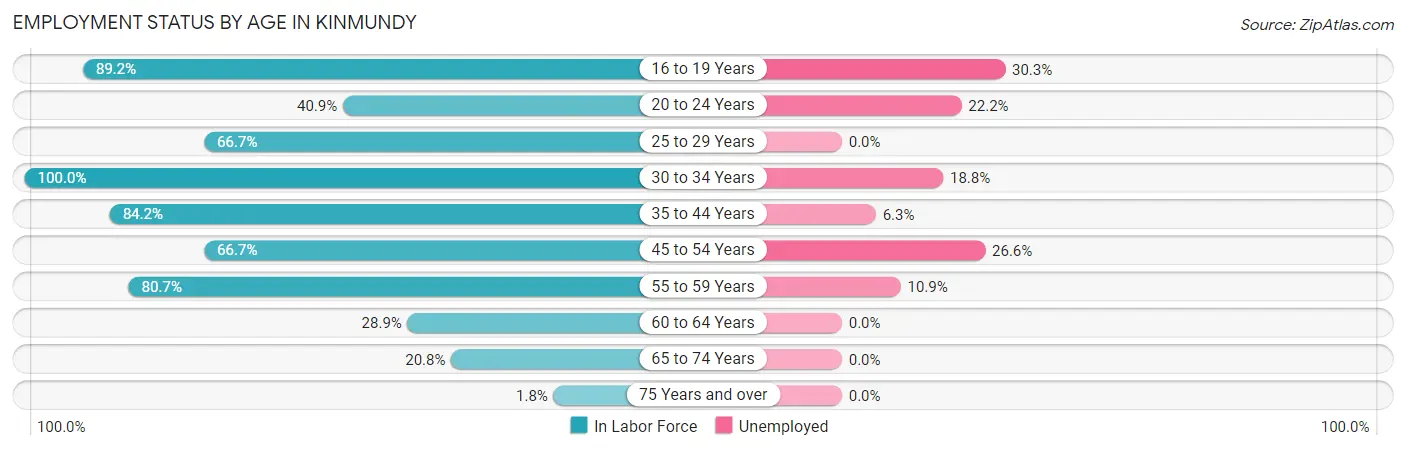
| Age Bracket | In Labor Force | Unemployed |
| 16 to 19 Years | 33 (89.2%) | 10 (30.3%) |
| 20 to 24 Years | 18 (40.9%) | 4 (22.2%) |
| 25 to 29 Years | 18 (66.7%) | 0 (0.0%) |
| 30 to 34 Years | 20 (100.0%) | 4 (18.8%) |
| 35 to 44 Years | 96 (84.2%) | 6 (6.3%) |
| 45 to 54 Years | 94 (66.7%) | 25 (26.6%) |
| 55 to 59 Years | 46 (80.7%) | 5 (10.9%) |
| 60 to 64 Years | 11 (28.9%) | 0 (0.0%) |
| 65 to 74 Years | 22 (20.8%) | 0 (0.0%) |
| 75 Years and over | 2 (1.8%) | 0 (0.0%) |
| Total | 360 (51.6%) | 54 (14.9%) |
Employment Status by Educational Attainment in Kinmundy
According to labor force statistics for Kinmundy, 71.8% of individuals (285) out of the total population between 25 and 64 years of age (397) are in the labor force, with 13.9% or 40 of them being unemployed. The group with the highest labor force participation rate are those with the educational attainment of bachelor's degree or higher, with 100.0% or 11 individuals in the labor force. Within the labor force, individuals with high school diploma education have the highest percentage of unemployment, with 18.9% or 30 of them being unemployed.
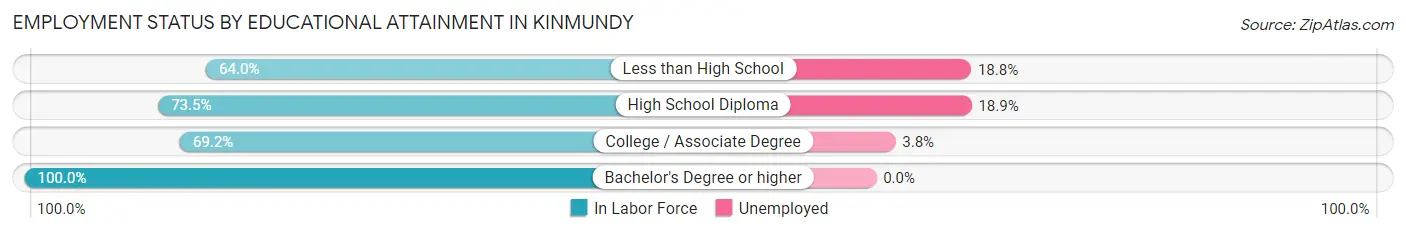
| Educational Attainment | In Labor Force | Unemployed |
| Less than High School | 32 (64.0%) | 9 (18.8%) |
| High School Diploma | 161 (73.5%) | 41 (18.9%) |
| College / Associate Degree | 81 (69.2%) | 4 (3.8%) |
| Bachelor's Degree or higher | 11 (100.0%) | 0 (0.0%) |
| Total | 285 (71.8%) | 55 (13.9%) |
Employment Occupations by Sex in Kinmundy
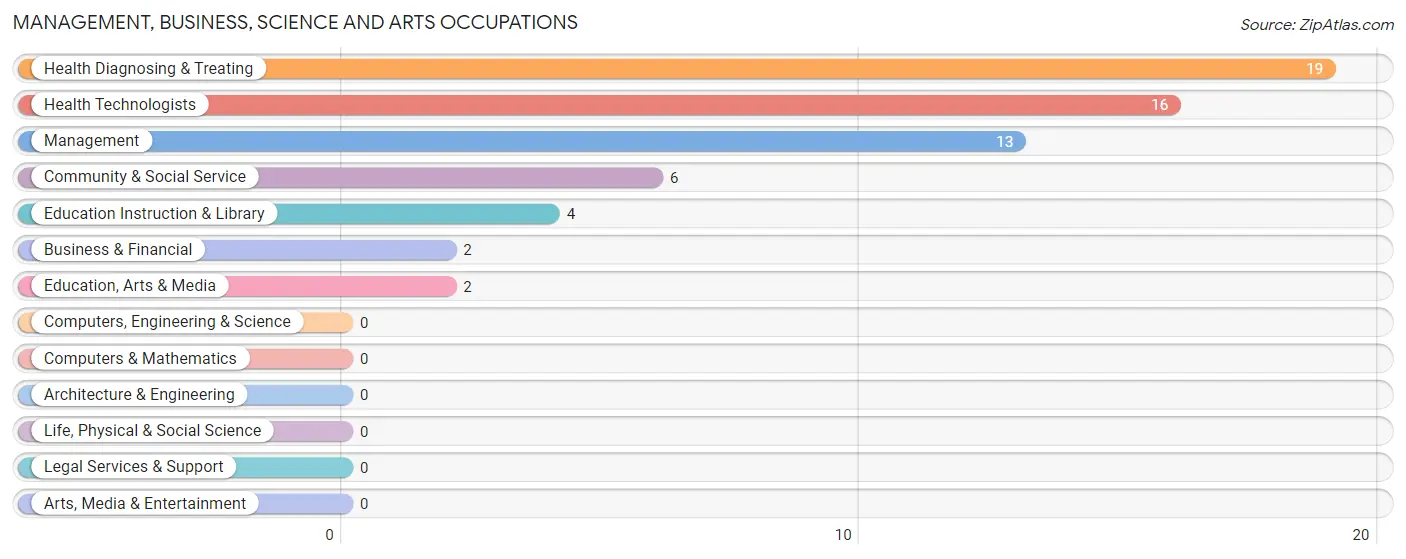
Management, Business, Science and Arts Occupations
The most common Management, Business, Science and Arts occupations in Kinmundy are Health Diagnosing & Treating (19 | 6.3%), Health Technologists (16 | 5.3%), Management (13 | 4.3%), Community & Social Service (6 | 2.0%), and Education Instruction & Library (4 | 1.3%).
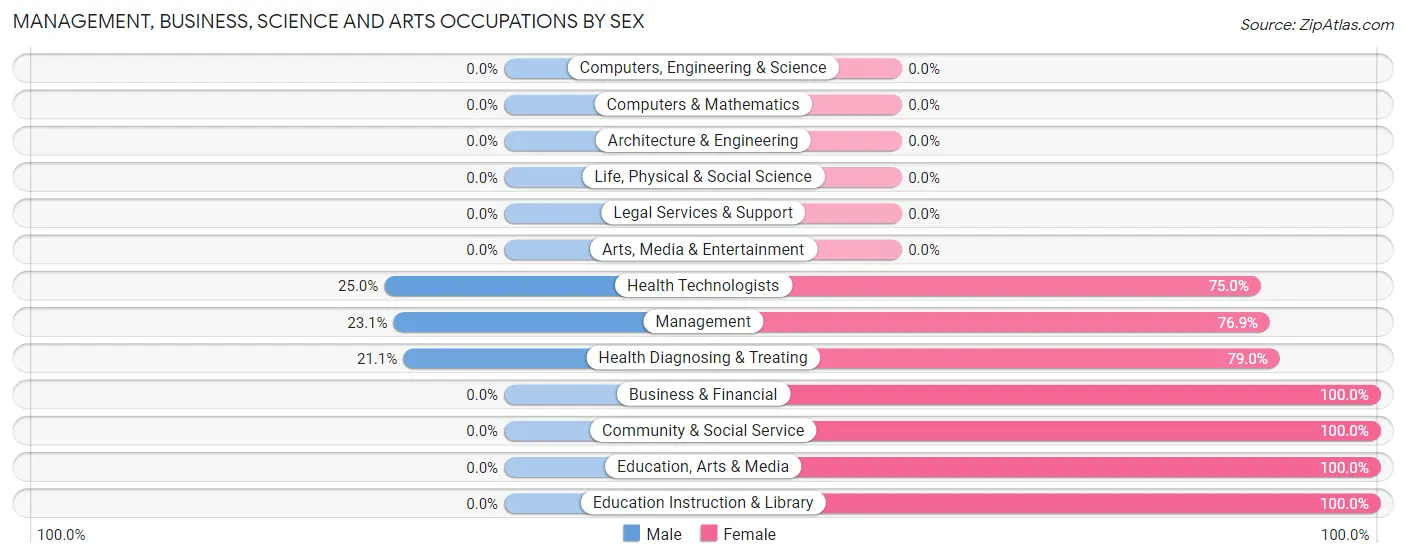
Management, Business, Science and Arts Occupations by Sex
Within the Management, Business, Science and Arts occupations in Kinmundy, the most male-oriented occupations are Health Technologists (25.0%), Management (23.1%), and Health Diagnosing & Treating (21.0%), while the most female-oriented occupations are Business & Financial (100.0%), Community & Social Service (100.0%), and Education, Arts & Media (100.0%).
| Occupation | Male | Female |
| Management | 3 (23.1%) | 10 (76.9%) |
| Business & Financial | 0 (0.0%) | 2 (100.0%) |
| Computers, Engineering & Science | 0 (0.0%) | 0 (0.0%) |
| Computers & Mathematics | 0 (0.0%) | 0 (0.0%) |
| Architecture & Engineering | 0 (0.0%) | 0 (0.0%) |
| Life, Physical & Social Science | 0 (0.0%) | 0 (0.0%) |
| Community & Social Service | 0 (0.0%) | 6 (100.0%) |
| Education, Arts & Media | 0 (0.0%) | 2 (100.0%) |
| Legal Services & Support | 0 (0.0%) | 0 (0.0%) |
| Education Instruction & Library | 0 (0.0%) | 4 (100.0%) |
| Arts, Media & Entertainment | 0 (0.0%) | 0 (0.0%) |
| Health Diagnosing & Treating | 4 (21.0%) | 15 (78.9%) |
| Health Technologists | 4 (25.0%) | 12 (75.0%) |
| Total (Category) | 7 (17.5%) | 33 (82.5%) |
| Total (Overall) | 151 (49.8%) | 152 (50.2%) |
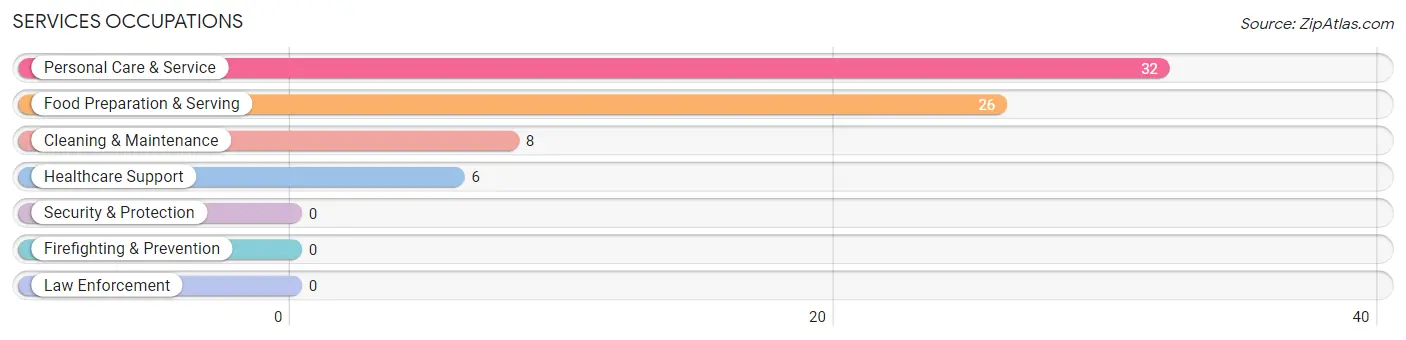
Services Occupations
The most common Services occupations in Kinmundy are Personal Care & Service (32 | 10.6%), Food Preparation & Serving (26 | 8.6%), Cleaning & Maintenance (8 | 2.6%), and Healthcare Support (6 | 2.0%).
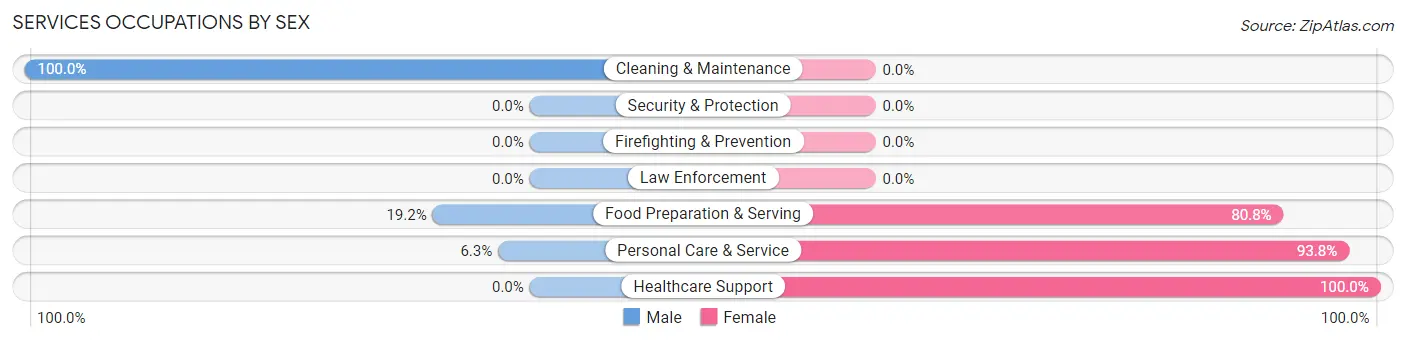
Services Occupations by Sex
Within the Services occupations in Kinmundy, the most male-oriented occupations are Cleaning & Maintenance (100.0%), Food Preparation & Serving (19.2%), and Personal Care & Service (6.2%), while the most female-oriented occupations are Healthcare Support (100.0%), Personal Care & Service (93.8%), and Food Preparation & Serving (80.8%).
| Occupation | Male | Female |
| Healthcare Support | 0 (0.0%) | 6 (100.0%) |
| Security & Protection | 0 (0.0%) | 0 (0.0%) |
| Firefighting & Prevention | 0 (0.0%) | 0 (0.0%) |
| Law Enforcement | 0 (0.0%) | 0 (0.0%) |
| Food Preparation & Serving | 5 (19.2%) | 21 (80.8%) |
| Cleaning & Maintenance | 8 (100.0%) | 0 (0.0%) |
| Personal Care & Service | 2 (6.2%) | 30 (93.8%) |
| Total (Category) | 15 (20.8%) | 57 (79.2%) |
| Total (Overall) | 151 (49.8%) | 152 (50.2%) |
Sales and Office Occupations
The most common Sales and Office occupations in Kinmundy are Sales & Related (36 | 11.9%), and Office & Administration (6 | 2.0%).
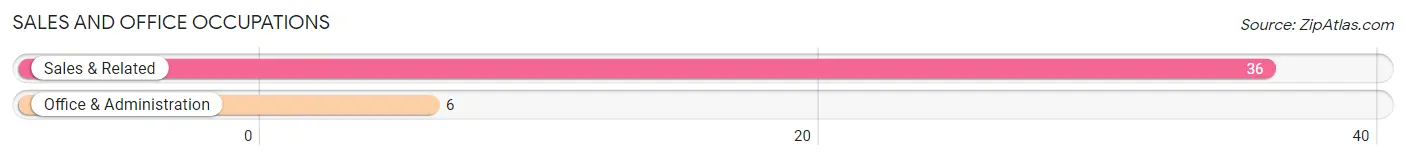
Sales and Office Occupations by Sex
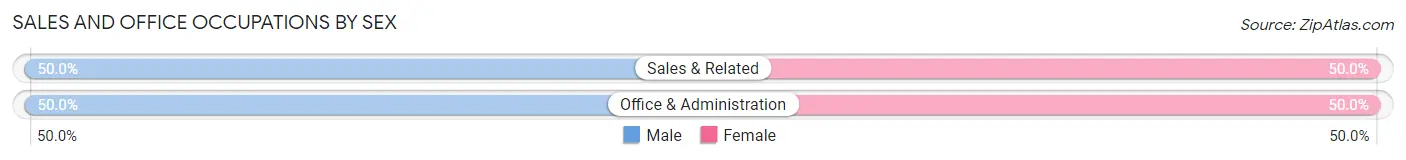
| Occupation | Male | Female |
| Sales & Related | 18 (50.0%) | 18 (50.0%) |
| Office & Administration | 3 (50.0%) | 3 (50.0%) |
| Total (Category) | 21 (50.0%) | 21 (50.0%) |
| Total (Overall) | 151 (49.8%) | 152 (50.2%) |
Natural Resources, Construction and Maintenance Occupations
The most common Natural Resources, Construction and Maintenance occupations in Kinmundy are Farming, Fishing & Forestry (20 | 6.6%), Construction & Extraction (14 | 4.6%), and Installation, Maintenance & Repair (2 | 0.7%).
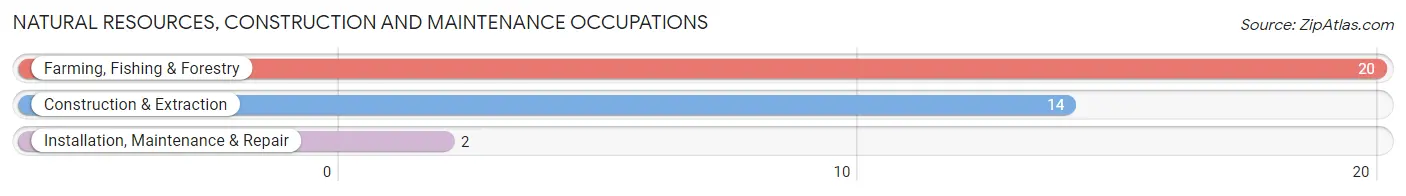
Natural Resources, Construction and Maintenance Occupations by Sex
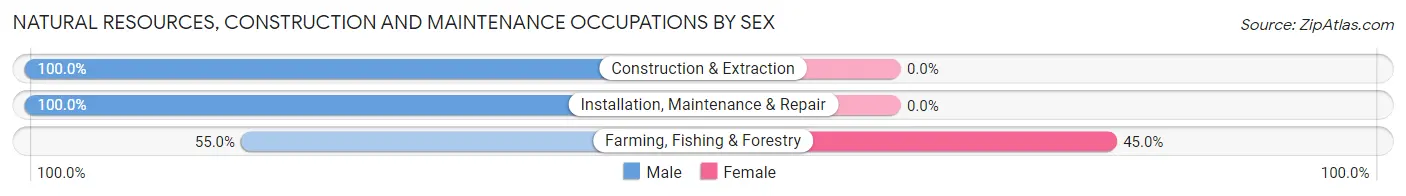
| Occupation | Male | Female |
| Farming, Fishing & Forestry | 11 (55.0%) | 9 (45.0%) |
| Construction & Extraction | 14 (100.0%) | 0 (0.0%) |
| Installation, Maintenance & Repair | 2 (100.0%) | 0 (0.0%) |
| Total (Category) | 27 (75.0%) | 9 (25.0%) |
| Total (Overall) | 151 (49.8%) | 152 (50.2%) |
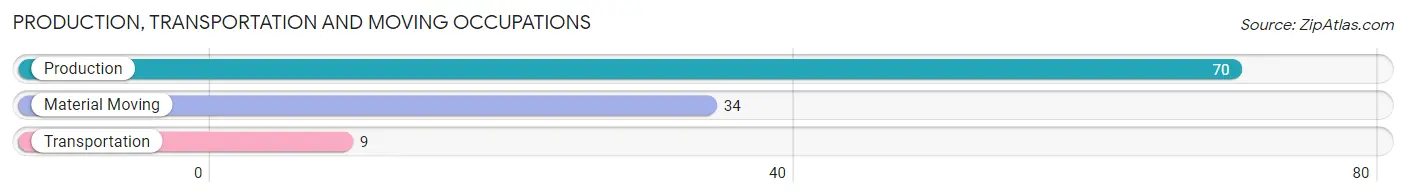
Production, Transportation and Moving Occupations
The most common Production, Transportation and Moving occupations in Kinmundy are Production (70 | 23.1%), Material Moving (34 | 11.2%), and Transportation (9 | 3.0%).
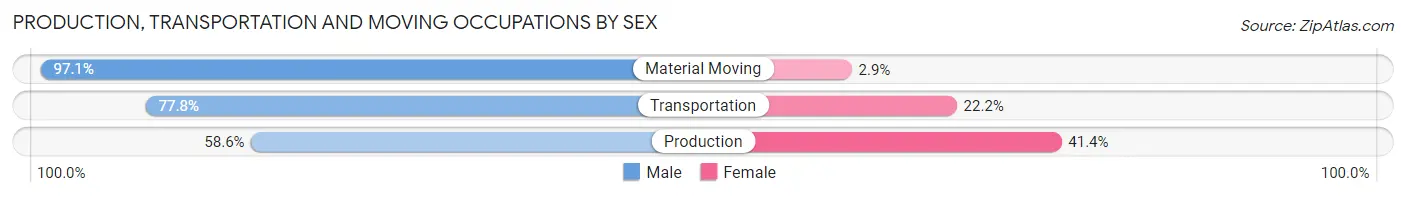
Production, Transportation and Moving Occupations by Sex
| Occupation | Male | Female |
| Production | 41 (58.6%) | 29 (41.4%) |
| Transportation | 7 (77.8%) | 2 (22.2%) |
| Material Moving | 33 (97.1%) | 1 (2.9%) |
| Total (Category) | 81 (71.7%) | 32 (28.3%) |
| Total (Overall) | 151 (49.8%) | 152 (50.2%) |
Employment Industries by Sex in Kinmundy
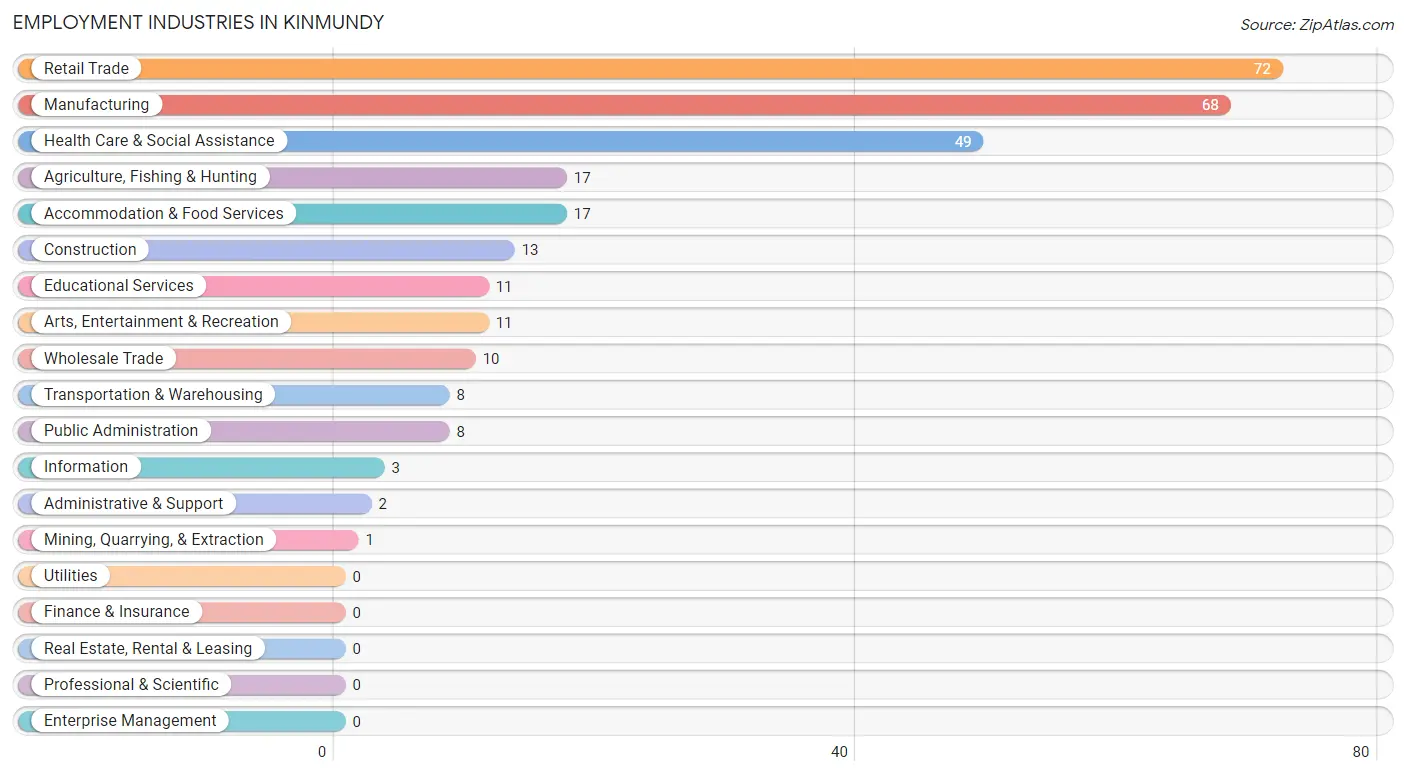
Employment Industries in Kinmundy
The major employment industries in Kinmundy include Retail Trade (72 | 23.8%), Manufacturing (68 | 22.4%), Health Care & Social Assistance (49 | 16.2%), Agriculture, Fishing & Hunting (17 | 5.6%), and Accommodation & Food Services (17 | 5.6%).
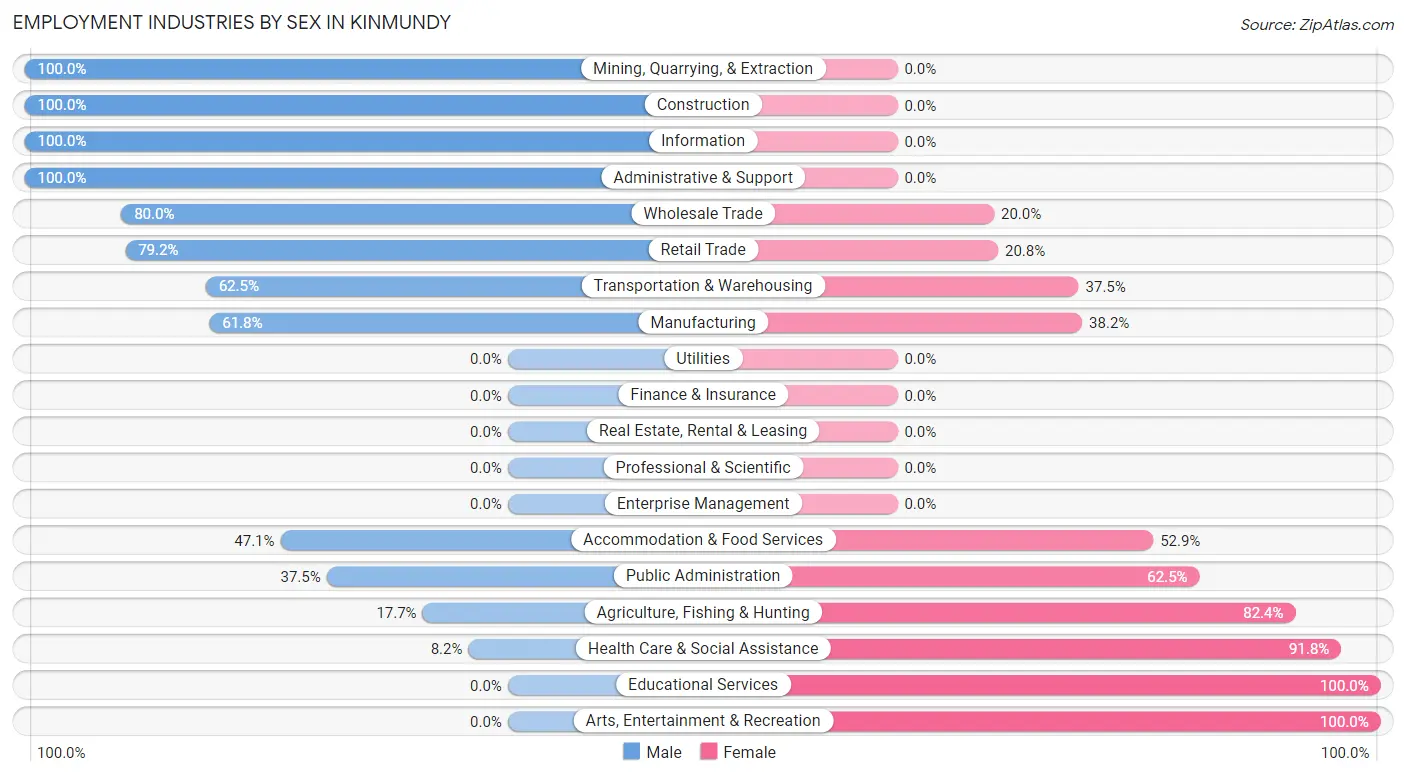
Employment Industries by Sex in Kinmundy
The Kinmundy industries that see more men than women are Mining, Quarrying, & Extraction (100.0%), Construction (100.0%), and Information (100.0%), whereas the industries that tend to have a higher number of women are Educational Services (100.0%), Arts, Entertainment & Recreation (100.0%), and Health Care & Social Assistance (91.8%).
| Industry | Male | Female |
| Agriculture, Fishing & Hunting | 3 (17.6%) | 14 (82.4%) |
| Mining, Quarrying, & Extraction | 1 (100.0%) | 0 (0.0%) |
| Construction | 13 (100.0%) | 0 (0.0%) |
| Manufacturing | 42 (61.8%) | 26 (38.2%) |
| Wholesale Trade | 8 (80.0%) | 2 (20.0%) |
| Retail Trade | 57 (79.2%) | 15 (20.8%) |
| Transportation & Warehousing | 5 (62.5%) | 3 (37.5%) |
| Utilities | 0 (0.0%) | 0 (0.0%) |
| Information | 3 (100.0%) | 0 (0.0%) |
| Finance & Insurance | 0 (0.0%) | 0 (0.0%) |
| Real Estate, Rental & Leasing | 0 (0.0%) | 0 (0.0%) |
| Professional & Scientific | 0 (0.0%) | 0 (0.0%) |
| Enterprise Management | 0 (0.0%) | 0 (0.0%) |
| Administrative & Support | 2 (100.0%) | 0 (0.0%) |
| Educational Services | 0 (0.0%) | 11 (100.0%) |
| Health Care & Social Assistance | 4 (8.2%) | 45 (91.8%) |
| Arts, Entertainment & Recreation | 0 (0.0%) | 11 (100.0%) |
| Accommodation & Food Services | 8 (47.1%) | 9 (52.9%) |
| Public Administration | 3 (37.5%) | 5 (62.5%) |
| Total | 151 (49.8%) | 152 (50.2%) |
Education in Kinmundy
School Enrollment in Kinmundy
The most common levels of schooling among the 166 students in Kinmundy are middle school (79 | 47.6%), high school (33 | 19.9%), and elementary school (27 | 16.3%).
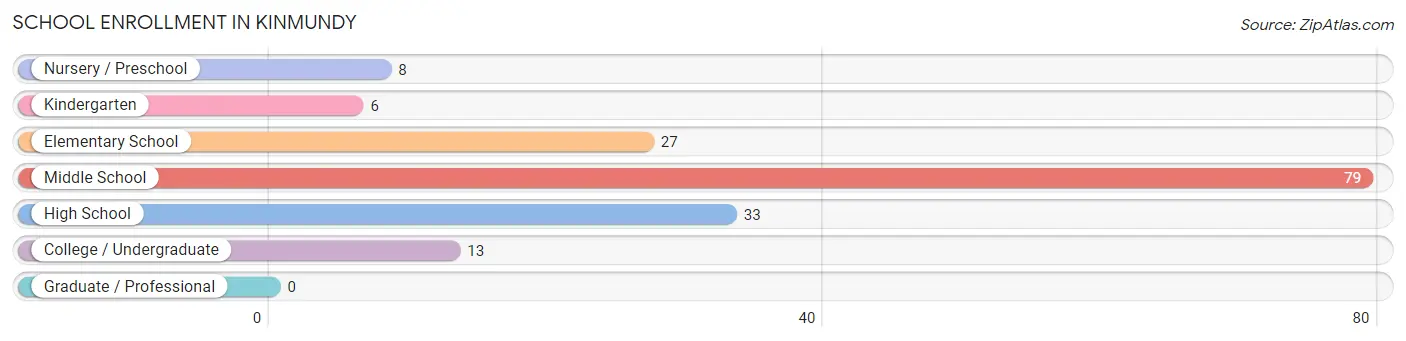
| School Level | # Students | % Students |
| Nursery / Preschool | 8 | 4.8% |
| Kindergarten | 6 | 3.6% |
| Elementary School | 27 | 16.3% |
| Middle School | 79 | 47.6% |
| High School | 33 | 19.9% |
| College / Undergraduate | 13 | 7.8% |
| Graduate / Professional | 0 | 0.0% |
| Total | 166 | 100.0% |
School Enrollment by Age by Funding Source in Kinmundy
Out of a total of 166 students who are enrolled in schools in Kinmundy, 18 (10.8%) attend a private institution, while the remaining 148 (89.2%) are enrolled in public schools. The age group of 20 to 24 year olds has the highest likelihood of being enrolled in private schools, with 7 (100.0% in the age bracket) enrolled. Conversely, the age group of 3 to 4 year olds has the lowest likelihood of being enrolled in a private school, with 4 (100.0% in the age bracket) attending a public institution.
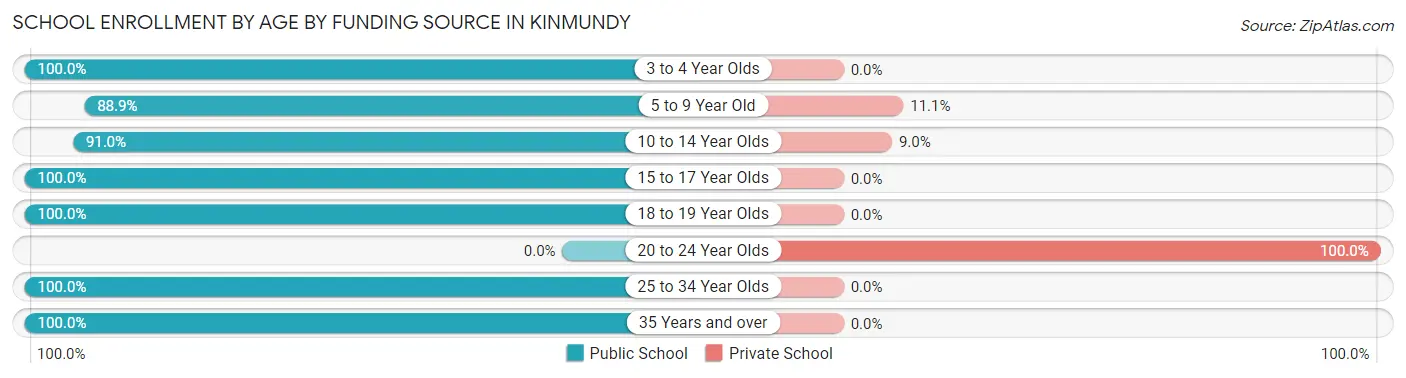
| Age Bracket | Public School | Private School |
| 3 to 4 Year Olds | 4 (100.0%) | 0 (0.0%) |
| 5 to 9 Year Old | 24 (88.9%) | 3 (11.1%) |
| 10 to 14 Year Olds | 81 (91.0%) | 8 (9.0%) |
| 15 to 17 Year Olds | 26 (100.0%) | 0 (0.0%) |
| 18 to 19 Year Olds | 7 (100.0%) | 0 (0.0%) |
| 20 to 24 Year Olds | 0 (0.0%) | 7 (100.0%) |
| 25 to 34 Year Olds | 2 (100.0%) | 0 (0.0%) |
| 35 Years and over | 4 (100.0%) | 0 (0.0%) |
| Total | 148 (89.2%) | 18 (10.8%) |
Educational Attainment by Field of Study in Kinmundy
Education (17 | 38.6%), science & technology (9 | 20.4%), visual & performing arts (8 | 18.2%), engineering (4 | 9.1%), and business (4 | 9.1%) are the most common fields of study among 44 individuals in Kinmundy who have obtained a bachelor's degree or higher.
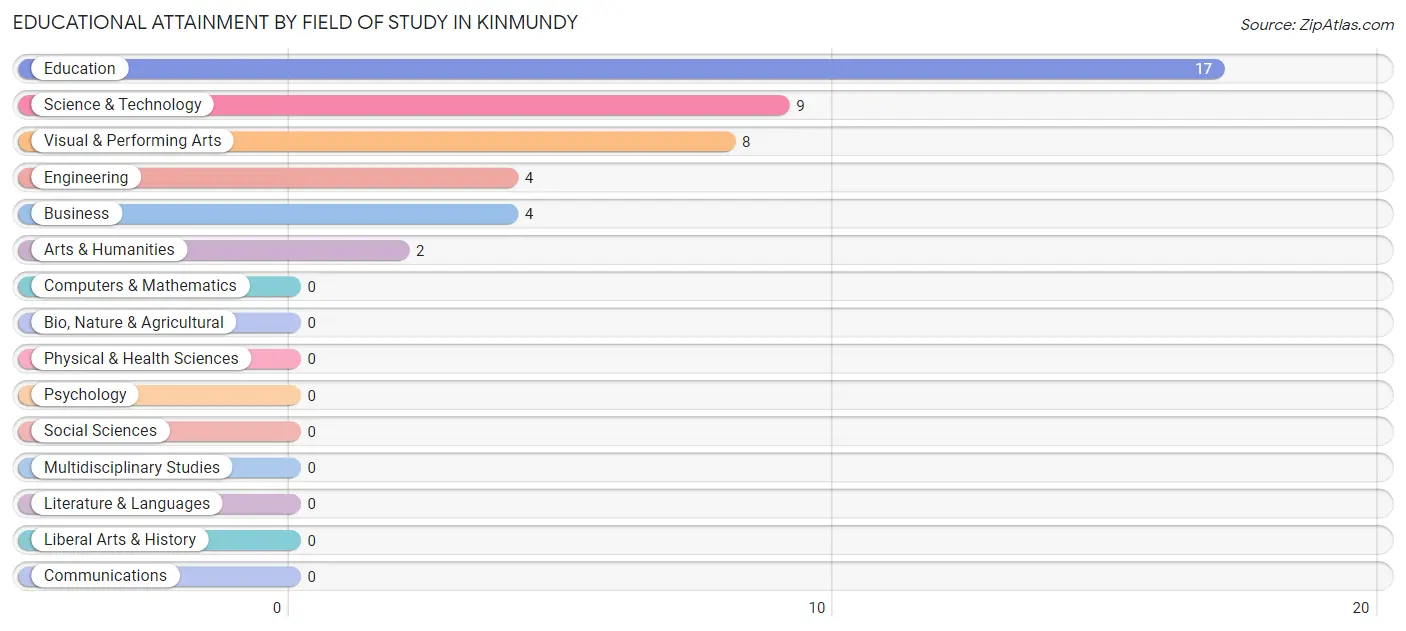
| Field of Study | # Graduates | % Graduates |
| Computers & Mathematics | 0 | 0.0% |
| Bio, Nature & Agricultural | 0 | 0.0% |
| Physical & Health Sciences | 0 | 0.0% |
| Psychology | 0 | 0.0% |
| Social Sciences | 0 | 0.0% |
| Engineering | 4 | 9.1% |
| Multidisciplinary Studies | 0 | 0.0% |
| Science & Technology | 9 | 20.4% |
| Business | 4 | 9.1% |
| Education | 17 | 38.6% |
| Literature & Languages | 0 | 0.0% |
| Liberal Arts & History | 0 | 0.0% |
| Visual & Performing Arts | 8 | 18.2% |
| Communications | 0 | 0.0% |
| Arts & Humanities | 2 | 4.5% |
| Total | 44 | 100.0% |
Transportation & Commute in Kinmundy
Vehicle Availability by Sex in Kinmundy
The most prevalent vehicle ownership categories in Kinmundy are males with 2 vehicles (53, accounting for 34.2%) and females with 2 vehicles (50, making up 34.9%).
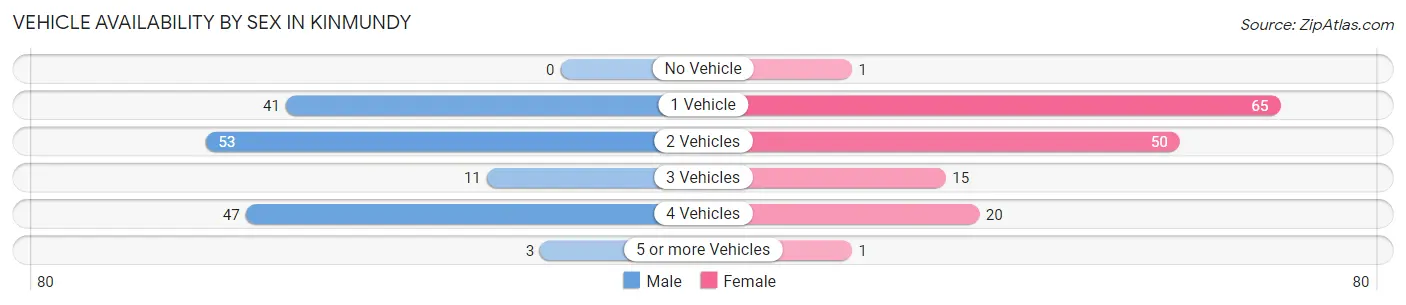
| Vehicles Available | Male | Female |
| No Vehicle | 0 (0.0%) | 1 (0.7%) |
| 1 Vehicle | 41 (26.5%) | 65 (42.8%) |
| 2 Vehicles | 53 (34.2%) | 50 (32.9%) |
| 3 Vehicles | 11 (7.1%) | 15 (9.9%) |
| 4 Vehicles | 47 (30.3%) | 20 (13.2%) |
| 5 or more Vehicles | 3 (1.9%) | 1 (0.7%) |
| Total | 155 (100.0%) | 152 (100.0%) |
Commute Time in Kinmundy
The most frequently occuring commute durations in Kinmundy are 30 to 34 minutes (81 commuters, 26.8%), 15 to 19 minutes (49 commuters, 16.2%), and 20 to 24 minutes (41 commuters, 13.6%).
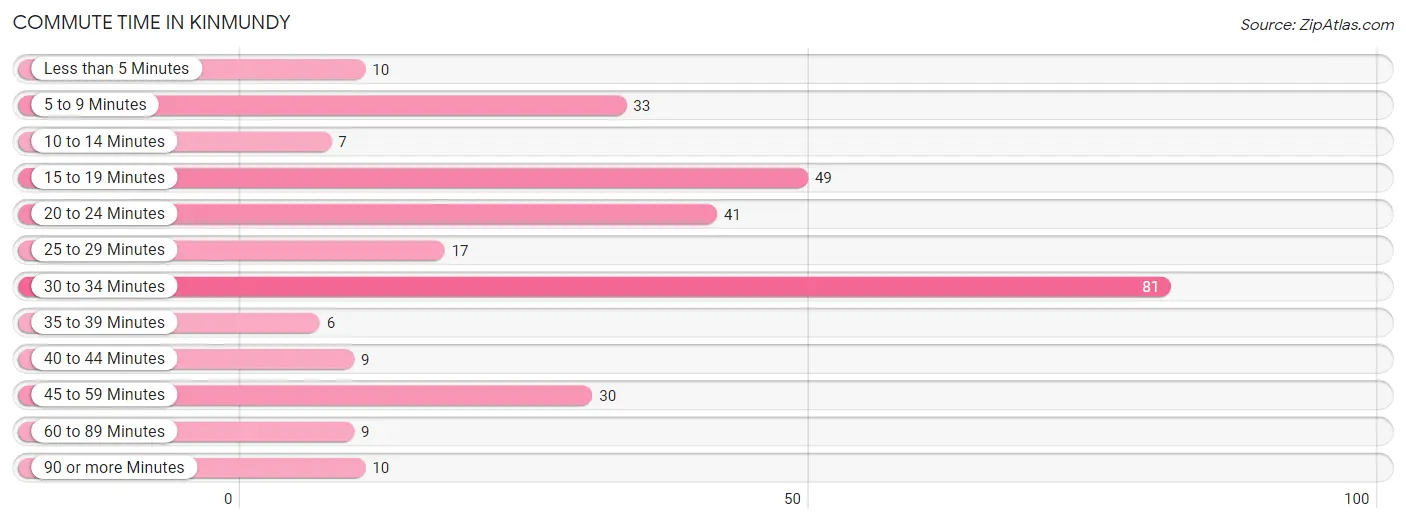
| Commute Time | # Commuters | % Commuters |
| Less than 5 Minutes | 10 | 3.3% |
| 5 to 9 Minutes | 33 | 10.9% |
| 10 to 14 Minutes | 7 | 2.3% |
| 15 to 19 Minutes | 49 | 16.2% |
| 20 to 24 Minutes | 41 | 13.6% |
| 25 to 29 Minutes | 17 | 5.6% |
| 30 to 34 Minutes | 81 | 26.8% |
| 35 to 39 Minutes | 6 | 2.0% |
| 40 to 44 Minutes | 9 | 3.0% |
| 45 to 59 Minutes | 30 | 9.9% |
| 60 to 89 Minutes | 9 | 3.0% |
| 90 or more Minutes | 10 | 3.3% |
Commute Time by Sex in Kinmundy
The most common commute times in Kinmundy are 30 to 34 minutes (63 commuters, 40.6%) for males and 15 to 19 minutes (34 commuters, 23.1%) for females.
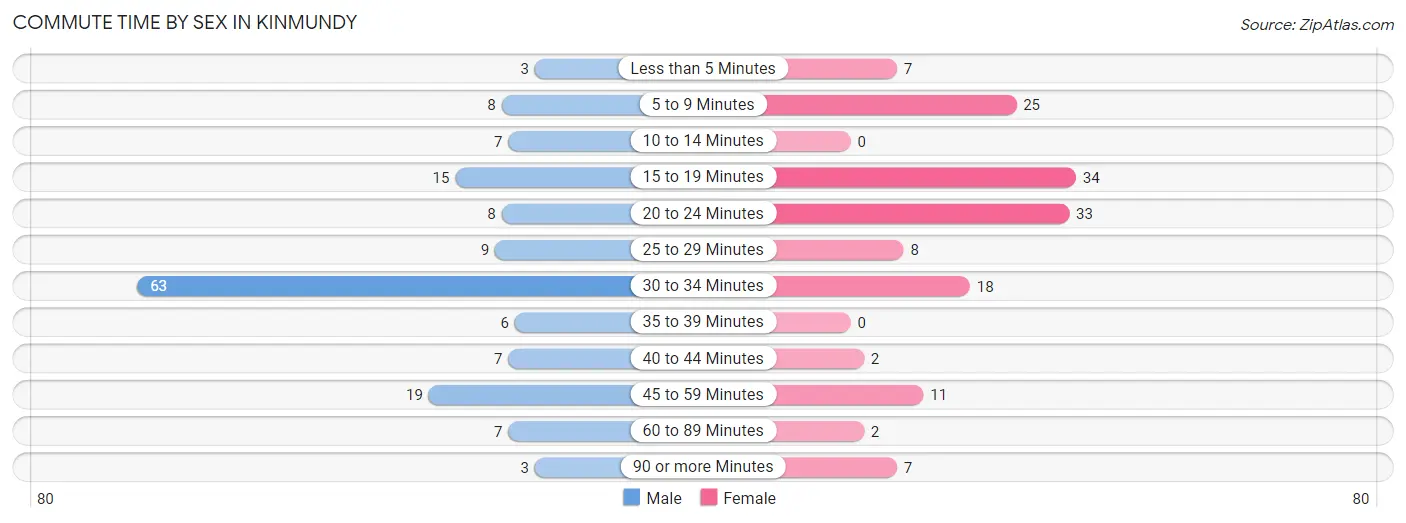
| Commute Time | Male | Female |
| Less than 5 Minutes | 3 (1.9%) | 7 (4.8%) |
| 5 to 9 Minutes | 8 (5.2%) | 25 (17.0%) |
| 10 to 14 Minutes | 7 (4.5%) | 0 (0.0%) |
| 15 to 19 Minutes | 15 (9.7%) | 34 (23.1%) |
| 20 to 24 Minutes | 8 (5.2%) | 33 (22.5%) |
| 25 to 29 Minutes | 9 (5.8%) | 8 (5.4%) |
| 30 to 34 Minutes | 63 (40.6%) | 18 (12.2%) |
| 35 to 39 Minutes | 6 (3.9%) | 0 (0.0%) |
| 40 to 44 Minutes | 7 (4.5%) | 2 (1.4%) |
| 45 to 59 Minutes | 19 (12.3%) | 11 (7.5%) |
| 60 to 89 Minutes | 7 (4.5%) | 2 (1.4%) |
| 90 or more Minutes | 3 (1.9%) | 7 (4.8%) |
Time of Departure to Work by Sex in Kinmundy
The most frequent times of departure to work in Kinmundy are 12:00 PM to 3:59 PM (53, 34.2%) for males and 5:30 AM to 5:59 AM (27, 18.4%) for females.
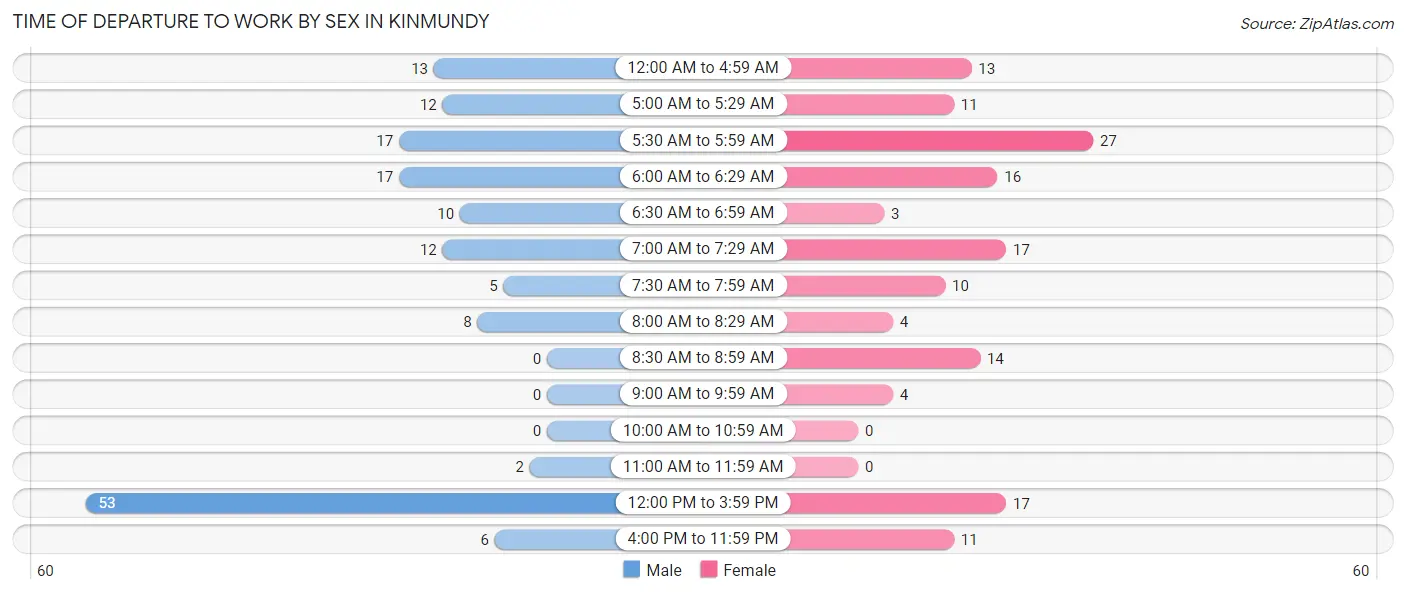
| Time of Departure | Male | Female |
| 12:00 AM to 4:59 AM | 13 (8.4%) | 13 (8.8%) |
| 5:00 AM to 5:29 AM | 12 (7.7%) | 11 (7.5%) |
| 5:30 AM to 5:59 AM | 17 (11.0%) | 27 (18.4%) |
| 6:00 AM to 6:29 AM | 17 (11.0%) | 16 (10.9%) |
| 6:30 AM to 6:59 AM | 10 (6.5%) | 3 (2.0%) |
| 7:00 AM to 7:29 AM | 12 (7.7%) | 17 (11.6%) |
| 7:30 AM to 7:59 AM | 5 (3.2%) | 10 (6.8%) |
| 8:00 AM to 8:29 AM | 8 (5.2%) | 4 (2.7%) |
| 8:30 AM to 8:59 AM | 0 (0.0%) | 14 (9.5%) |
| 9:00 AM to 9:59 AM | 0 (0.0%) | 4 (2.7%) |
| 10:00 AM to 10:59 AM | 0 (0.0%) | 0 (0.0%) |
| 11:00 AM to 11:59 AM | 2 (1.3%) | 0 (0.0%) |
| 12:00 PM to 3:59 PM | 53 (34.2%) | 17 (11.6%) |
| 4:00 PM to 11:59 PM | 6 (3.9%) | 11 (7.5%) |
| Total | 155 (100.0%) | 147 (100.0%) |
Housing Occupancy in Kinmundy
Occupancy by Ownership in Kinmundy
Of the total 413 dwellings in Kinmundy, owner-occupied units account for 309 (74.8%), while renter-occupied units make up 104 (25.2%).
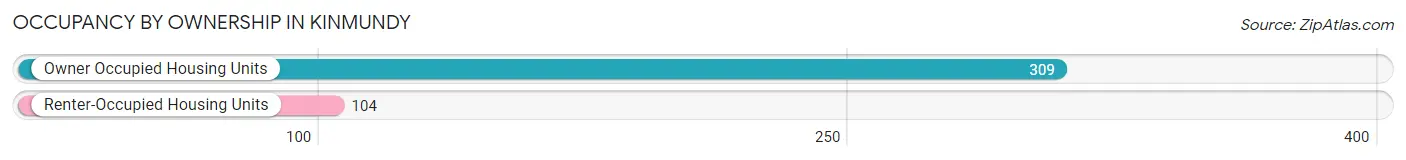
| Occupancy | # Housing Units | % Housing Units |
| Owner Occupied Housing Units | 309 | 74.8% |
| Renter-Occupied Housing Units | 104 | 25.2% |
| Total Occupied Housing Units | 413 | 100.0% |
Occupancy by Household Size in Kinmundy
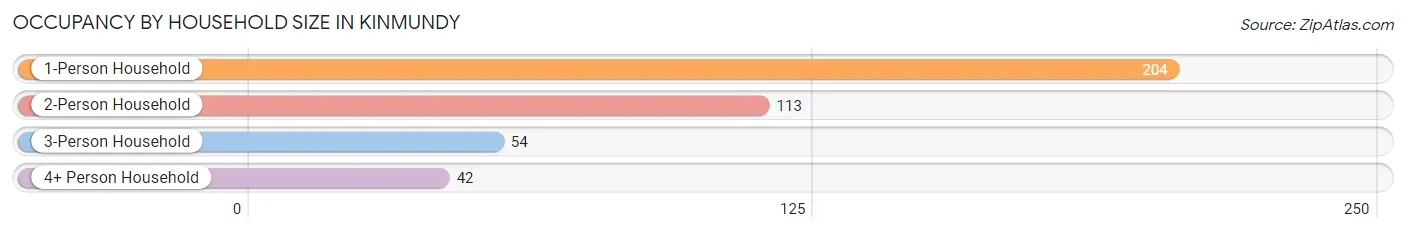
| Household Size | # Housing Units | % Housing Units |
| 1-Person Household | 204 | 49.4% |
| 2-Person Household | 113 | 27.4% |
| 3-Person Household | 54 | 13.1% |
| 4+ Person Household | 42 | 10.2% |
| Total Housing Units | 413 | 100.0% |
Occupancy by Ownership by Household Size in Kinmundy
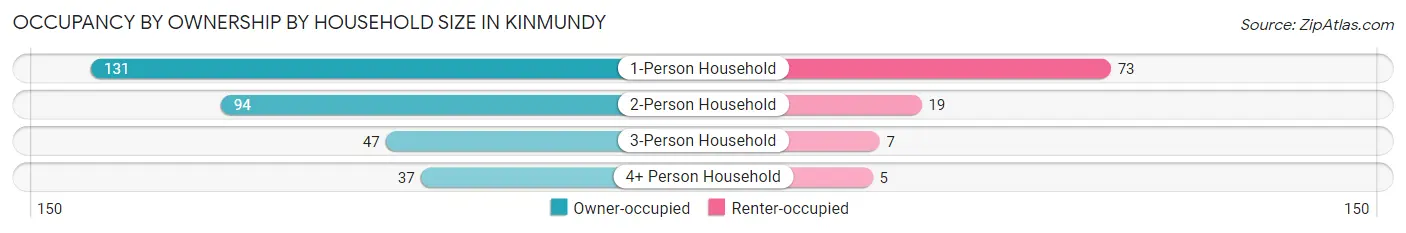
| Household Size | Owner-occupied | Renter-occupied |
| 1-Person Household | 131 (64.2%) | 73 (35.8%) |
| 2-Person Household | 94 (83.2%) | 19 (16.8%) |
| 3-Person Household | 47 (87.0%) | 7 (13.0%) |
| 4+ Person Household | 37 (88.1%) | 5 (11.9%) |
| Total Housing Units | 309 (74.8%) | 104 (25.2%) |
Occupancy by Educational Attainment in Kinmundy
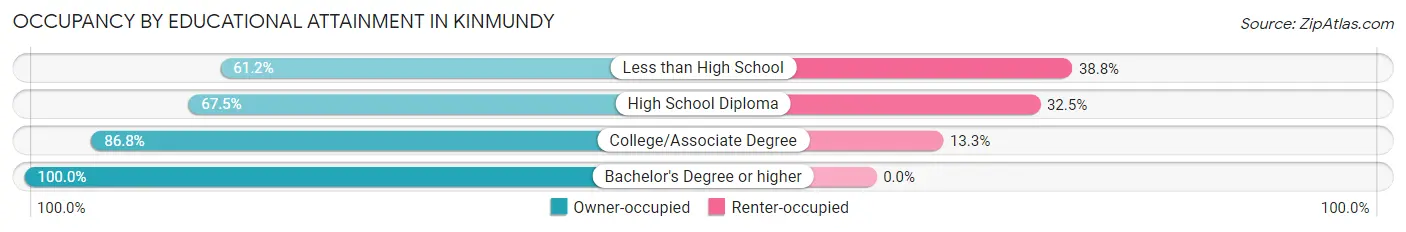
| Household Size | Owner-occupied | Renter-occupied |
| Less than High School | 52 (61.2%) | 33 (38.8%) |
| High School Diploma | 106 (67.5%) | 51 (32.5%) |
| College/Associate Degree | 131 (86.8%) | 20 (13.3%) |
| Bachelor's Degree or higher | 20 (100.0%) | 0 (0.0%) |
Occupancy by Age of Householder in Kinmundy
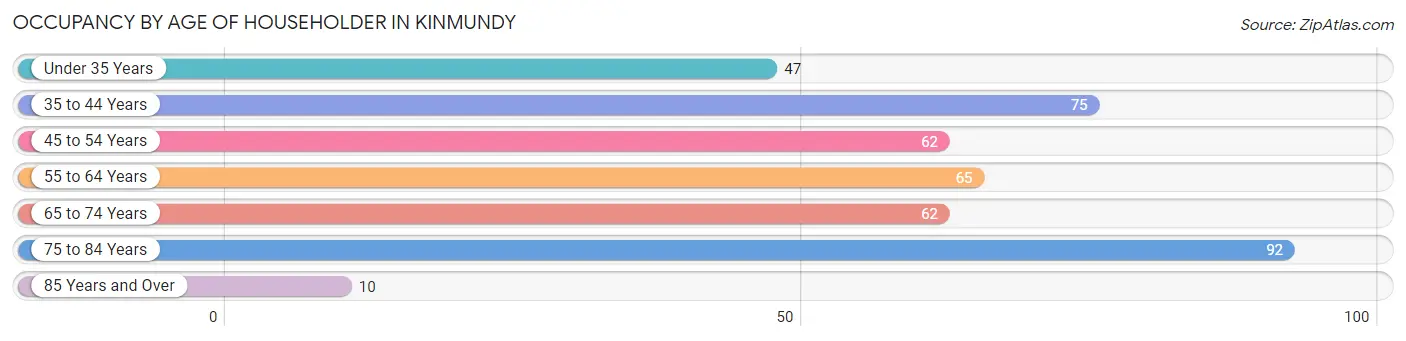
| Age Bracket | # Households | % Households |
| Under 35 Years | 47 | 11.4% |
| 35 to 44 Years | 75 | 18.2% |
| 45 to 54 Years | 62 | 15.0% |
| 55 to 64 Years | 65 | 15.7% |
| 65 to 74 Years | 62 | 15.0% |
| 75 to 84 Years | 92 | 22.3% |
| 85 Years and Over | 10 | 2.4% |
| Total | 413 | 100.0% |
Housing Finances in Kinmundy
Median Income by Occupancy in Kinmundy
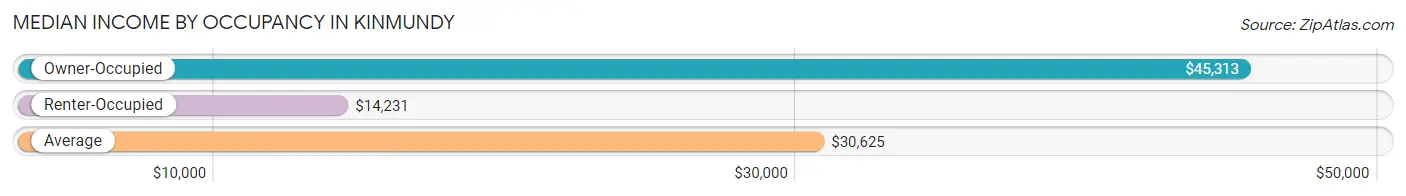
| Occupancy Type | # Households | Median Income |
| Owner-Occupied | 309 (74.8%) | $45,313 |
| Renter-Occupied | 104 (25.2%) | $14,231 |
| Average | 413 (100.0%) | $30,625 |
Occupancy by Householder Income Bracket in Kinmundy
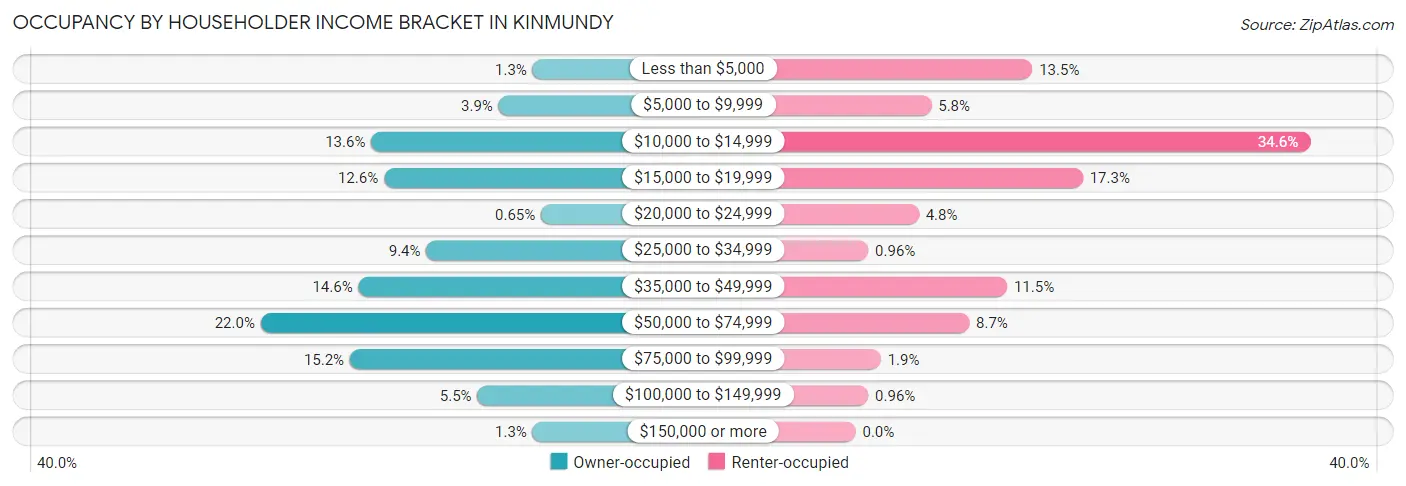
| Income Bracket | Owner-occupied | Renter-occupied |
| Less than $5,000 | 4 (1.3%) | 14 (13.5%) |
| $5,000 to $9,999 | 12 (3.9%) | 6 (5.8%) |
| $10,000 to $14,999 | 42 (13.6%) | 36 (34.6%) |
| $15,000 to $19,999 | 39 (12.6%) | 18 (17.3%) |
| $20,000 to $24,999 | 2 (0.6%) | 5 (4.8%) |
| $25,000 to $34,999 | 29 (9.4%) | 1 (1.0%) |
| $35,000 to $49,999 | 45 (14.6%) | 12 (11.5%) |
| $50,000 to $74,999 | 68 (22.0%) | 9 (8.6%) |
| $75,000 to $99,999 | 47 (15.2%) | 2 (1.9%) |
| $100,000 to $149,999 | 17 (5.5%) | 1 (1.0%) |
| $150,000 or more | 4 (1.3%) | 0 (0.0%) |
| Total | 309 (100.0%) | 104 (100.0%) |
Monthly Housing Cost Tiers in Kinmundy
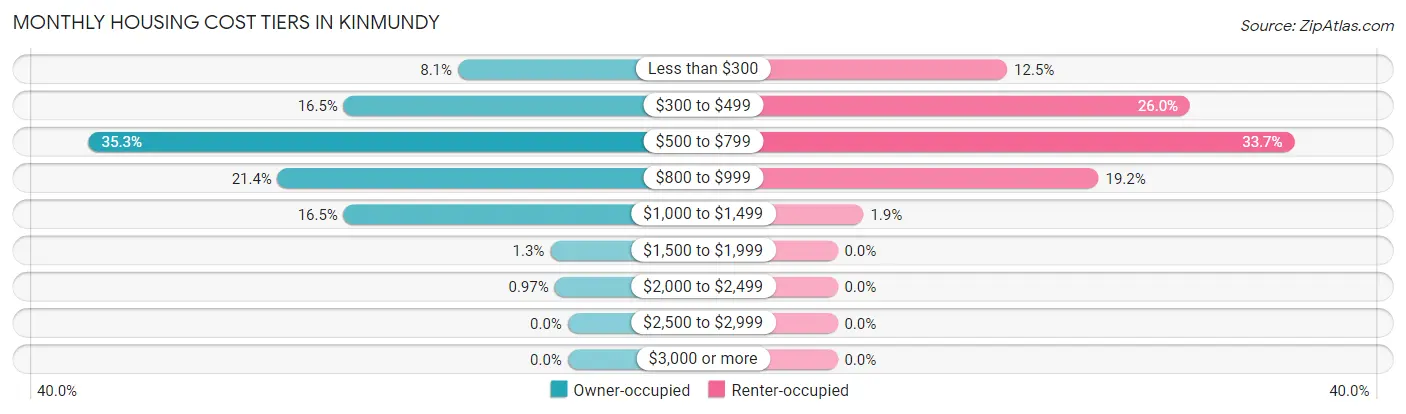
| Monthly Cost | Owner-occupied | Renter-occupied |
| Less than $300 | 25 (8.1%) | 13 (12.5%) |
| $300 to $499 | 51 (16.5%) | 27 (26.0%) |
| $500 to $799 | 109 (35.3%) | 35 (33.7%) |
| $800 to $999 | 66 (21.4%) | 20 (19.2%) |
| $1,000 to $1,499 | 51 (16.5%) | 2 (1.9%) |
| $1,500 to $1,999 | 4 (1.3%) | 0 (0.0%) |
| $2,000 to $2,499 | 3 (1.0%) | 0 (0.0%) |
| $2,500 to $2,999 | 0 (0.0%) | 0 (0.0%) |
| $3,000 or more | 0 (0.0%) | 0 (0.0%) |
| Total | 309 (100.0%) | 104 (100.0%) |
Physical Housing Characteristics in Kinmundy
Housing Structures in Kinmundy
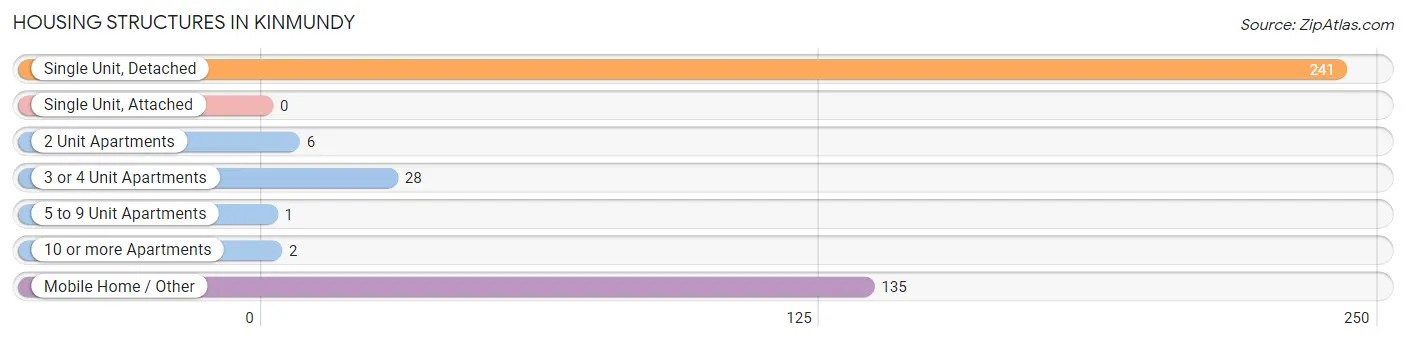
| Structure Type | # Housing Units | % Housing Units |
| Single Unit, Detached | 241 | 58.4% |
| Single Unit, Attached | 0 | 0.0% |
| 2 Unit Apartments | 6 | 1.5% |
| 3 or 4 Unit Apartments | 28 | 6.8% |
| 5 to 9 Unit Apartments | 1 | 0.2% |
| 10 or more Apartments | 2 | 0.5% |
| Mobile Home / Other | 135 | 32.7% |
| Total | 413 | 100.0% |
Housing Structures by Occupancy in Kinmundy
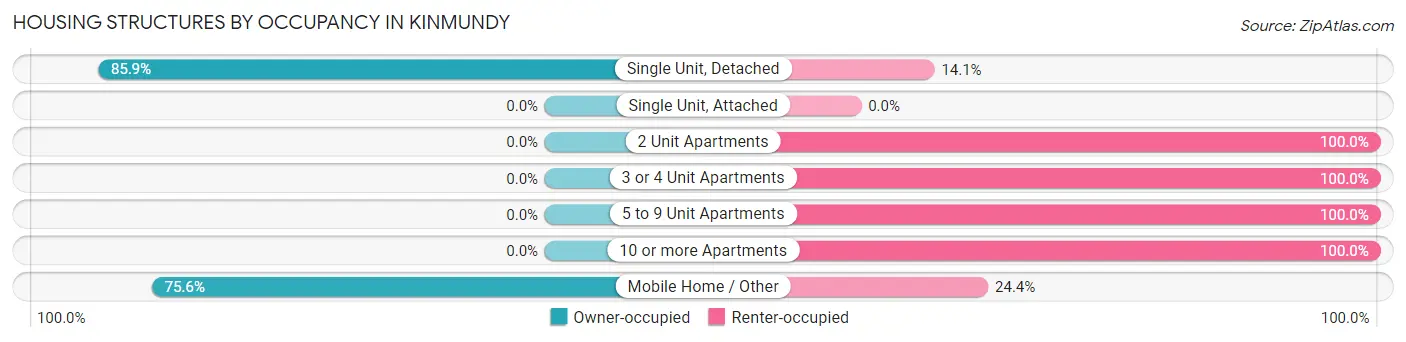
| Structure Type | Owner-occupied | Renter-occupied |
| Single Unit, Detached | 207 (85.9%) | 34 (14.1%) |
| Single Unit, Attached | 0 (0.0%) | 0 (0.0%) |
| 2 Unit Apartments | 0 (0.0%) | 6 (100.0%) |
| 3 or 4 Unit Apartments | 0 (0.0%) | 28 (100.0%) |
| 5 to 9 Unit Apartments | 0 (0.0%) | 1 (100.0%) |
| 10 or more Apartments | 0 (0.0%) | 2 (100.0%) |
| Mobile Home / Other | 102 (75.6%) | 33 (24.4%) |
| Total | 309 (74.8%) | 104 (25.2%) |
Housing Structures by Number of Rooms in Kinmundy
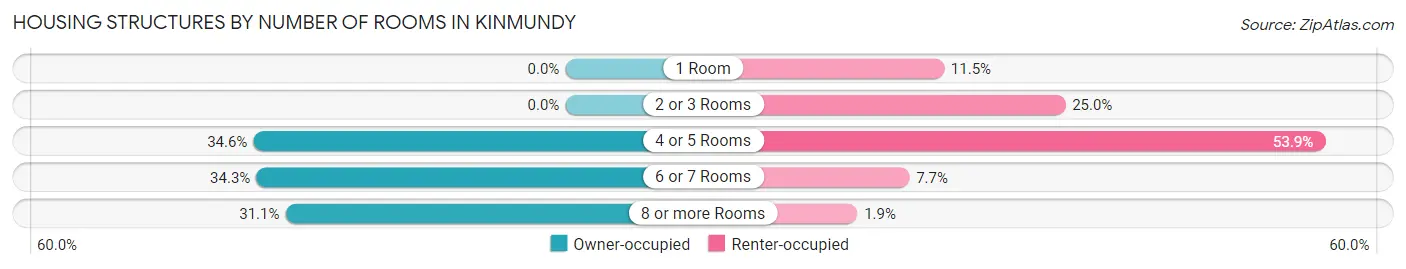
| Number of Rooms | Owner-occupied | Renter-occupied |
| 1 Room | 0 (0.0%) | 12 (11.5%) |
| 2 or 3 Rooms | 0 (0.0%) | 26 (25.0%) |
| 4 or 5 Rooms | 107 (34.6%) | 56 (53.8%) |
| 6 or 7 Rooms | 106 (34.3%) | 8 (7.7%) |
| 8 or more Rooms | 96 (31.1%) | 2 (1.9%) |
| Total | 309 (100.0%) | 104 (100.0%) |
Housing Structure by Heating Type in Kinmundy
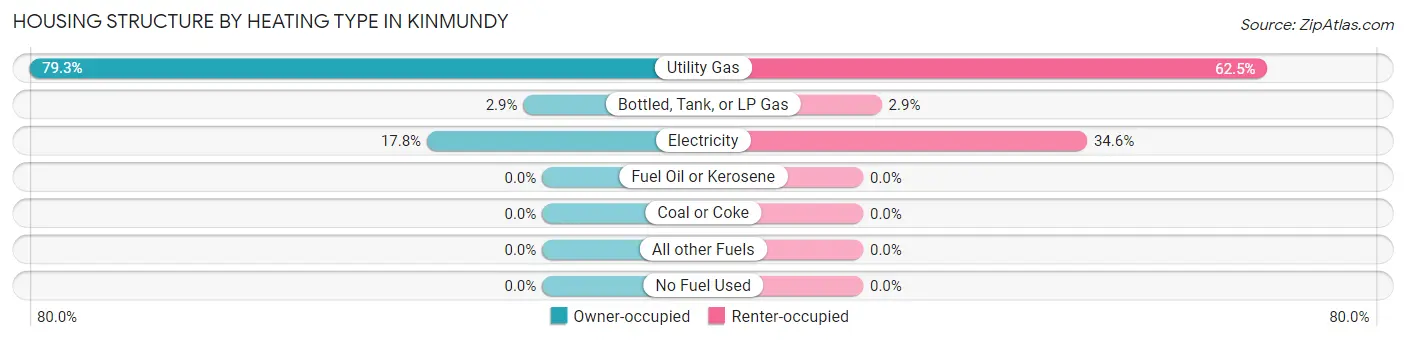
| Heating Type | Owner-occupied | Renter-occupied |
| Utility Gas | 245 (79.3%) | 65 (62.5%) |
| Bottled, Tank, or LP Gas | 9 (2.9%) | 3 (2.9%) |
| Electricity | 55 (17.8%) | 36 (34.6%) |
| Fuel Oil or Kerosene | 0 (0.0%) | 0 (0.0%) |
| Coal or Coke | 0 (0.0%) | 0 (0.0%) |
| All other Fuels | 0 (0.0%) | 0 (0.0%) |
| No Fuel Used | 0 (0.0%) | 0 (0.0%) |
| Total | 309 (100.0%) | 104 (100.0%) |
Household Vehicle Usage in Kinmundy
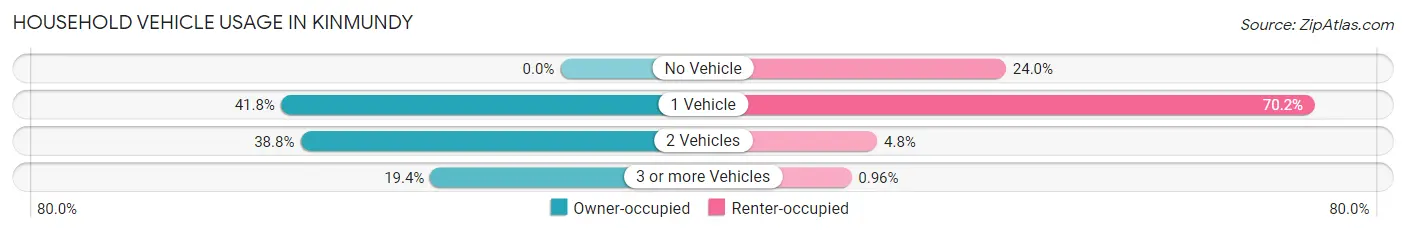
| Vehicles per Household | Owner-occupied | Renter-occupied |
| No Vehicle | 0 (0.0%) | 25 (24.0%) |
| 1 Vehicle | 129 (41.7%) | 73 (70.2%) |
| 2 Vehicles | 120 (38.8%) | 5 (4.8%) |
| 3 or more Vehicles | 60 (19.4%) | 1 (1.0%) |
| Total | 309 (100.0%) | 104 (100.0%) |
Real Estate & Mortgages in Kinmundy
Real Estate and Mortgage Overview in Kinmundy
| Characteristic | Without Mortgage | With Mortgage |
| Housing Units | 126 | 183 |
| Median Property Value | $58,100 | $90,700 |
| Median Household Income | $43,750 | $4 |
| Monthly Housing Costs | $490 | $0 |
| Real Estate Taxes | $1,161 | $4 |
Property Value by Mortgage Status in Kinmundy
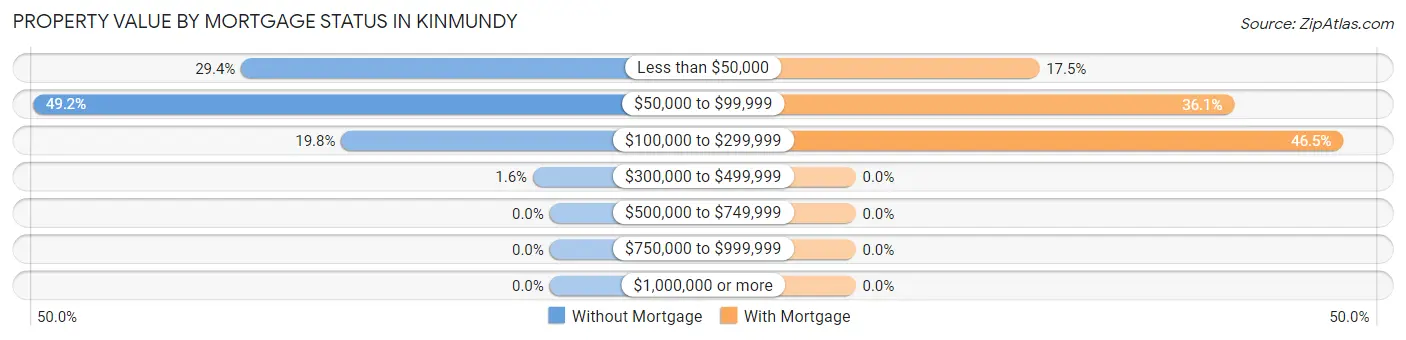
| Property Value | Without Mortgage | With Mortgage |
| Less than $50,000 | 37 (29.4%) | 32 (17.5%) |
| $50,000 to $99,999 | 62 (49.2%) | 66 (36.1%) |
| $100,000 to $299,999 | 25 (19.8%) | 85 (46.5%) |
| $300,000 to $499,999 | 2 (1.6%) | 0 (0.0%) |
| $500,000 to $749,999 | 0 (0.0%) | 0 (0.0%) |
| $750,000 to $999,999 | 0 (0.0%) | 0 (0.0%) |
| $1,000,000 or more | 0 (0.0%) | 0 (0.0%) |
| Total | 126 (100.0%) | 183 (100.0%) |
Household Income by Mortgage Status in Kinmundy
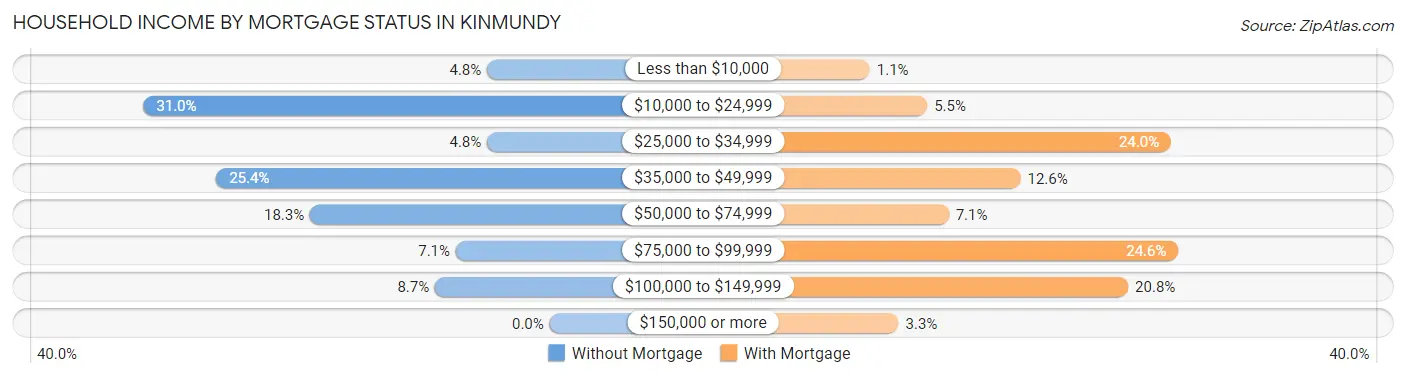
| Household Income | Without Mortgage | With Mortgage |
| Less than $10,000 | 6 (4.8%) | 2 (1.1%) |
| $10,000 to $24,999 | 39 (30.9%) | 10 (5.5%) |
| $25,000 to $34,999 | 6 (4.8%) | 44 (24.0%) |
| $35,000 to $49,999 | 32 (25.4%) | 23 (12.6%) |
| $50,000 to $74,999 | 23 (18.2%) | 13 (7.1%) |
| $75,000 to $99,999 | 9 (7.1%) | 45 (24.6%) |
| $100,000 to $149,999 | 11 (8.7%) | 38 (20.8%) |
| $150,000 or more | 0 (0.0%) | 6 (3.3%) |
| Total | 126 (100.0%) | 183 (100.0%) |
Property Value to Household Income Ratio in Kinmundy
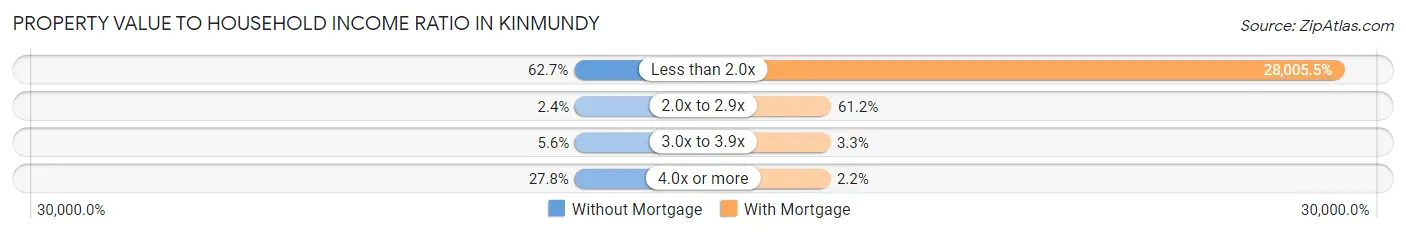
| Value-to-Income Ratio | Without Mortgage | With Mortgage |
| Less than 2.0x | 79 (62.7%) | 51,250 (28,005.5%) |
| 2.0x to 2.9x | 3 (2.4%) | 112 (61.2%) |
| 3.0x to 3.9x | 7 (5.6%) | 6 (3.3%) |
| 4.0x or more | 35 (27.8%) | 4 (2.2%) |
| Total | 126 (100.0%) | 183 (100.0%) |
Real Estate Taxes by Mortgage Status in Kinmundy
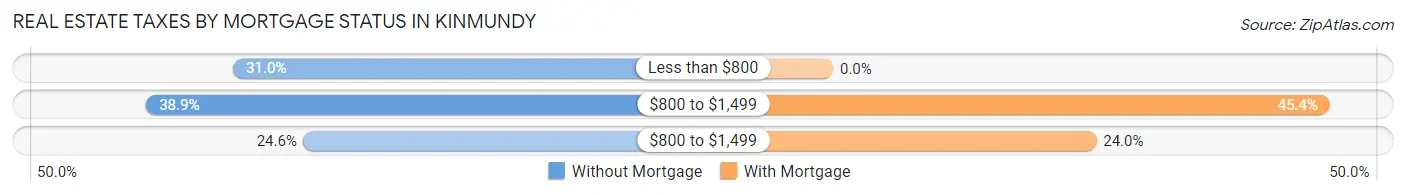
| Property Taxes | Without Mortgage | With Mortgage |
| Less than $800 | 39 (30.9%) | 0 (0.0%) |
| $800 to $1,499 | 49 (38.9%) | 83 (45.4%) |
| $800 to $1,499 | 31 (24.6%) | 44 (24.0%) |
| Total | 126 (100.0%) | 183 (100.0%) |
Health & Disability in Kinmundy
Health Insurance Coverage by Age in Kinmundy
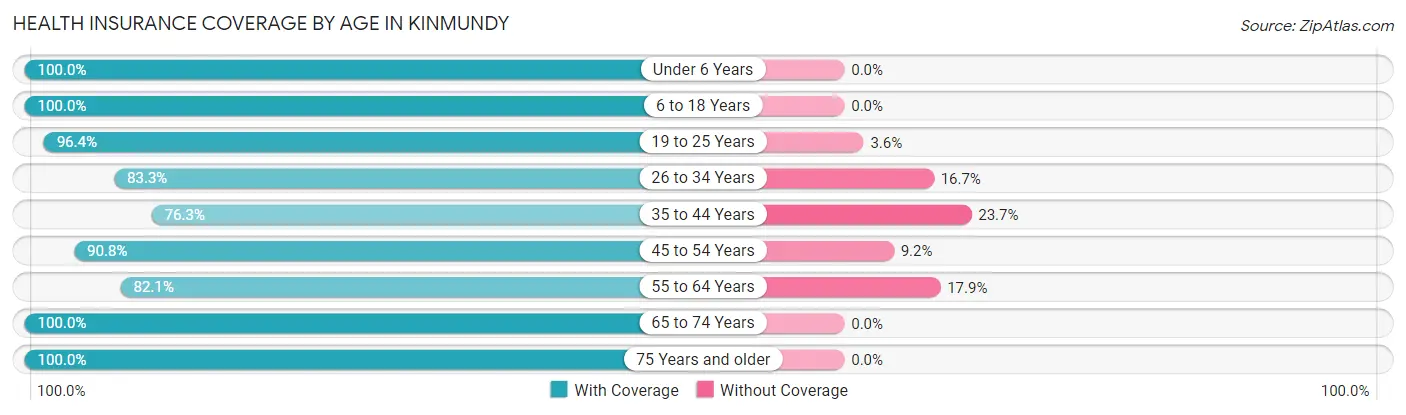
| Age Bracket | With Coverage | Without Coverage |
| Under 6 Years | 55 (100.0%) | 0 (0.0%) |
| 6 to 18 Years | 153 (100.0%) | 0 (0.0%) |
| 19 to 25 Years | 54 (96.4%) | 2 (3.6%) |
| 26 to 34 Years | 30 (83.3%) | 6 (16.7%) |
| 35 to 44 Years | 87 (76.3%) | 27 (23.7%) |
| 45 to 54 Years | 128 (90.8%) | 13 (9.2%) |
| 55 to 64 Years | 78 (82.1%) | 17 (17.9%) |
| 65 to 74 Years | 106 (100.0%) | 0 (0.0%) |
| 75 Years and older | 114 (100.0%) | 0 (0.0%) |
| Total | 805 (92.5%) | 65 (7.5%) |
Health Insurance Coverage by Citizenship Status in Kinmundy
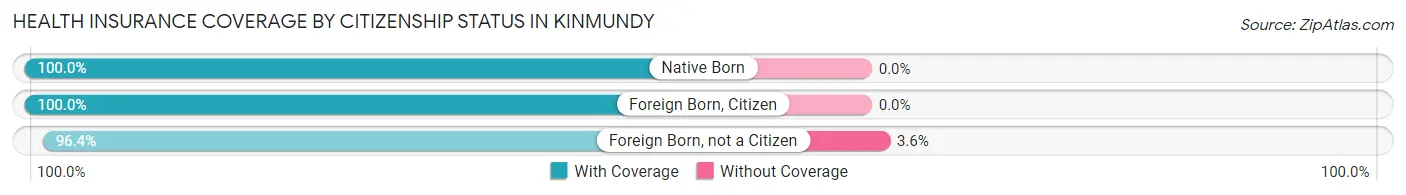
| Citizenship Status | With Coverage | Without Coverage |
| Native Born | 55 (100.0%) | 0 (0.0%) |
| Foreign Born, Citizen | 153 (100.0%) | 0 (0.0%) |
| Foreign Born, not a Citizen | 54 (96.4%) | 2 (3.6%) |
Health Insurance Coverage by Household Income in Kinmundy
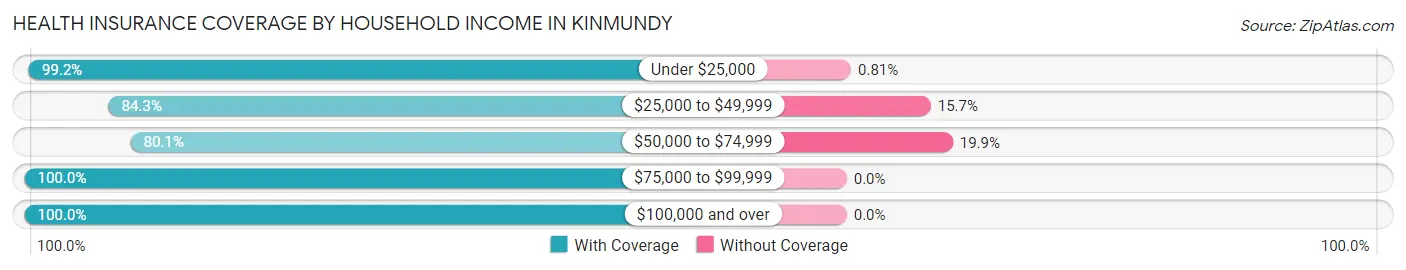
| Household Income | With Coverage | Without Coverage |
| Under $25,000 | 245 (99.2%) | 2 (0.8%) |
| $25,000 to $49,999 | 182 (84.3%) | 34 (15.7%) |
| $50,000 to $74,999 | 117 (80.1%) | 29 (19.9%) |
| $75,000 to $99,999 | 187 (100.0%) | 0 (0.0%) |
| $100,000 and over | 74 (100.0%) | 0 (0.0%) |
Public vs Private Health Insurance Coverage by Age in Kinmundy
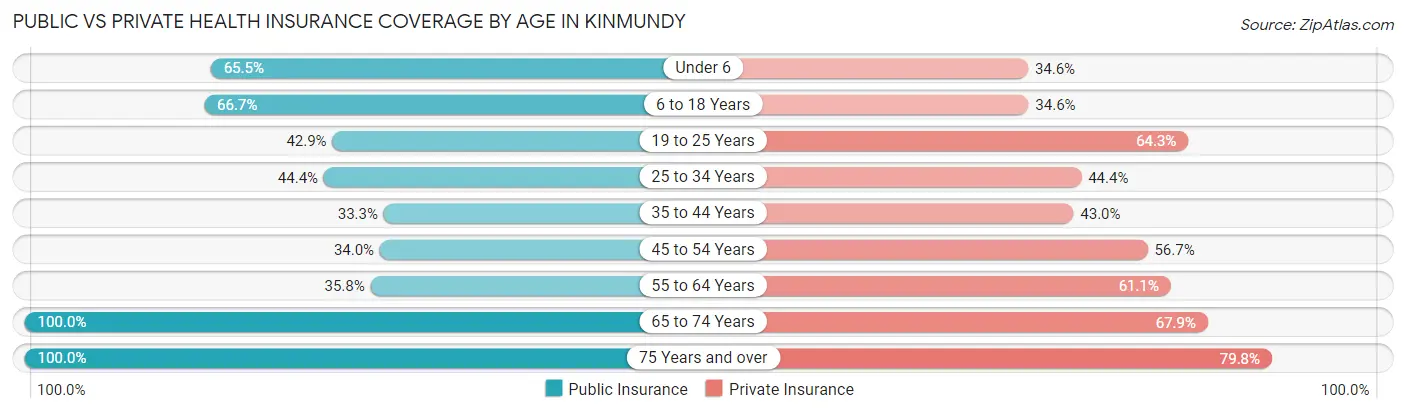
| Age Bracket | Public Insurance | Private Insurance |
| Under 6 | 36 (65.4%) | 19 (34.5%) |
| 6 to 18 Years | 102 (66.7%) | 53 (34.6%) |
| 19 to 25 Years | 24 (42.9%) | 36 (64.3%) |
| 25 to 34 Years | 16 (44.4%) | 16 (44.4%) |
| 35 to 44 Years | 38 (33.3%) | 49 (43.0%) |
| 45 to 54 Years | 48 (34.0%) | 80 (56.7%) |
| 55 to 64 Years | 34 (35.8%) | 58 (61.1%) |
| 65 to 74 Years | 106 (100.0%) | 72 (67.9%) |
| 75 Years and over | 114 (100.0%) | 91 (79.8%) |
| Total | 518 (59.5%) | 474 (54.5%) |
Disability Status by Sex by Age in Kinmundy
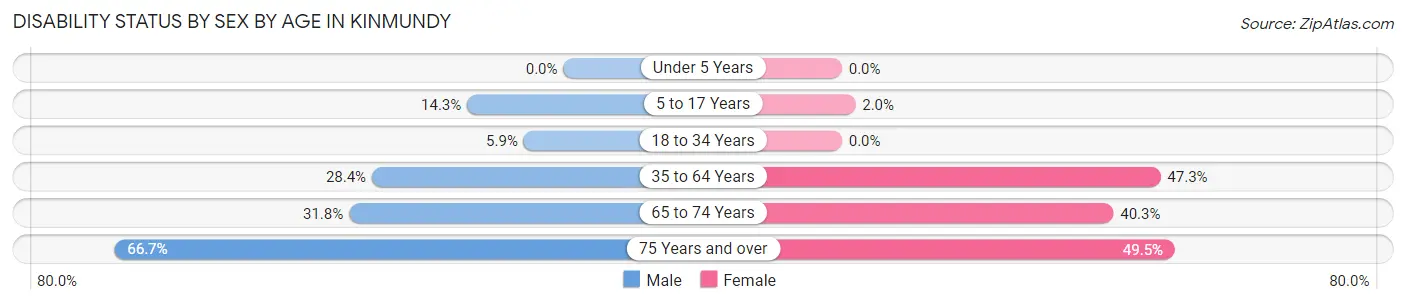
| Age Bracket | Male | Female |
| Under 5 Years | 0 (0.0%) | 0 (0.0%) |
| 5 to 17 Years | 8 (14.3%) | 2 (2.0%) |
| 18 to 34 Years | 3 (5.9%) | 0 (0.0%) |
| 35 to 64 Years | 52 (28.4%) | 79 (47.3%) |
| 65 to 74 Years | 14 (31.8%) | 25 (40.3%) |
| 75 Years and over | 14 (66.7%) | 46 (49.5%) |
Disability Class by Sex by Age in Kinmundy
Disability Class: Hearing Difficulty
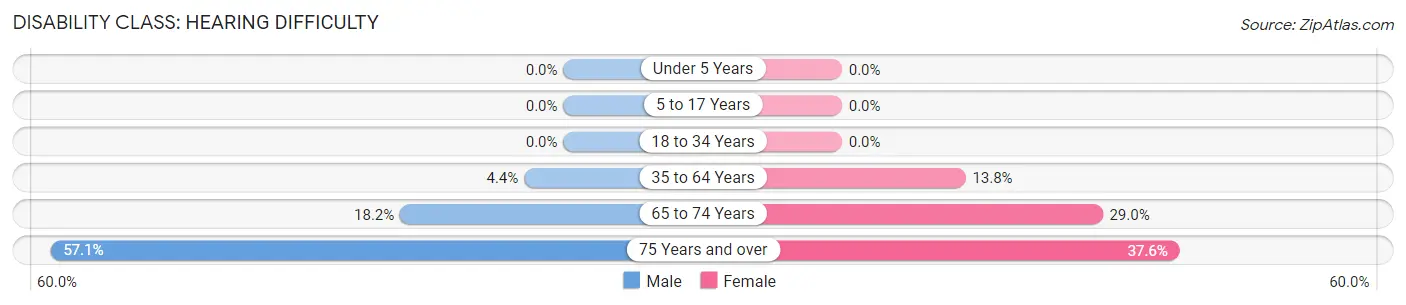
| Age Bracket | Male | Female |
| Under 5 Years | 0 (0.0%) | 0 (0.0%) |
| 5 to 17 Years | 0 (0.0%) | 0 (0.0%) |
| 18 to 34 Years | 0 (0.0%) | 0 (0.0%) |
| 35 to 64 Years | 8 (4.4%) | 23 (13.8%) |
| 65 to 74 Years | 8 (18.2%) | 18 (29.0%) |
| 75 Years and over | 12 (57.1%) | 35 (37.6%) |
Disability Class: Vision Difficulty
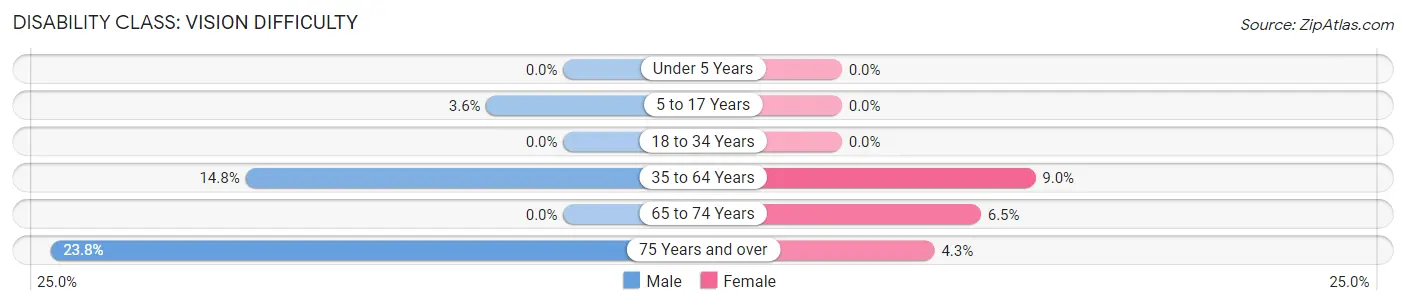
| Age Bracket | Male | Female |
| Under 5 Years | 0 (0.0%) | 0 (0.0%) |
| 5 to 17 Years | 2 (3.6%) | 0 (0.0%) |
| 18 to 34 Years | 0 (0.0%) | 0 (0.0%) |
| 35 to 64 Years | 27 (14.7%) | 15 (9.0%) |
| 65 to 74 Years | 0 (0.0%) | 4 (6.5%) |
| 75 Years and over | 5 (23.8%) | 4 (4.3%) |
Disability Class: Cognitive Difficulty
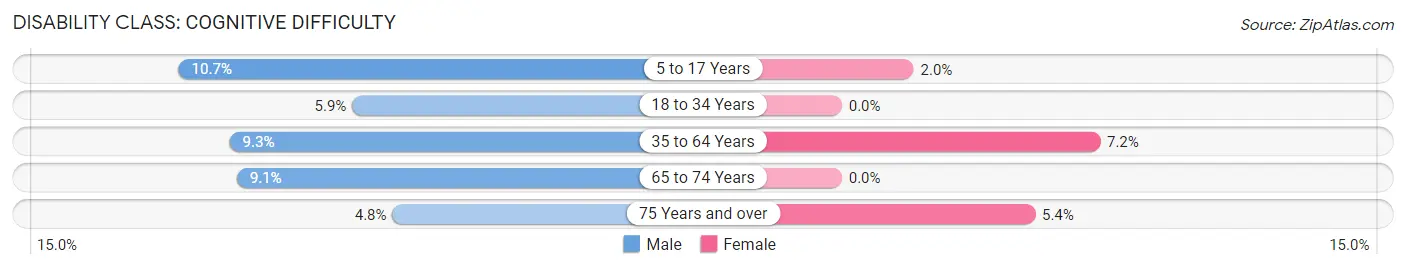
| Age Bracket | Male | Female |
| 5 to 17 Years | 6 (10.7%) | 2 (2.0%) |
| 18 to 34 Years | 3 (5.9%) | 0 (0.0%) |
| 35 to 64 Years | 17 (9.3%) | 12 (7.2%) |
| 65 to 74 Years | 4 (9.1%) | 0 (0.0%) |
| 75 Years and over | 1 (4.8%) | 5 (5.4%) |
Disability Class: Ambulatory Difficulty
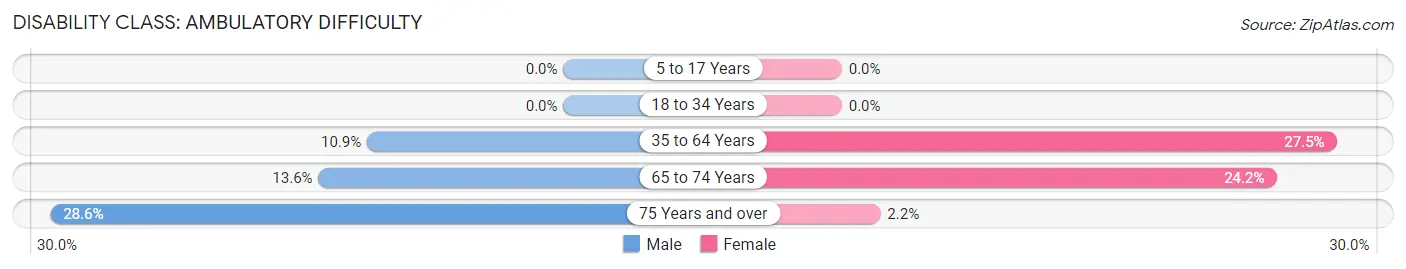
| Age Bracket | Male | Female |
| 5 to 17 Years | 0 (0.0%) | 0 (0.0%) |
| 18 to 34 Years | 0 (0.0%) | 0 (0.0%) |
| 35 to 64 Years | 20 (10.9%) | 46 (27.5%) |
| 65 to 74 Years | 6 (13.6%) | 15 (24.2%) |
| 75 Years and over | 6 (28.6%) | 2 (2.1%) |
Disability Class: Self-Care Difficulty
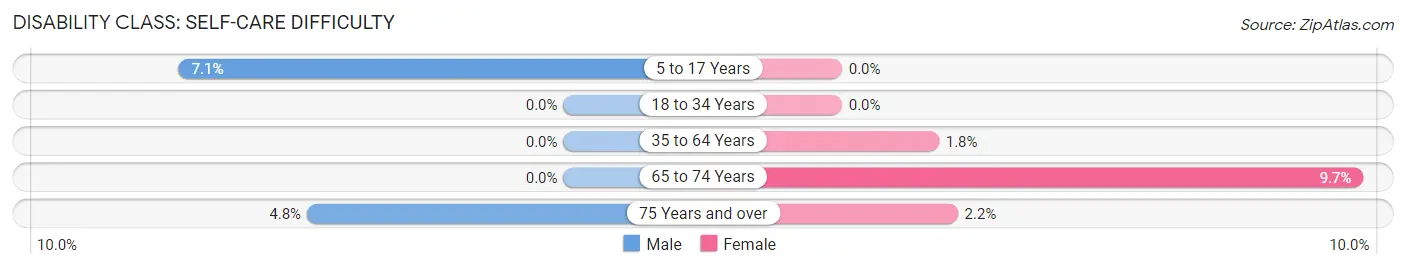
| Age Bracket | Male | Female |
| 5 to 17 Years | 4 (7.1%) | 0 (0.0%) |
| 18 to 34 Years | 0 (0.0%) | 0 (0.0%) |
| 35 to 64 Years | 0 (0.0%) | 3 (1.8%) |
| 65 to 74 Years | 0 (0.0%) | 6 (9.7%) |
| 75 Years and over | 1 (4.8%) | 2 (2.1%) |
Technology Access in Kinmundy
Computing Device Access in Kinmundy
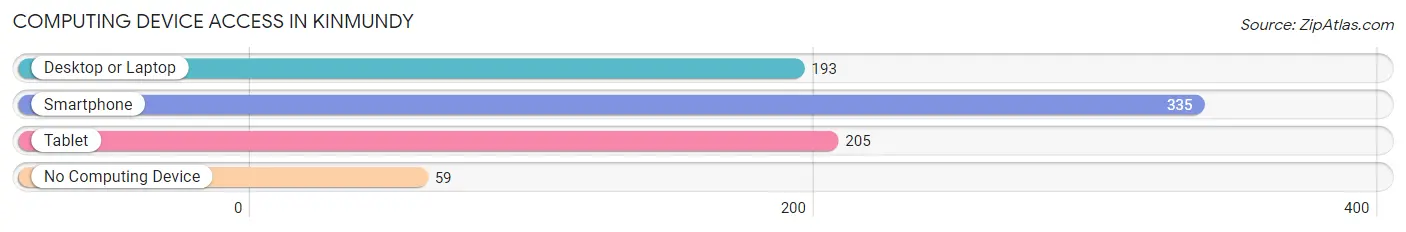
| Device Type | # Households | % Households |
| Desktop or Laptop | 193 | 46.7% |
| Smartphone | 335 | 81.1% |
| Tablet | 205 | 49.6% |
| No Computing Device | 59 | 14.3% |
| Total | 413 | 100.0% |
Internet Access in Kinmundy
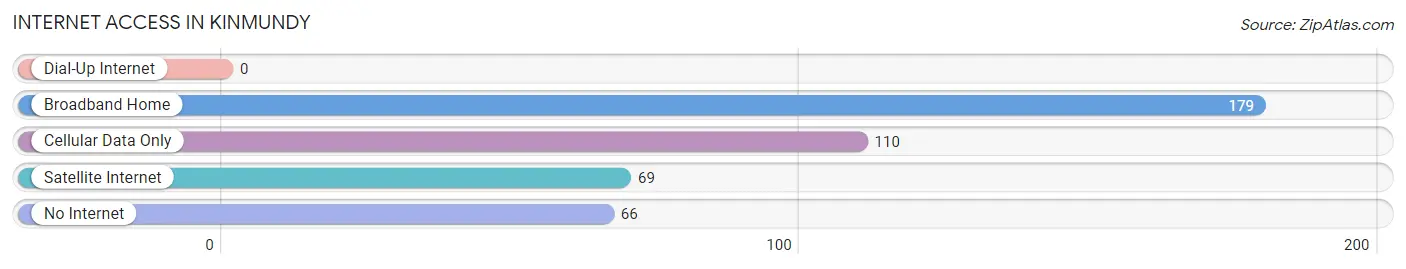
| Internet Type | # Households | % Households |
| Dial-Up Internet | 0 | 0.0% |
| Broadband Home | 179 | 43.3% |
| Cellular Data Only | 110 | 26.6% |
| Satellite Internet | 69 | 16.7% |
| No Internet | 66 | 16.0% |
| Total | 413 | 100.0% |
Kinmundy Summary
History
The small town of Kinmundy, Illinois is located in Marion County, about an hour and a half southeast of St. Louis. The town was founded in 1854 by William Kinney, who named it after his hometown of Kinmundy, Scotland. The town was incorporated in 1858 and has since grown to a population of 1,541 as of the 2010 census.
Kinmundy has a rich history of industry and agriculture. In the late 1800s, the town was home to several coal mines, which provided employment for many of the town’s residents. The coal industry eventually declined, but the town’s economy was bolstered by the arrival of the railroad in the early 1900s. The railroad brought new businesses and industries to the area, including a brickyard, a flour mill, and a furniture factory.
The town was also home to several notable figures in its history. One of the most famous was William Kinney, the founder of the town. He was a prominent businessman and politician, serving as a state senator and a member of the Illinois House of Representatives. Another notable figure was John W. Kinney, William’s son, who served as a state senator and a member of the U.S. House of Representatives.
Geography
Kinmundy is located in the southeastern part of Marion County, about an hour and a half southeast of St. Louis. The town is situated on the banks of the Kaskaskia River, which flows through the area. The town is surrounded by rolling hills and farmland, and is located near several small lakes and streams.
The climate in Kinmundy is typical of the Midwest, with hot summers and cold winters. The average temperature in the summer is around 80 degrees Fahrenheit, while the average temperature in the winter is around 30 degrees Fahrenheit. The town receives an average of 40 inches of precipitation per year, with most of it falling in the spring and summer months.
Economy
The economy of Kinmundy is largely based on agriculture and manufacturing. The town is home to several small businesses, including a grocery store, a hardware store, and a few restaurants. The town also has a few small manufacturing plants, which produce a variety of products, including furniture, clothing, and automotive parts.
The town is also home to several farms, which produce a variety of crops, including corn, soybeans, and wheat. The town is also home to several livestock farms, which produce beef, pork, and poultry.
Demographics
As of the 2010 census, the population of Kinmundy was 1,541. The town is predominantly white, with 92.3% of the population identifying as such. The town also has a small Hispanic population, with 4.2% of the population identifying as Hispanic or Latino. The town also has a small African American population, with 1.7% of the population identifying as such.
The median household income in Kinmundy is $41,944, and the median home value is $87,400. The town has a poverty rate of 16.3%, which is slightly higher than the national average. The town also has a high rate of unemployment, with 8.2% of the population being unemployed.
Conclusion
Kinmundy, Illinois is a small town with a rich history and a diverse economy. The town has a long history of industry and agriculture, and is home to several small businesses and manufacturing plants. The town also has a diverse population, with a majority of the population being white and a small percentage of the population being Hispanic or African American. The town has a median household income of $41,944 and a median home value of $87,400, and has a poverty rate of 16.3%.
Common Questions
What is Per Capita Income in Kinmundy?
Per Capita income in Kinmundy is $22,192.
What is the Median Family Income in Kinmundy?
Median Family Income in Kinmundy is $53,333.
What is the Median Household income in Kinmundy?
Median Household Income in Kinmundy is $30,625.
What is Income or Wage Gap in Kinmundy?
Income or Wage Gap in Kinmundy is 35.6%.
Women in Kinmundy earn 64.4 cents for every dollar earned by a man.
What is Inequality or Gini Index in Kinmundy?
Inequality or Gini Index in Kinmundy is 0.44.
What is the Total Population of Kinmundy?
Total Population of Kinmundy is 874.
What is the Total Male Population of Kinmundy?
Total Male Population of Kinmundy is 369.
What is the Total Female Population of Kinmundy?
Total Female Population of Kinmundy is 505.
What is the Ratio of Males per 100 Females in Kinmundy?
There are 73.07 Males per 100 Females in Kinmundy.
What is the Ratio of Females per 100 Males in Kinmundy?
There are 136.86 Females per 100 Males in Kinmundy.
What is the Median Population Age in Kinmundy?
Median Population Age in Kinmundy is 46.3 Years.
What is the Average Family Size in Kinmundy
Average Family Size in Kinmundy is 3.0 People.
What is the Average Household Size in Kinmundy
Average Household Size in Kinmundy is 2.1 People.
How Large is the Labor Force in Kinmundy?
There are 360 People in the Labor Forcein in Kinmundy.
What is the Percentage of People in the Labor Force in Kinmundy?
51.6% of People are in the Labor Force in Kinmundy.
What is the Unemployment Rate in Kinmundy?
Unemployment Rate in Kinmundy is 14.9%.