Kingston Mines, IL Map & Demographics
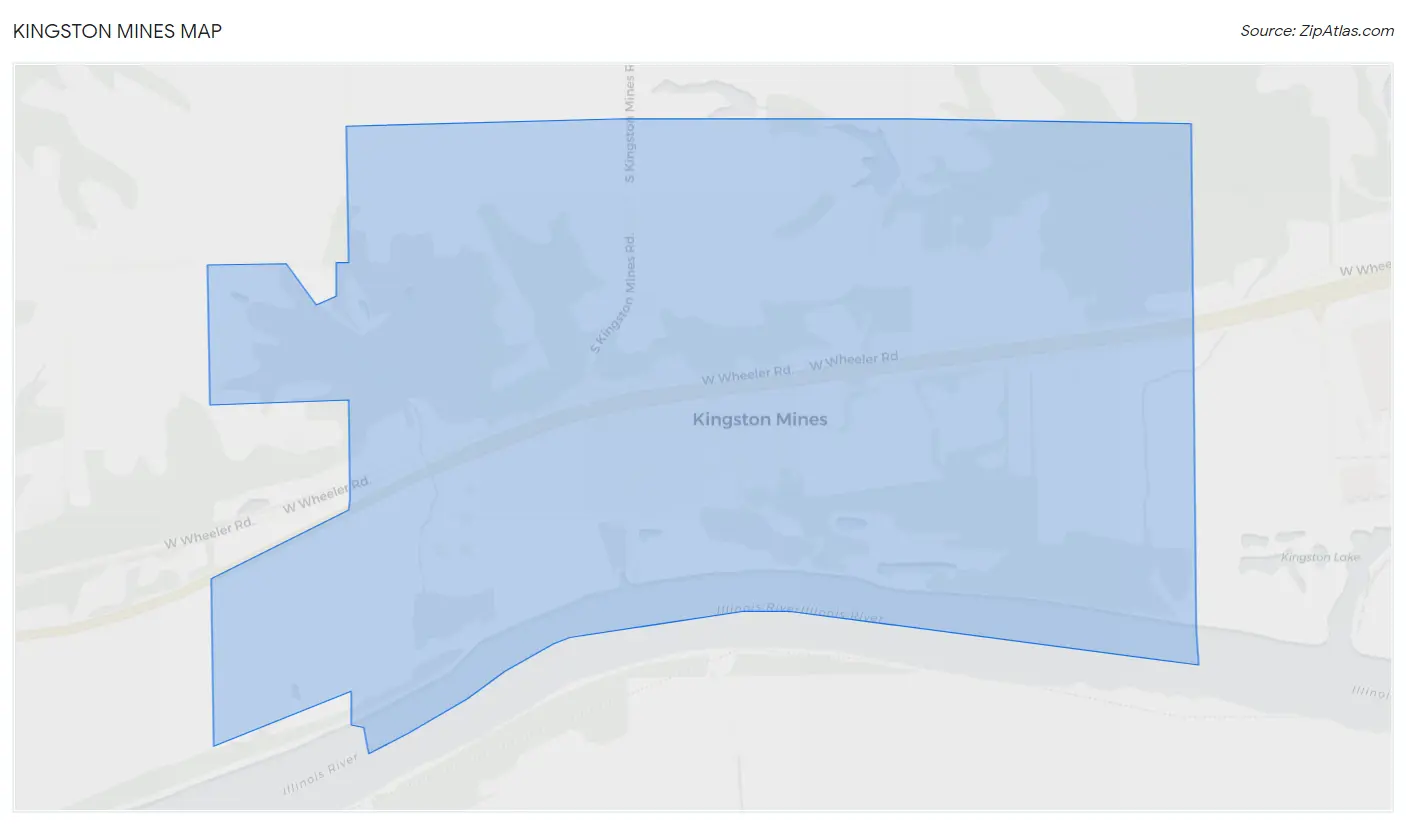
Kingston Mines Map
Kingston Mines Overview
$24,416
PER CAPITA INCOME
$57,375
AVG FAMILY INCOME
$51,719
AVG HOUSEHOLD INCOME
0.40
INEQUALITY / GINI INDEX
194
TOTAL POPULATION
95
MALE POPULATION
99
FEMALE POPULATION
95.96
MALES / 100 FEMALES
104.21
FEMALES / 100 MALES
44.0
MEDIAN AGE
3.1
AVG FAMILY SIZE
2.3
AVG HOUSEHOLD SIZE
71
LABOR FORCE [ PEOPLE ]
46.4%
PERCENT IN LABOR FORCE
Kingston Mines Zip Codes
Kingston Mines Area Codes
Income in Kingston Mines
Income Overview in Kingston Mines
Per Capita Income in Kingston Mines is $24,416, while median incomes of families and households are $57,375 and $51,719 respectively.
| Characteristic | Number | Measure |
| Per Capita Income | 194 | $24,416 |
| Median Family Income | 51 | $57,375 |
| Mean Family Income | 51 | $67,090 |
| Median Household Income | 83 | $51,719 |
| Mean Household Income | 83 | $55,305 |
| Income Deficit | 51 | $0 |
| Wage / Income Gap (%) | 194 | 0.00% |
| Wage / Income Gap ($) | 194 | 100.00¢ per $1 |
| Gini / Inequality Index | 194 | 0.40 |
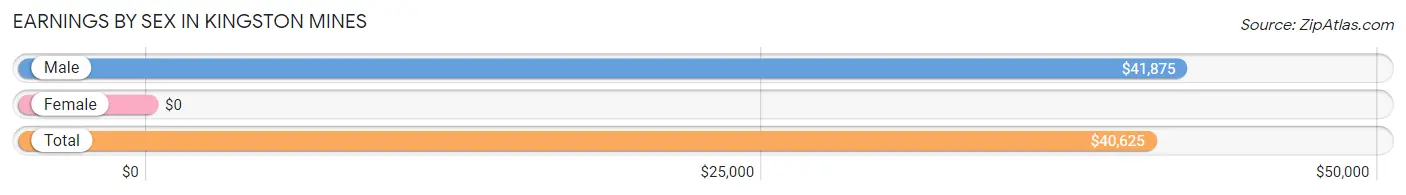
Earnings by Sex in Kingston Mines
| Sex | Number | Average Earnings |
| Male | 43 (58.9%) | $41,875 |
| Female | 30 (41.1%) | $0 |
| Total | 73 (100.0%) | $40,625 |
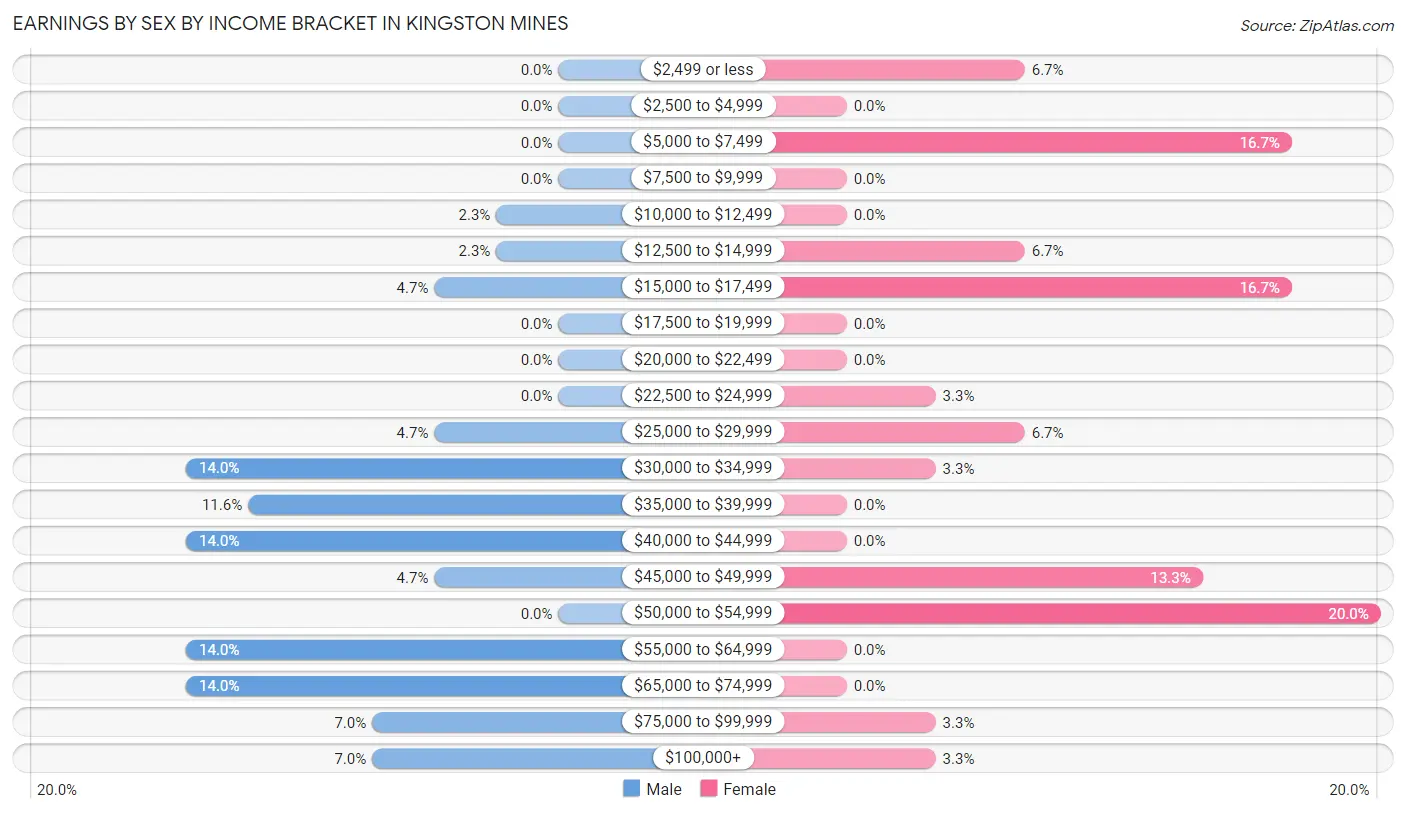
Earnings by Sex by Income Bracket in Kingston Mines
The most common earnings brackets in Kingston Mines are $30,000 to $34,999 for men (6 | 14.0%) and $50,000 to $54,999 for women (6 | 20.0%).
| Income | Male | Female |
| $2,499 or less | 0 (0.0%) | 2 (6.7%) |
| $2,500 to $4,999 | 0 (0.0%) | 0 (0.0%) |
| $5,000 to $7,499 | 0 (0.0%) | 5 (16.7%) |
| $7,500 to $9,999 | 0 (0.0%) | 0 (0.0%) |
| $10,000 to $12,499 | 1 (2.3%) | 0 (0.0%) |
| $12,500 to $14,999 | 1 (2.3%) | 2 (6.7%) |
| $15,000 to $17,499 | 2 (4.6%) | 5 (16.7%) |
| $17,500 to $19,999 | 0 (0.0%) | 0 (0.0%) |
| $20,000 to $22,499 | 0 (0.0%) | 0 (0.0%) |
| $22,500 to $24,999 | 0 (0.0%) | 1 (3.3%) |
| $25,000 to $29,999 | 2 (4.6%) | 2 (6.7%) |
| $30,000 to $34,999 | 6 (14.0%) | 1 (3.3%) |
| $35,000 to $39,999 | 5 (11.6%) | 0 (0.0%) |
| $40,000 to $44,999 | 6 (14.0%) | 0 (0.0%) |
| $45,000 to $49,999 | 2 (4.6%) | 4 (13.3%) |
| $50,000 to $54,999 | 0 (0.0%) | 6 (20.0%) |
| $55,000 to $64,999 | 6 (14.0%) | 0 (0.0%) |
| $65,000 to $74,999 | 6 (14.0%) | 0 (0.0%) |
| $75,000 to $99,999 | 3 (7.0%) | 1 (3.3%) |
| $100,000+ | 3 (7.0%) | 1 (3.3%) |
| Total | 43 (100.0%) | 30 (100.0%) |
Earnings by Sex by Educational Attainment in Kingston Mines
| Educational Attainment | Male Income | Female Income |
| Less than High School | - | - |
| High School Diploma | - | - |
| College or Associate's Degree | - | - |
| Bachelor's Degree | - | - |
| Graduate Degree | - | - |
| Total | $41,458 | $0 |
Family Income in Kingston Mines
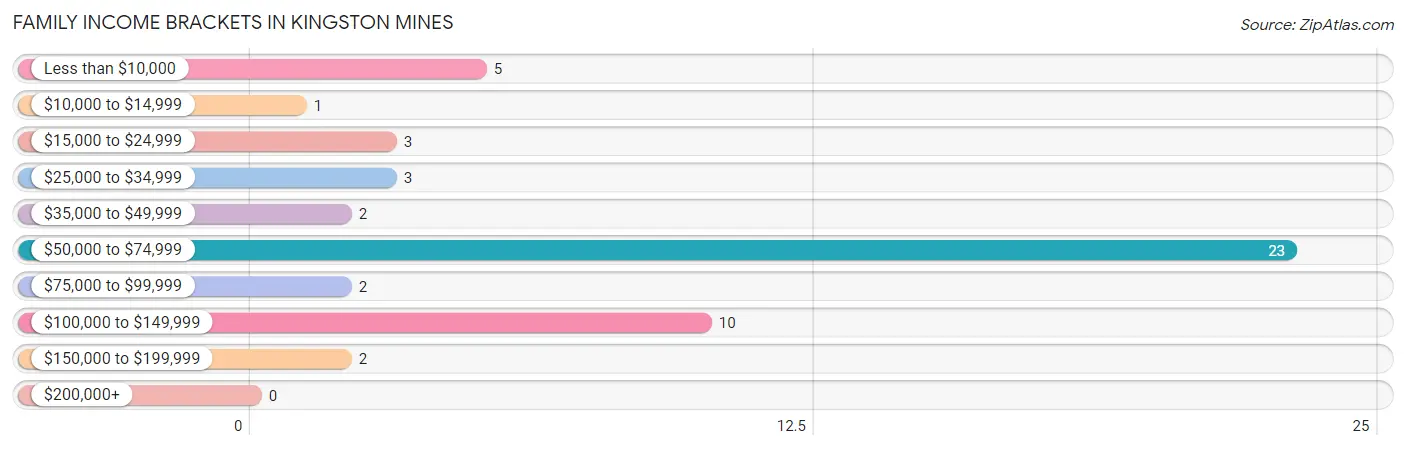
Family Income Brackets in Kingston Mines
According to the Kingston Mines family income data, there are 23 families falling into the $50,000 to $74,999 income range, which is the most common income bracket and makes up 45.1% of all families.
| Income Bracket | # Families | % Families |
| Less than $10,000 | 5 | 9.8% |
| $10,000 to $14,999 | 1 | 2.0% |
| $15,000 to $24,999 | 3 | 5.9% |
| $25,000 to $34,999 | 3 | 5.9% |
| $35,000 to $49,999 | 2 | 3.9% |
| $50,000 to $74,999 | 23 | 45.1% |
| $75,000 to $99,999 | 2 | 3.9% |
| $100,000 to $149,999 | 10 | 19.6% |
| $150,000 to $199,999 | 2 | 3.9% |
| $200,000+ | 0 | 0.0% |
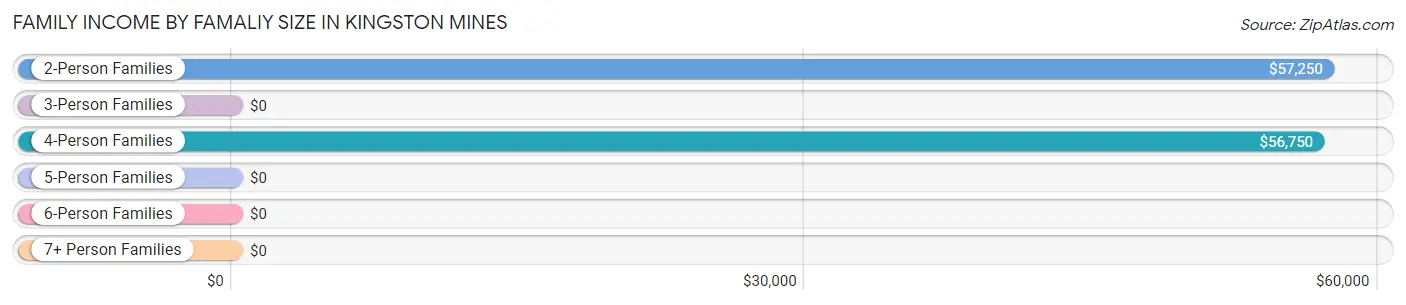
Family Income by Famaliy Size in Kingston Mines
2-person families (25 | 49.0%) account for the highest median family income in Kingston Mines with $57,250 per family, while 2-person families (25 | 49.0%) have the highest median income of $28,625 per family member.
| Income Bracket | # Families | Median Income |
| 2-Person Families | 25 (49.0%) | $57,250 |
| 3-Person Families | 8 (15.7%) | $0 |
| 4-Person Families | 15 (29.4%) | $56,750 |
| 5-Person Families | 3 (5.9%) | $0 |
| 6-Person Families | 0 (0.0%) | $0 |
| 7+ Person Families | 0 (0.0%) | $0 |
| Total | 51 (100.0%) | $57,375 |
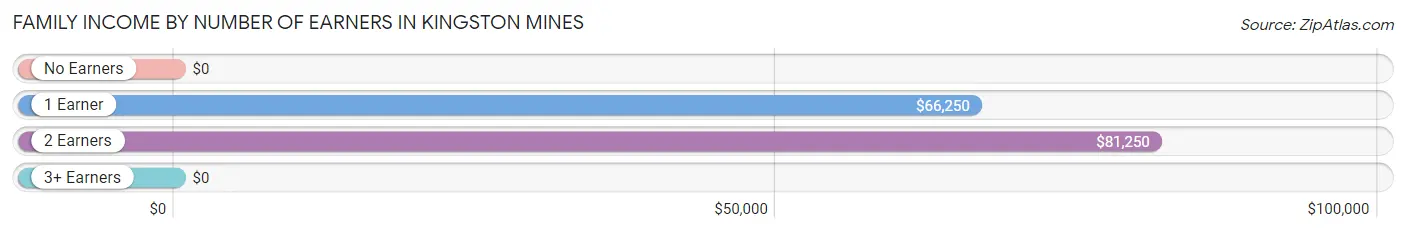
Family Income by Number of Earners in Kingston Mines
| Number of Earners | # Families | Median Income |
| No Earners | 13 (25.5%) | $0 |
| 1 Earner | 24 (47.1%) | $66,250 |
| 2 Earners | 12 (23.5%) | $81,250 |
| 3+ Earners | 2 (3.9%) | $0 |
| Total | 51 (100.0%) | $57,375 |
Household Income in Kingston Mines
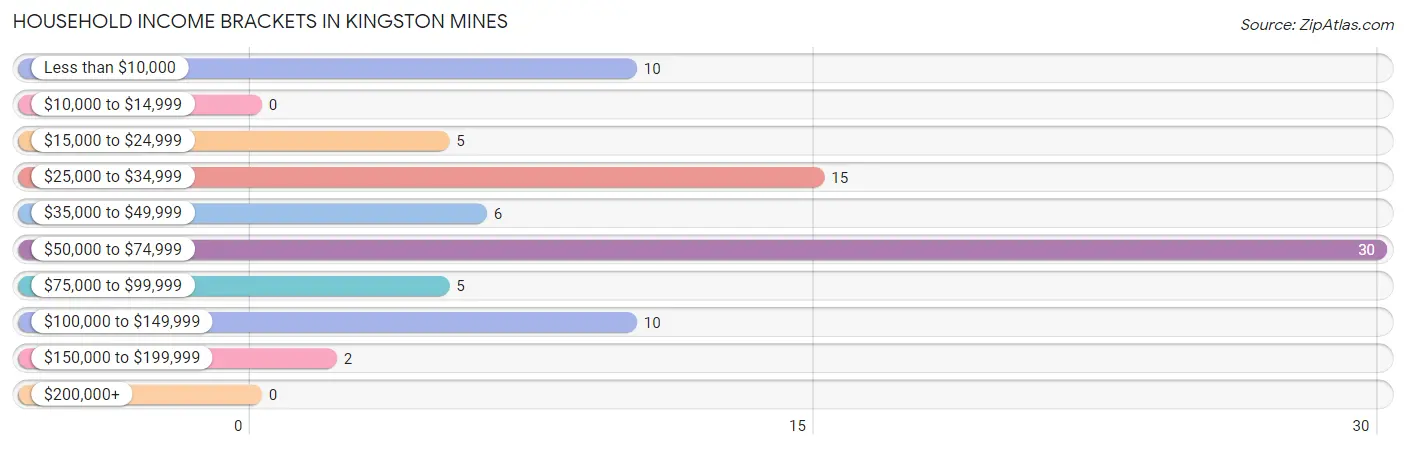
Household Income Brackets in Kingston Mines
With 30 households falling in the category, the $50,000 to $74,999 income range is the most frequent in Kingston Mines, accounting for 36.1% of all households.
| Income Bracket | # Households | % Households |
| Less than $10,000 | 10 | 12.0% |
| $10,000 to $14,999 | 0 | 0.0% |
| $15,000 to $24,999 | 5 | 6.0% |
| $25,000 to $34,999 | 15 | 18.1% |
| $35,000 to $49,999 | 6 | 7.2% |
| $50,000 to $74,999 | 30 | 36.1% |
| $75,000 to $99,999 | 5 | 6.0% |
| $100,000 to $149,999 | 10 | 12.0% |
| $150,000 to $199,999 | 2 | 2.4% |
| $200,000+ | 0 | 0.0% |
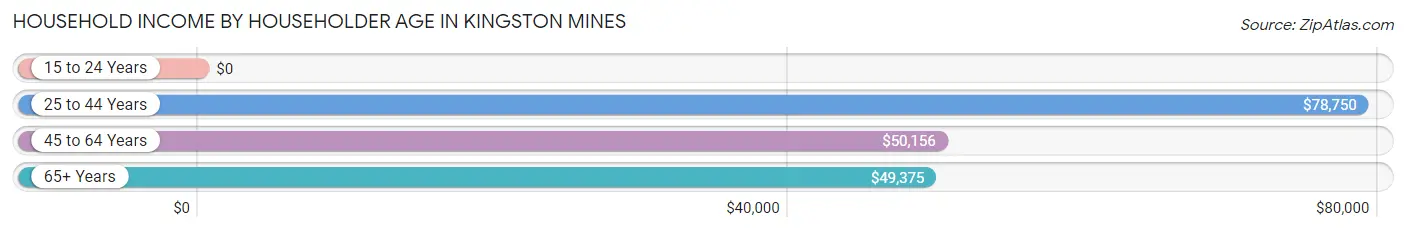
Household Income by Householder Age in Kingston Mines
The median household income in Kingston Mines is $51,719, with the highest median household income of $78,750 found in the 25 to 44 years age bracket for the primary householder. A total of 23 households (27.7%) fall into this category.
| Income Bracket | # Households | Median Income |
| 15 to 24 Years | 0 (0.0%) | $0 |
| 25 to 44 Years | 23 (27.7%) | $78,750 |
| 45 to 64 Years | 39 (47.0%) | $50,156 |
| 65+ Years | 21 (25.3%) | $49,375 |
| Total | 83 (100.0%) | $51,719 |
Poverty in Kingston Mines
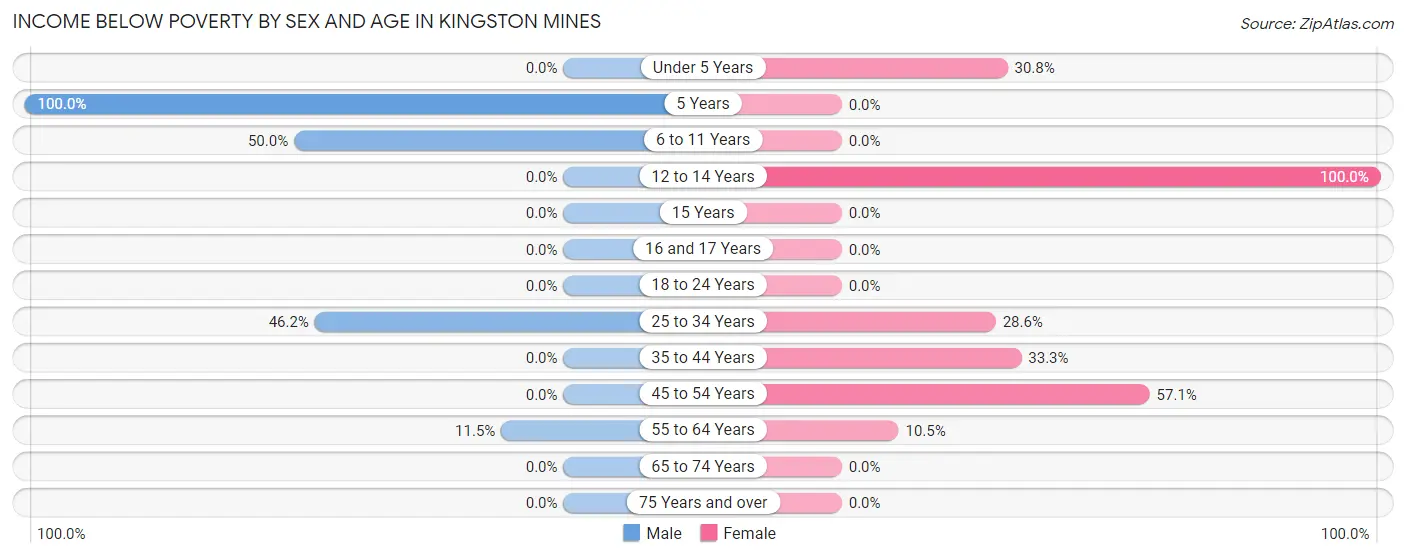
Income Below Poverty by Sex and Age in Kingston Mines
With 15.8% poverty level for males and 25.3% for females among the residents of Kingston Mines, 5 year old males and 12 to 14 year old females are the most vulnerable to poverty, with 1 males (100.0%) and 5 females (100.0%) in their respective age groups living below the poverty level.
| Age Bracket | Male | Female |
| Under 5 Years | 0 (0.0%) | 4 (30.8%) |
| 5 Years | 1 (100.0%) | 0 (0.0%) |
| 6 to 11 Years | 5 (50.0%) | 0 (0.0%) |
| 12 to 14 Years | 0 (0.0%) | 5 (100.0%) |
| 15 Years | 0 (0.0%) | 0 (0.0%) |
| 16 and 17 Years | 0 (0.0%) | 0 (0.0%) |
| 18 to 24 Years | 0 (0.0%) | 0 (0.0%) |
| 25 to 34 Years | 6 (46.2%) | 2 (28.6%) |
| 35 to 44 Years | 0 (0.0%) | 4 (33.3%) |
| 45 to 54 Years | 0 (0.0%) | 8 (57.1%) |
| 55 to 64 Years | 3 (11.5%) | 2 (10.5%) |
| 65 to 74 Years | 0 (0.0%) | 0 (0.0%) |
| 75 Years and over | 0 (0.0%) | 0 (0.0%) |
| Total | 15 (15.8%) | 25 (25.3%) |
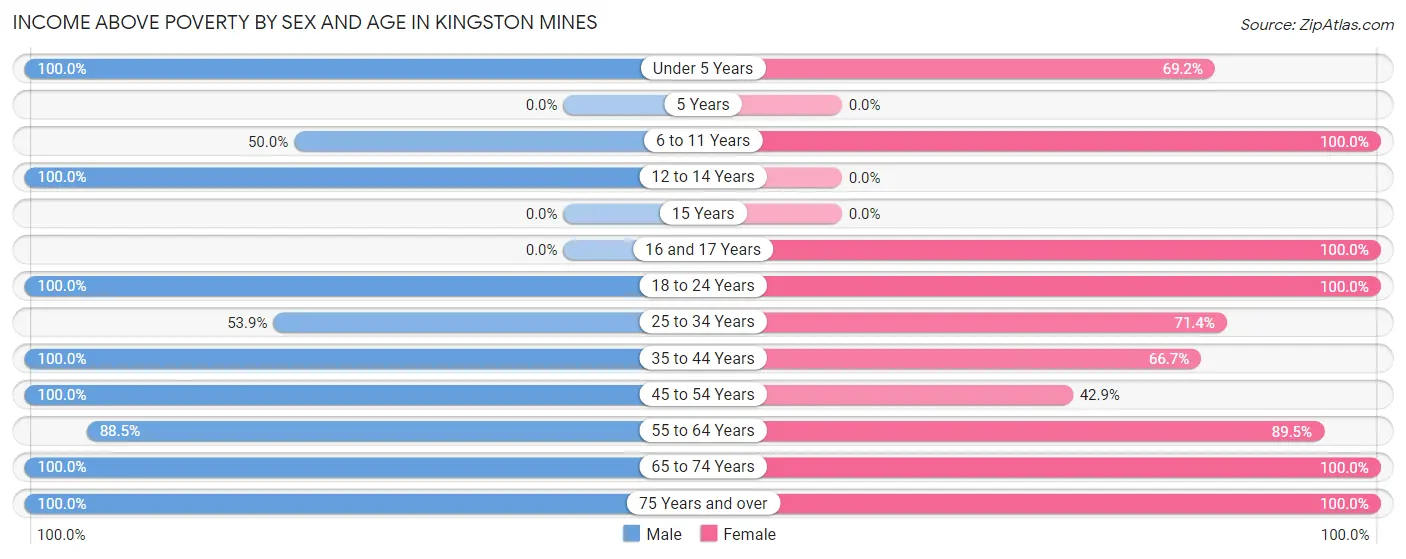
Income Above Poverty by Sex and Age in Kingston Mines
According to the poverty statistics in Kingston Mines, males aged under 5 years and females aged 6 to 11 years are the age groups that are most secure financially, with 100.0% of males and 100.0% of females in these age groups living above the poverty line.
| Age Bracket | Male | Female |
| Under 5 Years | 4 (100.0%) | 9 (69.2%) |
| 5 Years | 0 (0.0%) | 0 (0.0%) |
| 6 to 11 Years | 5 (50.0%) | 1 (100.0%) |
| 12 to 14 Years | 7 (100.0%) | 0 (0.0%) |
| 15 Years | 0 (0.0%) | 0 (0.0%) |
| 16 and 17 Years | 0 (0.0%) | 9 (100.0%) |
| 18 to 24 Years | 2 (100.0%) | 1 (100.0%) |
| 25 to 34 Years | 7 (53.8%) | 5 (71.4%) |
| 35 to 44 Years | 12 (100.0%) | 8 (66.7%) |
| 45 to 54 Years | 2 (100.0%) | 6 (42.9%) |
| 55 to 64 Years | 23 (88.5%) | 17 (89.5%) |
| 65 to 74 Years | 9 (100.0%) | 10 (100.0%) |
| 75 Years and over | 9 (100.0%) | 8 (100.0%) |
| Total | 80 (84.2%) | 74 (74.8%) |
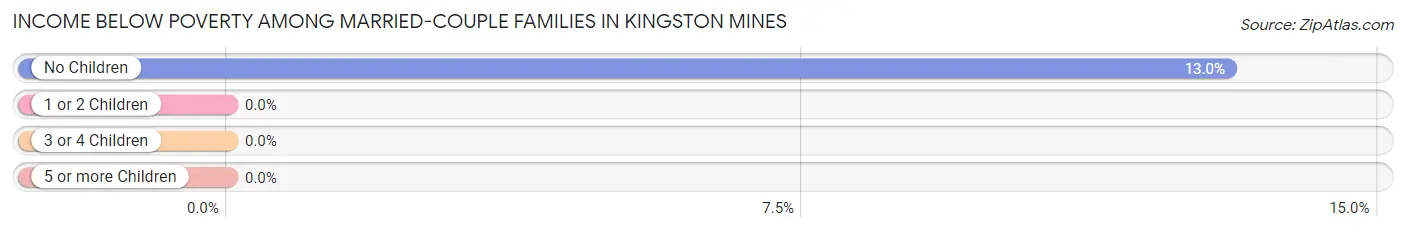
Income Below Poverty Among Married-Couple Families in Kingston Mines
The poverty statistics for married-couple families in Kingston Mines show that 7.7% or 3 of the total 39 families live below the poverty line. Families with no children have the highest poverty rate of 13.0%, comprising of 3 families. On the other hand, families with 1 or 2 children have the lowest poverty rate of 0.0%, which includes 0 families.
| Children | Above Poverty | Below Poverty |
| No Children | 20 (87.0%) | 3 (13.0%) |
| 1 or 2 Children | 13 (100.0%) | 0 (0.0%) |
| 3 or 4 Children | 3 (100.0%) | 0 (0.0%) |
| 5 or more Children | 0 (0.0%) | 0 (0.0%) |
| Total | 36 (92.3%) | 3 (7.7%) |
Income Below Poverty Among Single-Parent Households in Kingston Mines
According to the poverty data in Kingston Mines, 20.0% or 1 single-father households and 71.4% or 5 single-mother households are living below the poverty line. Among single-father households, those with 1 or 2 children have the highest poverty rate, with 1 households (100.0%) experiencing poverty. Likewise, among single-mother households, those with 1 or 2 children have the highest poverty rate, with 5 households (71.4%) falling below the poverty line.
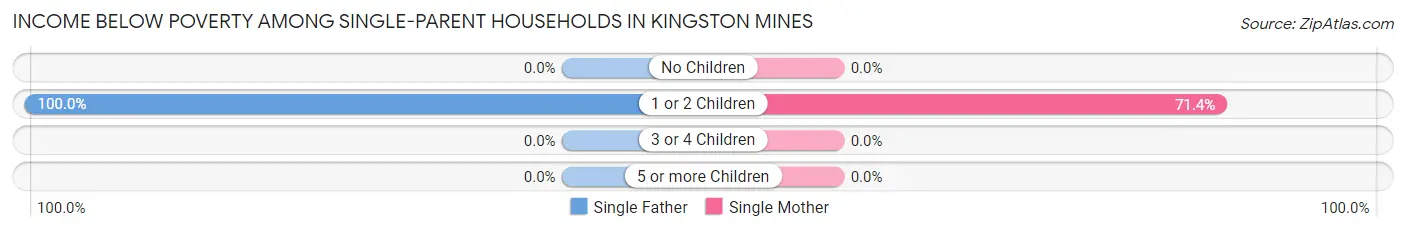
| Children | Single Father | Single Mother |
| No Children | 0 (0.0%) | 0 (0.0%) |
| 1 or 2 Children | 1 (100.0%) | 5 (71.4%) |
| 3 or 4 Children | 0 (0.0%) | 0 (0.0%) |
| 5 or more Children | 0 (0.0%) | 0 (0.0%) |
| Total | 1 (20.0%) | 5 (71.4%) |
Income Below Poverty Among Married-Couple vs Single-Parent Households in Kingston Mines
The poverty data for Kingston Mines shows that 3 of the married-couple family households (7.7%) and 6 of the single-parent households (50.0%) are living below the poverty level. Within the married-couple family households, those with no children have the highest poverty rate, with 3 households (13.0%) falling below the poverty line. Among the single-parent households, those with 1 or 2 children have the highest poverty rate, with 6 household (75.0%) living below poverty.
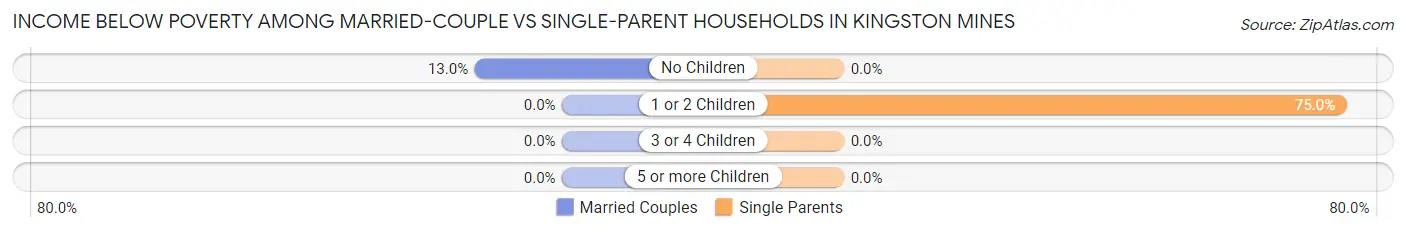
| Children | Married-Couple Families | Single-Parent Households |
| No Children | 3 (13.0%) | 0 (0.0%) |
| 1 or 2 Children | 0 (0.0%) | 6 (75.0%) |
| 3 or 4 Children | 0 (0.0%) | 0 (0.0%) |
| 5 or more Children | 0 (0.0%) | 0 (0.0%) |
| Total | 3 (7.7%) | 6 (50.0%) |
Race in Kingston Mines
The most populous races in Kingston Mines are White / Caucasian (186 | 95.9%), Hispanic or Latino (10 | 5.1%), and Two or more Races (7 | 3.6%).
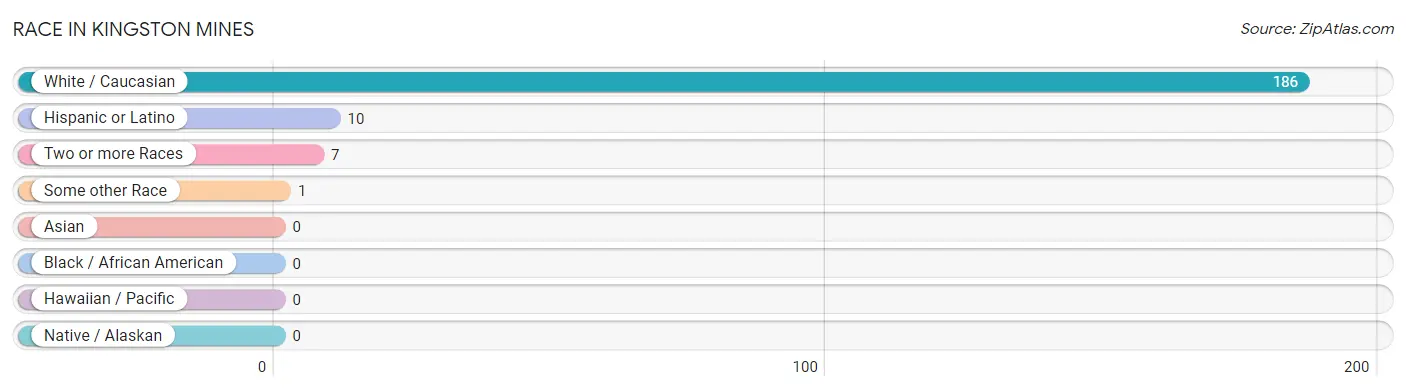
| Race | # Population | % Population |
| Asian | 0 | 0.0% |
| Black / African American | 0 | 0.0% |
| Hawaiian / Pacific | 0 | 0.0% |
| Hispanic or Latino | 10 | 5.1% |
| Native / Alaskan | 0 | 0.0% |
| White / Caucasian | 186 | 95.9% |
| Two or more Races | 7 | 3.6% |
| Some other Race | 1 | 0.5% |
| Total | 194 | 100.0% |
Ancestry in Kingston Mines
The most populous ancestries reported in Kingston Mines are German (62 | 32.0%), Irish (44 | 22.7%), English (27 | 13.9%), American (13 | 6.7%), and Italian (11 | 5.7%), together accounting for 80.9% of all Kingston Mines residents.
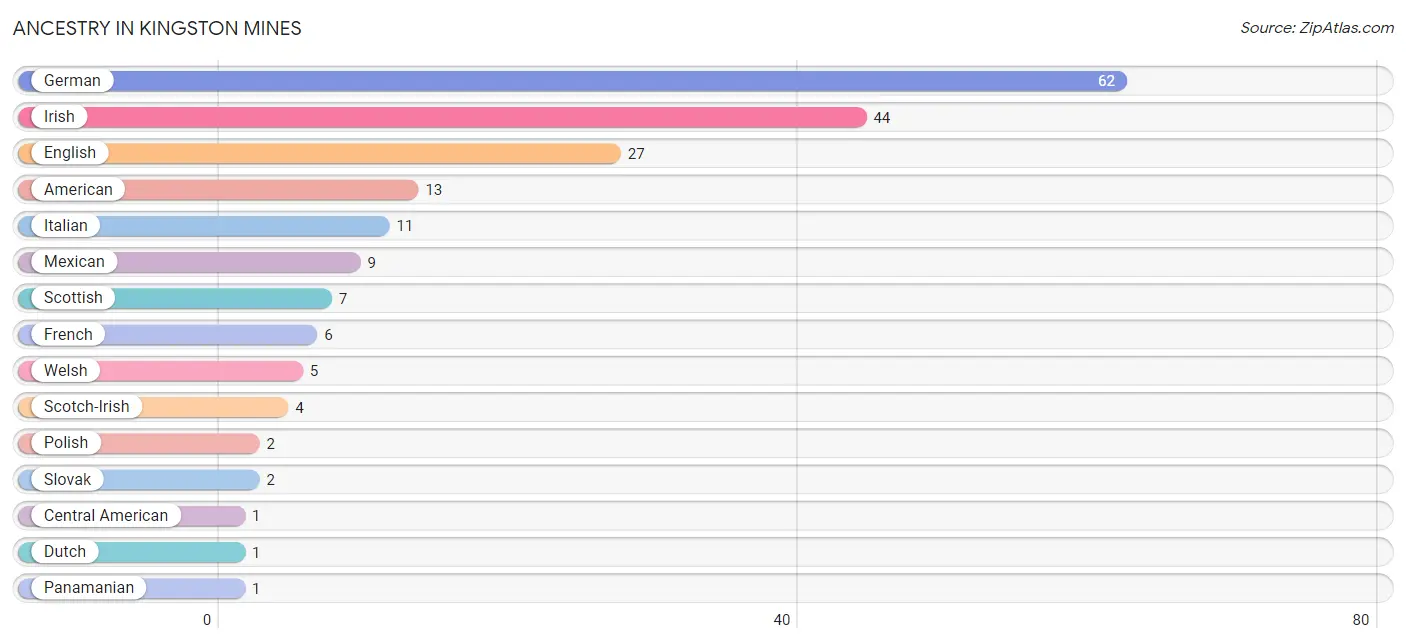
| Ancestry | # Population | % Population |
| American | 13 | 6.7% |
| Central American | 1 | 0.5% |
| Dutch | 1 | 0.5% |
| English | 27 | 13.9% |
| French | 6 | 3.1% |
| German | 62 | 32.0% |
| Irish | 44 | 22.7% |
| Italian | 11 | 5.7% |
| Mexican | 9 | 4.6% |
| Panamanian | 1 | 0.5% |
| Polish | 2 | 1.0% |
| Scotch-Irish | 4 | 2.1% |
| Scottish | 7 | 3.6% |
| Slovak | 2 | 1.0% |
| Welsh | 5 | 2.6% | View All 15 Rows |
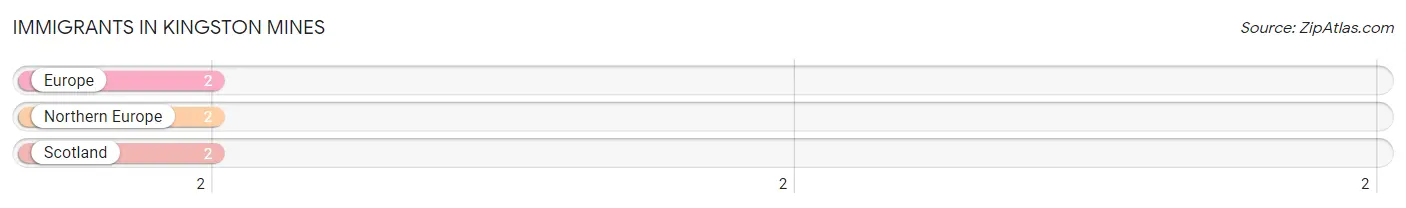
Immigrants in Kingston Mines
The most numerous immigrant groups reported in Kingston Mines came from Europe (2 | 1.0%), Northern Europe (2 | 1.0%), and Scotland (2 | 1.0%), together accounting for 3.1% of all Kingston Mines residents.
| Immigration Origin | # Population | % Population |
| Europe | 2 | 1.0% |
| Northern Europe | 2 | 1.0% |
| Scotland | 2 | 1.0% | View All 3 Rows |
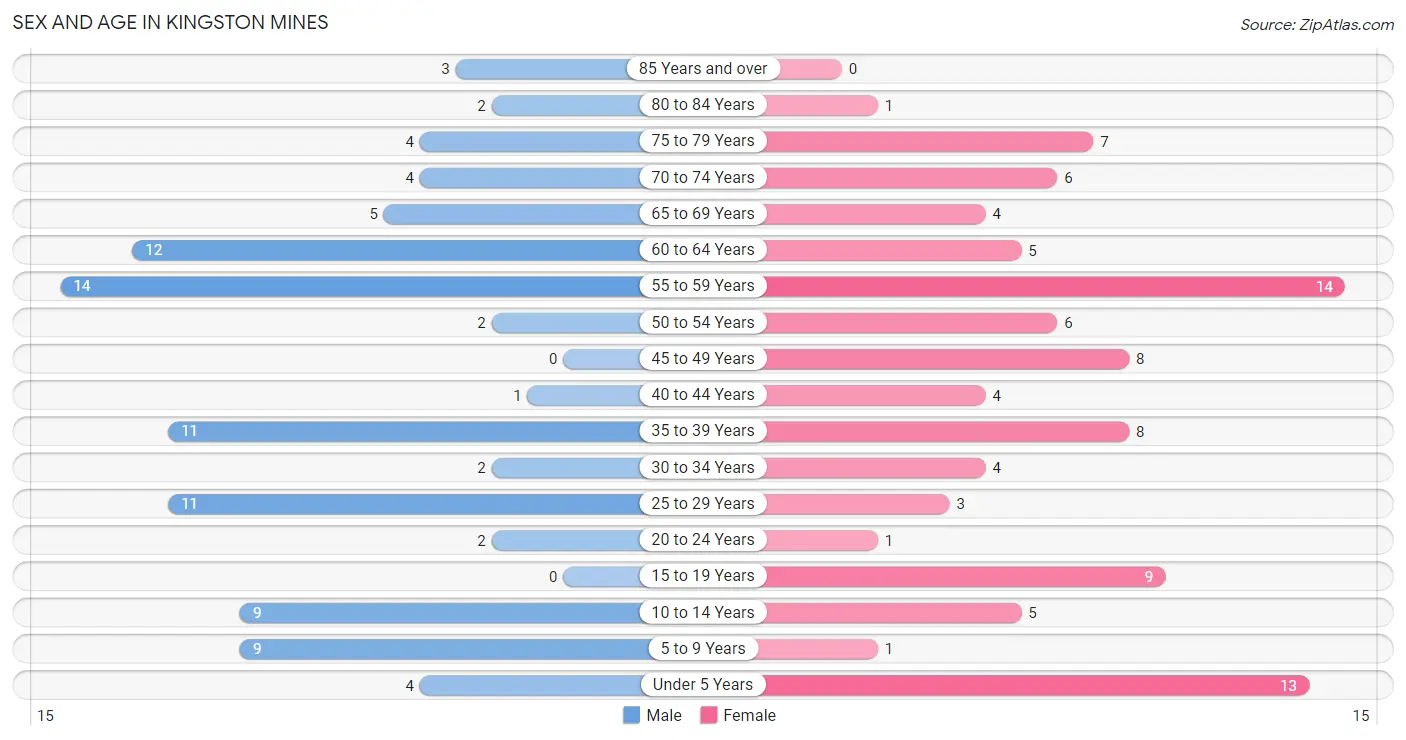
Sex and Age in Kingston Mines
Sex and Age in Kingston Mines
The most populous age groups in Kingston Mines are 55 to 59 Years (14 | 14.7%) for men and 55 to 59 Years (14 | 14.1%) for women.
| Age Bracket | Male | Female |
| Under 5 Years | 4 (4.2%) | 13 (13.1%) |
| 5 to 9 Years | 9 (9.5%) | 1 (1.0%) |
| 10 to 14 Years | 9 (9.5%) | 5 (5.1%) |
| 15 to 19 Years | 0 (0.0%) | 9 (9.1%) |
| 20 to 24 Years | 2 (2.1%) | 1 (1.0%) |
| 25 to 29 Years | 11 (11.6%) | 3 (3.0%) |
| 30 to 34 Years | 2 (2.1%) | 4 (4.0%) |
| 35 to 39 Years | 11 (11.6%) | 8 (8.1%) |
| 40 to 44 Years | 1 (1.1%) | 4 (4.0%) |
| 45 to 49 Years | 0 (0.0%) | 8 (8.1%) |
| 50 to 54 Years | 2 (2.1%) | 6 (6.1%) |
| 55 to 59 Years | 14 (14.7%) | 14 (14.1%) |
| 60 to 64 Years | 12 (12.6%) | 5 (5.1%) |
| 65 to 69 Years | 5 (5.3%) | 4 (4.0%) |
| 70 to 74 Years | 4 (4.2%) | 6 (6.1%) |
| 75 to 79 Years | 4 (4.2%) | 7 (7.1%) |
| 80 to 84 Years | 2 (2.1%) | 1 (1.0%) |
| 85 Years and over | 3 (3.2%) | 0 (0.0%) |
| Total | 95 (100.0%) | 99 (100.0%) |
Families and Households in Kingston Mines
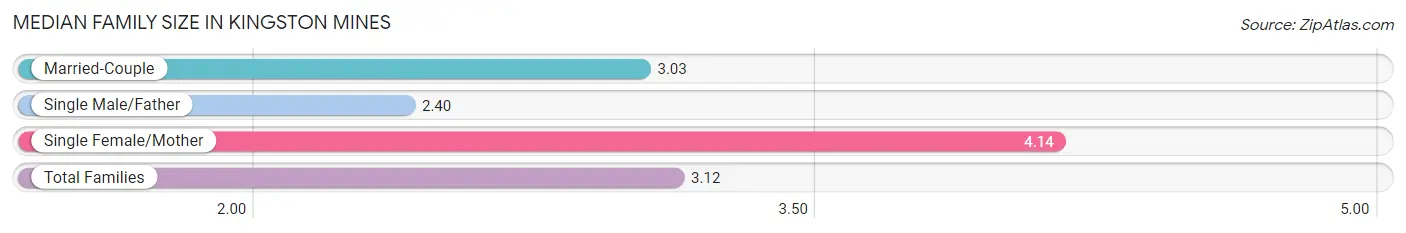
Median Family Size in Kingston Mines
The median family size in Kingston Mines is 3.12 persons per family, with single female/mother families (7 | 13.7%) accounting for the largest median family size of 4.14 persons per family. On the other hand, single male/father families (5 | 9.8%) represent the smallest median family size with 2.40 persons per family.
| Family Type | # Families | Family Size |
| Married-Couple | 39 (76.5%) | 3.03 |
| Single Male/Father | 5 (9.8%) | 2.40 |
| Single Female/Mother | 7 (13.7%) | 4.14 |
| Total Families | 51 (100.0%) | 3.12 |
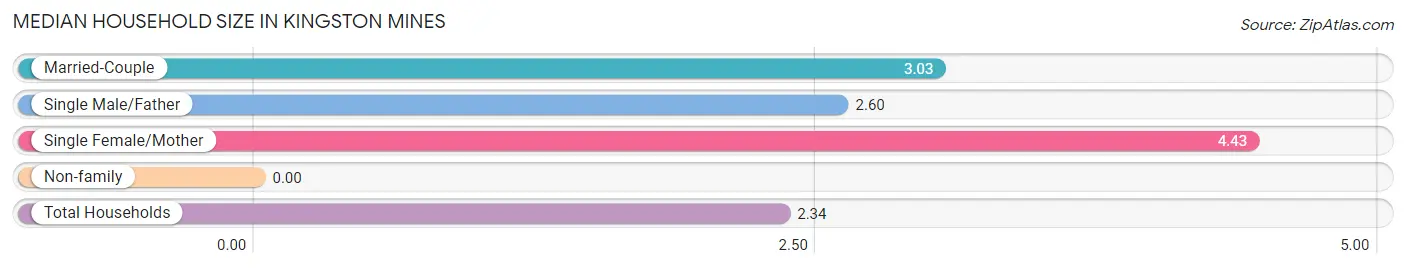
Median Household Size in Kingston Mines
| Household Type | # Households | Household Size |
| Married-Couple | 39 (47.0%) | 3.03 |
| Single Male/Father | 5 (6.0%) | 2.60 |
| Single Female/Mother | 7 (8.4%) | 4.43 |
| Non-family | 32 (38.6%) | - |
| Total Households | 83 (100.0%) | 2.34 |
Household Size by Marriage Status in Kingston Mines
Out of a total of 83 households in Kingston Mines, 51 (61.5%) are family households, while 32 (38.6%) are nonfamily households. The most numerous type of family households are 2-person households, comprising 24, and the most common type of nonfamily households are 1-person households, comprising 32.
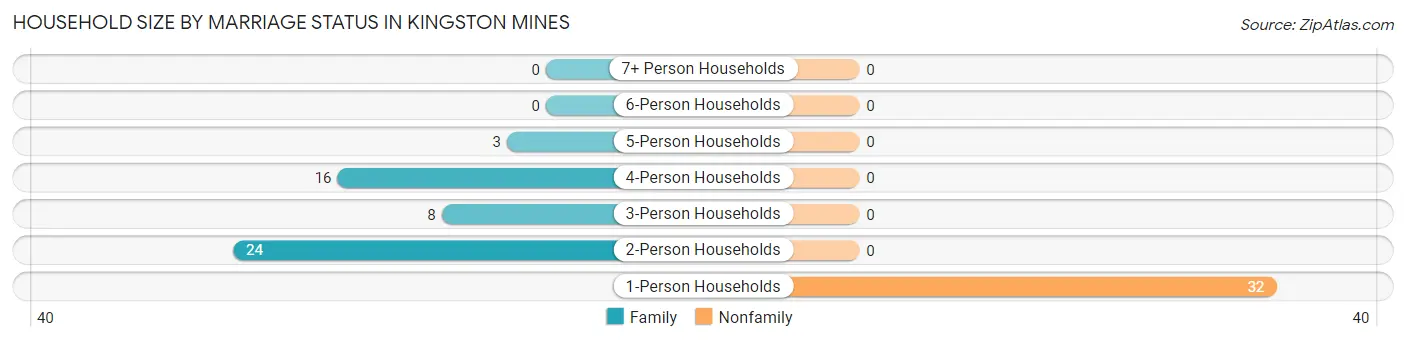
| Household Size | Family Households | Nonfamily Households |
| 1-Person Households | - | 32 (38.6%) |
| 2-Person Households | 24 (28.9%) | 0 (0.0%) |
| 3-Person Households | 8 (9.6%) | 0 (0.0%) |
| 4-Person Households | 16 (19.3%) | 0 (0.0%) |
| 5-Person Households | 3 (3.6%) | 0 (0.0%) |
| 6-Person Households | 0 (0.0%) | 0 (0.0%) |
| 7+ Person Households | 0 (0.0%) | 0 (0.0%) |
| Total | 51 (61.5%) | 32 (38.6%) |
Female Fertility in Kingston Mines
Fertility by Age in Kingston Mines
Average fertility rate in Kingston Mines is 135.0 births per 1,000 women. Women in the age bracket of 20 to 34 years have the highest fertility rate with 250.0 births per 1,000 women. Women in the age bracket of 35 to 50 years acount for 60.0% of all women with births.
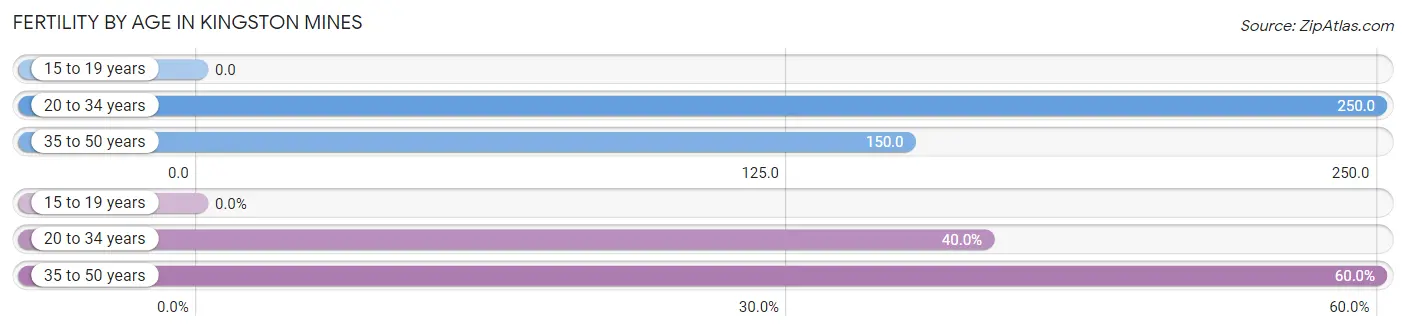
| Age Bracket | Women with Births | Births / 1,000 Women |
| 15 to 19 years | 0 (0.0%) | 0.0 |
| 20 to 34 years | 2 (40.0%) | 250.0 |
| 35 to 50 years | 3 (60.0%) | 150.0 |
| Total | 5 (100.0%) | 135.0 |
Fertility by Age by Marriage Status in Kingston Mines
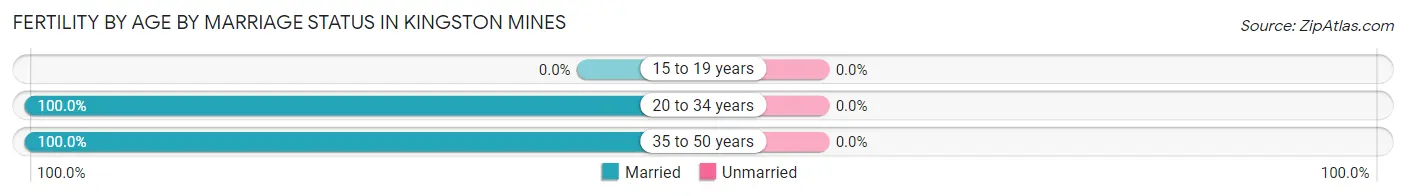
| Age Bracket | Married | Unmarried |
| 15 to 19 years | 0 (0.0%) | 0 (0.0%) |
| 20 to 34 years | 2 (100.0%) | 0 (0.0%) |
| 35 to 50 years | 3 (100.0%) | 0 (0.0%) |
| Total | 5 (100.0%) | 0 (0.0%) |
Fertility by Education in Kingston Mines
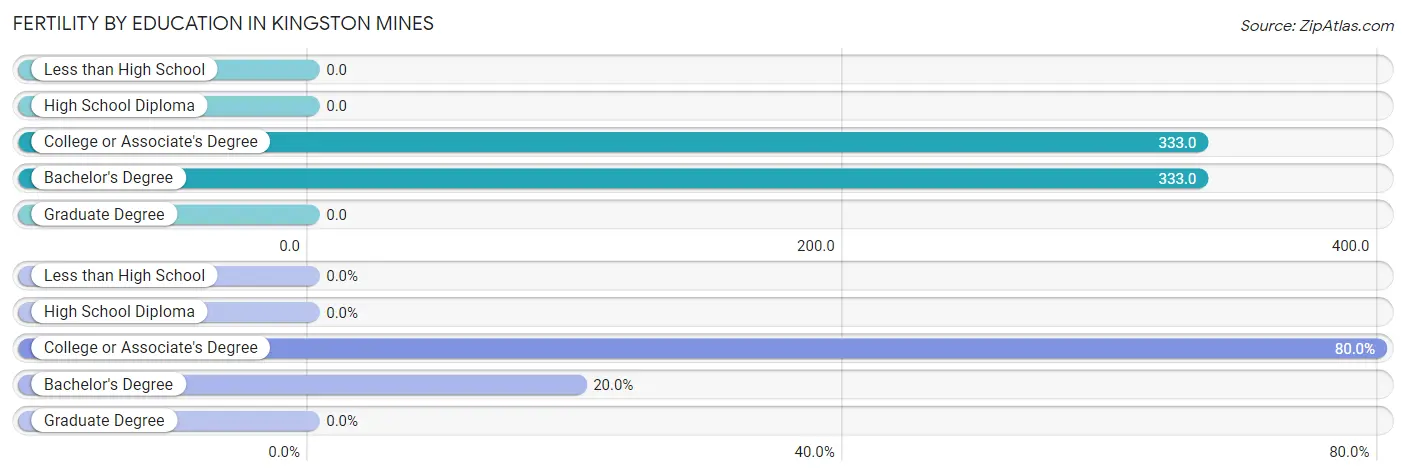
| Educational Attainment | Women with Births | Births / 1,000 Women |
| Less than High School | 0 (0.0%) | 0.0 |
| High School Diploma | 0 (0.0%) | 0.0 |
| College or Associate's Degree | 4 (80.0%) | 333.0 |
| Bachelor's Degree | 1 (20.0%) | 333.0 |
| Graduate Degree | 0 (0.0%) | 0.0 |
| Total | 5 (100.0%) | 135.0 |
Fertility by Education by Marriage Status in Kingston Mines
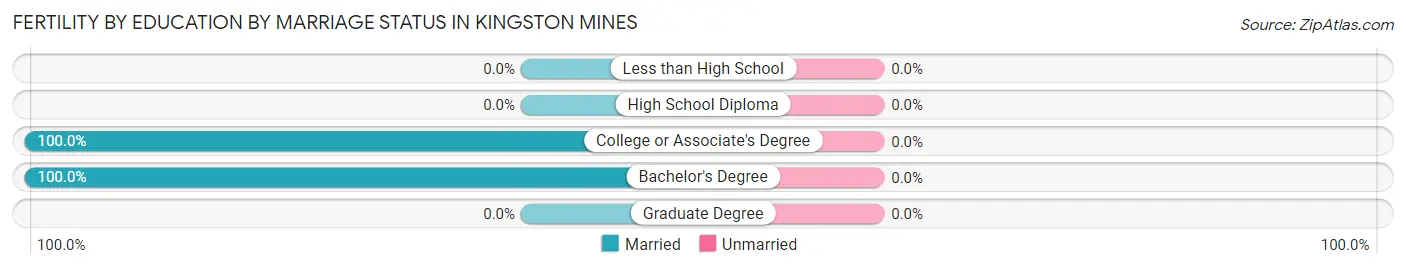
| Educational Attainment | Married | Unmarried |
| Less than High School | 0 (0.0%) | 0 (0.0%) |
| High School Diploma | 0 (0.0%) | 0 (0.0%) |
| College or Associate's Degree | 4 (100.0%) | 0 (0.0%) |
| Bachelor's Degree | 1 (100.0%) | 0 (0.0%) |
| Graduate Degree | 0 (0.0%) | 0 (0.0%) |
| Total | 5 (100.0%) | 0 (0.0%) |
Employment Characteristics in Kingston Mines
Employment by Class of Employer in Kingston Mines
Among the 69 employed individuals in Kingston Mines, private company employees (45 | 65.2%), local government employees (16 | 23.2%), and self-employed (not incorporated) (3 | 4.3%) make up the most common classes of employment.
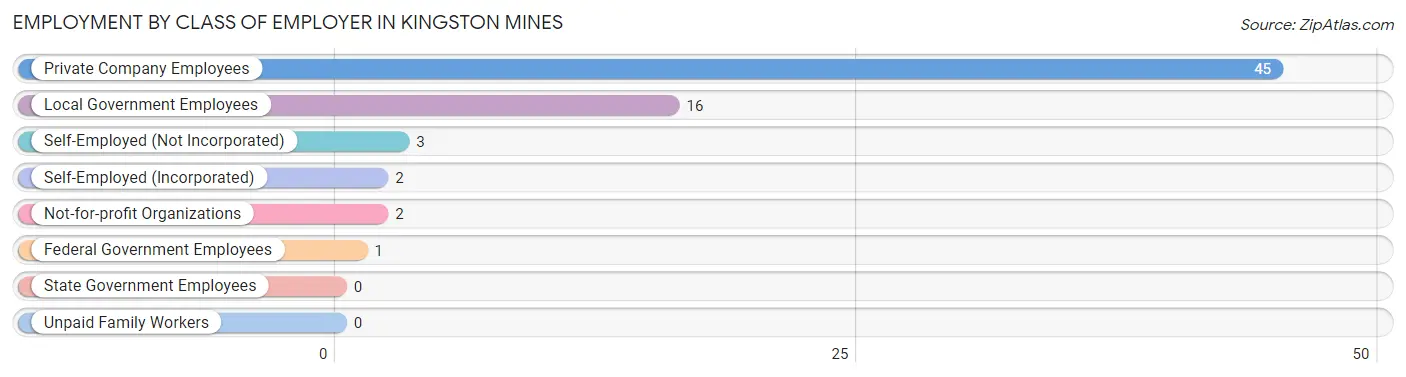
| Employer Class | # Employees | % Employees |
| Private Company Employees | 45 | 65.2% |
| Self-Employed (Incorporated) | 2 | 2.9% |
| Self-Employed (Not Incorporated) | 3 | 4.3% |
| Not-for-profit Organizations | 2 | 2.9% |
| Local Government Employees | 16 | 23.2% |
| State Government Employees | 0 | 0.0% |
| Federal Government Employees | 1 | 1.5% |
| Unpaid Family Workers | 0 | 0.0% |
| Total | 69 | 100.0% |
Employment Status by Age in Kingston Mines
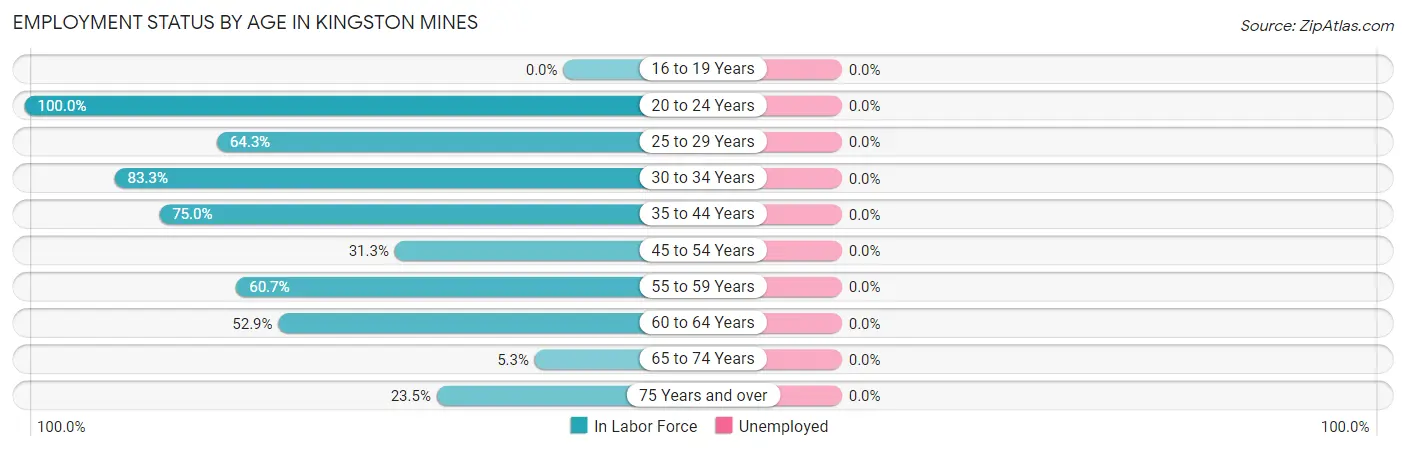
| Age Bracket | In Labor Force | Unemployed |
| 16 to 19 Years | 0 (0.0%) | 0 (0.0%) |
| 20 to 24 Years | 3 (100.0%) | 0 (0.0%) |
| 25 to 29 Years | 9 (64.3%) | 0 (0.0%) |
| 30 to 34 Years | 5 (83.3%) | 0 (0.0%) |
| 35 to 44 Years | 18 (75.0%) | 0 (0.0%) |
| 45 to 54 Years | 5 (31.3%) | 0 (0.0%) |
| 55 to 59 Years | 17 (60.7%) | 0 (0.0%) |
| 60 to 64 Years | 9 (52.9%) | 0 (0.0%) |
| 65 to 74 Years | 1 (5.3%) | 0 (0.0%) |
| 75 Years and over | 4 (23.5%) | 0 (0.0%) |
| Total | 71 (46.4%) | 0 (0.0%) |
Employment Status by Educational Attainment in Kingston Mines
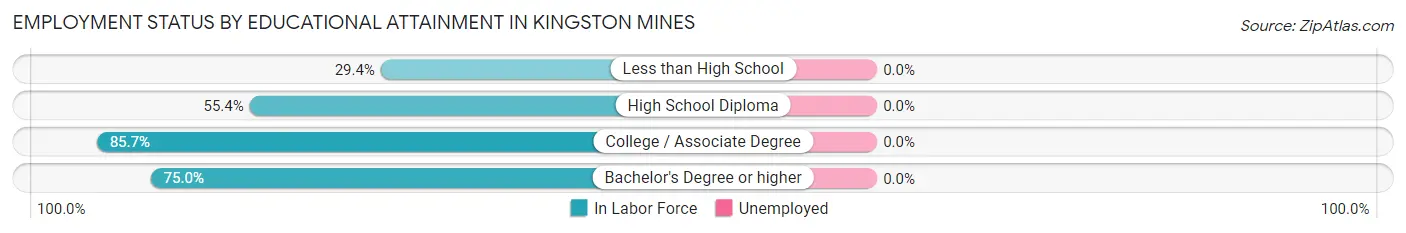
| Educational Attainment | In Labor Force | Unemployed |
| Less than High School | 5 (29.4%) | 0 (0.0%) |
| High School Diploma | 31 (55.4%) | 0 (0.0%) |
| College / Associate Degree | 24 (85.7%) | 0 (0.0%) |
| Bachelor's Degree or higher | 3 (75.0%) | 0 (0.0%) |
| Total | 63 (60.0%) | 0 (0.0%) |
Employment Occupations by Sex in Kingston Mines
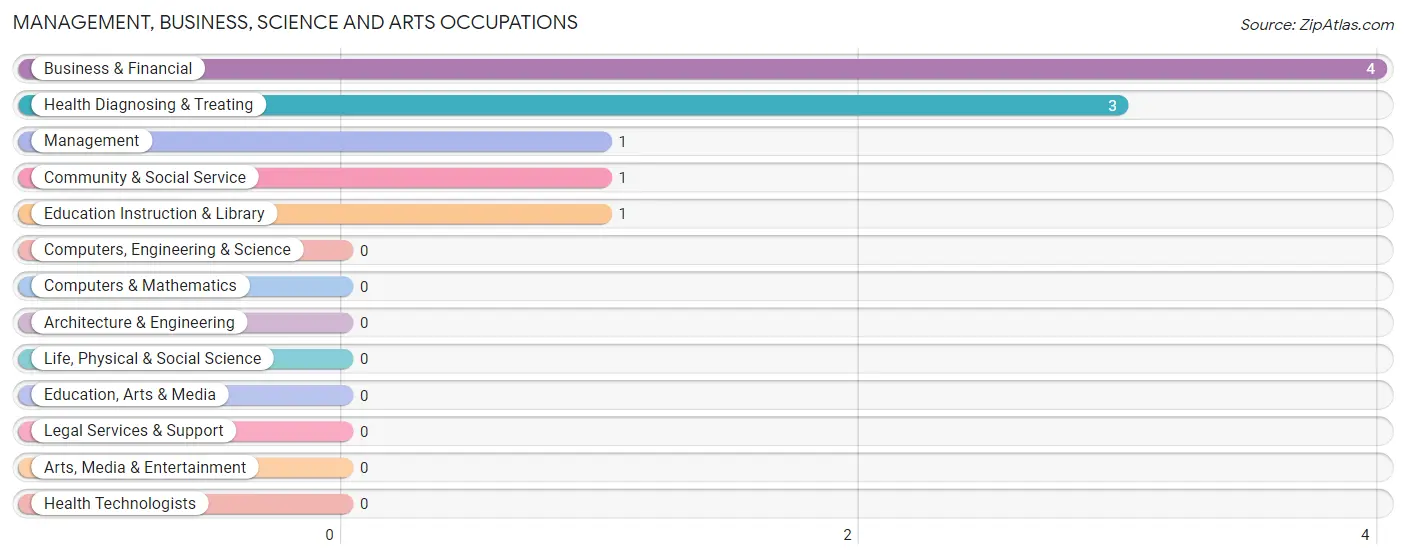
Management, Business, Science and Arts Occupations
The most common Management, Business, Science and Arts occupations in Kingston Mines are Business & Financial (4 | 5.6%), Health Diagnosing & Treating (3 | 4.2%), Management (1 | 1.4%), Community & Social Service (1 | 1.4%), and Education Instruction & Library (1 | 1.4%).
Management, Business, Science and Arts Occupations by Sex
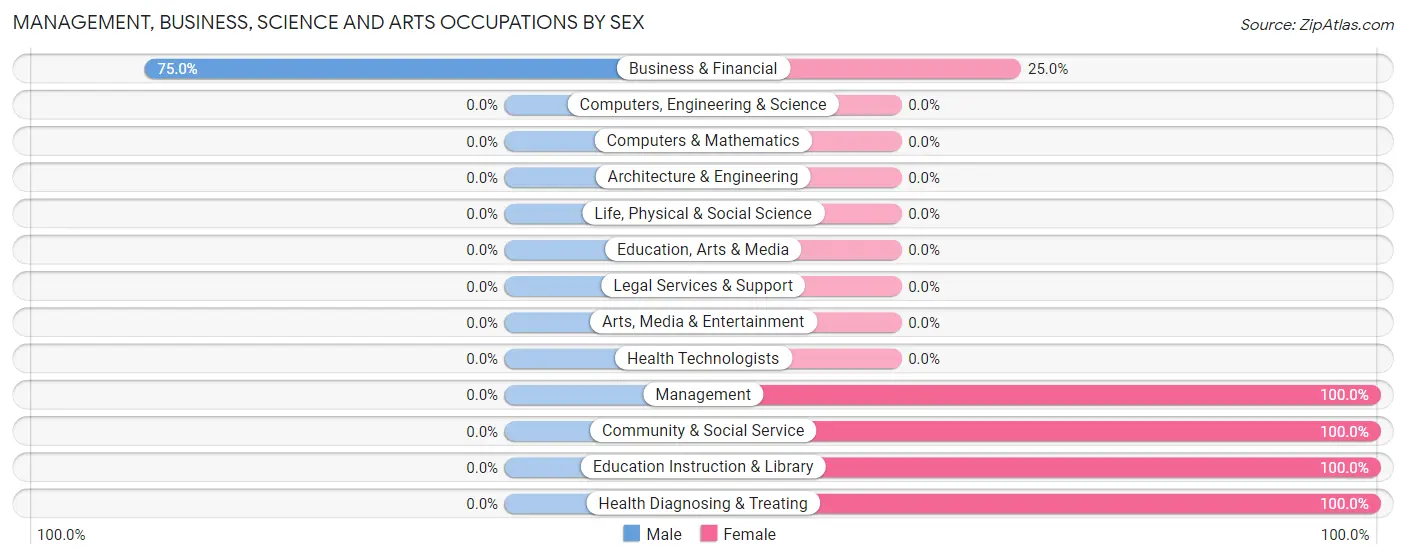
| Occupation | Male | Female |
| Management | 0 (0.0%) | 1 (100.0%) |
| Business & Financial | 3 (75.0%) | 1 (25.0%) |
| Computers, Engineering & Science | 0 (0.0%) | 0 (0.0%) |
| Computers & Mathematics | 0 (0.0%) | 0 (0.0%) |
| Architecture & Engineering | 0 (0.0%) | 0 (0.0%) |
| Life, Physical & Social Science | 0 (0.0%) | 0 (0.0%) |
| Community & Social Service | 0 (0.0%) | 1 (100.0%) |
| Education, Arts & Media | 0 (0.0%) | 0 (0.0%) |
| Legal Services & Support | 0 (0.0%) | 0 (0.0%) |
| Education Instruction & Library | 0 (0.0%) | 1 (100.0%) |
| Arts, Media & Entertainment | 0 (0.0%) | 0 (0.0%) |
| Health Diagnosing & Treating | 0 (0.0%) | 3 (100.0%) |
| Health Technologists | 0 (0.0%) | 0 (0.0%) |
| Total (Category) | 3 (33.3%) | 6 (66.7%) |
| Total (Overall) | 43 (60.6%) | 28 (39.4%) |
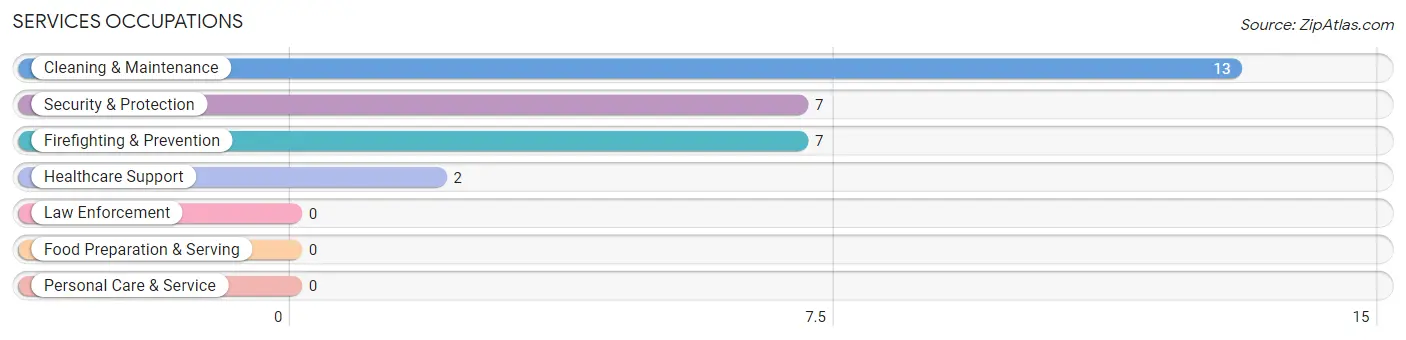
Services Occupations
The most common Services occupations in Kingston Mines are Cleaning & Maintenance (13 | 18.3%), Security & Protection (7 | 9.9%), Firefighting & Prevention (7 | 9.9%), and Healthcare Support (2 | 2.8%).
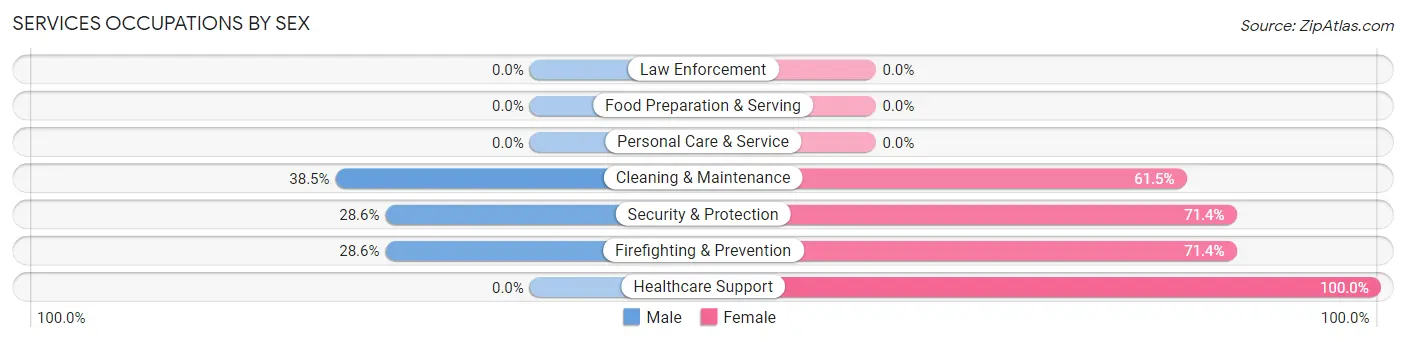
Services Occupations by Sex
Within the Services occupations in Kingston Mines, the most male-oriented occupations are Cleaning & Maintenance (38.5%), Security & Protection (28.6%), and Firefighting & Prevention (28.6%), while the most female-oriented occupations are Healthcare Support (100.0%), Security & Protection (71.4%), and Firefighting & Prevention (71.4%).
| Occupation | Male | Female |
| Healthcare Support | 0 (0.0%) | 2 (100.0%) |
| Security & Protection | 2 (28.6%) | 5 (71.4%) |
| Firefighting & Prevention | 2 (28.6%) | 5 (71.4%) |
| Law Enforcement | 0 (0.0%) | 0 (0.0%) |
| Food Preparation & Serving | 0 (0.0%) | 0 (0.0%) |
| Cleaning & Maintenance | 5 (38.5%) | 8 (61.5%) |
| Personal Care & Service | 0 (0.0%) | 0 (0.0%) |
| Total (Category) | 7 (31.8%) | 15 (68.2%) |
| Total (Overall) | 43 (60.6%) | 28 (39.4%) |
Sales and Office Occupations
The most common Sales and Office occupations in Kingston Mines are Office & Administration (8 | 11.3%), and Sales & Related (6 | 8.5%).
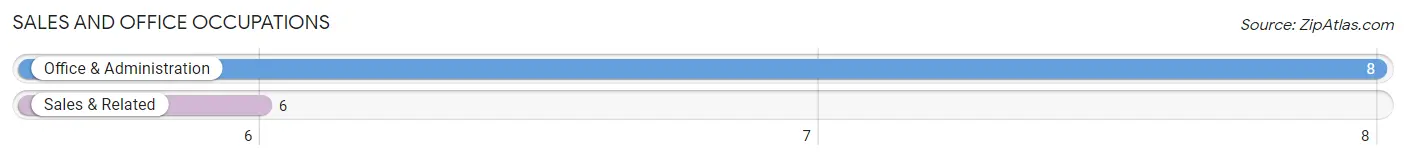
Sales and Office Occupations by Sex

| Occupation | Male | Female |
| Sales & Related | 6 (100.0%) | 0 (0.0%) |
| Office & Administration | 2 (25.0%) | 6 (75.0%) |
| Total (Category) | 8 (57.1%) | 6 (42.9%) |
| Total (Overall) | 43 (60.6%) | 28 (39.4%) |
Natural Resources, Construction and Maintenance Occupations
The most common Natural Resources, Construction and Maintenance occupations in Kingston Mines are Construction & Extraction (6 | 8.5%), and Installation, Maintenance & Repair (3 | 4.2%).
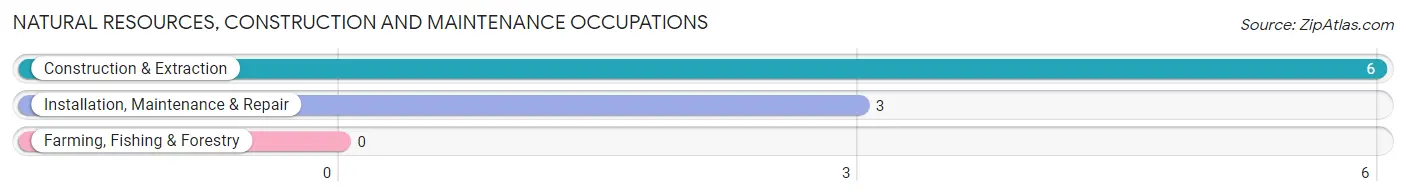
Natural Resources, Construction and Maintenance Occupations by Sex
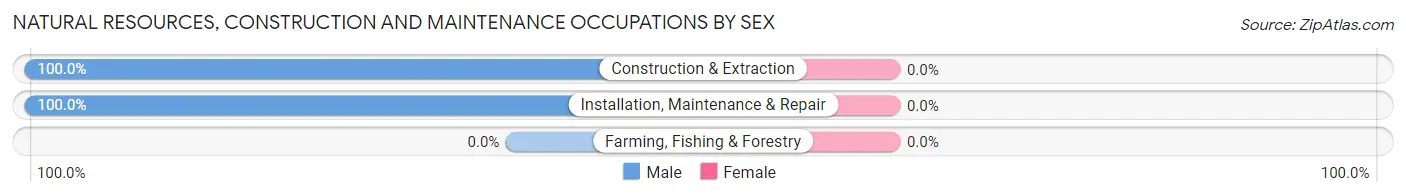
| Occupation | Male | Female |
| Farming, Fishing & Forestry | 0 (0.0%) | 0 (0.0%) |
| Construction & Extraction | 6 (100.0%) | 0 (0.0%) |
| Installation, Maintenance & Repair | 3 (100.0%) | 0 (0.0%) |
| Total (Category) | 9 (100.0%) | 0 (0.0%) |
| Total (Overall) | 43 (60.6%) | 28 (39.4%) |
Production, Transportation and Moving Occupations
The most common Production, Transportation and Moving occupations in Kingston Mines are Production (11 | 15.5%), Transportation (4 | 5.6%), and Material Moving (2 | 2.8%).
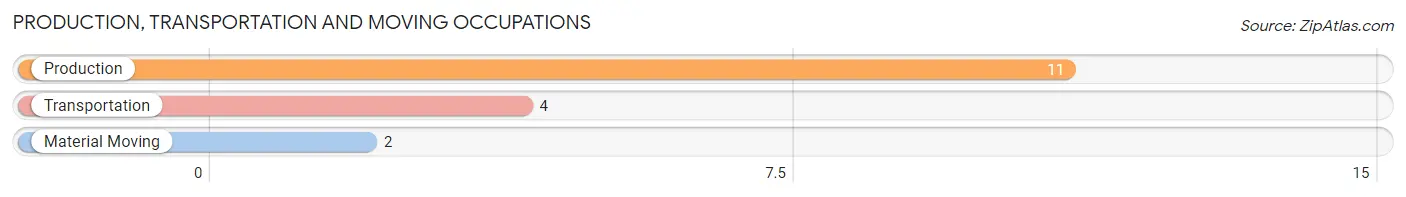
Production, Transportation and Moving Occupations by Sex
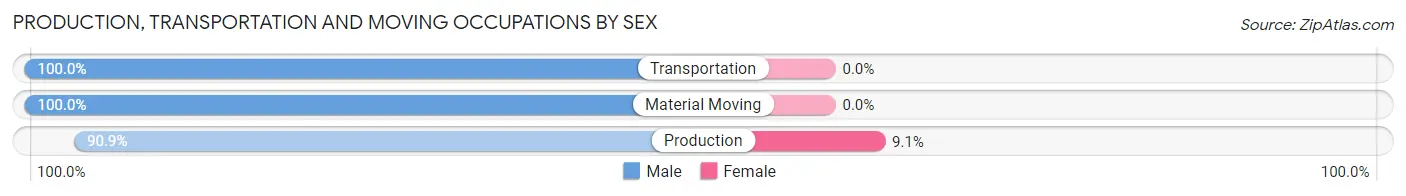
| Occupation | Male | Female |
| Production | 10 (90.9%) | 1 (9.1%) |
| Transportation | 4 (100.0%) | 0 (0.0%) |
| Material Moving | 2 (100.0%) | 0 (0.0%) |
| Total (Category) | 16 (94.1%) | 1 (5.9%) |
| Total (Overall) | 43 (60.6%) | 28 (39.4%) |
Employment Industries by Sex in Kingston Mines
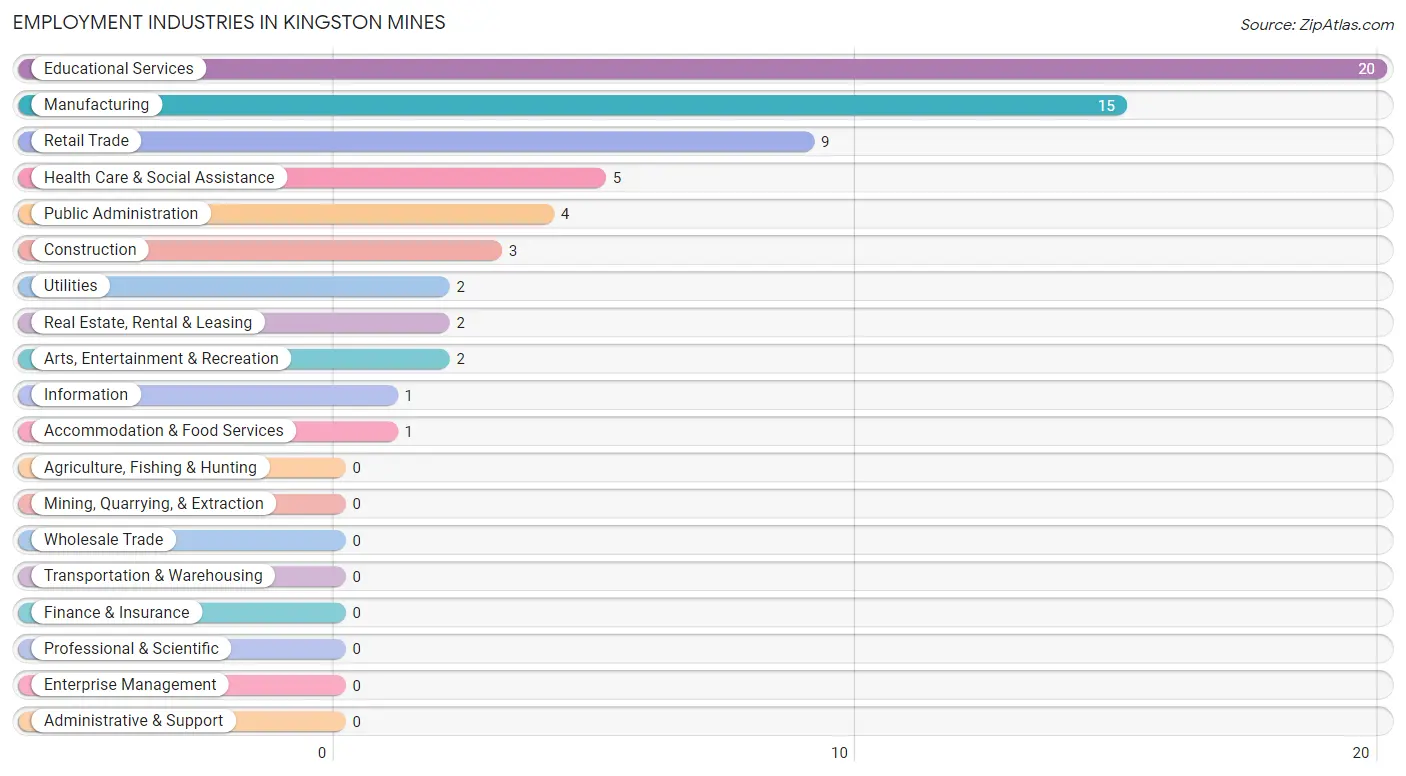
Employment Industries in Kingston Mines
The major employment industries in Kingston Mines include Educational Services (20 | 28.2%), Manufacturing (15 | 21.1%), Retail Trade (9 | 12.7%), Health Care & Social Assistance (5 | 7.0%), and Public Administration (4 | 5.6%).
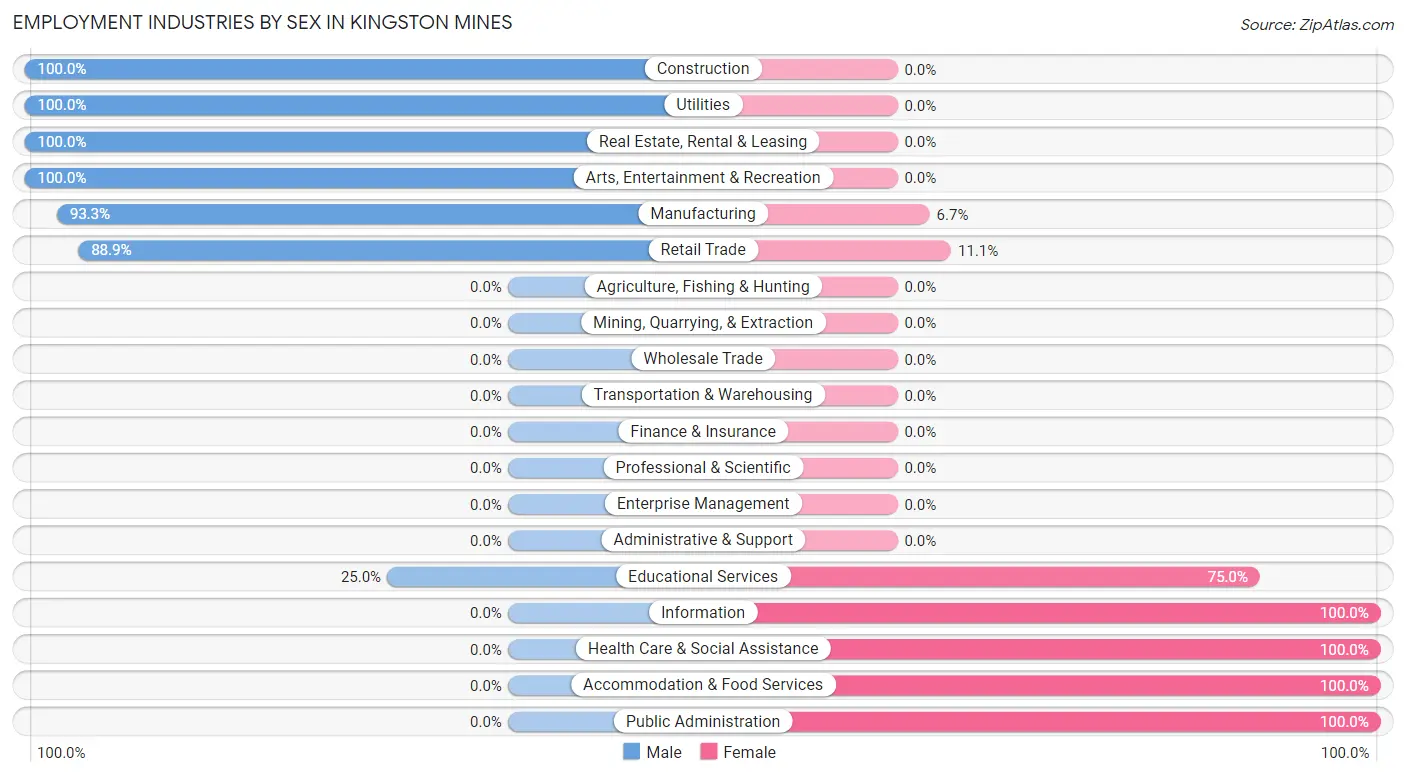
Employment Industries by Sex in Kingston Mines
The Kingston Mines industries that see more men than women are Construction (100.0%), Utilities (100.0%), and Real Estate, Rental & Leasing (100.0%), whereas the industries that tend to have a higher number of women are Information (100.0%), Health Care & Social Assistance (100.0%), and Accommodation & Food Services (100.0%).
| Industry | Male | Female |
| Agriculture, Fishing & Hunting | 0 (0.0%) | 0 (0.0%) |
| Mining, Quarrying, & Extraction | 0 (0.0%) | 0 (0.0%) |
| Construction | 3 (100.0%) | 0 (0.0%) |
| Manufacturing | 14 (93.3%) | 1 (6.7%) |
| Wholesale Trade | 0 (0.0%) | 0 (0.0%) |
| Retail Trade | 8 (88.9%) | 1 (11.1%) |
| Transportation & Warehousing | 0 (0.0%) | 0 (0.0%) |
| Utilities | 2 (100.0%) | 0 (0.0%) |
| Information | 0 (0.0%) | 1 (100.0%) |
| Finance & Insurance | 0 (0.0%) | 0 (0.0%) |
| Real Estate, Rental & Leasing | 2 (100.0%) | 0 (0.0%) |
| Professional & Scientific | 0 (0.0%) | 0 (0.0%) |
| Enterprise Management | 0 (0.0%) | 0 (0.0%) |
| Administrative & Support | 0 (0.0%) | 0 (0.0%) |
| Educational Services | 5 (25.0%) | 15 (75.0%) |
| Health Care & Social Assistance | 0 (0.0%) | 5 (100.0%) |
| Arts, Entertainment & Recreation | 2 (100.0%) | 0 (0.0%) |
| Accommodation & Food Services | 0 (0.0%) | 1 (100.0%) |
| Public Administration | 0 (0.0%) | 4 (100.0%) |
| Total | 43 (60.6%) | 28 (39.4%) |
Education in Kingston Mines
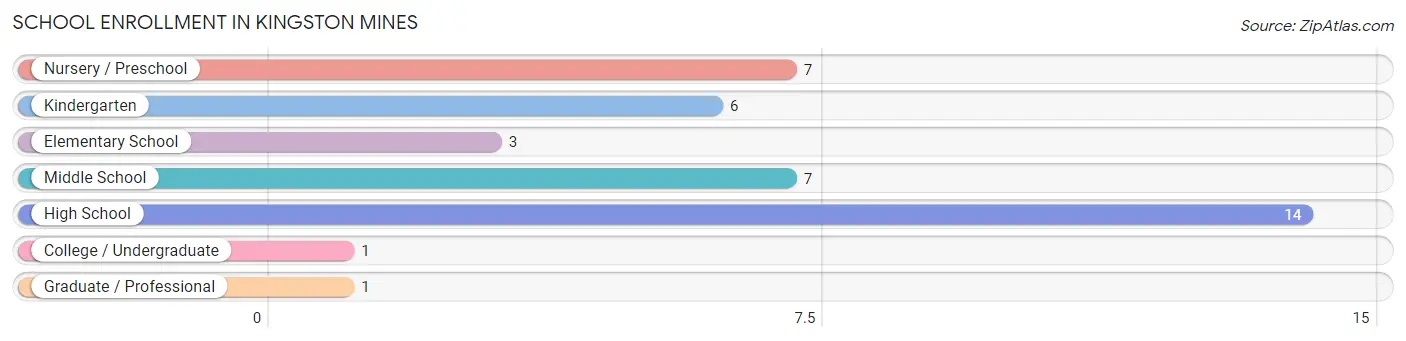
School Enrollment in Kingston Mines
The most common levels of schooling among the 39 students in Kingston Mines are high school (14 | 35.9%), nursery / preschool (7 | 17.9%), and middle school (7 | 17.9%).
| School Level | # Students | % Students |
| Nursery / Preschool | 7 | 17.9% |
| Kindergarten | 6 | 15.4% |
| Elementary School | 3 | 7.7% |
| Middle School | 7 | 17.9% |
| High School | 14 | 35.9% |
| College / Undergraduate | 1 | 2.6% |
| Graduate / Professional | 1 | 2.6% |
| Total | 39 | 100.0% |
School Enrollment by Age by Funding Source in Kingston Mines
Out of a total of 39 students who are enrolled in schools in Kingston Mines, 8 (20.5%) attend a private institution, while the remaining 31 (79.5%) are enrolled in public schools. The age group of 20 to 24 year olds has the highest likelihood of being enrolled in private schools, with 1 (100.0% in the age bracket) enrolled. Conversely, the age group of 3 to 4 year olds has the lowest likelihood of being enrolled in a private school, with 4 (100.0% in the age bracket) attending a public institution.
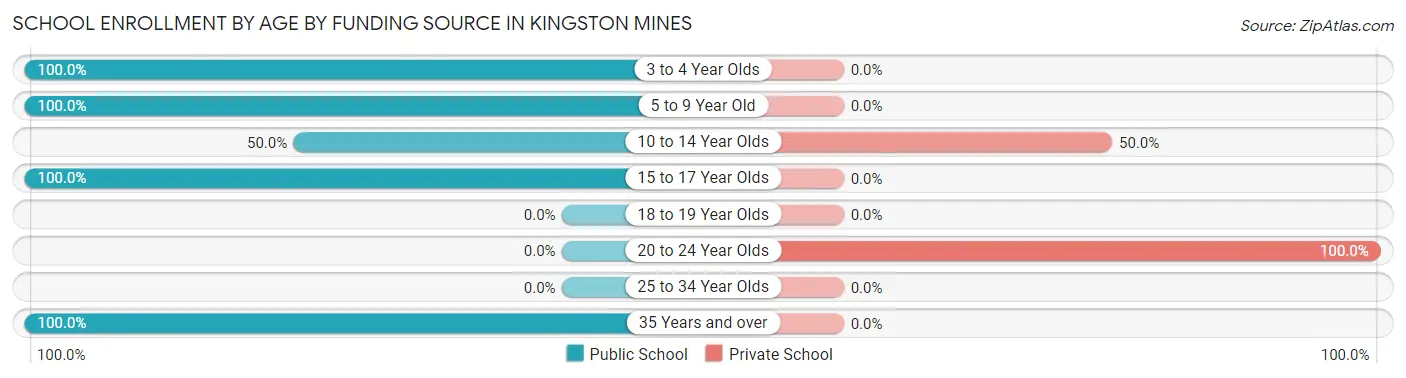
| Age Bracket | Public School | Private School |
| 3 to 4 Year Olds | 4 (100.0%) | 0 (0.0%) |
| 5 to 9 Year Old | 10 (100.0%) | 0 (0.0%) |
| 10 to 14 Year Olds | 7 (50.0%) | 7 (50.0%) |
| 15 to 17 Year Olds | 9 (100.0%) | 0 (0.0%) |
| 18 to 19 Year Olds | 0 (0.0%) | 0 (0.0%) |
| 20 to 24 Year Olds | 0 (0.0%) | 1 (100.0%) |
| 25 to 34 Year Olds | 0 (0.0%) | 0 (0.0%) |
| 35 Years and over | 1 (100.0%) | 0 (0.0%) |
| Total | 31 (79.5%) | 8 (20.5%) |
Educational Attainment by Field of Study in Kingston Mines
Business (5 | 50.0%), education (4 | 40.0%), and science & technology (1 | 10.0%) are the most common fields of study among 10 individuals in Kingston Mines who have obtained a bachelor's degree or higher.
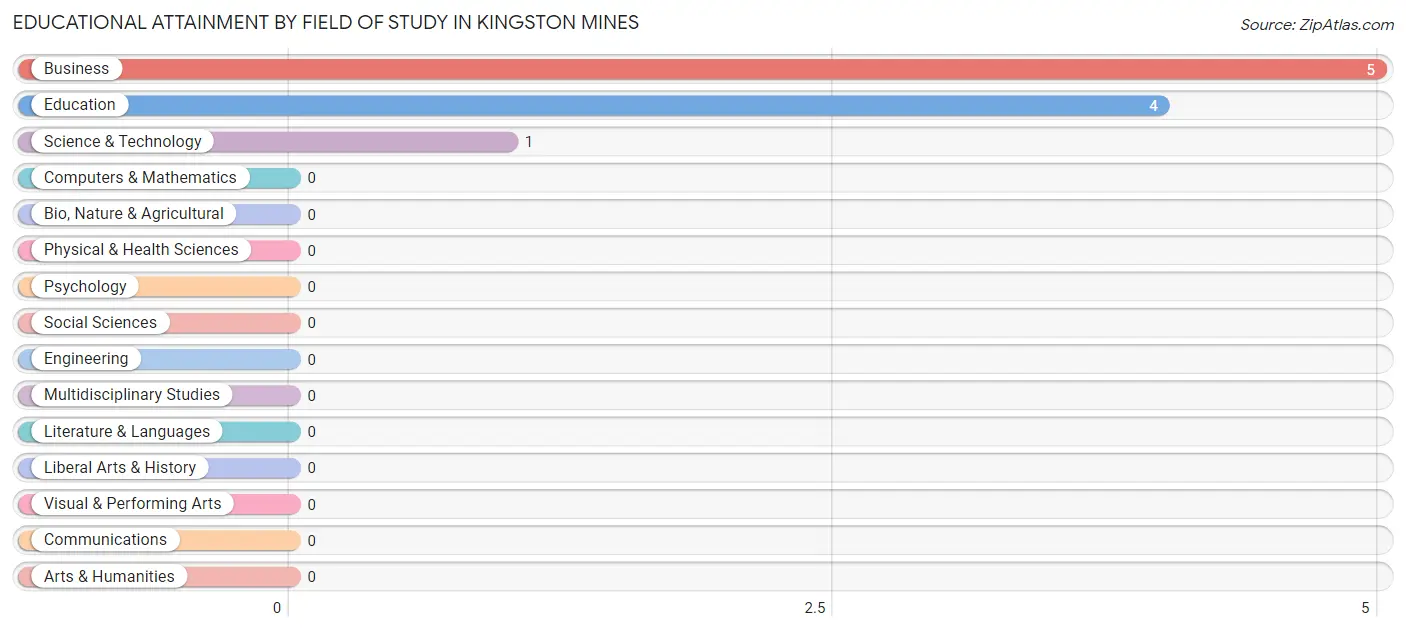
| Field of Study | # Graduates | % Graduates |
| Computers & Mathematics | 0 | 0.0% |
| Bio, Nature & Agricultural | 0 | 0.0% |
| Physical & Health Sciences | 0 | 0.0% |
| Psychology | 0 | 0.0% |
| Social Sciences | 0 | 0.0% |
| Engineering | 0 | 0.0% |
| Multidisciplinary Studies | 0 | 0.0% |
| Science & Technology | 1 | 10.0% |
| Business | 5 | 50.0% |
| Education | 4 | 40.0% |
| Literature & Languages | 0 | 0.0% |
| Liberal Arts & History | 0 | 0.0% |
| Visual & Performing Arts | 0 | 0.0% |
| Communications | 0 | 0.0% |
| Arts & Humanities | 0 | 0.0% |
| Total | 10 | 100.0% |
Transportation & Commute in Kingston Mines
Vehicle Availability by Sex in Kingston Mines
The most prevalent vehicle ownership categories in Kingston Mines are males with 2 vehicles (21, accounting for 51.2%) and females with 2 vehicles (12, making up 75.0%).
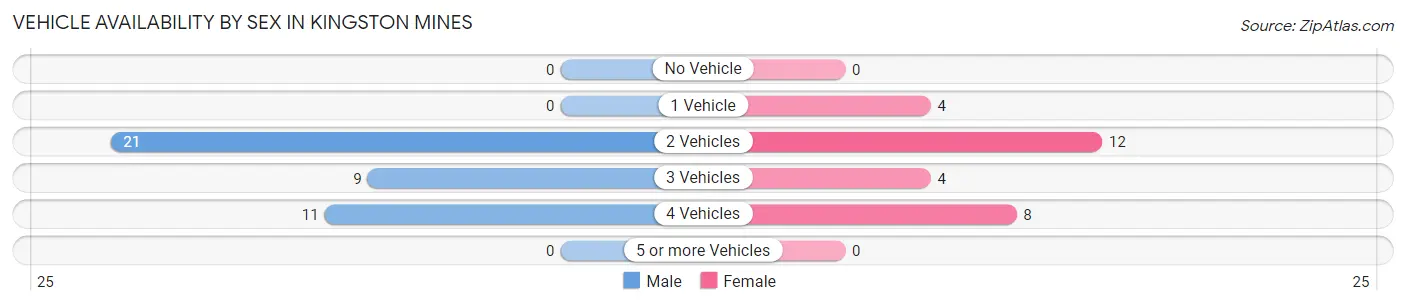
| Vehicles Available | Male | Female |
| No Vehicle | 0 (0.0%) | 0 (0.0%) |
| 1 Vehicle | 0 (0.0%) | 4 (14.3%) |
| 2 Vehicles | 21 (51.2%) | 12 (42.9%) |
| 3 Vehicles | 9 (22.0%) | 4 (14.3%) |
| 4 Vehicles | 11 (26.8%) | 8 (28.6%) |
| 5 or more Vehicles | 0 (0.0%) | 0 (0.0%) |
| Total | 41 (100.0%) | 28 (100.0%) |
Commute Time in Kingston Mines
The most frequently occuring commute durations in Kingston Mines are 5 to 9 minutes (20 commuters, 29.0%), 30 to 34 minutes (16 commuters, 23.2%), and 20 to 24 minutes (9 commuters, 13.0%).
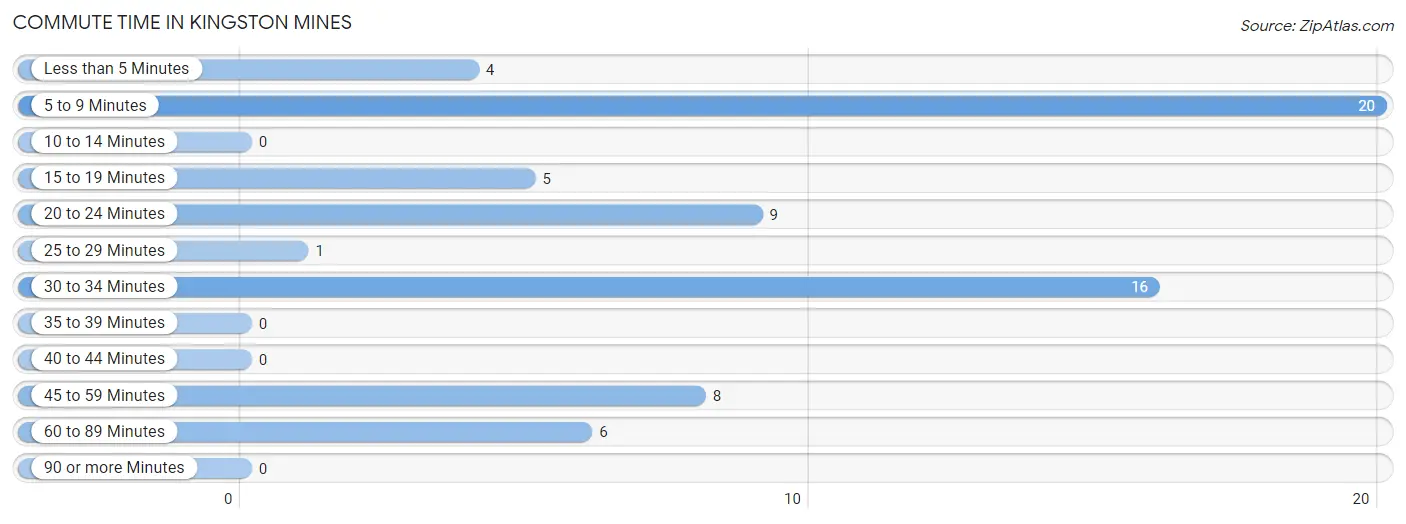
| Commute Time | # Commuters | % Commuters |
| Less than 5 Minutes | 4 | 5.8% |
| 5 to 9 Minutes | 20 | 29.0% |
| 10 to 14 Minutes | 0 | 0.0% |
| 15 to 19 Minutes | 5 | 7.2% |
| 20 to 24 Minutes | 9 | 13.0% |
| 25 to 29 Minutes | 1 | 1.5% |
| 30 to 34 Minutes | 16 | 23.2% |
| 35 to 39 Minutes | 0 | 0.0% |
| 40 to 44 Minutes | 0 | 0.0% |
| 45 to 59 Minutes | 8 | 11.6% |
| 60 to 89 Minutes | 6 | 8.7% |
| 90 or more Minutes | 0 | 0.0% |
Commute Time by Sex in Kingston Mines
The most common commute times in Kingston Mines are 30 to 34 minutes (12 commuters, 29.3%) for males and 5 to 9 minutes (20 commuters, 71.4%) for females.
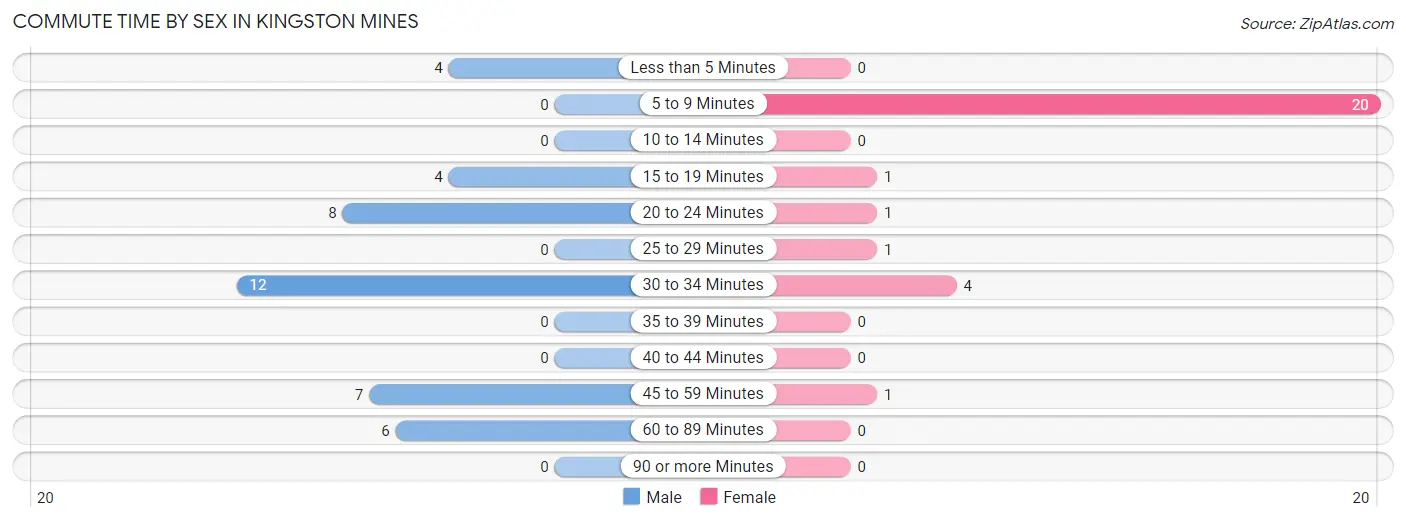
| Commute Time | Male | Female |
| Less than 5 Minutes | 4 (9.8%) | 0 (0.0%) |
| 5 to 9 Minutes | 0 (0.0%) | 20 (71.4%) |
| 10 to 14 Minutes | 0 (0.0%) | 0 (0.0%) |
| 15 to 19 Minutes | 4 (9.8%) | 1 (3.6%) |
| 20 to 24 Minutes | 8 (19.5%) | 1 (3.6%) |
| 25 to 29 Minutes | 0 (0.0%) | 1 (3.6%) |
| 30 to 34 Minutes | 12 (29.3%) | 4 (14.3%) |
| 35 to 39 Minutes | 0 (0.0%) | 0 (0.0%) |
| 40 to 44 Minutes | 0 (0.0%) | 0 (0.0%) |
| 45 to 59 Minutes | 7 (17.1%) | 1 (3.6%) |
| 60 to 89 Minutes | 6 (14.6%) | 0 (0.0%) |
| 90 or more Minutes | 0 (0.0%) | 0 (0.0%) |
Time of Departure to Work by Sex in Kingston Mines
The most frequent times of departure to work in Kingston Mines are 12:00 AM to 4:59 AM (13, 31.7%) for males and 7:00 AM to 7:29 AM (8, 28.6%) for females.
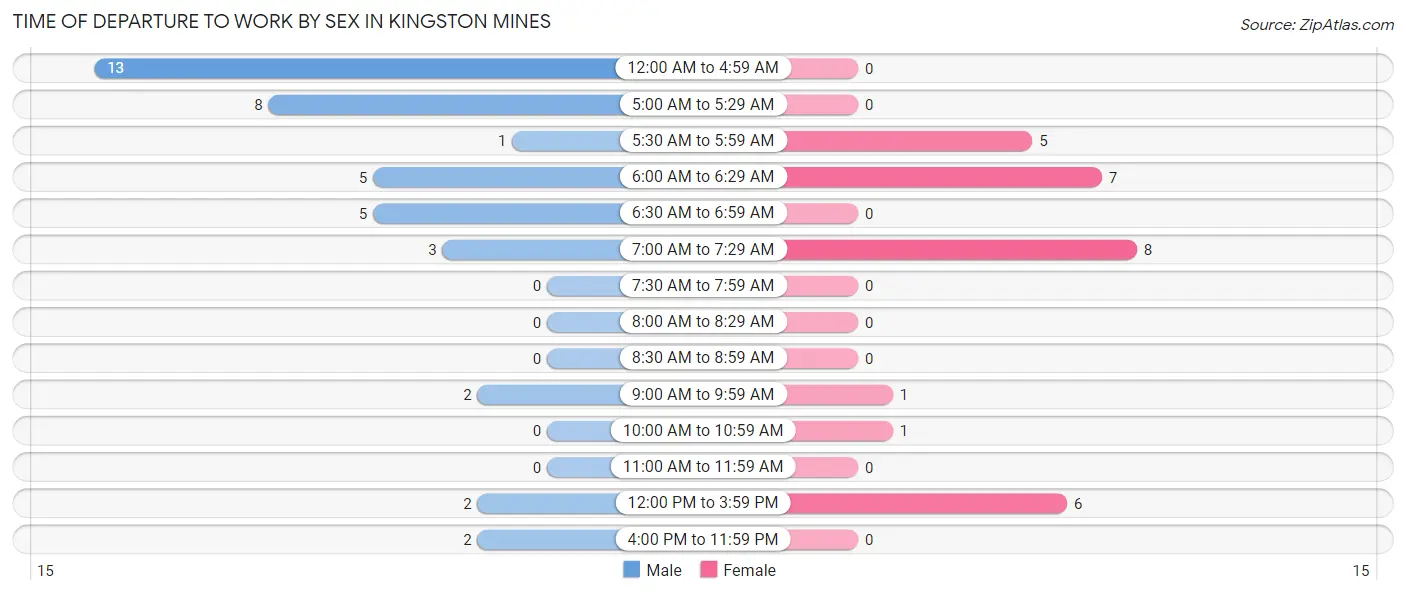
| Time of Departure | Male | Female |
| 12:00 AM to 4:59 AM | 13 (31.7%) | 0 (0.0%) |
| 5:00 AM to 5:29 AM | 8 (19.5%) | 0 (0.0%) |
| 5:30 AM to 5:59 AM | 1 (2.4%) | 5 (17.9%) |
| 6:00 AM to 6:29 AM | 5 (12.2%) | 7 (25.0%) |
| 6:30 AM to 6:59 AM | 5 (12.2%) | 0 (0.0%) |
| 7:00 AM to 7:29 AM | 3 (7.3%) | 8 (28.6%) |
| 7:30 AM to 7:59 AM | 0 (0.0%) | 0 (0.0%) |
| 8:00 AM to 8:29 AM | 0 (0.0%) | 0 (0.0%) |
| 8:30 AM to 8:59 AM | 0 (0.0%) | 0 (0.0%) |
| 9:00 AM to 9:59 AM | 2 (4.9%) | 1 (3.6%) |
| 10:00 AM to 10:59 AM | 0 (0.0%) | 1 (3.6%) |
| 11:00 AM to 11:59 AM | 0 (0.0%) | 0 (0.0%) |
| 12:00 PM to 3:59 PM | 2 (4.9%) | 6 (21.4%) |
| 4:00 PM to 11:59 PM | 2 (4.9%) | 0 (0.0%) |
| Total | 41 (100.0%) | 28 (100.0%) |
Housing Occupancy in Kingston Mines
Occupancy by Ownership in Kingston Mines
Of the total 83 dwellings in Kingston Mines, owner-occupied units account for 61 (73.5%), while renter-occupied units make up 22 (26.5%).
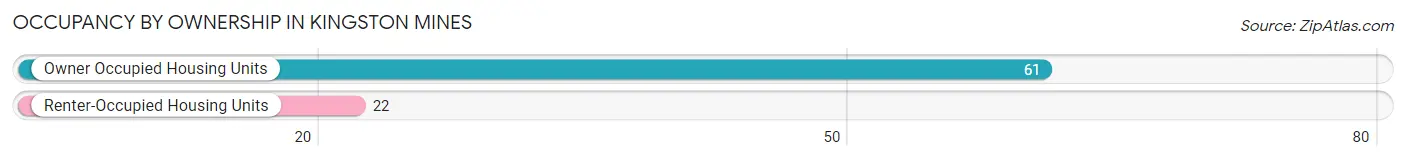
| Occupancy | # Housing Units | % Housing Units |
| Owner Occupied Housing Units | 61 | 73.5% |
| Renter-Occupied Housing Units | 22 | 26.5% |
| Total Occupied Housing Units | 83 | 100.0% |
Occupancy by Household Size in Kingston Mines
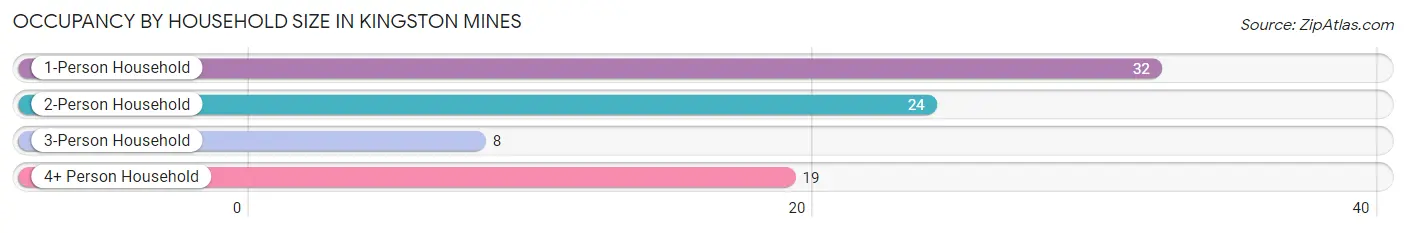
| Household Size | # Housing Units | % Housing Units |
| 1-Person Household | 32 | 38.6% |
| 2-Person Household | 24 | 28.9% |
| 3-Person Household | 8 | 9.6% |
| 4+ Person Household | 19 | 22.9% |
| Total Housing Units | 83 | 100.0% |
Occupancy by Ownership by Household Size in Kingston Mines
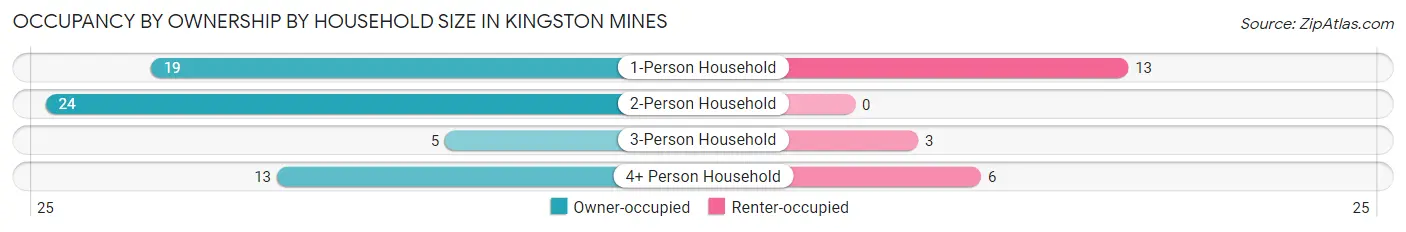
| Household Size | Owner-occupied | Renter-occupied |
| 1-Person Household | 19 (59.4%) | 13 (40.6%) |
| 2-Person Household | 24 (100.0%) | 0 (0.0%) |
| 3-Person Household | 5 (62.5%) | 3 (37.5%) |
| 4+ Person Household | 13 (68.4%) | 6 (31.6%) |
| Total Housing Units | 61 (73.5%) | 22 (26.5%) |
Occupancy by Educational Attainment in Kingston Mines
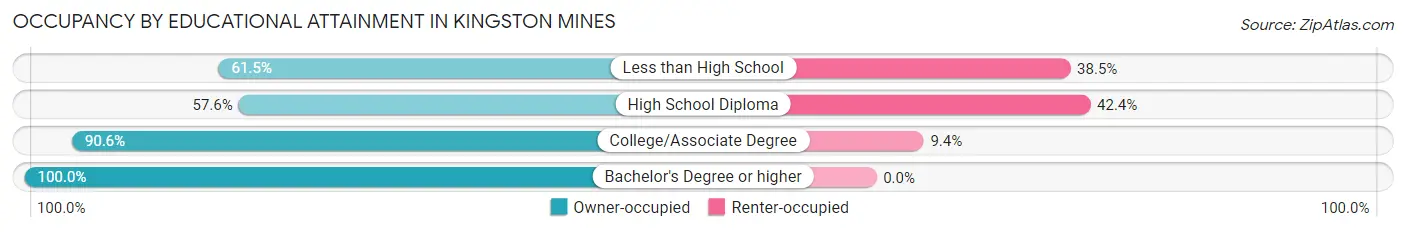
| Household Size | Owner-occupied | Renter-occupied |
| Less than High School | 8 (61.5%) | 5 (38.5%) |
| High School Diploma | 19 (57.6%) | 14 (42.4%) |
| College/Associate Degree | 29 (90.6%) | 3 (9.4%) |
| Bachelor's Degree or higher | 5 (100.0%) | 0 (0.0%) |
Occupancy by Age of Householder in Kingston Mines
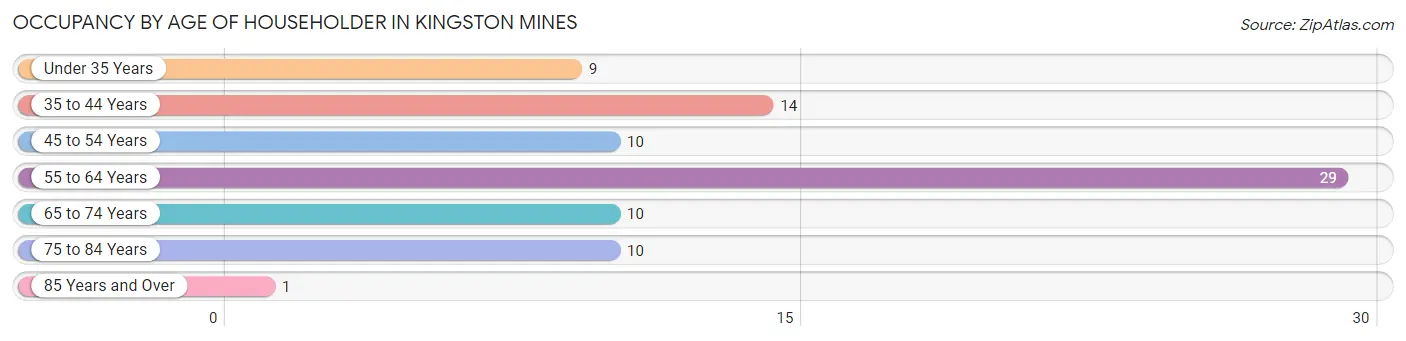
| Age Bracket | # Households | % Households |
| Under 35 Years | 9 | 10.8% |
| 35 to 44 Years | 14 | 16.9% |
| 45 to 54 Years | 10 | 12.0% |
| 55 to 64 Years | 29 | 34.9% |
| 65 to 74 Years | 10 | 12.0% |
| 75 to 84 Years | 10 | 12.0% |
| 85 Years and Over | 1 | 1.2% |
| Total | 83 | 100.0% |
Housing Finances in Kingston Mines
Median Income by Occupancy in Kingston Mines
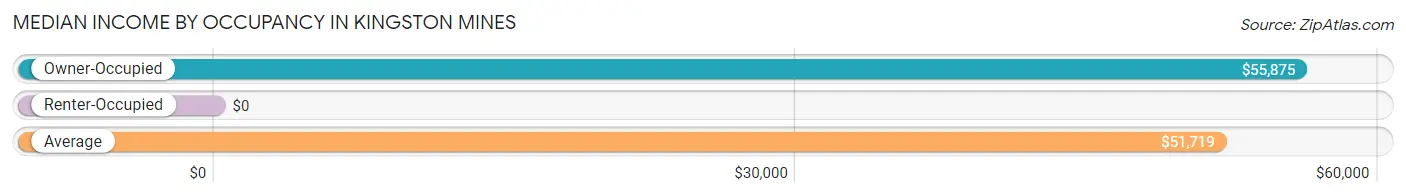
| Occupancy Type | # Households | Median Income |
| Owner-Occupied | 61 (73.5%) | $55,875 |
| Renter-Occupied | 22 (26.5%) | $0 |
| Average | 83 (100.0%) | $51,719 |
Occupancy by Householder Income Bracket in Kingston Mines
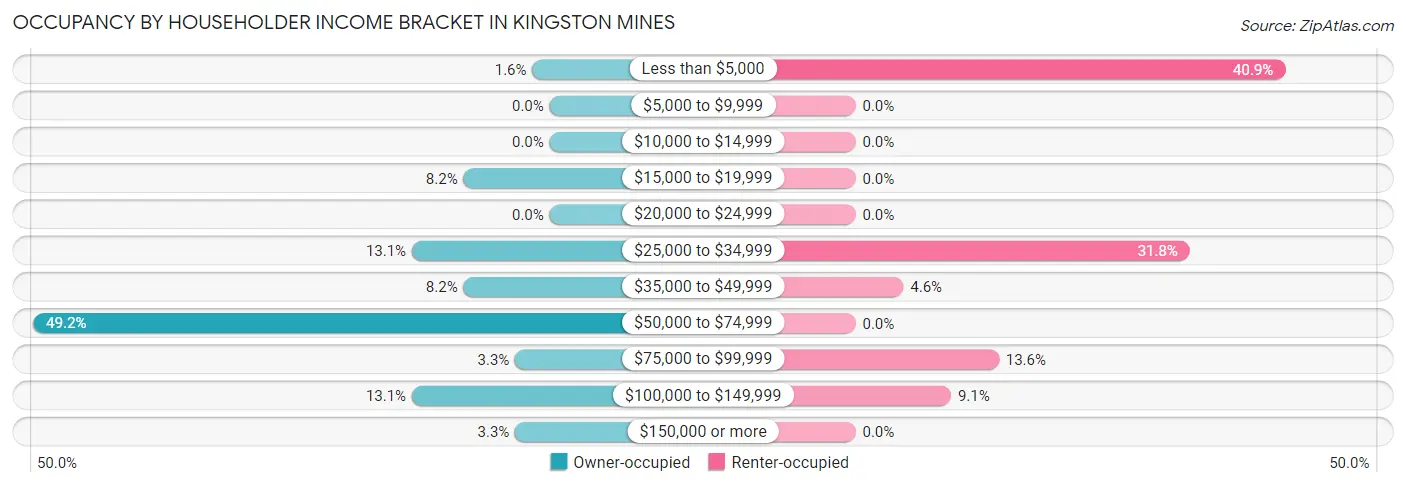
| Income Bracket | Owner-occupied | Renter-occupied |
| Less than $5,000 | 1 (1.6%) | 9 (40.9%) |
| $5,000 to $9,999 | 0 (0.0%) | 0 (0.0%) |
| $10,000 to $14,999 | 0 (0.0%) | 0 (0.0%) |
| $15,000 to $19,999 | 5 (8.2%) | 0 (0.0%) |
| $20,000 to $24,999 | 0 (0.0%) | 0 (0.0%) |
| $25,000 to $34,999 | 8 (13.1%) | 7 (31.8%) |
| $35,000 to $49,999 | 5 (8.2%) | 1 (4.5%) |
| $50,000 to $74,999 | 30 (49.2%) | 0 (0.0%) |
| $75,000 to $99,999 | 2 (3.3%) | 3 (13.6%) |
| $100,000 to $149,999 | 8 (13.1%) | 2 (9.1%) |
| $150,000 or more | 2 (3.3%) | 0 (0.0%) |
| Total | 61 (100.0%) | 22 (100.0%) |
Monthly Housing Cost Tiers in Kingston Mines
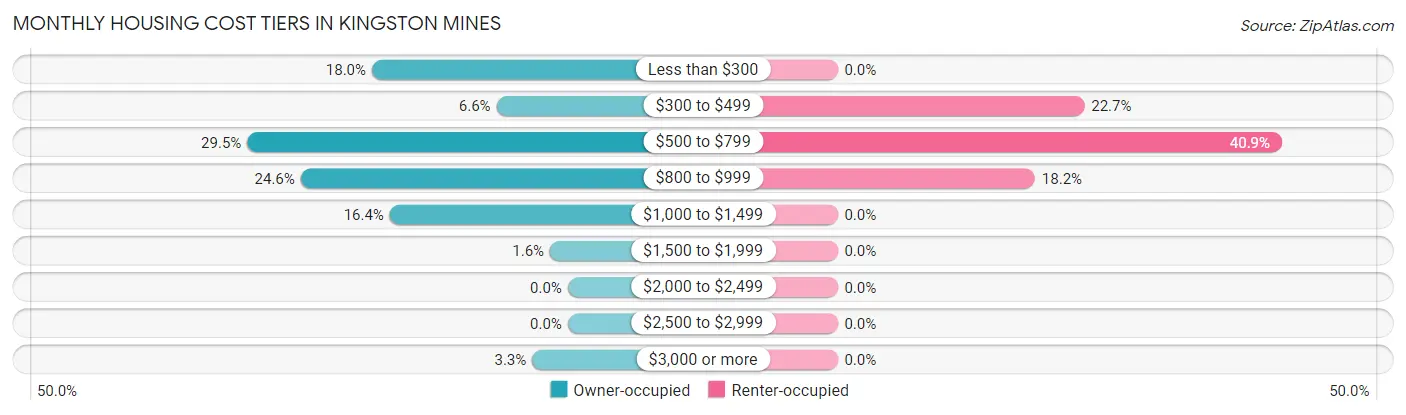
| Monthly Cost | Owner-occupied | Renter-occupied |
| Less than $300 | 11 (18.0%) | 0 (0.0%) |
| $300 to $499 | 4 (6.6%) | 5 (22.7%) |
| $500 to $799 | 18 (29.5%) | 9 (40.9%) |
| $800 to $999 | 15 (24.6%) | 4 (18.2%) |
| $1,000 to $1,499 | 10 (16.4%) | 0 (0.0%) |
| $1,500 to $1,999 | 1 (1.6%) | 0 (0.0%) |
| $2,000 to $2,499 | 0 (0.0%) | 0 (0.0%) |
| $2,500 to $2,999 | 0 (0.0%) | 0 (0.0%) |
| $3,000 or more | 2 (3.3%) | 0 (0.0%) |
| Total | 61 (100.0%) | 22 (100.0%) |
Physical Housing Characteristics in Kingston Mines
Housing Structures in Kingston Mines
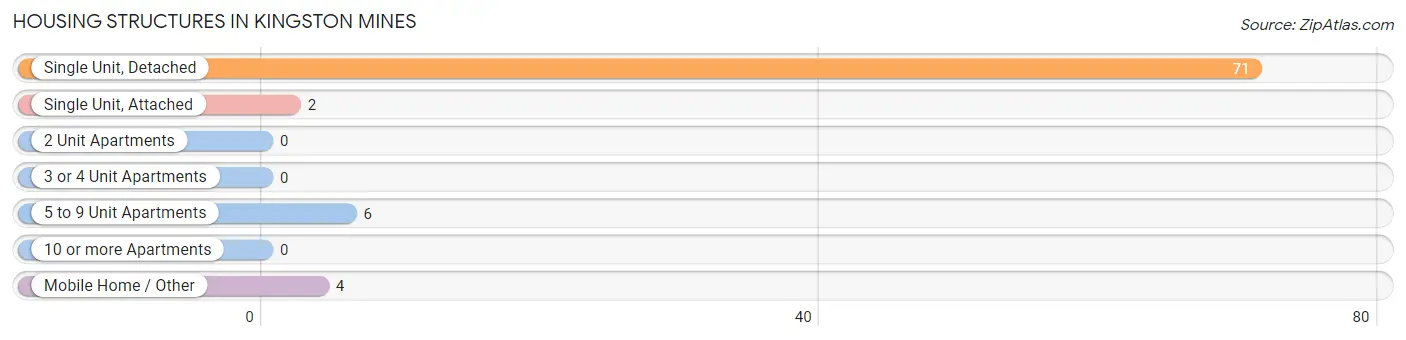
| Structure Type | # Housing Units | % Housing Units |
| Single Unit, Detached | 71 | 85.5% |
| Single Unit, Attached | 2 | 2.4% |
| 2 Unit Apartments | 0 | 0.0% |
| 3 or 4 Unit Apartments | 0 | 0.0% |
| 5 to 9 Unit Apartments | 6 | 7.2% |
| 10 or more Apartments | 0 | 0.0% |
| Mobile Home / Other | 4 | 4.8% |
| Total | 83 | 100.0% |
Housing Structures by Occupancy in Kingston Mines
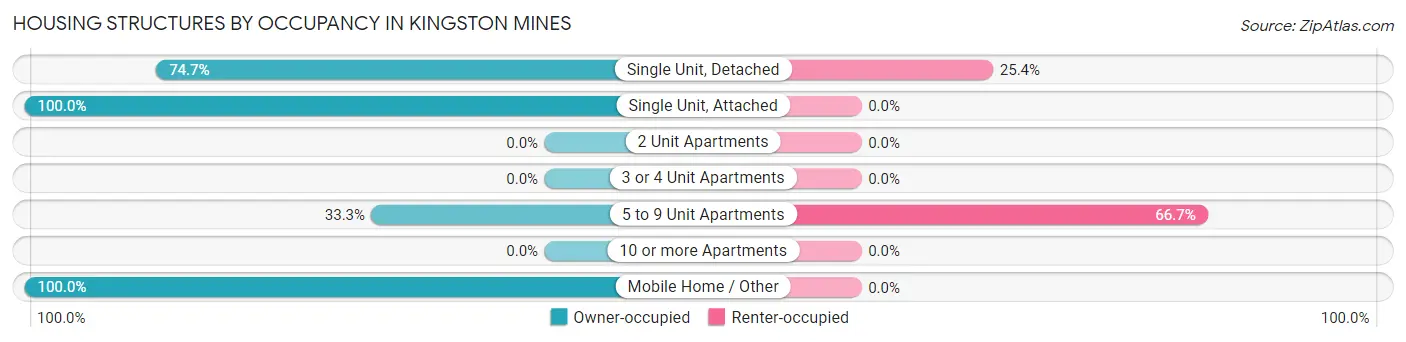
| Structure Type | Owner-occupied | Renter-occupied |
| Single Unit, Detached | 53 (74.7%) | 18 (25.4%) |
| Single Unit, Attached | 2 (100.0%) | 0 (0.0%) |
| 2 Unit Apartments | 0 (0.0%) | 0 (0.0%) |
| 3 or 4 Unit Apartments | 0 (0.0%) | 0 (0.0%) |
| 5 to 9 Unit Apartments | 2 (33.3%) | 4 (66.7%) |
| 10 or more Apartments | 0 (0.0%) | 0 (0.0%) |
| Mobile Home / Other | 4 (100.0%) | 0 (0.0%) |
| Total | 61 (73.5%) | 22 (26.5%) |
Housing Structures by Number of Rooms in Kingston Mines
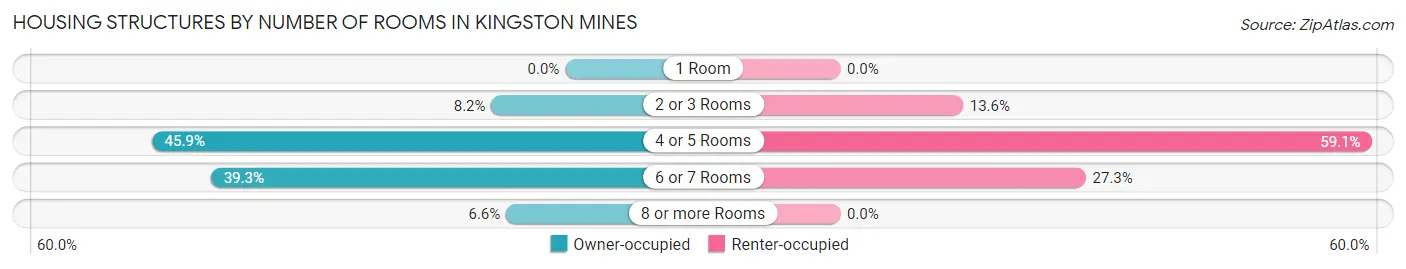
| Number of Rooms | Owner-occupied | Renter-occupied |
| 1 Room | 0 (0.0%) | 0 (0.0%) |
| 2 or 3 Rooms | 5 (8.2%) | 3 (13.6%) |
| 4 or 5 Rooms | 28 (45.9%) | 13 (59.1%) |
| 6 or 7 Rooms | 24 (39.3%) | 6 (27.3%) |
| 8 or more Rooms | 4 (6.6%) | 0 (0.0%) |
| Total | 61 (100.0%) | 22 (100.0%) |
Housing Structure by Heating Type in Kingston Mines
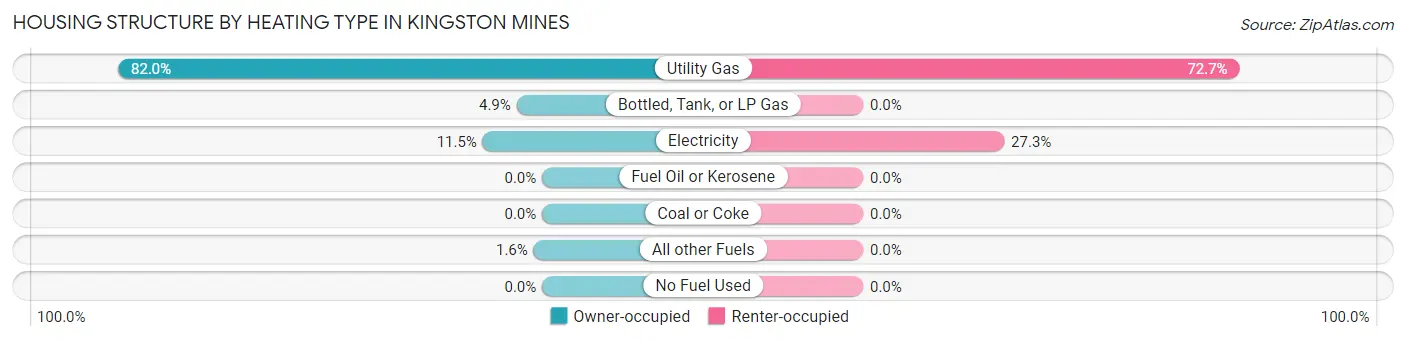
| Heating Type | Owner-occupied | Renter-occupied |
| Utility Gas | 50 (82.0%) | 16 (72.7%) |
| Bottled, Tank, or LP Gas | 3 (4.9%) | 0 (0.0%) |
| Electricity | 7 (11.5%) | 6 (27.3%) |
| Fuel Oil or Kerosene | 0 (0.0%) | 0 (0.0%) |
| Coal or Coke | 0 (0.0%) | 0 (0.0%) |
| All other Fuels | 1 (1.6%) | 0 (0.0%) |
| No Fuel Used | 0 (0.0%) | 0 (0.0%) |
| Total | 61 (100.0%) | 22 (100.0%) |
Household Vehicle Usage in Kingston Mines
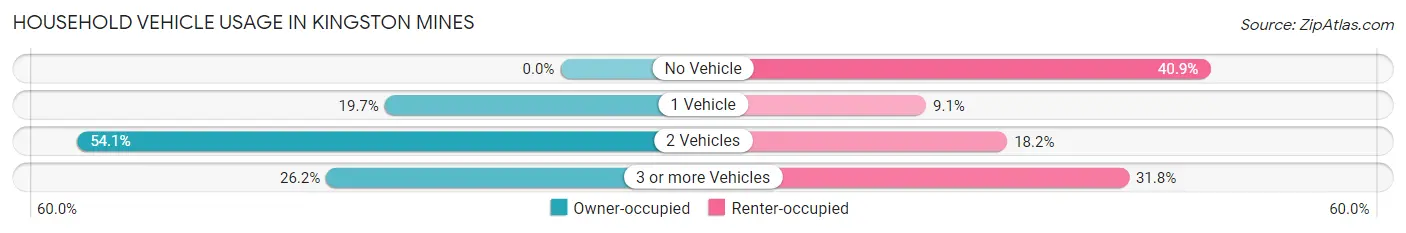
| Vehicles per Household | Owner-occupied | Renter-occupied |
| No Vehicle | 0 (0.0%) | 9 (40.9%) |
| 1 Vehicle | 12 (19.7%) | 2 (9.1%) |
| 2 Vehicles | 33 (54.1%) | 4 (18.2%) |
| 3 or more Vehicles | 16 (26.2%) | 7 (31.8%) |
| Total | 61 (100.0%) | 22 (100.0%) |
Real Estate & Mortgages in Kingston Mines
Real Estate and Mortgage Overview in Kingston Mines
| Characteristic | Without Mortgage | With Mortgage |
| Housing Units | 30 | 31 |
| Median Property Value | $52,000 | $83,000 |
| Median Household Income | $51,250 | $1 |
| Monthly Housing Costs | $500 | $2 |
| Real Estate Taxes | $1,600 | $0 |
Property Value by Mortgage Status in Kingston Mines
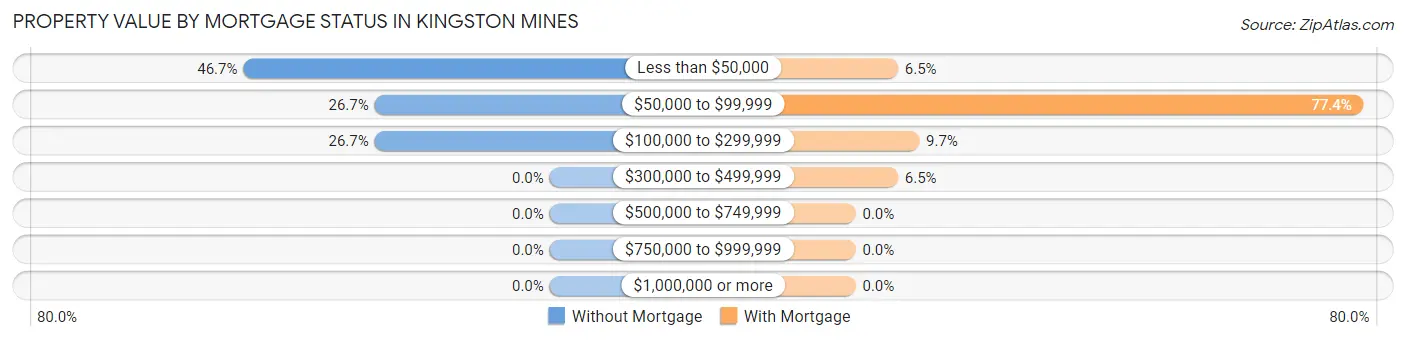
| Property Value | Without Mortgage | With Mortgage |
| Less than $50,000 | 14 (46.7%) | 2 (6.5%) |
| $50,000 to $99,999 | 8 (26.7%) | 24 (77.4%) |
| $100,000 to $299,999 | 8 (26.7%) | 3 (9.7%) |
| $300,000 to $499,999 | 0 (0.0%) | 2 (6.5%) |
| $500,000 to $749,999 | 0 (0.0%) | 0 (0.0%) |
| $750,000 to $999,999 | 0 (0.0%) | 0 (0.0%) |
| $1,000,000 or more | 0 (0.0%) | 0 (0.0%) |
| Total | 30 (100.0%) | 31 (100.0%) |
Household Income by Mortgage Status in Kingston Mines
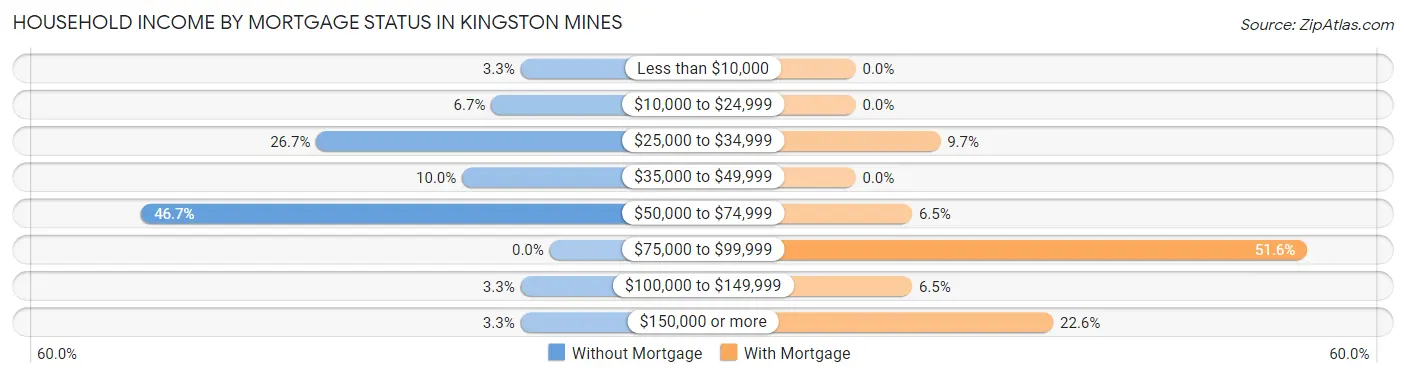
| Household Income | Without Mortgage | With Mortgage |
| Less than $10,000 | 1 (3.3%) | 0 (0.0%) |
| $10,000 to $24,999 | 2 (6.7%) | 0 (0.0%) |
| $25,000 to $34,999 | 8 (26.7%) | 3 (9.7%) |
| $35,000 to $49,999 | 3 (10.0%) | 0 (0.0%) |
| $50,000 to $74,999 | 14 (46.7%) | 2 (6.5%) |
| $75,000 to $99,999 | 0 (0.0%) | 16 (51.6%) |
| $100,000 to $149,999 | 1 (3.3%) | 2 (6.5%) |
| $150,000 or more | 1 (3.3%) | 7 (22.6%) |
| Total | 30 (100.0%) | 31 (100.0%) |
Property Value to Household Income Ratio in Kingston Mines
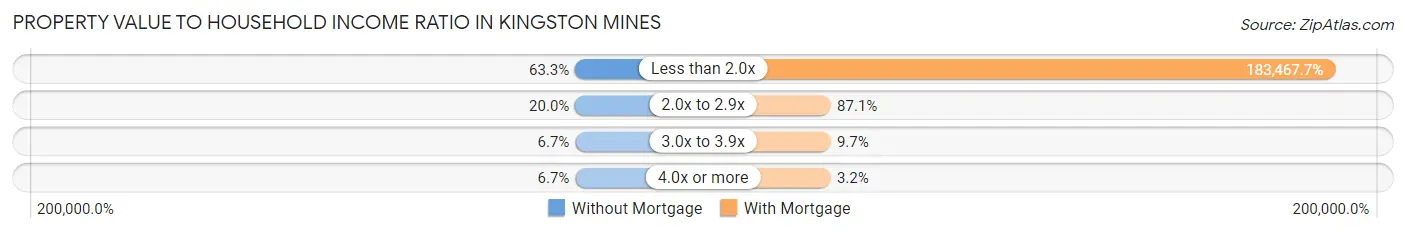
| Value-to-Income Ratio | Without Mortgage | With Mortgage |
| Less than 2.0x | 19 (63.3%) | 56,875 (183,467.7%) |
| 2.0x to 2.9x | 6 (20.0%) | 27 (87.1%) |
| 3.0x to 3.9x | 2 (6.7%) | 3 (9.7%) |
| 4.0x or more | 2 (6.7%) | 1 (3.2%) |
| Total | 30 (100.0%) | 31 (100.0%) |
Real Estate Taxes by Mortgage Status in Kingston Mines
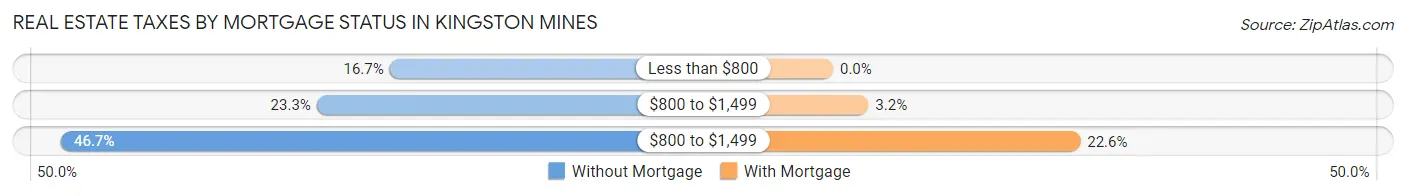
| Property Taxes | Without Mortgage | With Mortgage |
| Less than $800 | 5 (16.7%) | 0 (0.0%) |
| $800 to $1,499 | 7 (23.3%) | 1 (3.2%) |
| $800 to $1,499 | 14 (46.7%) | 7 (22.6%) |
| Total | 30 (100.0%) | 31 (100.0%) |
Health & Disability in Kingston Mines
Health Insurance Coverage by Age in Kingston Mines
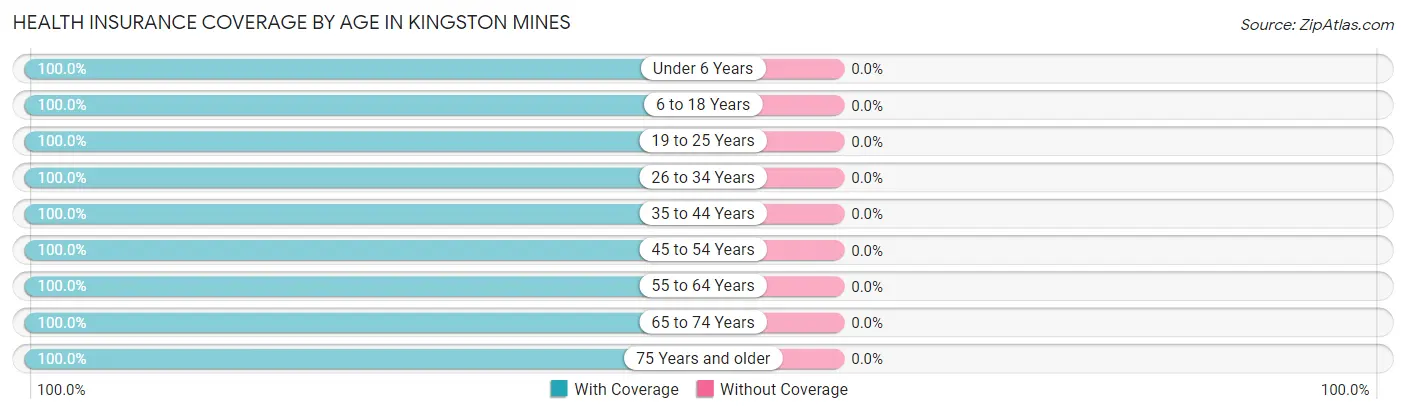
| Age Bracket | With Coverage | Without Coverage |
| Under 6 Years | 18 (100.0%) | 0 (0.0%) |
| 6 to 18 Years | 32 (100.0%) | 0 (0.0%) |
| 19 to 25 Years | 10 (100.0%) | 0 (0.0%) |
| 26 to 34 Years | 13 (100.0%) | 0 (0.0%) |
| 35 to 44 Years | 24 (100.0%) | 0 (0.0%) |
| 45 to 54 Years | 16 (100.0%) | 0 (0.0%) |
| 55 to 64 Years | 45 (100.0%) | 0 (0.0%) |
| 65 to 74 Years | 19 (100.0%) | 0 (0.0%) |
| 75 Years and older | 17 (100.0%) | 0 (0.0%) |
| Total | 194 (100.0%) | 0 (0.0%) |
Health Insurance Coverage by Citizenship Status in Kingston Mines
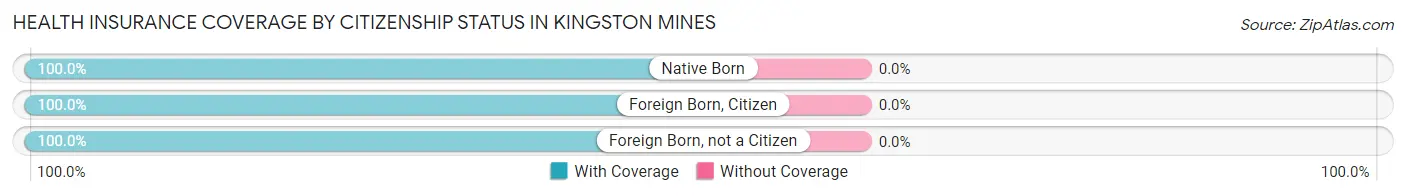
| Citizenship Status | With Coverage | Without Coverage |
| Native Born | 18 (100.0%) | 0 (0.0%) |
| Foreign Born, Citizen | 32 (100.0%) | 0 (0.0%) |
| Foreign Born, not a Citizen | 10 (100.0%) | 0 (0.0%) |
Health Insurance Coverage by Household Income in Kingston Mines
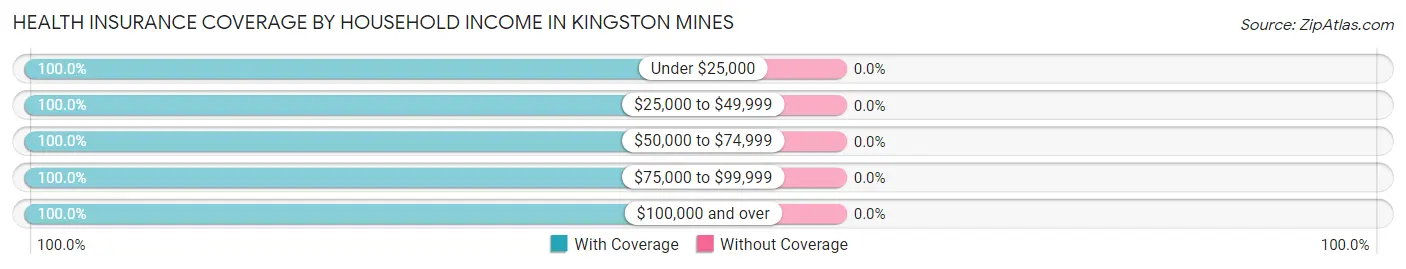
| Household Income | With Coverage | Without Coverage |
| Under $25,000 | 39 (100.0%) | 0 (0.0%) |
| $25,000 to $49,999 | 33 (100.0%) | 0 (0.0%) |
| $50,000 to $74,999 | 71 (100.0%) | 0 (0.0%) |
| $75,000 to $99,999 | 8 (100.0%) | 0 (0.0%) |
| $100,000 and over | 43 (100.0%) | 0 (0.0%) |
Public vs Private Health Insurance Coverage by Age in Kingston Mines
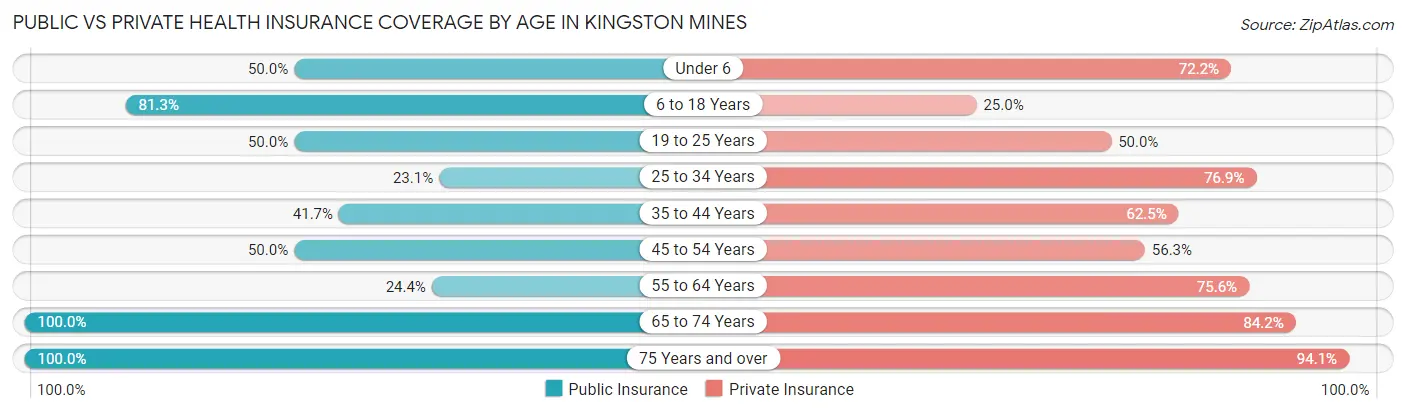
| Age Bracket | Public Insurance | Private Insurance |
| Under 6 | 9 (50.0%) | 13 (72.2%) |
| 6 to 18 Years | 26 (81.2%) | 8 (25.0%) |
| 19 to 25 Years | 5 (50.0%) | 5 (50.0%) |
| 25 to 34 Years | 3 (23.1%) | 10 (76.9%) |
| 35 to 44 Years | 10 (41.7%) | 15 (62.5%) |
| 45 to 54 Years | 8 (50.0%) | 9 (56.2%) |
| 55 to 64 Years | 11 (24.4%) | 34 (75.6%) |
| 65 to 74 Years | 19 (100.0%) | 16 (84.2%) |
| 75 Years and over | 17 (100.0%) | 16 (94.1%) |
| Total | 108 (55.7%) | 126 (64.9%) |
Disability Status by Sex by Age in Kingston Mines
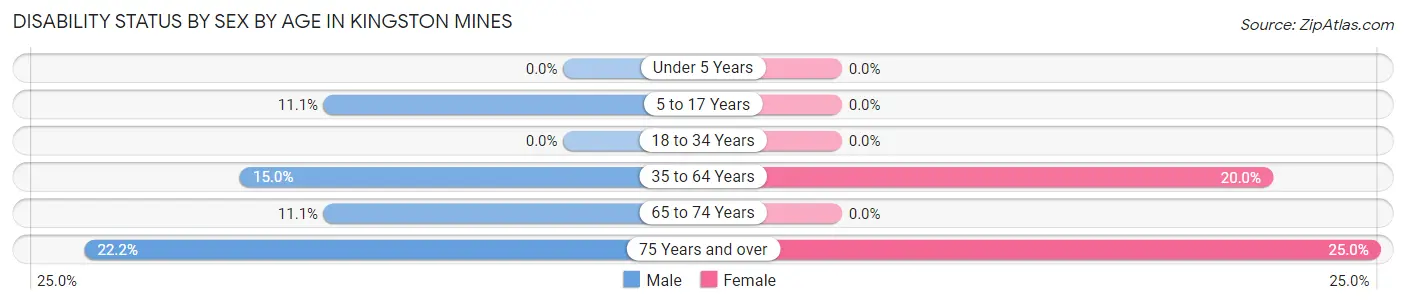
| Age Bracket | Male | Female |
| Under 5 Years | 0 (0.0%) | 0 (0.0%) |
| 5 to 17 Years | 2 (11.1%) | 0 (0.0%) |
| 18 to 34 Years | 0 (0.0%) | 0 (0.0%) |
| 35 to 64 Years | 6 (15.0%) | 9 (20.0%) |
| 65 to 74 Years | 1 (11.1%) | 0 (0.0%) |
| 75 Years and over | 2 (22.2%) | 2 (25.0%) |
Disability Class by Sex by Age in Kingston Mines
Disability Class: Hearing Difficulty
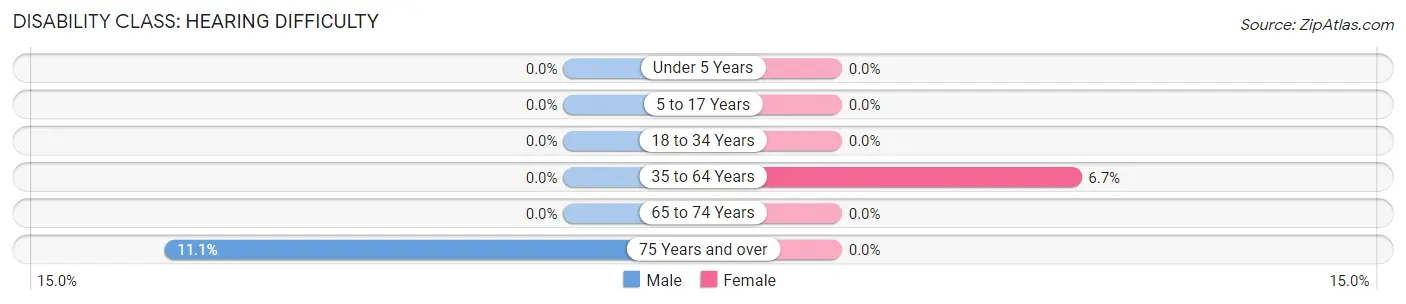
| Age Bracket | Male | Female |
| Under 5 Years | 0 (0.0%) | 0 (0.0%) |
| 5 to 17 Years | 0 (0.0%) | 0 (0.0%) |
| 18 to 34 Years | 0 (0.0%) | 0 (0.0%) |
| 35 to 64 Years | 0 (0.0%) | 3 (6.7%) |
| 65 to 74 Years | 0 (0.0%) | 0 (0.0%) |
| 75 Years and over | 1 (11.1%) | 0 (0.0%) |
Disability Class: Vision Difficulty
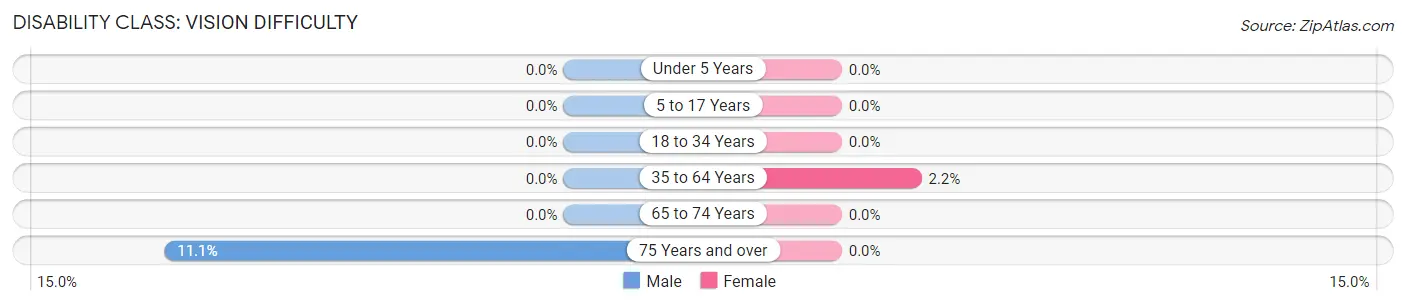
| Age Bracket | Male | Female |
| Under 5 Years | 0 (0.0%) | 0 (0.0%) |
| 5 to 17 Years | 0 (0.0%) | 0 (0.0%) |
| 18 to 34 Years | 0 (0.0%) | 0 (0.0%) |
| 35 to 64 Years | 0 (0.0%) | 1 (2.2%) |
| 65 to 74 Years | 0 (0.0%) | 0 (0.0%) |
| 75 Years and over | 1 (11.1%) | 0 (0.0%) |
Disability Class: Cognitive Difficulty
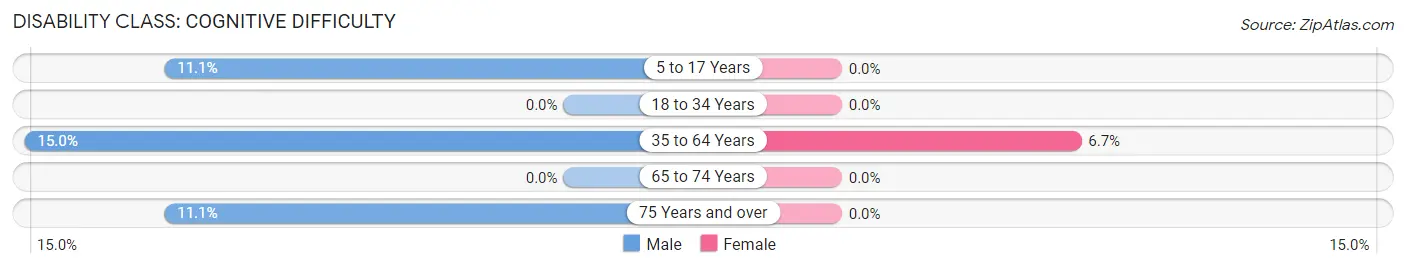
| Age Bracket | Male | Female |
| 5 to 17 Years | 2 (11.1%) | 0 (0.0%) |
| 18 to 34 Years | 0 (0.0%) | 0 (0.0%) |
| 35 to 64 Years | 6 (15.0%) | 3 (6.7%) |
| 65 to 74 Years | 0 (0.0%) | 0 (0.0%) |
| 75 Years and over | 1 (11.1%) | 0 (0.0%) |
Disability Class: Ambulatory Difficulty

| Age Bracket | Male | Female |
| 5 to 17 Years | 0 (0.0%) | 0 (0.0%) |
| 18 to 34 Years | 0 (0.0%) | 0 (0.0%) |
| 35 to 64 Years | 4 (10.0%) | 7 (15.6%) |
| 65 to 74 Years | 1 (11.1%) | 0 (0.0%) |
| 75 Years and over | 1 (11.1%) | 2 (25.0%) |
Disability Class: Self-Care Difficulty
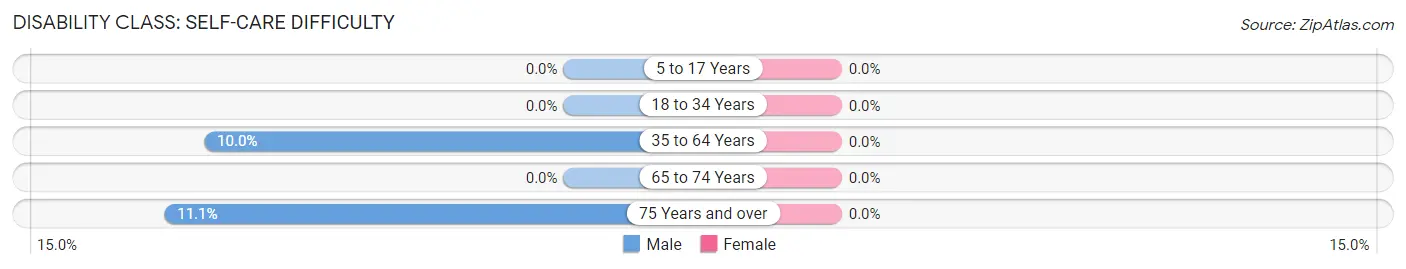
| Age Bracket | Male | Female |
| 5 to 17 Years | 0 (0.0%) | 0 (0.0%) |
| 18 to 34 Years | 0 (0.0%) | 0 (0.0%) |
| 35 to 64 Years | 4 (10.0%) | 0 (0.0%) |
| 65 to 74 Years | 0 (0.0%) | 0 (0.0%) |
| 75 Years and over | 1 (11.1%) | 0 (0.0%) |
Technology Access in Kingston Mines
Computing Device Access in Kingston Mines
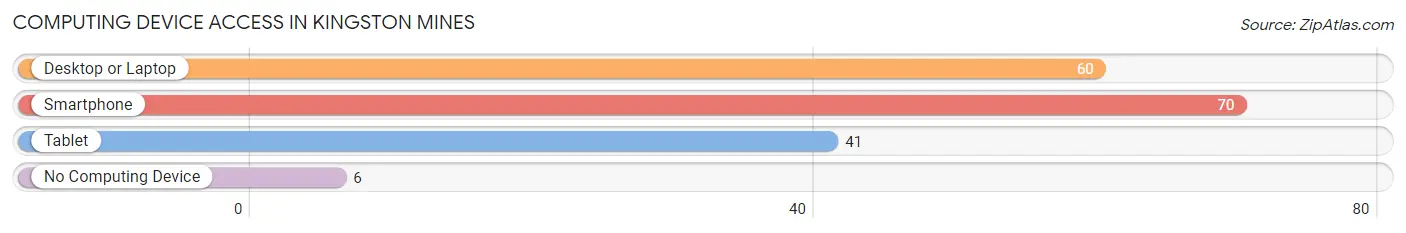
| Device Type | # Households | % Households |
| Desktop or Laptop | 60 | 72.3% |
| Smartphone | 70 | 84.3% |
| Tablet | 41 | 49.4% |
| No Computing Device | 6 | 7.2% |
| Total | 83 | 100.0% |
Internet Access in Kingston Mines
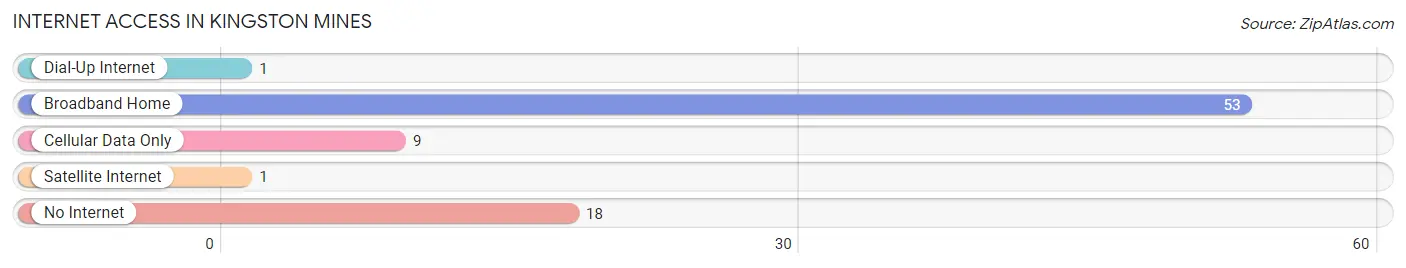
| Internet Type | # Households | % Households |
| Dial-Up Internet | 1 | 1.2% |
| Broadband Home | 53 | 63.9% |
| Cellular Data Only | 9 | 10.8% |
| Satellite Internet | 1 | 1.2% |
| No Internet | 18 | 21.7% |
| Total | 83 | 100.0% |
Kingston Mines Summary
Kingston Mines is a small unincorporated community located in Peoria County, Illinois. It is situated along the banks of the Illinois River, approximately 10 miles south of Peoria. The community was founded in 1837 and is named after the nearby Kingston Mines, which were used to extract coal from the area.
History
Kingston Mines was founded in 1837 by a group of settlers from Kentucky. The settlers were attracted to the area due to its rich coal deposits, which were used to fuel the local economy. The first coal mine in the area was opened in 1845, and by the late 19th century, the area had become a major coal-producing region. The coal industry in the area continued to grow until the early 20th century, when the demand for coal began to decline.
In the early 20th century, Kingston Mines began to transition away from its reliance on coal and towards other industries. The area became known for its agricultural production, particularly corn and soybeans. The area also became a popular destination for tourists, who were drawn to the area’s natural beauty and recreational opportunities.
Geography
Kingston Mines is located in Peoria County, Illinois, approximately 10 miles south of Peoria. The community is situated along the banks of the Illinois River, which provides a natural border between the community and the surrounding area. The area is characterized by rolling hills and wooded areas, with the Illinois River providing a scenic backdrop.
Economy
The economy of Kingston Mines is largely based on agriculture and tourism. The area is known for its production of corn and soybeans, which are sold to local markets and beyond. The area is also a popular destination for tourists, who come to enjoy the area’s natural beauty and recreational opportunities.
Demographics
As of the 2010 census, the population of Kingston Mines was 1,093. The racial makeup of the community was 97.2% White, 0.7% African American, 0.2% Native American, 0.2% Asian, 0.1% Pacific Islander, 0.7% from other races, and 0.9% from two or more races. The median household income in the area was $45,938, and the median family income was $50,938.
Conclusion
Kingston Mines is a small unincorporated community located in Peoria County, Illinois. It was founded in 1837 and is named after the nearby Kingston Mines, which were used to extract coal from the area. The economy of Kingston Mines is largely based on agriculture and tourism, and the area is known for its production of corn and soybeans. As of the 2010 census, the population of Kingston Mines was 1,093. The racial makeup of the community was 97.2% White, 0.7% African American, 0.2% Native American, 0.2% Asian, 0.1% Pacific Islander, 0.7% from other races, and 0.9% from two or more races. The median household income in the area was $45,938, and the median family income was $50,938.
Common Questions
What is Per Capita Income in Kingston Mines?
Per Capita income in Kingston Mines is $24,416.
What is the Median Family Income in Kingston Mines?
Median Family Income in Kingston Mines is $57,375.
What is the Median Household income in Kingston Mines?
Median Household Income in Kingston Mines is $51,719.
What is Inequality or Gini Index in Kingston Mines?
Inequality or Gini Index in Kingston Mines is 0.40.
What is the Total Population of Kingston Mines?
Total Population of Kingston Mines is 194.
What is the Total Male Population of Kingston Mines?
Total Male Population of Kingston Mines is 95.
What is the Total Female Population of Kingston Mines?
Total Female Population of Kingston Mines is 99.
What is the Ratio of Males per 100 Females in Kingston Mines?
There are 95.96 Males per 100 Females in Kingston Mines.
What is the Ratio of Females per 100 Males in Kingston Mines?
There are 104.21 Females per 100 Males in Kingston Mines.
What is the Median Population Age in Kingston Mines?
Median Population Age in Kingston Mines is 44.0 Years.
What is the Average Family Size in Kingston Mines
Average Family Size in Kingston Mines is 3.1 People.
What is the Average Household Size in Kingston Mines
Average Household Size in Kingston Mines is 2.3 People.
How Large is the Labor Force in Kingston Mines?
There are 71 People in the Labor Forcein in Kingston Mines.
What is the Percentage of People in the Labor Force in Kingston Mines?
46.4% of People are in the Labor Force in Kingston Mines.