Ina, IL Map & Demographics
Ina Map
Ina Overview
$7,228
PER CAPITA INCOME
$62,188
AVG FAMILY INCOME
$48,125
AVG HOUSEHOLD INCOME
56.5%
WAGE / INCOME GAP [ % ]
43.5¢/ $1
WAGE / INCOME GAP [ $ ]
0.43
INEQUALITY / GINI INDEX
1,754
TOTAL POPULATION
1,437
MALE POPULATION
317
FEMALE POPULATION
453.31
MALES / 100 FEMALES
22.06
FEMALES / 100 MALES
42.3
MEDIAN AGE
3.6
AVG FAMILY SIZE
2.8
AVG HOUSEHOLD SIZE
250
LABOR FORCE [ PEOPLE ]
15.2%
PERCENT IN LABOR FORCE
11.6%
UNEMPLOYMENT RATE
Ina Zip Codes
Ina Area Codes
Income in Ina
Income Overview in Ina
Per Capita Income in Ina is $7,228, while median incomes of families and households are $62,188 and $48,125 respectively.
| Characteristic | Number | Measure |
| Per Capita Income | 1,754 | $7,228 |
| Median Family Income | 136 | $62,188 |
| Mean Family Income | 136 | $77,249 |
| Median Household Income | 203 | $48,125 |
| Mean Household Income | 203 | $62,105 |
| Income Deficit | 136 | $0 |
| Wage / Income Gap (%) | 1,754 | 56.49% |
| Wage / Income Gap ($) | 1,754 | 43.51¢ per $1 |
| Gini / Inequality Index | 1,754 | 0.43 |
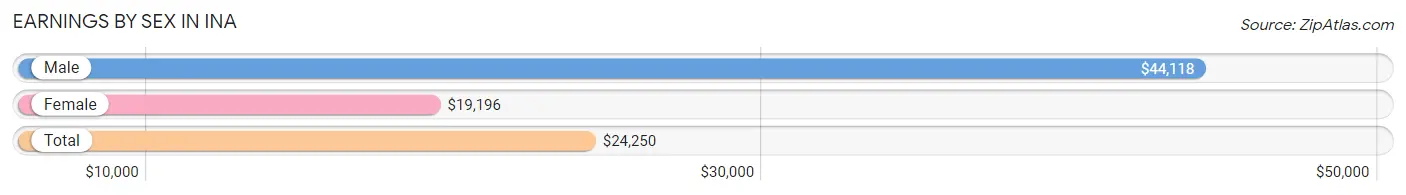
Earnings by Sex in Ina
Average Earnings in Ina are $24,250, $44,118 for men and $19,196 for women, a difference of 56.5%.
| Sex | Number | Average Earnings |
| Male | 106 (41.2%) | $44,118 |
| Female | 151 (58.8%) | $19,196 |
| Total | 257 (100.0%) | $24,250 |
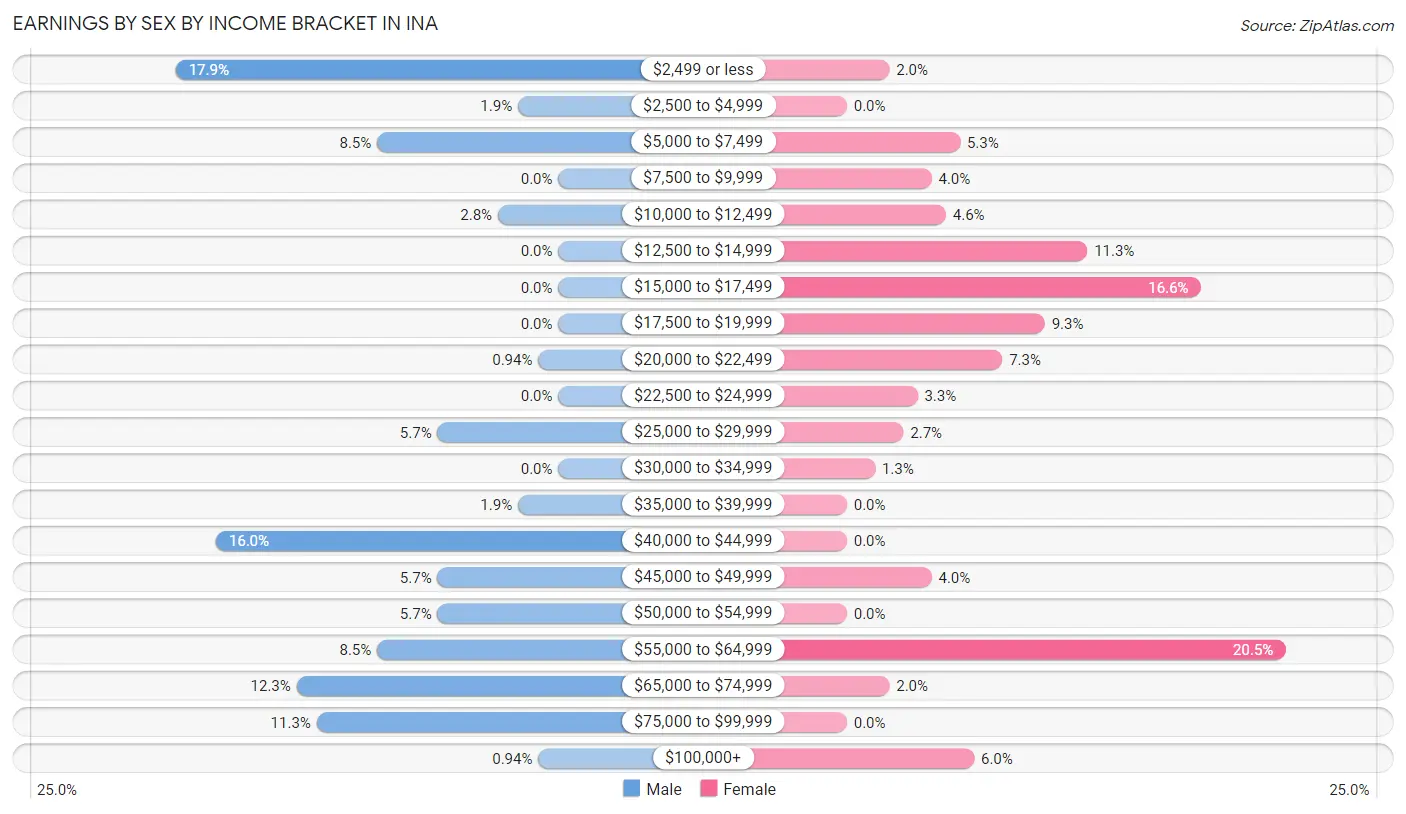
Earnings by Sex by Income Bracket in Ina
The most common earnings brackets in Ina are $2,499 or less for men (19 | 17.9%) and $55,000 to $64,999 for women (31 | 20.5%).
| Income | Male | Female |
| $2,499 or less | 19 (17.9%) | 3 (2.0%) |
| $2,500 to $4,999 | 2 (1.9%) | 0 (0.0%) |
| $5,000 to $7,499 | 9 (8.5%) | 8 (5.3%) |
| $7,500 to $9,999 | 0 (0.0%) | 6 (4.0%) |
| $10,000 to $12,499 | 3 (2.8%) | 7 (4.6%) |
| $12,500 to $14,999 | 0 (0.0%) | 17 (11.3%) |
| $15,000 to $17,499 | 0 (0.0%) | 25 (16.6%) |
| $17,500 to $19,999 | 0 (0.0%) | 14 (9.3%) |
| $20,000 to $22,499 | 1 (0.9%) | 11 (7.3%) |
| $22,500 to $24,999 | 0 (0.0%) | 5 (3.3%) |
| $25,000 to $29,999 | 6 (5.7%) | 4 (2.6%) |
| $30,000 to $34,999 | 0 (0.0%) | 2 (1.3%) |
| $35,000 to $39,999 | 2 (1.9%) | 0 (0.0%) |
| $40,000 to $44,999 | 17 (16.0%) | 0 (0.0%) |
| $45,000 to $49,999 | 6 (5.7%) | 6 (4.0%) |
| $50,000 to $54,999 | 6 (5.7%) | 0 (0.0%) |
| $55,000 to $64,999 | 9 (8.5%) | 31 (20.5%) |
| $65,000 to $74,999 | 13 (12.3%) | 3 (2.0%) |
| $75,000 to $99,999 | 12 (11.3%) | 0 (0.0%) |
| $100,000+ | 1 (0.9%) | 9 (6.0%) |
| Total | 106 (100.0%) | 151 (100.0%) |
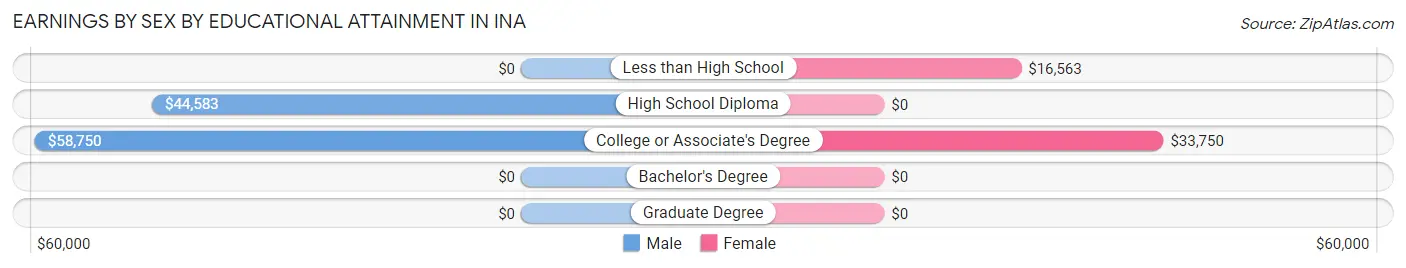
Earnings by Sex by Educational Attainment in Ina
Average earnings in Ina are $47,500 for men and $21,023 for women, a difference of 55.7%. Men with an educational attainment of college or associate's degree enjoy the highest average annual earnings of $58,750, while those with high school diploma education earn the least with $44,583. Women with an educational attainment of college or associate's degree earn the most with the average annual earnings of $33,750, while those with less than high school education have the smallest earnings of $16,563.
| Educational Attainment | Male Income | Female Income |
| Less than High School | - | - |
| High School Diploma | $44,583 | $0 |
| College or Associate's Degree | $58,750 | $33,750 |
| Bachelor's Degree | - | - |
| Graduate Degree | - | - |
| Total | $47,500 | $21,023 |
Family Income in Ina
Family Income Brackets in Ina
According to the Ina family income data, there are 34 families falling into the $50,000 to $74,999 income range, which is the most common income bracket and makes up 25.0% of all families.
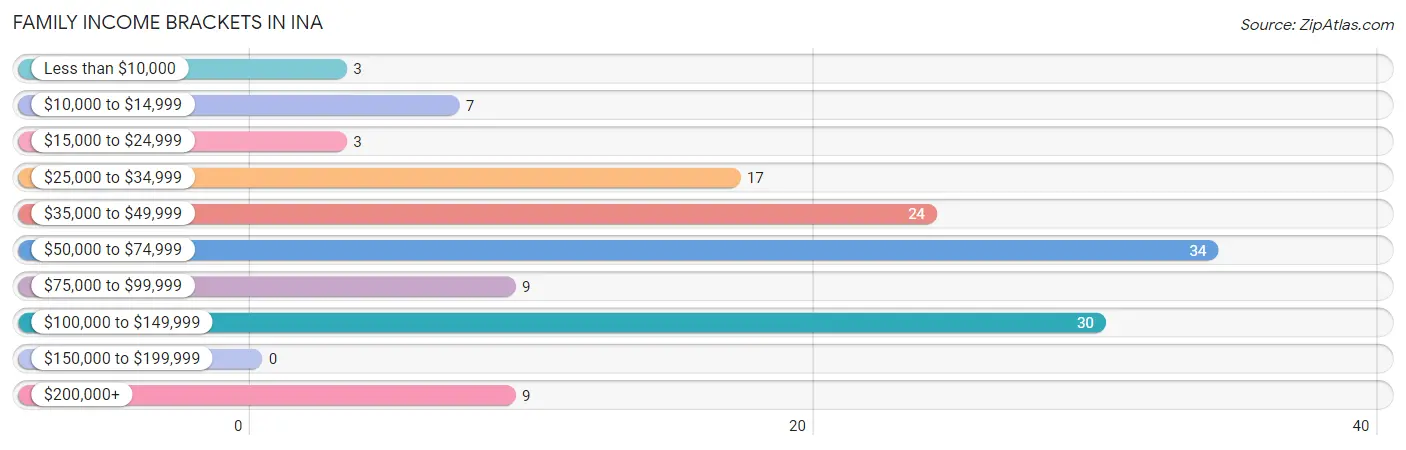
| Income Bracket | # Families | % Families |
| Less than $10,000 | 3 | 2.2% |
| $10,000 to $14,999 | 7 | 5.1% |
| $15,000 to $24,999 | 3 | 2.2% |
| $25,000 to $34,999 | 17 | 12.5% |
| $35,000 to $49,999 | 24 | 17.6% |
| $50,000 to $74,999 | 34 | 25.0% |
| $75,000 to $99,999 | 9 | 6.6% |
| $100,000 to $149,999 | 30 | 22.1% |
| $150,000 to $199,999 | 0 | 0.0% |
| $200,000+ | 9 | 6.6% |
Family Income by Famaliy Size in Ina
4-person families (15 | 11.0%) account for the highest median family income in Ina with $64,375 per family, while 2-person families (55 | 40.4%) have the highest median income of $24,062 per family member.
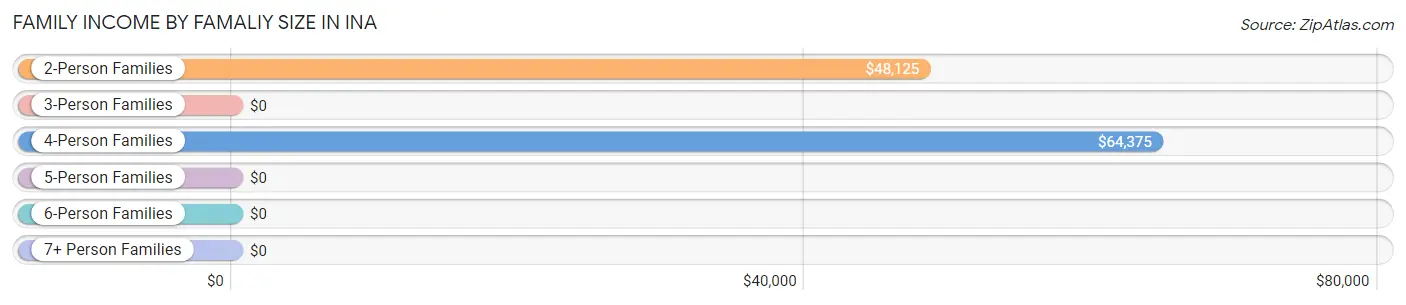
| Income Bracket | # Families | Median Income |
| 2-Person Families | 55 (40.4%) | $48,125 |
| 3-Person Families | 30 (22.1%) | $0 |
| 4-Person Families | 15 (11.0%) | $64,375 |
| 5-Person Families | 13 (9.6%) | $0 |
| 6-Person Families | 11 (8.1%) | $0 |
| 7+ Person Families | 12 (8.8%) | $0 |
| Total | 136 (100.0%) | $62,188 |
Family Income by Number of Earners in Ina
The median family income in Ina is $62,188, with families comprising 3+ earners (32) having the highest median family income of $109,792, while families with 1 earner (45) have the lowest median family income of $36,250, accounting for 23.5% and 33.1% of families, respectively.
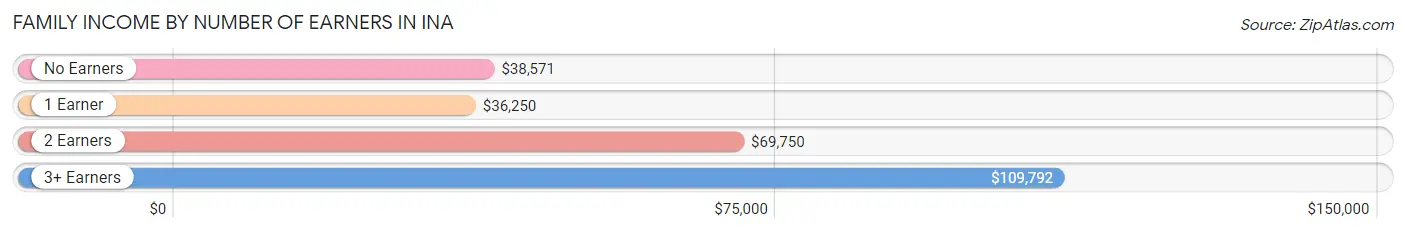
| Number of Earners | # Families | Median Income |
| No Earners | 28 (20.6%) | $38,571 |
| 1 Earner | 45 (33.1%) | $36,250 |
| 2 Earners | 31 (22.8%) | $69,750 |
| 3+ Earners | 32 (23.5%) | $109,792 |
| Total | 136 (100.0%) | $62,188 |
Household Income in Ina
Household Income Brackets in Ina
With 45 households falling in the category, the $50,000 to $74,999 income range is the most frequent in Ina, accounting for 22.2% of all households.
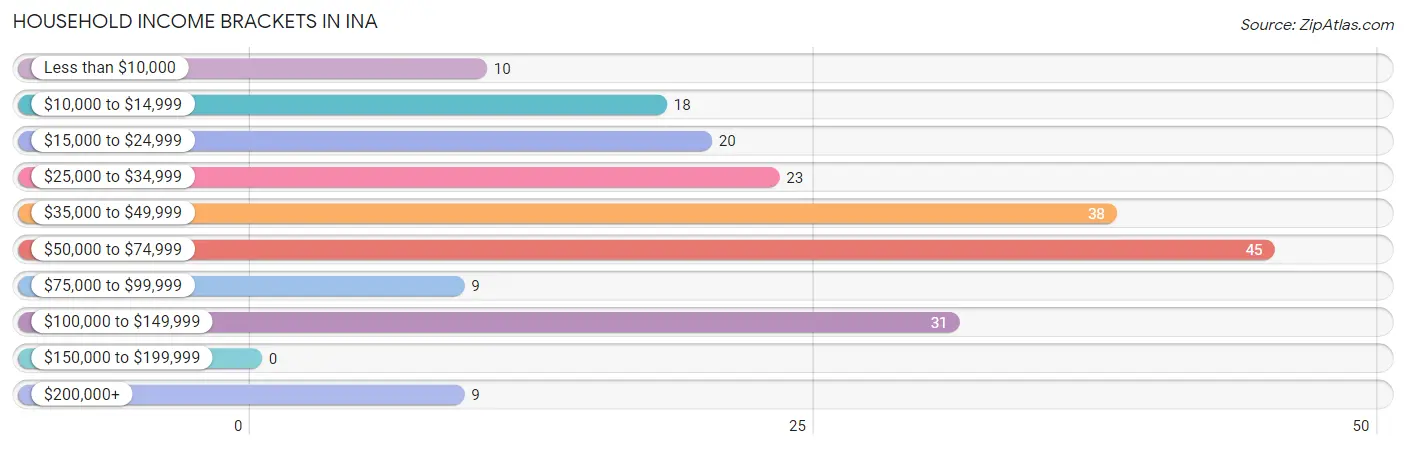
| Income Bracket | # Households | % Households |
| Less than $10,000 | 10 | 4.9% |
| $10,000 to $14,999 | 18 | 8.9% |
| $15,000 to $24,999 | 20 | 9.9% |
| $25,000 to $34,999 | 23 | 11.3% |
| $35,000 to $49,999 | 38 | 18.7% |
| $50,000 to $74,999 | 45 | 22.2% |
| $75,000 to $99,999 | 9 | 4.4% |
| $100,000 to $149,999 | 31 | 15.3% |
| $150,000 to $199,999 | 0 | 0.0% |
| $200,000+ | 9 | 4.4% |
Household Income by Householder Age in Ina
The median household income in Ina is $48,125, with the highest median household income of $67,083 found in the 15 to 24 years age bracket for the primary householder. A total of 16 households (7.9%) fall into this category. Meanwhile, the 65+ years age bracket for the primary householder has the lowest median household income of $35,556, with 56 households (27.6%) in this group.
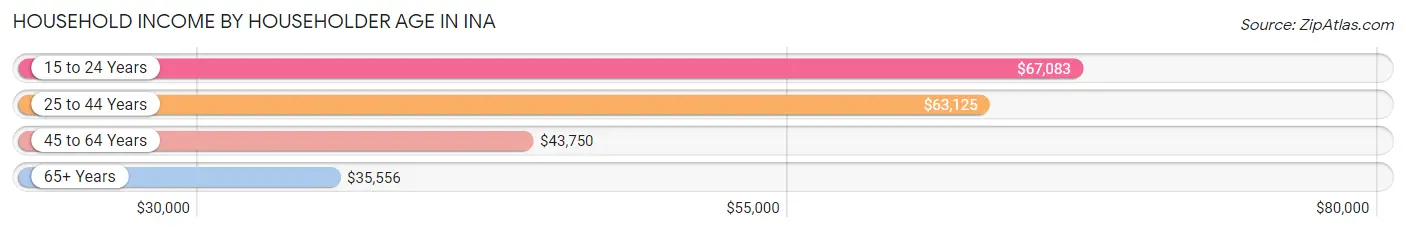
| Income Bracket | # Households | Median Income |
| 15 to 24 Years | 16 (7.9%) | $67,083 |
| 25 to 44 Years | 33 (16.3%) | $63,125 |
| 45 to 64 Years | 98 (48.3%) | $43,750 |
| 65+ Years | 56 (27.6%) | $35,556 |
| Total | 203 (100.0%) | $48,125 |
Poverty in Ina
Income Below Poverty by Sex and Age in Ina
With 24.7% poverty level for males and 24.0% for females among the residents of Ina, 35 to 44 year old males and 12 to 14 year old females are the most vulnerable to poverty, with 22 males (91.7%) and 15 females (78.9%) in their respective age groups living below the poverty level.
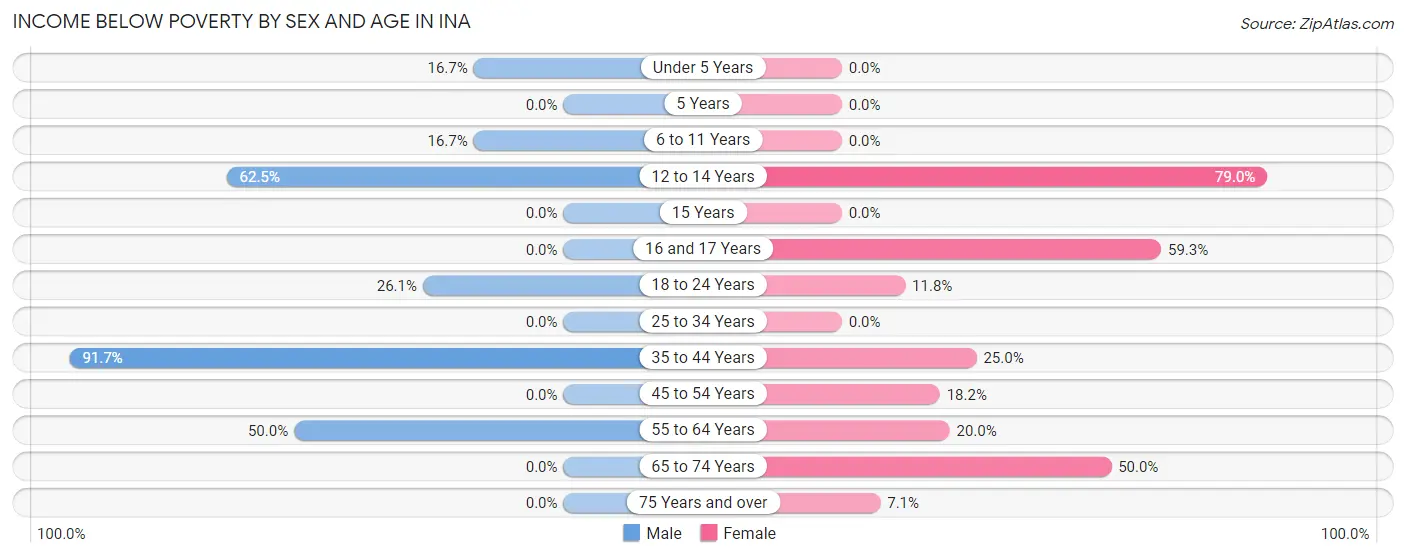
| Age Bracket | Male | Female |
| Under 5 Years | 2 (16.7%) | 0 (0.0%) |
| 5 Years | 0 (0.0%) | 0 (0.0%) |
| 6 to 11 Years | 3 (16.7%) | 0 (0.0%) |
| 12 to 14 Years | 5 (62.5%) | 15 (78.9%) |
| 15 Years | 0 (0.0%) | 0 (0.0%) |
| 16 and 17 Years | 0 (0.0%) | 16 (59.3%) |
| 18 to 24 Years | 12 (26.1%) | 2 (11.8%) |
| 25 to 34 Years | 0 (0.0%) | 0 (0.0%) |
| 35 to 44 Years | 22 (91.7%) | 6 (25.0%) |
| 45 to 54 Years | 0 (0.0%) | 8 (18.2%) |
| 55 to 64 Years | 16 (50.0%) | 11 (20.0%) |
| 65 to 74 Years | 0 (0.0%) | 17 (50.0%) |
| 75 Years and over | 0 (0.0%) | 1 (7.1%) |
| Total | 60 (24.7%) | 76 (24.0%) |
Income Above Poverty by Sex and Age in Ina
According to the poverty statistics in Ina, males aged 5 years and females aged under 5 years are the age groups that are most secure financially, with 100.0% of males and 100.0% of females in these age groups living above the poverty line.
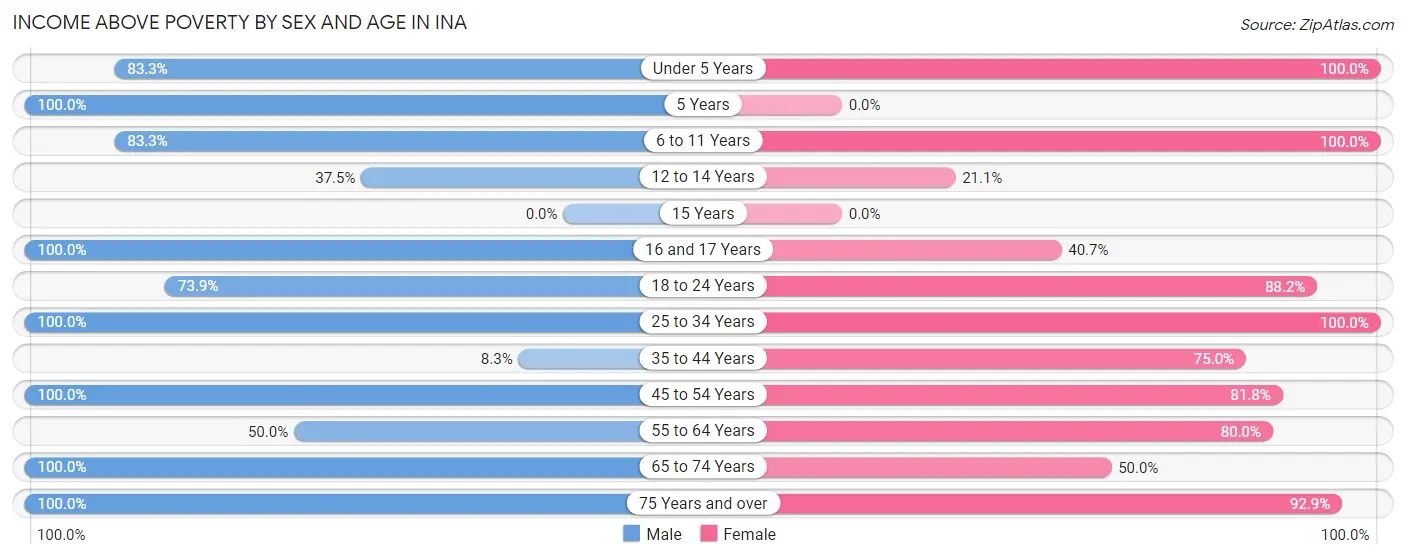
| Age Bracket | Male | Female |
| Under 5 Years | 10 (83.3%) | 34 (100.0%) |
| 5 Years | 2 (100.0%) | 0 (0.0%) |
| 6 to 11 Years | 15 (83.3%) | 15 (100.0%) |
| 12 to 14 Years | 3 (37.5%) | 4 (21.0%) |
| 15 Years | 0 (0.0%) | 0 (0.0%) |
| 16 and 17 Years | 15 (100.0%) | 11 (40.7%) |
| 18 to 24 Years | 34 (73.9%) | 15 (88.2%) |
| 25 to 34 Years | 28 (100.0%) | 34 (100.0%) |
| 35 to 44 Years | 2 (8.3%) | 18 (75.0%) |
| 45 to 54 Years | 24 (100.0%) | 36 (81.8%) |
| 55 to 64 Years | 16 (50.0%) | 44 (80.0%) |
| 65 to 74 Years | 15 (100.0%) | 17 (50.0%) |
| 75 Years and over | 19 (100.0%) | 13 (92.9%) |
| Total | 183 (75.3%) | 241 (76.0%) |
Income Below Poverty Among Married-Couple Families in Ina
The poverty statistics for married-couple families in Ina show that 15.9% or 14 of the total 88 families live below the poverty line. Families with 1 or 2 children have the highest poverty rate of 28.0%, comprising of 14 families. On the other hand, families with no children have the lowest poverty rate of 0.0%, which includes 0 families.
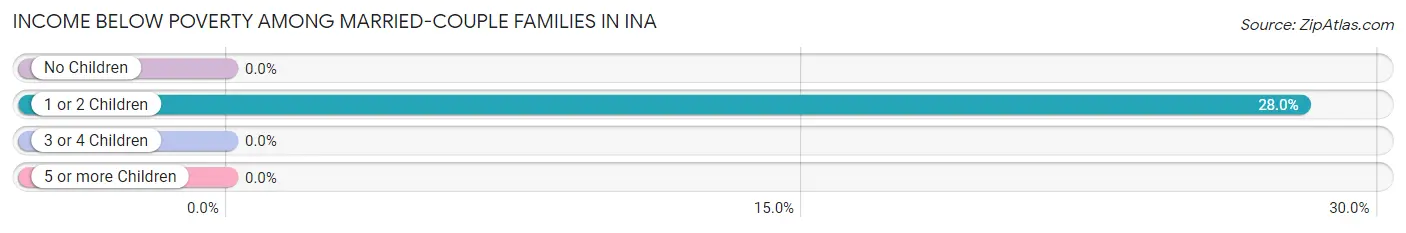
| Children | Above Poverty | Below Poverty |
| No Children | 38 (100.0%) | 0 (0.0%) |
| 1 or 2 Children | 36 (72.0%) | 14 (28.0%) |
| 3 or 4 Children | 0 (0.0%) | 0 (0.0%) |
| 5 or more Children | 0 (0.0%) | 0 (0.0%) |
| Total | 74 (84.1%) | 14 (15.9%) |
Income Below Poverty Among Single-Parent Households in Ina
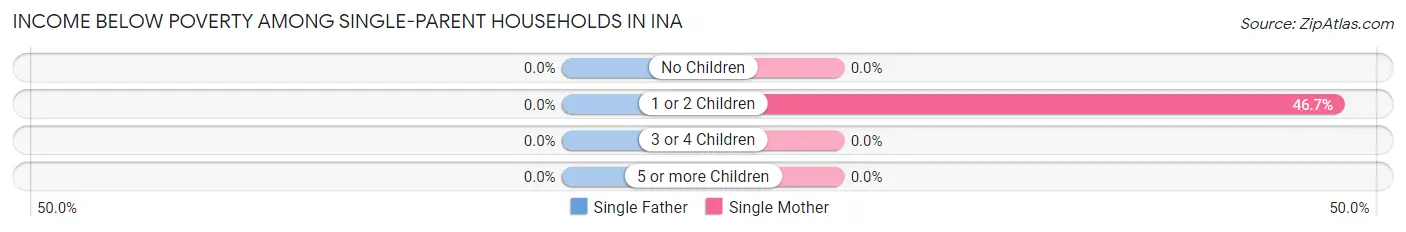
| Children | Single Father | Single Mother |
| No Children | 0 (0.0%) | 0 (0.0%) |
| 1 or 2 Children | 0 (0.0%) | 7 (46.7%) |
| 3 or 4 Children | 0 (0.0%) | 0 (0.0%) |
| 5 or more Children | 0 (0.0%) | 0 (0.0%) |
| Total | 0 (0.0%) | 7 (17.1%) |
Income Below Poverty Among Married-Couple vs Single-Parent Households in Ina
The poverty data for Ina shows that 14 of the married-couple family households (15.9%) and 7 of the single-parent households (14.6%) are living below the poverty level. Within the married-couple family households, those with 1 or 2 children have the highest poverty rate, with 14 households (28.0%) falling below the poverty line. Among the single-parent households, those with 1 or 2 children have the highest poverty rate, with 7 household (43.8%) living below poverty.
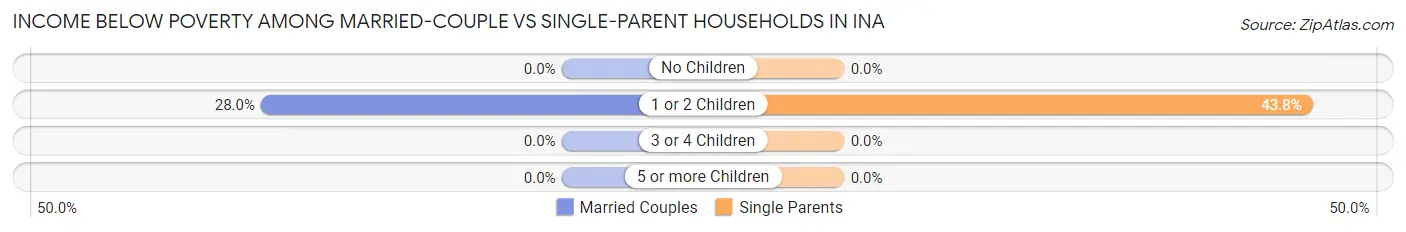
| Children | Married-Couple Families | Single-Parent Households |
| No Children | 0 (0.0%) | 0 (0.0%) |
| 1 or 2 Children | 14 (28.0%) | 7 (43.8%) |
| 3 or 4 Children | 0 (0.0%) | 0 (0.0%) |
| 5 or more Children | 0 (0.0%) | 0 (0.0%) |
| Total | 14 (15.9%) | 7 (14.6%) |
Race in Ina
The most populous races in Ina are White / Caucasian (1,156 | 65.9%), Black / African American (400 | 22.8%), and Two or more Races (156 | 8.9%).
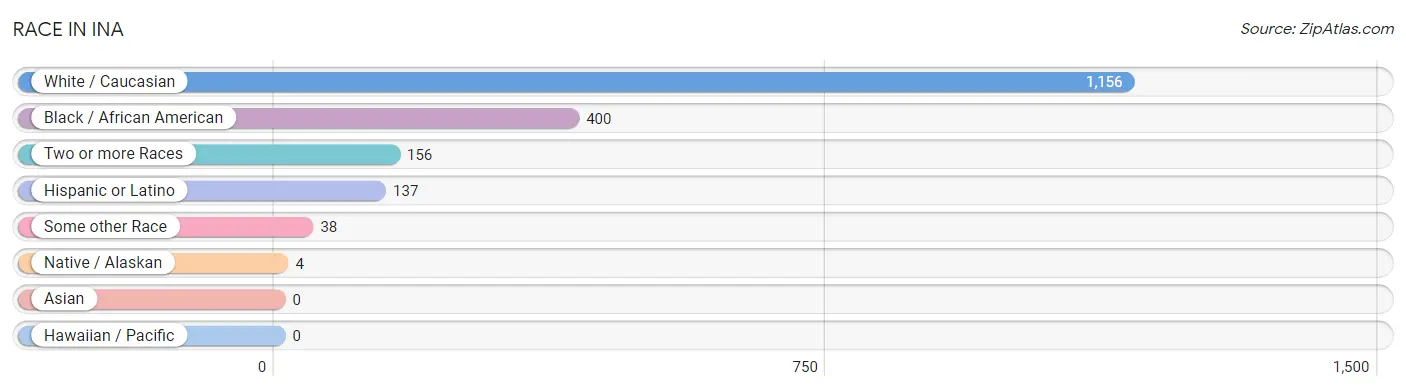
| Race | # Population | % Population |
| Asian | 0 | 0.0% |
| Black / African American | 400 | 22.8% |
| Hawaiian / Pacific | 0 | 0.0% |
| Hispanic or Latino | 137 | 7.8% |
| Native / Alaskan | 4 | 0.2% |
| White / Caucasian | 1,156 | 65.9% |
| Two or more Races | 156 | 8.9% |
| Some other Race | 38 | 2.2% |
| Total | 1,754 | 100.0% |
Ancestry in Ina
The most populous ancestries reported in Ina are German (181 | 10.3%), Irish (139 | 7.9%), Mexican (130 | 7.4%), English (97 | 5.5%), and American (15 | 0.9%), together accounting for 32.0% of all Ina residents.
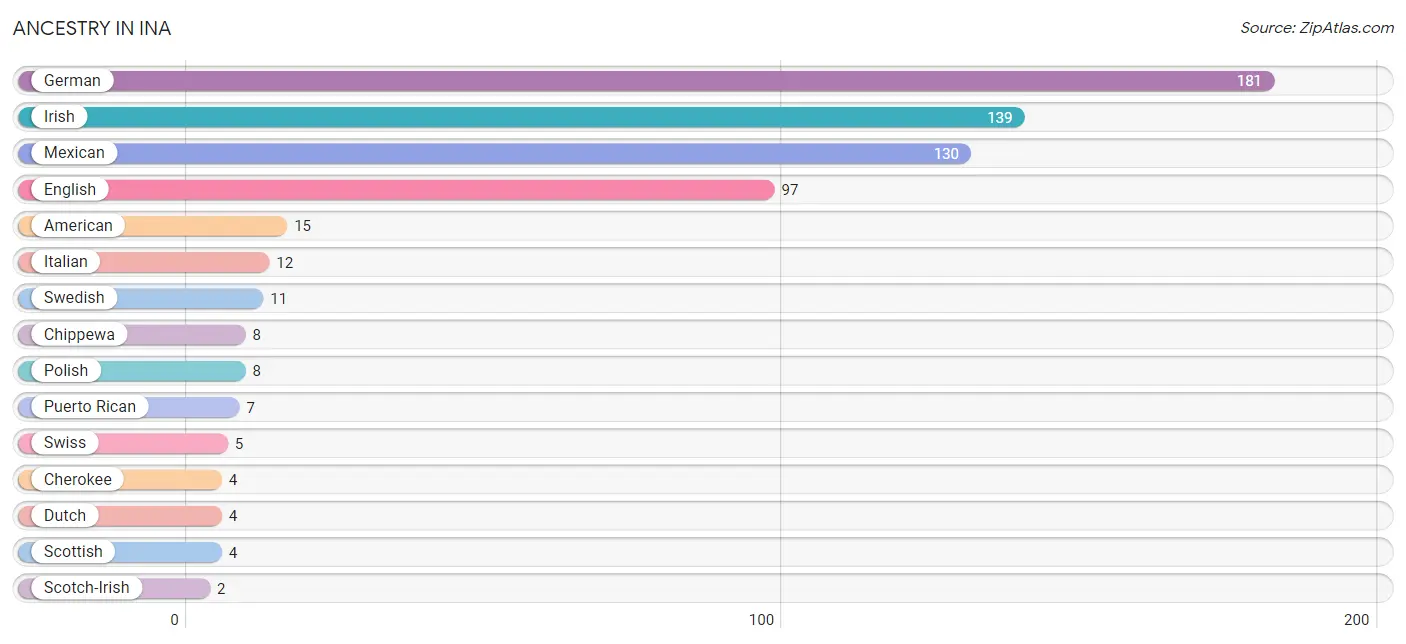
| Ancestry | # Population | % Population |
| American | 15 | 0.9% |
| Cherokee | 4 | 0.2% |
| Chippewa | 8 | 0.5% |
| Dutch | 4 | 0.2% |
| English | 97 | 5.5% |
| German | 181 | 10.3% |
| Irish | 139 | 7.9% |
| Italian | 12 | 0.7% |
| Mexican | 130 | 7.4% |
| Polish | 8 | 0.5% |
| Puerto Rican | 7 | 0.4% |
| Scotch-Irish | 2 | 0.1% |
| Scottish | 4 | 0.2% |
| Swedish | 11 | 0.6% |
| Swiss | 5 | 0.3% | View All 15 Rows |
Immigrants in Ina
The most numerous immigrant groups reported in Ina came from Central America (35 | 2.0%), Latin America (35 | 2.0%), and Mexico (35 | 2.0%), together accounting for 6.0% of all Ina residents.
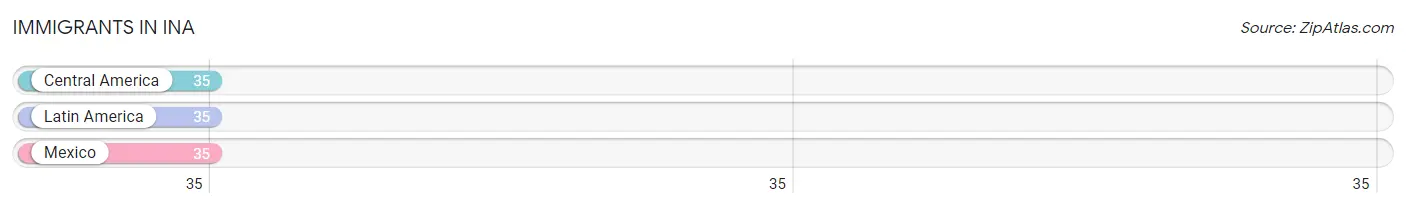
| Immigration Origin | # Population | % Population |
| Central America | 35 | 2.0% |
| Latin America | 35 | 2.0% |
| Mexico | 35 | 2.0% | View All 3 Rows |
Sex and Age in Ina
Sex and Age in Ina
The most populous age groups in Ina are 30 to 34 Years (186 | 12.9%) for men and Under 5 Years (34 | 10.7%) for women.
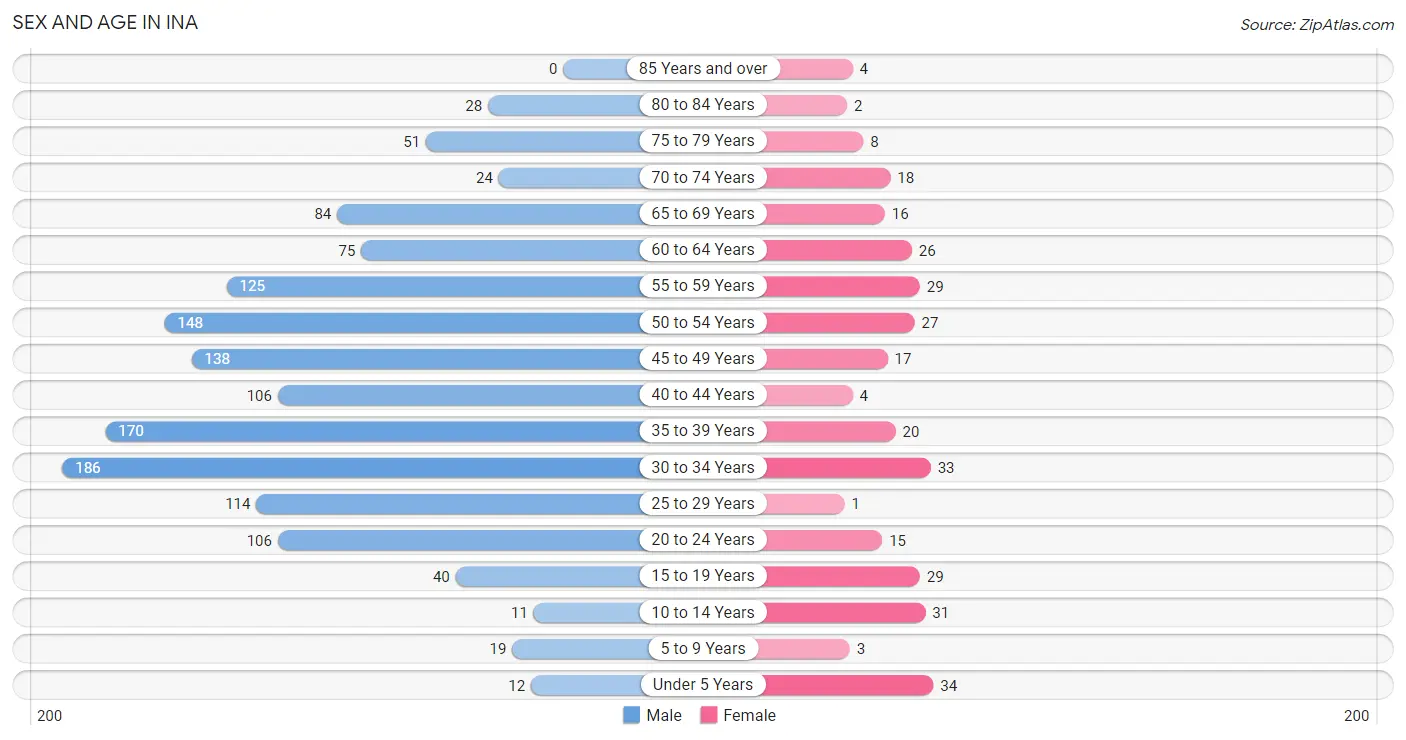
| Age Bracket | Male | Female |
| Under 5 Years | 12 (0.8%) | 34 (10.7%) |
| 5 to 9 Years | 19 (1.3%) | 3 (0.9%) |
| 10 to 14 Years | 11 (0.8%) | 31 (9.8%) |
| 15 to 19 Years | 40 (2.8%) | 29 (9.1%) |
| 20 to 24 Years | 106 (7.4%) | 15 (4.7%) |
| 25 to 29 Years | 114 (7.9%) | 1 (0.3%) |
| 30 to 34 Years | 186 (12.9%) | 33 (10.4%) |
| 35 to 39 Years | 170 (11.8%) | 20 (6.3%) |
| 40 to 44 Years | 106 (7.4%) | 4 (1.3%) |
| 45 to 49 Years | 138 (9.6%) | 17 (5.4%) |
| 50 to 54 Years | 148 (10.3%) | 27 (8.5%) |
| 55 to 59 Years | 125 (8.7%) | 29 (9.1%) |
| 60 to 64 Years | 75 (5.2%) | 26 (8.2%) |
| 65 to 69 Years | 84 (5.9%) | 16 (5.1%) |
| 70 to 74 Years | 24 (1.7%) | 18 (5.7%) |
| 75 to 79 Years | 51 (3.5%) | 8 (2.5%) |
| 80 to 84 Years | 28 (1.9%) | 2 (0.6%) |
| 85 Years and over | 0 (0.0%) | 4 (1.3%) |
| Total | 1,437 (100.0%) | 317 (100.0%) |
Families and Households in Ina
Median Family Size in Ina
The median family size in Ina is 3.56 persons per family, with single female/mother families (41 | 30.1%) accounting for the largest median family size of 4 persons per family. On the other hand, single male/father families (7 | 5.1%) represent the smallest median family size with 1.86 persons per family.
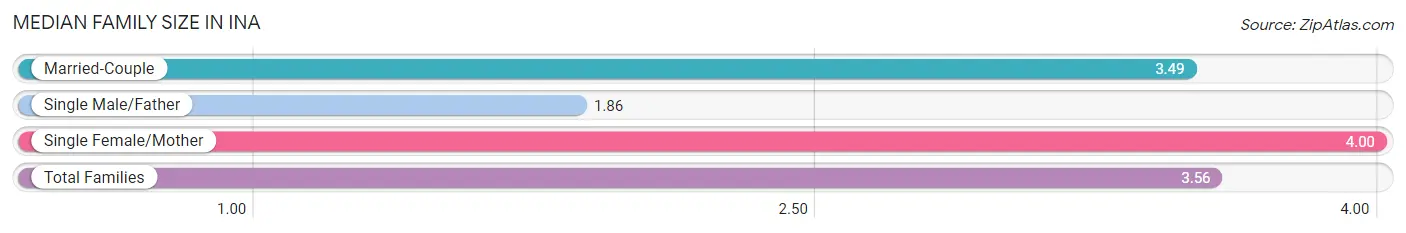
| Family Type | # Families | Family Size |
| Married-Couple | 88 (64.7%) | 3.49 |
| Single Male/Father | 7 (5.1%) | 1.86 |
| Single Female/Mother | 41 (30.1%) | 4.00 |
| Total Families | 136 (100.0%) | 3.56 |
Median Household Size in Ina
The median household size in Ina is 2.77 persons per household, with single female/mother households (41 | 20.2%) accounting for the largest median household size of 4.05 persons per household. non-family households (67 | 33.0%) represent the smallest median household size with 1.12 persons per household.
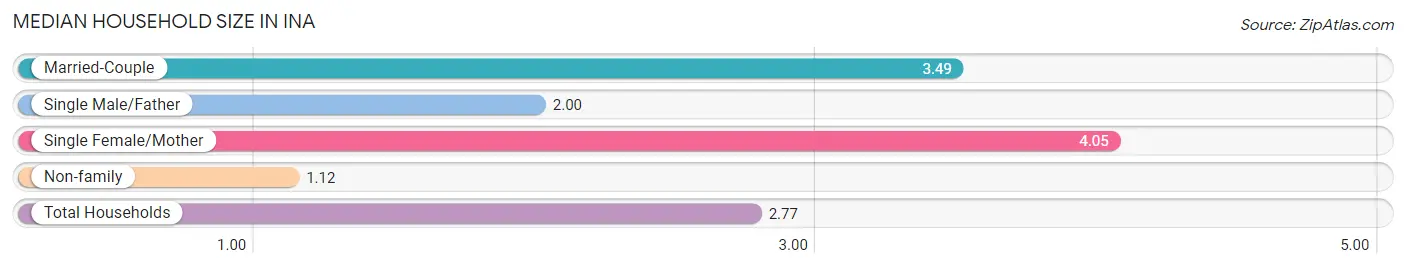
| Household Type | # Households | Household Size |
| Married-Couple | 88 (43.3%) | 3.49 |
| Single Male/Father | 7 (3.5%) | 2.00 |
| Single Female/Mother | 41 (20.2%) | 4.05 |
| Non-family | 67 (33.0%) | 1.12 |
| Total Households | 203 (100.0%) | 2.77 |
Household Size by Marriage Status in Ina
Out of a total of 203 households in Ina, 136 (67.0%) are family households, while 67 (33.0%) are nonfamily households. The most numerous type of family households are 2-person households, comprising 52, and the most common type of nonfamily households are 1-person households, comprising 62.
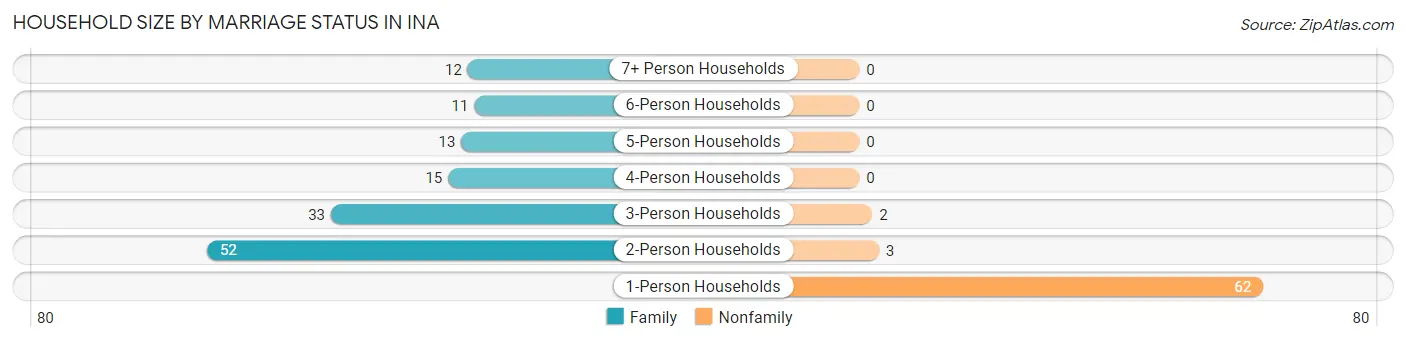
| Household Size | Family Households | Nonfamily Households |
| 1-Person Households | - | 62 (30.5%) |
| 2-Person Households | 52 (25.6%) | 3 (1.5%) |
| 3-Person Households | 33 (16.3%) | 2 (1.0%) |
| 4-Person Households | 15 (7.4%) | 0 (0.0%) |
| 5-Person Households | 13 (6.4%) | 0 (0.0%) |
| 6-Person Households | 11 (5.4%) | 0 (0.0%) |
| 7+ Person Households | 12 (5.9%) | 0 (0.0%) |
| Total | 136 (67.0%) | 67 (33.0%) |
Female Fertility in Ina
Fertility by Age in Ina
Average fertility rate in Ina is 145.0 births per 1,000 women. Women in the age bracket of 20 to 34 years have the highest fertility rate with 388.0 births per 1,000 women. Women in the age bracket of 20 to 34 years acount for 100.0% of all women with births.
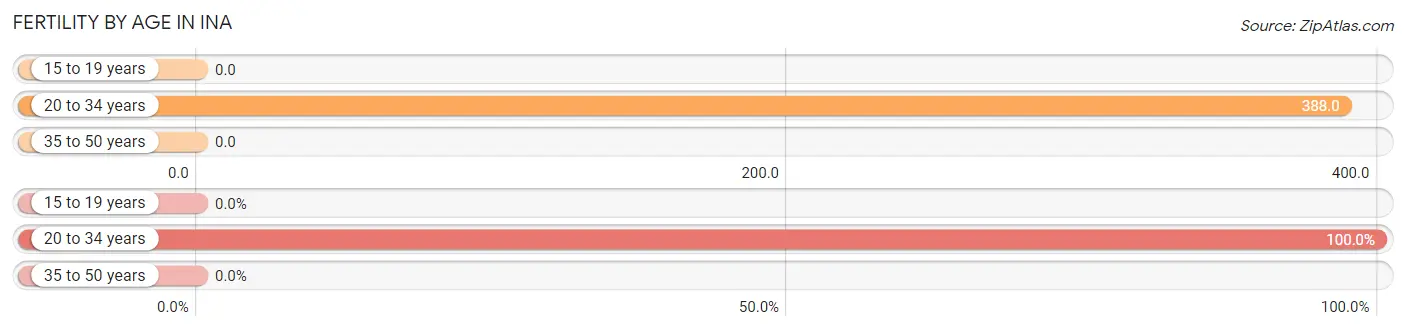
| Age Bracket | Women with Births | Births / 1,000 Women |
| 15 to 19 years | 0 (0.0%) | 0.0 |
| 20 to 34 years | 19 (100.0%) | 388.0 |
| 35 to 50 years | 0 (0.0%) | 0.0 |
| Total | 19 (100.0%) | 145.0 |
Fertility by Age by Marriage Status in Ina
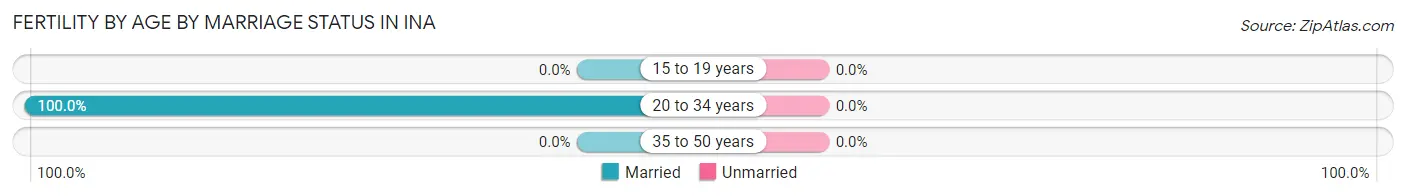
| Age Bracket | Married | Unmarried |
| 15 to 19 years | 0 (0.0%) | 0 (0.0%) |
| 20 to 34 years | 19 (100.0%) | 0 (0.0%) |
| 35 to 50 years | 0 (0.0%) | 0 (0.0%) |
| Total | 19 (100.0%) | 0 (0.0%) |
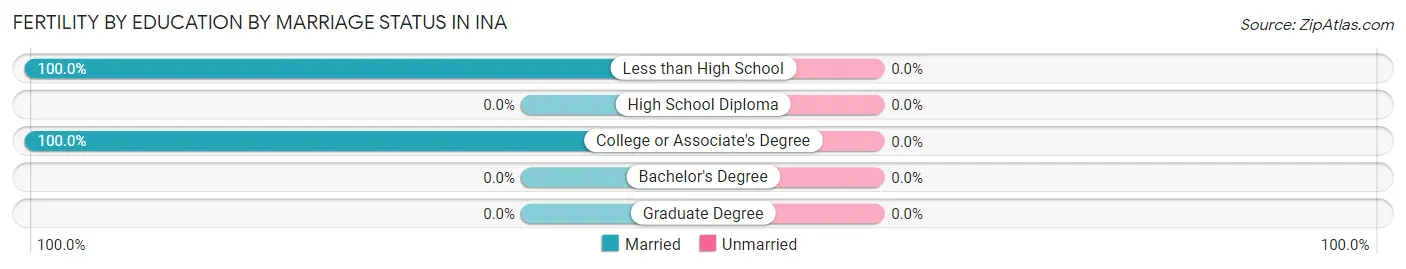
Fertility by Education in Ina
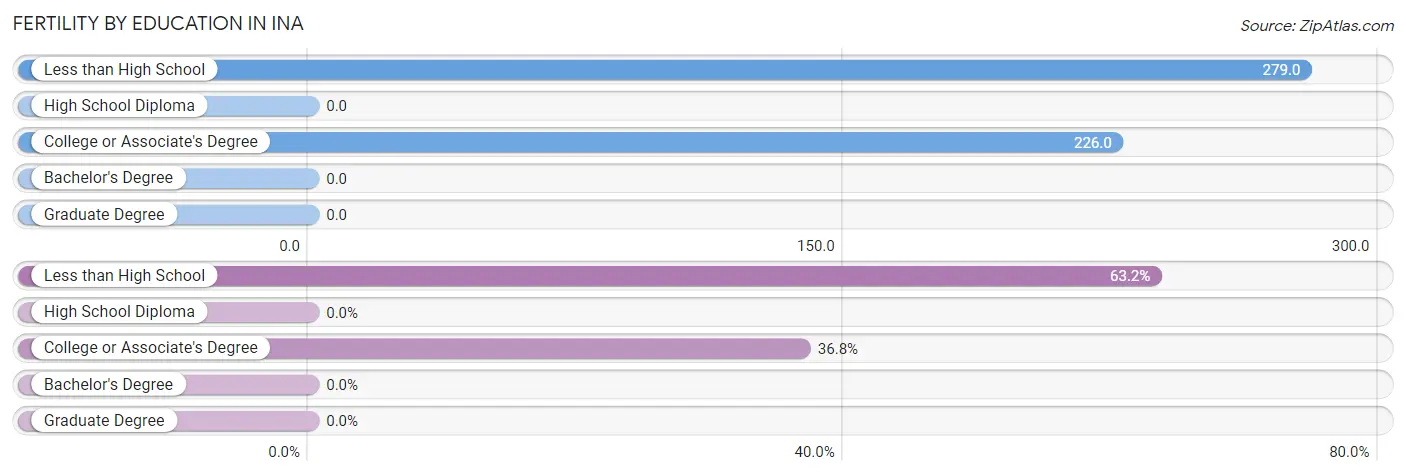
| Educational Attainment | Women with Births | Births / 1,000 Women |
| Less than High School | 12 (63.2%) | 279.0 |
| High School Diploma | 0 (0.0%) | 0.0 |
| College or Associate's Degree | 7 (36.8%) | 226.0 |
| Bachelor's Degree | 0 (0.0%) | 0.0 |
| Graduate Degree | 0 (0.0%) | 0.0 |
| Total | 19 (100.0%) | 145.0 |
Fertility by Education by Marriage Status in Ina
| Educational Attainment | Married | Unmarried |
| Less than High School | 12 (100.0%) | 0 (0.0%) |
| High School Diploma | 0 (0.0%) | 0 (0.0%) |
| College or Associate's Degree | 7 (100.0%) | 0 (0.0%) |
| Bachelor's Degree | 0 (0.0%) | 0 (0.0%) |
| Graduate Degree | 0 (0.0%) | 0 (0.0%) |
| Total | 19 (100.0%) | 0 (0.0%) |
Employment Characteristics in Ina
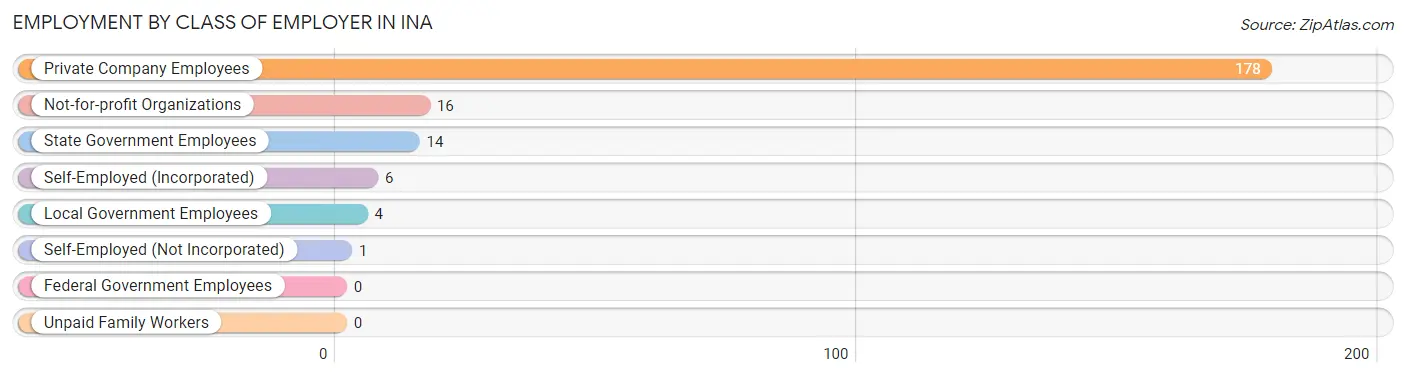
Employment by Class of Employer in Ina
Among the 219 employed individuals in Ina, private company employees (178 | 81.3%), not-for-profit organizations (16 | 7.3%), and state government employees (14 | 6.4%) make up the most common classes of employment.
| Employer Class | # Employees | % Employees |
| Private Company Employees | 178 | 81.3% |
| Self-Employed (Incorporated) | 6 | 2.7% |
| Self-Employed (Not Incorporated) | 1 | 0.5% |
| Not-for-profit Organizations | 16 | 7.3% |
| Local Government Employees | 4 | 1.8% |
| State Government Employees | 14 | 6.4% |
| Federal Government Employees | 0 | 0.0% |
| Unpaid Family Workers | 0 | 0.0% |
| Total | 219 | 100.0% |
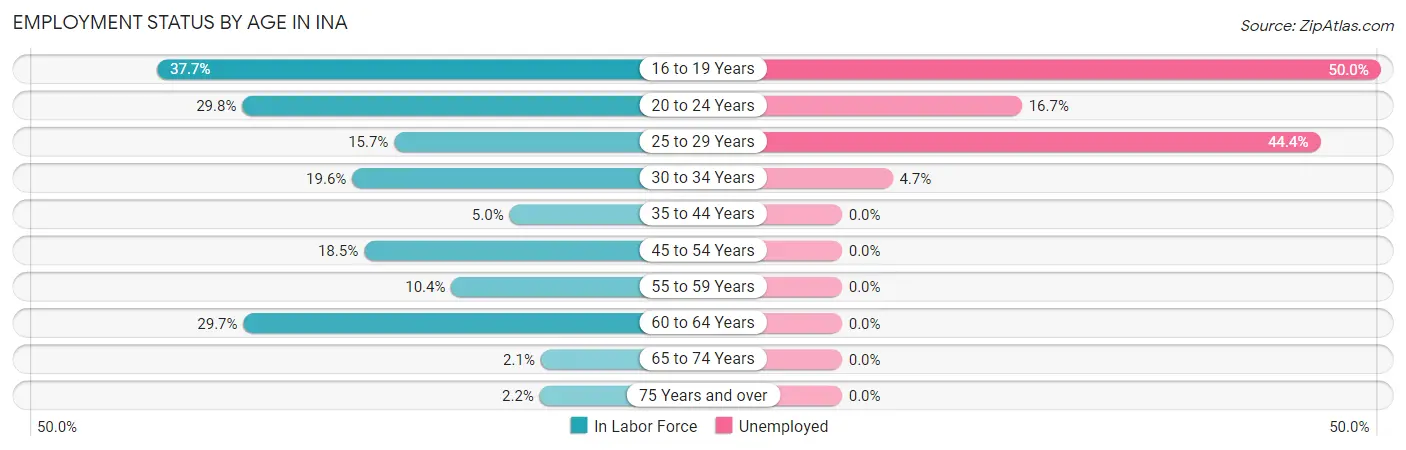
Employment Status by Age in Ina
According to the labor force statistics for Ina, out of the total population over 16 years of age (1,644), 15.2% or 250 individuals are in the labor force, with 11.6% or 29 of them unemployed. The age group with the highest labor force participation rate is 16 to 19 years, with 37.7% or 26 individuals in the labor force. Within the labor force, the 16 to 19 years age range has the highest percentage of unemployed individuals, with 50.0% or 13 of them being unemployed.
| Age Bracket | In Labor Force | Unemployed |
| 16 to 19 Years | 26 (37.7%) | 13 (50.0%) |
| 20 to 24 Years | 36 (29.8%) | 6 (16.7%) |
| 25 to 29 Years | 18 (15.7%) | 8 (44.4%) |
| 30 to 34 Years | 43 (19.6%) | 2 (4.7%) |
| 35 to 44 Years | 15 (5.0%) | 0 (0.0%) |
| 45 to 54 Years | 61 (18.5%) | 0 (0.0%) |
| 55 to 59 Years | 16 (10.4%) | 0 (0.0%) |
| 60 to 64 Years | 30 (29.7%) | 0 (0.0%) |
| 65 to 74 Years | 3 (2.1%) | 0 (0.0%) |
| 75 Years and over | 2 (2.2%) | 0 (0.0%) |
| Total | 250 (15.2%) | 29 (11.6%) |
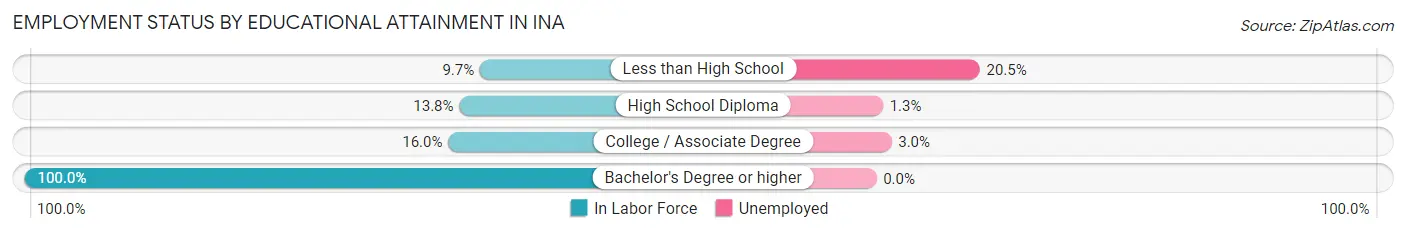
Employment Status by Educational Attainment in Ina
According to labor force statistics for Ina, 15.0% of individuals (183) out of the total population between 25 and 64 years of age (1,219) are in the labor force, with 5.5% or 10 of them being unemployed. The group with the highest labor force participation rate are those with the educational attainment of bachelor's degree or higher, with 100.0% or 31 individuals in the labor force. Within the labor force, individuals with less than high school education have the highest percentage of unemployment, with 20.5% or 8 of them being unemployed.
| Educational Attainment | In Labor Force | Unemployed |
| Less than High School | 39 (9.7%) | 82 (20.5%) |
| High School Diploma | 80 (13.8%) | 8 (1.3%) |
| College / Associate Degree | 33 (16.0%) | 6 (3.0%) |
| Bachelor's Degree or higher | 31 (100.0%) | 0 (0.0%) |
| Total | 183 (15.0%) | 67 (5.5%) |
Employment Occupations by Sex in Ina
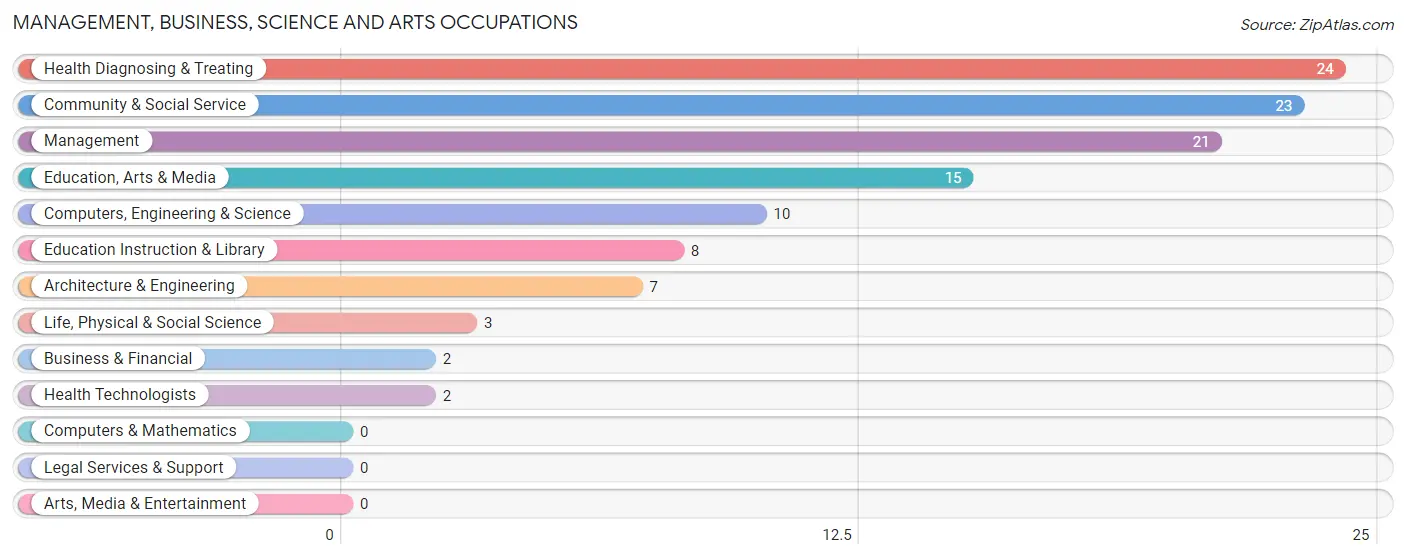
Management, Business, Science and Arts Occupations
The most common Management, Business, Science and Arts occupations in Ina are Health Diagnosing & Treating (24 | 10.9%), Community & Social Service (23 | 10.4%), Management (21 | 9.5%), Education, Arts & Media (15 | 6.8%), and Computers, Engineering & Science (10 | 4.5%).
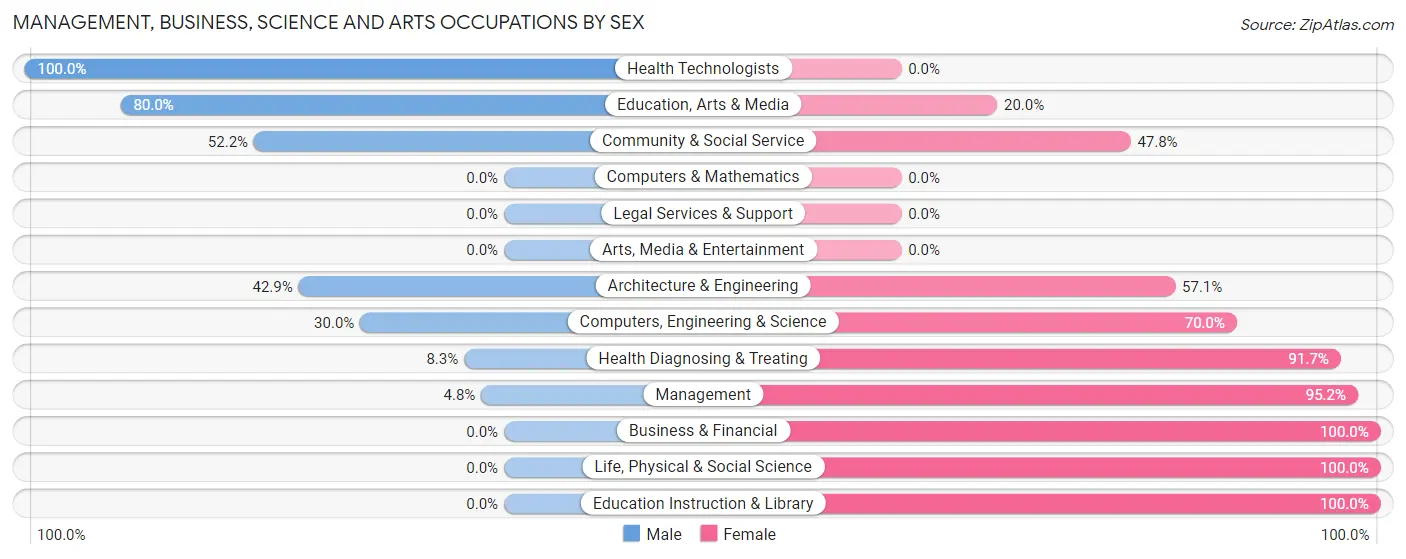
Management, Business, Science and Arts Occupations by Sex
Within the Management, Business, Science and Arts occupations in Ina, the most male-oriented occupations are Health Technologists (100.0%), Education, Arts & Media (80.0%), and Community & Social Service (52.2%), while the most female-oriented occupations are Business & Financial (100.0%), Life, Physical & Social Science (100.0%), and Education Instruction & Library (100.0%).
| Occupation | Male | Female |
| Management | 1 (4.8%) | 20 (95.2%) |
| Business & Financial | 0 (0.0%) | 2 (100.0%) |
| Computers, Engineering & Science | 3 (30.0%) | 7 (70.0%) |
| Computers & Mathematics | 0 (0.0%) | 0 (0.0%) |
| Architecture & Engineering | 3 (42.9%) | 4 (57.1%) |
| Life, Physical & Social Science | 0 (0.0%) | 3 (100.0%) |
| Community & Social Service | 12 (52.2%) | 11 (47.8%) |
| Education, Arts & Media | 12 (80.0%) | 3 (20.0%) |
| Legal Services & Support | 0 (0.0%) | 0 (0.0%) |
| Education Instruction & Library | 0 (0.0%) | 8 (100.0%) |
| Arts, Media & Entertainment | 0 (0.0%) | 0 (0.0%) |
| Health Diagnosing & Treating | 2 (8.3%) | 22 (91.7%) |
| Health Technologists | 2 (100.0%) | 0 (0.0%) |
| Total (Category) | 18 (22.5%) | 62 (77.5%) |
| Total (Overall) | 77 (34.8%) | 144 (65.2%) |
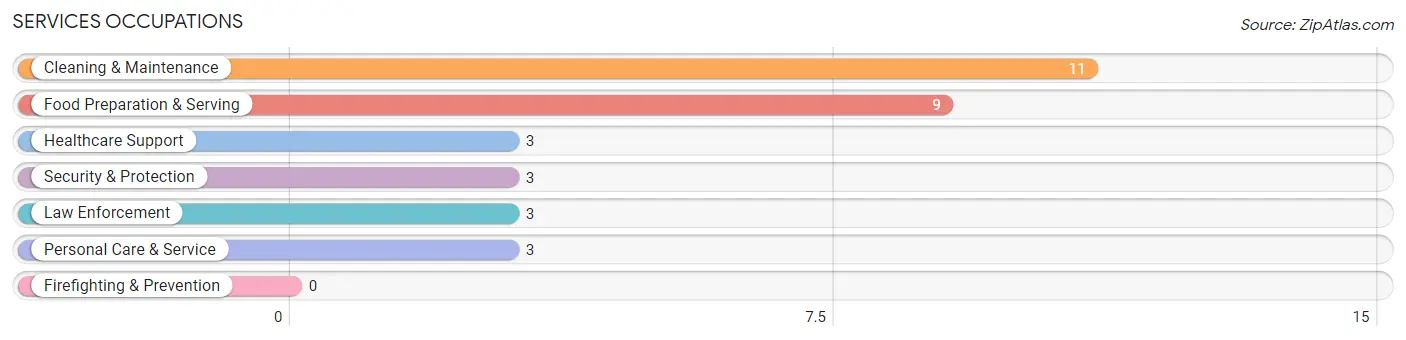
Services Occupations
The most common Services occupations in Ina are Cleaning & Maintenance (11 | 5.0%), Food Preparation & Serving (9 | 4.1%), Healthcare Support (3 | 1.4%), Security & Protection (3 | 1.4%), and Law Enforcement (3 | 1.4%).
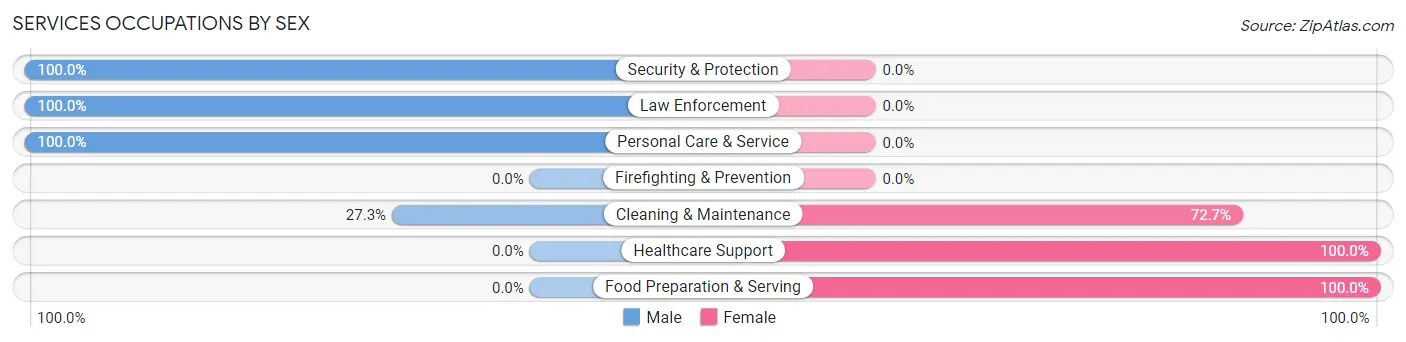
Services Occupations by Sex
Within the Services occupations in Ina, the most male-oriented occupations are Security & Protection (100.0%), Law Enforcement (100.0%), and Personal Care & Service (100.0%), while the most female-oriented occupations are Healthcare Support (100.0%), Food Preparation & Serving (100.0%), and Cleaning & Maintenance (72.7%).
| Occupation | Male | Female |
| Healthcare Support | 0 (0.0%) | 3 (100.0%) |
| Security & Protection | 3 (100.0%) | 0 (0.0%) |
| Firefighting & Prevention | 0 (0.0%) | 0 (0.0%) |
| Law Enforcement | 3 (100.0%) | 0 (0.0%) |
| Food Preparation & Serving | 0 (0.0%) | 9 (100.0%) |
| Cleaning & Maintenance | 3 (27.3%) | 8 (72.7%) |
| Personal Care & Service | 3 (100.0%) | 0 (0.0%) |
| Total (Category) | 9 (31.0%) | 20 (69.0%) |
| Total (Overall) | 77 (34.8%) | 144 (65.2%) |
Sales and Office Occupations
The most common Sales and Office occupations in Ina are Sales & Related (15 | 6.8%), and Office & Administration (15 | 6.8%).
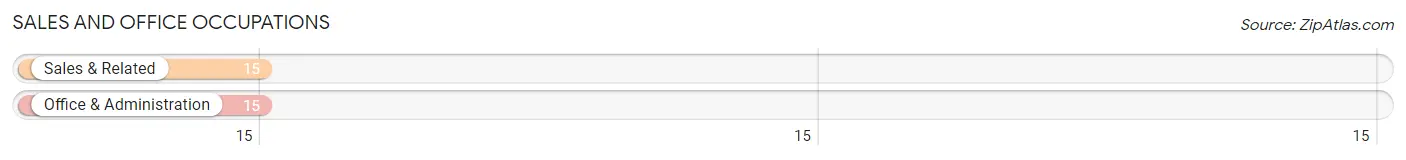
Sales and Office Occupations by Sex
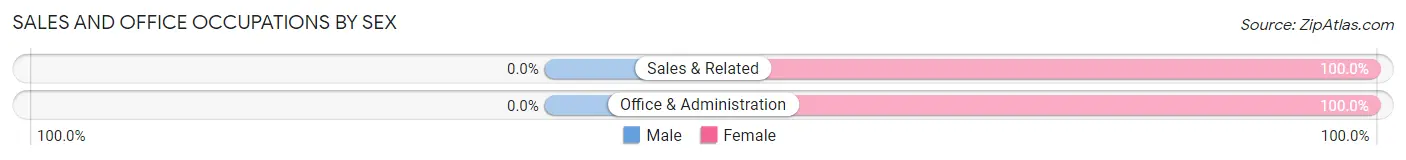
| Occupation | Male | Female |
| Sales & Related | 0 (0.0%) | 15 (100.0%) |
| Office & Administration | 0 (0.0%) | 15 (100.0%) |
| Total (Category) | 0 (0.0%) | 30 (100.0%) |
| Total (Overall) | 77 (34.8%) | 144 (65.2%) |
Natural Resources, Construction and Maintenance Occupations
The most common Natural Resources, Construction and Maintenance occupations in Ina are Construction & Extraction (8 | 3.6%), and Installation, Maintenance & Repair (8 | 3.6%).
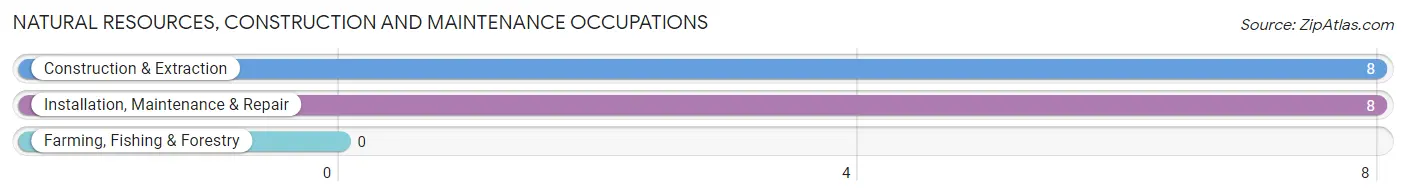
Natural Resources, Construction and Maintenance Occupations by Sex
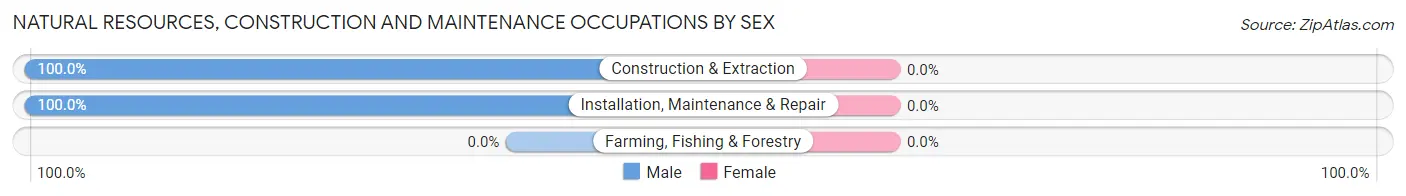
| Occupation | Male | Female |
| Farming, Fishing & Forestry | 0 (0.0%) | 0 (0.0%) |
| Construction & Extraction | 8 (100.0%) | 0 (0.0%) |
| Installation, Maintenance & Repair | 8 (100.0%) | 0 (0.0%) |
| Total (Category) | 16 (100.0%) | 0 (0.0%) |
| Total (Overall) | 77 (34.8%) | 144 (65.2%) |
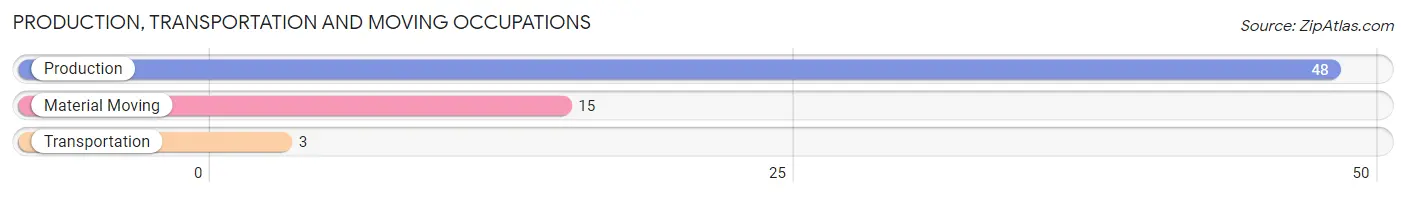
Production, Transportation and Moving Occupations
The most common Production, Transportation and Moving occupations in Ina are Production (48 | 21.7%), Material Moving (15 | 6.8%), and Transportation (3 | 1.4%).
Production, Transportation and Moving Occupations by Sex
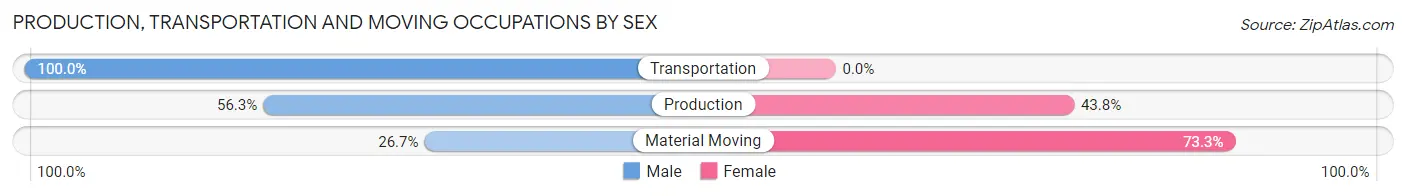
| Occupation | Male | Female |
| Production | 27 (56.2%) | 21 (43.8%) |
| Transportation | 3 (100.0%) | 0 (0.0%) |
| Material Moving | 4 (26.7%) | 11 (73.3%) |
| Total (Category) | 34 (51.5%) | 32 (48.5%) |
| Total (Overall) | 77 (34.8%) | 144 (65.2%) |
Employment Industries by Sex in Ina
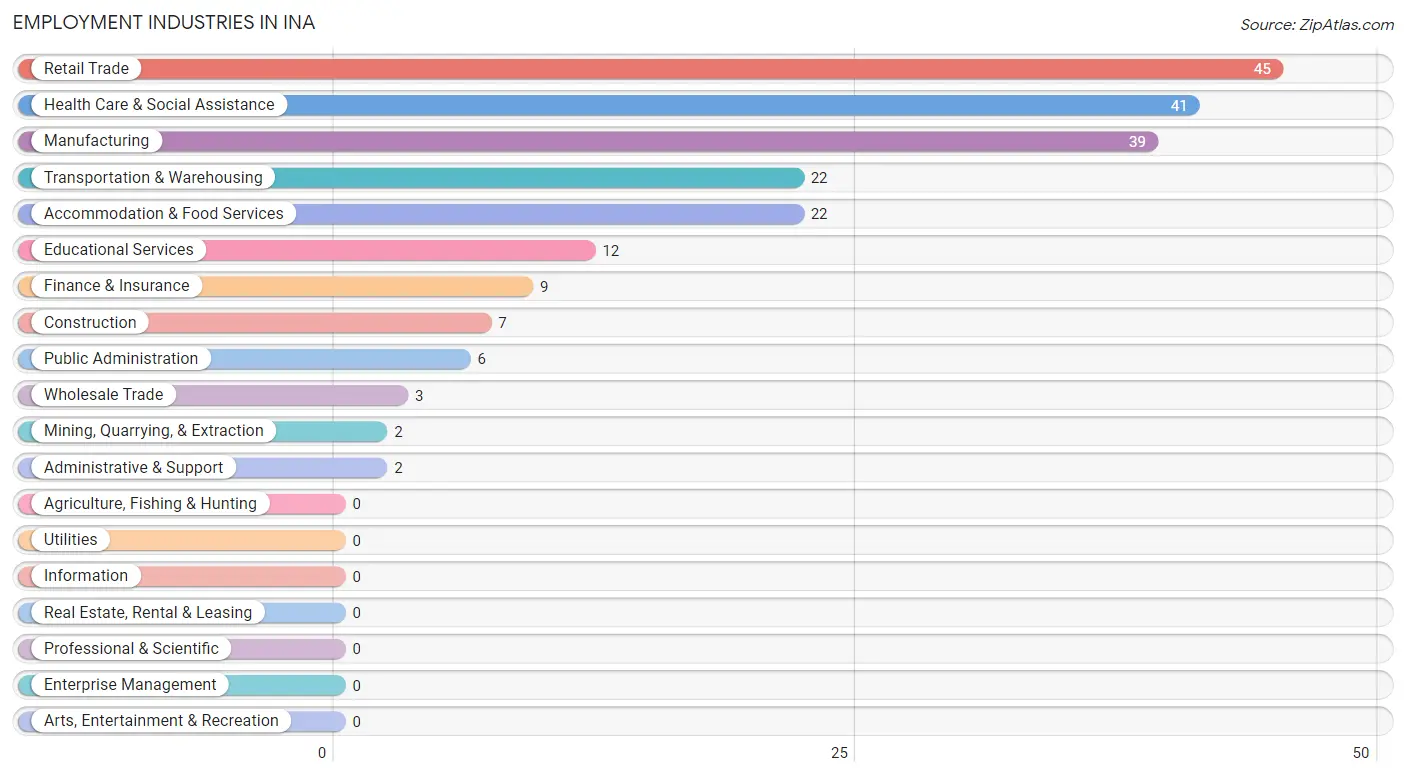
Employment Industries in Ina
The major employment industries in Ina include Retail Trade (45 | 20.4%), Health Care & Social Assistance (41 | 18.5%), Manufacturing (39 | 17.6%), Transportation & Warehousing (22 | 10.0%), and Accommodation & Food Services (22 | 10.0%).
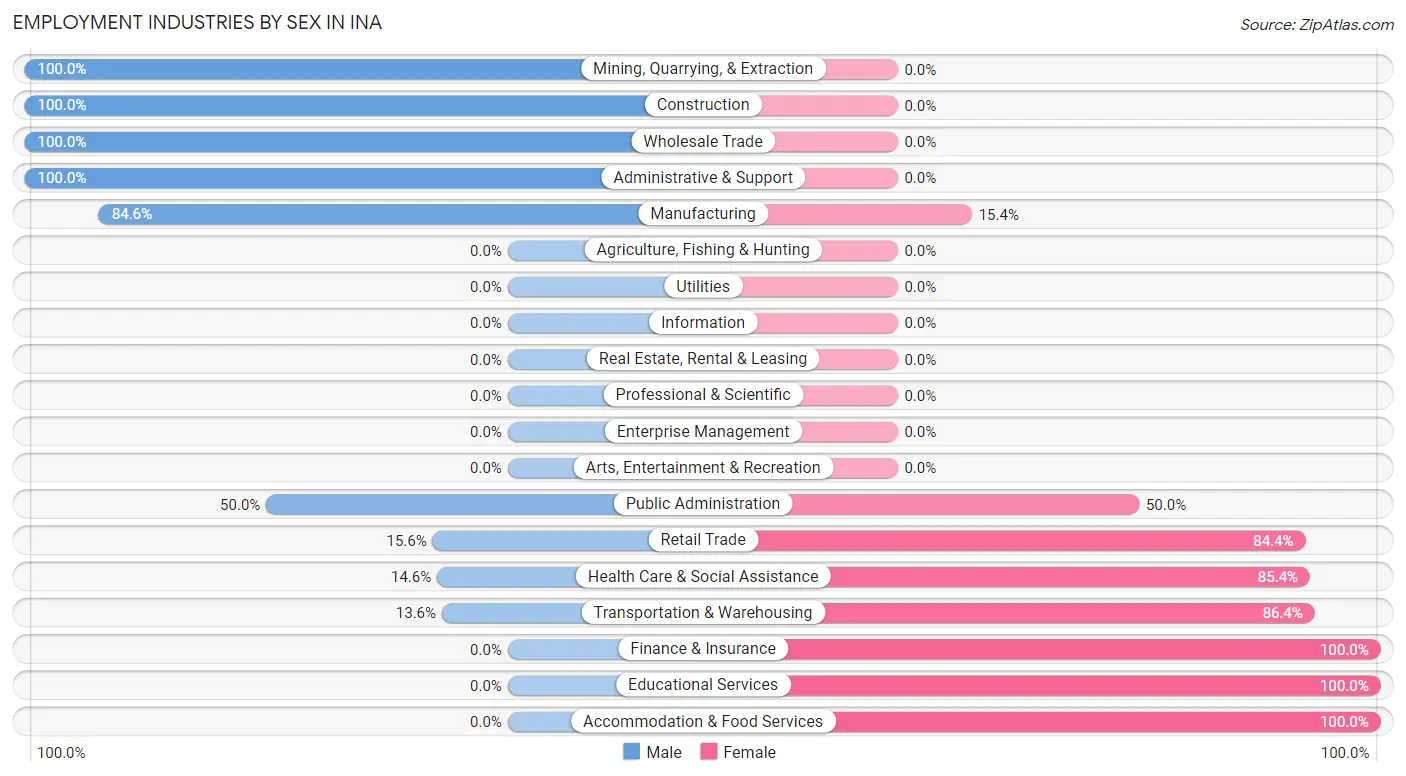
Employment Industries by Sex in Ina
The Ina industries that see more men than women are Mining, Quarrying, & Extraction (100.0%), Construction (100.0%), and Wholesale Trade (100.0%), whereas the industries that tend to have a higher number of women are Finance & Insurance (100.0%), Educational Services (100.0%), and Accommodation & Food Services (100.0%).
| Industry | Male | Female |
| Agriculture, Fishing & Hunting | 0 (0.0%) | 0 (0.0%) |
| Mining, Quarrying, & Extraction | 2 (100.0%) | 0 (0.0%) |
| Construction | 7 (100.0%) | 0 (0.0%) |
| Manufacturing | 33 (84.6%) | 6 (15.4%) |
| Wholesale Trade | 3 (100.0%) | 0 (0.0%) |
| Retail Trade | 7 (15.6%) | 38 (84.4%) |
| Transportation & Warehousing | 3 (13.6%) | 19 (86.4%) |
| Utilities | 0 (0.0%) | 0 (0.0%) |
| Information | 0 (0.0%) | 0 (0.0%) |
| Finance & Insurance | 0 (0.0%) | 9 (100.0%) |
| Real Estate, Rental & Leasing | 0 (0.0%) | 0 (0.0%) |
| Professional & Scientific | 0 (0.0%) | 0 (0.0%) |
| Enterprise Management | 0 (0.0%) | 0 (0.0%) |
| Administrative & Support | 2 (100.0%) | 0 (0.0%) |
| Educational Services | 0 (0.0%) | 12 (100.0%) |
| Health Care & Social Assistance | 6 (14.6%) | 35 (85.4%) |
| Arts, Entertainment & Recreation | 0 (0.0%) | 0 (0.0%) |
| Accommodation & Food Services | 0 (0.0%) | 22 (100.0%) |
| Public Administration | 3 (50.0%) | 3 (50.0%) |
| Total | 77 (34.8%) | 144 (65.2%) |
Education in Ina
School Enrollment in Ina
The most common levels of schooling among the 140 students in Ina are high school (56 | 40.0%), middle school (37 | 26.4%), and college / undergraduate (24 | 17.1%).
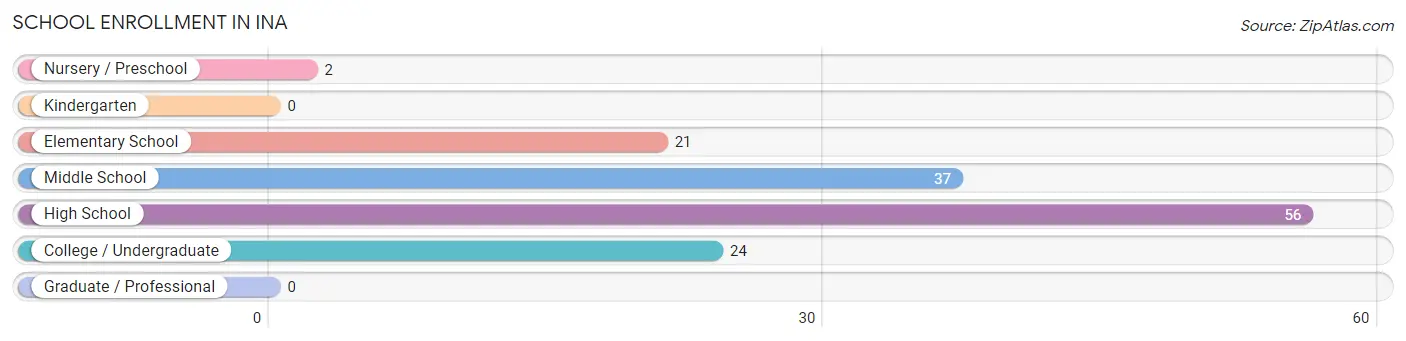
| School Level | # Students | % Students |
| Nursery / Preschool | 2 | 1.4% |
| Kindergarten | 0 | 0.0% |
| Elementary School | 21 | 15.0% |
| Middle School | 37 | 26.4% |
| High School | 56 | 40.0% |
| College / Undergraduate | 24 | 17.1% |
| Graduate / Professional | 0 | 0.0% |
| Total | 140 | 100.0% |
School Enrollment by Age by Funding Source in Ina
Out of a total of 140 students who are enrolled in schools in Ina, 8 (5.7%) attend a private institution, while the remaining 132 (94.3%) are enrolled in public schools. The age group of 25 to 34 year olds has the highest likelihood of being enrolled in private schools, with 6 (100.0% in the age bracket) enrolled. Conversely, the age group of 3 to 4 year olds has the lowest likelihood of being enrolled in a private school, with 2 (100.0% in the age bracket) attending a public institution.
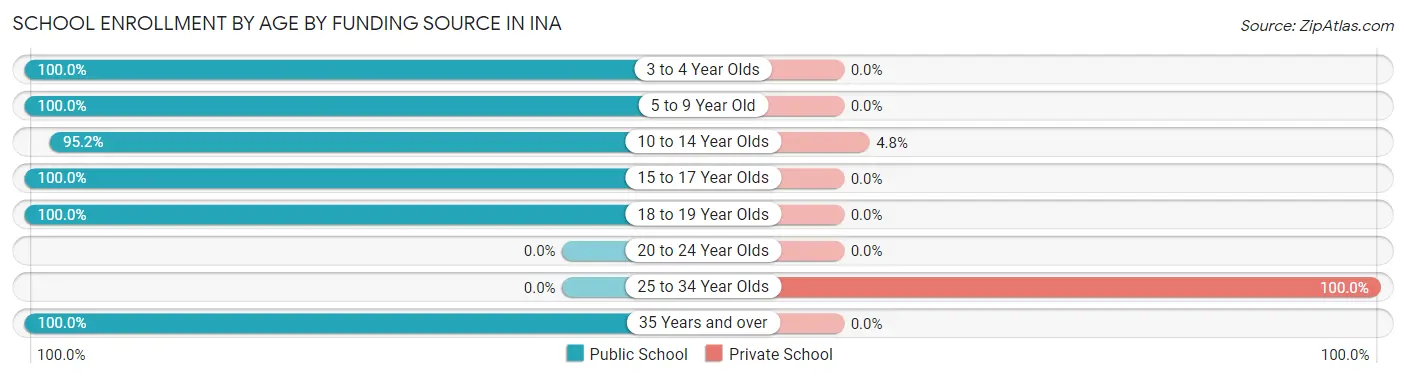
| Age Bracket | Public School | Private School |
| 3 to 4 Year Olds | 2 (100.0%) | 0 (0.0%) |
| 5 to 9 Year Old | 18 (100.0%) | 0 (0.0%) |
| 10 to 14 Year Olds | 40 (95.2%) | 2 (4.8%) |
| 15 to 17 Year Olds | 42 (100.0%) | 0 (0.0%) |
| 18 to 19 Year Olds | 19 (100.0%) | 0 (0.0%) |
| 20 to 24 Year Olds | 0 (0.0%) | 0 (0.0%) |
| 25 to 34 Year Olds | 0 (0.0%) | 6 (100.0%) |
| 35 Years and over | 11 (100.0%) | 0 (0.0%) |
| Total | 132 (94.3%) | 8 (5.7%) |
Educational Attainment by Field of Study in Ina
Education (18 | 46.2%), arts & humanities (7 | 17.9%), business (6 | 15.4%), bio, nature & agricultural (3 | 7.7%), and psychology (3 | 7.7%) are the most common fields of study among 39 individuals in Ina who have obtained a bachelor's degree or higher.
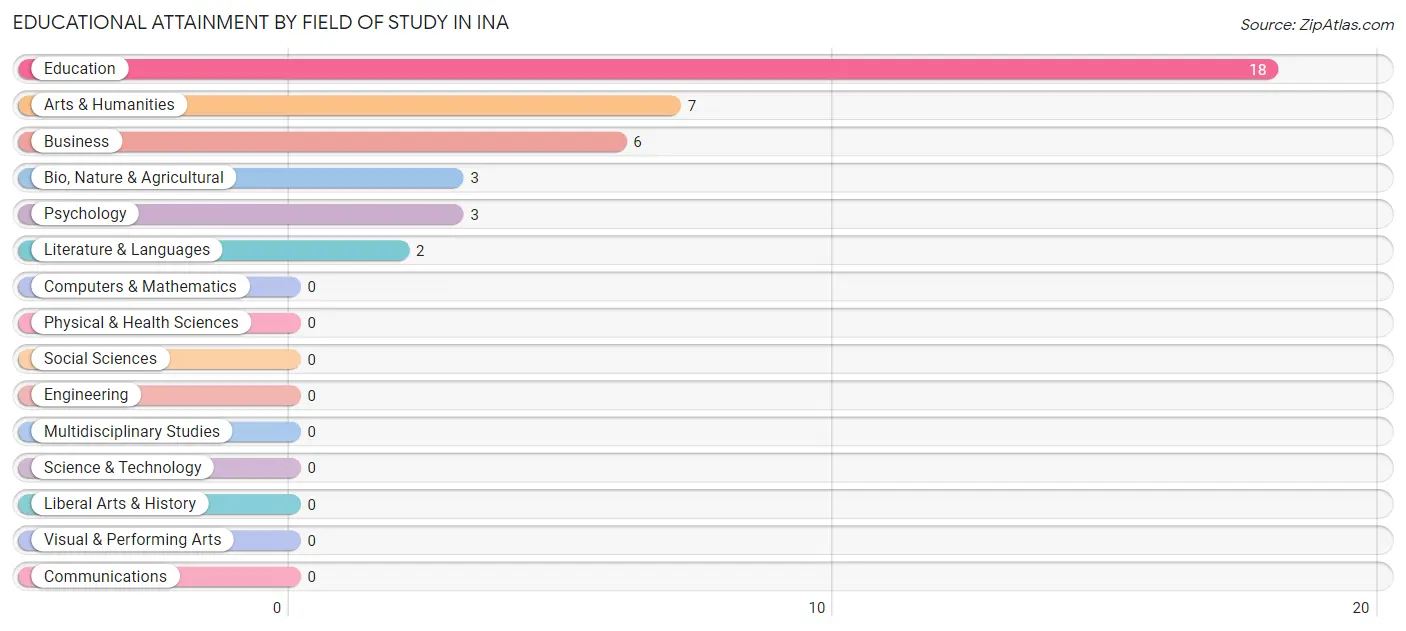
| Field of Study | # Graduates | % Graduates |
| Computers & Mathematics | 0 | 0.0% |
| Bio, Nature & Agricultural | 3 | 7.7% |
| Physical & Health Sciences | 0 | 0.0% |
| Psychology | 3 | 7.7% |
| Social Sciences | 0 | 0.0% |
| Engineering | 0 | 0.0% |
| Multidisciplinary Studies | 0 | 0.0% |
| Science & Technology | 0 | 0.0% |
| Business | 6 | 15.4% |
| Education | 18 | 46.2% |
| Literature & Languages | 2 | 5.1% |
| Liberal Arts & History | 0 | 0.0% |
| Visual & Performing Arts | 0 | 0.0% |
| Communications | 0 | 0.0% |
| Arts & Humanities | 7 | 17.9% |
| Total | 39 | 100.0% |
Transportation & Commute in Ina
Vehicle Availability by Sex in Ina
The most prevalent vehicle ownership categories in Ina are males with 2 vehicles (33, accounting for 42.9%) and females with 2 vehicles (27, making up 23.2%).
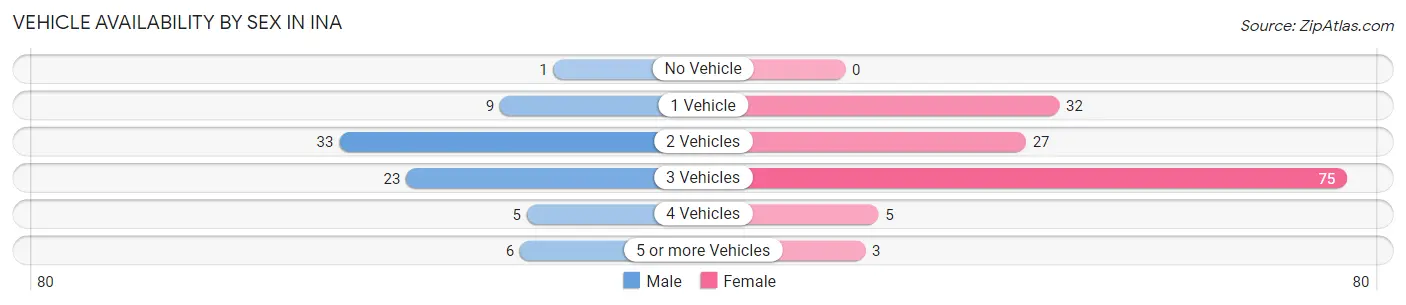
| Vehicles Available | Male | Female |
| No Vehicle | 1 (1.3%) | 0 (0.0%) |
| 1 Vehicle | 9 (11.7%) | 32 (22.5%) |
| 2 Vehicles | 33 (42.9%) | 27 (19.0%) |
| 3 Vehicles | 23 (29.9%) | 75 (52.8%) |
| 4 Vehicles | 5 (6.5%) | 5 (3.5%) |
| 5 or more Vehicles | 6 (7.8%) | 3 (2.1%) |
| Total | 77 (100.0%) | 142 (100.0%) |
Commute Time in Ina
The most frequently occuring commute durations in Ina are 15 to 19 minutes (61 commuters, 28.0%), 20 to 24 minutes (54 commuters, 24.8%), and 5 to 9 minutes (44 commuters, 20.2%).
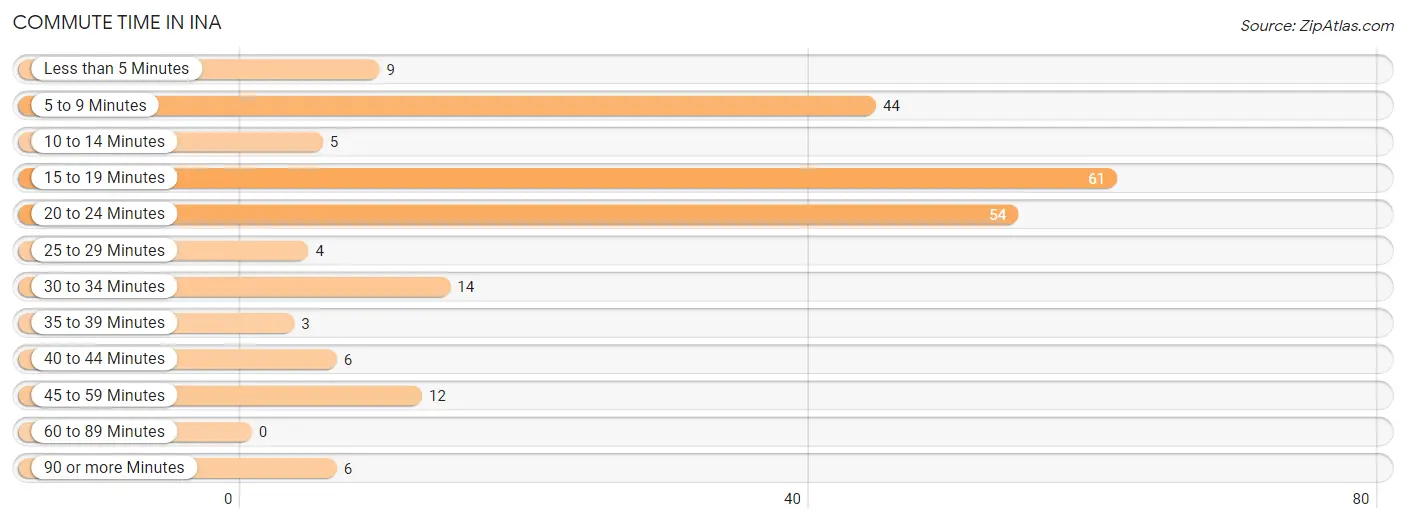
| Commute Time | # Commuters | % Commuters |
| Less than 5 Minutes | 9 | 4.1% |
| 5 to 9 Minutes | 44 | 20.2% |
| 10 to 14 Minutes | 5 | 2.3% |
| 15 to 19 Minutes | 61 | 28.0% |
| 20 to 24 Minutes | 54 | 24.8% |
| 25 to 29 Minutes | 4 | 1.8% |
| 30 to 34 Minutes | 14 | 6.4% |
| 35 to 39 Minutes | 3 | 1.4% |
| 40 to 44 Minutes | 6 | 2.8% |
| 45 to 59 Minutes | 12 | 5.5% |
| 60 to 89 Minutes | 0 | 0.0% |
| 90 or more Minutes | 6 | 2.8% |
Commute Time by Sex in Ina
The most common commute times in Ina are 20 to 24 minutes (17 commuters, 22.4%) for males and 15 to 19 minutes (46 commuters, 32.4%) for females.
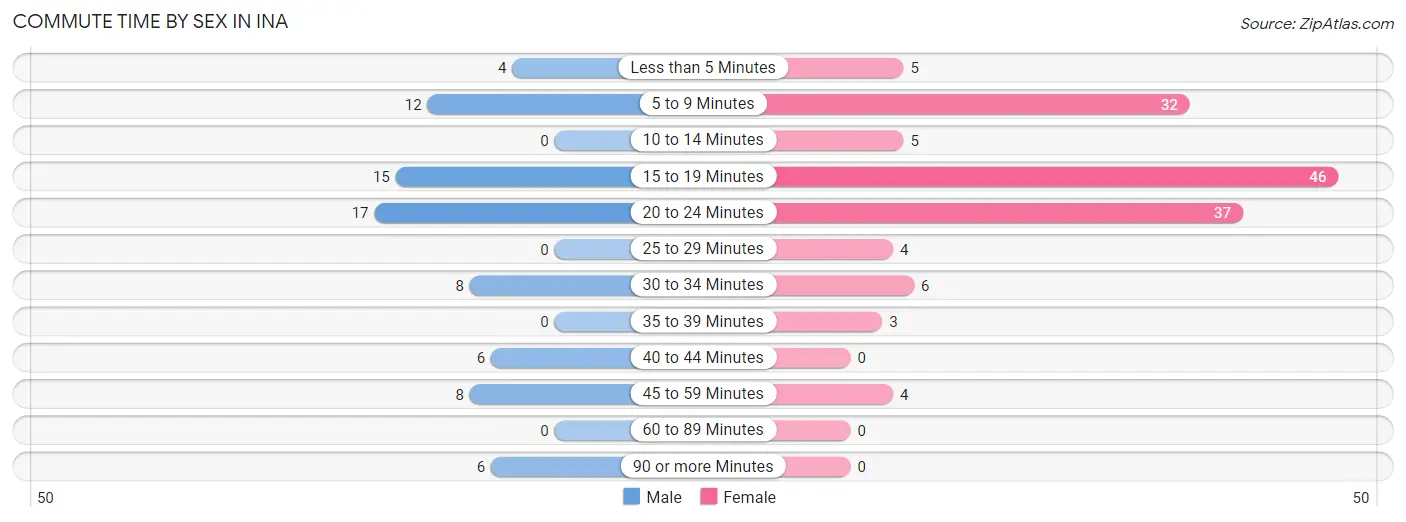
| Commute Time | Male | Female |
| Less than 5 Minutes | 4 (5.3%) | 5 (3.5%) |
| 5 to 9 Minutes | 12 (15.8%) | 32 (22.5%) |
| 10 to 14 Minutes | 0 (0.0%) | 5 (3.5%) |
| 15 to 19 Minutes | 15 (19.7%) | 46 (32.4%) |
| 20 to 24 Minutes | 17 (22.4%) | 37 (26.1%) |
| 25 to 29 Minutes | 0 (0.0%) | 4 (2.8%) |
| 30 to 34 Minutes | 8 (10.5%) | 6 (4.2%) |
| 35 to 39 Minutes | 0 (0.0%) | 3 (2.1%) |
| 40 to 44 Minutes | 6 (7.9%) | 0 (0.0%) |
| 45 to 59 Minutes | 8 (10.5%) | 4 (2.8%) |
| 60 to 89 Minutes | 0 (0.0%) | 0 (0.0%) |
| 90 or more Minutes | 6 (7.9%) | 0 (0.0%) |
Time of Departure to Work by Sex in Ina
The most frequent times of departure to work in Ina are 12:00 PM to 3:59 PM (13, 17.1%) for males and 12:00 AM to 4:59 AM (29, 20.4%) for females.
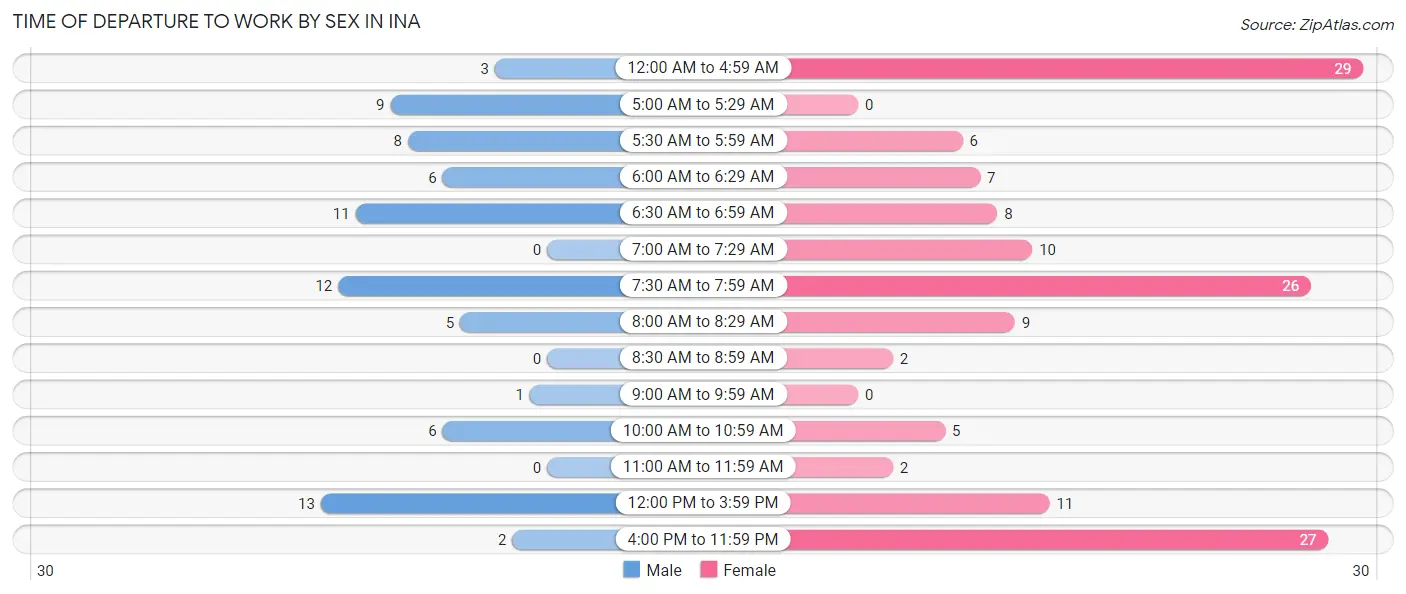
| Time of Departure | Male | Female |
| 12:00 AM to 4:59 AM | 3 (4.0%) | 29 (20.4%) |
| 5:00 AM to 5:29 AM | 9 (11.8%) | 0 (0.0%) |
| 5:30 AM to 5:59 AM | 8 (10.5%) | 6 (4.2%) |
| 6:00 AM to 6:29 AM | 6 (7.9%) | 7 (4.9%) |
| 6:30 AM to 6:59 AM | 11 (14.5%) | 8 (5.6%) |
| 7:00 AM to 7:29 AM | 0 (0.0%) | 10 (7.0%) |
| 7:30 AM to 7:59 AM | 12 (15.8%) | 26 (18.3%) |
| 8:00 AM to 8:29 AM | 5 (6.6%) | 9 (6.3%) |
| 8:30 AM to 8:59 AM | 0 (0.0%) | 2 (1.4%) |
| 9:00 AM to 9:59 AM | 1 (1.3%) | 0 (0.0%) |
| 10:00 AM to 10:59 AM | 6 (7.9%) | 5 (3.5%) |
| 11:00 AM to 11:59 AM | 0 (0.0%) | 2 (1.4%) |
| 12:00 PM to 3:59 PM | 13 (17.1%) | 11 (7.7%) |
| 4:00 PM to 11:59 PM | 2 (2.6%) | 27 (19.0%) |
| Total | 76 (100.0%) | 142 (100.0%) |
Housing Occupancy in Ina
Occupancy by Ownership in Ina
Of the total 203 dwellings in Ina, owner-occupied units account for 147 (72.4%), while renter-occupied units make up 56 (27.6%).
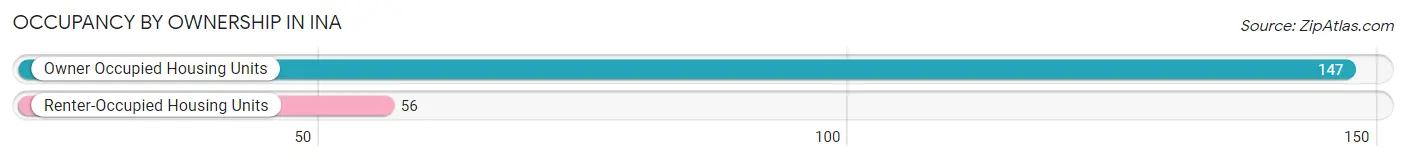
| Occupancy | # Housing Units | % Housing Units |
| Owner Occupied Housing Units | 147 | 72.4% |
| Renter-Occupied Housing Units | 56 | 27.6% |
| Total Occupied Housing Units | 203 | 100.0% |
Occupancy by Household Size in Ina
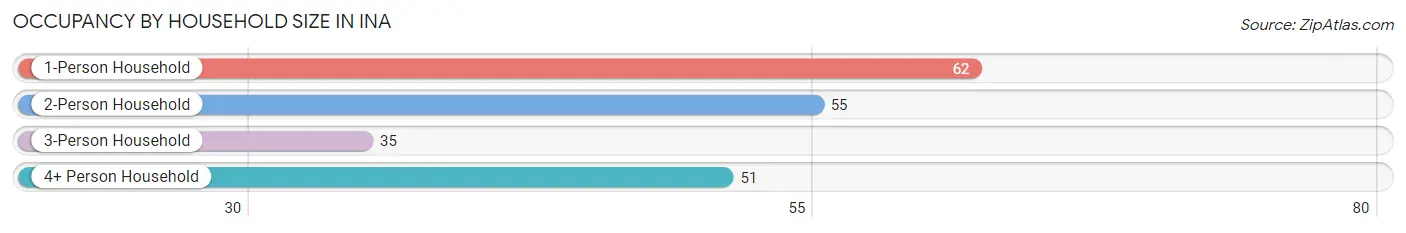
| Household Size | # Housing Units | % Housing Units |
| 1-Person Household | 62 | 30.5% |
| 2-Person Household | 55 | 27.1% |
| 3-Person Household | 35 | 17.2% |
| 4+ Person Household | 51 | 25.1% |
| Total Housing Units | 203 | 100.0% |
Occupancy by Ownership by Household Size in Ina
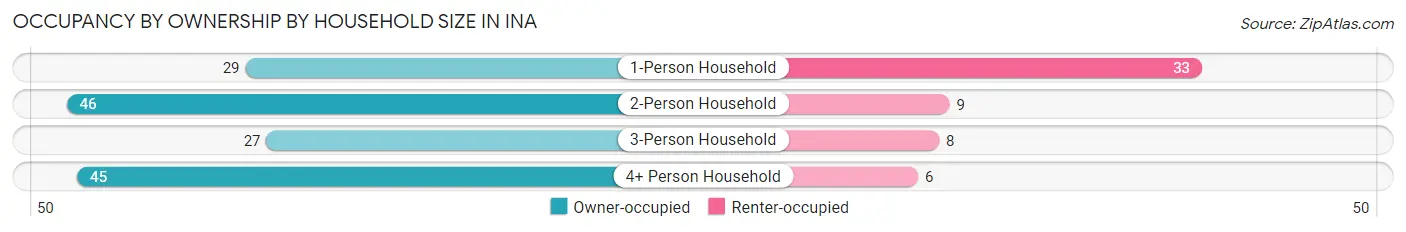
| Household Size | Owner-occupied | Renter-occupied |
| 1-Person Household | 29 (46.8%) | 33 (53.2%) |
| 2-Person Household | 46 (83.6%) | 9 (16.4%) |
| 3-Person Household | 27 (77.1%) | 8 (22.9%) |
| 4+ Person Household | 45 (88.2%) | 6 (11.8%) |
| Total Housing Units | 147 (72.4%) | 56 (27.6%) |
Occupancy by Educational Attainment in Ina
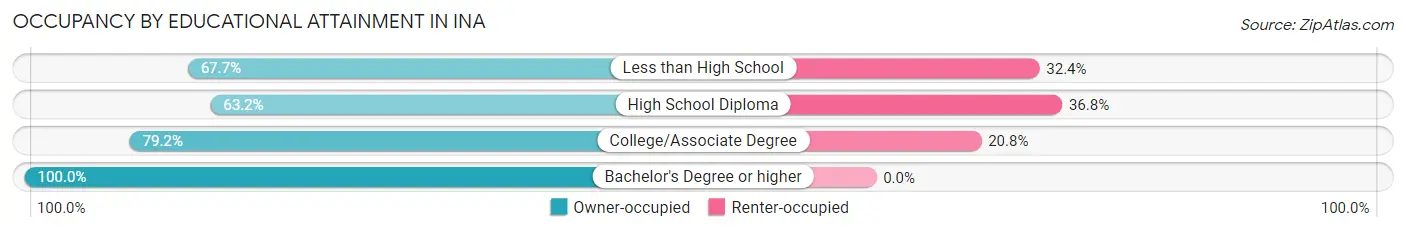
| Household Size | Owner-occupied | Renter-occupied |
| Less than High School | 23 (67.6%) | 11 (32.4%) |
| High School Diploma | 60 (63.2%) | 35 (36.8%) |
| College/Associate Degree | 38 (79.2%) | 10 (20.8%) |
| Bachelor's Degree or higher | 26 (100.0%) | 0 (0.0%) |
Occupancy by Age of Householder in Ina
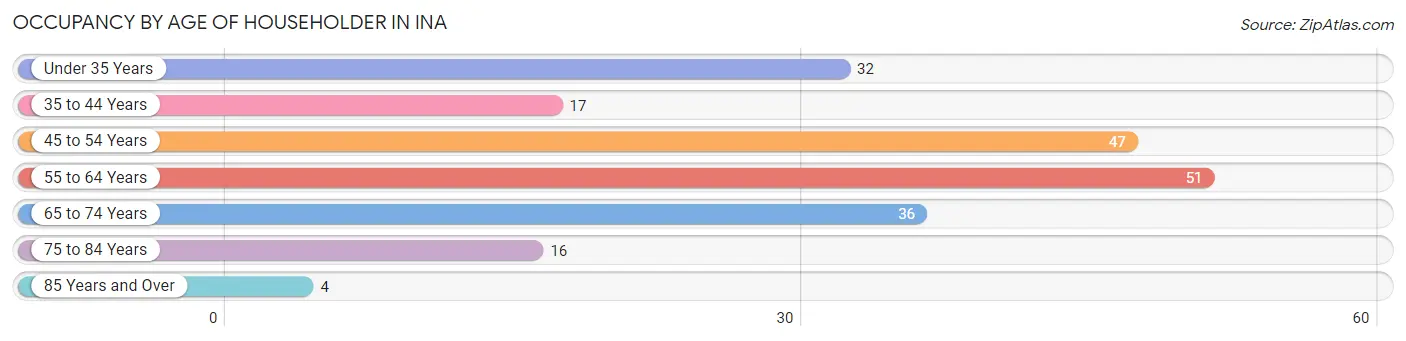
| Age Bracket | # Households | % Households |
| Under 35 Years | 32 | 15.8% |
| 35 to 44 Years | 17 | 8.4% |
| 45 to 54 Years | 47 | 23.2% |
| 55 to 64 Years | 51 | 25.1% |
| 65 to 74 Years | 36 | 17.7% |
| 75 to 84 Years | 16 | 7.9% |
| 85 Years and Over | 4 | 2.0% |
| Total | 203 | 100.0% |
Housing Finances in Ina
Median Income by Occupancy in Ina
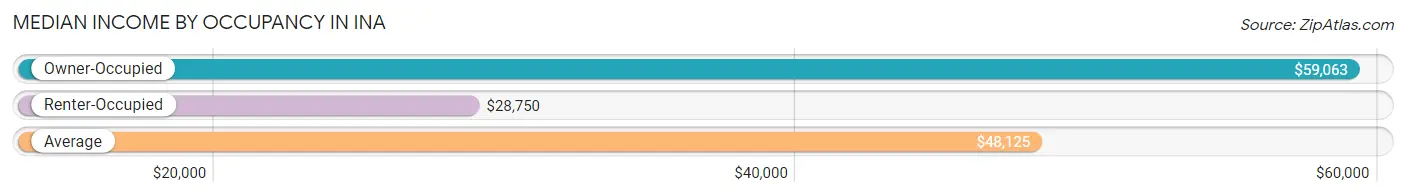
| Occupancy Type | # Households | Median Income |
| Owner-Occupied | 147 (72.4%) | $59,063 |
| Renter-Occupied | 56 (27.6%) | $28,750 |
| Average | 203 (100.0%) | $48,125 |
Occupancy by Householder Income Bracket in Ina
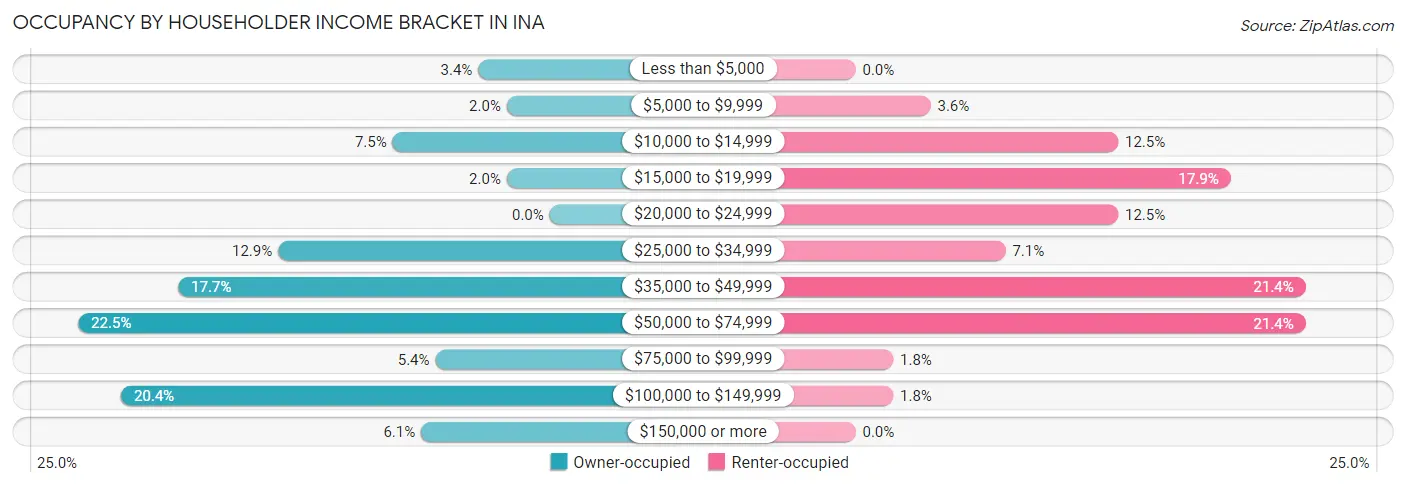
| Income Bracket | Owner-occupied | Renter-occupied |
| Less than $5,000 | 5 (3.4%) | 0 (0.0%) |
| $5,000 to $9,999 | 3 (2.0%) | 2 (3.6%) |
| $10,000 to $14,999 | 11 (7.5%) | 7 (12.5%) |
| $15,000 to $19,999 | 3 (2.0%) | 10 (17.9%) |
| $20,000 to $24,999 | 0 (0.0%) | 7 (12.5%) |
| $25,000 to $34,999 | 19 (12.9%) | 4 (7.1%) |
| $35,000 to $49,999 | 26 (17.7%) | 12 (21.4%) |
| $50,000 to $74,999 | 33 (22.5%) | 12 (21.4%) |
| $75,000 to $99,999 | 8 (5.4%) | 1 (1.8%) |
| $100,000 to $149,999 | 30 (20.4%) | 1 (1.8%) |
| $150,000 or more | 9 (6.1%) | 0 (0.0%) |
| Total | 147 (100.0%) | 56 (100.0%) |
Monthly Housing Cost Tiers in Ina
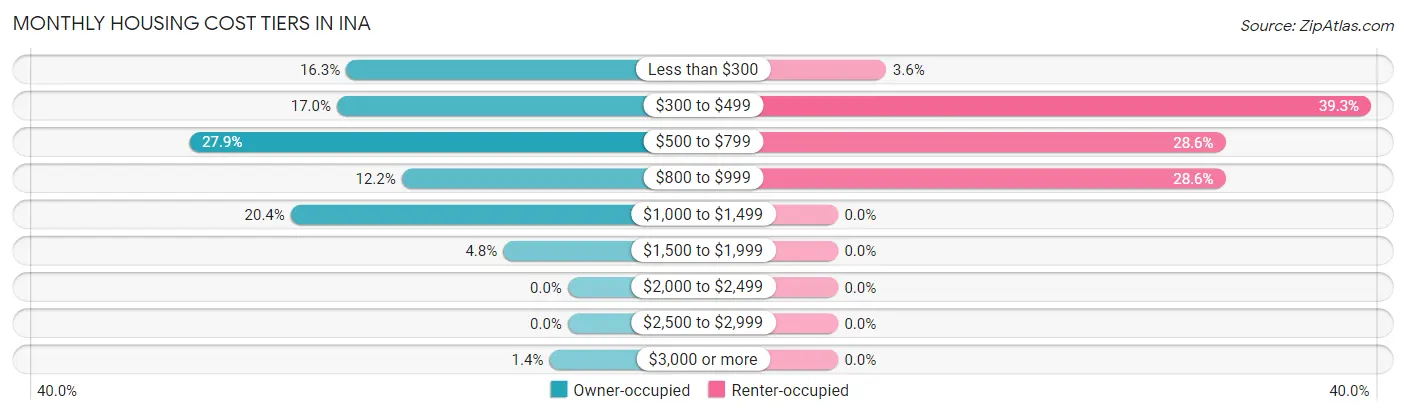
| Monthly Cost | Owner-occupied | Renter-occupied |
| Less than $300 | 24 (16.3%) | 2 (3.6%) |
| $300 to $499 | 25 (17.0%) | 22 (39.3%) |
| $500 to $799 | 41 (27.9%) | 16 (28.6%) |
| $800 to $999 | 18 (12.2%) | 16 (28.6%) |
| $1,000 to $1,499 | 30 (20.4%) | 0 (0.0%) |
| $1,500 to $1,999 | 7 (4.8%) | 0 (0.0%) |
| $2,000 to $2,499 | 0 (0.0%) | 0 (0.0%) |
| $2,500 to $2,999 | 0 (0.0%) | 0 (0.0%) |
| $3,000 or more | 2 (1.4%) | 0 (0.0%) |
| Total | 147 (100.0%) | 56 (100.0%) |
Physical Housing Characteristics in Ina
Housing Structures in Ina
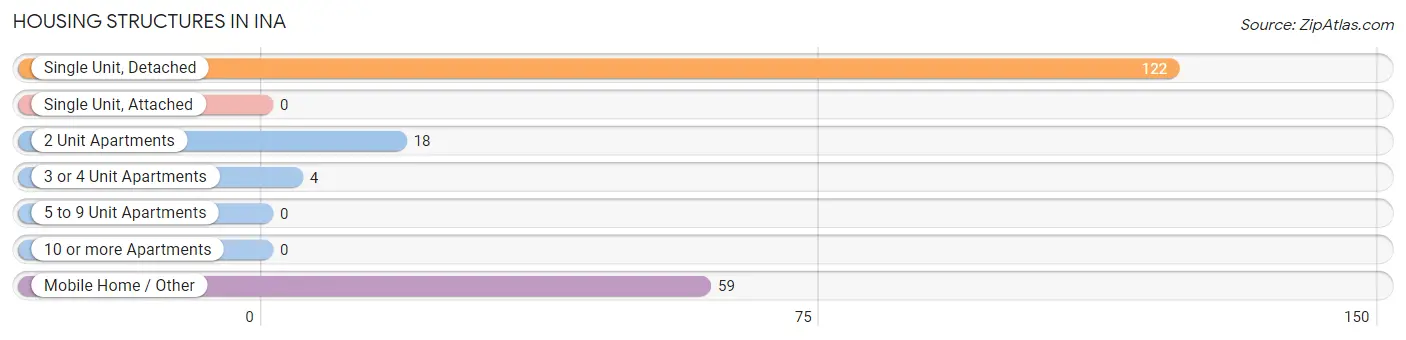
| Structure Type | # Housing Units | % Housing Units |
| Single Unit, Detached | 122 | 60.1% |
| Single Unit, Attached | 0 | 0.0% |
| 2 Unit Apartments | 18 | 8.9% |
| 3 or 4 Unit Apartments | 4 | 2.0% |
| 5 to 9 Unit Apartments | 0 | 0.0% |
| 10 or more Apartments | 0 | 0.0% |
| Mobile Home / Other | 59 | 29.1% |
| Total | 203 | 100.0% |
Housing Structures by Occupancy in Ina
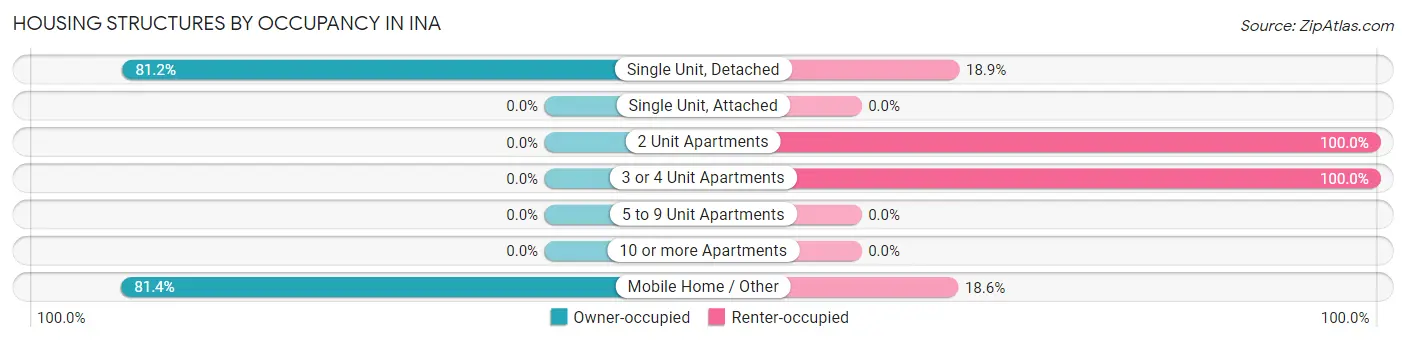
| Structure Type | Owner-occupied | Renter-occupied |
| Single Unit, Detached | 99 (81.1%) | 23 (18.9%) |
| Single Unit, Attached | 0 (0.0%) | 0 (0.0%) |
| 2 Unit Apartments | 0 (0.0%) | 18 (100.0%) |
| 3 or 4 Unit Apartments | 0 (0.0%) | 4 (100.0%) |
| 5 to 9 Unit Apartments | 0 (0.0%) | 0 (0.0%) |
| 10 or more Apartments | 0 (0.0%) | 0 (0.0%) |
| Mobile Home / Other | 48 (81.4%) | 11 (18.6%) |
| Total | 147 (72.4%) | 56 (27.6%) |
Housing Structures by Number of Rooms in Ina
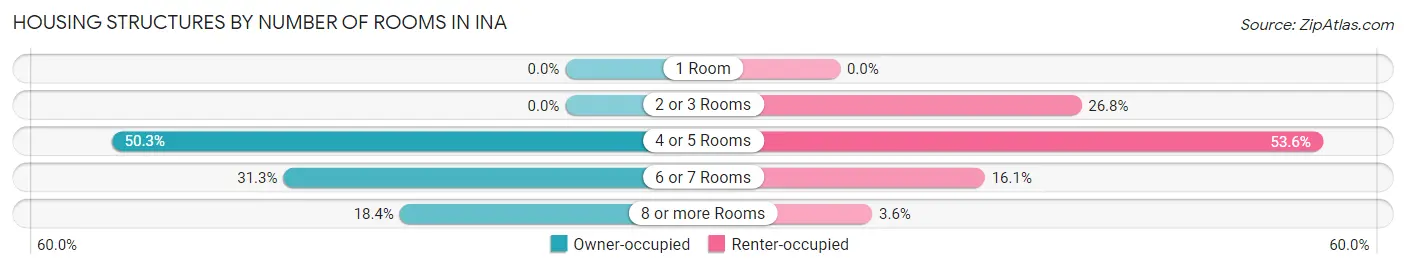
| Number of Rooms | Owner-occupied | Renter-occupied |
| 1 Room | 0 (0.0%) | 0 (0.0%) |
| 2 or 3 Rooms | 0 (0.0%) | 15 (26.8%) |
| 4 or 5 Rooms | 74 (50.3%) | 30 (53.6%) |
| 6 or 7 Rooms | 46 (31.3%) | 9 (16.1%) |
| 8 or more Rooms | 27 (18.4%) | 2 (3.6%) |
| Total | 147 (100.0%) | 56 (100.0%) |
Housing Structure by Heating Type in Ina
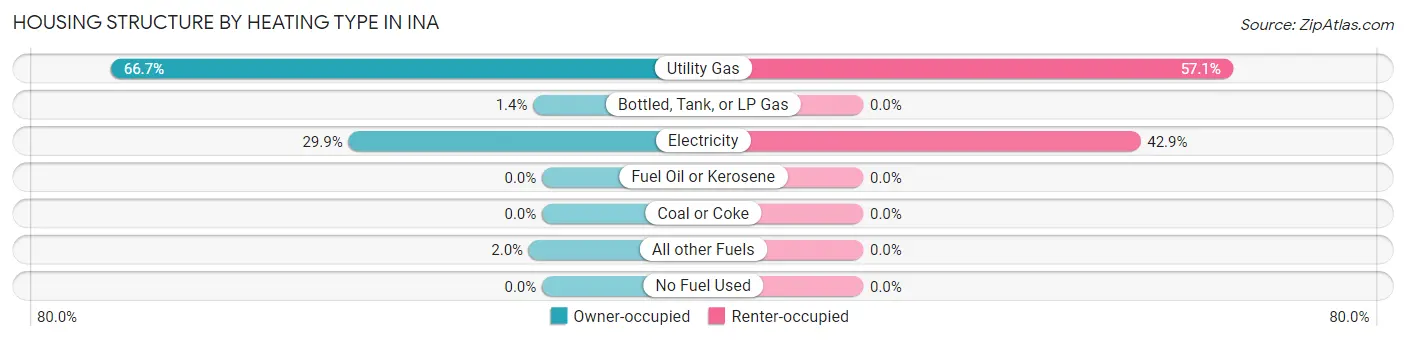
| Heating Type | Owner-occupied | Renter-occupied |
| Utility Gas | 98 (66.7%) | 32 (57.1%) |
| Bottled, Tank, or LP Gas | 2 (1.4%) | 0 (0.0%) |
| Electricity | 44 (29.9%) | 24 (42.9%) |
| Fuel Oil or Kerosene | 0 (0.0%) | 0 (0.0%) |
| Coal or Coke | 0 (0.0%) | 0 (0.0%) |
| All other Fuels | 3 (2.0%) | 0 (0.0%) |
| No Fuel Used | 0 (0.0%) | 0 (0.0%) |
| Total | 147 (100.0%) | 56 (100.0%) |
Household Vehicle Usage in Ina
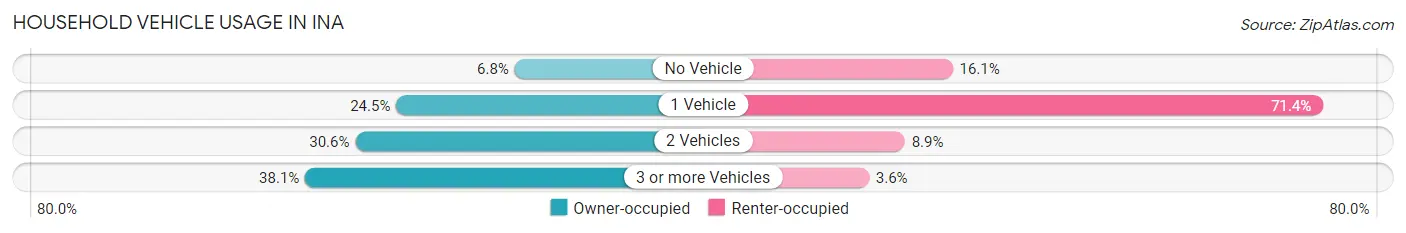
| Vehicles per Household | Owner-occupied | Renter-occupied |
| No Vehicle | 10 (6.8%) | 9 (16.1%) |
| 1 Vehicle | 36 (24.5%) | 40 (71.4%) |
| 2 Vehicles | 45 (30.6%) | 5 (8.9%) |
| 3 or more Vehicles | 56 (38.1%) | 2 (3.6%) |
| Total | 147 (100.0%) | 56 (100.0%) |
Real Estate & Mortgages in Ina
Real Estate and Mortgage Overview in Ina
| Characteristic | Without Mortgage | With Mortgage |
| Housing Units | 57 | 90 |
| Median Property Value | $61,300 | $82,900 |
| Median Household Income | $34,205 | $9 |
| Monthly Housing Costs | $358 | $2 |
| Real Estate Taxes | $375 | $7 |
Property Value by Mortgage Status in Ina
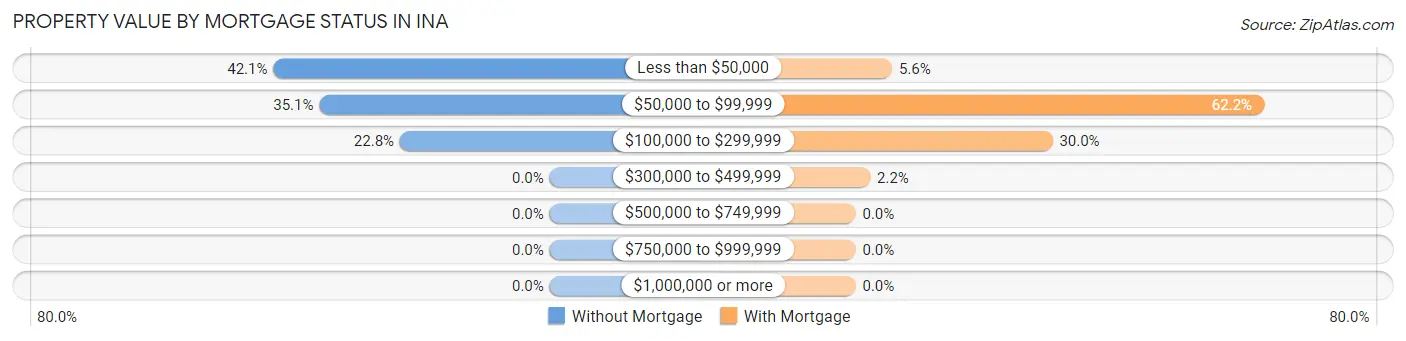
| Property Value | Without Mortgage | With Mortgage |
| Less than $50,000 | 24 (42.1%) | 5 (5.6%) |
| $50,000 to $99,999 | 20 (35.1%) | 56 (62.2%) |
| $100,000 to $299,999 | 13 (22.8%) | 27 (30.0%) |
| $300,000 to $499,999 | 0 (0.0%) | 2 (2.2%) |
| $500,000 to $749,999 | 0 (0.0%) | 0 (0.0%) |
| $750,000 to $999,999 | 0 (0.0%) | 0 (0.0%) |
| $1,000,000 or more | 0 (0.0%) | 0 (0.0%) |
| Total | 57 (100.0%) | 90 (100.0%) |
Household Income by Mortgage Status in Ina
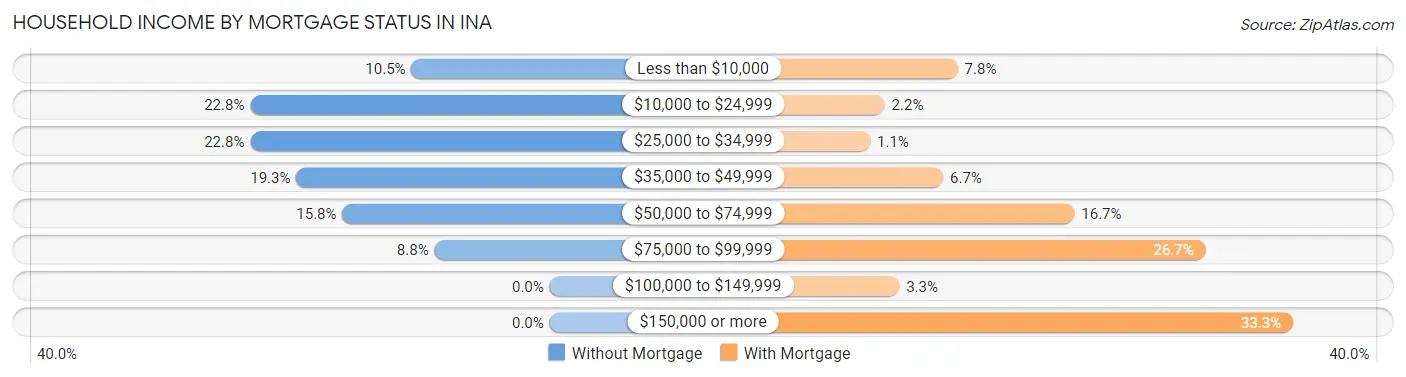
| Household Income | Without Mortgage | With Mortgage |
| Less than $10,000 | 6 (10.5%) | 7 (7.8%) |
| $10,000 to $24,999 | 13 (22.8%) | 2 (2.2%) |
| $25,000 to $34,999 | 13 (22.8%) | 1 (1.1%) |
| $35,000 to $49,999 | 11 (19.3%) | 6 (6.7%) |
| $50,000 to $74,999 | 9 (15.8%) | 15 (16.7%) |
| $75,000 to $99,999 | 5 (8.8%) | 24 (26.7%) |
| $100,000 to $149,999 | 0 (0.0%) | 3 (3.3%) |
| $150,000 or more | 0 (0.0%) | 30 (33.3%) |
| Total | 57 (100.0%) | 90 (100.0%) |
Property Value to Household Income Ratio in Ina
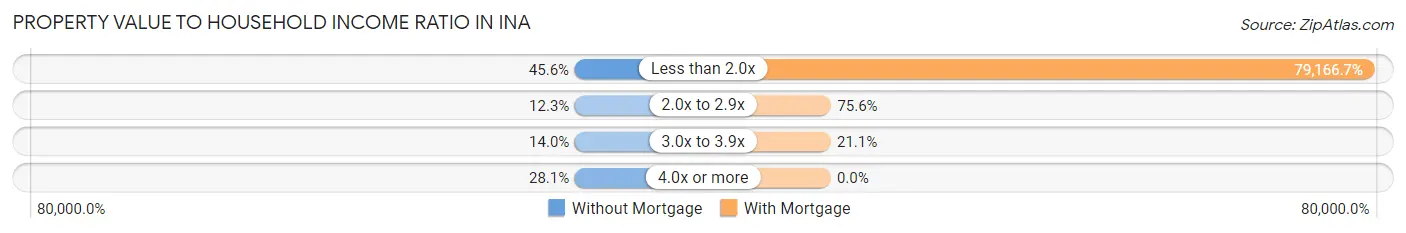
| Value-to-Income Ratio | Without Mortgage | With Mortgage |
| Less than 2.0x | 26 (45.6%) | 71,250 (79,166.7%) |
| 2.0x to 2.9x | 7 (12.3%) | 68 (75.6%) |
| 3.0x to 3.9x | 8 (14.0%) | 19 (21.1%) |
| 4.0x or more | 16 (28.1%) | 0 (0.0%) |
| Total | 57 (100.0%) | 90 (100.0%) |
Real Estate Taxes by Mortgage Status in Ina
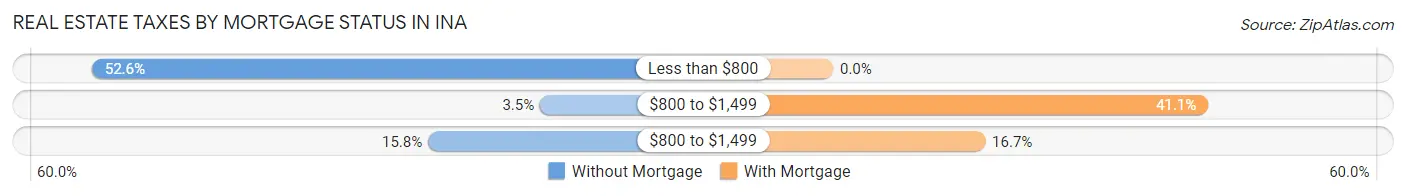
| Property Taxes | Without Mortgage | With Mortgage |
| Less than $800 | 30 (52.6%) | 0 (0.0%) |
| $800 to $1,499 | 2 (3.5%) | 37 (41.1%) |
| $800 to $1,499 | 9 (15.8%) | 15 (16.7%) |
| Total | 57 (100.0%) | 90 (100.0%) |
Health & Disability in Ina
Health Insurance Coverage by Age in Ina
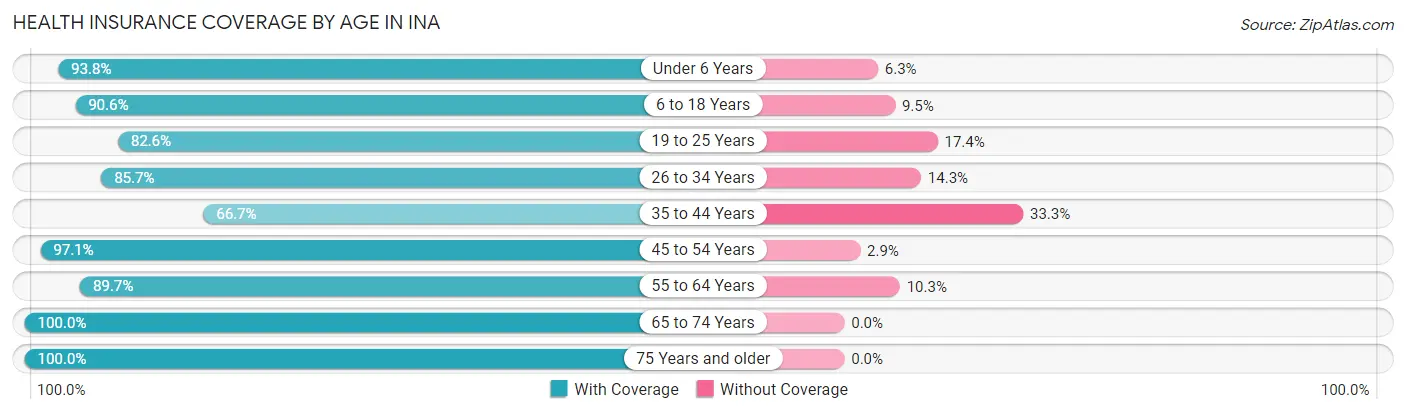
| Age Bracket | With Coverage | Without Coverage |
| Under 6 Years | 45 (93.8%) | 3 (6.2%) |
| 6 to 18 Years | 115 (90.5%) | 12 (9.5%) |
| 19 to 25 Years | 38 (82.6%) | 8 (17.4%) |
| 26 to 34 Years | 48 (85.7%) | 8 (14.3%) |
| 35 to 44 Years | 32 (66.7%) | 16 (33.3%) |
| 45 to 54 Years | 66 (97.1%) | 2 (2.9%) |
| 55 to 64 Years | 78 (89.7%) | 9 (10.3%) |
| 65 to 74 Years | 49 (100.0%) | 0 (0.0%) |
| 75 Years and older | 33 (100.0%) | 0 (0.0%) |
| Total | 504 (89.7%) | 58 (10.3%) |
Health Insurance Coverage by Citizenship Status in Ina
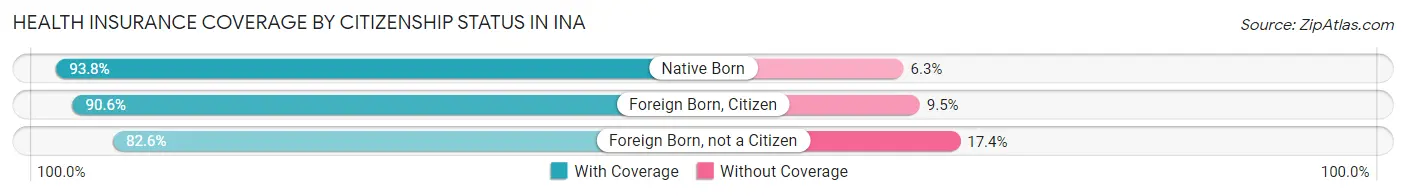
| Citizenship Status | With Coverage | Without Coverage |
| Native Born | 45 (93.8%) | 3 (6.2%) |
| Foreign Born, Citizen | 115 (90.5%) | 12 (9.5%) |
| Foreign Born, not a Citizen | 38 (82.6%) | 8 (17.4%) |
Health Insurance Coverage by Household Income in Ina
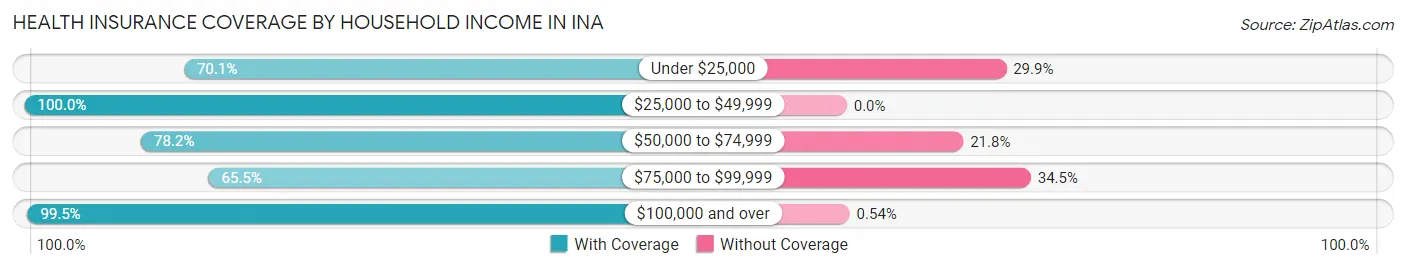
| Household Income | With Coverage | Without Coverage |
| Under $25,000 | 54 (70.1%) | 23 (29.9%) |
| $25,000 to $49,999 | 162 (100.0%) | 0 (0.0%) |
| $50,000 to $74,999 | 86 (78.2%) | 24 (21.8%) |
| $75,000 to $99,999 | 19 (65.5%) | 10 (34.5%) |
| $100,000 and over | 183 (99.5%) | 1 (0.5%) |
Public vs Private Health Insurance Coverage by Age in Ina
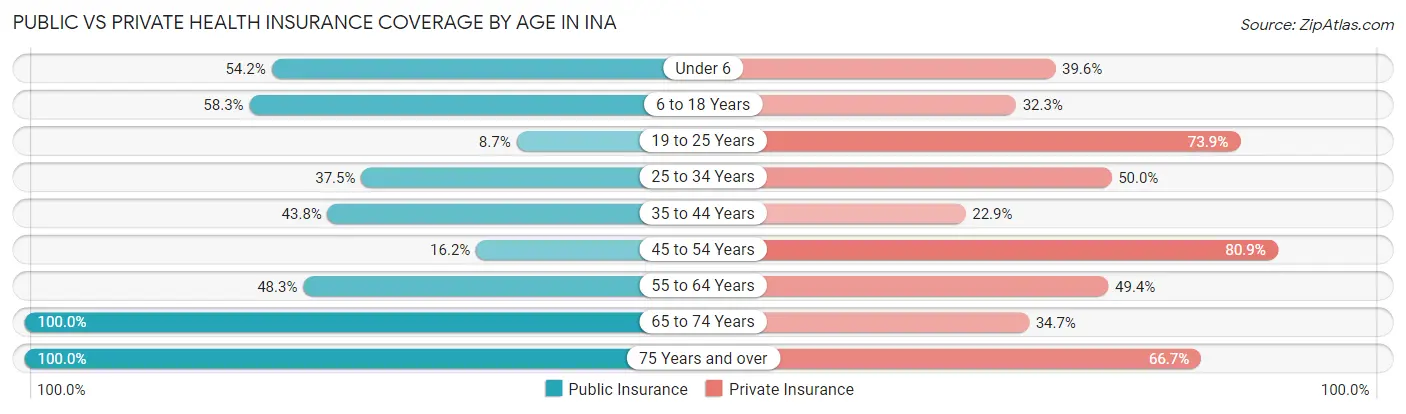
| Age Bracket | Public Insurance | Private Insurance |
| Under 6 | 26 (54.2%) | 19 (39.6%) |
| 6 to 18 Years | 74 (58.3%) | 41 (32.3%) |
| 19 to 25 Years | 4 (8.7%) | 34 (73.9%) |
| 25 to 34 Years | 21 (37.5%) | 28 (50.0%) |
| 35 to 44 Years | 21 (43.8%) | 11 (22.9%) |
| 45 to 54 Years | 11 (16.2%) | 55 (80.9%) |
| 55 to 64 Years | 42 (48.3%) | 43 (49.4%) |
| 65 to 74 Years | 49 (100.0%) | 17 (34.7%) |
| 75 Years and over | 33 (100.0%) | 22 (66.7%) |
| Total | 281 (50.0%) | 270 (48.0%) |
Disability Status by Sex by Age in Ina
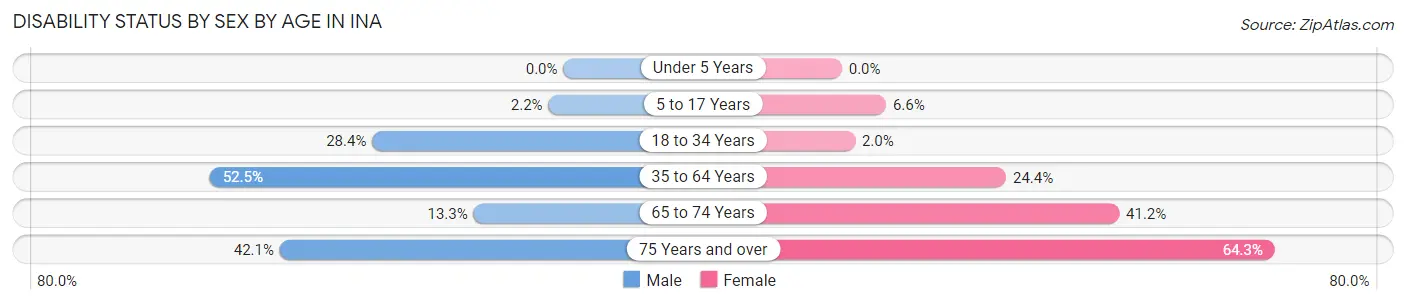
| Age Bracket | Male | Female |
| Under 5 Years | 0 (0.0%) | 0 (0.0%) |
| 5 to 17 Years | 1 (2.2%) | 4 (6.6%) |
| 18 to 34 Years | 21 (28.4%) | 1 (2.0%) |
| 35 to 64 Years | 42 (52.5%) | 30 (24.4%) |
| 65 to 74 Years | 2 (13.3%) | 14 (41.2%) |
| 75 Years and over | 8 (42.1%) | 9 (64.3%) |
Disability Class by Sex by Age in Ina
Disability Class: Hearing Difficulty
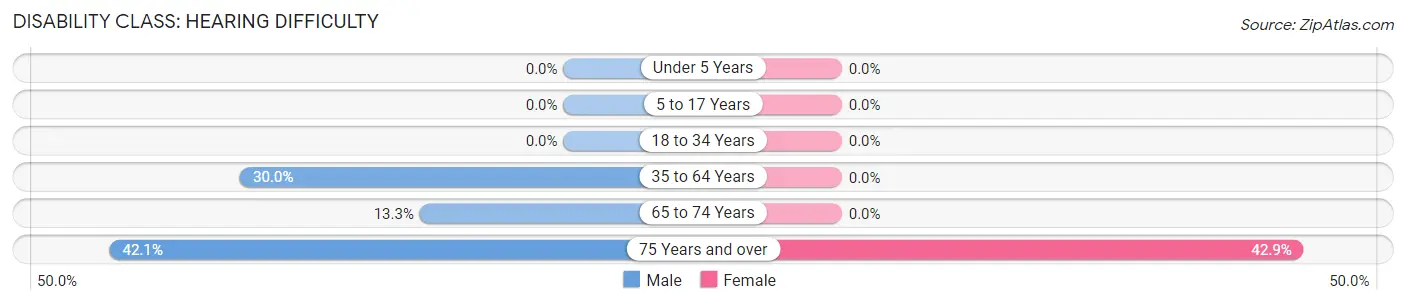
| Age Bracket | Male | Female |
| Under 5 Years | 0 (0.0%) | 0 (0.0%) |
| 5 to 17 Years | 0 (0.0%) | 0 (0.0%) |
| 18 to 34 Years | 0 (0.0%) | 0 (0.0%) |
| 35 to 64 Years | 24 (30.0%) | 0 (0.0%) |
| 65 to 74 Years | 2 (13.3%) | 0 (0.0%) |
| 75 Years and over | 8 (42.1%) | 6 (42.9%) |
Disability Class: Vision Difficulty
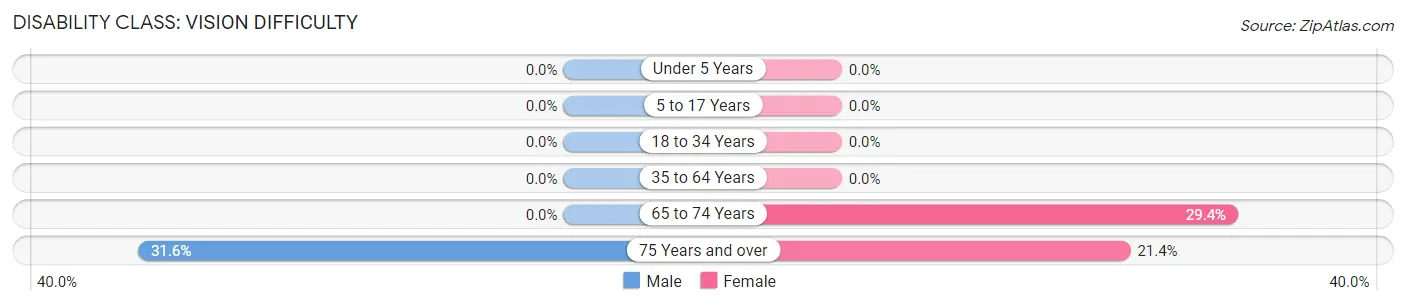
| Age Bracket | Male | Female |
| Under 5 Years | 0 (0.0%) | 0 (0.0%) |
| 5 to 17 Years | 0 (0.0%) | 0 (0.0%) |
| 18 to 34 Years | 0 (0.0%) | 0 (0.0%) |
| 35 to 64 Years | 0 (0.0%) | 0 (0.0%) |
| 65 to 74 Years | 0 (0.0%) | 10 (29.4%) |
| 75 Years and over | 6 (31.6%) | 3 (21.4%) |
Disability Class: Cognitive Difficulty
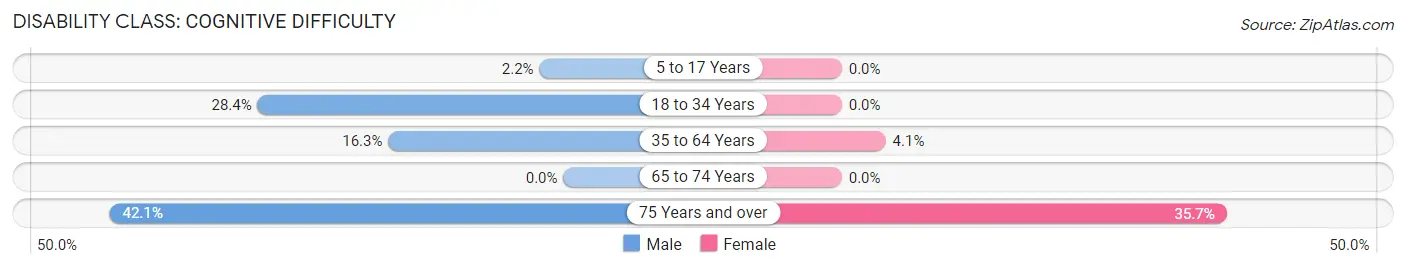
| Age Bracket | Male | Female |
| 5 to 17 Years | 1 (2.2%) | 0 (0.0%) |
| 18 to 34 Years | 21 (28.4%) | 0 (0.0%) |
| 35 to 64 Years | 13 (16.3%) | 5 (4.1%) |
| 65 to 74 Years | 0 (0.0%) | 0 (0.0%) |
| 75 Years and over | 8 (42.1%) | 5 (35.7%) |
Disability Class: Ambulatory Difficulty
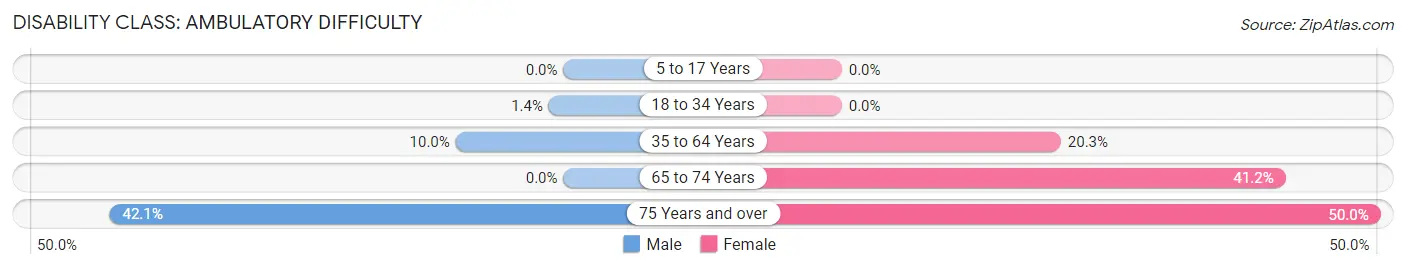
| Age Bracket | Male | Female |
| 5 to 17 Years | 0 (0.0%) | 0 (0.0%) |
| 18 to 34 Years | 1 (1.3%) | 0 (0.0%) |
| 35 to 64 Years | 8 (10.0%) | 25 (20.3%) |
| 65 to 74 Years | 0 (0.0%) | 14 (41.2%) |
| 75 Years and over | 8 (42.1%) | 7 (50.0%) |
Disability Class: Self-Care Difficulty
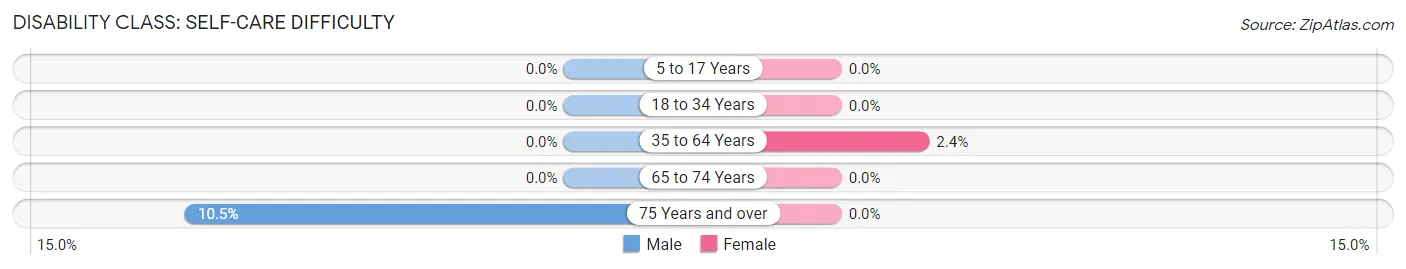
| Age Bracket | Male | Female |
| 5 to 17 Years | 0 (0.0%) | 0 (0.0%) |
| 18 to 34 Years | 0 (0.0%) | 0 (0.0%) |
| 35 to 64 Years | 0 (0.0%) | 3 (2.4%) |
| 65 to 74 Years | 0 (0.0%) | 0 (0.0%) |
| 75 Years and over | 2 (10.5%) | 0 (0.0%) |
Technology Access in Ina
Computing Device Access in Ina
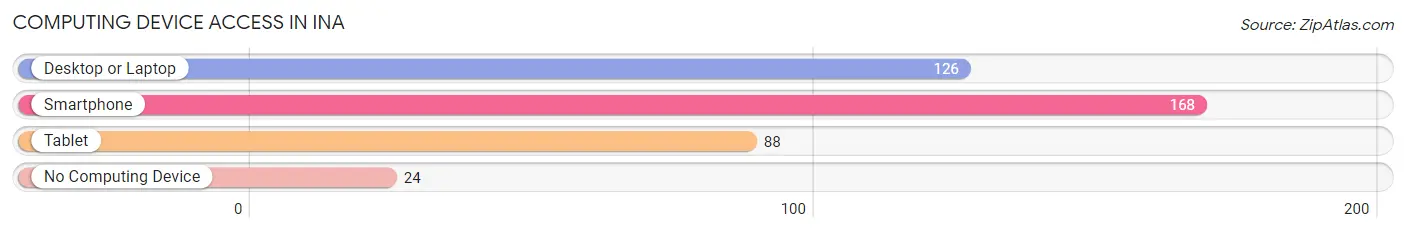
| Device Type | # Households | % Households |
| Desktop or Laptop | 126 | 62.1% |
| Smartphone | 168 | 82.8% |
| Tablet | 88 | 43.3% |
| No Computing Device | 24 | 11.8% |
| Total | 203 | 100.0% |
Internet Access in Ina
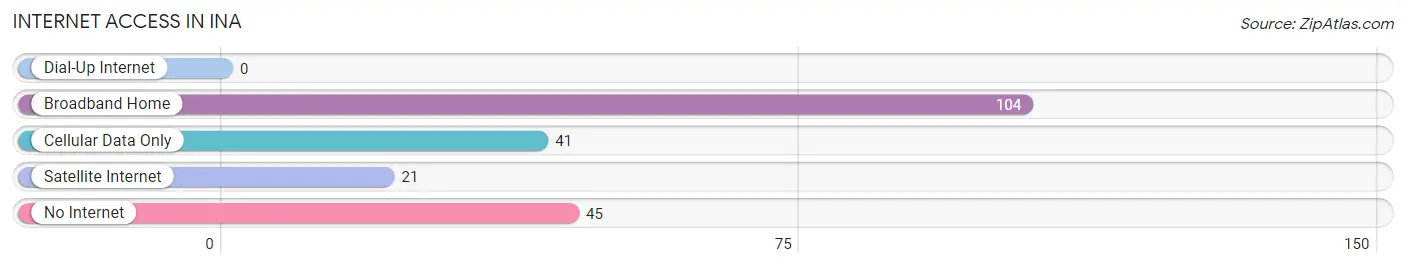
| Internet Type | # Households | % Households |
| Dial-Up Internet | 0 | 0.0% |
| Broadband Home | 104 | 51.2% |
| Cellular Data Only | 41 | 20.2% |
| Satellite Internet | 21 | 10.3% |
| No Internet | 45 | 22.2% |
| Total | 203 | 100.0% |
Ina Summary
Ina, Illinois is a small village located in Jefferson County, Illinois. It is situated on the banks of the Kaskaskia River, about 25 miles east of St. Louis, Missouri. The village has a population of 1,717 people, according to the 2010 census.
History
Ina was founded in 1819 by a group of settlers from Kentucky. The village was named after the daughter of one of the settlers, Ina B. Smith. The village was incorporated in 1872.
Ina was a thriving agricultural community in the late 19th and early 20th centuries. The village was home to several grain elevators, a flour mill, a sawmill, and a brickyard. Ina was also home to a number of businesses, including a hotel, a bank, a general store, and a blacksmith shop.
In the late 20th century, Ina began to experience a decline in population and economic activity. The village was hit hard by the Great Depression and the Dust Bowl. Many of the businesses in the village closed, and the population dropped from 1,945 in 1930 to 1,717 in 2010.
Geography
Ina is located in the southeastern corner of Jefferson County, Illinois. The village is situated on the banks of the Kaskaskia River, about 25 miles east of St. Louis, Missouri. The village is surrounded by rolling hills and farmland.
The climate in Ina is humid continental, with hot, humid summers and cold, snowy winters. The average annual temperature is 54°F, and the average annual precipitation is 40 inches.
Economy
Ina’s economy is largely based on agriculture. The village is home to several grain elevators, a flour mill, and a sawmill. The village also has a number of small businesses, including a hotel, a bank, a general store, and a blacksmith shop.
Ina is also home to a number of manufacturing companies, including a plastics factory, a metal fabrication plant, and a printing company. The village is also home to a number of retail stores, including a grocery store, a hardware store, and a pharmacy.
Demographics
Ina has a population of 1,717 people, according to the 2010 census. The population is predominantly white (94.3%), with small percentages of African American (2.2%), Hispanic (1.7%), and Asian (1.2%) residents.
The median household income in Ina is $41,250, and the median home value is $90,000. The village has a poverty rate of 16.3%, and the unemployment rate is 5.2%.
Ina is served by the Ina Community Unit School District, which includes an elementary school, a middle school, and a high school. The village is also home to a public library and a number of churches.
Common Questions
What is Per Capita Income in Ina?
Per Capita income in Ina is $7,228.
What is the Median Family Income in Ina?
Median Family Income in Ina is $62,188.
What is the Median Household income in Ina?
Median Household Income in Ina is $48,125.
What is Income or Wage Gap in Ina?
Income or Wage Gap in Ina is 56.5%.
Women in Ina earn 43.5 cents for every dollar earned by a man.
What is Inequality or Gini Index in Ina?
Inequality or Gini Index in Ina is 0.43.
What is the Total Population of Ina?
Total Population of Ina is 1,754.
What is the Total Male Population of Ina?
Total Male Population of Ina is 1,437.
What is the Total Female Population of Ina?
Total Female Population of Ina is 317.
What is the Ratio of Males per 100 Females in Ina?
There are 453.31 Males per 100 Females in Ina.
What is the Ratio of Females per 100 Males in Ina?
There are 22.06 Females per 100 Males in Ina.
What is the Median Population Age in Ina?
Median Population Age in Ina is 42.3 Years.
What is the Average Family Size in Ina
Average Family Size in Ina is 3.6 People.
What is the Average Household Size in Ina
Average Household Size in Ina is 2.8 People.
How Large is the Labor Force in Ina?
There are 250 People in the Labor Forcein in Ina.
What is the Percentage of People in the Labor Force in Ina?
15.2% of People are in the Labor Force in Ina.
What is the Unemployment Rate in Ina?
Unemployment Rate in Ina is 11.6%.