Hardin, IL Map & Demographics
Hardin Map
Hardin Overview
$31,370
PER CAPITA INCOME
$84,028
AVG FAMILY INCOME
$83,472
AVG HOUSEHOLD INCOME
45.6%
WAGE / INCOME GAP [ % ]
54.4¢/ $1
WAGE / INCOME GAP [ $ ]
0.38
INEQUALITY / GINI INDEX
774
TOTAL POPULATION
418
MALE POPULATION
356
FEMALE POPULATION
117.42
MALES / 100 FEMALES
85.17
FEMALES / 100 MALES
54.4
MEDIAN AGE
3.6
AVG FAMILY SIZE
3.4
AVG HOUSEHOLD SIZE
296
LABOR FORCE [ PEOPLE ]
43.4%
PERCENT IN LABOR FORCE
0.7%
UNEMPLOYMENT RATE
Hardin Zip Codes
Hardin Area Codes
Income in Hardin
Income Overview in Hardin
Per Capita Income in Hardin is $31,370, while median incomes of families and households are $84,028 and $83,472 respectively.
| Characteristic | Number | Measure |
| Per Capita Income | 774 | $31,370 |
| Median Family Income | 161 | $84,028 |
| Mean Family Income | 161 | $97,411 |
| Median Household Income | 205 | $83,472 |
| Mean Household Income | 205 | $91,788 |
| Income Deficit | 161 | $0 |
| Wage / Income Gap (%) | 774 | 45.55% |
| Wage / Income Gap ($) | 774 | 54.45¢ per $1 |
| Gini / Inequality Index | 774 | 0.38 |
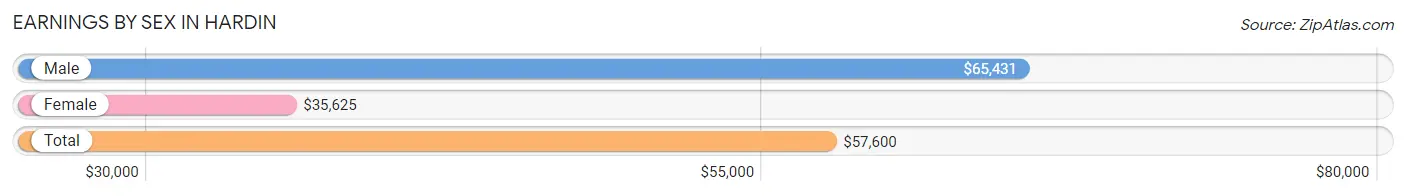
Earnings by Sex in Hardin
Average Earnings in Hardin are $57,600, $65,431 for men and $35,625 for women, a difference of 45.6%.
| Sex | Number | Average Earnings |
| Male | 194 (56.1%) | $65,431 |
| Female | 152 (43.9%) | $35,625 |
| Total | 346 (100.0%) | $57,600 |
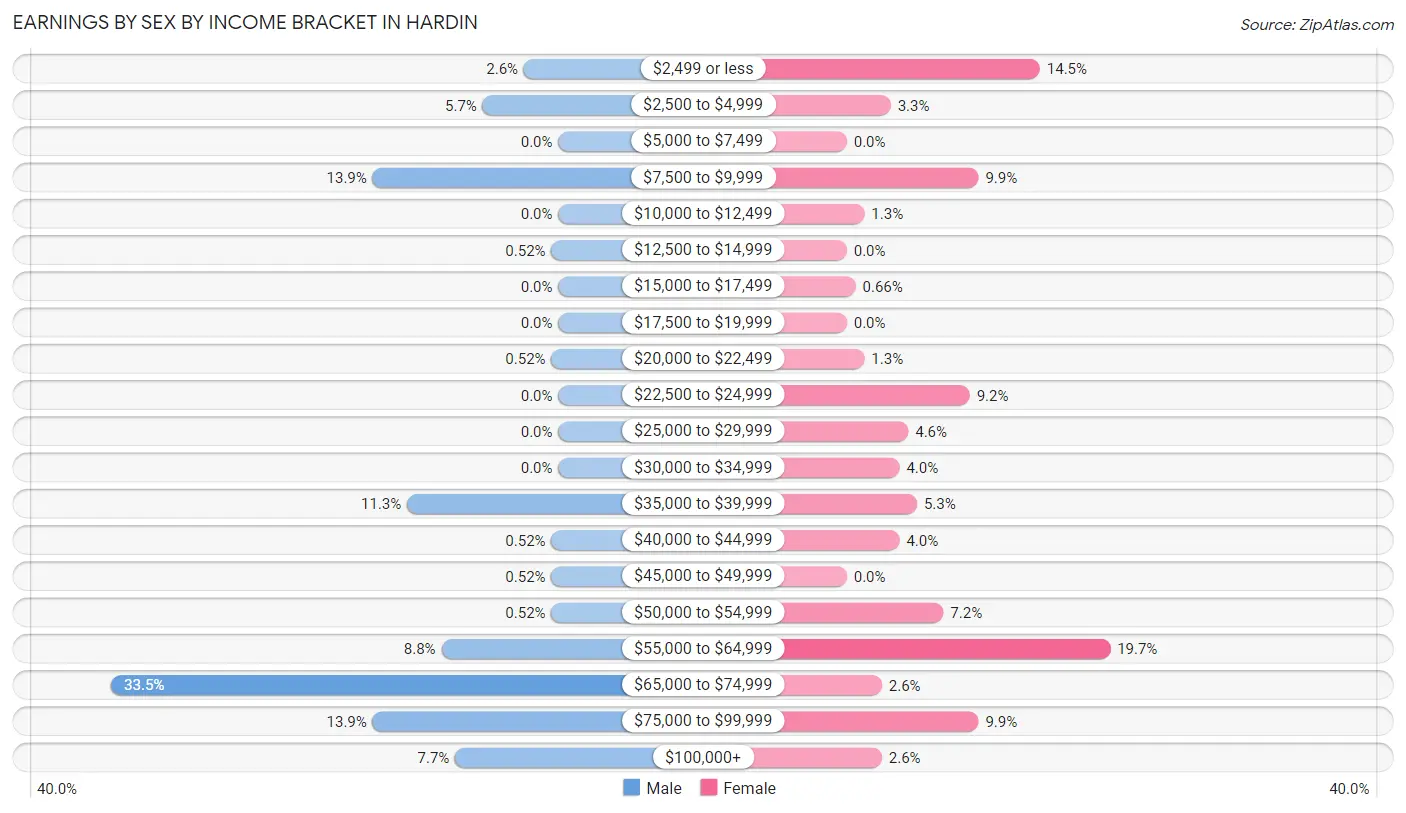
Earnings by Sex by Income Bracket in Hardin
The most common earnings brackets in Hardin are $65,000 to $74,999 for men (65 | 33.5%) and $55,000 to $64,999 for women (30 | 19.7%).
| Income | Male | Female |
| $2,499 or less | 5 (2.6%) | 22 (14.5%) |
| $2,500 to $4,999 | 11 (5.7%) | 5 (3.3%) |
| $5,000 to $7,499 | 0 (0.0%) | 0 (0.0%) |
| $7,500 to $9,999 | 27 (13.9%) | 15 (9.9%) |
| $10,000 to $12,499 | 0 (0.0%) | 2 (1.3%) |
| $12,500 to $14,999 | 1 (0.5%) | 0 (0.0%) |
| $15,000 to $17,499 | 0 (0.0%) | 1 (0.7%) |
| $17,500 to $19,999 | 0 (0.0%) | 0 (0.0%) |
| $20,000 to $22,499 | 1 (0.5%) | 2 (1.3%) |
| $22,500 to $24,999 | 0 (0.0%) | 14 (9.2%) |
| $25,000 to $29,999 | 0 (0.0%) | 7 (4.6%) |
| $30,000 to $34,999 | 0 (0.0%) | 6 (4.0%) |
| $35,000 to $39,999 | 22 (11.3%) | 8 (5.3%) |
| $40,000 to $44,999 | 1 (0.5%) | 6 (4.0%) |
| $45,000 to $49,999 | 1 (0.5%) | 0 (0.0%) |
| $50,000 to $54,999 | 1 (0.5%) | 11 (7.2%) |
| $55,000 to $64,999 | 17 (8.8%) | 30 (19.7%) |
| $65,000 to $74,999 | 65 (33.5%) | 4 (2.6%) |
| $75,000 to $99,999 | 27 (13.9%) | 15 (9.9%) |
| $100,000+ | 15 (7.7%) | 4 (2.6%) |
| Total | 194 (100.0%) | 152 (100.0%) |
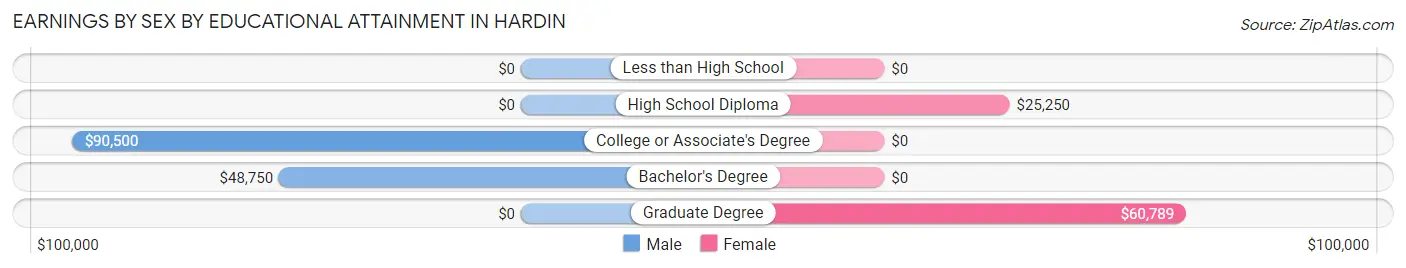
Earnings by Sex by Educational Attainment in Hardin
Average earnings in Hardin are $65,797 for men and $53,182 for women, a difference of 19.2%. Men with an educational attainment of college or associate's degree enjoy the highest average annual earnings of $90,500, while those with bachelor's degree education earn the least with $48,750. Women with an educational attainment of graduate degree earn the most with the average annual earnings of $60,789, while those with high school diploma education have the smallest earnings of $25,250.
| Educational Attainment | Male Income | Female Income |
| Less than High School | - | - |
| High School Diploma | - | - |
| College or Associate's Degree | $90,500 | $0 |
| Bachelor's Degree | $48,750 | $0 |
| Graduate Degree | - | - |
| Total | $65,797 | $53,182 |
Family Income in Hardin
Family Income Brackets in Hardin
According to the Hardin family income data, there are 48 families falling into the $75,000 to $99,999 income range, which is the most common income bracket and makes up 29.8% of all families.
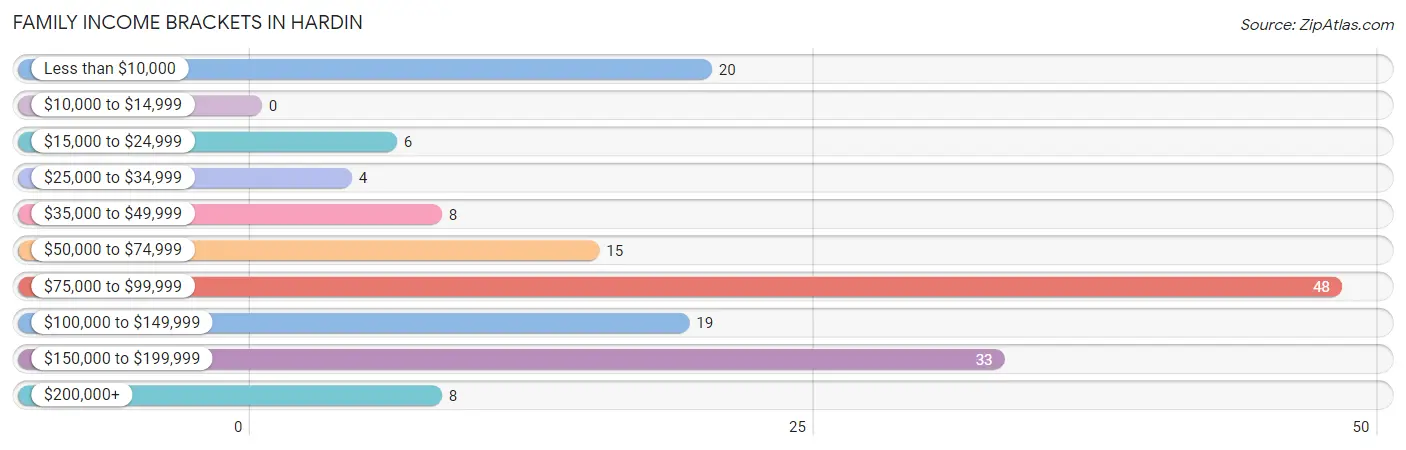
| Income Bracket | # Families | % Families |
| Less than $10,000 | 20 | 12.4% |
| $10,000 to $14,999 | 0 | 0.0% |
| $15,000 to $24,999 | 6 | 3.7% |
| $25,000 to $34,999 | 4 | 2.5% |
| $35,000 to $49,999 | 8 | 5.0% |
| $50,000 to $74,999 | 15 | 9.3% |
| $75,000 to $99,999 | 48 | 29.8% |
| $100,000 to $149,999 | 19 | 11.8% |
| $150,000 to $199,999 | 33 | 20.5% |
| $200,000+ | 8 | 5.0% |
Family Income by Famaliy Size in Hardin
4-person families (27 | 16.8%) account for the highest median family income in Hardin with $166,875 per family, while 4-person families (27 | 16.8%) have the highest median income of $41,719 per family member.
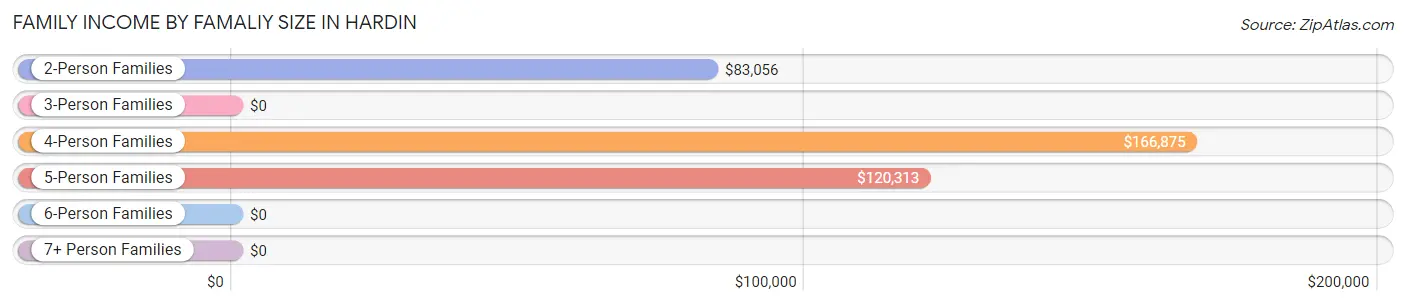
| Income Bracket | # Families | Median Income |
| 2-Person Families | 90 (55.9%) | $83,056 |
| 3-Person Families | 21 (13.0%) | $0 |
| 4-Person Families | 27 (16.8%) | $166,875 |
| 5-Person Families | 20 (12.4%) | $120,313 |
| 6-Person Families | 0 (0.0%) | $0 |
| 7+ Person Families | 3 (1.9%) | $0 |
| Total | 161 (100.0%) | $84,028 |
Family Income by Number of Earners in Hardin
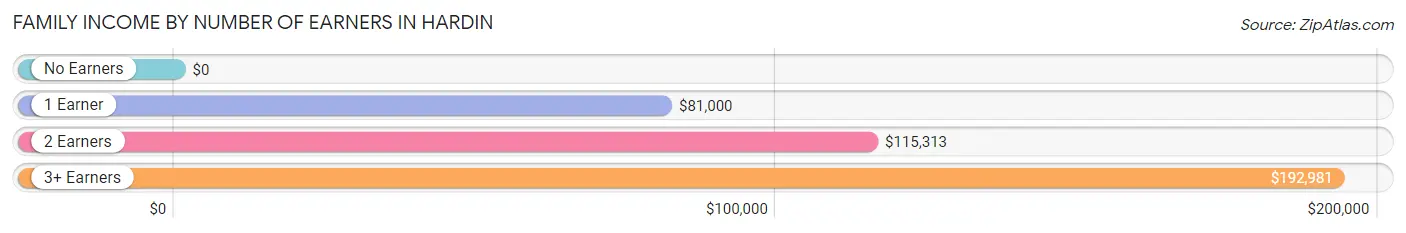
| Number of Earners | # Families | Median Income |
| No Earners | 37 (23.0%) | $0 |
| 1 Earner | 50 (31.1%) | $81,000 |
| 2 Earners | 47 (29.2%) | $115,313 |
| 3+ Earners | 27 (16.8%) | $192,981 |
| Total | 161 (100.0%) | $84,028 |
Household Income in Hardin
Household Income Brackets in Hardin
With 49 households falling in the category, the $75,000 to $99,999 income range is the most frequent in Hardin, accounting for 23.9% of all households. In contrast, only 6 households (2.9%) fall into the $25,000 to $34,999 income bracket, making it the least populous group.
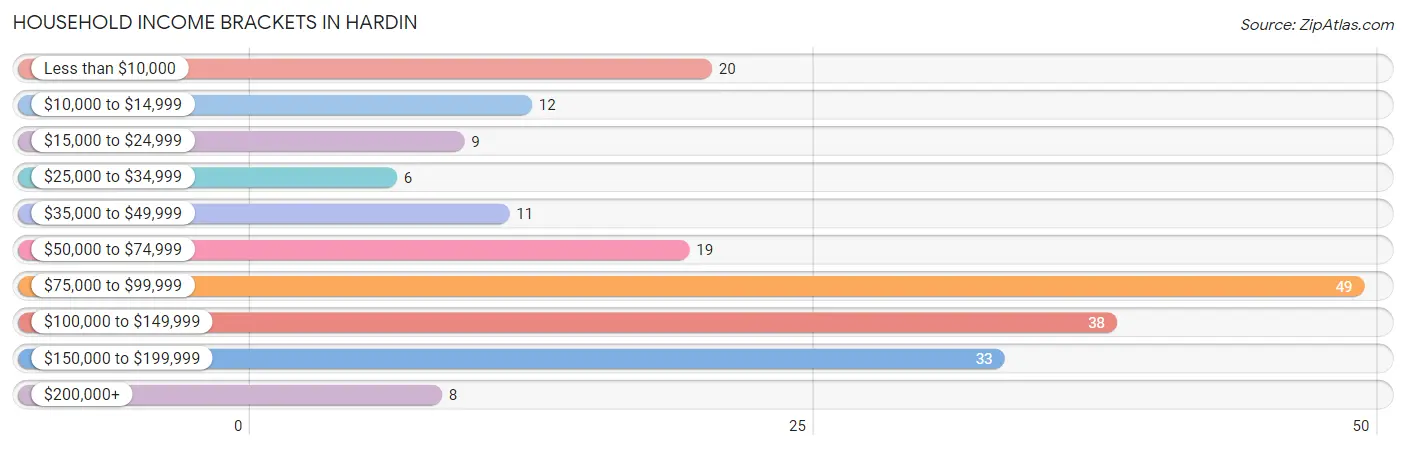
| Income Bracket | # Households | % Households |
| Less than $10,000 | 20 | 9.8% |
| $10,000 to $14,999 | 12 | 5.9% |
| $15,000 to $24,999 | 9 | 4.4% |
| $25,000 to $34,999 | 6 | 2.9% |
| $35,000 to $49,999 | 11 | 5.4% |
| $50,000 to $74,999 | 19 | 9.3% |
| $75,000 to $99,999 | 49 | 23.9% |
| $100,000 to $149,999 | 38 | 18.5% |
| $150,000 to $199,999 | 33 | 16.1% |
| $200,000+ | 8 | 3.9% |
Household Income by Householder Age in Hardin
The median household income in Hardin is $83,472, with the highest median household income of $121,875 found in the 45 to 64 years age bracket for the primary householder. A total of 96 households (46.8%) fall into this category. Meanwhile, the 15 to 24 years age bracket for the primary householder has the lowest median household income of $0, with 3 households (1.5%) in this group.
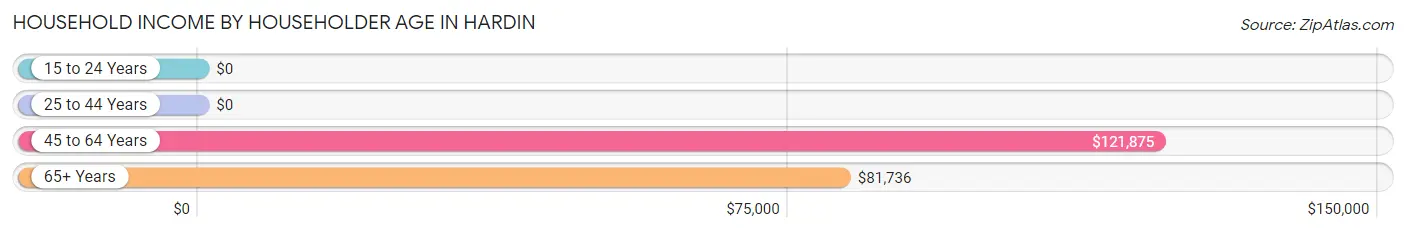
| Income Bracket | # Households | Median Income |
| 15 to 24 Years | 3 (1.5%) | $0 |
| 25 to 44 Years | 27 (13.2%) | $0 |
| 45 to 64 Years | 96 (46.8%) | $121,875 |
| 65+ Years | 79 (38.5%) | $81,736 |
| Total | 205 (100.0%) | $83,472 |
Poverty in Hardin
Income Below Poverty by Sex and Age in Hardin
With 33.4% poverty level for males and 10.6% for females among the residents of Hardin, 35 to 44 year old males and 35 to 44 year old females are the most vulnerable to poverty, with 10 males (83.3%) and 9 females (81.8%) in their respective age groups living below the poverty level.
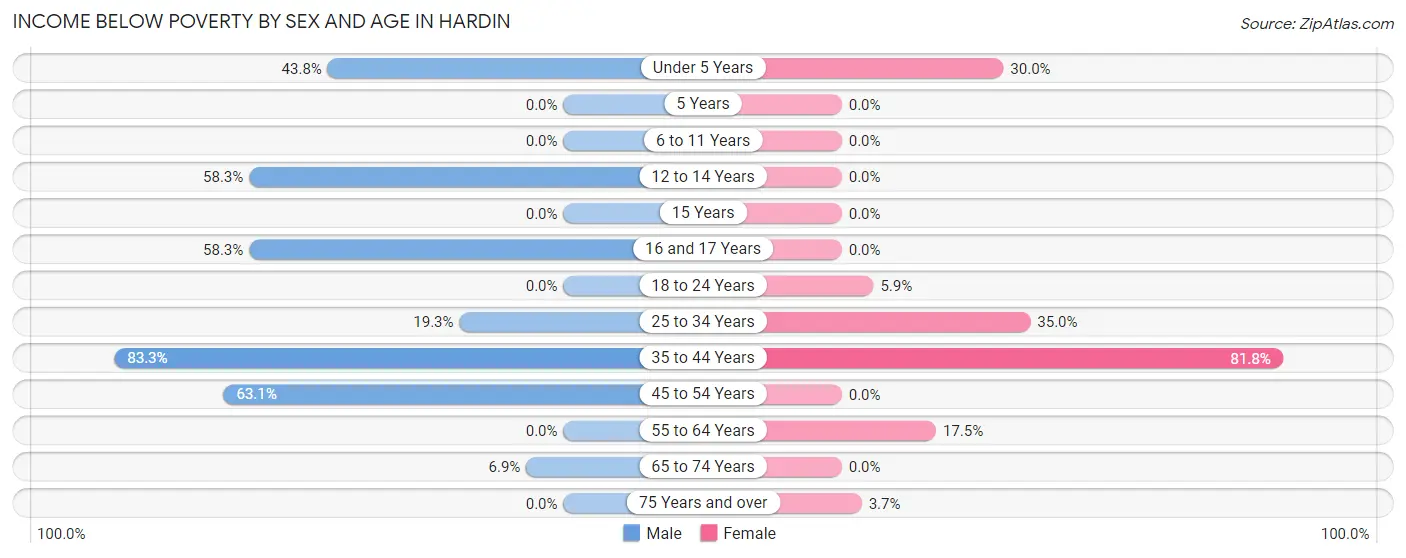
| Age Bracket | Male | Female |
| Under 5 Years | 14 (43.8%) | 6 (30.0%) |
| 5 Years | 0 (0.0%) | 0 (0.0%) |
| 6 to 11 Years | 0 (0.0%) | 0 (0.0%) |
| 12 to 14 Years | 7 (58.3%) | 0 (0.0%) |
| 15 Years | 0 (0.0%) | 0 (0.0%) |
| 16 and 17 Years | 7 (58.3%) | 0 (0.0%) |
| 18 to 24 Years | 0 (0.0%) | 1 (5.9%) |
| 25 to 34 Years | 11 (19.3%) | 7 (35.0%) |
| 35 to 44 Years | 10 (83.3%) | 9 (81.8%) |
| 45 to 54 Years | 82 (63.1%) | 0 (0.0%) |
| 55 to 64 Years | 0 (0.0%) | 7 (17.5%) |
| 65 to 74 Years | 4 (6.9%) | 0 (0.0%) |
| 75 Years and over | 0 (0.0%) | 1 (3.7%) |
| Total | 135 (33.4%) | 31 (10.6%) |
Income Above Poverty by Sex and Age in Hardin
According to the poverty statistics in Hardin, males aged 5 years and females aged 6 to 11 years are the age groups that are most secure financially, with 100.0% of males and 100.0% of females in these age groups living above the poverty line.
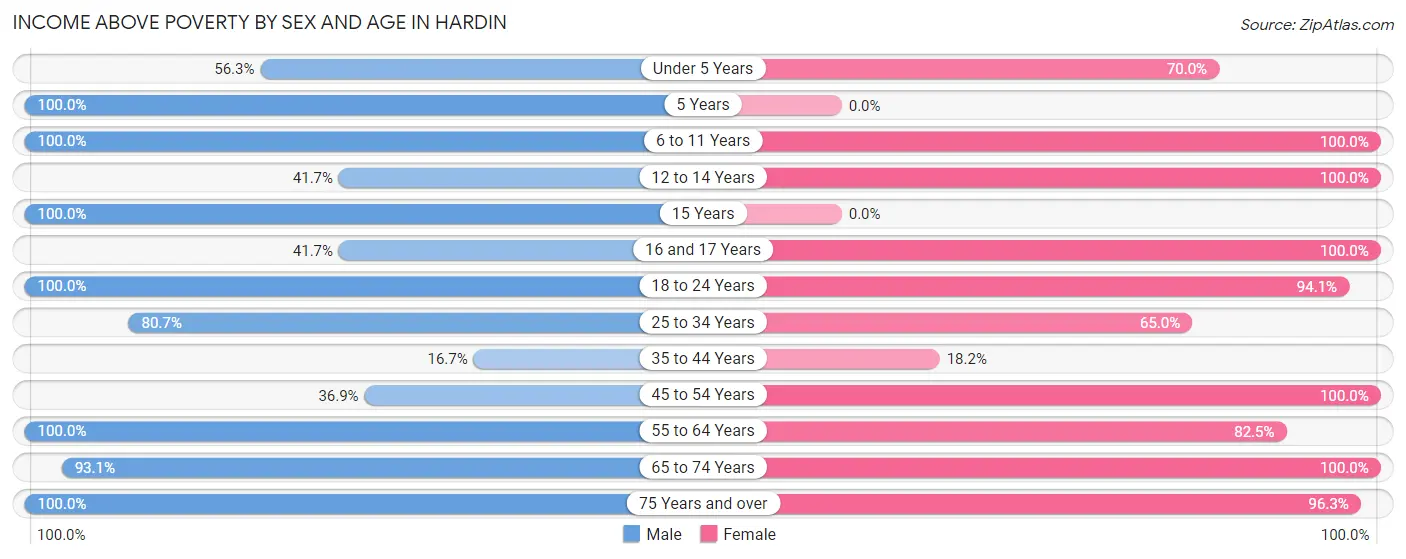
| Age Bracket | Male | Female |
| Under 5 Years | 18 (56.2%) | 14 (70.0%) |
| 5 Years | 3 (100.0%) | 0 (0.0%) |
| 6 to 11 Years | 3 (100.0%) | 15 (100.0%) |
| 12 to 14 Years | 5 (41.7%) | 6 (100.0%) |
| 15 Years | 1 (100.0%) | 0 (0.0%) |
| 16 and 17 Years | 5 (41.7%) | 18 (100.0%) |
| 18 to 24 Years | 12 (100.0%) | 16 (94.1%) |
| 25 to 34 Years | 46 (80.7%) | 13 (65.0%) |
| 35 to 44 Years | 2 (16.7%) | 2 (18.2%) |
| 45 to 54 Years | 48 (36.9%) | 52 (100.0%) |
| 55 to 64 Years | 53 (100.0%) | 33 (82.5%) |
| 65 to 74 Years | 54 (93.1%) | 67 (100.0%) |
| 75 Years and over | 19 (100.0%) | 26 (96.3%) |
| Total | 269 (66.6%) | 262 (89.4%) |
Income Below Poverty Among Married-Couple Families in Hardin
The poverty statistics for married-couple families in Hardin show that 12.6% or 19 of the total 151 families live below the poverty line. Families with 1 or 2 children have the highest poverty rate of 38.0%, comprising of 19 families. On the other hand, families with no children have the lowest poverty rate of 0.0%, which includes 0 families.
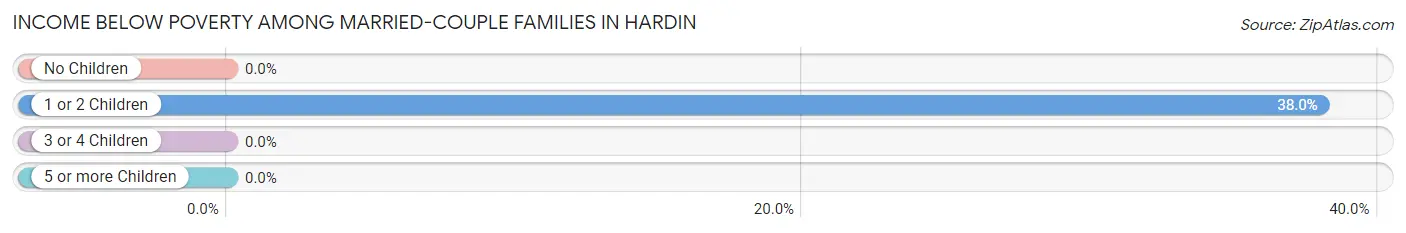
| Children | Above Poverty | Below Poverty |
| No Children | 98 (100.0%) | 0 (0.0%) |
| 1 or 2 Children | 31 (62.0%) | 19 (38.0%) |
| 3 or 4 Children | 0 (0.0%) | 0 (0.0%) |
| 5 or more Children | 3 (100.0%) | 0 (0.0%) |
| Total | 132 (87.4%) | 19 (12.6%) |
Income Below Poverty Among Single-Parent Households in Hardin
According to the poverty data in Hardin, 100.0% or 6 single-father households and 100.0% or 4 single-mother households are living below the poverty line. Among single-father households, those with no children have the highest poverty rate, with 6 households (100.0%) experiencing poverty. Likewise, among single-mother households, those with 3 or 4 children have the highest poverty rate, with 4 households (100.0%) falling below the poverty line.
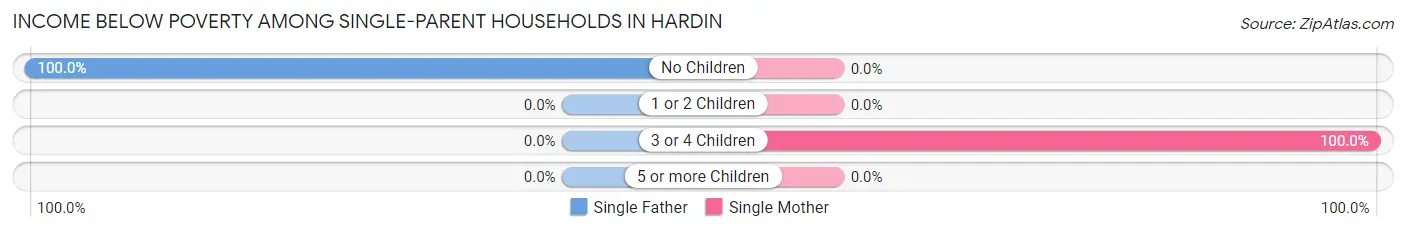
| Children | Single Father | Single Mother |
| No Children | 6 (100.0%) | 0 (0.0%) |
| 1 or 2 Children | 0 (0.0%) | 0 (0.0%) |
| 3 or 4 Children | 0 (0.0%) | 4 (100.0%) |
| 5 or more Children | 0 (0.0%) | 0 (0.0%) |
| Total | 6 (100.0%) | 4 (100.0%) |
Income Below Poverty Among Married-Couple vs Single-Parent Households in Hardin
The poverty data for Hardin shows that 19 of the married-couple family households (12.6%) and 10 of the single-parent households (100.0%) are living below the poverty level. Within the married-couple family households, those with 1 or 2 children have the highest poverty rate, with 19 households (38.0%) falling below the poverty line. Among the single-parent households, those with no children have the highest poverty rate, with 6 household (100.0%) living below poverty.
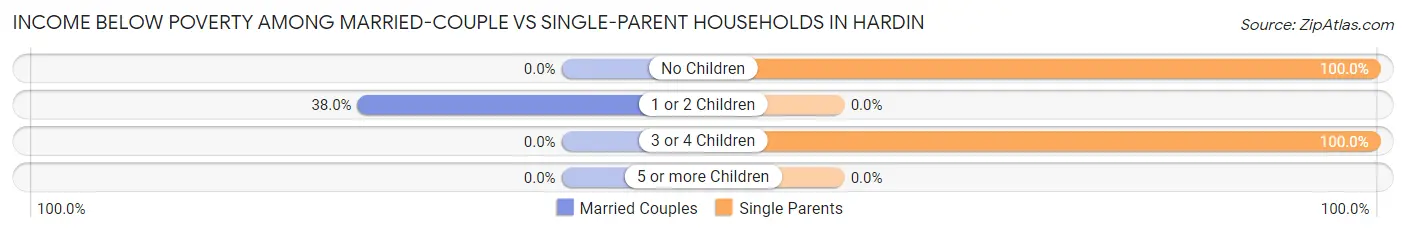
| Children | Married-Couple Families | Single-Parent Households |
| No Children | 0 (0.0%) | 6 (100.0%) |
| 1 or 2 Children | 19 (38.0%) | 0 (0.0%) |
| 3 or 4 Children | 0 (0.0%) | 4 (100.0%) |
| 5 or more Children | 0 (0.0%) | 0 (0.0%) |
| Total | 19 (12.6%) | 10 (100.0%) |
Race in Hardin
The most populous races in Hardin are White / Caucasian (760 | 98.2%), Black / African American (12 | 1.5%), and Two or more Races (2 | 0.3%).
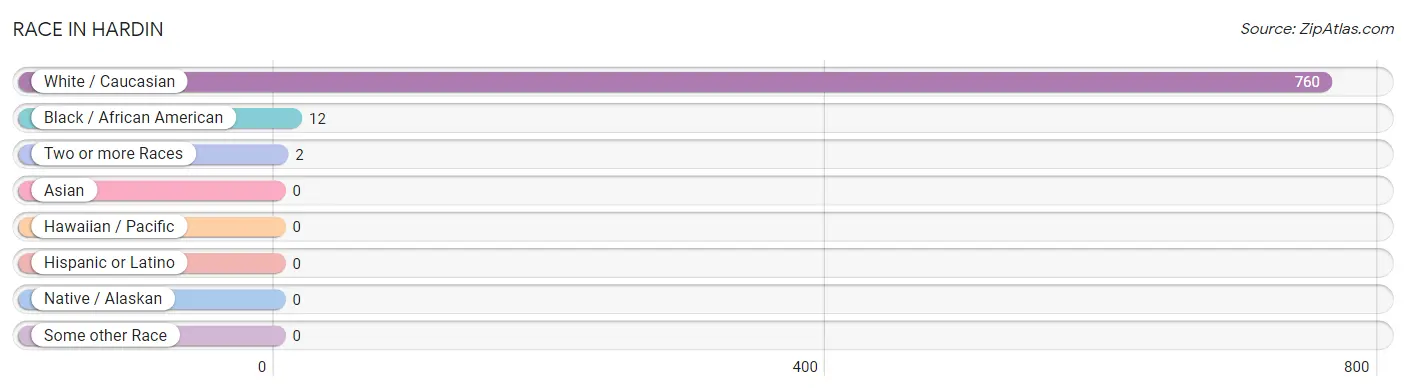
| Race | # Population | % Population |
| Asian | 0 | 0.0% |
| Black / African American | 12 | 1.5% |
| Hawaiian / Pacific | 0 | 0.0% |
| Hispanic or Latino | 0 | 0.0% |
| Native / Alaskan | 0 | 0.0% |
| White / Caucasian | 760 | 98.2% |
| Two or more Races | 2 | 0.3% |
| Some other Race | 0 | 0.0% |
| Total | 774 | 100.0% |
Ancestry in Hardin
The most populous ancestries reported in Hardin are German (425 | 54.9%), Irish (57 | 7.4%), Italian (29 | 3.7%), Hungarian (16 | 2.1%), and English (12 | 1.5%), together accounting for 69.6% of all Hardin residents.
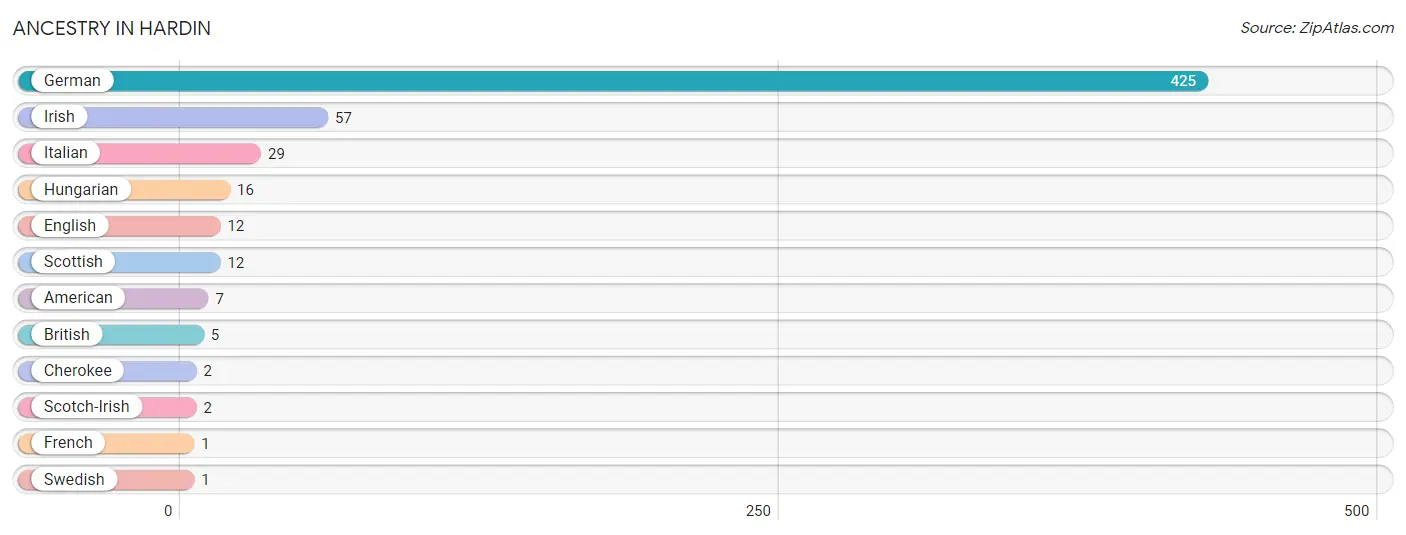
| Ancestry | # Population | % Population |
| American | 7 | 0.9% |
| British | 5 | 0.6% |
| Cherokee | 2 | 0.3% |
| English | 12 | 1.5% |
| French | 1 | 0.1% |
| German | 425 | 54.9% |
| Hungarian | 16 | 2.1% |
| Irish | 57 | 7.4% |
| Italian | 29 | 3.7% |
| Scotch-Irish | 2 | 0.3% |
| Scottish | 12 | 1.5% |
| Swedish | 1 | 0.1% | View All 12 Rows |
Immigrants in Hardin
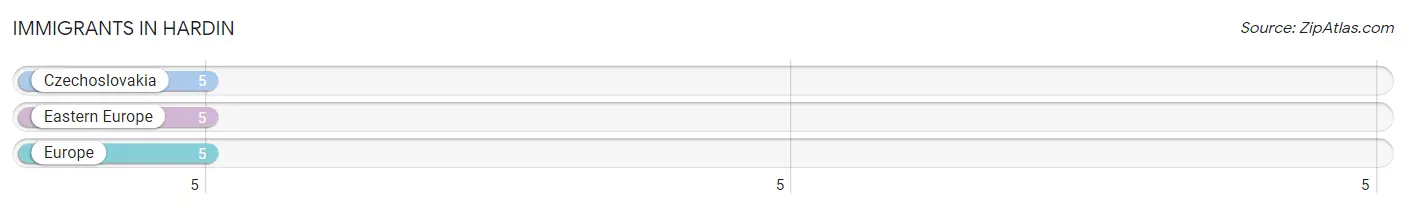
The most numerous immigrant groups reported in Hardin came from Czechoslovakia (5 | 0.6%), Eastern Europe (5 | 0.6%), and Europe (5 | 0.6%), together accounting for 1.9% of all Hardin residents.
| Immigration Origin | # Population | % Population |
| Czechoslovakia | 5 | 0.6% |
| Eastern Europe | 5 | 0.6% |
| Europe | 5 | 0.6% | View All 3 Rows |
Sex and Age in Hardin
Sex and Age in Hardin
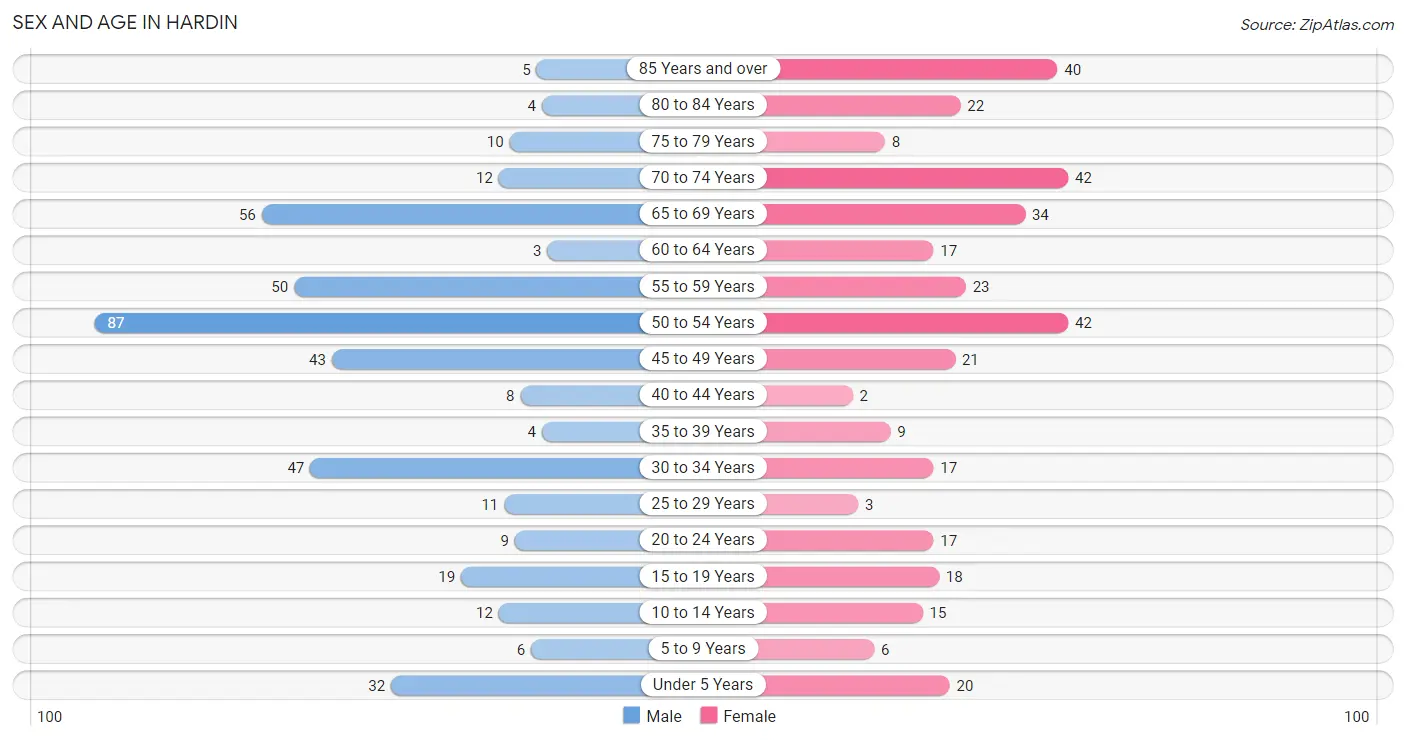
The most populous age groups in Hardin are 50 to 54 Years (87 | 20.8%) for men and 50 to 54 Years (42 | 11.8%) for women.
| Age Bracket | Male | Female |
| Under 5 Years | 32 (7.7%) | 20 (5.6%) |
| 5 to 9 Years | 6 (1.4%) | 6 (1.7%) |
| 10 to 14 Years | 12 (2.9%) | 15 (4.2%) |
| 15 to 19 Years | 19 (4.5%) | 18 (5.1%) |
| 20 to 24 Years | 9 (2.1%) | 17 (4.8%) |
| 25 to 29 Years | 11 (2.6%) | 3 (0.8%) |
| 30 to 34 Years | 47 (11.2%) | 17 (4.8%) |
| 35 to 39 Years | 4 (1.0%) | 9 (2.5%) |
| 40 to 44 Years | 8 (1.9%) | 2 (0.6%) |
| 45 to 49 Years | 43 (10.3%) | 21 (5.9%) |
| 50 to 54 Years | 87 (20.8%) | 42 (11.8%) |
| 55 to 59 Years | 50 (12.0%) | 23 (6.5%) |
| 60 to 64 Years | 3 (0.7%) | 17 (4.8%) |
| 65 to 69 Years | 56 (13.4%) | 34 (9.6%) |
| 70 to 74 Years | 12 (2.9%) | 42 (11.8%) |
| 75 to 79 Years | 10 (2.4%) | 8 (2.2%) |
| 80 to 84 Years | 4 (1.0%) | 22 (6.2%) |
| 85 Years and over | 5 (1.2%) | 40 (11.2%) |
| Total | 418 (100.0%) | 356 (100.0%) |
Families and Households in Hardin
Median Family Size in Hardin
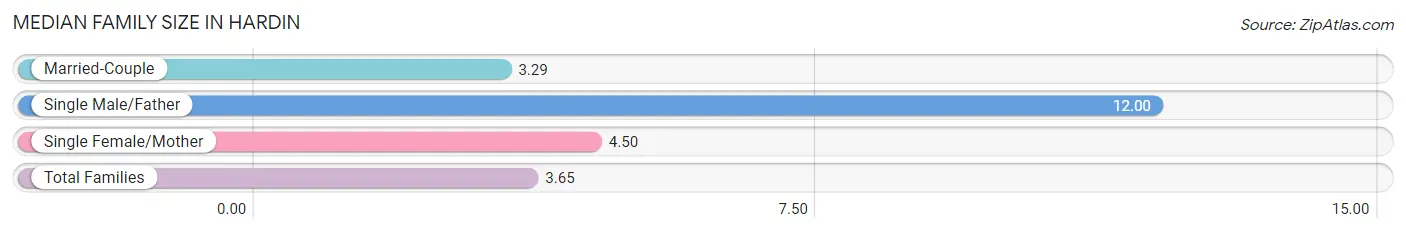
The median family size in Hardin is 3.65 persons per family, with single male/father families (6 | 3.7%) accounting for the largest median family size of 12 persons per family. On the other hand, married-couple families (151 | 93.8%) represent the smallest median family size with 3.29 persons per family.
| Family Type | # Families | Family Size |
| Married-Couple | 151 (93.8%) | 3.29 |
| Single Male/Father | 6 (3.7%) | 12.00 |
| Single Female/Mother | 4 (2.5%) | 4.50 |
| Total Families | 161 (100.0%) | 3.65 |
Median Household Size in Hardin
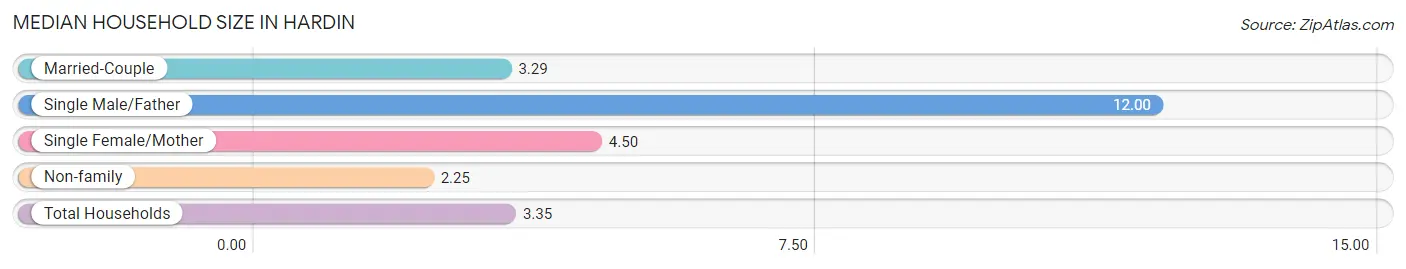
The median household size in Hardin is 3.35 persons per household, with single male/father households (6 | 2.9%) accounting for the largest median household size of 12 persons per household. non-family households (44 | 21.5%) represent the smallest median household size with 2.25 persons per household.
| Household Type | # Households | Household Size |
| Married-Couple | 151 (73.7%) | 3.29 |
| Single Male/Father | 6 (2.9%) | 12.00 |
| Single Female/Mother | 4 (1.9%) | 4.50 |
| Non-family | 44 (21.5%) | 2.25 |
| Total Households | 205 (100.0%) | 3.35 |
Household Size by Marriage Status in Hardin
Out of a total of 205 households in Hardin, 161 (78.5%) are family households, while 44 (21.5%) are nonfamily households. The most numerous type of family households are 2-person households, comprising 90, and the most common type of nonfamily households are 1-person households, comprising 22.
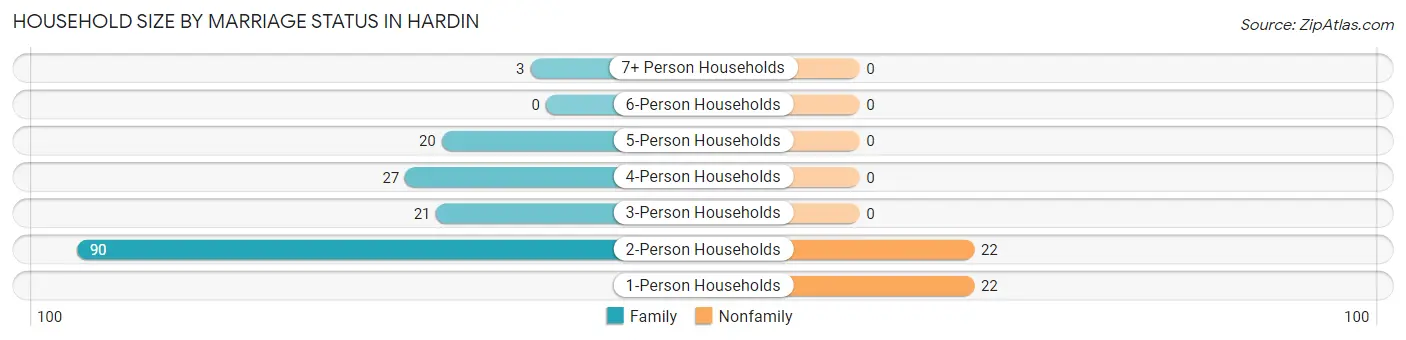
| Household Size | Family Households | Nonfamily Households |
| 1-Person Households | - | 22 (10.7%) |
| 2-Person Households | 90 (43.9%) | 22 (10.7%) |
| 3-Person Households | 21 (10.2%) | 0 (0.0%) |
| 4-Person Households | 27 (13.2%) | 0 (0.0%) |
| 5-Person Households | 20 (9.8%) | 0 (0.0%) |
| 6-Person Households | 0 (0.0%) | 0 (0.0%) |
| 7+ Person Households | 3 (1.5%) | 0 (0.0%) |
| Total | 161 (78.5%) | 44 (21.5%) |
Female Fertility in Hardin
Fertility by Age in Hardin
Average fertility rate in Hardin is 51.0 births per 1,000 women. Women in the age bracket of 20 to 34 years have the highest fertility rate with 135.0 births per 1,000 women. Women in the age bracket of 20 to 34 years acount for 100.0% of all women with births.
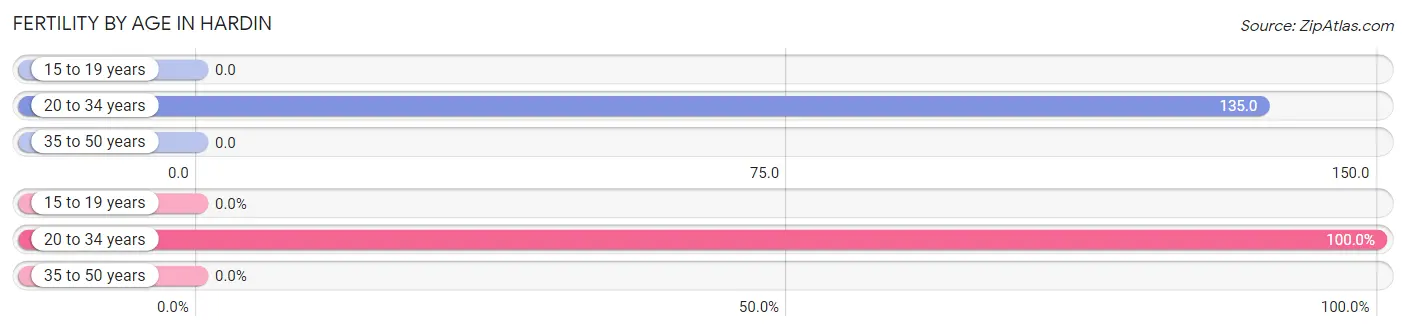
| Age Bracket | Women with Births | Births / 1,000 Women |
| 15 to 19 years | 0 (0.0%) | 0.0 |
| 20 to 34 years | 5 (100.0%) | 135.0 |
| 35 to 50 years | 0 (0.0%) | 0.0 |
| Total | 5 (100.0%) | 51.0 |
Fertility by Age by Marriage Status in Hardin
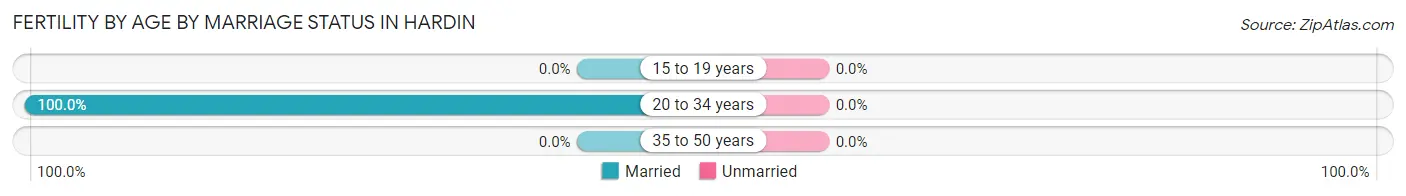
| Age Bracket | Married | Unmarried |
| 15 to 19 years | 0 (0.0%) | 0 (0.0%) |
| 20 to 34 years | 5 (100.0%) | 0 (0.0%) |
| 35 to 50 years | 0 (0.0%) | 0 (0.0%) |
| Total | 5 (100.0%) | 0 (0.0%) |
Fertility by Education in Hardin
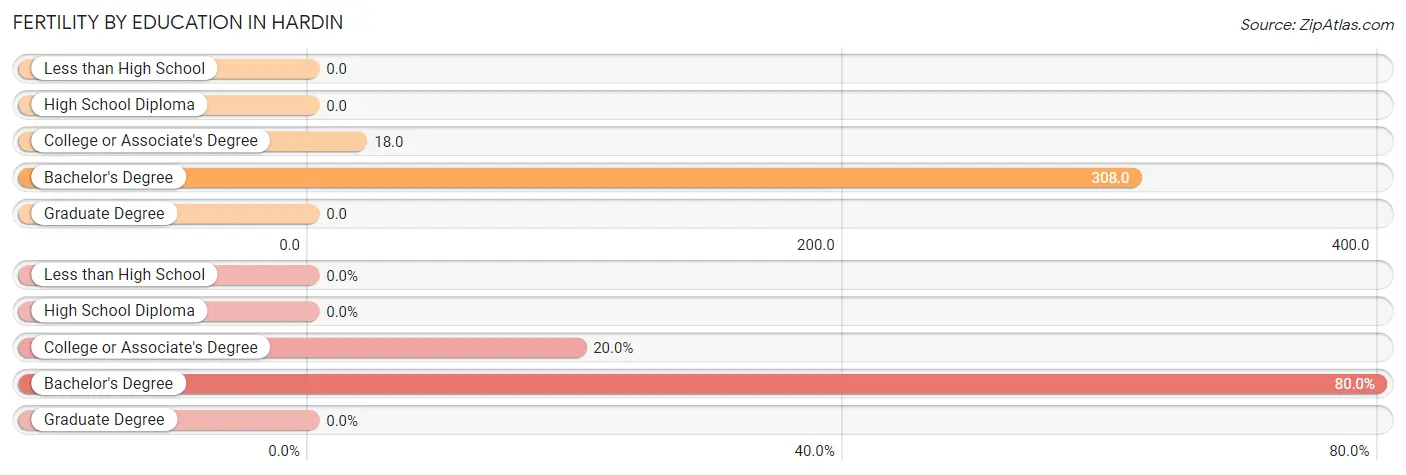
| Educational Attainment | Women with Births | Births / 1,000 Women |
| Less than High School | 0 (0.0%) | 0.0 |
| High School Diploma | 0 (0.0%) | 0.0 |
| College or Associate's Degree | 1 (20.0%) | 18.0 |
| Bachelor's Degree | 4 (80.0%) | 308.0 |
| Graduate Degree | 0 (0.0%) | 0.0 |
| Total | 5 (100.0%) | 51.0 |
Fertility by Education by Marriage Status in Hardin
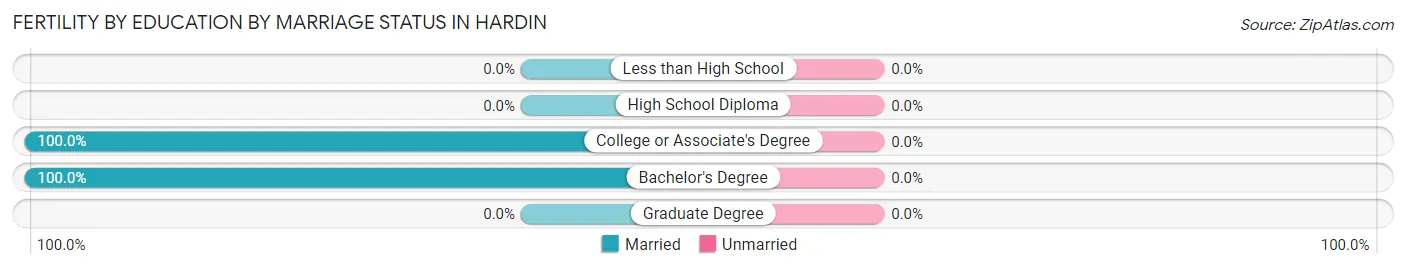
| Educational Attainment | Married | Unmarried |
| Less than High School | 0 (0.0%) | 0 (0.0%) |
| High School Diploma | 0 (0.0%) | 0 (0.0%) |
| College or Associate's Degree | 1 (100.0%) | 0 (0.0%) |
| Bachelor's Degree | 4 (100.0%) | 0 (0.0%) |
| Graduate Degree | 0 (0.0%) | 0 (0.0%) |
| Total | 5 (100.0%) | 0 (0.0%) |
Employment Characteristics in Hardin
Employment by Class of Employer in Hardin
Among the 285 employed individuals in Hardin, private company employees (159 | 55.8%), local government employees (77 | 27.0%), and self-employed (incorporated) (24 | 8.4%) make up the most common classes of employment.
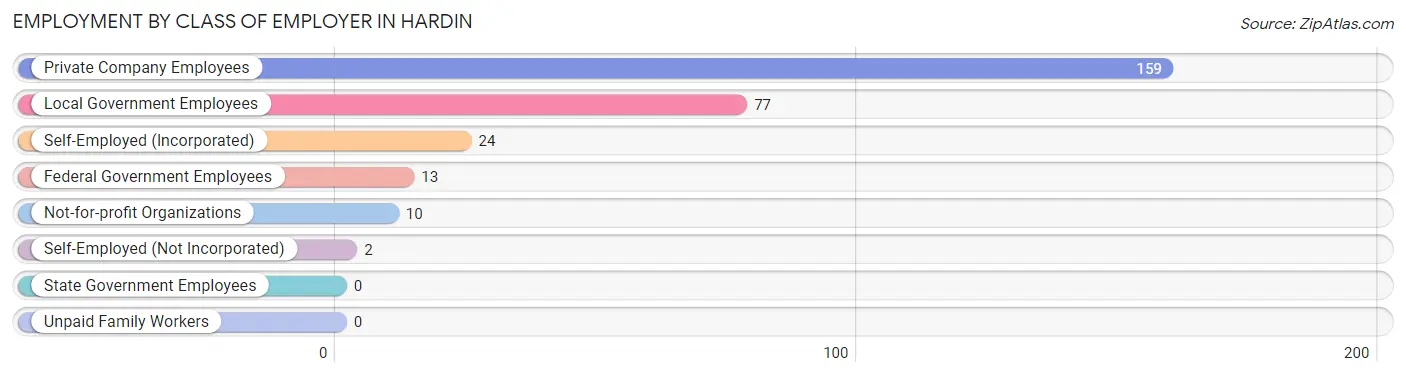
| Employer Class | # Employees | % Employees |
| Private Company Employees | 159 | 55.8% |
| Self-Employed (Incorporated) | 24 | 8.4% |
| Self-Employed (Not Incorporated) | 2 | 0.7% |
| Not-for-profit Organizations | 10 | 3.5% |
| Local Government Employees | 77 | 27.0% |
| State Government Employees | 0 | 0.0% |
| Federal Government Employees | 13 | 4.6% |
| Unpaid Family Workers | 0 | 0.0% |
| Total | 285 | 100.0% |
Employment Status by Age in Hardin
According to the labor force statistics for Hardin, out of the total population over 16 years of age (682), 43.4% or 296 individuals are in the labor force, with 0.7% or 2 of them unemployed. The age group with the highest labor force participation rate is 25 to 29 years, with 92.9% or 13 individuals in the labor force. Within the labor force, the 35 to 44 years age range has the highest percentage of unemployed individuals, with 50.0% or 2 of them being unemployed.
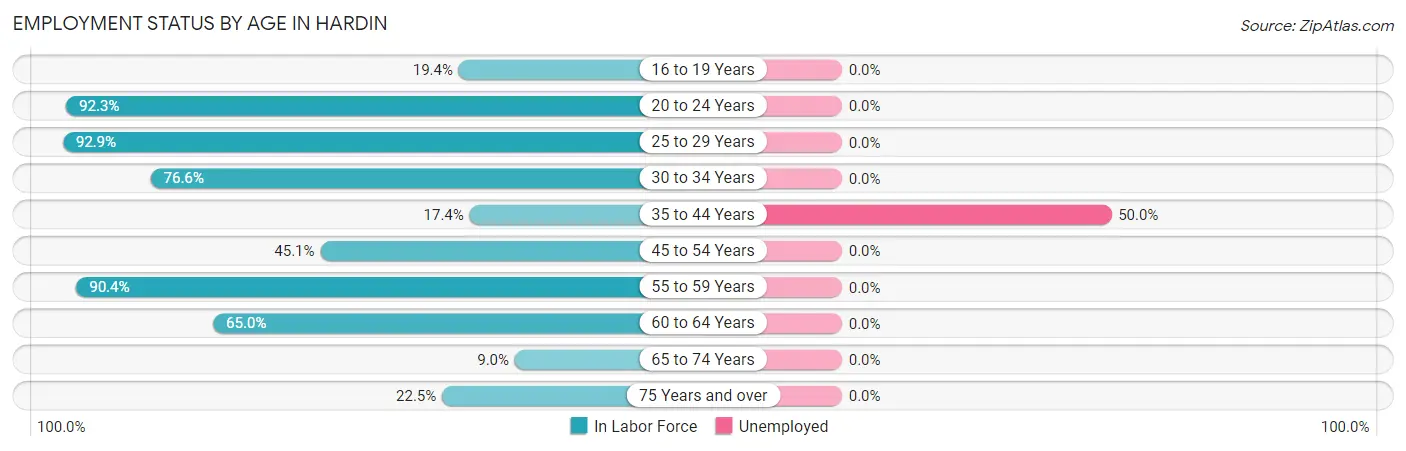
| Age Bracket | In Labor Force | Unemployed |
| 16 to 19 Years | 7 (19.4%) | 0 (0.0%) |
| 20 to 24 Years | 24 (92.3%) | 0 (0.0%) |
| 25 to 29 Years | 13 (92.9%) | 0 (0.0%) |
| 30 to 34 Years | 49 (76.6%) | 0 (0.0%) |
| 35 to 44 Years | 4 (17.4%) | 2 (50.0%) |
| 45 to 54 Years | 87 (45.1%) | 0 (0.0%) |
| 55 to 59 Years | 66 (90.4%) | 0 (0.0%) |
| 60 to 64 Years | 13 (65.0%) | 0 (0.0%) |
| 65 to 74 Years | 13 (9.0%) | 0 (0.0%) |
| 75 Years and over | 20 (22.5%) | 0 (0.0%) |
| Total | 296 (43.4%) | 2 (0.7%) |
Employment Status by Educational Attainment in Hardin
According to labor force statistics for Hardin, 59.9% of individuals (232) out of the total population between 25 and 64 years of age (387) are in the labor force, with 0.9% or 2 of them being unemployed. The group with the highest labor force participation rate are those with the educational attainment of bachelor's degree or higher, with 98.9% or 87 individuals in the labor force. Within the labor force, individuals with college / associate degree education have the highest percentage of unemployment, with 2.5% or 2 of them being unemployed.
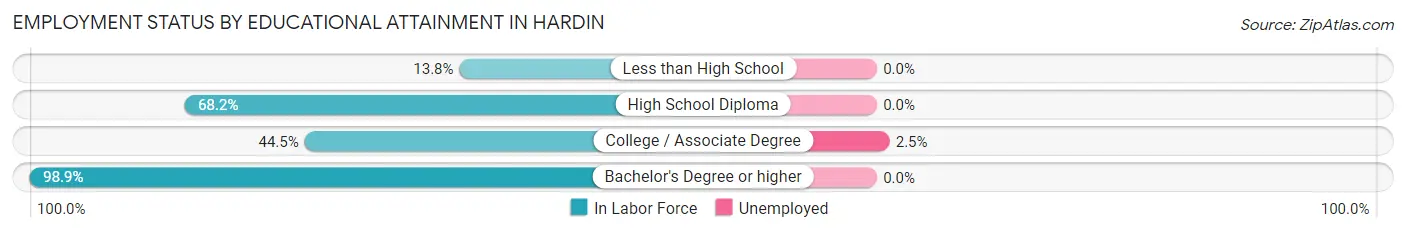
| Educational Attainment | In Labor Force | Unemployed |
| Less than High School | 4 (13.8%) | 0 (0.0%) |
| High School Diploma | 60 (68.2%) | 0 (0.0%) |
| College / Associate Degree | 81 (44.5%) | 5 (2.5%) |
| Bachelor's Degree or higher | 87 (98.9%) | 0 (0.0%) |
| Total | 232 (59.9%) | 3 (0.9%) |
Employment Occupations by Sex in Hardin
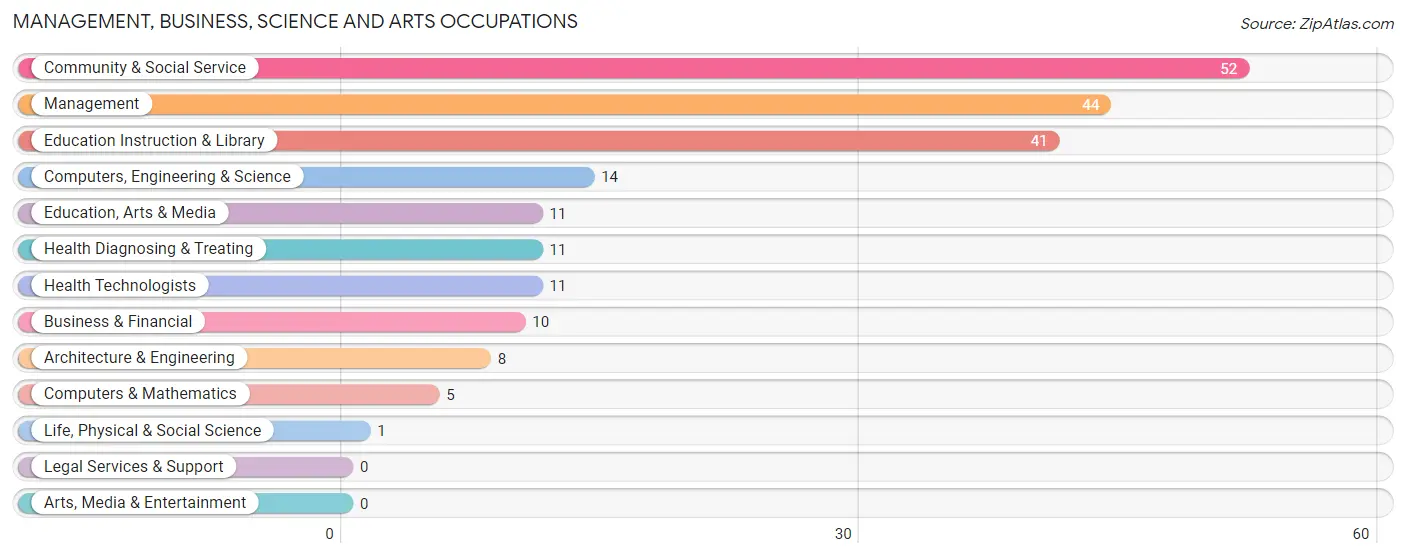
Management, Business, Science and Arts Occupations
The most common Management, Business, Science and Arts occupations in Hardin are Community & Social Service (52 | 17.7%), Management (44 | 15.0%), Education Instruction & Library (41 | 14.0%), Computers, Engineering & Science (14 | 4.8%), and Education, Arts & Media (11 | 3.7%).
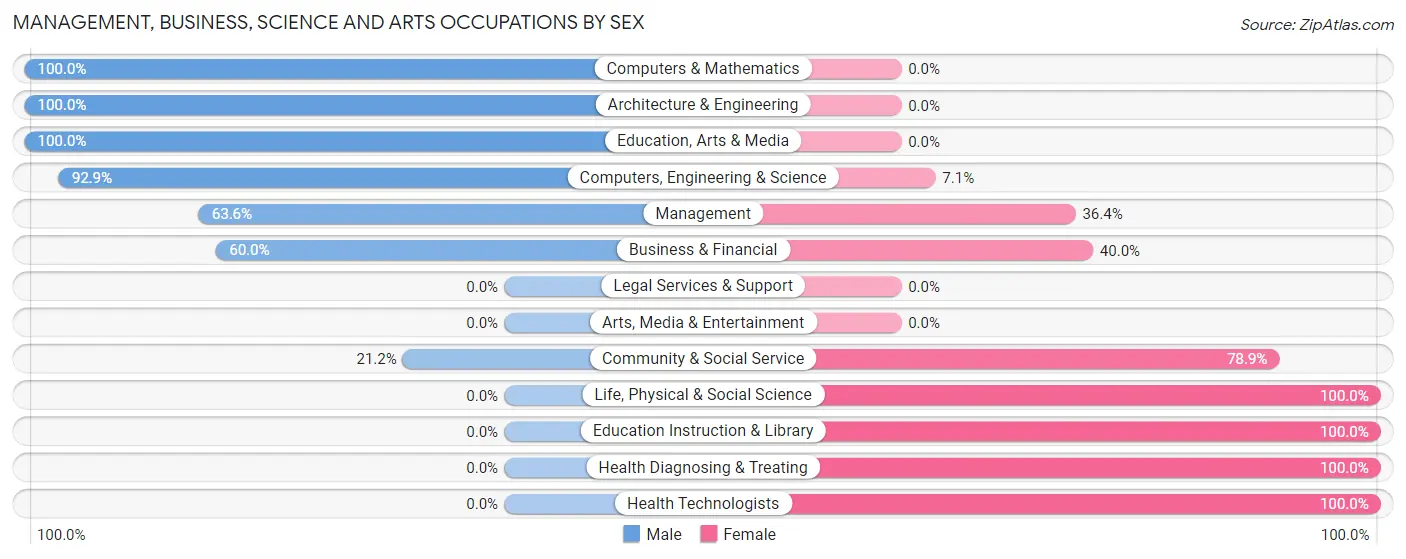
Management, Business, Science and Arts Occupations by Sex
Within the Management, Business, Science and Arts occupations in Hardin, the most male-oriented occupations are Computers & Mathematics (100.0%), Architecture & Engineering (100.0%), and Education, Arts & Media (100.0%), while the most female-oriented occupations are Life, Physical & Social Science (100.0%), Education Instruction & Library (100.0%), and Health Diagnosing & Treating (100.0%).
| Occupation | Male | Female |
| Management | 28 (63.6%) | 16 (36.4%) |
| Business & Financial | 6 (60.0%) | 4 (40.0%) |
| Computers, Engineering & Science | 13 (92.9%) | 1 (7.1%) |
| Computers & Mathematics | 5 (100.0%) | 0 (0.0%) |
| Architecture & Engineering | 8 (100.0%) | 0 (0.0%) |
| Life, Physical & Social Science | 0 (0.0%) | 1 (100.0%) |
| Community & Social Service | 11 (21.1%) | 41 (78.8%) |
| Education, Arts & Media | 11 (100.0%) | 0 (0.0%) |
| Legal Services & Support | 0 (0.0%) | 0 (0.0%) |
| Education Instruction & Library | 0 (0.0%) | 41 (100.0%) |
| Arts, Media & Entertainment | 0 (0.0%) | 0 (0.0%) |
| Health Diagnosing & Treating | 0 (0.0%) | 11 (100.0%) |
| Health Technologists | 0 (0.0%) | 11 (100.0%) |
| Total (Category) | 58 (44.3%) | 73 (55.7%) |
| Total (Overall) | 170 (57.8%) | 124 (42.2%) |
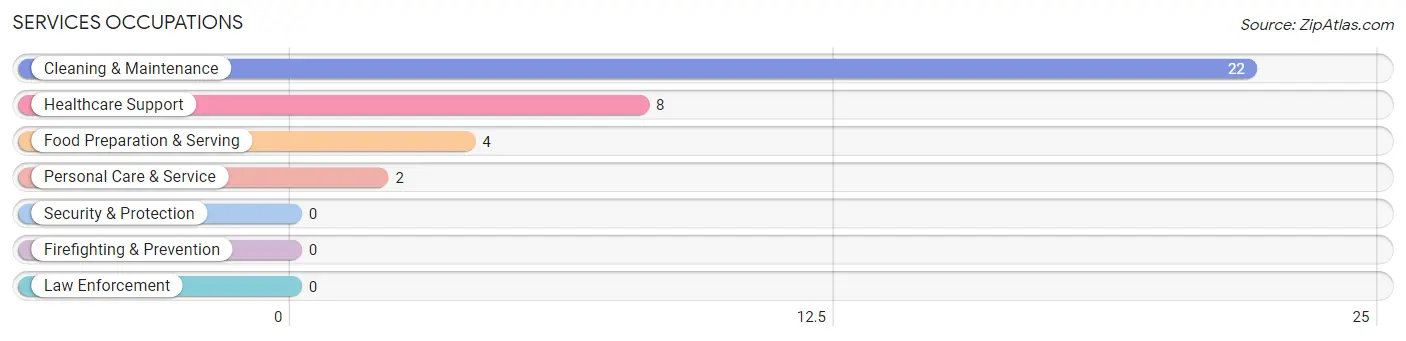
Services Occupations
The most common Services occupations in Hardin are Cleaning & Maintenance (22 | 7.5%), Healthcare Support (8 | 2.7%), Food Preparation & Serving (4 | 1.4%), and Personal Care & Service (2 | 0.7%).
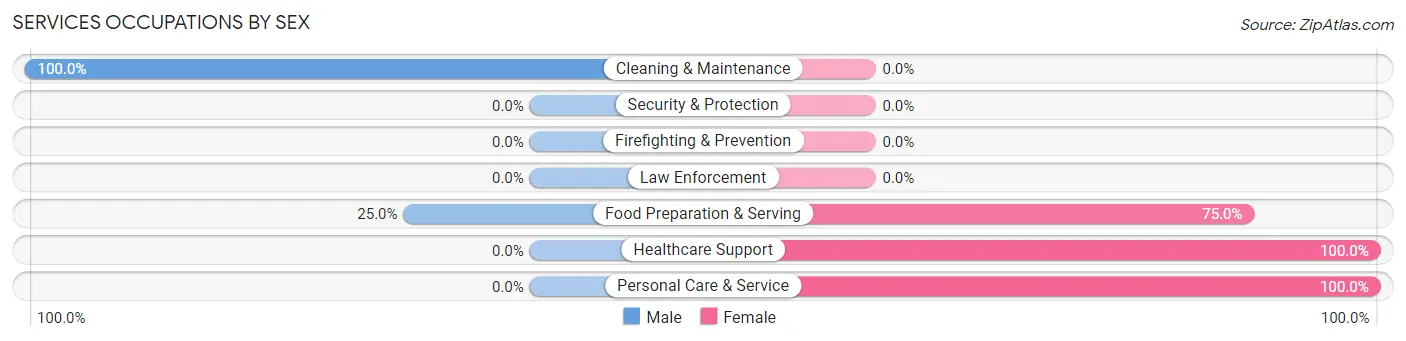
Services Occupations by Sex
Within the Services occupations in Hardin, the most male-oriented occupations are Cleaning & Maintenance (100.0%), and Food Preparation & Serving (25.0%), while the most female-oriented occupations are Healthcare Support (100.0%), Personal Care & Service (100.0%), and Food Preparation & Serving (75.0%).
| Occupation | Male | Female |
| Healthcare Support | 0 (0.0%) | 8 (100.0%) |
| Security & Protection | 0 (0.0%) | 0 (0.0%) |
| Firefighting & Prevention | 0 (0.0%) | 0 (0.0%) |
| Law Enforcement | 0 (0.0%) | 0 (0.0%) |
| Food Preparation & Serving | 1 (25.0%) | 3 (75.0%) |
| Cleaning & Maintenance | 22 (100.0%) | 0 (0.0%) |
| Personal Care & Service | 0 (0.0%) | 2 (100.0%) |
| Total (Category) | 23 (63.9%) | 13 (36.1%) |
| Total (Overall) | 170 (57.8%) | 124 (42.2%) |
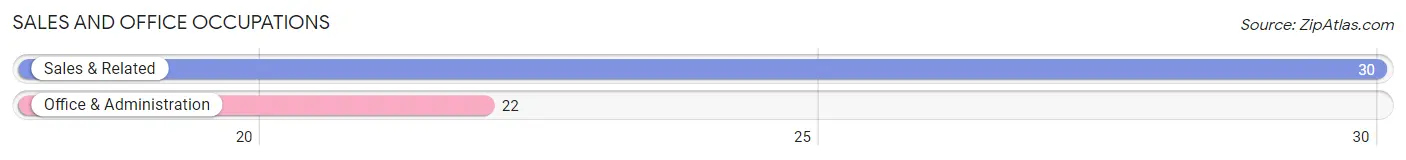
Sales and Office Occupations
The most common Sales and Office occupations in Hardin are Sales & Related (30 | 10.2%), and Office & Administration (22 | 7.5%).
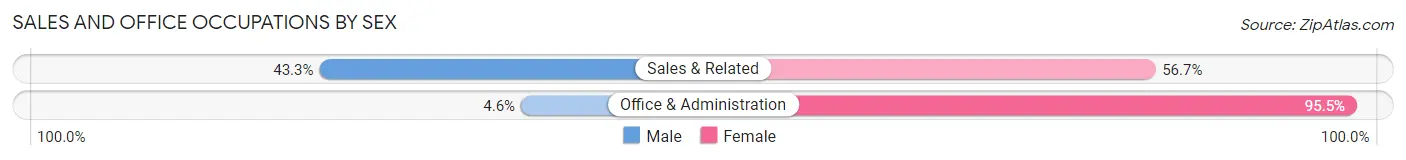
Sales and Office Occupations by Sex
| Occupation | Male | Female |
| Sales & Related | 13 (43.3%) | 17 (56.7%) |
| Office & Administration | 1 (4.5%) | 21 (95.5%) |
| Total (Category) | 14 (26.9%) | 38 (73.1%) |
| Total (Overall) | 170 (57.8%) | 124 (42.2%) |
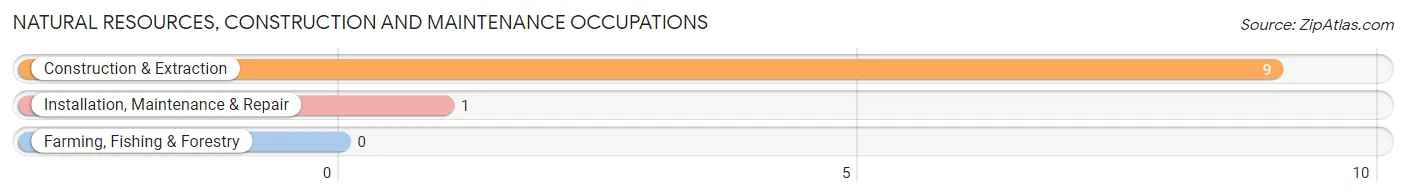
Natural Resources, Construction and Maintenance Occupations
The most common Natural Resources, Construction and Maintenance occupations in Hardin are Construction & Extraction (9 | 3.1%), and Installation, Maintenance & Repair (1 | 0.3%).
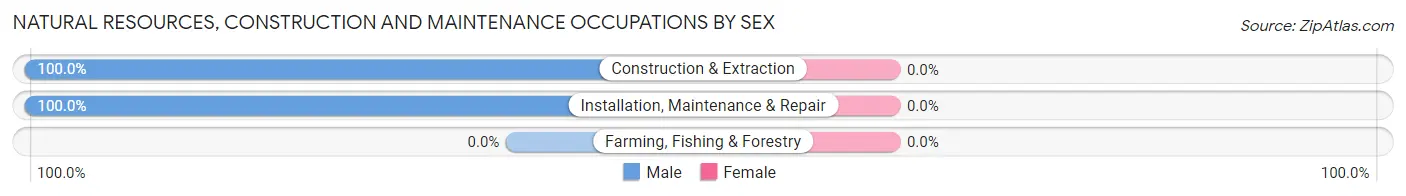
Natural Resources, Construction and Maintenance Occupations by Sex
| Occupation | Male | Female |
| Farming, Fishing & Forestry | 0 (0.0%) | 0 (0.0%) |
| Construction & Extraction | 9 (100.0%) | 0 (0.0%) |
| Installation, Maintenance & Repair | 1 (100.0%) | 0 (0.0%) |
| Total (Category) | 10 (100.0%) | 0 (0.0%) |
| Total (Overall) | 170 (57.8%) | 124 (42.2%) |
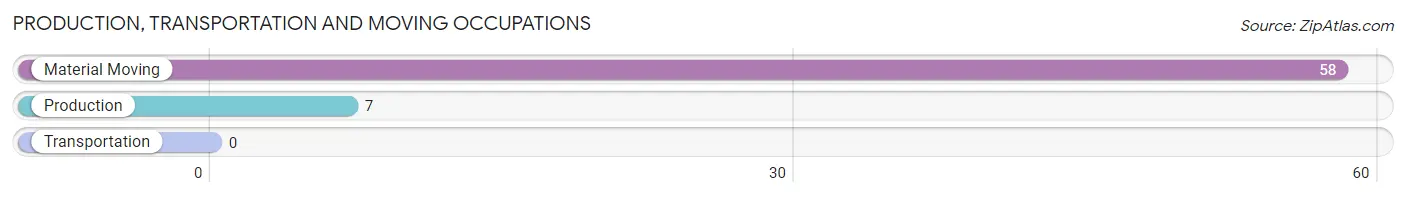
Production, Transportation and Moving Occupations
The most common Production, Transportation and Moving occupations in Hardin are Material Moving (58 | 19.7%), and Production (7 | 2.4%).
Production, Transportation and Moving Occupations by Sex
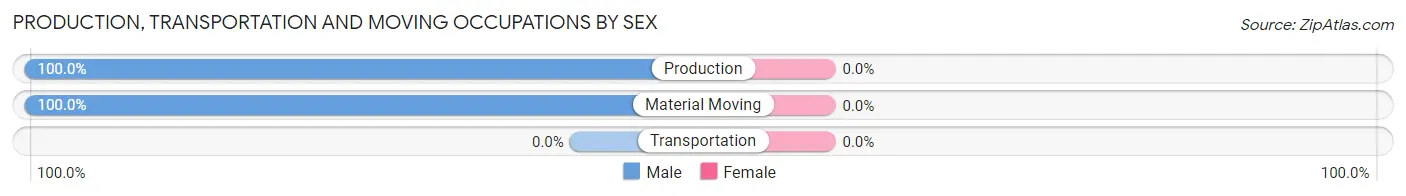
| Occupation | Male | Female |
| Production | 7 (100.0%) | 0 (0.0%) |
| Transportation | 0 (0.0%) | 0 (0.0%) |
| Material Moving | 58 (100.0%) | 0 (0.0%) |
| Total (Category) | 65 (100.0%) | 0 (0.0%) |
| Total (Overall) | 170 (57.8%) | 124 (42.2%) |
Employment Industries by Sex in Hardin
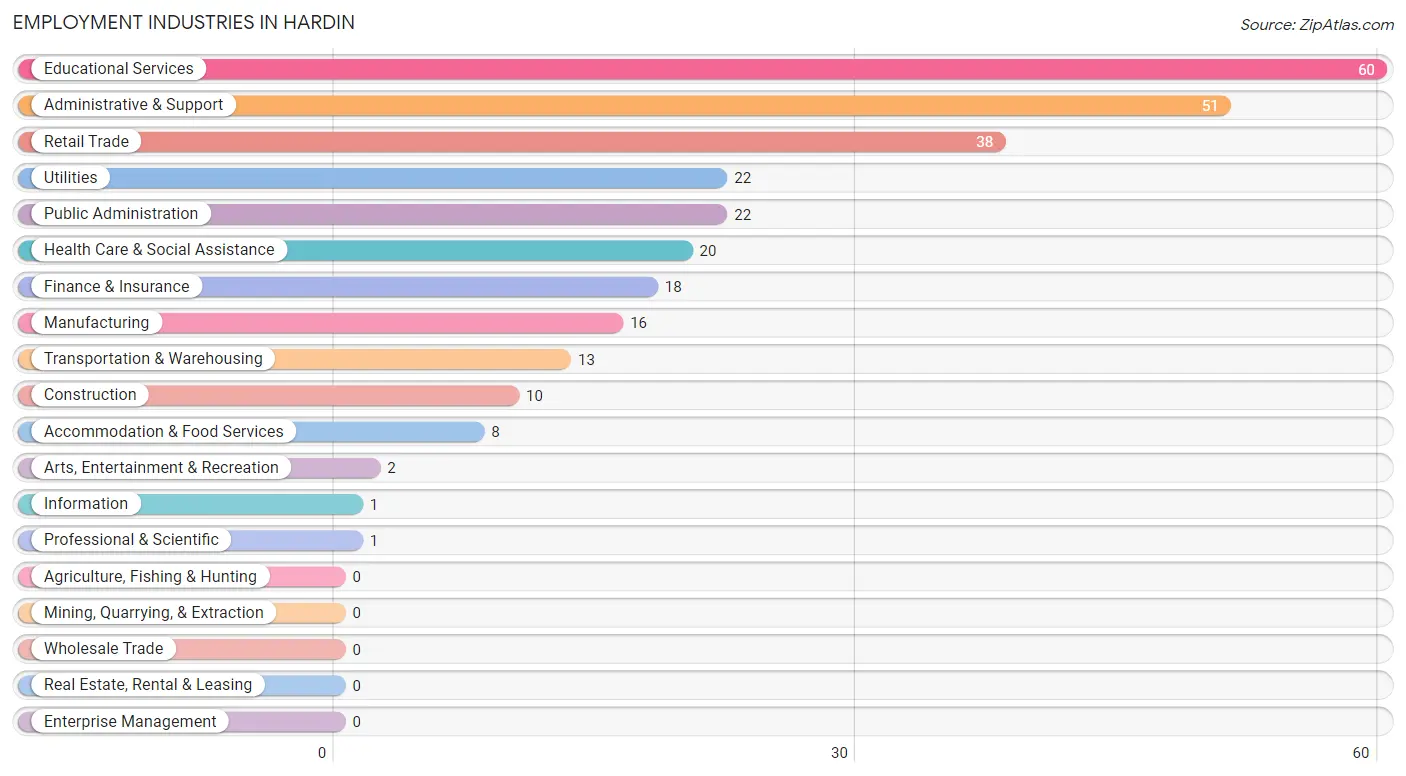
Employment Industries in Hardin
The major employment industries in Hardin include Educational Services (60 | 20.4%), Administrative & Support (51 | 17.3%), Retail Trade (38 | 12.9%), Utilities (22 | 7.5%), and Public Administration (22 | 7.5%).
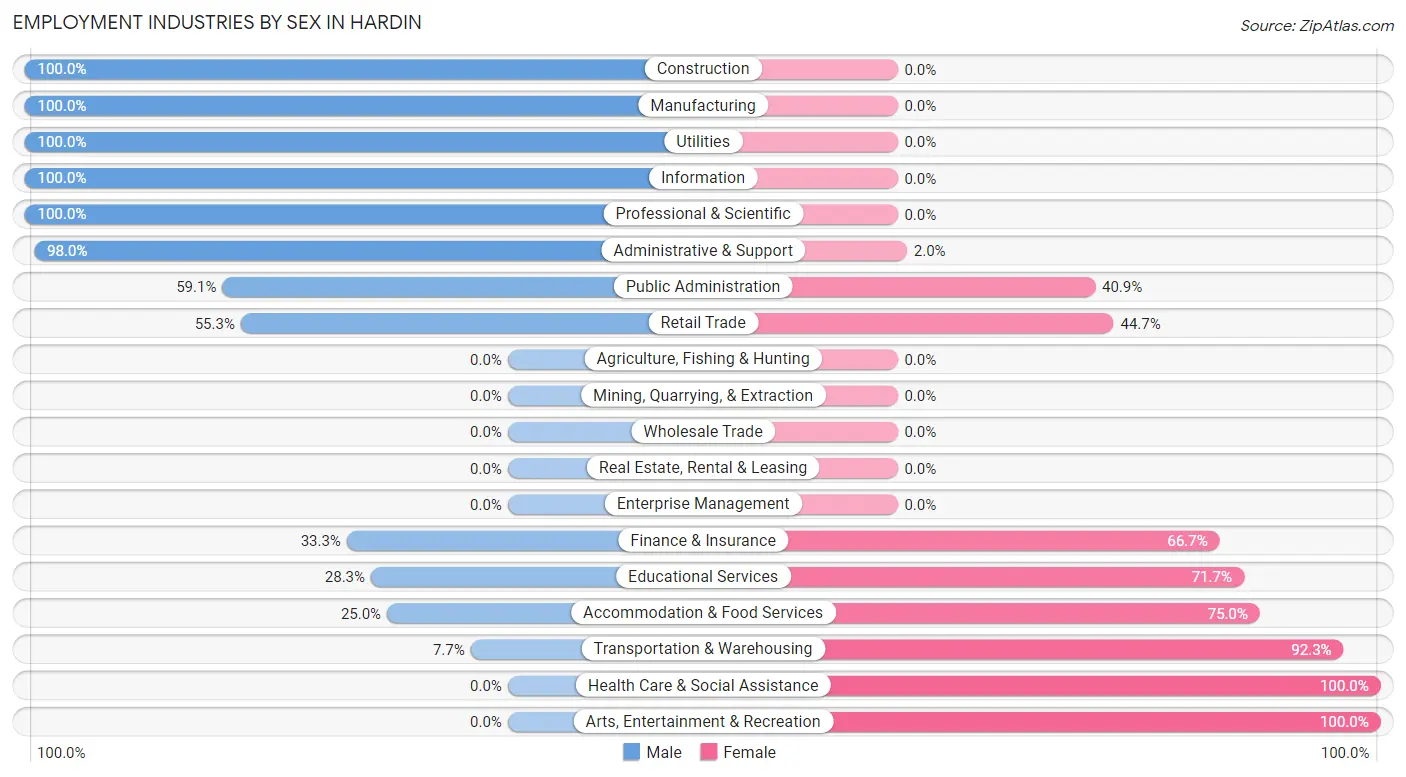
Employment Industries by Sex in Hardin
The Hardin industries that see more men than women are Construction (100.0%), Manufacturing (100.0%), and Utilities (100.0%), whereas the industries that tend to have a higher number of women are Health Care & Social Assistance (100.0%), Arts, Entertainment & Recreation (100.0%), and Transportation & Warehousing (92.3%).
| Industry | Male | Female |
| Agriculture, Fishing & Hunting | 0 (0.0%) | 0 (0.0%) |
| Mining, Quarrying, & Extraction | 0 (0.0%) | 0 (0.0%) |
| Construction | 10 (100.0%) | 0 (0.0%) |
| Manufacturing | 16 (100.0%) | 0 (0.0%) |
| Wholesale Trade | 0 (0.0%) | 0 (0.0%) |
| Retail Trade | 21 (55.3%) | 17 (44.7%) |
| Transportation & Warehousing | 1 (7.7%) | 12 (92.3%) |
| Utilities | 22 (100.0%) | 0 (0.0%) |
| Information | 1 (100.0%) | 0 (0.0%) |
| Finance & Insurance | 6 (33.3%) | 12 (66.7%) |
| Real Estate, Rental & Leasing | 0 (0.0%) | 0 (0.0%) |
| Professional & Scientific | 1 (100.0%) | 0 (0.0%) |
| Enterprise Management | 0 (0.0%) | 0 (0.0%) |
| Administrative & Support | 50 (98.0%) | 1 (2.0%) |
| Educational Services | 17 (28.3%) | 43 (71.7%) |
| Health Care & Social Assistance | 0 (0.0%) | 20 (100.0%) |
| Arts, Entertainment & Recreation | 0 (0.0%) | 2 (100.0%) |
| Accommodation & Food Services | 2 (25.0%) | 6 (75.0%) |
| Public Administration | 13 (59.1%) | 9 (40.9%) |
| Total | 170 (57.8%) | 124 (42.2%) |
Education in Hardin
School Enrollment in Hardin
The most common levels of schooling among the 111 students in Hardin are high school (37 | 33.3%), nursery / preschool (19 | 17.1%), and middle school (18 | 16.2%).
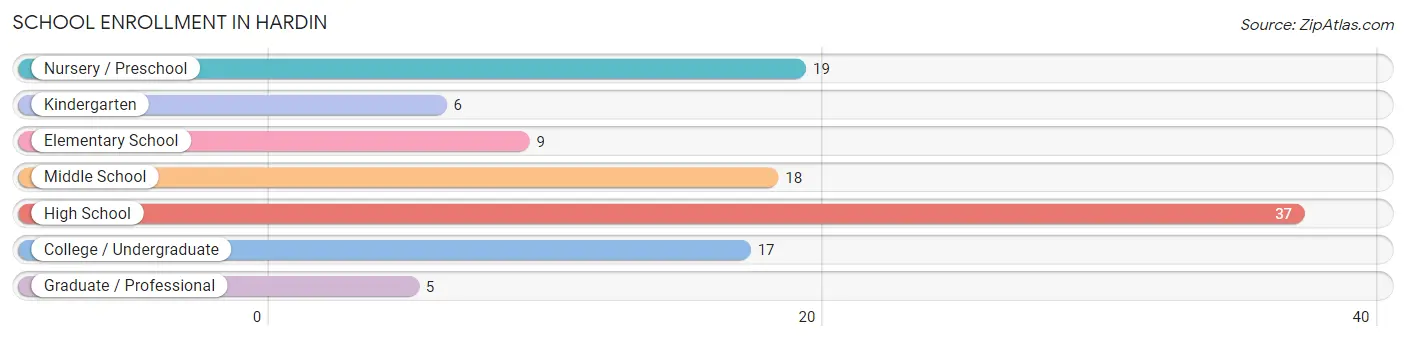
| School Level | # Students | % Students |
| Nursery / Preschool | 19 | 17.1% |
| Kindergarten | 6 | 5.4% |
| Elementary School | 9 | 8.1% |
| Middle School | 18 | 16.2% |
| High School | 37 | 33.3% |
| College / Undergraduate | 17 | 15.3% |
| Graduate / Professional | 5 | 4.5% |
| Total | 111 | 100.0% |
School Enrollment by Age by Funding Source in Hardin
Out of a total of 111 students who are enrolled in schools in Hardin, 34 (30.6%) attend a private institution, while the remaining 77 (69.4%) are enrolled in public schools. The age group of 5 to 9 year old has the highest likelihood of being enrolled in private schools, with 12 (100.0% in the age bracket) enrolled. Conversely, the age group of 18 to 19 year olds has the lowest likelihood of being enrolled in a private school, with 5 (100.0% in the age bracket) attending a public institution.
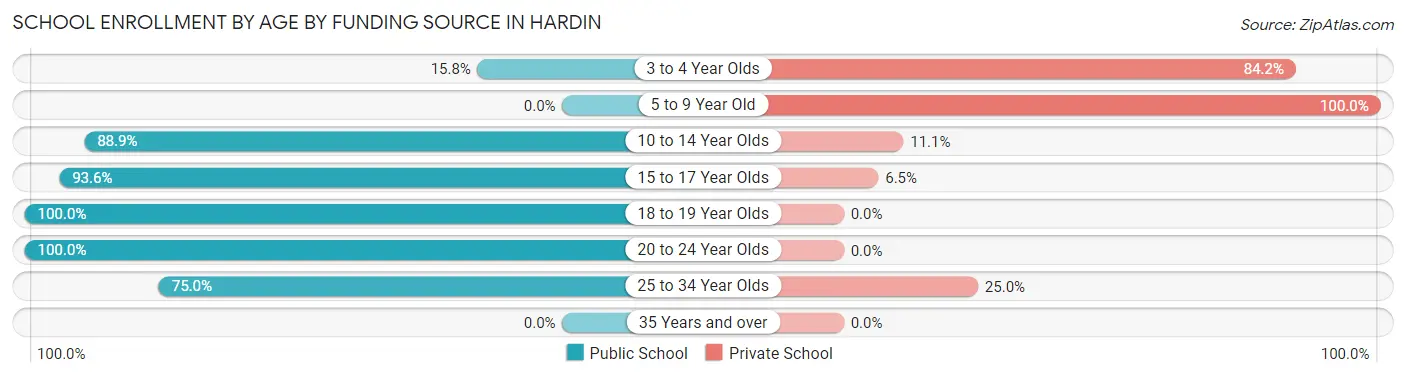
| Age Bracket | Public School | Private School |
| 3 to 4 Year Olds | 3 (15.8%) | 16 (84.2%) |
| 5 to 9 Year Old | 0 (0.0%) | 12 (100.0%) |
| 10 to 14 Year Olds | 24 (88.9%) | 3 (11.1%) |
| 15 to 17 Year Olds | 29 (93.5%) | 2 (6.5%) |
| 18 to 19 Year Olds | 5 (100.0%) | 0 (0.0%) |
| 20 to 24 Year Olds | 13 (100.0%) | 0 (0.0%) |
| 25 to 34 Year Olds | 3 (75.0%) | 1 (25.0%) |
| 35 Years and over | 0 (0.0%) | 0 (0.0%) |
| Total | 77 (69.4%) | 34 (30.6%) |
Educational Attainment by Field of Study in Hardin
Education (50 | 43.1%), bio, nature & agricultural (22 | 19.0%), liberal arts & history (17 | 14.7%), engineering (13 | 11.2%), and literature & languages (7 | 6.0%) are the most common fields of study among 116 individuals in Hardin who have obtained a bachelor's degree or higher.
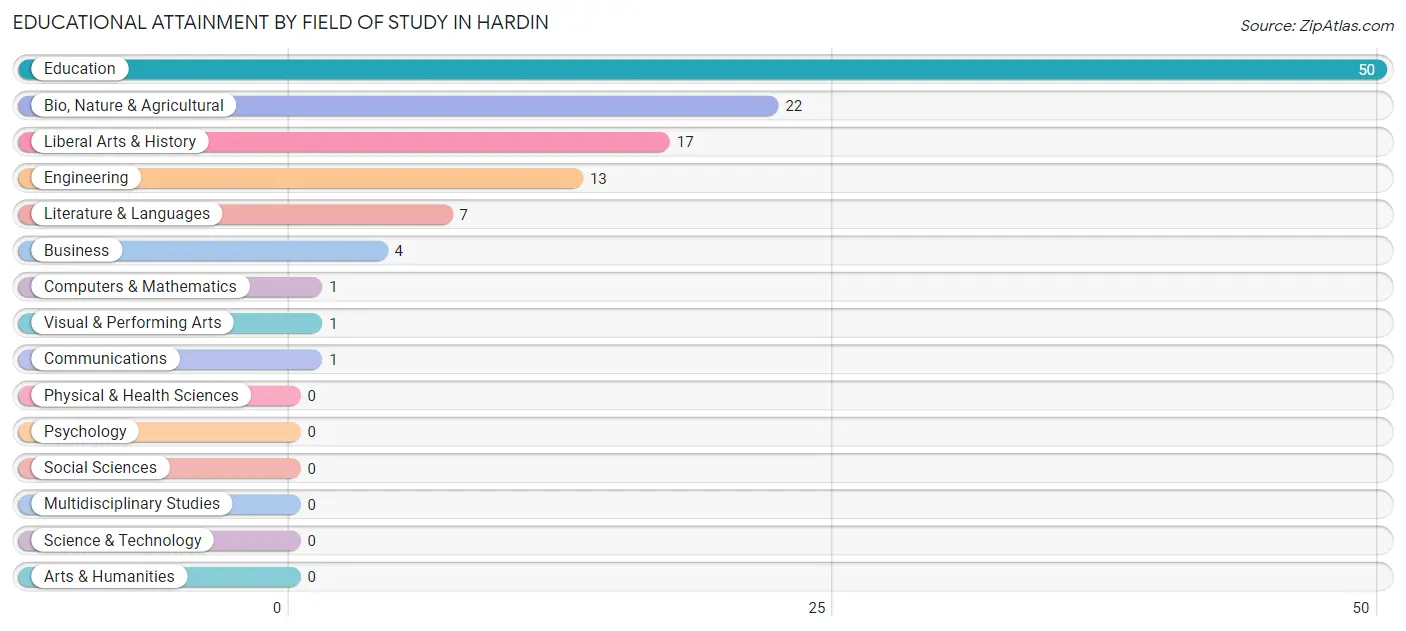
| Field of Study | # Graduates | % Graduates |
| Computers & Mathematics | 1 | 0.9% |
| Bio, Nature & Agricultural | 22 | 19.0% |
| Physical & Health Sciences | 0 | 0.0% |
| Psychology | 0 | 0.0% |
| Social Sciences | 0 | 0.0% |
| Engineering | 13 | 11.2% |
| Multidisciplinary Studies | 0 | 0.0% |
| Science & Technology | 0 | 0.0% |
| Business | 4 | 3.5% |
| Education | 50 | 43.1% |
| Literature & Languages | 7 | 6.0% |
| Liberal Arts & History | 17 | 14.7% |
| Visual & Performing Arts | 1 | 0.9% |
| Communications | 1 | 0.9% |
| Arts & Humanities | 0 | 0.0% |
| Total | 116 | 100.0% |
Transportation & Commute in Hardin
Vehicle Availability by Sex in Hardin
The most prevalent vehicle ownership categories in Hardin are males with 3 vehicles (100, accounting for 62.1%) and females with 3 vehicles (49, making up 80.6%).
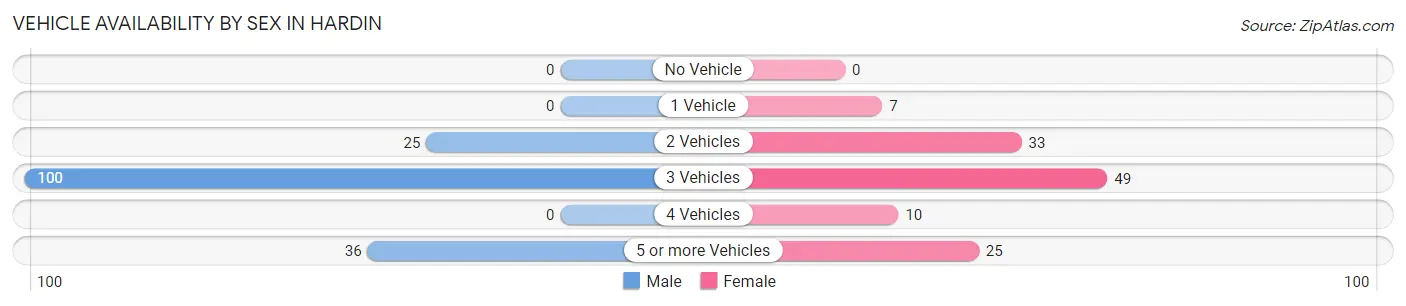
| Vehicles Available | Male | Female |
| No Vehicle | 0 (0.0%) | 0 (0.0%) |
| 1 Vehicle | 0 (0.0%) | 7 (5.7%) |
| 2 Vehicles | 25 (15.5%) | 33 (26.6%) |
| 3 Vehicles | 100 (62.1%) | 49 (39.5%) |
| 4 Vehicles | 0 (0.0%) | 10 (8.1%) |
| 5 or more Vehicles | 36 (22.4%) | 25 (20.2%) |
| Total | 161 (100.0%) | 124 (100.0%) |
Commute Time in Hardin
The most frequently occuring commute durations in Hardin are 60 to 89 minutes (61 commuters, 23.1%), 5 to 9 minutes (54 commuters, 20.4%), and 90 or more minutes (50 commuters, 18.9%).
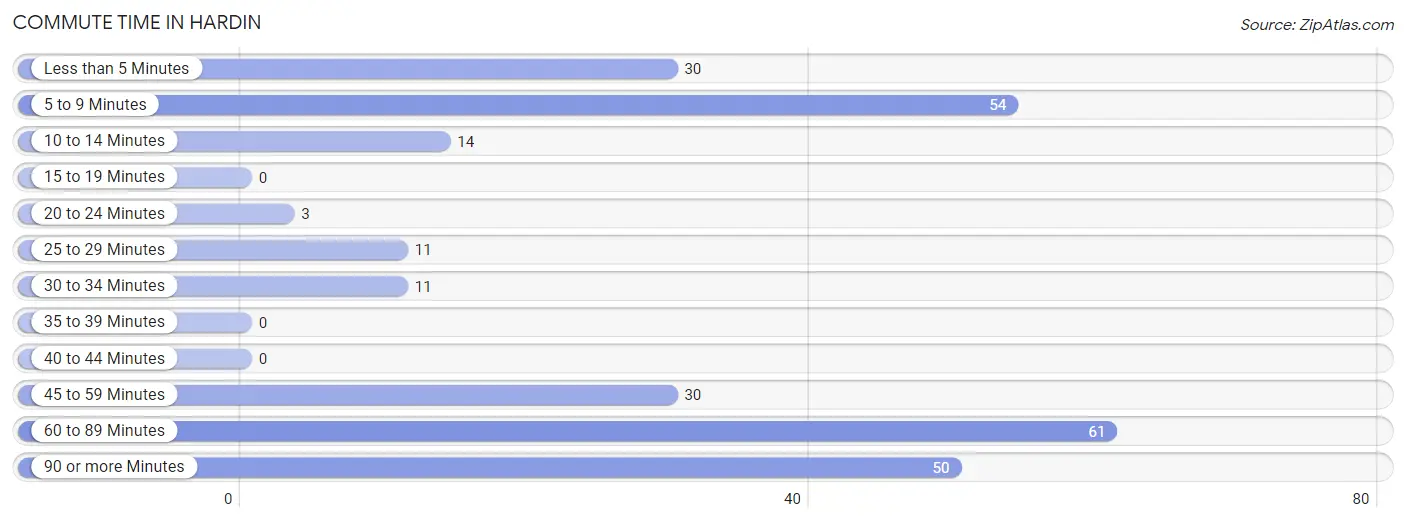
| Commute Time | # Commuters | % Commuters |
| Less than 5 Minutes | 30 | 11.4% |
| 5 to 9 Minutes | 54 | 20.4% |
| 10 to 14 Minutes | 14 | 5.3% |
| 15 to 19 Minutes | 0 | 0.0% |
| 20 to 24 Minutes | 3 | 1.1% |
| 25 to 29 Minutes | 11 | 4.2% |
| 30 to 34 Minutes | 11 | 4.2% |
| 35 to 39 Minutes | 0 | 0.0% |
| 40 to 44 Minutes | 0 | 0.0% |
| 45 to 59 Minutes | 30 | 11.4% |
| 60 to 89 Minutes | 61 | 23.1% |
| 90 or more Minutes | 50 | 18.9% |
Commute Time by Sex in Hardin
The most common commute times in Hardin are 60 to 89 minutes (56 commuters, 37.1%) for males and 5 to 9 minutes (44 commuters, 38.9%) for females.
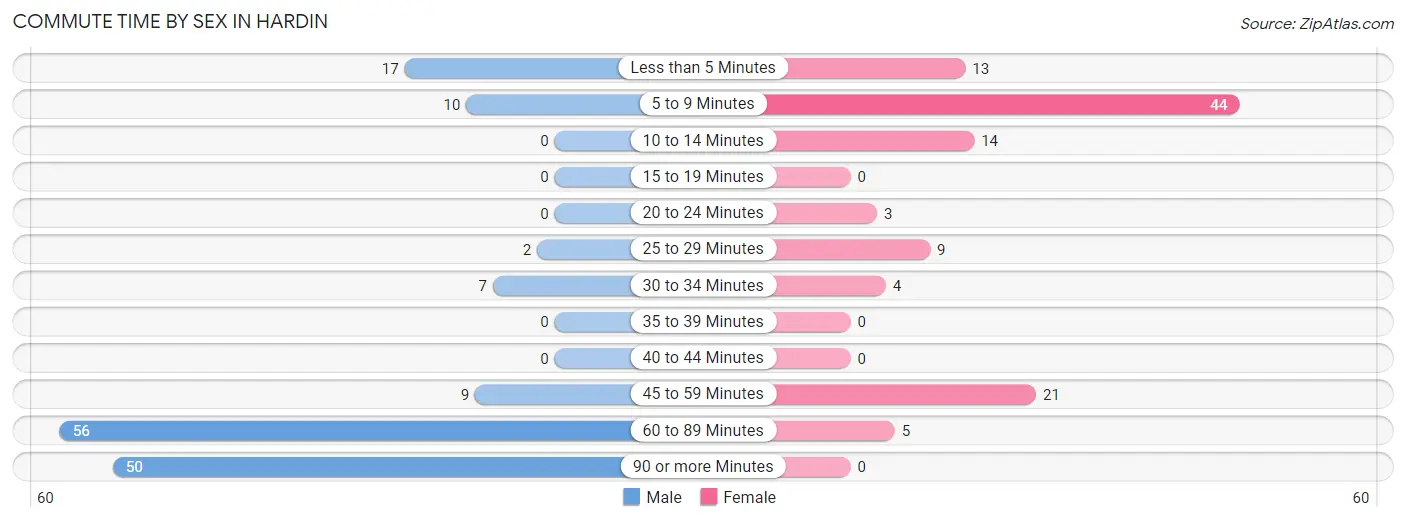
| Commute Time | Male | Female |
| Less than 5 Minutes | 17 (11.3%) | 13 (11.5%) |
| 5 to 9 Minutes | 10 (6.6%) | 44 (38.9%) |
| 10 to 14 Minutes | 0 (0.0%) | 14 (12.4%) |
| 15 to 19 Minutes | 0 (0.0%) | 0 (0.0%) |
| 20 to 24 Minutes | 0 (0.0%) | 3 (2.6%) |
| 25 to 29 Minutes | 2 (1.3%) | 9 (8.0%) |
| 30 to 34 Minutes | 7 (4.6%) | 4 (3.5%) |
| 35 to 39 Minutes | 0 (0.0%) | 0 (0.0%) |
| 40 to 44 Minutes | 0 (0.0%) | 0 (0.0%) |
| 45 to 59 Minutes | 9 (6.0%) | 21 (18.6%) |
| 60 to 89 Minutes | 56 (37.1%) | 5 (4.4%) |
| 90 or more Minutes | 50 (33.1%) | 0 (0.0%) |
Time of Departure to Work by Sex in Hardin
The most frequent times of departure to work in Hardin are 5:00 AM to 5:29 AM (56, 37.1%) for males and 7:30 AM to 7:59 AM (39, 34.5%) for females.
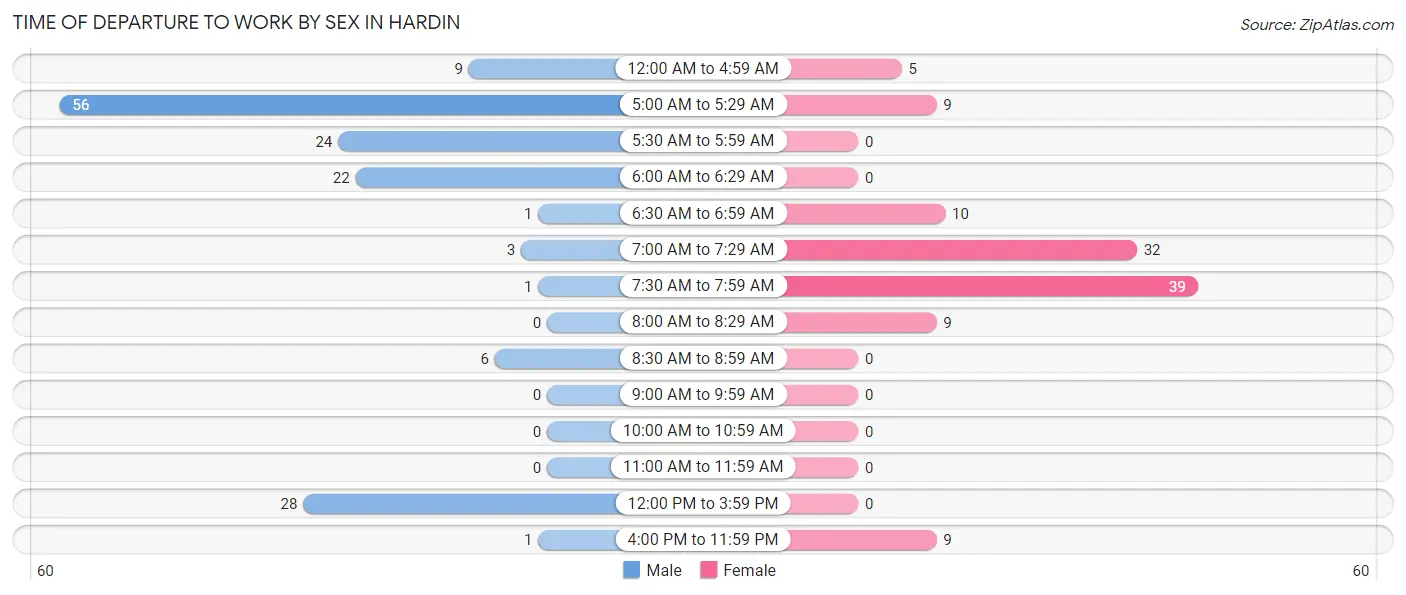
| Time of Departure | Male | Female |
| 12:00 AM to 4:59 AM | 9 (6.0%) | 5 (4.4%) |
| 5:00 AM to 5:29 AM | 56 (37.1%) | 9 (8.0%) |
| 5:30 AM to 5:59 AM | 24 (15.9%) | 0 (0.0%) |
| 6:00 AM to 6:29 AM | 22 (14.6%) | 0 (0.0%) |
| 6:30 AM to 6:59 AM | 1 (0.7%) | 10 (8.8%) |
| 7:00 AM to 7:29 AM | 3 (2.0%) | 32 (28.3%) |
| 7:30 AM to 7:59 AM | 1 (0.7%) | 39 (34.5%) |
| 8:00 AM to 8:29 AM | 0 (0.0%) | 9 (8.0%) |
| 8:30 AM to 8:59 AM | 6 (4.0%) | 0 (0.0%) |
| 9:00 AM to 9:59 AM | 0 (0.0%) | 0 (0.0%) |
| 10:00 AM to 10:59 AM | 0 (0.0%) | 0 (0.0%) |
| 11:00 AM to 11:59 AM | 0 (0.0%) | 0 (0.0%) |
| 12:00 PM to 3:59 PM | 28 (18.5%) | 0 (0.0%) |
| 4:00 PM to 11:59 PM | 1 (0.7%) | 9 (8.0%) |
| Total | 151 (100.0%) | 113 (100.0%) |
Housing Occupancy in Hardin
Occupancy by Ownership in Hardin
Of the total 205 dwellings in Hardin, owner-occupied units account for 144 (70.2%), while renter-occupied units make up 61 (29.8%).
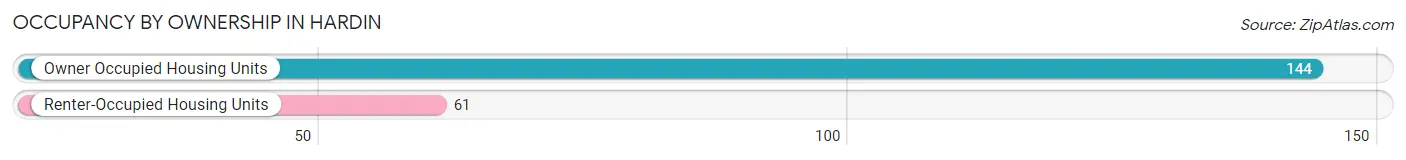
| Occupancy | # Housing Units | % Housing Units |
| Owner Occupied Housing Units | 144 | 70.2% |
| Renter-Occupied Housing Units | 61 | 29.8% |
| Total Occupied Housing Units | 205 | 100.0% |
Occupancy by Household Size in Hardin
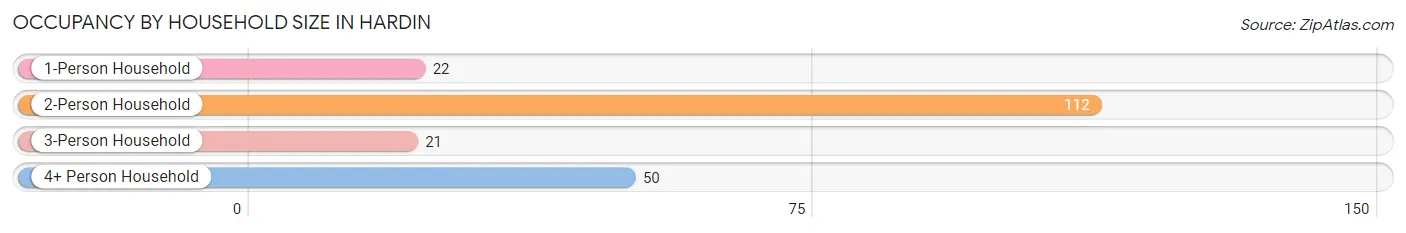
| Household Size | # Housing Units | % Housing Units |
| 1-Person Household | 22 | 10.7% |
| 2-Person Household | 112 | 54.6% |
| 3-Person Household | 21 | 10.2% |
| 4+ Person Household | 50 | 24.4% |
| Total Housing Units | 205 | 100.0% |
Occupancy by Ownership by Household Size in Hardin
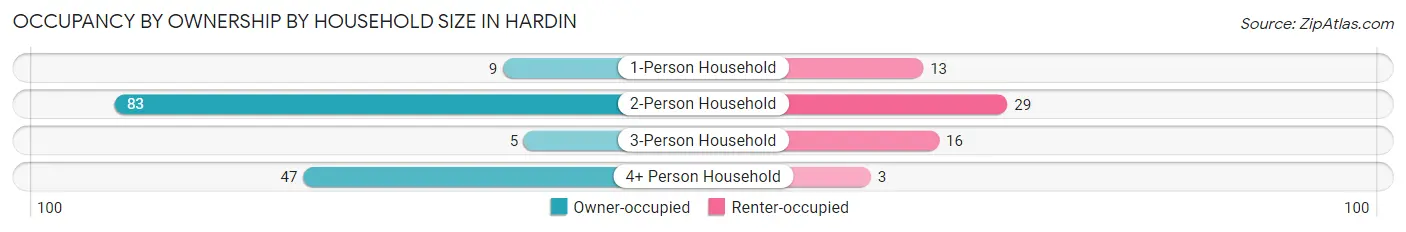
| Household Size | Owner-occupied | Renter-occupied |
| 1-Person Household | 9 (40.9%) | 13 (59.1%) |
| 2-Person Household | 83 (74.1%) | 29 (25.9%) |
| 3-Person Household | 5 (23.8%) | 16 (76.2%) |
| 4+ Person Household | 47 (94.0%) | 3 (6.0%) |
| Total Housing Units | 144 (70.2%) | 61 (29.8%) |
Occupancy by Educational Attainment in Hardin
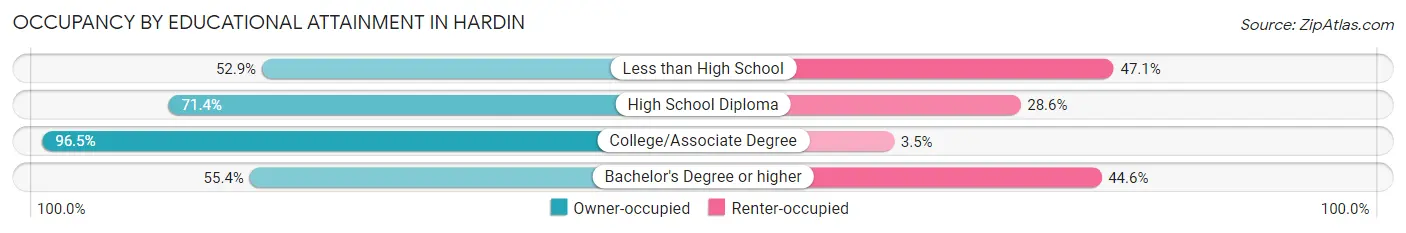
| Household Size | Owner-occupied | Renter-occupied |
| Less than High School | 18 (52.9%) | 16 (47.1%) |
| High School Diploma | 35 (71.4%) | 14 (28.6%) |
| College/Associate Degree | 55 (96.5%) | 2 (3.5%) |
| Bachelor's Degree or higher | 36 (55.4%) | 29 (44.6%) |
Occupancy by Age of Householder in Hardin
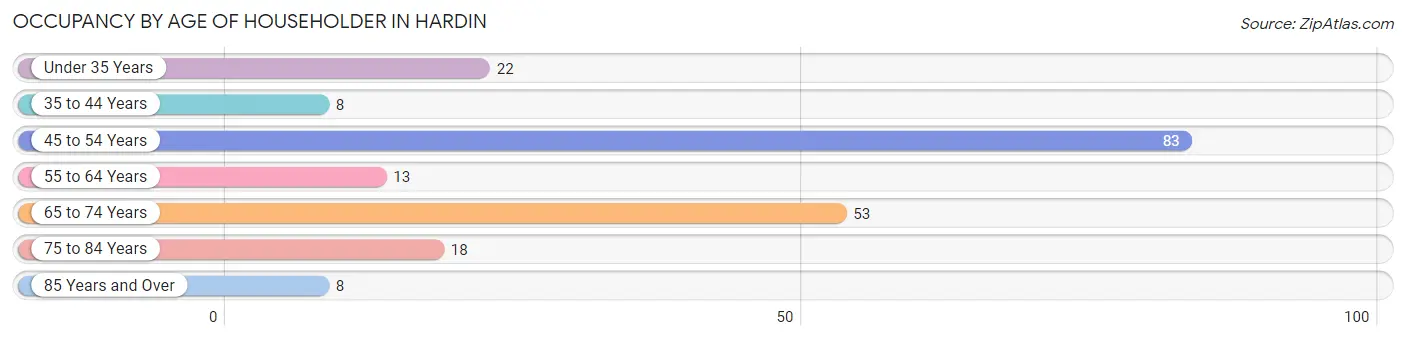
| Age Bracket | # Households | % Households |
| Under 35 Years | 22 | 10.7% |
| 35 to 44 Years | 8 | 3.9% |
| 45 to 54 Years | 83 | 40.5% |
| 55 to 64 Years | 13 | 6.3% |
| 65 to 74 Years | 53 | 25.9% |
| 75 to 84 Years | 18 | 8.8% |
| 85 Years and Over | 8 | 3.9% |
| Total | 205 | 100.0% |
Housing Finances in Hardin
Median Income by Occupancy in Hardin
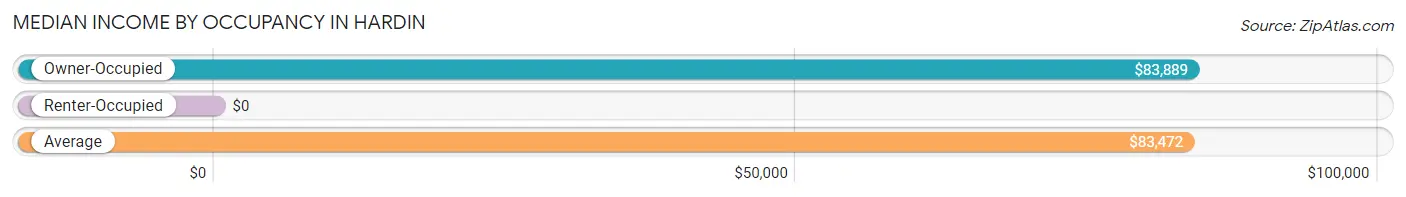
| Occupancy Type | # Households | Median Income |
| Owner-Occupied | 144 (70.2%) | $83,889 |
| Renter-Occupied | 61 (29.8%) | $0 |
| Average | 205 (100.0%) | $83,472 |
Occupancy by Householder Income Bracket in Hardin
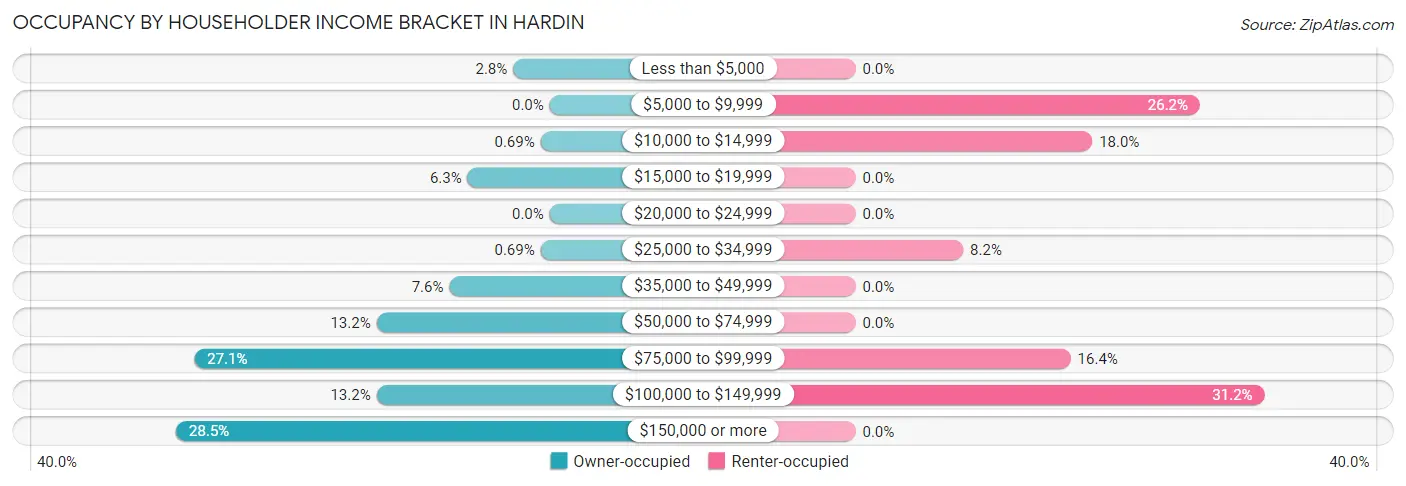
| Income Bracket | Owner-occupied | Renter-occupied |
| Less than $5,000 | 4 (2.8%) | 0 (0.0%) |
| $5,000 to $9,999 | 0 (0.0%) | 16 (26.2%) |
| $10,000 to $14,999 | 1 (0.7%) | 11 (18.0%) |
| $15,000 to $19,999 | 9 (6.2%) | 0 (0.0%) |
| $20,000 to $24,999 | 0 (0.0%) | 0 (0.0%) |
| $25,000 to $34,999 | 1 (0.7%) | 5 (8.2%) |
| $35,000 to $49,999 | 11 (7.6%) | 0 (0.0%) |
| $50,000 to $74,999 | 19 (13.2%) | 0 (0.0%) |
| $75,000 to $99,999 | 39 (27.1%) | 10 (16.4%) |
| $100,000 to $149,999 | 19 (13.2%) | 19 (31.1%) |
| $150,000 or more | 41 (28.5%) | 0 (0.0%) |
| Total | 144 (100.0%) | 61 (100.0%) |
Monthly Housing Cost Tiers in Hardin
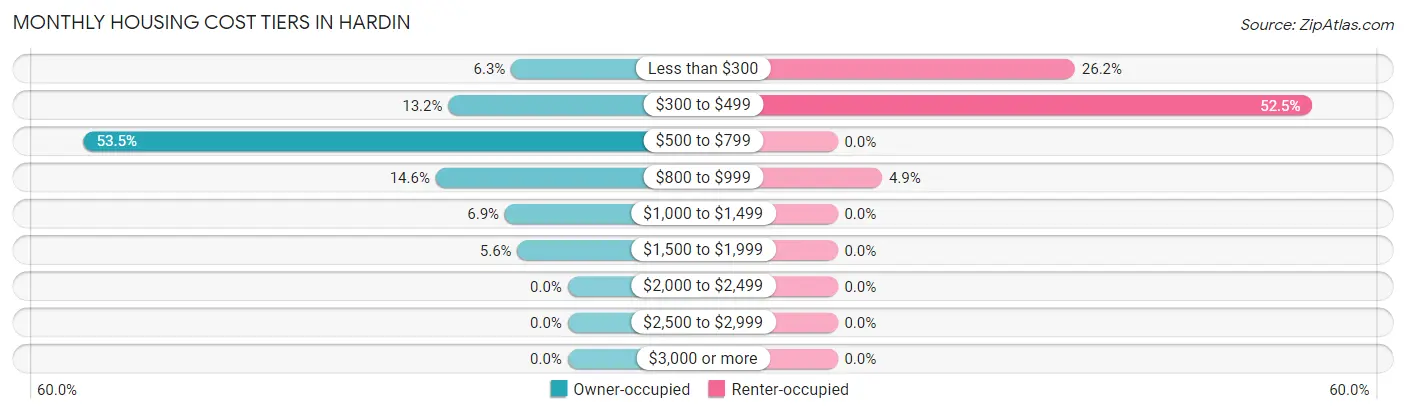
| Monthly Cost | Owner-occupied | Renter-occupied |
| Less than $300 | 9 (6.2%) | 16 (26.2%) |
| $300 to $499 | 19 (13.2%) | 32 (52.5%) |
| $500 to $799 | 77 (53.5%) | 0 (0.0%) |
| $800 to $999 | 21 (14.6%) | 3 (4.9%) |
| $1,000 to $1,499 | 10 (6.9%) | 0 (0.0%) |
| $1,500 to $1,999 | 8 (5.6%) | 0 (0.0%) |
| $2,000 to $2,499 | 0 (0.0%) | 0 (0.0%) |
| $2,500 to $2,999 | 0 (0.0%) | 0 (0.0%) |
| $3,000 or more | 0 (0.0%) | 0 (0.0%) |
| Total | 144 (100.0%) | 61 (100.0%) |
Physical Housing Characteristics in Hardin
Housing Structures in Hardin
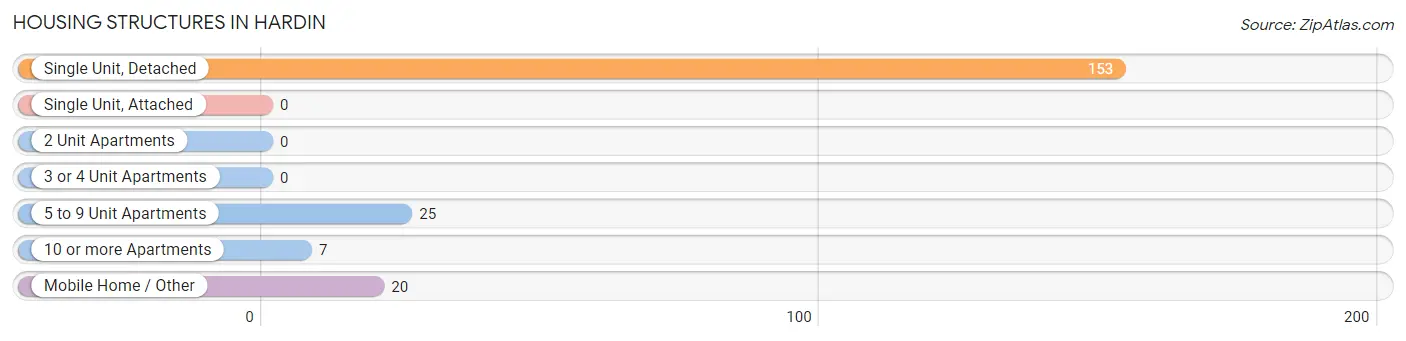
| Structure Type | # Housing Units | % Housing Units |
| Single Unit, Detached | 153 | 74.6% |
| Single Unit, Attached | 0 | 0.0% |
| 2 Unit Apartments | 0 | 0.0% |
| 3 or 4 Unit Apartments | 0 | 0.0% |
| 5 to 9 Unit Apartments | 25 | 12.2% |
| 10 or more Apartments | 7 | 3.4% |
| Mobile Home / Other | 20 | 9.8% |
| Total | 205 | 100.0% |
Housing Structures by Occupancy in Hardin
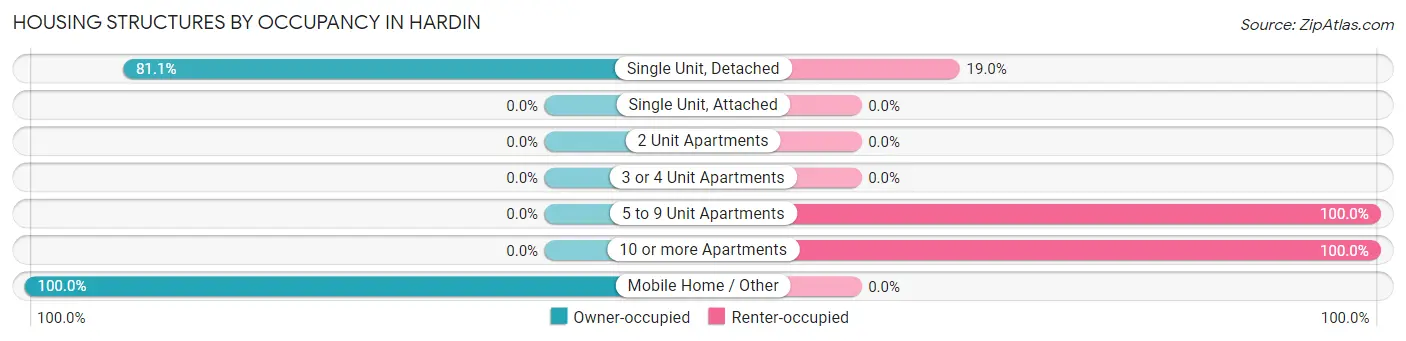
| Structure Type | Owner-occupied | Renter-occupied |
| Single Unit, Detached | 124 (81.0%) | 29 (19.0%) |
| Single Unit, Attached | 0 (0.0%) | 0 (0.0%) |
| 2 Unit Apartments | 0 (0.0%) | 0 (0.0%) |
| 3 or 4 Unit Apartments | 0 (0.0%) | 0 (0.0%) |
| 5 to 9 Unit Apartments | 0 (0.0%) | 25 (100.0%) |
| 10 or more Apartments | 0 (0.0%) | 7 (100.0%) |
| Mobile Home / Other | 20 (100.0%) | 0 (0.0%) |
| Total | 144 (70.2%) | 61 (29.8%) |
Housing Structures by Number of Rooms in Hardin
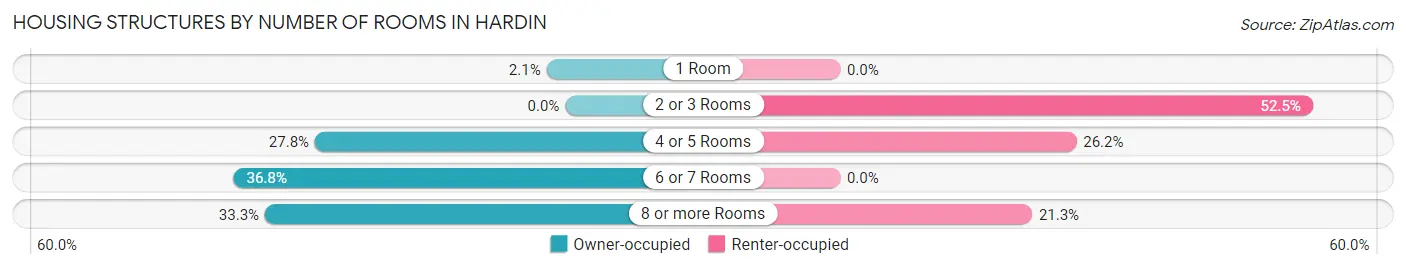
| Number of Rooms | Owner-occupied | Renter-occupied |
| 1 Room | 3 (2.1%) | 0 (0.0%) |
| 2 or 3 Rooms | 0 (0.0%) | 32 (52.5%) |
| 4 or 5 Rooms | 40 (27.8%) | 16 (26.2%) |
| 6 or 7 Rooms | 53 (36.8%) | 0 (0.0%) |
| 8 or more Rooms | 48 (33.3%) | 13 (21.3%) |
| Total | 144 (100.0%) | 61 (100.0%) |
Housing Structure by Heating Type in Hardin
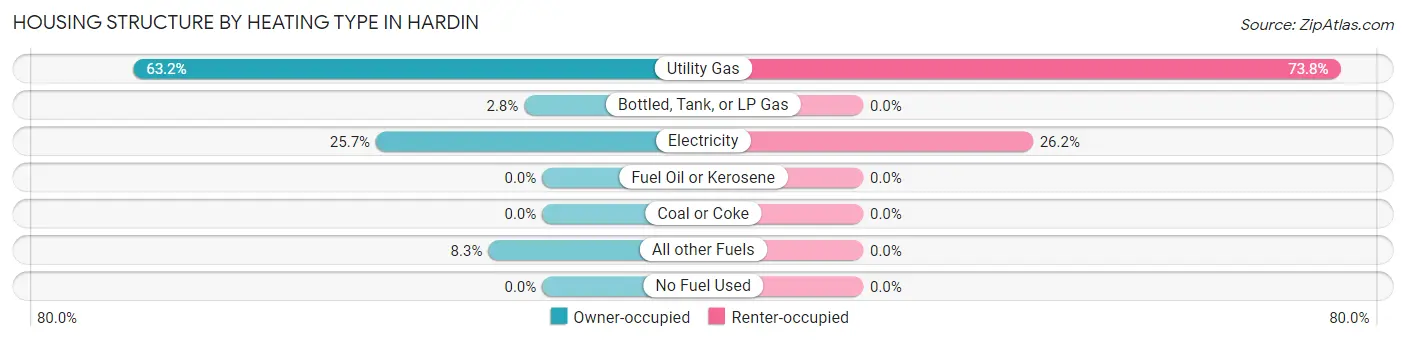
| Heating Type | Owner-occupied | Renter-occupied |
| Utility Gas | 91 (63.2%) | 45 (73.8%) |
| Bottled, Tank, or LP Gas | 4 (2.8%) | 0 (0.0%) |
| Electricity | 37 (25.7%) | 16 (26.2%) |
| Fuel Oil or Kerosene | 0 (0.0%) | 0 (0.0%) |
| Coal or Coke | 0 (0.0%) | 0 (0.0%) |
| All other Fuels | 12 (8.3%) | 0 (0.0%) |
| No Fuel Used | 0 (0.0%) | 0 (0.0%) |
| Total | 144 (100.0%) | 61 (100.0%) |
Household Vehicle Usage in Hardin
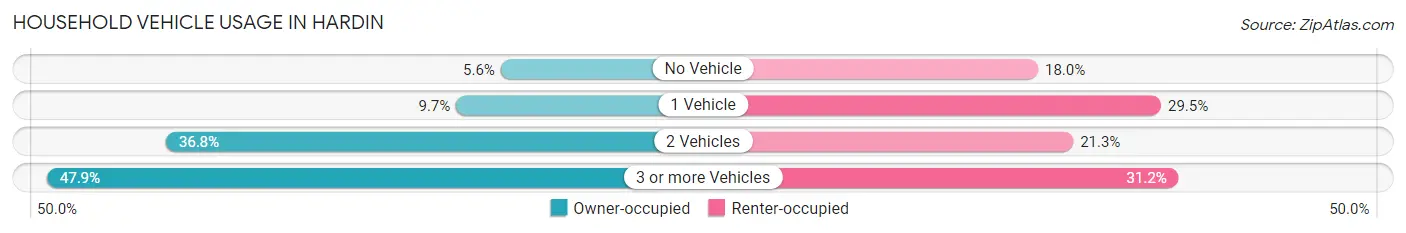
| Vehicles per Household | Owner-occupied | Renter-occupied |
| No Vehicle | 8 (5.6%) | 11 (18.0%) |
| 1 Vehicle | 14 (9.7%) | 18 (29.5%) |
| 2 Vehicles | 53 (36.8%) | 13 (21.3%) |
| 3 or more Vehicles | 69 (47.9%) | 19 (31.1%) |
| Total | 144 (100.0%) | 61 (100.0%) |
Real Estate & Mortgages in Hardin
Real Estate and Mortgage Overview in Hardin
| Characteristic | Without Mortgage | With Mortgage |
| Housing Units | 106 | 38 |
| Median Property Value | $84,000 | $100,000 |
| Median Household Income | $84,167 | $14 |
| Monthly Housing Costs | $569 | $0 |
| Real Estate Taxes | $2,298 | $0 |
Property Value by Mortgage Status in Hardin
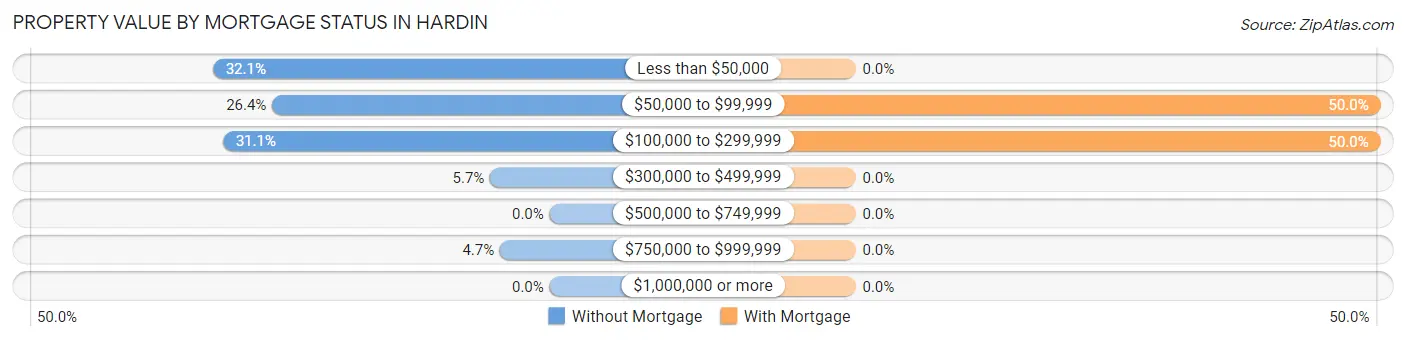
| Property Value | Without Mortgage | With Mortgage |
| Less than $50,000 | 34 (32.1%) | 0 (0.0%) |
| $50,000 to $99,999 | 28 (26.4%) | 19 (50.0%) |
| $100,000 to $299,999 | 33 (31.1%) | 19 (50.0%) |
| $300,000 to $499,999 | 6 (5.7%) | 0 (0.0%) |
| $500,000 to $749,999 | 0 (0.0%) | 0 (0.0%) |
| $750,000 to $999,999 | 5 (4.7%) | 0 (0.0%) |
| $1,000,000 or more | 0 (0.0%) | 0 (0.0%) |
| Total | 106 (100.0%) | 38 (100.0%) |
Household Income by Mortgage Status in Hardin
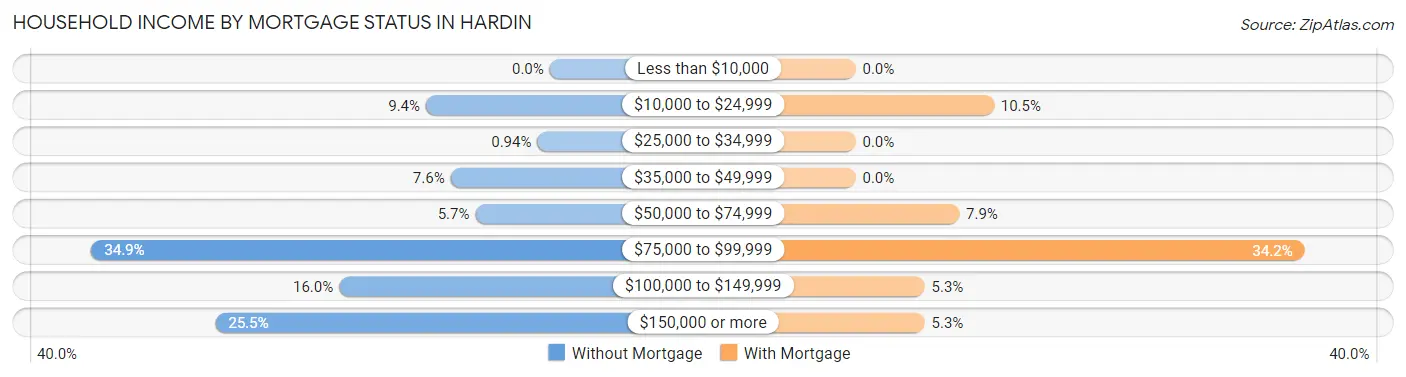
| Household Income | Without Mortgage | With Mortgage |
| Less than $10,000 | 0 (0.0%) | 0 (0.0%) |
| $10,000 to $24,999 | 10 (9.4%) | 4 (10.5%) |
| $25,000 to $34,999 | 1 (0.9%) | 0 (0.0%) |
| $35,000 to $49,999 | 8 (7.5%) | 0 (0.0%) |
| $50,000 to $74,999 | 6 (5.7%) | 3 (7.9%) |
| $75,000 to $99,999 | 37 (34.9%) | 13 (34.2%) |
| $100,000 to $149,999 | 17 (16.0%) | 2 (5.3%) |
| $150,000 or more | 27 (25.5%) | 2 (5.3%) |
| Total | 106 (100.0%) | 38 (100.0%) |
Property Value to Household Income Ratio in Hardin
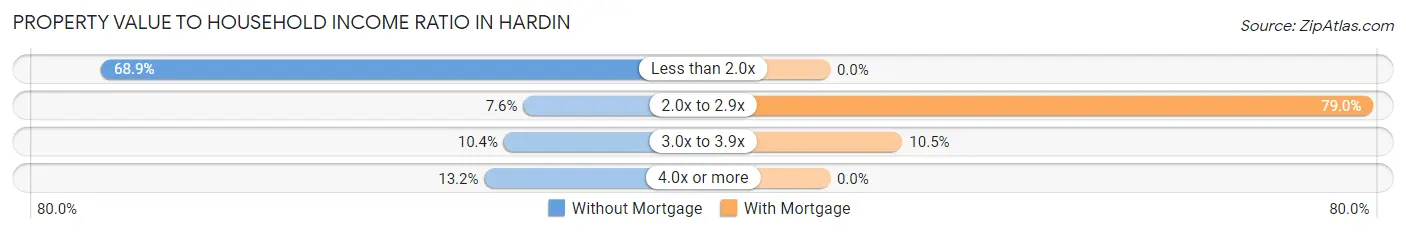
| Value-to-Income Ratio | Without Mortgage | With Mortgage |
| Less than 2.0x | 73 (68.9%) | 0 (0.0%) |
| 2.0x to 2.9x | 8 (7.5%) | 30 (78.9%) |
| 3.0x to 3.9x | 11 (10.4%) | 4 (10.5%) |
| 4.0x or more | 14 (13.2%) | 0 (0.0%) |
| Total | 106 (100.0%) | 38 (100.0%) |
Real Estate Taxes by Mortgage Status in Hardin
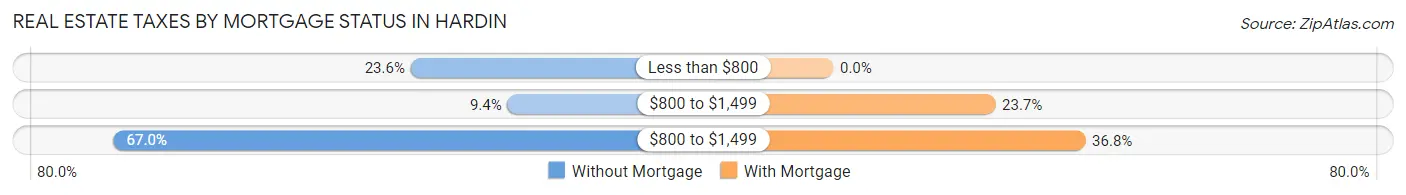
| Property Taxes | Without Mortgage | With Mortgage |
| Less than $800 | 25 (23.6%) | 0 (0.0%) |
| $800 to $1,499 | 10 (9.4%) | 9 (23.7%) |
| $800 to $1,499 | 71 (67.0%) | 14 (36.8%) |
| Total | 106 (100.0%) | 38 (100.0%) |
Health & Disability in Hardin
Health Insurance Coverage by Age in Hardin
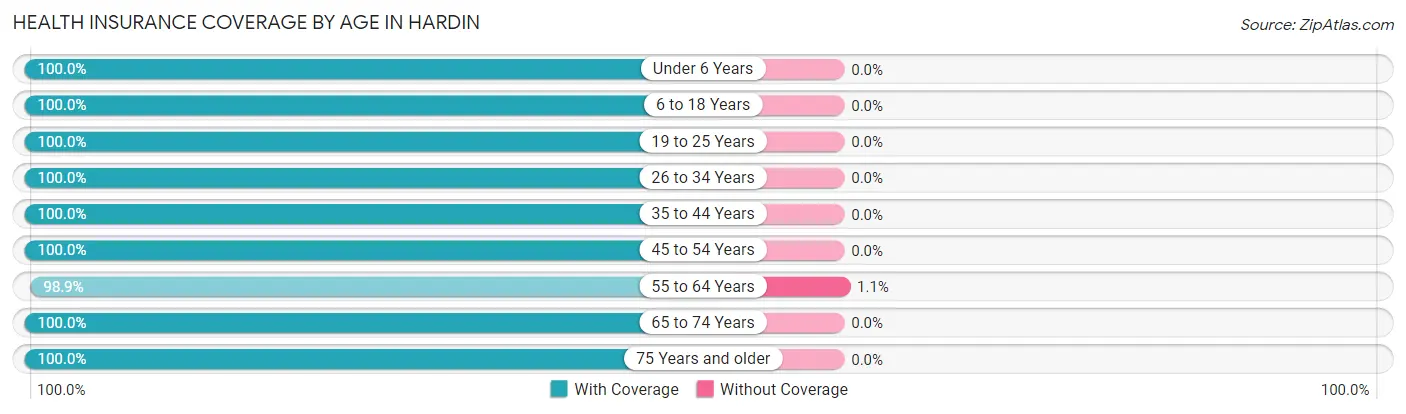
| Age Bracket | With Coverage | Without Coverage |
| Under 6 Years | 55 (100.0%) | 0 (0.0%) |
| 6 to 18 Years | 67 (100.0%) | 0 (0.0%) |
| 19 to 25 Years | 29 (100.0%) | 0 (0.0%) |
| 26 to 34 Years | 77 (100.0%) | 0 (0.0%) |
| 35 to 44 Years | 23 (100.0%) | 0 (0.0%) |
| 45 to 54 Years | 182 (100.0%) | 0 (0.0%) |
| 55 to 64 Years | 92 (98.9%) | 1 (1.1%) |
| 65 to 74 Years | 125 (100.0%) | 0 (0.0%) |
| 75 Years and older | 46 (100.0%) | 0 (0.0%) |
| Total | 696 (99.9%) | 1 (0.1%) |
Health Insurance Coverage by Citizenship Status in Hardin
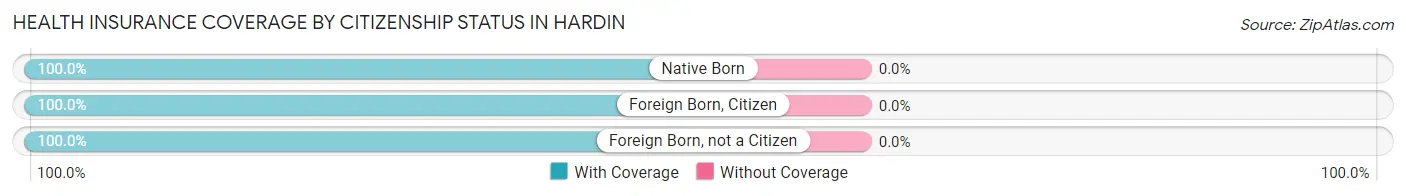
| Citizenship Status | With Coverage | Without Coverage |
| Native Born | 55 (100.0%) | 0 (0.0%) |
| Foreign Born, Citizen | 67 (100.0%) | 0 (0.0%) |
| Foreign Born, not a Citizen | 29 (100.0%) | 0 (0.0%) |
Health Insurance Coverage by Household Income in Hardin
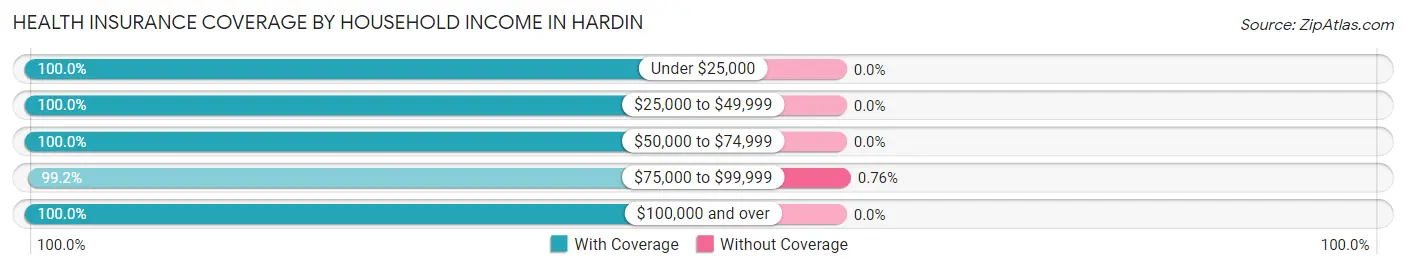
| Household Income | With Coverage | Without Coverage |
| Under $25,000 | 137 (100.0%) | 0 (0.0%) |
| $25,000 to $49,999 | 43 (100.0%) | 0 (0.0%) |
| $50,000 to $74,999 | 82 (100.0%) | 0 (0.0%) |
| $75,000 to $99,999 | 131 (99.2%) | 1 (0.8%) |
| $100,000 and over | 292 (100.0%) | 0 (0.0%) |
Public vs Private Health Insurance Coverage by Age in Hardin
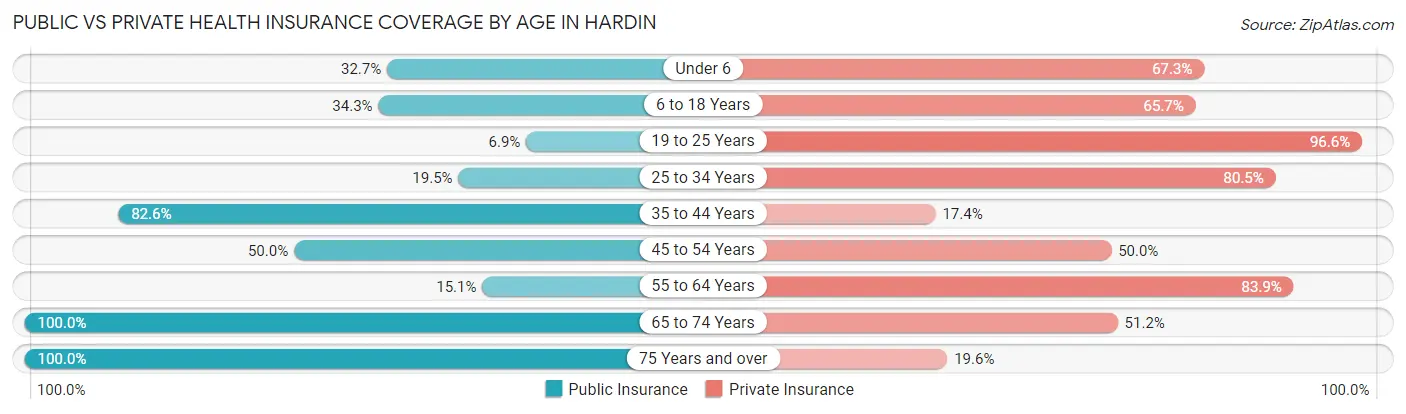
| Age Bracket | Public Insurance | Private Insurance |
| Under 6 | 18 (32.7%) | 37 (67.3%) |
| 6 to 18 Years | 23 (34.3%) | 44 (65.7%) |
| 19 to 25 Years | 2 (6.9%) | 28 (96.6%) |
| 25 to 34 Years | 15 (19.5%) | 62 (80.5%) |
| 35 to 44 Years | 19 (82.6%) | 4 (17.4%) |
| 45 to 54 Years | 91 (50.0%) | 91 (50.0%) |
| 55 to 64 Years | 14 (15.0%) | 78 (83.9%) |
| 65 to 74 Years | 125 (100.0%) | 64 (51.2%) |
| 75 Years and over | 46 (100.0%) | 9 (19.6%) |
| Total | 353 (50.6%) | 417 (59.8%) |
Disability Status by Sex by Age in Hardin
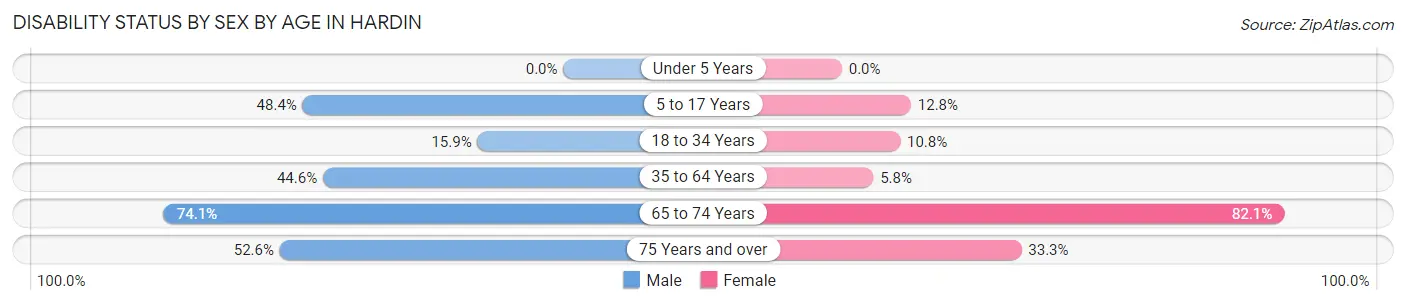
| Age Bracket | Male | Female |
| Under 5 Years | 0 (0.0%) | 0 (0.0%) |
| 5 to 17 Years | 15 (48.4%) | 5 (12.8%) |
| 18 to 34 Years | 11 (15.9%) | 4 (10.8%) |
| 35 to 64 Years | 87 (44.6%) | 6 (5.8%) |
| 65 to 74 Years | 43 (74.1%) | 55 (82.1%) |
| 75 Years and over | 10 (52.6%) | 9 (33.3%) |
Disability Class by Sex by Age in Hardin
Disability Class: Hearing Difficulty
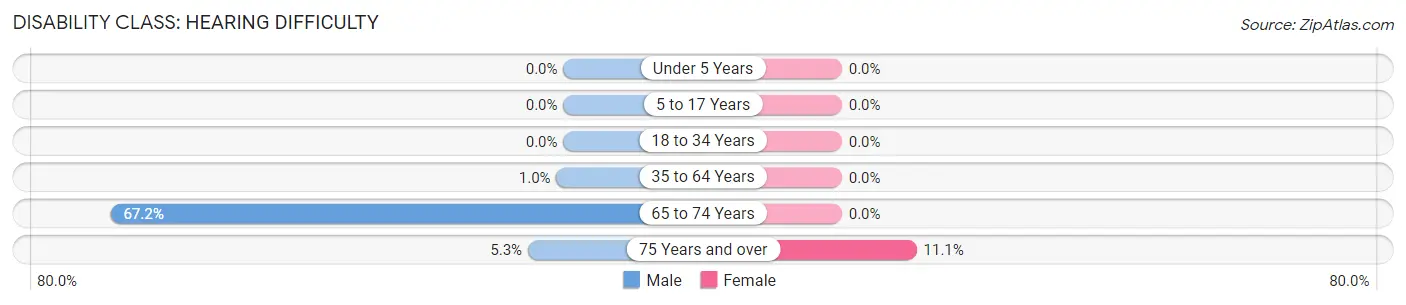
| Age Bracket | Male | Female |
| Under 5 Years | 0 (0.0%) | 0 (0.0%) |
| 5 to 17 Years | 0 (0.0%) | 0 (0.0%) |
| 18 to 34 Years | 0 (0.0%) | 0 (0.0%) |
| 35 to 64 Years | 2 (1.0%) | 0 (0.0%) |
| 65 to 74 Years | 39 (67.2%) | 0 (0.0%) |
| 75 Years and over | 1 (5.3%) | 3 (11.1%) |
Disability Class: Vision Difficulty
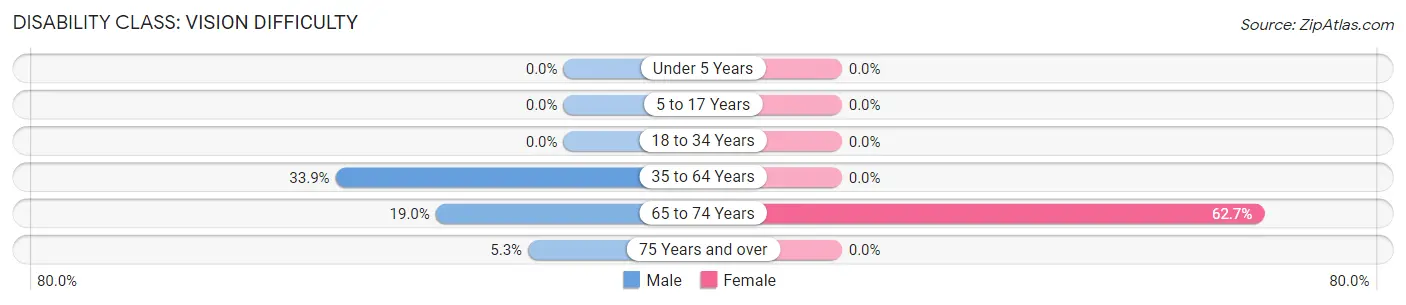
| Age Bracket | Male | Female |
| Under 5 Years | 0 (0.0%) | 0 (0.0%) |
| 5 to 17 Years | 0 (0.0%) | 0 (0.0%) |
| 18 to 34 Years | 0 (0.0%) | 0 (0.0%) |
| 35 to 64 Years | 66 (33.9%) | 0 (0.0%) |
| 65 to 74 Years | 11 (19.0%) | 42 (62.7%) |
| 75 Years and over | 1 (5.3%) | 0 (0.0%) |
Disability Class: Cognitive Difficulty
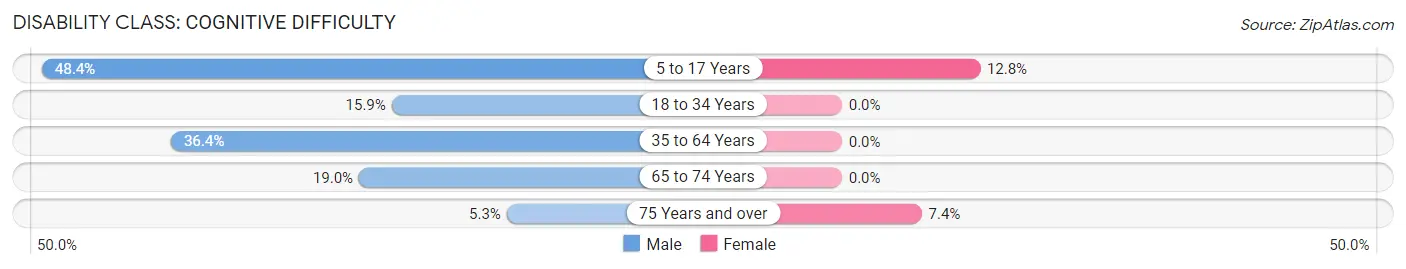
| Age Bracket | Male | Female |
| 5 to 17 Years | 15 (48.4%) | 5 (12.8%) |
| 18 to 34 Years | 11 (15.9%) | 0 (0.0%) |
| 35 to 64 Years | 71 (36.4%) | 0 (0.0%) |
| 65 to 74 Years | 11 (19.0%) | 0 (0.0%) |
| 75 Years and over | 1 (5.3%) | 2 (7.4%) |
Disability Class: Ambulatory Difficulty
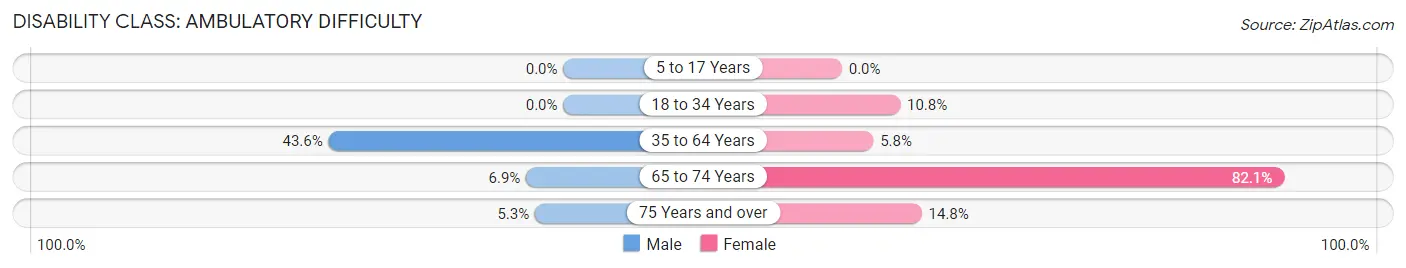
| Age Bracket | Male | Female |
| 5 to 17 Years | 0 (0.0%) | 0 (0.0%) |
| 18 to 34 Years | 0 (0.0%) | 4 (10.8%) |
| 35 to 64 Years | 85 (43.6%) | 6 (5.8%) |
| 65 to 74 Years | 4 (6.9%) | 55 (82.1%) |
| 75 Years and over | 1 (5.3%) | 4 (14.8%) |
Disability Class: Self-Care Difficulty
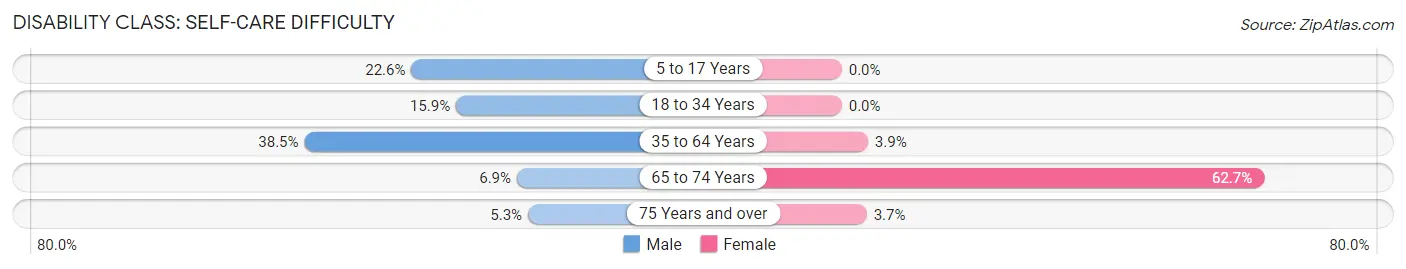
| Age Bracket | Male | Female |
| 5 to 17 Years | 7 (22.6%) | 0 (0.0%) |
| 18 to 34 Years | 11 (15.9%) | 0 (0.0%) |
| 35 to 64 Years | 75 (38.5%) | 4 (3.9%) |
| 65 to 74 Years | 4 (6.9%) | 42 (62.7%) |
| 75 Years and over | 1 (5.3%) | 1 (3.7%) |
Technology Access in Hardin
Computing Device Access in Hardin
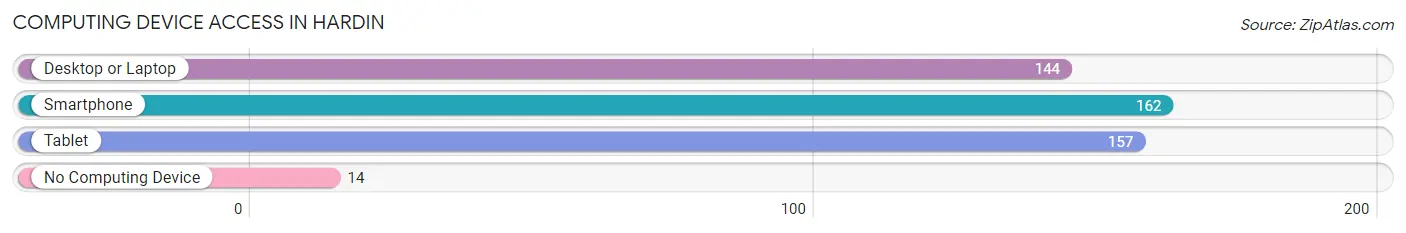
| Device Type | # Households | % Households |
| Desktop or Laptop | 144 | 70.2% |
| Smartphone | 162 | 79.0% |
| Tablet | 157 | 76.6% |
| No Computing Device | 14 | 6.8% |
| Total | 205 | 100.0% |
Internet Access in Hardin
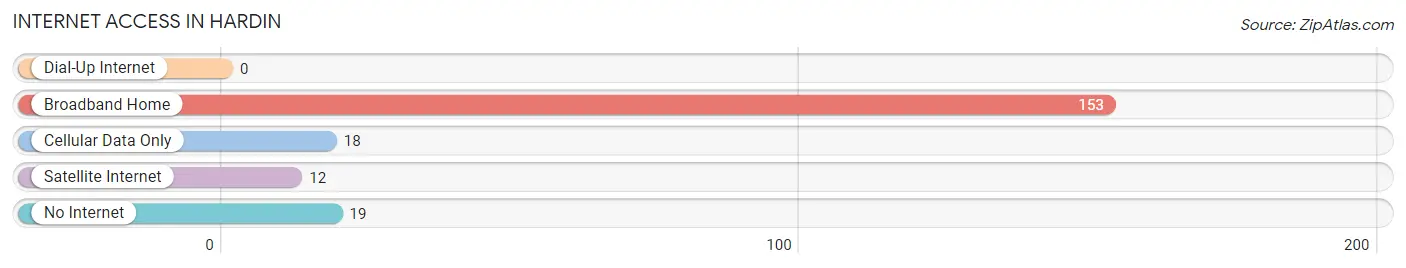
| Internet Type | # Households | % Households |
| Dial-Up Internet | 0 | 0.0% |
| Broadband Home | 153 | 74.6% |
| Cellular Data Only | 18 | 8.8% |
| Satellite Internet | 12 | 5.9% |
| No Internet | 19 | 9.3% |
| Total | 205 | 100.0% |
Hardin Summary
Hardin, Illinois is a small village located in Calhoun County, Illinois. It is situated on the banks of the Mississippi River, approximately 25 miles south of St. Louis, Missouri. The village has a population of approximately 500 people and covers an area of 0.6 square miles.
History
The area that is now Hardin was first settled in the early 1800s by a group of French-Canadian fur traders. The village was originally known as “La Prairie” and was located on the banks of the Mississippi River. In 1818, the village was renamed “Hardin” after Colonel John Hardin, a Revolutionary War hero.
In the mid-1800s, Hardin became a popular stop for steamboats traveling up and down the Mississippi River. The village was also home to a number of businesses, including a sawmill, a gristmill, a blacksmith shop, and a general store.
In the late 1800s, Hardin experienced a period of growth and prosperity. The village was home to a number of businesses, including a hotel, a bank, a newspaper, and a number of stores. The village also had its own school and post office.
In the early 1900s, Hardin experienced a period of decline. The steamboat industry declined, and the village’s businesses began to close. In the 1950s, the village was almost completely abandoned.
Geography
Hardin is located in Calhoun County, Illinois. It is situated on the banks of the Mississippi River, approximately 25 miles south of St. Louis, Missouri. The village covers an area of 0.6 square miles and has a population of approximately 500 people.
The village is located in a rural area and is surrounded by farmland. The nearest major city is St. Louis, which is located 25 miles to the north. The nearest airport is Lambert-St. Louis International Airport, which is located approximately 30 miles away.
Economy
The economy of Hardin is largely based on agriculture. The village is surrounded by farmland, and many of the residents are employed in the agricultural industry. The village also has a number of small businesses, including a general store, a gas station, and a restaurant.
Demographics
As of the 2010 census, the population of Hardin was 498. The racial makeup of the village was 97.2% White, 0.2% African American, 0.2% Native American, 0.2% Asian, 0.2% from other races, and 1.8% from two or more races. Hispanic or Latino of any race were 0.8% of the population.
The median household income in Hardin was $37,500, and the median family income was $41,250. The per capita income for the village was $17,857. About 11.2% of families and 13.2% of the population were below the poverty line, including 16.7% of those under age 18 and none of those age 65 or over.
Conclusion
Hardin, Illinois is a small village located in Calhoun County, Illinois. It is situated on the banks of the Mississippi River, approximately 25 miles south of St. Louis, Missouri. The village has a population of approximately 500 people and covers an area of 0.6 square miles. The economy of Hardin is largely based on agriculture, and the village is surrounded by farmland. The racial makeup of the village is predominantly White, with a small percentage of African American, Native American, and Asian residents. The median household income in Hardin is $37,500, and the per capita income is $17,857.
Common Questions
What is Per Capita Income in Hardin?
Per Capita income in Hardin is $31,370.
What is the Median Family Income in Hardin?
Median Family Income in Hardin is $84,028.
What is the Median Household income in Hardin?
Median Household Income in Hardin is $83,472.
What is Income or Wage Gap in Hardin?
Income or Wage Gap in Hardin is 45.6%.
Women in Hardin earn 54.4 cents for every dollar earned by a man.
What is Inequality or Gini Index in Hardin?
Inequality or Gini Index in Hardin is 0.38.
What is the Total Population of Hardin?
Total Population of Hardin is 774.
What is the Total Male Population of Hardin?
Total Male Population of Hardin is 418.
What is the Total Female Population of Hardin?
Total Female Population of Hardin is 356.
What is the Ratio of Males per 100 Females in Hardin?
There are 117.42 Males per 100 Females in Hardin.
What is the Ratio of Females per 100 Males in Hardin?
There are 85.17 Females per 100 Males in Hardin.
What is the Median Population Age in Hardin?
Median Population Age in Hardin is 54.4 Years.
What is the Average Family Size in Hardin
Average Family Size in Hardin is 3.6 People.
What is the Average Household Size in Hardin
Average Household Size in Hardin is 3.4 People.
How Large is the Labor Force in Hardin?
There are 296 People in the Labor Forcein in Hardin.
What is the Percentage of People in the Labor Force in Hardin?
43.4% of People are in the Labor Force in Hardin.
What is the Unemployment Rate in Hardin?
Unemployment Rate in Hardin is 0.7%.