Hanna City, IL Map & Demographics
Hanna City Map
Hanna City Overview
$37,729
PER CAPITA INCOME
$85,694
AVG FAMILY INCOME
$67,500
AVG HOUSEHOLD INCOME
46.3%
WAGE / INCOME GAP [ % ]
53.7¢/ $1
WAGE / INCOME GAP [ $ ]
$7,586
FAMILY INCOME DEFICIT
0.33
INEQUALITY / GINI INDEX
1,417
TOTAL POPULATION
722
MALE POPULATION
695
FEMALE POPULATION
103.88
MALES / 100 FEMALES
96.26
FEMALES / 100 MALES
54.9
MEDIAN AGE
2.5
AVG FAMILY SIZE
1.9
AVG HOUSEHOLD SIZE
767
LABOR FORCE [ PEOPLE ]
60.0%
PERCENT IN LABOR FORCE
2.0%
UNEMPLOYMENT RATE
Hanna City Zip Codes
Hanna City Area Codes
Income in Hanna City
Income Overview in Hanna City
Per Capita Income in Hanna City is $37,729, while median incomes of families and households are $85,694 and $67,500 respectively.
| Characteristic | Number | Measure |
| Per Capita Income | 1,417 | $37,729 |
| Median Family Income | 391 | $85,694 |
| Mean Family Income | 391 | $85,888 |
| Median Household Income | 762 | $67,500 |
| Mean Household Income | 762 | $69,577 |
| Income Deficit | 391 | $7,586 |
| Wage / Income Gap (%) | 1,417 | 46.28% |
| Wage / Income Gap ($) | 1,417 | 53.72¢ per $1 |
| Gini / Inequality Index | 1,417 | 0.33 |
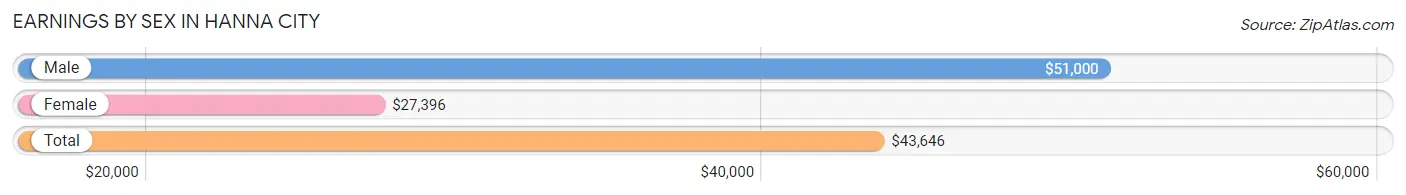
Earnings by Sex in Hanna City
Average Earnings in Hanna City are $43,646, $51,000 for men and $27,396 for women, a difference of 46.3%.
| Sex | Number | Average Earnings |
| Male | 436 (52.7%) | $51,000 |
| Female | 391 (47.3%) | $27,396 |
| Total | 827 (100.0%) | $43,646 |
Earnings by Sex by Income Bracket in Hanna City
The most common earnings brackets in Hanna City are $65,000 to $74,999 for men (122 | 28.0%) and $10,000 to $12,499 for women (58 | 14.8%).
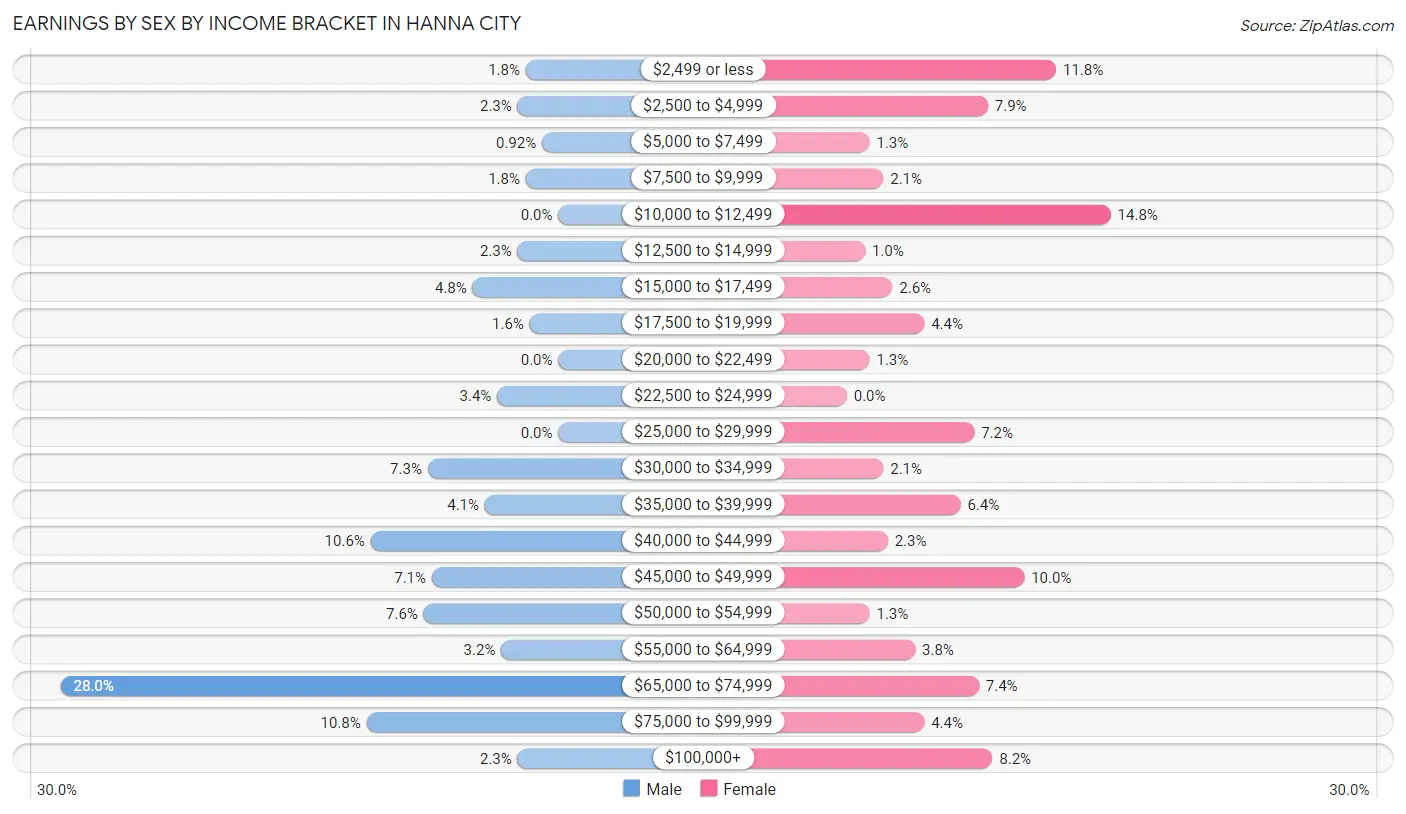
| Income | Male | Female |
| $2,499 or less | 8 (1.8%) | 46 (11.8%) |
| $2,500 to $4,999 | 10 (2.3%) | 31 (7.9%) |
| $5,000 to $7,499 | 4 (0.9%) | 5 (1.3%) |
| $7,500 to $9,999 | 8 (1.8%) | 8 (2.1%) |
| $10,000 to $12,499 | 0 (0.0%) | 58 (14.8%) |
| $12,500 to $14,999 | 10 (2.3%) | 4 (1.0%) |
| $15,000 to $17,499 | 21 (4.8%) | 10 (2.6%) |
| $17,500 to $19,999 | 7 (1.6%) | 17 (4.3%) |
| $20,000 to $22,499 | 0 (0.0%) | 5 (1.3%) |
| $22,500 to $24,999 | 15 (3.4%) | 0 (0.0%) |
| $25,000 to $29,999 | 0 (0.0%) | 28 (7.2%) |
| $30,000 to $34,999 | 32 (7.3%) | 8 (2.1%) |
| $35,000 to $39,999 | 18 (4.1%) | 25 (6.4%) |
| $40,000 to $44,999 | 46 (10.5%) | 9 (2.3%) |
| $45,000 to $49,999 | 31 (7.1%) | 39 (10.0%) |
| $50,000 to $54,999 | 33 (7.6%) | 5 (1.3%) |
| $55,000 to $64,999 | 14 (3.2%) | 15 (3.8%) |
| $65,000 to $74,999 | 122 (28.0%) | 29 (7.4%) |
| $75,000 to $99,999 | 47 (10.8%) | 17 (4.3%) |
| $100,000+ | 10 (2.3%) | 32 (8.2%) |
| Total | 436 (100.0%) | 391 (100.0%) |
Earnings by Sex by Educational Attainment in Hanna City
Average earnings in Hanna City are $52,981 for men and $37,955 for women, a difference of 28.4%. Men with an educational attainment of graduate degree enjoy the highest average annual earnings of $70,446, while those with college or associate's degree education earn the least with $45,250. Women with an educational attainment of bachelor's degree earn the most with the average annual earnings of $67,917, while those with high school diploma education have the smallest earnings of $26,667.
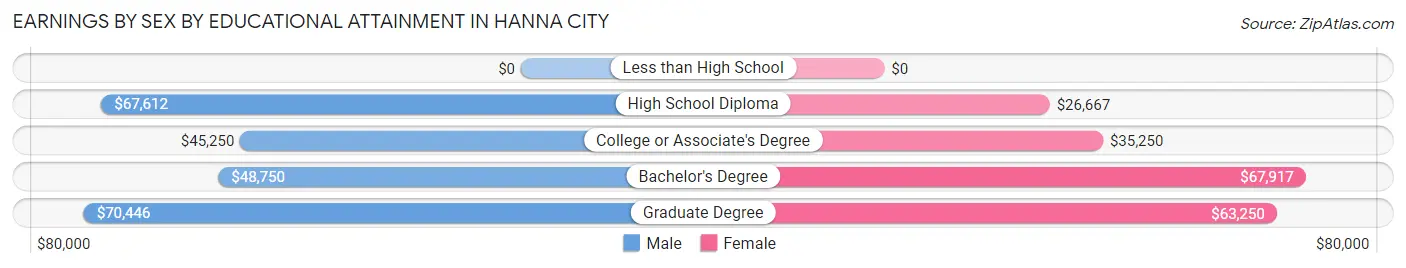
| Educational Attainment | Male Income | Female Income |
| Less than High School | - | - |
| High School Diploma | $67,612 | $26,667 |
| College or Associate's Degree | $45,250 | $35,250 |
| Bachelor's Degree | $48,750 | $67,917 |
| Graduate Degree | $70,446 | $63,250 |
| Total | $52,981 | $37,955 |
Family Income in Hanna City
Family Income Brackets in Hanna City
According to the Hanna City family income data, there are 110 families falling into the $75,000 to $99,999 income range, which is the most common income bracket and makes up 28.1% of all families. Conversely, the less than $10,000 income bracket is the least frequent group with only 3 families (0.8%) belonging to this category.
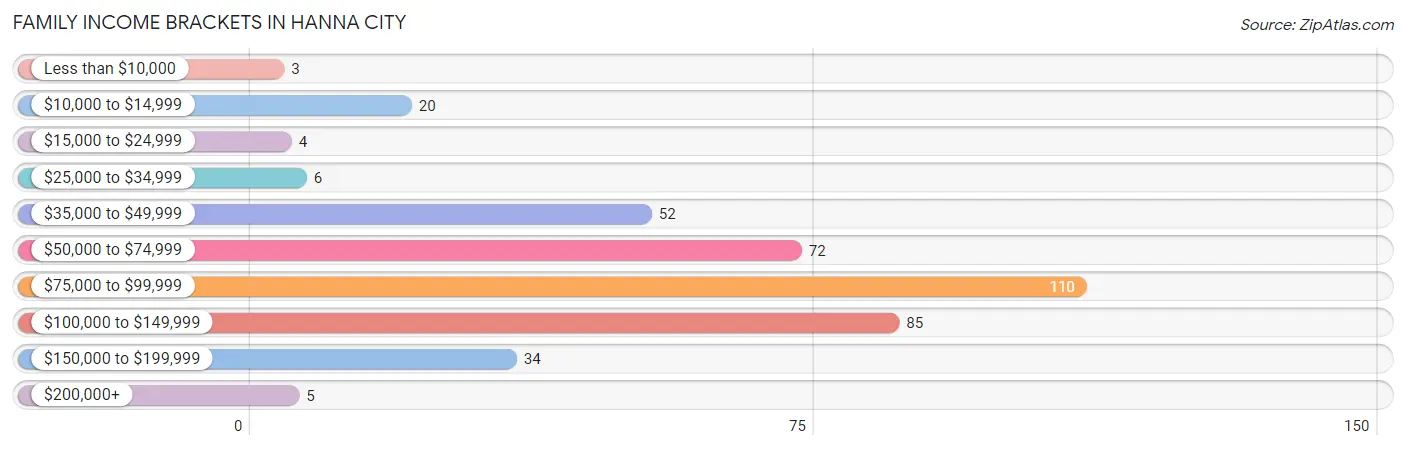
| Income Bracket | # Families | % Families |
| Less than $10,000 | 3 | 0.8% |
| $10,000 to $14,999 | 20 | 5.1% |
| $15,000 to $24,999 | 4 | 1.0% |
| $25,000 to $34,999 | 6 | 1.5% |
| $35,000 to $49,999 | 52 | 13.3% |
| $50,000 to $74,999 | 72 | 18.4% |
| $75,000 to $99,999 | 110 | 28.1% |
| $100,000 to $149,999 | 85 | 21.7% |
| $150,000 to $199,999 | 34 | 8.7% |
| $200,000+ | 5 | 1.3% |
Family Income by Famaliy Size in Hanna City
4-person families (33 | 8.4%) account for the highest median family income in Hanna City with $103,281 per family, while 2-person families (272 | 69.6%) have the highest median income of $36,562 per family member.
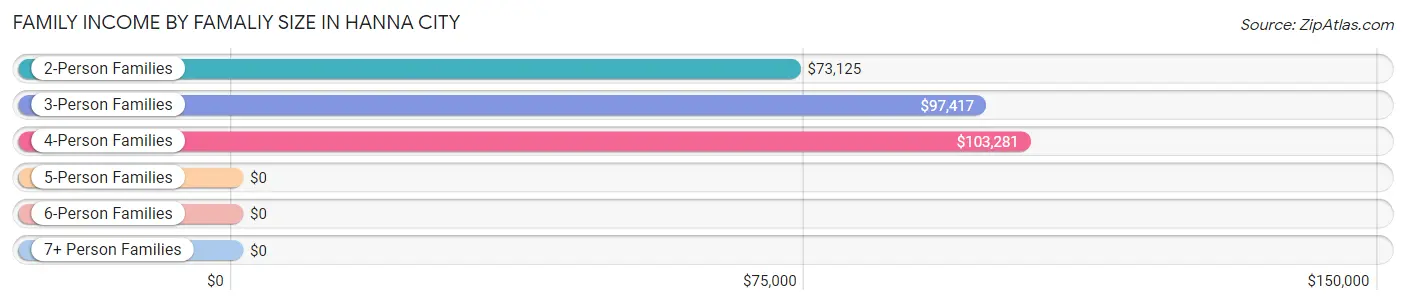
| Income Bracket | # Families | Median Income |
| 2-Person Families | 272 (69.6%) | $73,125 |
| 3-Person Families | 71 (18.2%) | $97,417 |
| 4-Person Families | 33 (8.4%) | $103,281 |
| 5-Person Families | 14 (3.6%) | $0 |
| 6-Person Families | 0 (0.0%) | $0 |
| 7+ Person Families | 1 (0.3%) | $0 |
| Total | 391 (100.0%) | $85,694 |
Family Income by Number of Earners in Hanna City
The median family income in Hanna City is $85,694, with families comprising 3+ earners (56) having the highest median family income of $100,500, while families with no earners (91) have the lowest median family income of $49,479, accounting for 14.3% and 23.3% of families, respectively.
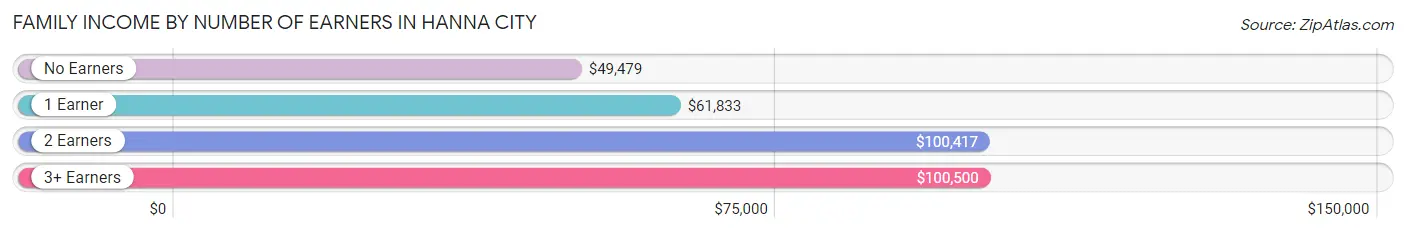
| Number of Earners | # Families | Median Income |
| No Earners | 91 (23.3%) | $49,479 |
| 1 Earner | 106 (27.1%) | $61,833 |
| 2 Earners | 138 (35.3%) | $100,417 |
| 3+ Earners | 56 (14.3%) | $100,500 |
| Total | 391 (100.0%) | $85,694 |
Household Income in Hanna City
Household Income Brackets in Hanna City
With 207 households falling in the category, the $50,000 to $74,999 income range is the most frequent in Hanna City, accounting for 27.2% of all households. In contrast, only 5 households (0.7%) fall into the $200,000+ income bracket, making it the least populous group.
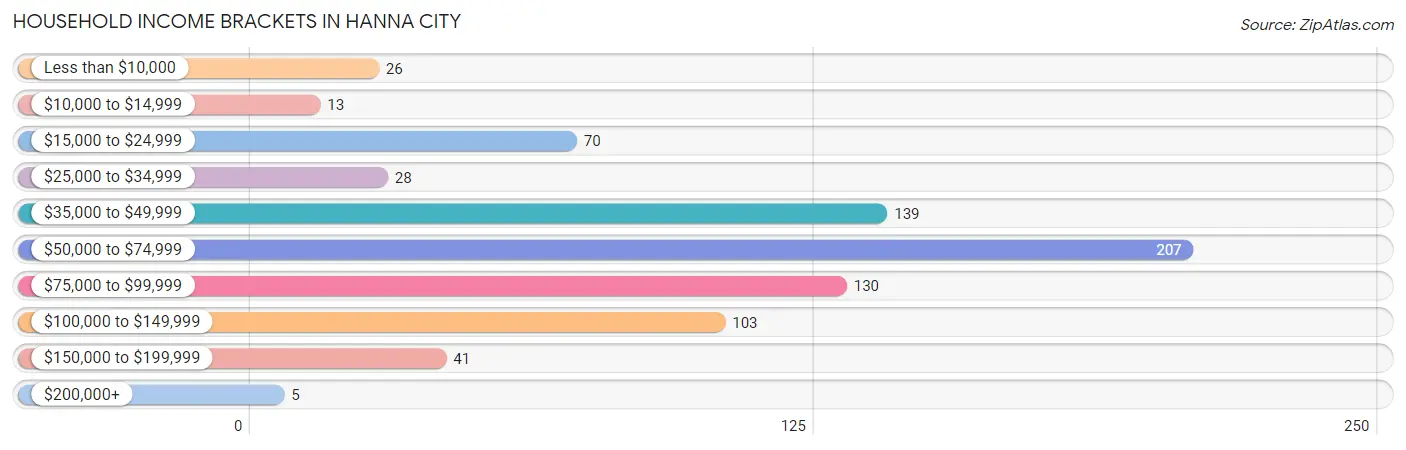
| Income Bracket | # Households | % Households |
| Less than $10,000 | 26 | 3.4% |
| $10,000 to $14,999 | 13 | 1.7% |
| $15,000 to $24,999 | 70 | 9.2% |
| $25,000 to $34,999 | 28 | 3.7% |
| $35,000 to $49,999 | 139 | 18.2% |
| $50,000 to $74,999 | 207 | 27.2% |
| $75,000 to $99,999 | 130 | 17.1% |
| $100,000 to $149,999 | 103 | 13.5% |
| $150,000 to $199,999 | 41 | 5.4% |
| $200,000+ | 5 | 0.7% |
Household Income by Householder Age in Hanna City
The median household income in Hanna City is $67,500, with the highest median household income of $85,833 found in the 25 to 44 years age bracket for the primary householder. A total of 130 households (17.1%) fall into this category. Meanwhile, the 15 to 24 years age bracket for the primary householder has the lowest median household income of $0, with 31 households (4.1%) in this group.
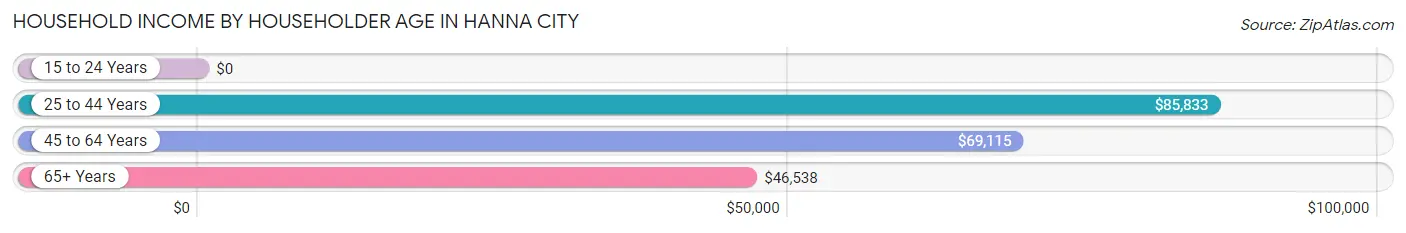
| Income Bracket | # Households | Median Income |
| 15 to 24 Years | 31 (4.1%) | $0 |
| 25 to 44 Years | 130 (17.1%) | $85,833 |
| 45 to 64 Years | 351 (46.1%) | $69,115 |
| 65+ Years | 250 (32.8%) | $46,538 |
| Total | 762 (100.0%) | $67,500 |
Poverty in Hanna City
Income Below Poverty by Sex and Age in Hanna City
With 7.5% poverty level for males and 10.6% for females among the residents of Hanna City, under 5 year old males and 18 to 24 year old females are the most vulnerable to poverty, with 15 males (38.5%) and 21 females (27.3%) in their respective age groups living below the poverty level.
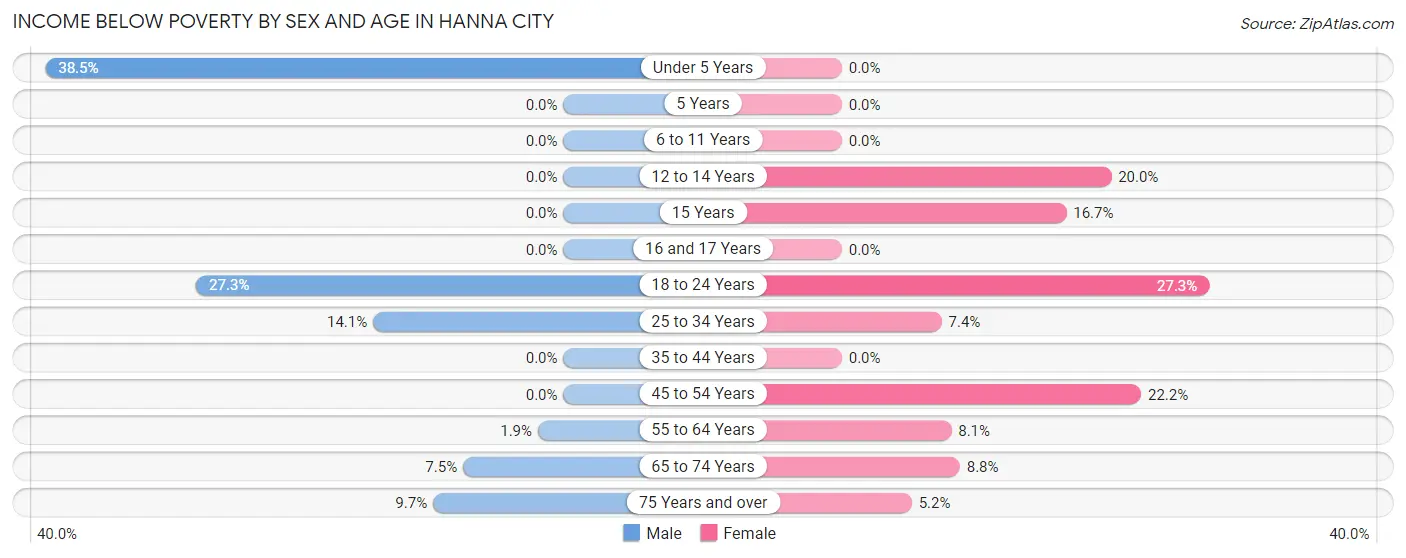
| Age Bracket | Male | Female |
| Under 5 Years | 15 (38.5%) | 0 (0.0%) |
| 5 Years | 0 (0.0%) | 0 (0.0%) |
| 6 to 11 Years | 0 (0.0%) | 0 (0.0%) |
| 12 to 14 Years | 0 (0.0%) | 2 (20.0%) |
| 15 Years | 0 (0.0%) | 1 (16.7%) |
| 16 and 17 Years | 0 (0.0%) | 0 (0.0%) |
| 18 to 24 Years | 9 (27.3%) | 21 (27.3%) |
| 25 to 34 Years | 13 (14.1%) | 4 (7.4%) |
| 35 to 44 Years | 0 (0.0%) | 0 (0.0%) |
| 45 to 54 Years | 0 (0.0%) | 20 (22.2%) |
| 55 to 64 Years | 4 (1.9%) | 10 (8.1%) |
| 65 to 74 Years | 7 (7.4%) | 12 (8.8%) |
| 75 Years and over | 6 (9.7%) | 4 (5.2%) |
| Total | 54 (7.5%) | 74 (10.6%) |
Income Above Poverty by Sex and Age in Hanna City
According to the poverty statistics in Hanna City, males aged 5 years and females aged under 5 years are the age groups that are most secure financially, with 100.0% of males and 100.0% of females in these age groups living above the poverty line.
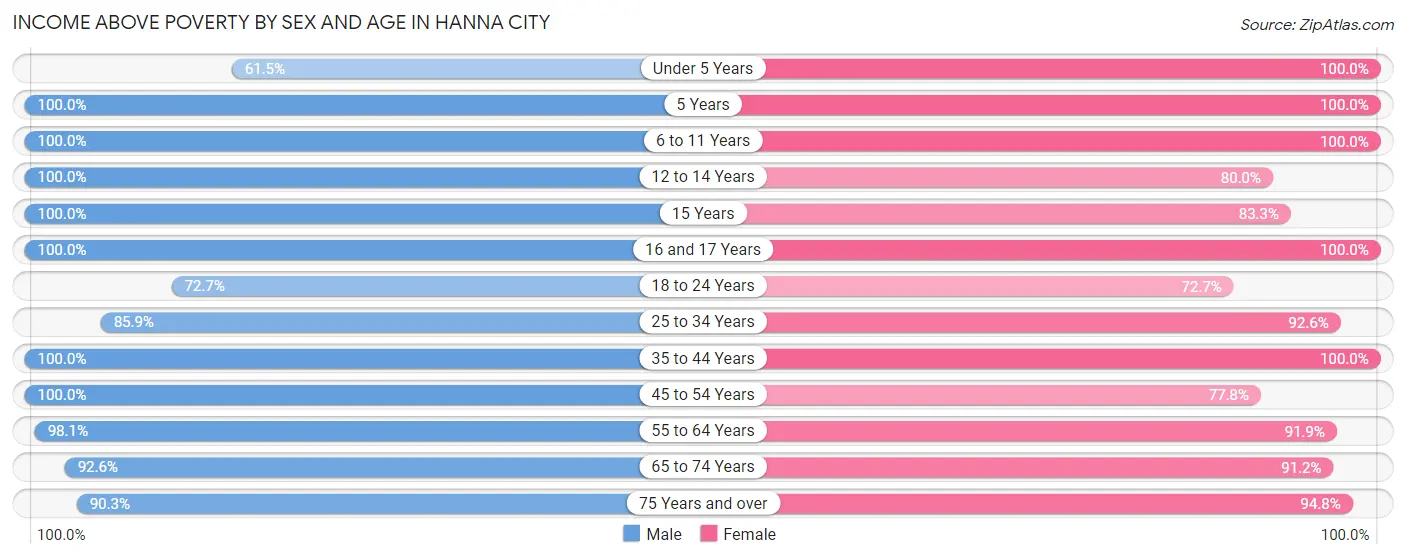
| Age Bracket | Male | Female |
| Under 5 Years | 24 (61.5%) | 13 (100.0%) |
| 5 Years | 5 (100.0%) | 2 (100.0%) |
| 6 to 11 Years | 19 (100.0%) | 23 (100.0%) |
| 12 to 14 Years | 16 (100.0%) | 8 (80.0%) |
| 15 Years | 5 (100.0%) | 5 (83.3%) |
| 16 and 17 Years | 1 (100.0%) | 15 (100.0%) |
| 18 to 24 Years | 24 (72.7%) | 56 (72.7%) |
| 25 to 34 Years | 79 (85.9%) | 50 (92.6%) |
| 35 to 44 Years | 58 (100.0%) | 68 (100.0%) |
| 45 to 54 Years | 86 (100.0%) | 70 (77.8%) |
| 55 to 64 Years | 208 (98.1%) | 113 (91.9%) |
| 65 to 74 Years | 87 (92.5%) | 125 (91.2%) |
| 75 Years and over | 56 (90.3%) | 73 (94.8%) |
| Total | 668 (92.5%) | 621 (89.3%) |
Income Below Poverty Among Married-Couple Families in Hanna City
The poverty statistics for married-couple families in Hanna City show that 3.2% or 10 of the total 316 families live below the poverty line. Families with no children have the highest poverty rate of 3.8%, comprising of 10 families. On the other hand, families with 1 or 2 children have the lowest poverty rate of 0.0%, which includes 0 families.
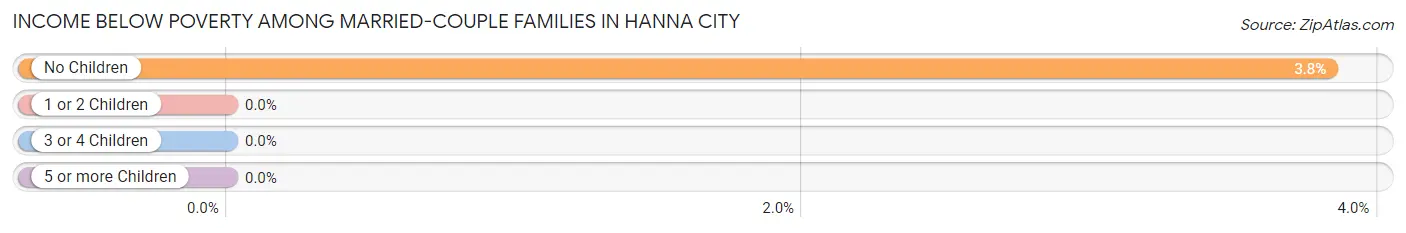
| Children | Above Poverty | Below Poverty |
| No Children | 251 (96.2%) | 10 (3.8%) |
| 1 or 2 Children | 43 (100.0%) | 0 (0.0%) |
| 3 or 4 Children | 11 (100.0%) | 0 (0.0%) |
| 5 or more Children | 1 (100.0%) | 0 (0.0%) |
| Total | 306 (96.8%) | 10 (3.2%) |
Income Below Poverty Among Single-Parent Households in Hanna City
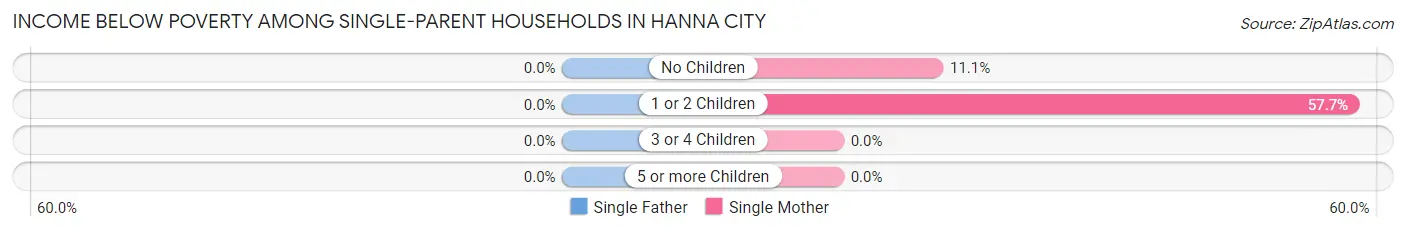
| Children | Single Father | Single Mother |
| No Children | 0 (0.0%) | 4 (11.1%) |
| 1 or 2 Children | 0 (0.0%) | 15 (57.7%) |
| 3 or 4 Children | 0 (0.0%) | 0 (0.0%) |
| 5 or more Children | 0 (0.0%) | 0 (0.0%) |
| Total | 0 (0.0%) | 19 (30.6%) |
Income Below Poverty Among Married-Couple vs Single-Parent Households in Hanna City
The poverty data for Hanna City shows that 10 of the married-couple family households (3.2%) and 19 of the single-parent households (25.3%) are living below the poverty level. Within the married-couple family households, those with no children have the highest poverty rate, with 10 households (3.8%) falling below the poverty line. Among the single-parent households, those with 1 or 2 children have the highest poverty rate, with 15 household (39.5%) living below poverty.
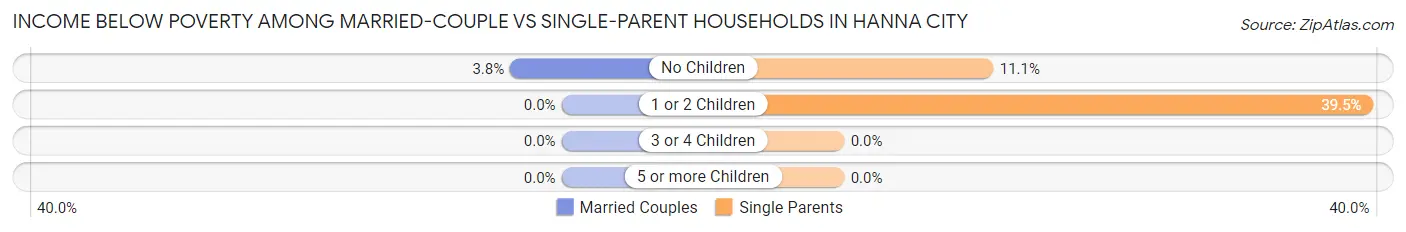
| Children | Married-Couple Families | Single-Parent Households |
| No Children | 10 (3.8%) | 4 (11.1%) |
| 1 or 2 Children | 0 (0.0%) | 15 (39.5%) |
| 3 or 4 Children | 0 (0.0%) | 0 (0.0%) |
| 5 or more Children | 0 (0.0%) | 0 (0.0%) |
| Total | 10 (3.2%) | 19 (25.3%) |
Race in Hanna City
The most populous races in Hanna City are White / Caucasian (1,382 | 97.5%), Two or more Races (22 | 1.5%), and Hispanic or Latino (12 | 0.9%).
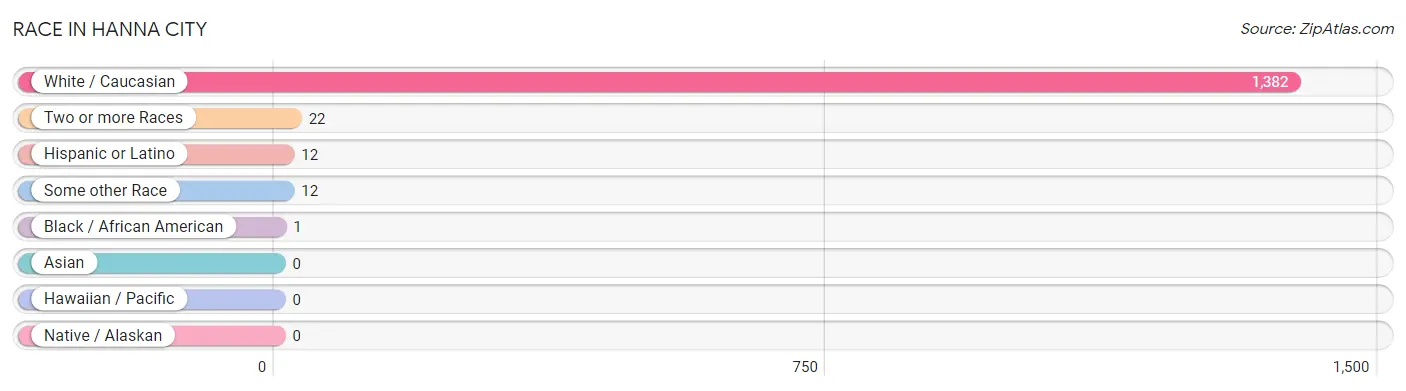
| Race | # Population | % Population |
| Asian | 0 | 0.0% |
| Black / African American | 1 | 0.1% |
| Hawaiian / Pacific | 0 | 0.0% |
| Hispanic or Latino | 12 | 0.9% |
| Native / Alaskan | 0 | 0.0% |
| White / Caucasian | 1,382 | 97.5% |
| Two or more Races | 22 | 1.5% |
| Some other Race | 12 | 0.9% |
| Total | 1,417 | 100.0% |
Ancestry in Hanna City
The most populous ancestries reported in Hanna City are German (491 | 34.6%), English (165 | 11.6%), Irish (127 | 9.0%), American (101 | 7.1%), and Scottish (61 | 4.3%), together accounting for 66.7% of all Hanna City residents.
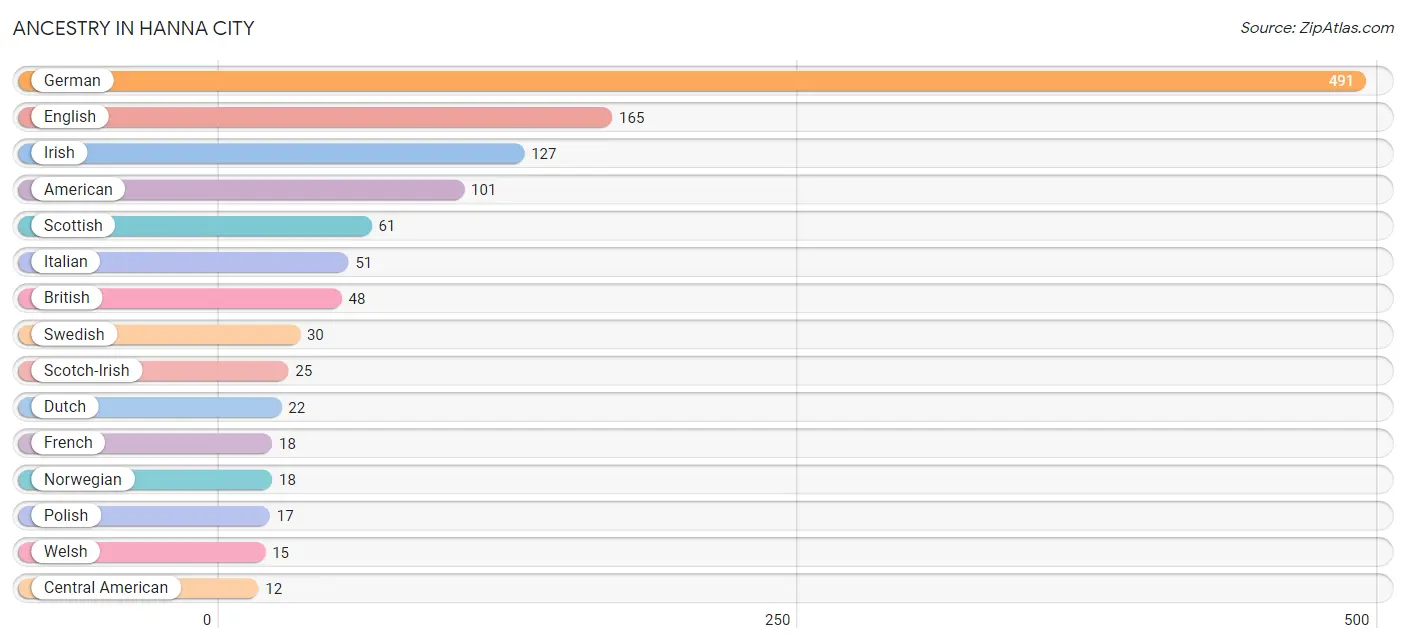
| Ancestry | # Population | % Population |
| American | 101 | 7.1% |
| Arab | 5 | 0.4% |
| Bhutanese | 5 | 0.4% |
| British | 48 | 3.4% |
| Bulgarian | 5 | 0.4% |
| Central American | 12 | 0.9% |
| Danish | 5 | 0.4% |
| Dutch | 22 | 1.5% |
| English | 165 | 11.6% |
| European | 9 | 0.6% |
| French | 18 | 1.3% |
| French Canadian | 4 | 0.3% |
| German | 491 | 34.6% |
| Guatemalan | 12 | 0.9% |
| Irish | 127 | 9.0% |
| Italian | 51 | 3.6% |
| Lebanese | 5 | 0.4% |
| Norwegian | 18 | 1.3% |
| Polish | 17 | 1.2% |
| Scandinavian | 2 | 0.1% |
| Scotch-Irish | 25 | 1.8% |
| Scottish | 61 | 4.3% |
| Swedish | 30 | 2.1% |
| Swiss | 2 | 0.1% |
| Tlingit-Haida | 5 | 0.4% |
| Turkish | 5 | 0.4% |
| Welsh | 15 | 1.1% |
| Yugoslavian | 8 | 0.6% | View All 28 Rows |
Immigrants in Hanna City
The most numerous immigrant groups reported in Hanna City came from Central America (12 | 0.9%), Guatemala (12 | 0.9%), and Latin America (12 | 0.9%), together accounting for 2.6% of all Hanna City residents.
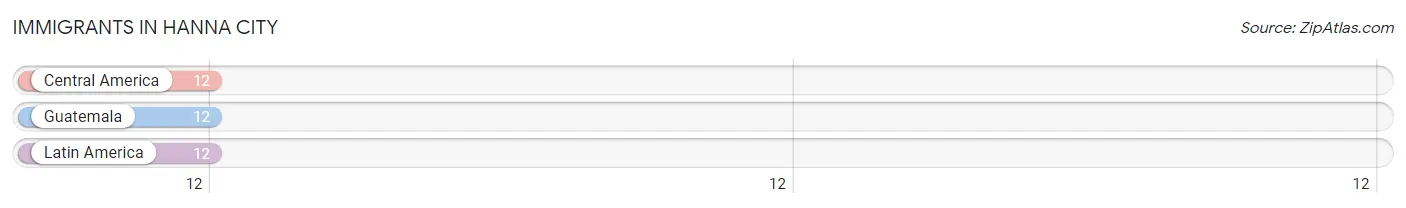
| Immigration Origin | # Population | % Population |
| Central America | 12 | 0.9% |
| Guatemala | 12 | 0.9% |
| Latin America | 12 | 0.9% | View All 3 Rows |
Sex and Age in Hanna City
Sex and Age in Hanna City
The most populous age groups in Hanna City are 55 to 59 Years (132 | 18.3%) for men and 60 to 64 Years (89 | 12.8%) for women.
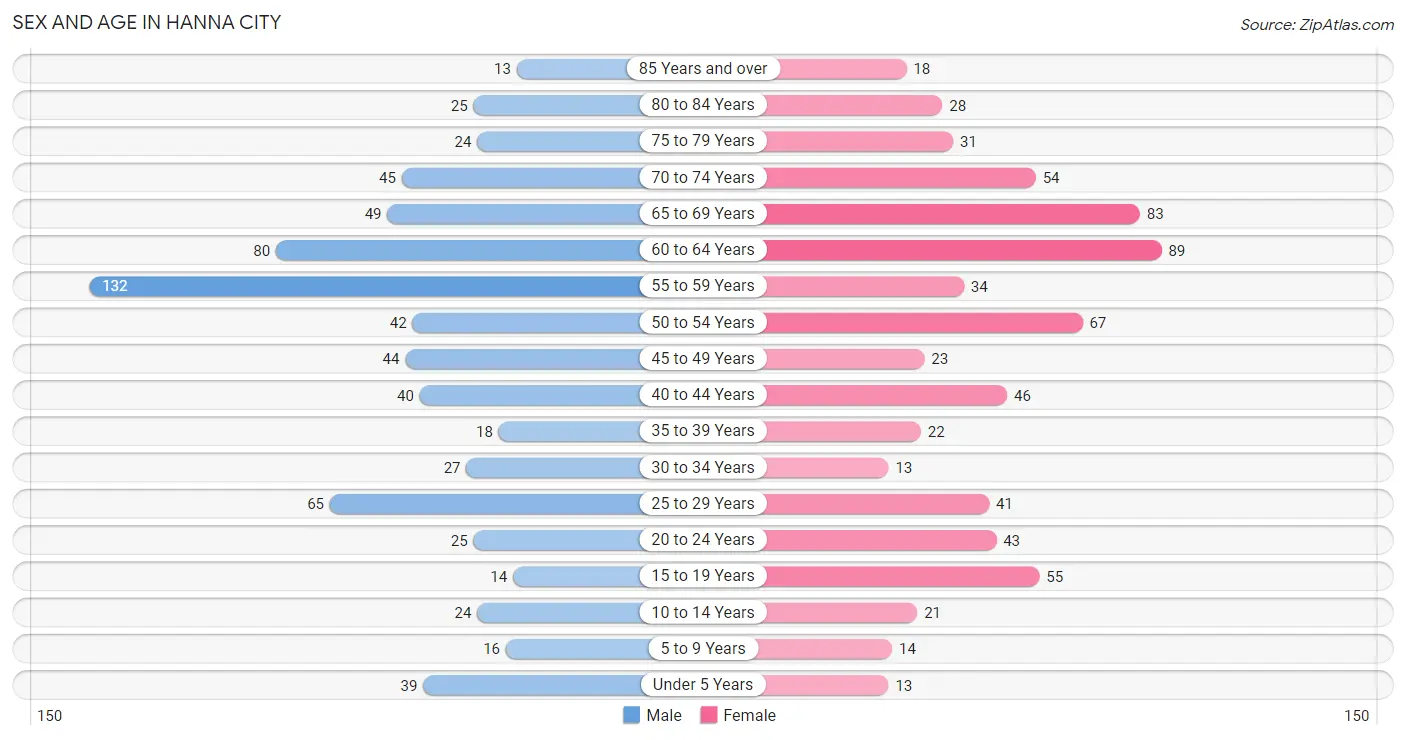
| Age Bracket | Male | Female |
| Under 5 Years | 39 (5.4%) | 13 (1.9%) |
| 5 to 9 Years | 16 (2.2%) | 14 (2.0%) |
| 10 to 14 Years | 24 (3.3%) | 21 (3.0%) |
| 15 to 19 Years | 14 (1.9%) | 55 (7.9%) |
| 20 to 24 Years | 25 (3.5%) | 43 (6.2%) |
| 25 to 29 Years | 65 (9.0%) | 41 (5.9%) |
| 30 to 34 Years | 27 (3.7%) | 13 (1.9%) |
| 35 to 39 Years | 18 (2.5%) | 22 (3.2%) |
| 40 to 44 Years | 40 (5.5%) | 46 (6.6%) |
| 45 to 49 Years | 44 (6.1%) | 23 (3.3%) |
| 50 to 54 Years | 42 (5.8%) | 67 (9.6%) |
| 55 to 59 Years | 132 (18.3%) | 34 (4.9%) |
| 60 to 64 Years | 80 (11.1%) | 89 (12.8%) |
| 65 to 69 Years | 49 (6.8%) | 83 (11.9%) |
| 70 to 74 Years | 45 (6.2%) | 54 (7.8%) |
| 75 to 79 Years | 24 (3.3%) | 31 (4.5%) |
| 80 to 84 Years | 25 (3.5%) | 28 (4.0%) |
| 85 Years and over | 13 (1.8%) | 18 (2.6%) |
| Total | 722 (100.0%) | 695 (100.0%) |
Families and Households in Hanna City
Median Family Size in Hanna City
The median family size in Hanna City is 2.55 persons per family, with married-couple families (316 | 80.8%) accounting for the largest median family size of 2.6 persons per family. On the other hand, single female/mother families (62 | 15.9%) represent the smallest median family size with 2.31 persons per family.
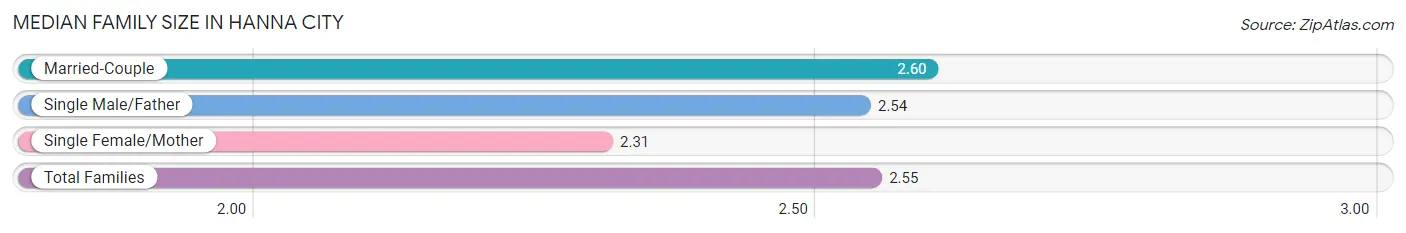
| Family Type | # Families | Family Size |
| Married-Couple | 316 (80.8%) | 2.60 |
| Single Male/Father | 13 (3.3%) | 2.54 |
| Single Female/Mother | 62 (15.9%) | 2.31 |
| Total Families | 391 (100.0%) | 2.55 |
Median Household Size in Hanna City
The median household size in Hanna City is 1.86 persons per household, with single male/father households (13 | 1.7%) accounting for the largest median household size of 2.92 persons per household. non-family households (371 | 48.7%) represent the smallest median household size with 1.07 persons per household.
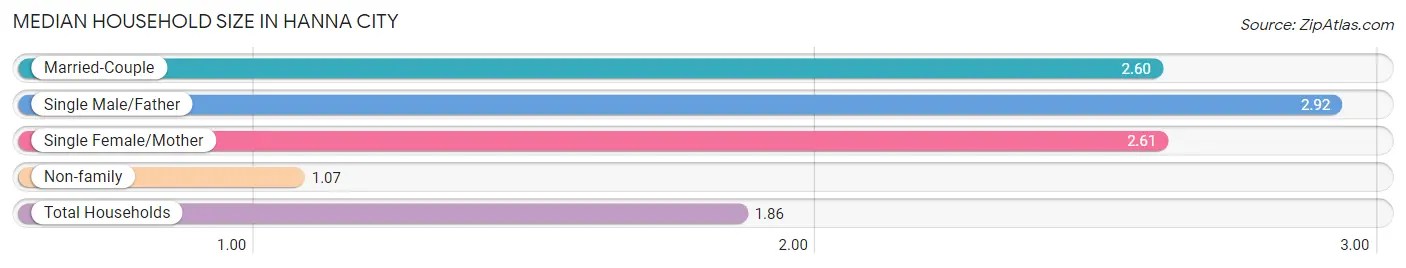
| Household Type | # Households | Household Size |
| Married-Couple | 316 (41.5%) | 2.60 |
| Single Male/Father | 13 (1.7%) | 2.92 |
| Single Female/Mother | 62 (8.1%) | 2.61 |
| Non-family | 371 (48.7%) | 1.07 |
| Total Households | 762 (100.0%) | 1.86 |
Household Size by Marriage Status in Hanna City
Out of a total of 762 households in Hanna City, 391 (51.3%) are family households, while 371 (48.7%) are nonfamily households. The most numerous type of family households are 2-person households, comprising 250, and the most common type of nonfamily households are 1-person households, comprising 344.
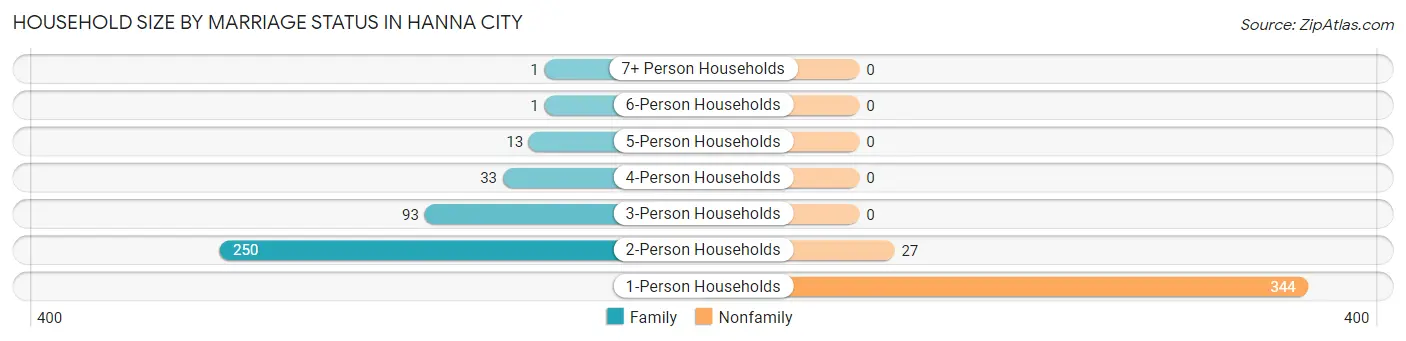
| Household Size | Family Households | Nonfamily Households |
| 1-Person Households | - | 344 (45.1%) |
| 2-Person Households | 250 (32.8%) | 27 (3.5%) |
| 3-Person Households | 93 (12.2%) | 0 (0.0%) |
| 4-Person Households | 33 (4.3%) | 0 (0.0%) |
| 5-Person Households | 13 (1.7%) | 0 (0.0%) |
| 6-Person Households | 1 (0.1%) | 0 (0.0%) |
| 7+ Person Households | 1 (0.1%) | 0 (0.0%) |
| Total | 391 (51.3%) | 371 (48.7%) |
Female Fertility in Hanna City
Fertility by Age in Hanna City
Average fertility rate in Hanna City is 20.0 births per 1,000 women. Women in the age bracket of 20 to 34 years have the highest fertility rate with 52.0 births per 1,000 women. Women in the age bracket of 20 to 34 years acount for 100.0% of all women with births.
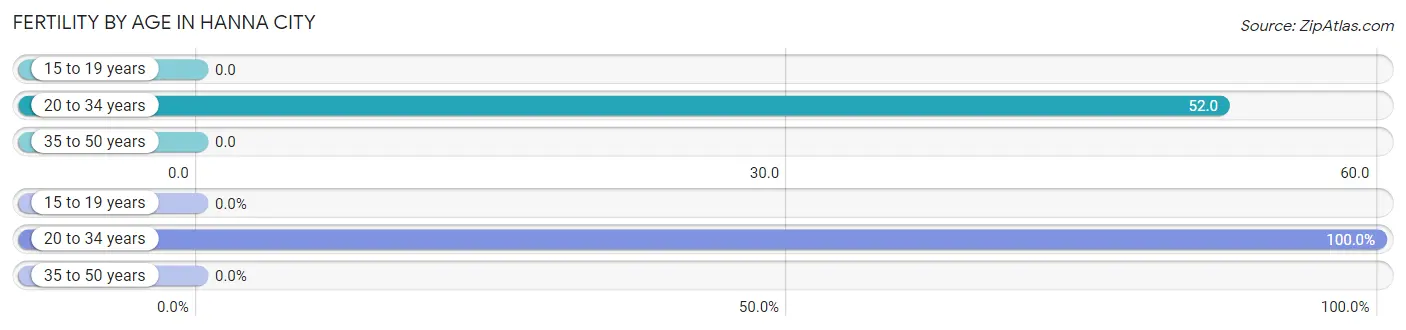
| Age Bracket | Women with Births | Births / 1,000 Women |
| 15 to 19 years | 0 (0.0%) | 0.0 |
| 20 to 34 years | 5 (100.0%) | 52.0 |
| 35 to 50 years | 0 (0.0%) | 0.0 |
| Total | 5 (100.0%) | 20.0 |
Fertility by Age by Marriage Status in Hanna City
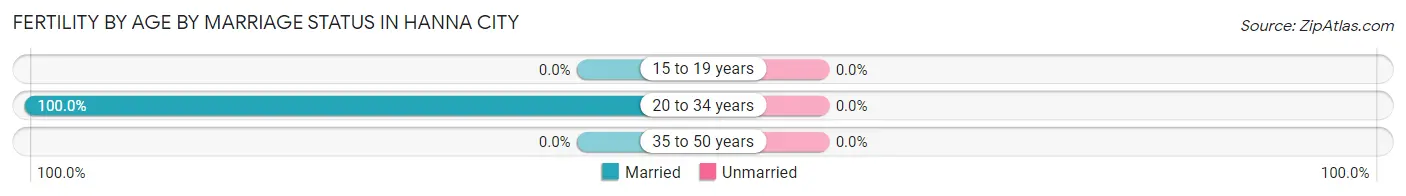
| Age Bracket | Married | Unmarried |
| 15 to 19 years | 0 (0.0%) | 0 (0.0%) |
| 20 to 34 years | 5 (100.0%) | 0 (0.0%) |
| 35 to 50 years | 0 (0.0%) | 0 (0.0%) |
| Total | 5 (100.0%) | 0 (0.0%) |
Fertility by Education in Hanna City
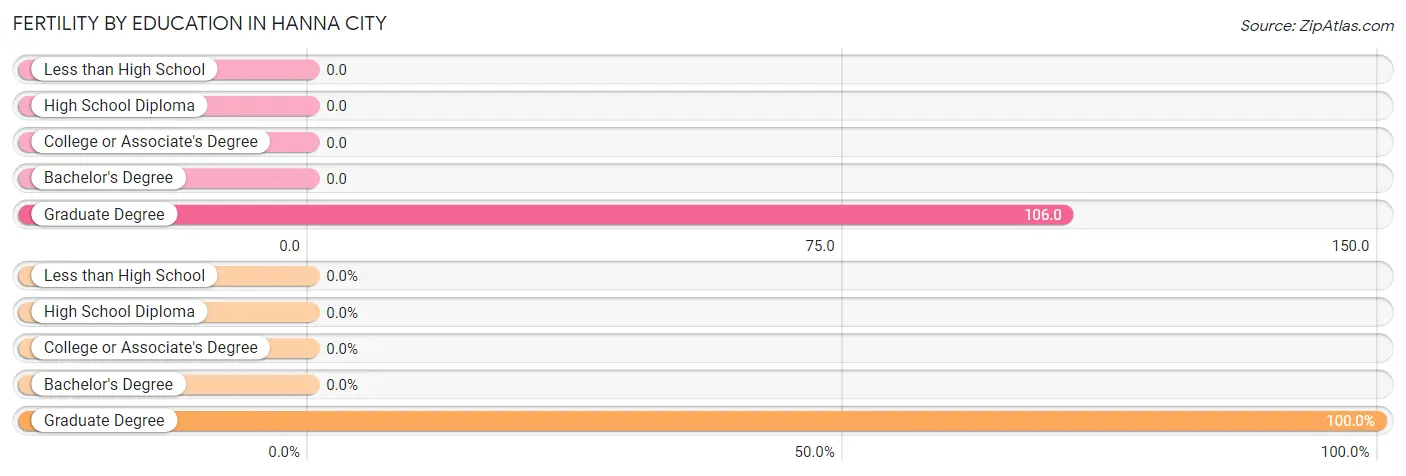
| Educational Attainment | Women with Births | Births / 1,000 Women |
| Less than High School | 0 (0.0%) | 0.0 |
| High School Diploma | 0 (0.0%) | 0.0 |
| College or Associate's Degree | 0 (0.0%) | 0.0 |
| Bachelor's Degree | 0 (0.0%) | 0.0 |
| Graduate Degree | 5 (100.0%) | 106.0 |
| Total | 5 (100.0%) | 20.0 |
Fertility by Education by Marriage Status in Hanna City
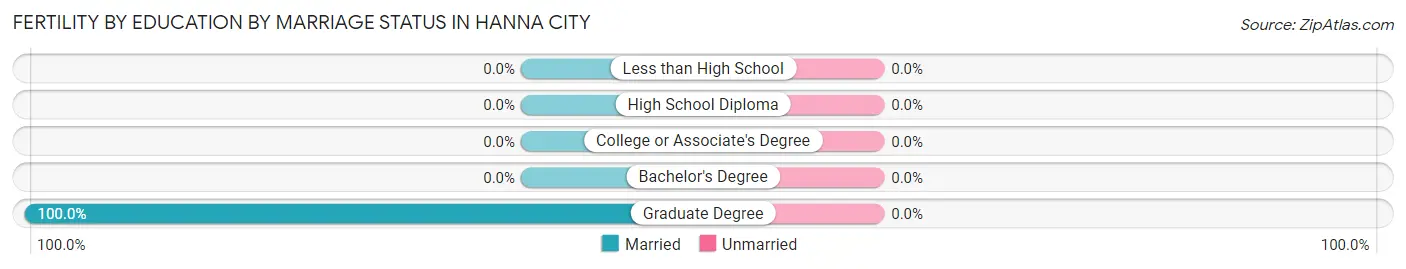
| Educational Attainment | Married | Unmarried |
| Less than High School | 0 (0.0%) | 0 (0.0%) |
| High School Diploma | 0 (0.0%) | 0 (0.0%) |
| College or Associate's Degree | 0 (0.0%) | 0 (0.0%) |
| Bachelor's Degree | 0 (0.0%) | 0 (0.0%) |
| Graduate Degree | 5 (100.0%) | 0 (0.0%) |
| Total | 5 (100.0%) | 0 (0.0%) |
Employment Characteristics in Hanna City
Employment by Class of Employer in Hanna City
Among the 742 employed individuals in Hanna City, private company employees (496 | 66.8%), not-for-profit organizations (117 | 15.8%), and local government employees (47 | 6.3%) make up the most common classes of employment.
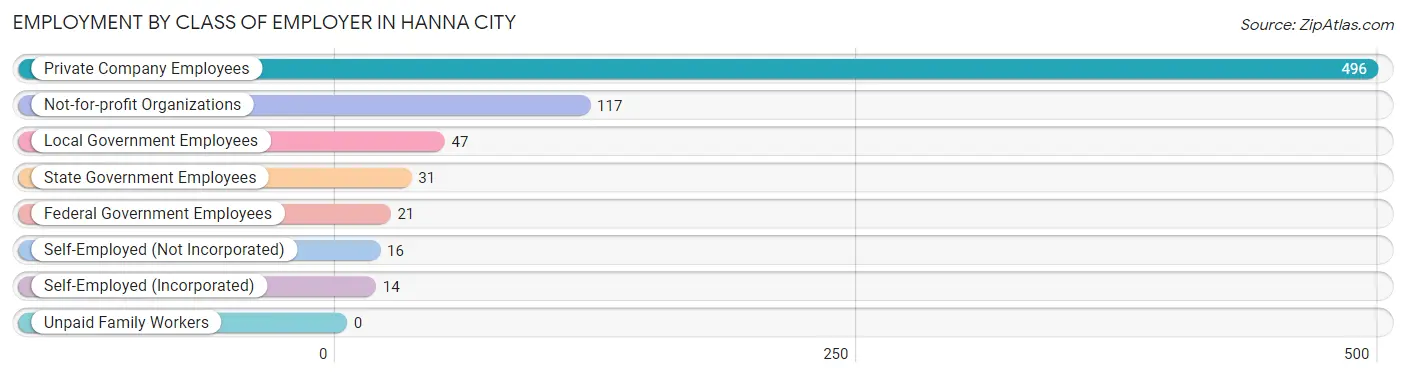
| Employer Class | # Employees | % Employees |
| Private Company Employees | 496 | 66.8% |
| Self-Employed (Incorporated) | 14 | 1.9% |
| Self-Employed (Not Incorporated) | 16 | 2.2% |
| Not-for-profit Organizations | 117 | 15.8% |
| Local Government Employees | 47 | 6.3% |
| State Government Employees | 31 | 4.2% |
| Federal Government Employees | 21 | 2.8% |
| Unpaid Family Workers | 0 | 0.0% |
| Total | 742 | 100.0% |
Employment Status by Age in Hanna City
According to the labor force statistics for Hanna City, out of the total population over 16 years of age (1,279), 60.0% or 767 individuals are in the labor force, with 2.0% or 15 of them unemployed. The age group with the highest labor force participation rate is 30 to 34 years, with 100.0% or 40 individuals in the labor force. Within the labor force, the 16 to 19 years age range has the highest percentage of unemployed individuals, with 9.3% or 4 of them being unemployed.
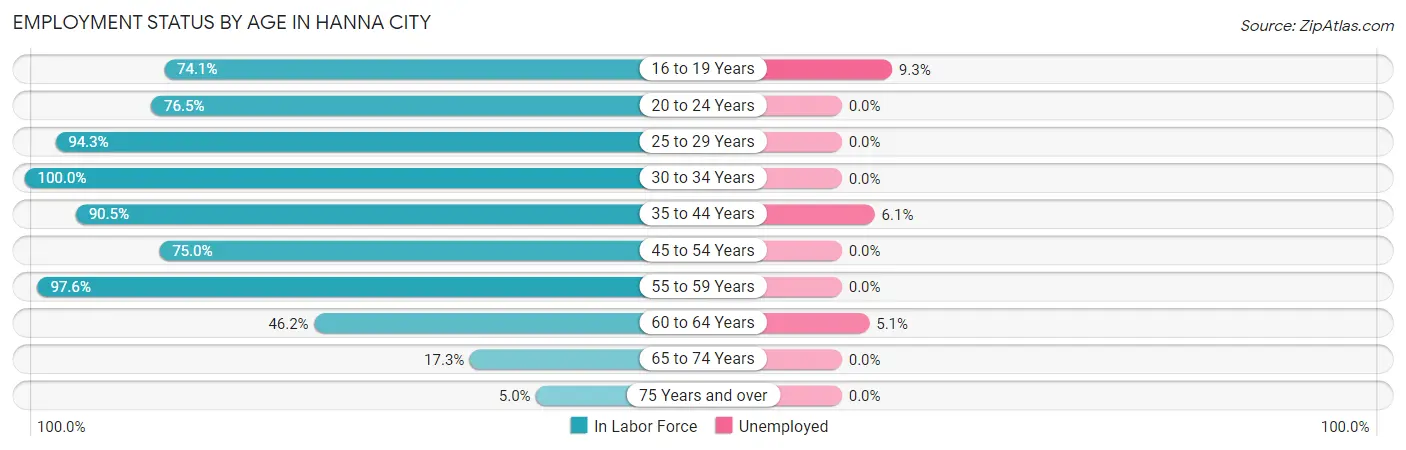
| Age Bracket | In Labor Force | Unemployed |
| 16 to 19 Years | 43 (74.1%) | 4 (9.3%) |
| 20 to 24 Years | 52 (76.5%) | 0 (0.0%) |
| 25 to 29 Years | 100 (94.3%) | 0 (0.0%) |
| 30 to 34 Years | 40 (100.0%) | 0 (0.0%) |
| 35 to 44 Years | 114 (90.5%) | 7 (6.1%) |
| 45 to 54 Years | 132 (75.0%) | 0 (0.0%) |
| 55 to 59 Years | 162 (97.6%) | 0 (0.0%) |
| 60 to 64 Years | 78 (46.2%) | 4 (5.1%) |
| 65 to 74 Years | 40 (17.3%) | 0 (0.0%) |
| 75 Years and over | 7 (5.0%) | 0 (0.0%) |
| Total | 767 (60.0%) | 15 (2.0%) |
Employment Status by Educational Attainment in Hanna City
According to labor force statistics for Hanna City, 79.9% of individuals (626) out of the total population between 25 and 64 years of age (783) are in the labor force, with 1.8% or 11 of them being unemployed. The group with the highest labor force participation rate are those with the educational attainment of bachelor's degree or higher, with 87.1% or 182 individuals in the labor force. Within the labor force, individuals with college / associate degree education have the highest percentage of unemployment, with 2.9% or 6 of them being unemployed.
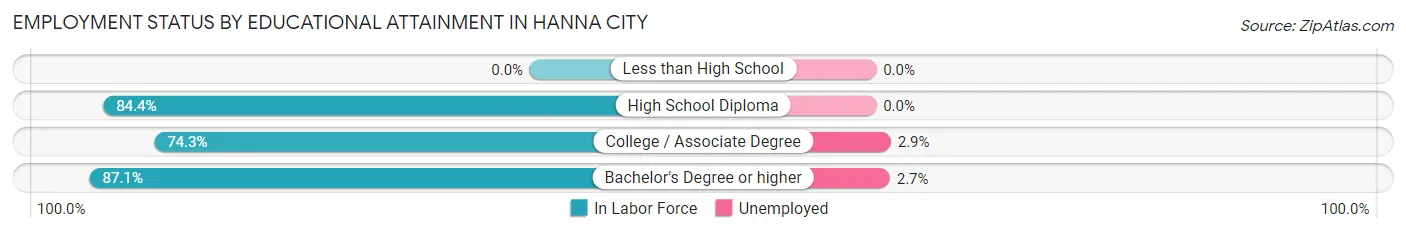
| Educational Attainment | In Labor Force | Unemployed |
| Less than High School | 0 (0.0%) | 0 (0.0%) |
| High School Diploma | 233 (84.4%) | 0 (0.0%) |
| College / Associate Degree | 211 (74.3%) | 8 (2.9%) |
| Bachelor's Degree or higher | 182 (87.1%) | 6 (2.7%) |
| Total | 626 (79.9%) | 14 (1.8%) |
Employment Occupations by Sex in Hanna City
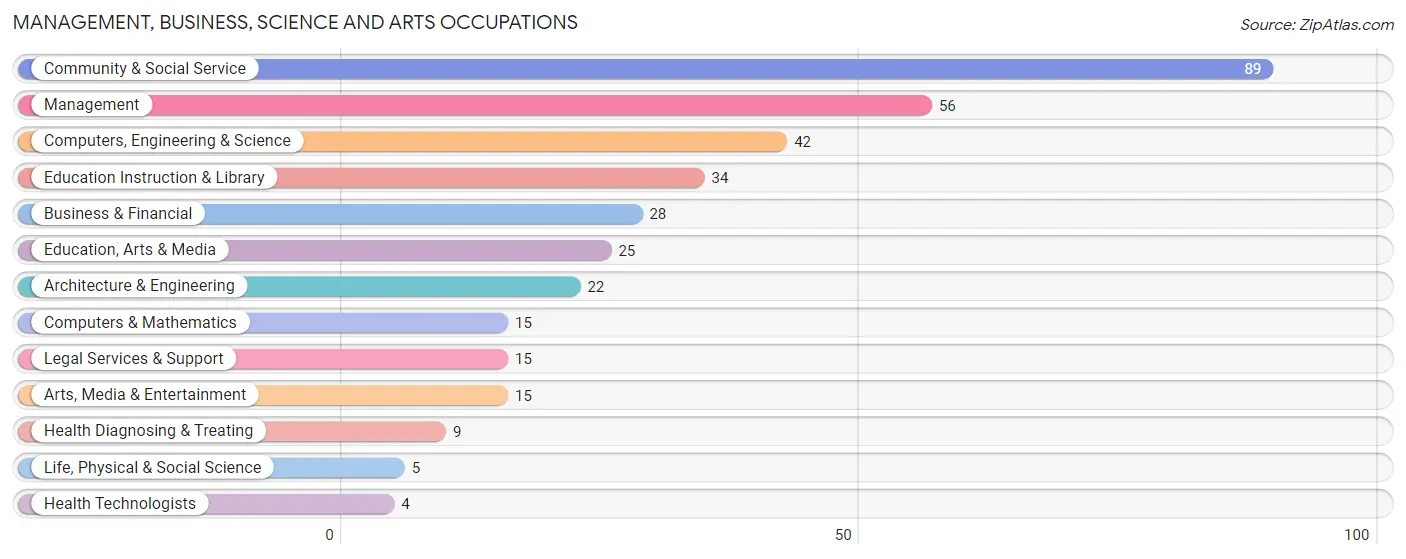
Management, Business, Science and Arts Occupations
The most common Management, Business, Science and Arts occupations in Hanna City are Community & Social Service (89 | 11.9%), Management (56 | 7.5%), Computers, Engineering & Science (42 | 5.6%), Education Instruction & Library (34 | 4.5%), and Business & Financial (28 | 3.7%).
Management, Business, Science and Arts Occupations by Sex
Within the Management, Business, Science and Arts occupations in Hanna City, the most male-oriented occupations are Architecture & Engineering (100.0%), Life, Physical & Social Science (100.0%), and Computers, Engineering & Science (66.7%), while the most female-oriented occupations are Legal Services & Support (100.0%), Health Diagnosing & Treating (100.0%), and Health Technologists (100.0%).
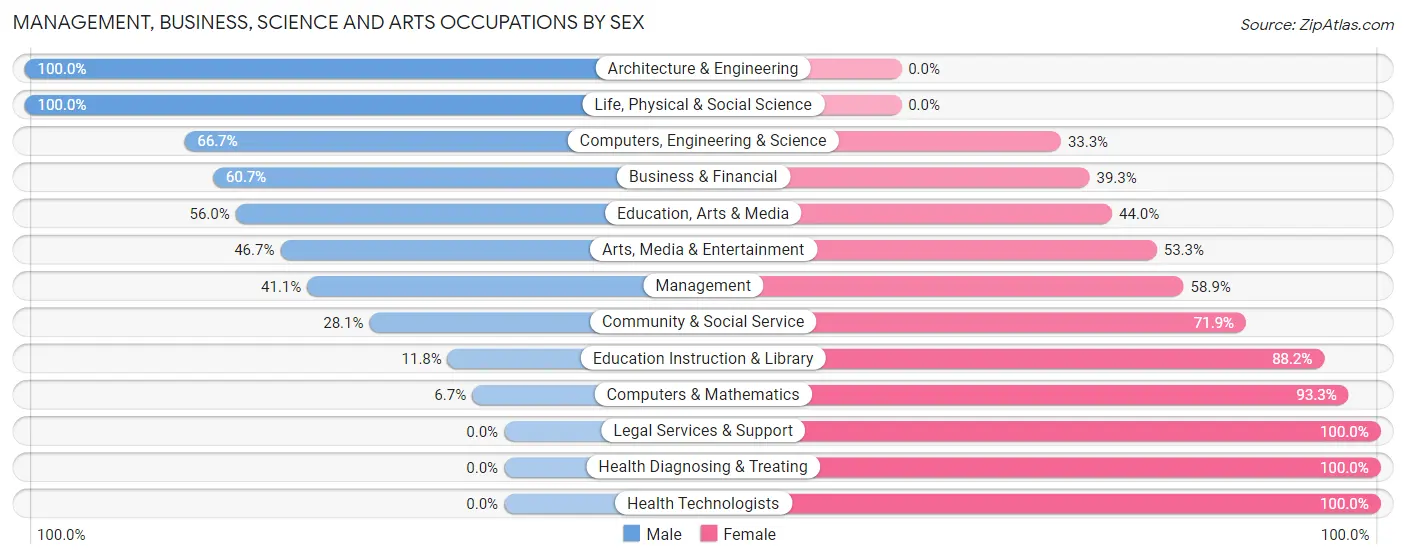
| Occupation | Male | Female |
| Management | 23 (41.1%) | 33 (58.9%) |
| Business & Financial | 17 (60.7%) | 11 (39.3%) |
| Computers, Engineering & Science | 28 (66.7%) | 14 (33.3%) |
| Computers & Mathematics | 1 (6.7%) | 14 (93.3%) |
| Architecture & Engineering | 22 (100.0%) | 0 (0.0%) |
| Life, Physical & Social Science | 5 (100.0%) | 0 (0.0%) |
| Community & Social Service | 25 (28.1%) | 64 (71.9%) |
| Education, Arts & Media | 14 (56.0%) | 11 (44.0%) |
| Legal Services & Support | 0 (0.0%) | 15 (100.0%) |
| Education Instruction & Library | 4 (11.8%) | 30 (88.2%) |
| Arts, Media & Entertainment | 7 (46.7%) | 8 (53.3%) |
| Health Diagnosing & Treating | 0 (0.0%) | 9 (100.0%) |
| Health Technologists | 0 (0.0%) | 4 (100.0%) |
| Total (Category) | 93 (41.5%) | 131 (58.5%) |
| Total (Overall) | 416 (55.6%) | 332 (44.4%) |
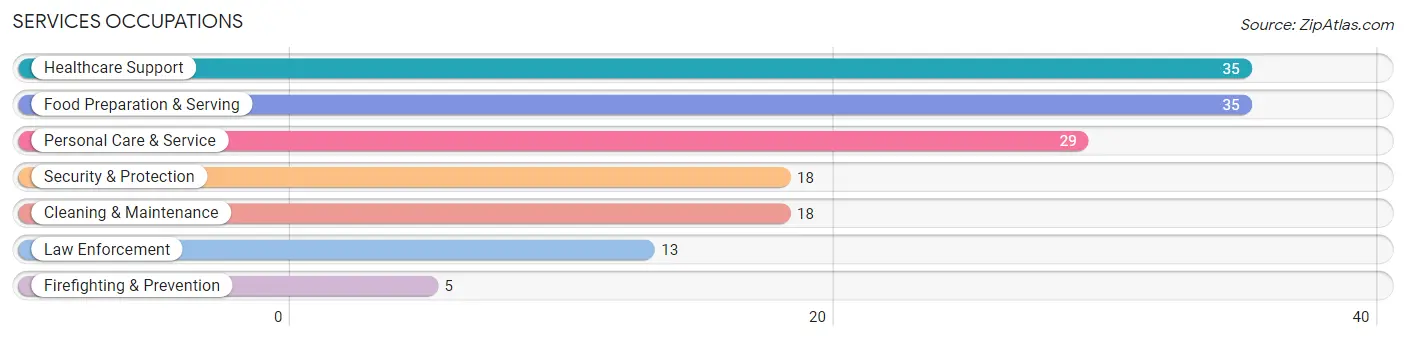
Services Occupations
The most common Services occupations in Hanna City are Healthcare Support (35 | 4.7%), Food Preparation & Serving (35 | 4.7%), Personal Care & Service (29 | 3.9%), Security & Protection (18 | 2.4%), and Cleaning & Maintenance (18 | 2.4%).
Services Occupations by Sex
Within the Services occupations in Hanna City, the most male-oriented occupations are Security & Protection (100.0%), Firefighting & Prevention (100.0%), and Law Enforcement (100.0%), while the most female-oriented occupations are Food Preparation & Serving (100.0%), Personal Care & Service (96.6%), and Healthcare Support (54.3%).
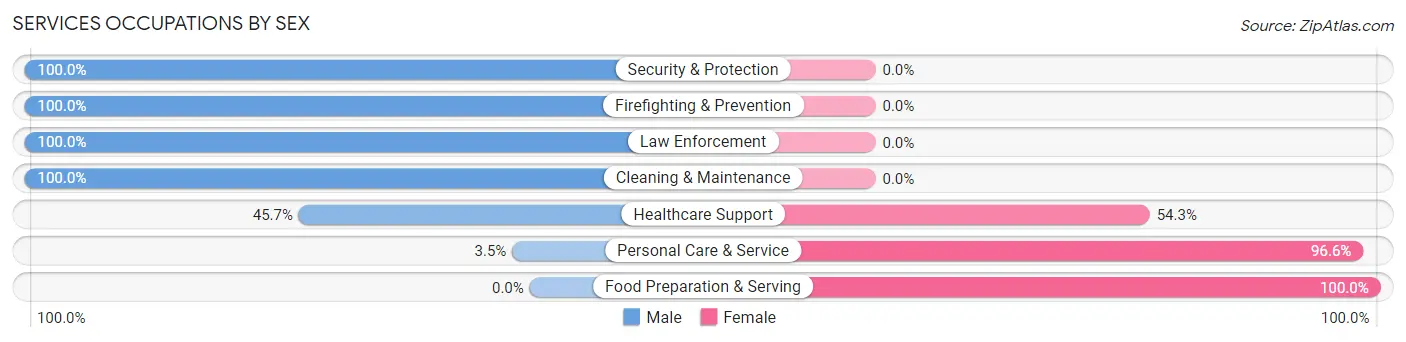
| Occupation | Male | Female |
| Healthcare Support | 16 (45.7%) | 19 (54.3%) |
| Security & Protection | 18 (100.0%) | 0 (0.0%) |
| Firefighting & Prevention | 5 (100.0%) | 0 (0.0%) |
| Law Enforcement | 13 (100.0%) | 0 (0.0%) |
| Food Preparation & Serving | 0 (0.0%) | 35 (100.0%) |
| Cleaning & Maintenance | 18 (100.0%) | 0 (0.0%) |
| Personal Care & Service | 1 (3.5%) | 28 (96.6%) |
| Total (Category) | 53 (39.3%) | 82 (60.7%) |
| Total (Overall) | 416 (55.6%) | 332 (44.4%) |
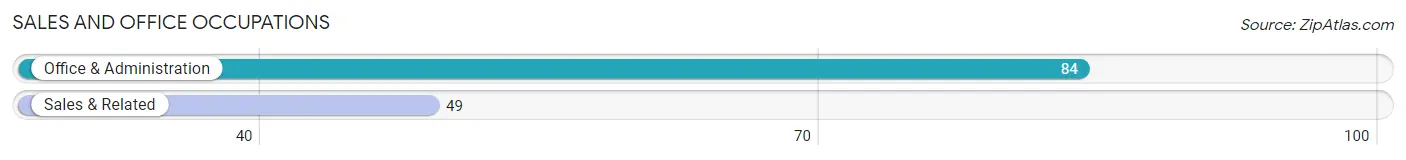
Sales and Office Occupations
The most common Sales and Office occupations in Hanna City are Office & Administration (84 | 11.2%), and Sales & Related (49 | 6.6%).
Sales and Office Occupations by Sex
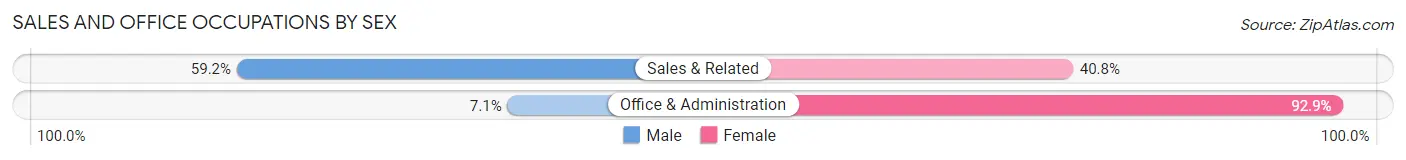
| Occupation | Male | Female |
| Sales & Related | 29 (59.2%) | 20 (40.8%) |
| Office & Administration | 6 (7.1%) | 78 (92.9%) |
| Total (Category) | 35 (26.3%) | 98 (73.7%) |
| Total (Overall) | 416 (55.6%) | 332 (44.4%) |
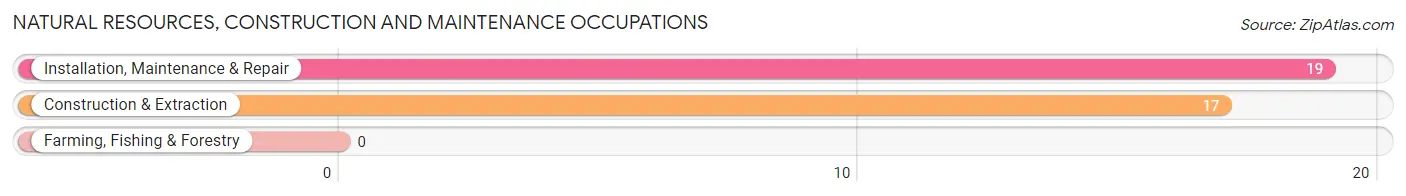
Natural Resources, Construction and Maintenance Occupations
The most common Natural Resources, Construction and Maintenance occupations in Hanna City are Installation, Maintenance & Repair (19 | 2.5%), and Construction & Extraction (17 | 2.3%).
Natural Resources, Construction and Maintenance Occupations by Sex
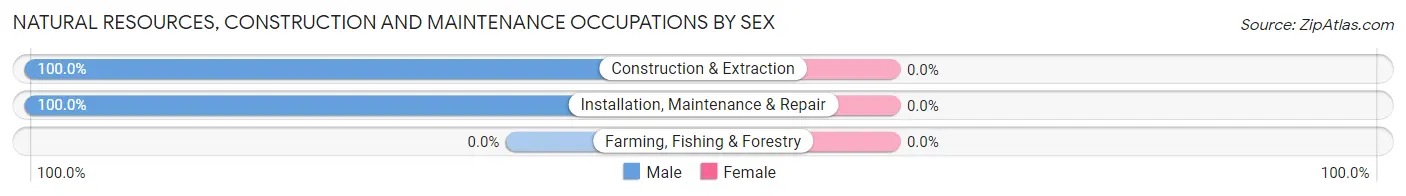
| Occupation | Male | Female |
| Farming, Fishing & Forestry | 0 (0.0%) | 0 (0.0%) |
| Construction & Extraction | 17 (100.0%) | 0 (0.0%) |
| Installation, Maintenance & Repair | 19 (100.0%) | 0 (0.0%) |
| Total (Category) | 36 (100.0%) | 0 (0.0%) |
| Total (Overall) | 416 (55.6%) | 332 (44.4%) |
Production, Transportation and Moving Occupations
The most common Production, Transportation and Moving occupations in Hanna City are Material Moving (129 | 17.2%), Production (49 | 6.6%), and Transportation (42 | 5.6%).
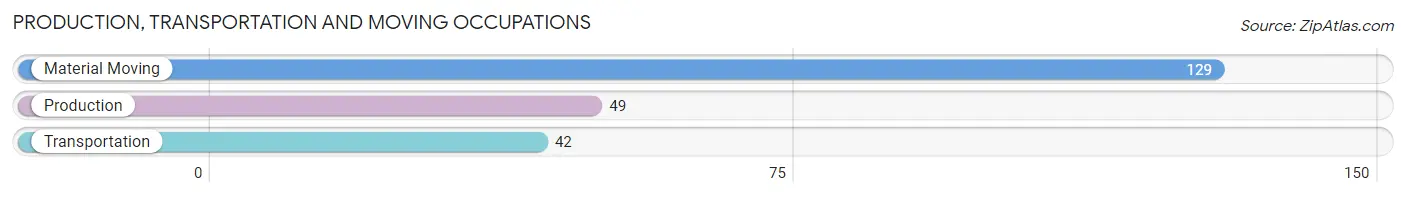
Production, Transportation and Moving Occupations by Sex
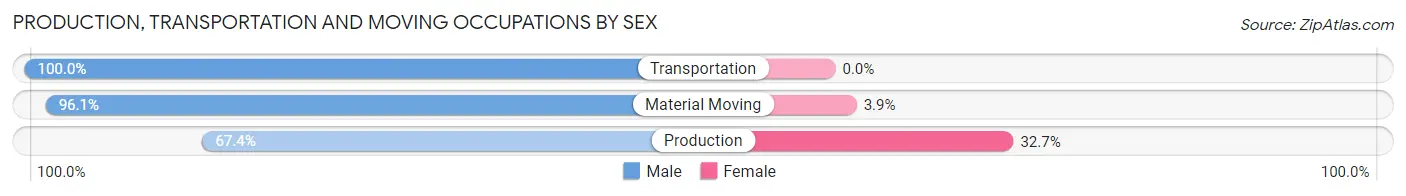
| Occupation | Male | Female |
| Production | 33 (67.3%) | 16 (32.7%) |
| Transportation | 42 (100.0%) | 0 (0.0%) |
| Material Moving | 124 (96.1%) | 5 (3.9%) |
| Total (Category) | 199 (90.4%) | 21 (9.6%) |
| Total (Overall) | 416 (55.6%) | 332 (44.4%) |
Employment Industries by Sex in Hanna City
Employment Industries in Hanna City
The major employment industries in Hanna City include Health Care & Social Assistance (129 | 17.2%), Transportation & Warehousing (126 | 16.8%), Manufacturing (97 | 13.0%), Retail Trade (72 | 9.6%), and Educational Services (51 | 6.8%).
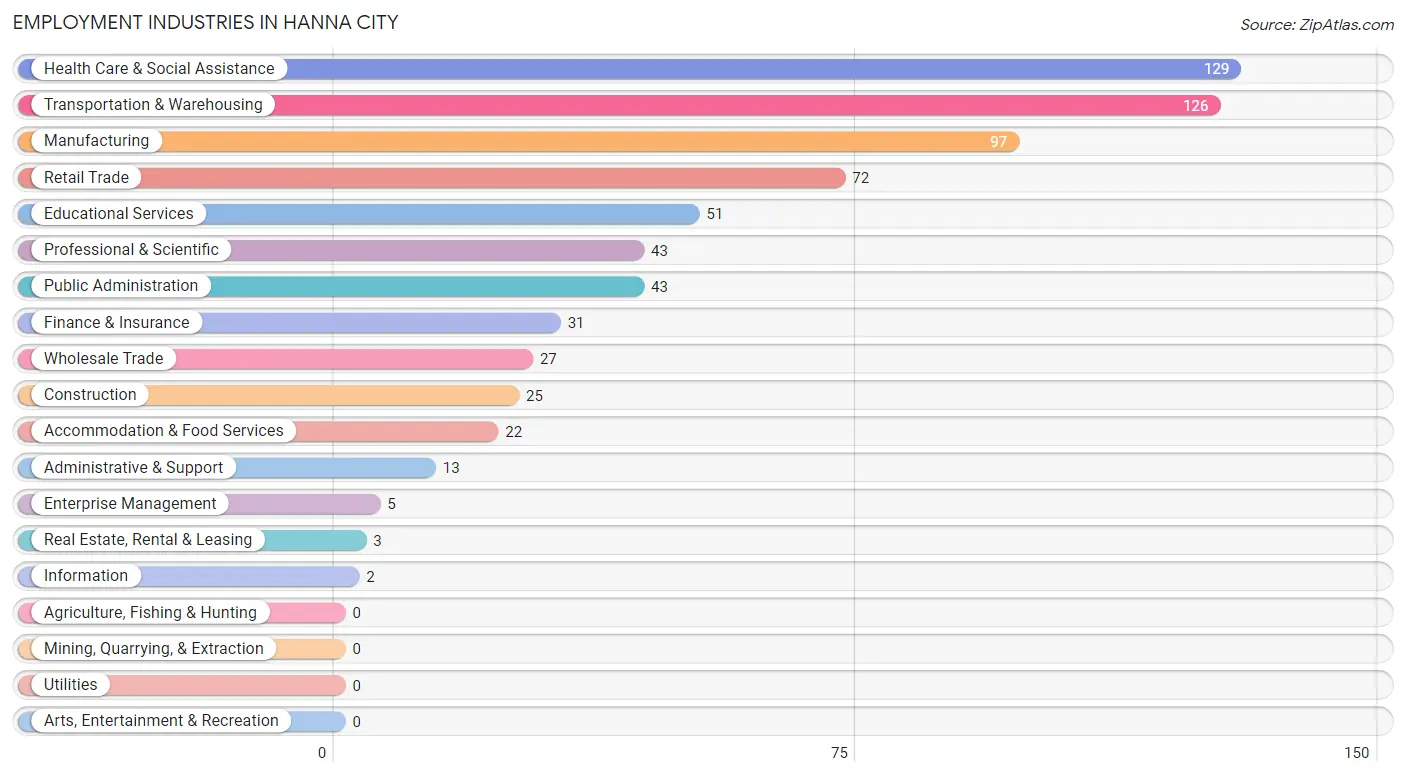
Employment Industries by Sex in Hanna City
The Hanna City industries that see more men than women are Construction (100.0%), Wholesale Trade (100.0%), and Information (100.0%), whereas the industries that tend to have a higher number of women are Enterprise Management (100.0%), Accommodation & Food Services (100.0%), and Finance & Insurance (96.8%).
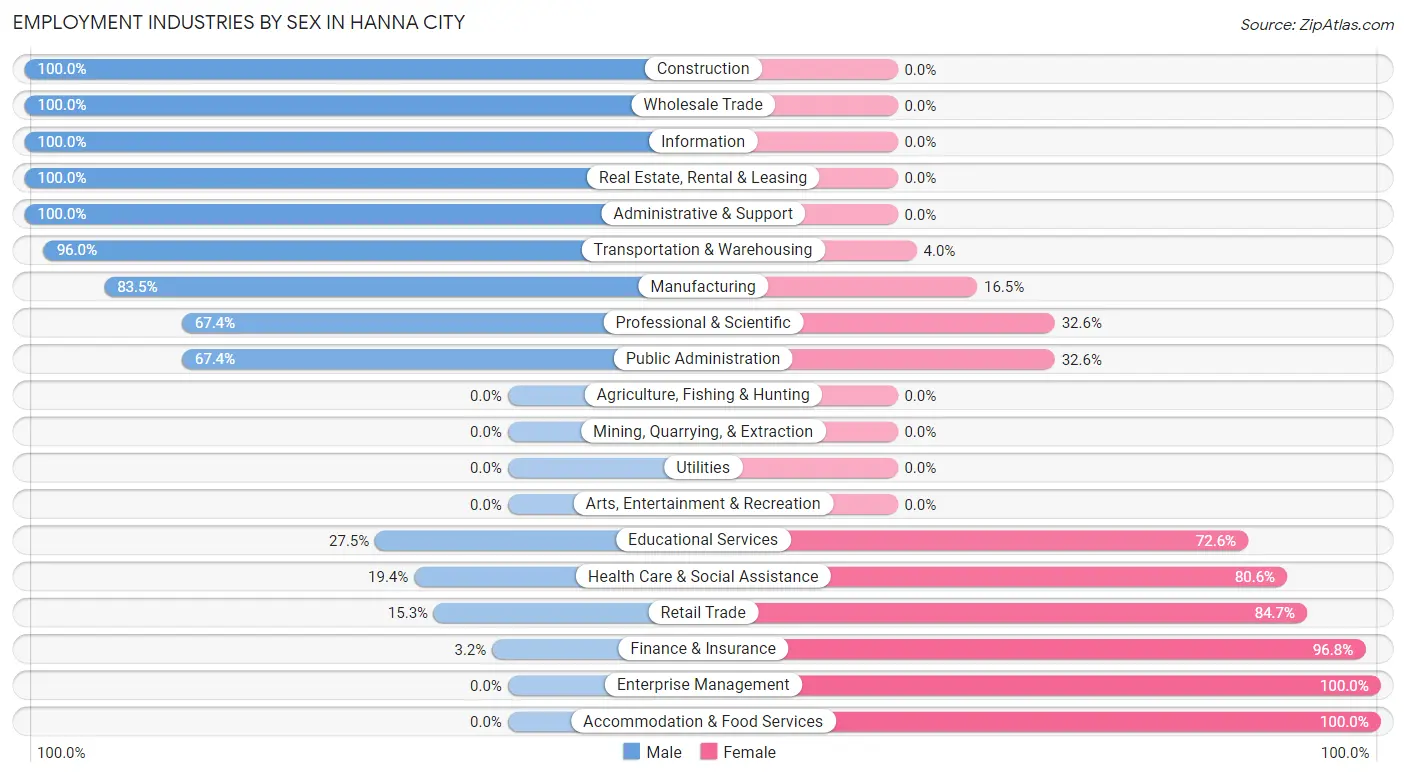
| Industry | Male | Female |
| Agriculture, Fishing & Hunting | 0 (0.0%) | 0 (0.0%) |
| Mining, Quarrying, & Extraction | 0 (0.0%) | 0 (0.0%) |
| Construction | 25 (100.0%) | 0 (0.0%) |
| Manufacturing | 81 (83.5%) | 16 (16.5%) |
| Wholesale Trade | 27 (100.0%) | 0 (0.0%) |
| Retail Trade | 11 (15.3%) | 61 (84.7%) |
| Transportation & Warehousing | 121 (96.0%) | 5 (4.0%) |
| Utilities | 0 (0.0%) | 0 (0.0%) |
| Information | 2 (100.0%) | 0 (0.0%) |
| Finance & Insurance | 1 (3.2%) | 30 (96.8%) |
| Real Estate, Rental & Leasing | 3 (100.0%) | 0 (0.0%) |
| Professional & Scientific | 29 (67.4%) | 14 (32.6%) |
| Enterprise Management | 0 (0.0%) | 5 (100.0%) |
| Administrative & Support | 13 (100.0%) | 0 (0.0%) |
| Educational Services | 14 (27.5%) | 37 (72.6%) |
| Health Care & Social Assistance | 25 (19.4%) | 104 (80.6%) |
| Arts, Entertainment & Recreation | 0 (0.0%) | 0 (0.0%) |
| Accommodation & Food Services | 0 (0.0%) | 22 (100.0%) |
| Public Administration | 29 (67.4%) | 14 (32.6%) |
| Total | 416 (55.6%) | 332 (44.4%) |
Education in Hanna City
School Enrollment in Hanna City
The most common levels of schooling among the 181 students in Hanna City are high school (50 | 27.6%), elementary school (36 | 19.9%), and college / undergraduate (35 | 19.3%).
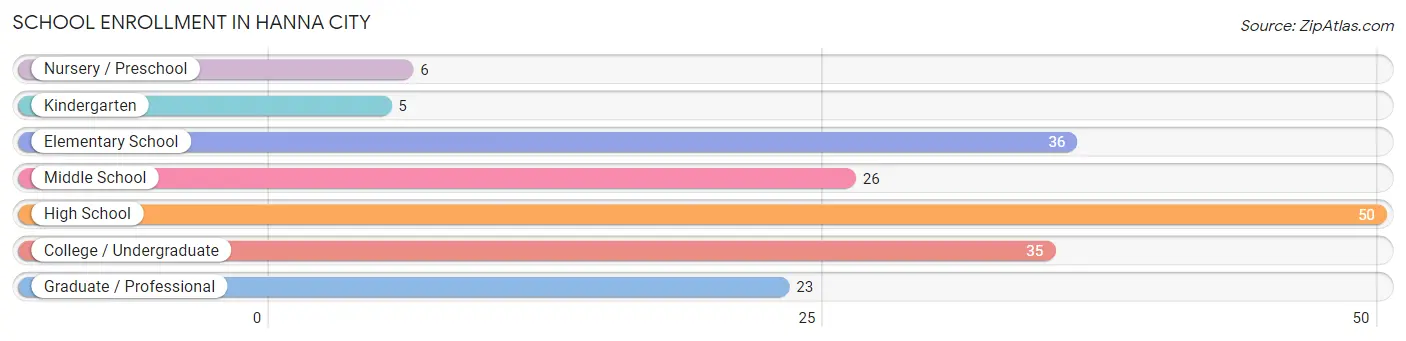
| School Level | # Students | % Students |
| Nursery / Preschool | 6 | 3.3% |
| Kindergarten | 5 | 2.8% |
| Elementary School | 36 | 19.9% |
| Middle School | 26 | 14.4% |
| High School | 50 | 27.6% |
| College / Undergraduate | 35 | 19.3% |
| Graduate / Professional | 23 | 12.7% |
| Total | 181 | 100.0% |
School Enrollment by Age by Funding Source in Hanna City
Out of a total of 181 students who are enrolled in schools in Hanna City, 46 (25.4%) attend a private institution, while the remaining 135 (74.6%) are enrolled in public schools. The age group of 3 to 4 year olds has the highest likelihood of being enrolled in private schools, with 4 (100.0% in the age bracket) enrolled. Conversely, the age group of 18 to 19 year olds has the lowest likelihood of being enrolled in a private school, with 29 (100.0% in the age bracket) attending a public institution.
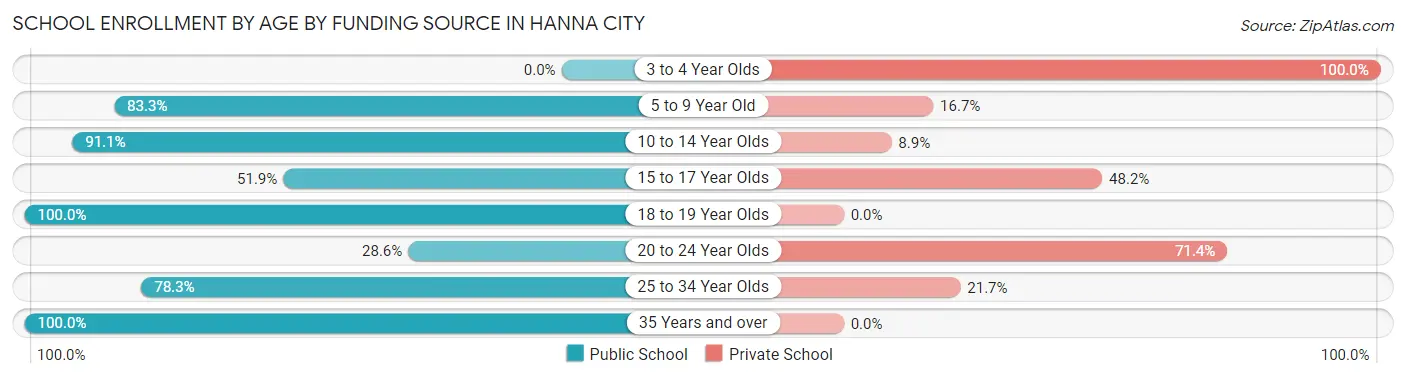
| Age Bracket | Public School | Private School |
| 3 to 4 Year Olds | 0 (0.0%) | 4 (100.0%) |
| 5 to 9 Year Old | 25 (83.3%) | 5 (16.7%) |
| 10 to 14 Year Olds | 41 (91.1%) | 4 (8.9%) |
| 15 to 17 Year Olds | 14 (51.8%) | 13 (48.1%) |
| 18 to 19 Year Olds | 29 (100.0%) | 0 (0.0%) |
| 20 to 24 Year Olds | 6 (28.6%) | 15 (71.4%) |
| 25 to 34 Year Olds | 18 (78.3%) | 5 (21.7%) |
| 35 Years and over | 2 (100.0%) | 0 (0.0%) |
| Total | 135 (74.6%) | 46 (25.4%) |
Educational Attainment by Field of Study in Hanna City
Education (44 | 17.2%), business (40 | 15.7%), liberal arts & history (38 | 14.9%), science & technology (31 | 12.2%), and arts & humanities (28 | 11.0%) are the most common fields of study among 255 individuals in Hanna City who have obtained a bachelor's degree or higher.
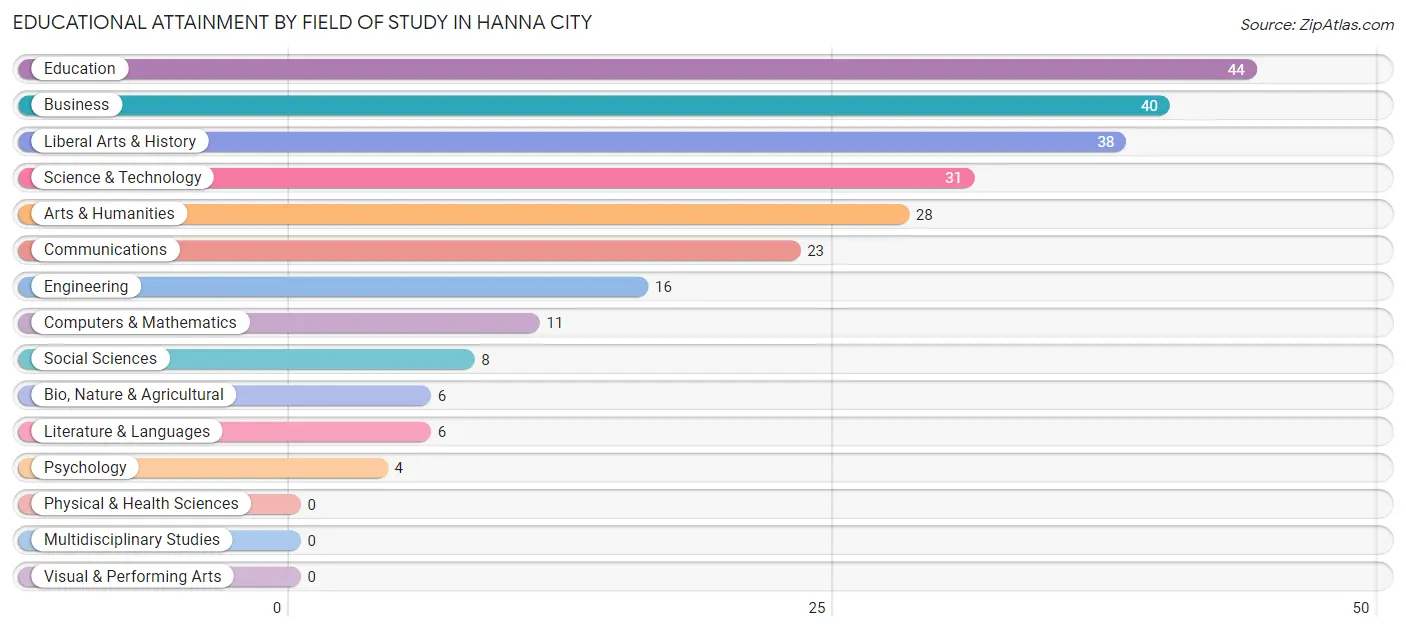
| Field of Study | # Graduates | % Graduates |
| Computers & Mathematics | 11 | 4.3% |
| Bio, Nature & Agricultural | 6 | 2.4% |
| Physical & Health Sciences | 0 | 0.0% |
| Psychology | 4 | 1.6% |
| Social Sciences | 8 | 3.1% |
| Engineering | 16 | 6.3% |
| Multidisciplinary Studies | 0 | 0.0% |
| Science & Technology | 31 | 12.2% |
| Business | 40 | 15.7% |
| Education | 44 | 17.2% |
| Literature & Languages | 6 | 2.4% |
| Liberal Arts & History | 38 | 14.9% |
| Visual & Performing Arts | 0 | 0.0% |
| Communications | 23 | 9.0% |
| Arts & Humanities | 28 | 11.0% |
| Total | 255 | 100.0% |
Transportation & Commute in Hanna City
Vehicle Availability by Sex in Hanna City
The most prevalent vehicle ownership categories in Hanna City are males with 2 vehicles (238, accounting for 56.5%) and females with 2 vehicles (138, making up 74.1%).
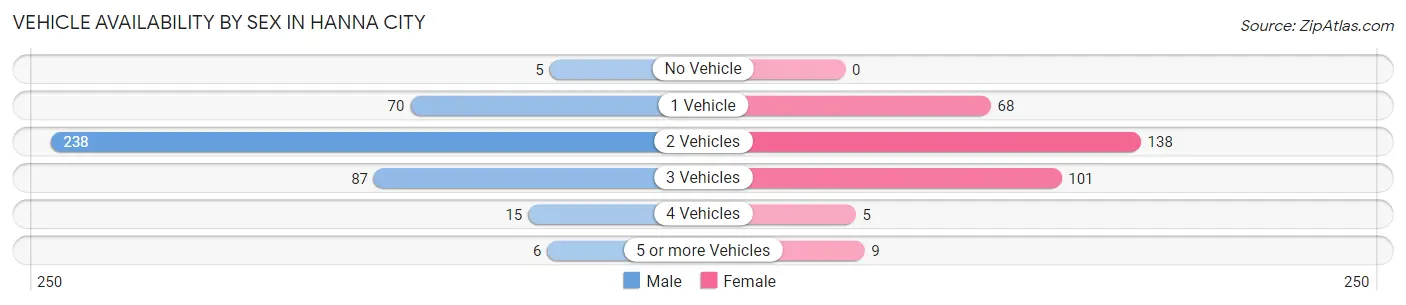
| Vehicles Available | Male | Female |
| No Vehicle | 5 (1.2%) | 0 (0.0%) |
| 1 Vehicle | 70 (16.6%) | 68 (21.2%) |
| 2 Vehicles | 238 (56.5%) | 138 (43.0%) |
| 3 Vehicles | 87 (20.7%) | 101 (31.5%) |
| 4 Vehicles | 15 (3.6%) | 5 (1.6%) |
| 5 or more Vehicles | 6 (1.4%) | 9 (2.8%) |
| Total | 421 (100.0%) | 321 (100.0%) |
Commute Time in Hanna City
The most frequently occuring commute durations in Hanna City are 20 to 24 minutes (304 commuters, 44.0%), 25 to 29 minutes (111 commuters, 16.1%), and 30 to 34 minutes (72 commuters, 10.4%).
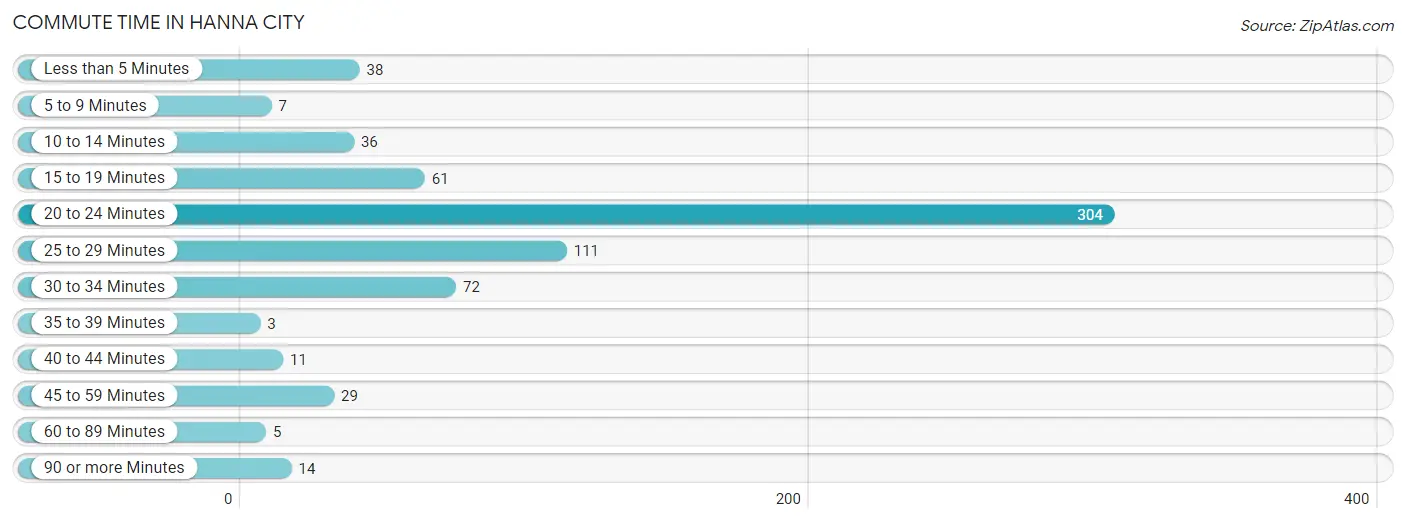
| Commute Time | # Commuters | % Commuters |
| Less than 5 Minutes | 38 | 5.5% |
| 5 to 9 Minutes | 7 | 1.0% |
| 10 to 14 Minutes | 36 | 5.2% |
| 15 to 19 Minutes | 61 | 8.8% |
| 20 to 24 Minutes | 304 | 44.0% |
| 25 to 29 Minutes | 111 | 16.1% |
| 30 to 34 Minutes | 72 | 10.4% |
| 35 to 39 Minutes | 3 | 0.4% |
| 40 to 44 Minutes | 11 | 1.6% |
| 45 to 59 Minutes | 29 | 4.2% |
| 60 to 89 Minutes | 5 | 0.7% |
| 90 or more Minutes | 14 | 2.0% |
Commute Time by Sex in Hanna City
The most common commute times in Hanna City are 20 to 24 minutes (191 commuters, 46.8%) for males and 20 to 24 minutes (113 commuters, 39.9%) for females.
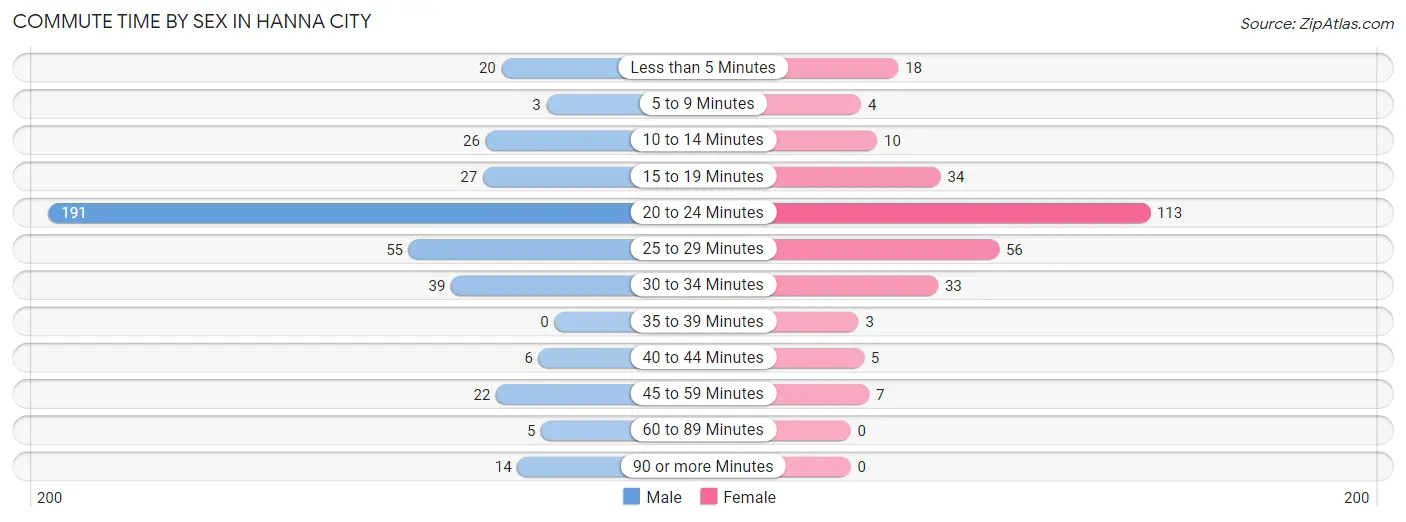
| Commute Time | Male | Female |
| Less than 5 Minutes | 20 (4.9%) | 18 (6.4%) |
| 5 to 9 Minutes | 3 (0.7%) | 4 (1.4%) |
| 10 to 14 Minutes | 26 (6.4%) | 10 (3.5%) |
| 15 to 19 Minutes | 27 (6.6%) | 34 (12.0%) |
| 20 to 24 Minutes | 191 (46.8%) | 113 (39.9%) |
| 25 to 29 Minutes | 55 (13.5%) | 56 (19.8%) |
| 30 to 34 Minutes | 39 (9.6%) | 33 (11.7%) |
| 35 to 39 Minutes | 0 (0.0%) | 3 (1.1%) |
| 40 to 44 Minutes | 6 (1.5%) | 5 (1.8%) |
| 45 to 59 Minutes | 22 (5.4%) | 7 (2.5%) |
| 60 to 89 Minutes | 5 (1.2%) | 0 (0.0%) |
| 90 or more Minutes | 14 (3.4%) | 0 (0.0%) |
Time of Departure to Work by Sex in Hanna City
The most frequent times of departure to work in Hanna City are 6:00 AM to 6:29 AM (173, 42.4%) for males and 7:30 AM to 7:59 AM (77, 27.2%) for females.
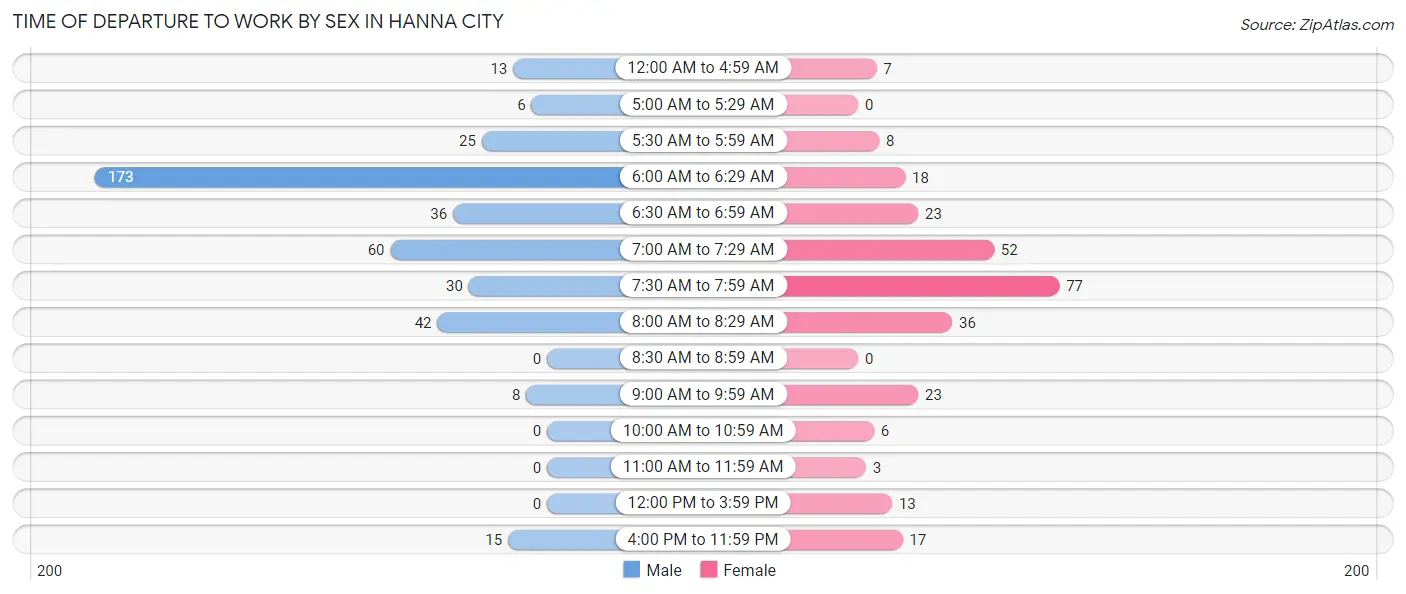
| Time of Departure | Male | Female |
| 12:00 AM to 4:59 AM | 13 (3.2%) | 7 (2.5%) |
| 5:00 AM to 5:29 AM | 6 (1.5%) | 0 (0.0%) |
| 5:30 AM to 5:59 AM | 25 (6.1%) | 8 (2.8%) |
| 6:00 AM to 6:29 AM | 173 (42.4%) | 18 (6.4%) |
| 6:30 AM to 6:59 AM | 36 (8.8%) | 23 (8.1%) |
| 7:00 AM to 7:29 AM | 60 (14.7%) | 52 (18.4%) |
| 7:30 AM to 7:59 AM | 30 (7.3%) | 77 (27.2%) |
| 8:00 AM to 8:29 AM | 42 (10.3%) | 36 (12.7%) |
| 8:30 AM to 8:59 AM | 0 (0.0%) | 0 (0.0%) |
| 9:00 AM to 9:59 AM | 8 (2.0%) | 23 (8.1%) |
| 10:00 AM to 10:59 AM | 0 (0.0%) | 6 (2.1%) |
| 11:00 AM to 11:59 AM | 0 (0.0%) | 3 (1.1%) |
| 12:00 PM to 3:59 PM | 0 (0.0%) | 13 (4.6%) |
| 4:00 PM to 11:59 PM | 15 (3.7%) | 17 (6.0%) |
| Total | 408 (100.0%) | 283 (100.0%) |
Housing Occupancy in Hanna City
Occupancy by Ownership in Hanna City
Of the total 762 dwellings in Hanna City, owner-occupied units account for 620 (81.4%), while renter-occupied units make up 142 (18.6%).
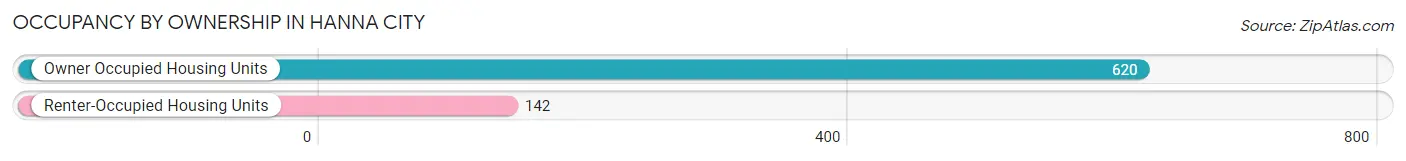
| Occupancy | # Housing Units | % Housing Units |
| Owner Occupied Housing Units | 620 | 81.4% |
| Renter-Occupied Housing Units | 142 | 18.6% |
| Total Occupied Housing Units | 762 | 100.0% |
Occupancy by Household Size in Hanna City
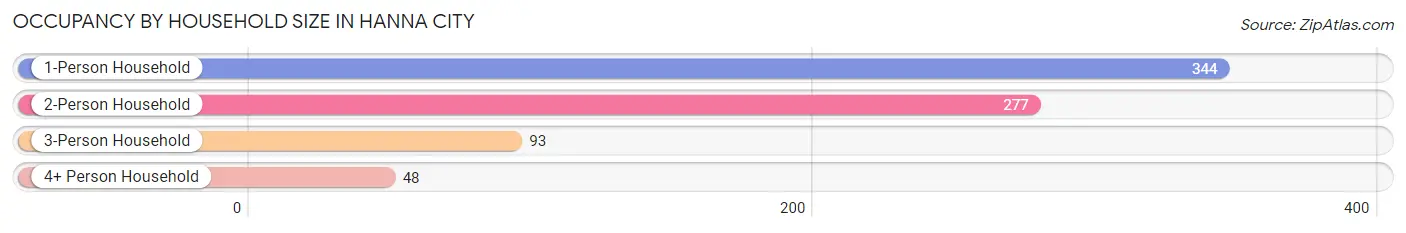
| Household Size | # Housing Units | % Housing Units |
| 1-Person Household | 344 | 45.1% |
| 2-Person Household | 277 | 36.3% |
| 3-Person Household | 93 | 12.2% |
| 4+ Person Household | 48 | 6.3% |
| Total Housing Units | 762 | 100.0% |
Occupancy by Ownership by Household Size in Hanna City
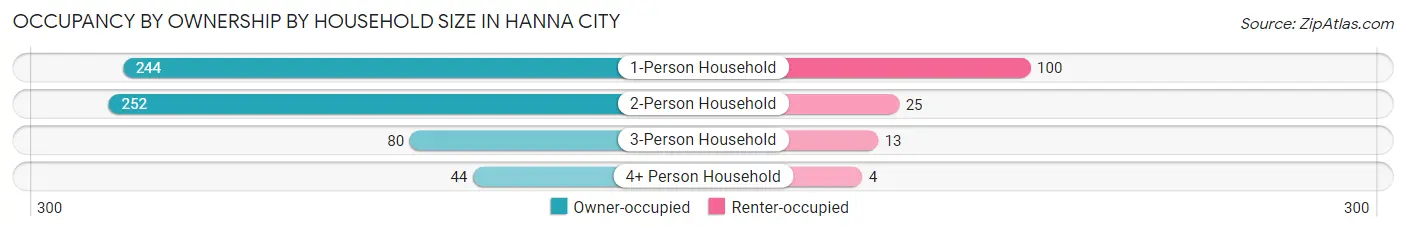
| Household Size | Owner-occupied | Renter-occupied |
| 1-Person Household | 244 (70.9%) | 100 (29.1%) |
| 2-Person Household | 252 (91.0%) | 25 (9.0%) |
| 3-Person Household | 80 (86.0%) | 13 (14.0%) |
| 4+ Person Household | 44 (91.7%) | 4 (8.3%) |
| Total Housing Units | 620 (81.4%) | 142 (18.6%) |
Occupancy by Educational Attainment in Hanna City
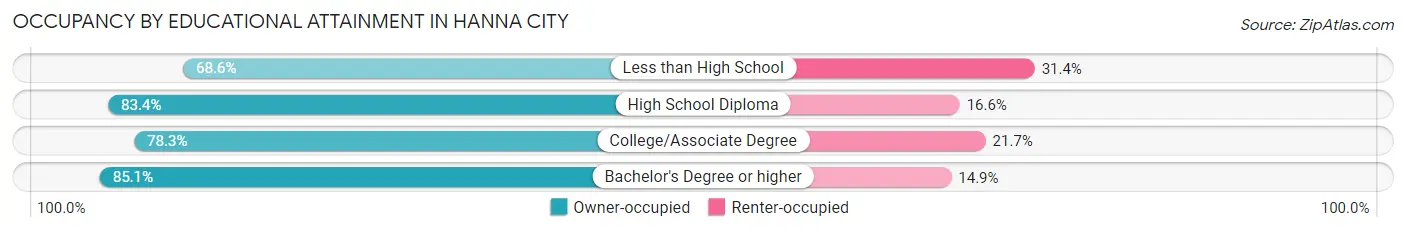
| Household Size | Owner-occupied | Renter-occupied |
| Less than High School | 24 (68.6%) | 11 (31.4%) |
| High School Diploma | 257 (83.4%) | 51 (16.6%) |
| College/Associate Degree | 202 (78.3%) | 56 (21.7%) |
| Bachelor's Degree or higher | 137 (85.1%) | 24 (14.9%) |
Occupancy by Age of Householder in Hanna City
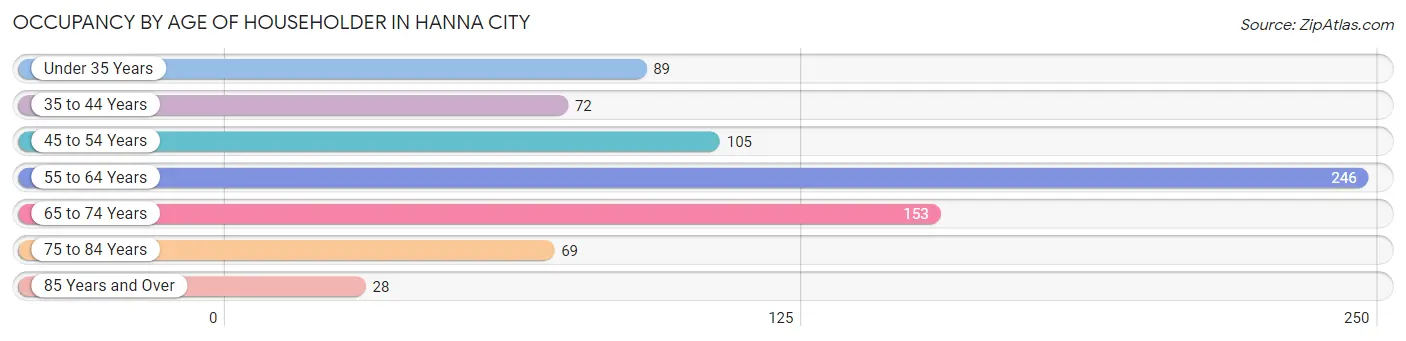
| Age Bracket | # Households | % Households |
| Under 35 Years | 89 | 11.7% |
| 35 to 44 Years | 72 | 9.5% |
| 45 to 54 Years | 105 | 13.8% |
| 55 to 64 Years | 246 | 32.3% |
| 65 to 74 Years | 153 | 20.1% |
| 75 to 84 Years | 69 | 9.1% |
| 85 Years and Over | 28 | 3.7% |
| Total | 762 | 100.0% |
Housing Finances in Hanna City
Median Income by Occupancy in Hanna City
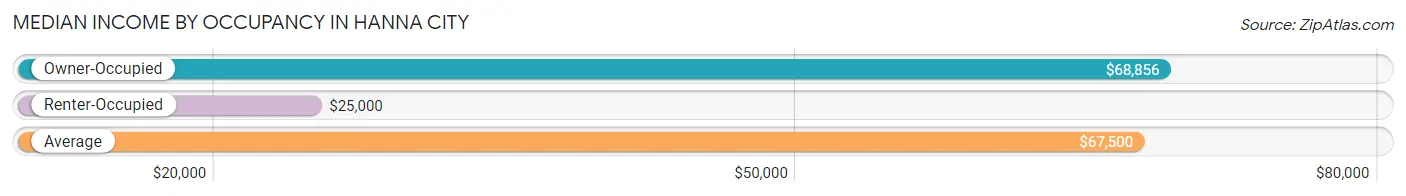
| Occupancy Type | # Households | Median Income |
| Owner-Occupied | 620 (81.4%) | $68,856 |
| Renter-Occupied | 142 (18.6%) | $25,000 |
| Average | 762 (100.0%) | $67,500 |
Occupancy by Householder Income Bracket in Hanna City
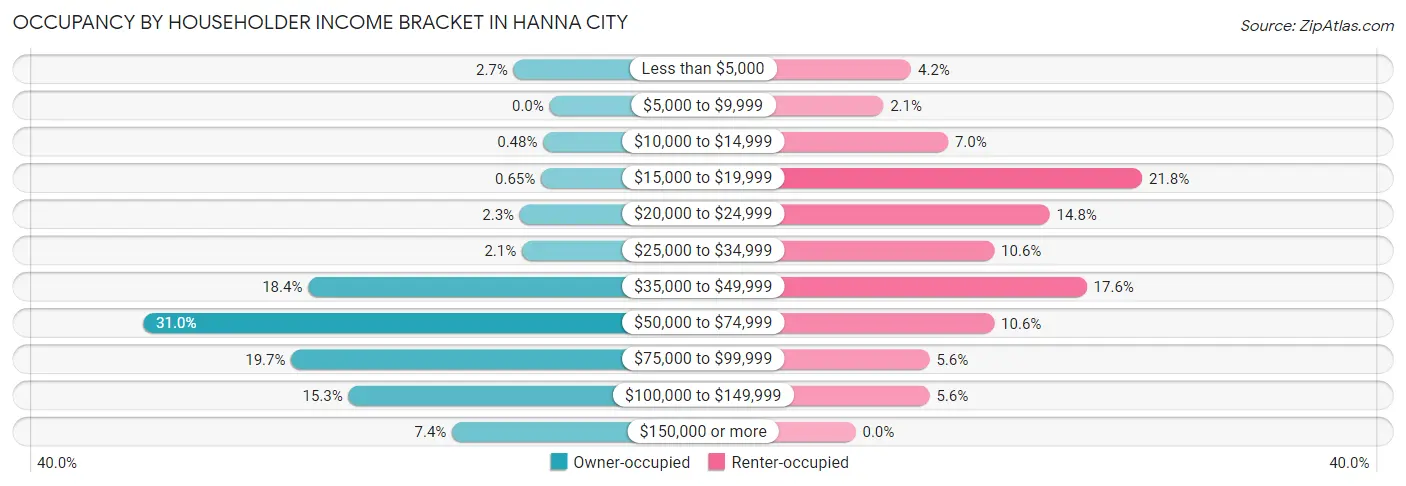
| Income Bracket | Owner-occupied | Renter-occupied |
| Less than $5,000 | 17 (2.7%) | 6 (4.2%) |
| $5,000 to $9,999 | 0 (0.0%) | 3 (2.1%) |
| $10,000 to $14,999 | 3 (0.5%) | 10 (7.0%) |
| $15,000 to $19,999 | 4 (0.6%) | 31 (21.8%) |
| $20,000 to $24,999 | 14 (2.3%) | 21 (14.8%) |
| $25,000 to $34,999 | 13 (2.1%) | 15 (10.6%) |
| $35,000 to $49,999 | 114 (18.4%) | 25 (17.6%) |
| $50,000 to $74,999 | 192 (31.0%) | 15 (10.6%) |
| $75,000 to $99,999 | 122 (19.7%) | 8 (5.6%) |
| $100,000 to $149,999 | 95 (15.3%) | 8 (5.6%) |
| $150,000 or more | 46 (7.4%) | 0 (0.0%) |
| Total | 620 (100.0%) | 142 (100.0%) |
Monthly Housing Cost Tiers in Hanna City
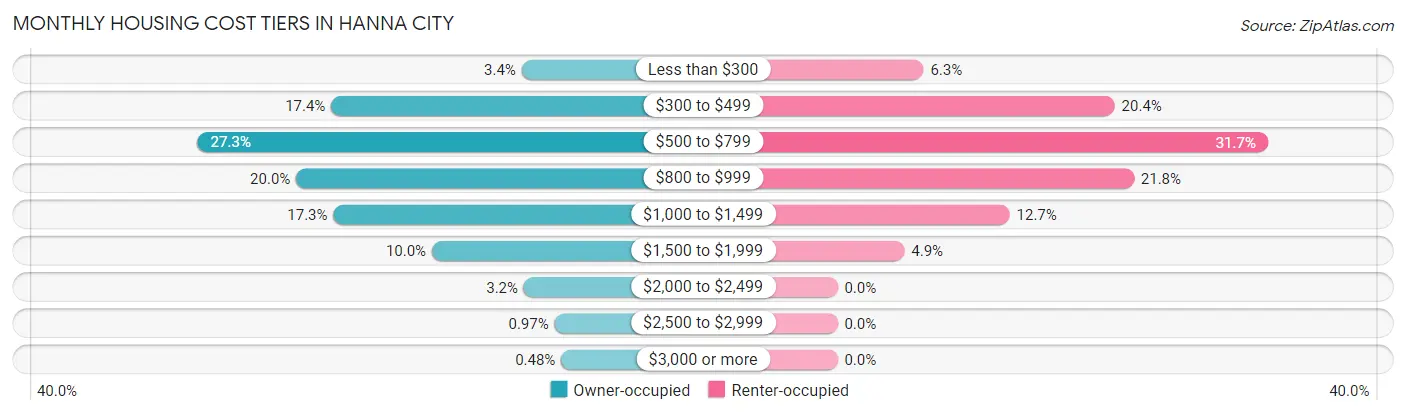
| Monthly Cost | Owner-occupied | Renter-occupied |
| Less than $300 | 21 (3.4%) | 9 (6.3%) |
| $300 to $499 | 108 (17.4%) | 29 (20.4%) |
| $500 to $799 | 169 (27.3%) | 45 (31.7%) |
| $800 to $999 | 124 (20.0%) | 31 (21.8%) |
| $1,000 to $1,499 | 107 (17.3%) | 18 (12.7%) |
| $1,500 to $1,999 | 62 (10.0%) | 7 (4.9%) |
| $2,000 to $2,499 | 20 (3.2%) | 0 (0.0%) |
| $2,500 to $2,999 | 6 (1.0%) | 0 (0.0%) |
| $3,000 or more | 3 (0.5%) | 0 (0.0%) |
| Total | 620 (100.0%) | 142 (100.0%) |
Physical Housing Characteristics in Hanna City
Housing Structures in Hanna City
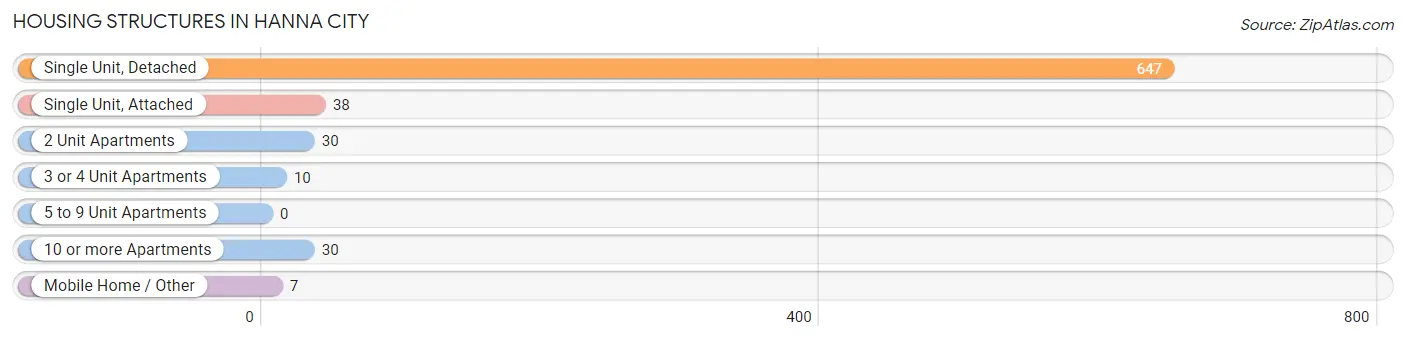
| Structure Type | # Housing Units | % Housing Units |
| Single Unit, Detached | 647 | 84.9% |
| Single Unit, Attached | 38 | 5.0% |
| 2 Unit Apartments | 30 | 3.9% |
| 3 or 4 Unit Apartments | 10 | 1.3% |
| 5 to 9 Unit Apartments | 0 | 0.0% |
| 10 or more Apartments | 30 | 3.9% |
| Mobile Home / Other | 7 | 0.9% |
| Total | 762 | 100.0% |
Housing Structures by Occupancy in Hanna City
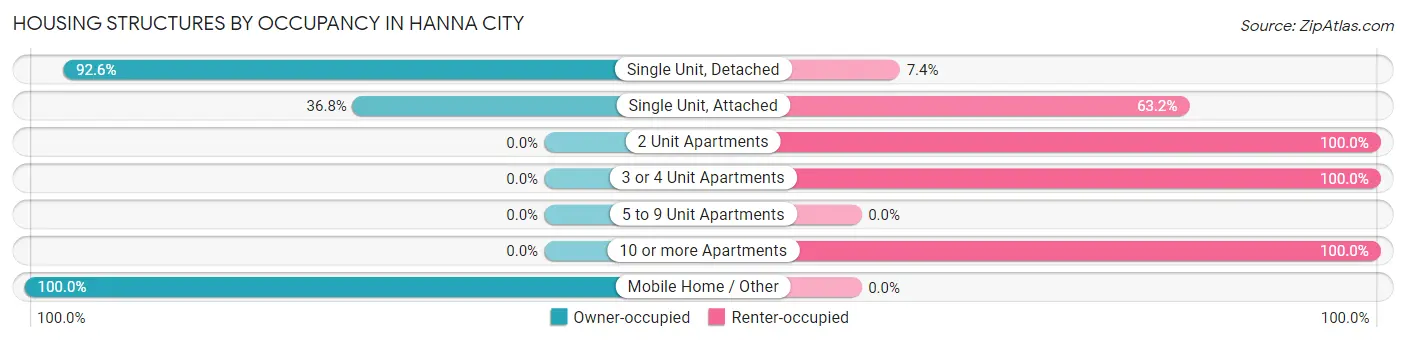
| Structure Type | Owner-occupied | Renter-occupied |
| Single Unit, Detached | 599 (92.6%) | 48 (7.4%) |
| Single Unit, Attached | 14 (36.8%) | 24 (63.2%) |
| 2 Unit Apartments | 0 (0.0%) | 30 (100.0%) |
| 3 or 4 Unit Apartments | 0 (0.0%) | 10 (100.0%) |
| 5 to 9 Unit Apartments | 0 (0.0%) | 0 (0.0%) |
| 10 or more Apartments | 0 (0.0%) | 30 (100.0%) |
| Mobile Home / Other | 7 (100.0%) | 0 (0.0%) |
| Total | 620 (81.4%) | 142 (18.6%) |
Housing Structures by Number of Rooms in Hanna City
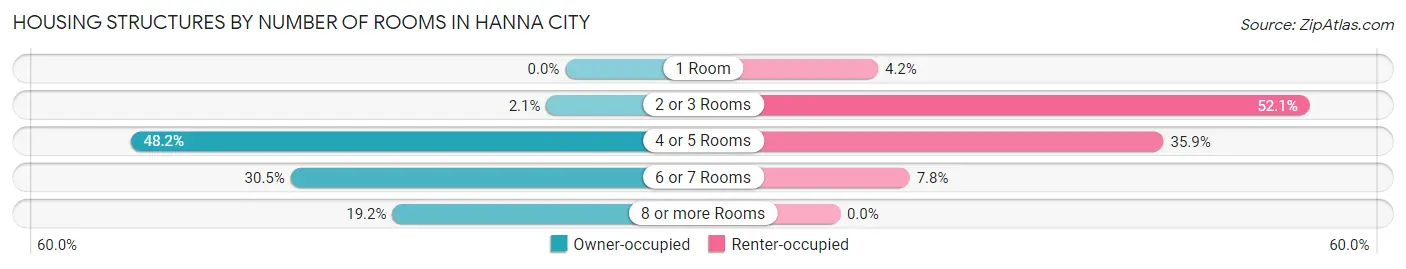
| Number of Rooms | Owner-occupied | Renter-occupied |
| 1 Room | 0 (0.0%) | 6 (4.2%) |
| 2 or 3 Rooms | 13 (2.1%) | 74 (52.1%) |
| 4 or 5 Rooms | 299 (48.2%) | 51 (35.9%) |
| 6 or 7 Rooms | 189 (30.5%) | 11 (7.7%) |
| 8 or more Rooms | 119 (19.2%) | 0 (0.0%) |
| Total | 620 (100.0%) | 142 (100.0%) |
Housing Structure by Heating Type in Hanna City
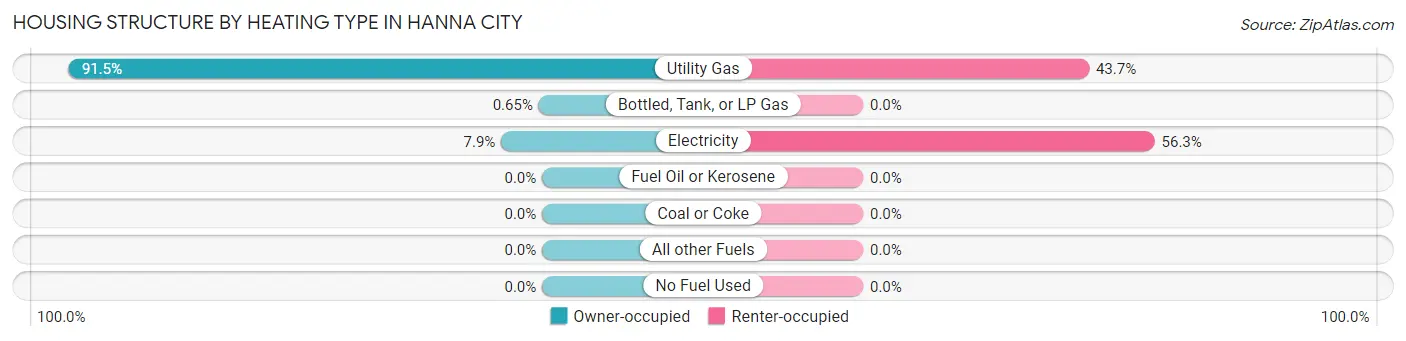
| Heating Type | Owner-occupied | Renter-occupied |
| Utility Gas | 567 (91.4%) | 62 (43.7%) |
| Bottled, Tank, or LP Gas | 4 (0.6%) | 0 (0.0%) |
| Electricity | 49 (7.9%) | 80 (56.3%) |
| Fuel Oil or Kerosene | 0 (0.0%) | 0 (0.0%) |
| Coal or Coke | 0 (0.0%) | 0 (0.0%) |
| All other Fuels | 0 (0.0%) | 0 (0.0%) |
| No Fuel Used | 0 (0.0%) | 0 (0.0%) |
| Total | 620 (100.0%) | 142 (100.0%) |
Household Vehicle Usage in Hanna City
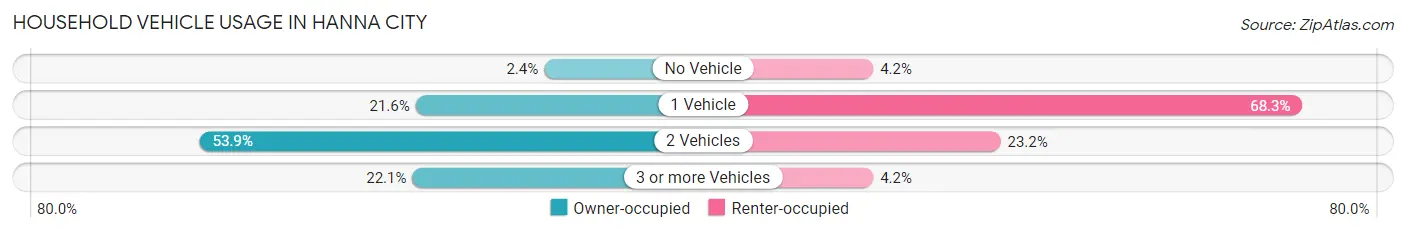
| Vehicles per Household | Owner-occupied | Renter-occupied |
| No Vehicle | 15 (2.4%) | 6 (4.2%) |
| 1 Vehicle | 134 (21.6%) | 97 (68.3%) |
| 2 Vehicles | 334 (53.9%) | 33 (23.2%) |
| 3 or more Vehicles | 137 (22.1%) | 6 (4.2%) |
| Total | 620 (100.0%) | 142 (100.0%) |
Real Estate & Mortgages in Hanna City
Real Estate and Mortgage Overview in Hanna City
| Characteristic | Without Mortgage | With Mortgage |
| Housing Units | 272 | 348 |
| Median Property Value | $130,300 | $119,800 |
| Median Household Income | $55,833 | $34 |
| Monthly Housing Costs | $516 | $3 |
| Real Estate Taxes | $2,450 | $0 |
Property Value by Mortgage Status in Hanna City
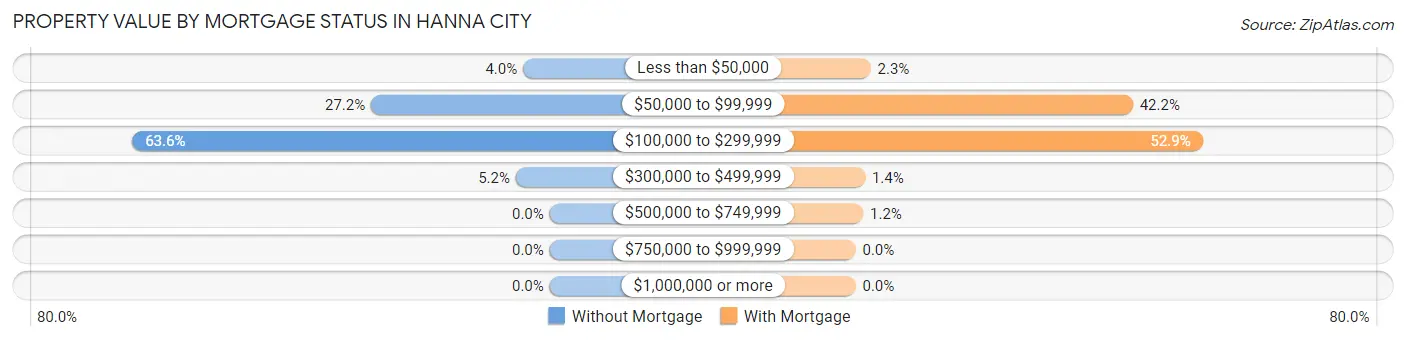
| Property Value | Without Mortgage | With Mortgage |
| Less than $50,000 | 11 (4.0%) | 8 (2.3%) |
| $50,000 to $99,999 | 74 (27.2%) | 147 (42.2%) |
| $100,000 to $299,999 | 173 (63.6%) | 184 (52.9%) |
| $300,000 to $499,999 | 14 (5.1%) | 5 (1.4%) |
| $500,000 to $749,999 | 0 (0.0%) | 4 (1.1%) |
| $750,000 to $999,999 | 0 (0.0%) | 0 (0.0%) |
| $1,000,000 or more | 0 (0.0%) | 0 (0.0%) |
| Total | 272 (100.0%) | 348 (100.0%) |
Household Income by Mortgage Status in Hanna City
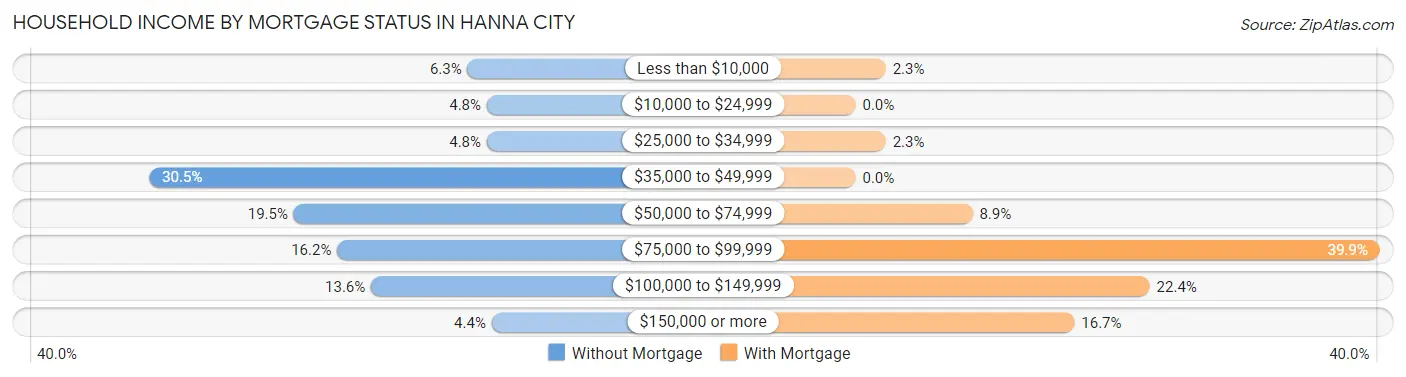
| Household Income | Without Mortgage | With Mortgage |
| Less than $10,000 | 17 (6.2%) | 8 (2.3%) |
| $10,000 to $24,999 | 13 (4.8%) | 0 (0.0%) |
| $25,000 to $34,999 | 13 (4.8%) | 8 (2.3%) |
| $35,000 to $49,999 | 83 (30.5%) | 0 (0.0%) |
| $50,000 to $74,999 | 53 (19.5%) | 31 (8.9%) |
| $75,000 to $99,999 | 44 (16.2%) | 139 (39.9%) |
| $100,000 to $149,999 | 37 (13.6%) | 78 (22.4%) |
| $150,000 or more | 12 (4.4%) | 58 (16.7%) |
| Total | 272 (100.0%) | 348 (100.0%) |
Property Value to Household Income Ratio in Hanna City
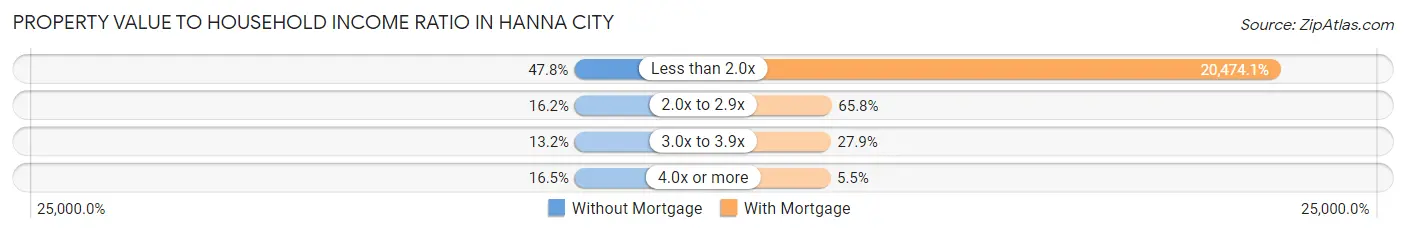
| Value-to-Income Ratio | Without Mortgage | With Mortgage |
| Less than 2.0x | 130 (47.8%) | 71,250 (20,474.1%) |
| 2.0x to 2.9x | 44 (16.2%) | 229 (65.8%) |
| 3.0x to 3.9x | 36 (13.2%) | 97 (27.9%) |
| 4.0x or more | 45 (16.5%) | 19 (5.5%) |
| Total | 272 (100.0%) | 348 (100.0%) |
Real Estate Taxes by Mortgage Status in Hanna City
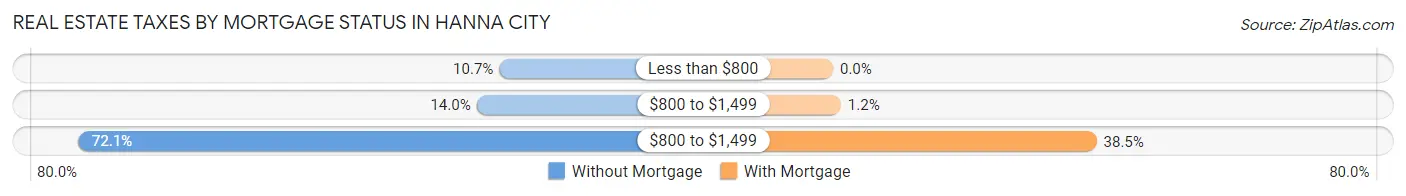
| Property Taxes | Without Mortgage | With Mortgage |
| Less than $800 | 29 (10.7%) | 0 (0.0%) |
| $800 to $1,499 | 38 (14.0%) | 4 (1.1%) |
| $800 to $1,499 | 196 (72.1%) | 134 (38.5%) |
| Total | 272 (100.0%) | 348 (100.0%) |
Health & Disability in Hanna City
Health Insurance Coverage by Age in Hanna City
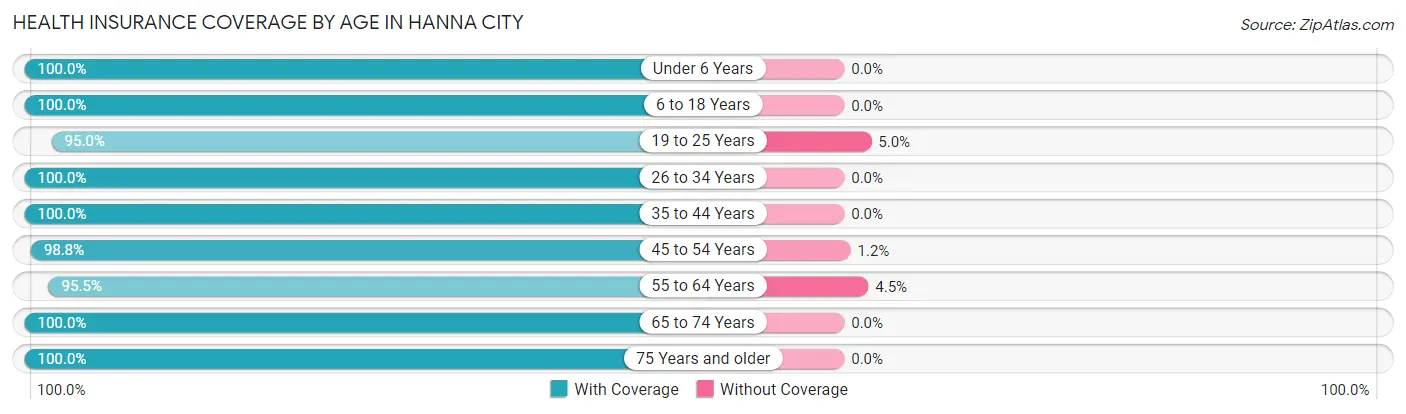
| Age Bracket | With Coverage | Without Coverage |
| Under 6 Years | 59 (100.0%) | 0 (0.0%) |
| 6 to 18 Years | 128 (100.0%) | 0 (0.0%) |
| 19 to 25 Years | 132 (95.0%) | 7 (5.0%) |
| 26 to 34 Years | 84 (100.0%) | 0 (0.0%) |
| 35 to 44 Years | 126 (100.0%) | 0 (0.0%) |
| 45 to 54 Years | 169 (98.8%) | 2 (1.2%) |
| 55 to 64 Years | 320 (95.5%) | 15 (4.5%) |
| 65 to 74 Years | 231 (100.0%) | 0 (0.0%) |
| 75 Years and older | 139 (100.0%) | 0 (0.0%) |
| Total | 1,388 (98.3%) | 24 (1.7%) |
Health Insurance Coverage by Citizenship Status in Hanna City
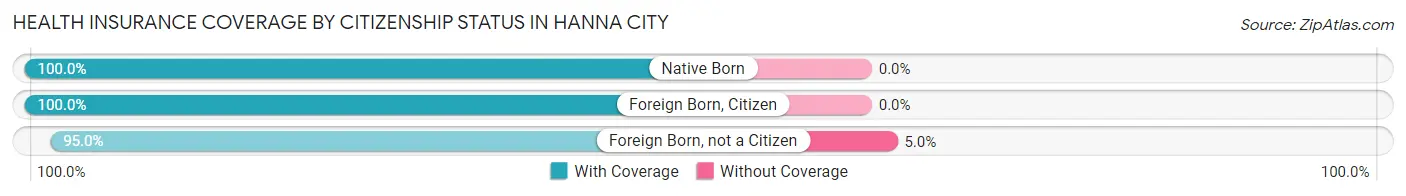
| Citizenship Status | With Coverage | Without Coverage |
| Native Born | 59 (100.0%) | 0 (0.0%) |
| Foreign Born, Citizen | 128 (100.0%) | 0 (0.0%) |
| Foreign Born, not a Citizen | 132 (95.0%) | 7 (5.0%) |
Health Insurance Coverage by Household Income in Hanna City
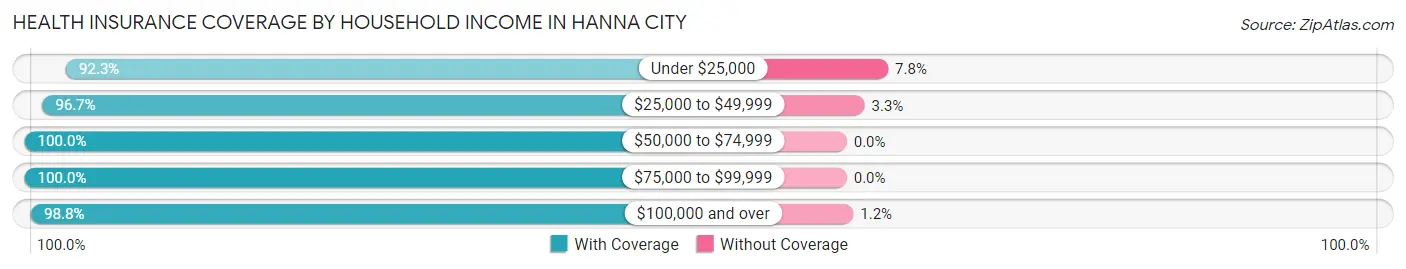
| Household Income | With Coverage | Without Coverage |
| Under $25,000 | 119 (92.2%) | 10 (7.7%) |
| $25,000 to $49,999 | 261 (96.7%) | 9 (3.3%) |
| $50,000 to $74,999 | 304 (100.0%) | 0 (0.0%) |
| $75,000 to $99,999 | 304 (100.0%) | 0 (0.0%) |
| $100,000 and over | 400 (98.8%) | 5 (1.2%) |
Public vs Private Health Insurance Coverage by Age in Hanna City

| Age Bracket | Public Insurance | Private Insurance |
| Under 6 | 15 (25.4%) | 59 (100.0%) |
| 6 to 18 Years | 24 (18.8%) | 121 (94.5%) |
| 19 to 25 Years | 44 (31.7%) | 95 (68.3%) |
| 25 to 34 Years | 4 (4.8%) | 80 (95.2%) |
| 35 to 44 Years | 14 (11.1%) | 122 (96.8%) |
| 45 to 54 Years | 28 (16.4%) | 141 (82.5%) |
| 55 to 64 Years | 25 (7.5%) | 306 (91.3%) |
| 65 to 74 Years | 231 (100.0%) | 181 (78.3%) |
| 75 Years and over | 139 (100.0%) | 114 (82.0%) |
| Total | 524 (37.1%) | 1,219 (86.3%) |
Disability Status by Sex by Age in Hanna City
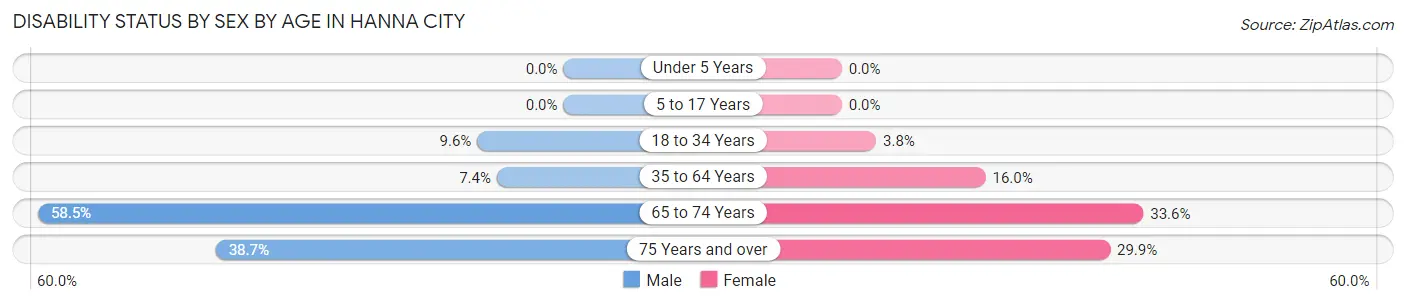
| Age Bracket | Male | Female |
| Under 5 Years | 0 (0.0%) | 0 (0.0%) |
| 5 to 17 Years | 0 (0.0%) | 0 (0.0%) |
| 18 to 34 Years | 12 (9.6%) | 5 (3.8%) |
| 35 to 64 Years | 26 (7.4%) | 45 (16.0%) |
| 65 to 74 Years | 55 (58.5%) | 46 (33.6%) |
| 75 Years and over | 24 (38.7%) | 23 (29.9%) |
Disability Class by Sex by Age in Hanna City
Disability Class: Hearing Difficulty
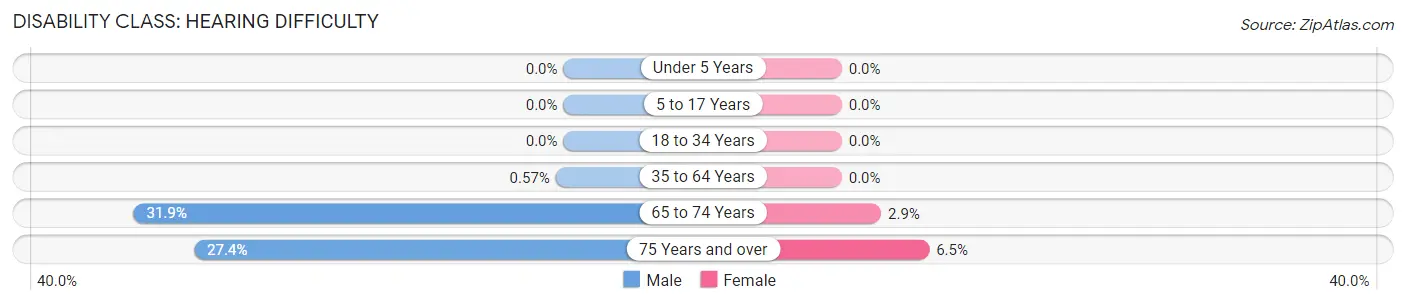
| Age Bracket | Male | Female |
| Under 5 Years | 0 (0.0%) | 0 (0.0%) |
| 5 to 17 Years | 0 (0.0%) | 0 (0.0%) |
| 18 to 34 Years | 0 (0.0%) | 0 (0.0%) |
| 35 to 64 Years | 2 (0.6%) | 0 (0.0%) |
| 65 to 74 Years | 30 (31.9%) | 4 (2.9%) |
| 75 Years and over | 17 (27.4%) | 5 (6.5%) |
Disability Class: Vision Difficulty
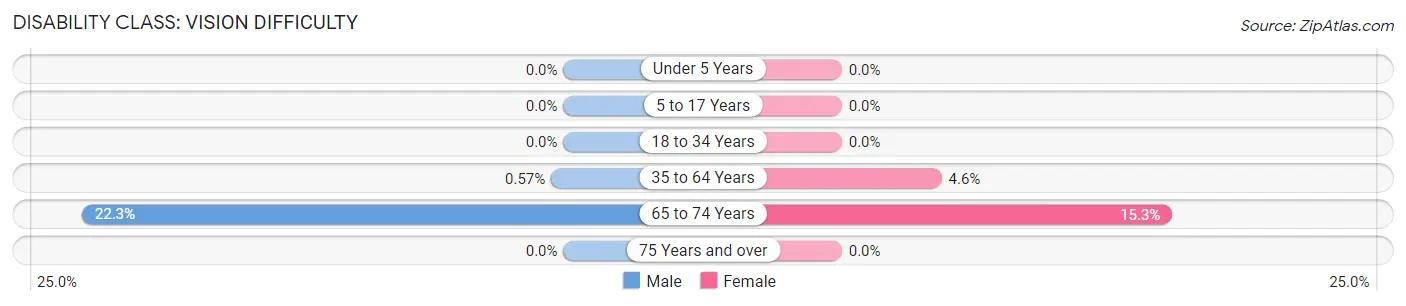
| Age Bracket | Male | Female |
| Under 5 Years | 0 (0.0%) | 0 (0.0%) |
| 5 to 17 Years | 0 (0.0%) | 0 (0.0%) |
| 18 to 34 Years | 0 (0.0%) | 0 (0.0%) |
| 35 to 64 Years | 2 (0.6%) | 13 (4.6%) |
| 65 to 74 Years | 21 (22.3%) | 21 (15.3%) |
| 75 Years and over | 0 (0.0%) | 0 (0.0%) |
Disability Class: Cognitive Difficulty

| Age Bracket | Male | Female |
| 5 to 17 Years | 0 (0.0%) | 0 (0.0%) |
| 18 to 34 Years | 12 (9.6%) | 5 (3.8%) |
| 35 to 64 Years | 9 (2.6%) | 21 (7.5%) |
| 65 to 74 Years | 12 (12.8%) | 4 (2.9%) |
| 75 Years and over | 8 (12.9%) | 5 (6.5%) |
Disability Class: Ambulatory Difficulty
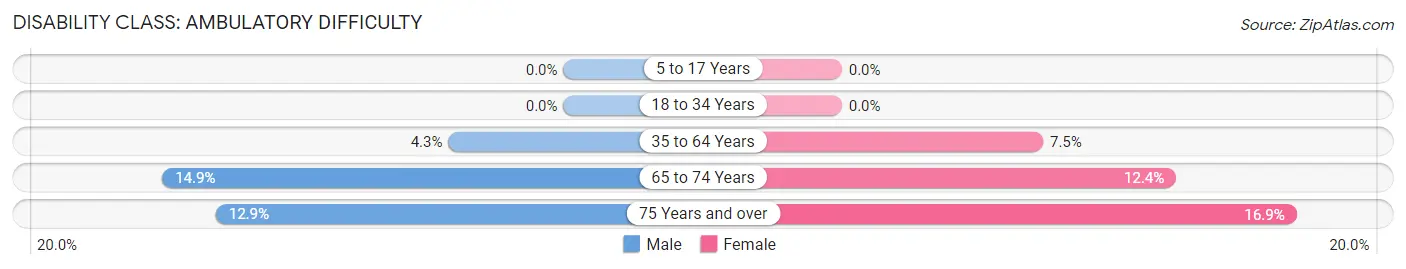
| Age Bracket | Male | Female |
| 5 to 17 Years | 0 (0.0%) | 0 (0.0%) |
| 18 to 34 Years | 0 (0.0%) | 0 (0.0%) |
| 35 to 64 Years | 15 (4.3%) | 21 (7.5%) |
| 65 to 74 Years | 14 (14.9%) | 17 (12.4%) |
| 75 Years and over | 8 (12.9%) | 13 (16.9%) |
Disability Class: Self-Care Difficulty
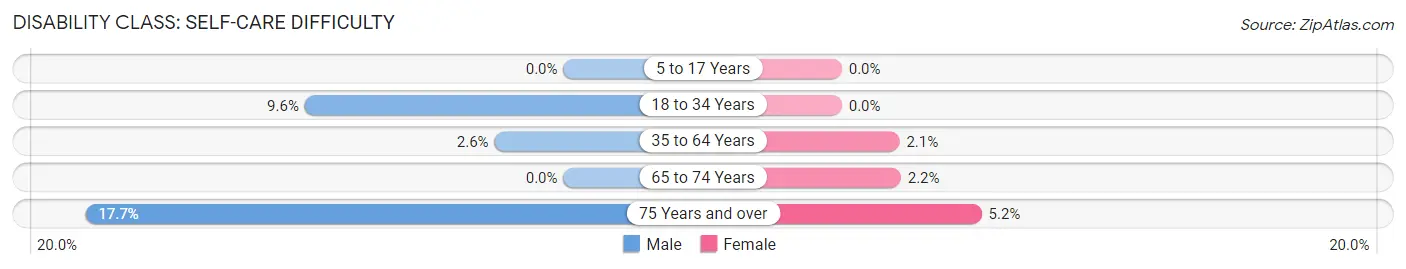
| Age Bracket | Male | Female |
| 5 to 17 Years | 0 (0.0%) | 0 (0.0%) |
| 18 to 34 Years | 12 (9.6%) | 0 (0.0%) |
| 35 to 64 Years | 9 (2.6%) | 6 (2.1%) |
| 65 to 74 Years | 0 (0.0%) | 3 (2.2%) |
| 75 Years and over | 11 (17.7%) | 4 (5.2%) |
Technology Access in Hanna City
Computing Device Access in Hanna City
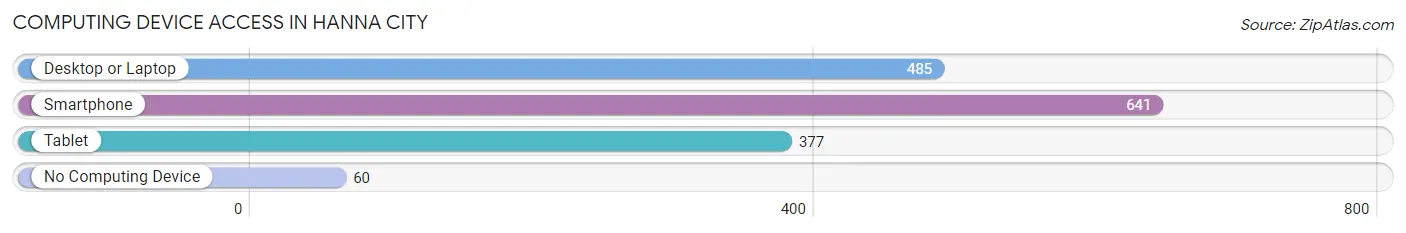
| Device Type | # Households | % Households |
| Desktop or Laptop | 485 | 63.6% |
| Smartphone | 641 | 84.1% |
| Tablet | 377 | 49.5% |
| No Computing Device | 60 | 7.9% |
| Total | 762 | 100.0% |
Internet Access in Hanna City
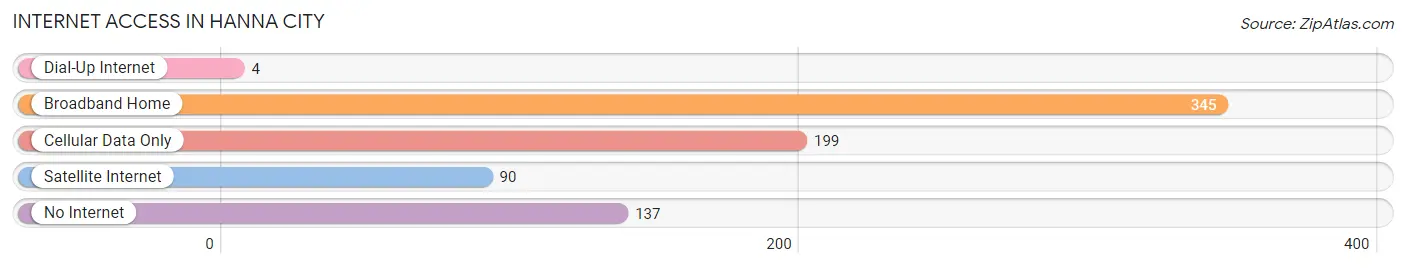
| Internet Type | # Households | % Households |
| Dial-Up Internet | 4 | 0.5% |
| Broadband Home | 345 | 45.3% |
| Cellular Data Only | 199 | 26.1% |
| Satellite Internet | 90 | 11.8% |
| No Internet | 137 | 18.0% |
| Total | 762 | 100.0% |
Hanna City Summary
Hanna City is a small village located in Peoria County, Illinois. It is situated in the northern part of the state, about 20 miles northwest of Peoria. The village has a population of 1,093 people, according to the 2010 census.
Geography
Hanna City is located in the northern part of Peoria County, Illinois. It is situated in the northern part of the state, about 20 miles northwest of Peoria. The village is located on the banks of the Illinois River, and is surrounded by rolling hills and farmland. The village is located in the Tazewell-Woodford County line, and is bordered by the towns of Elmwood, Trivoli, and Princeville.
The village is located in the Central Till Plain, which is a flat, fertile region of the Midwest. The area is known for its rich soil and abundant rainfall, which makes it ideal for farming. The village is located in the Central Till Plain, which is a flat, fertile region of the Midwest. The area is known for its rich soil and abundant rainfall, which makes it ideal for farming.
History
Hanna City was founded in 1836 by William Hanna, a settler from Ohio. The village was named after him, and was originally a small farming community. The village grew slowly over the years, and by the late 19th century, it had become a thriving agricultural center. The village was home to several businesses, including a flour mill, a sawmill, and a blacksmith shop.
In the early 20th century, the village began to experience a decline in population as people moved away to larger cities. However, the village was able to maintain its small-town charm, and today it is still a quiet, rural community.
Economy
Hanna City’s economy is largely based on agriculture. The village is home to several farms, which produce a variety of crops, including corn, soybeans, and wheat. The village also has several small businesses, including a grocery store, a hardware store, and a restaurant.
The village is also home to several manufacturing companies, including a plastics factory and a metal fabrication plant. These companies provide employment for many of the village’s residents.
Demographics
According to the 2010 census, the population of Hanna City was 1,093. The village is predominantly white, with 92.3% of the population identifying as white. The remaining 7.7% of the population is made up of African Americans, Hispanics, and other races.
The median household income in Hanna City is $45,938, which is slightly lower than the national average. The village has a poverty rate of 11.3%, which is slightly higher than the national average.
Conclusion
Hanna City is a small village located in Peoria County, Illinois. It is situated in the northern part of the state, about 20 miles northwest of Peoria. The village has a population of 1,093 people, according to the 2010 census. The village’s economy is largely based on agriculture, and it is home to several small businesses. The village is predominantly white, with 92.3% of the population identifying as white. The median household income in Hanna City is $45,938, which is slightly lower than the national average.
Common Questions
What is Per Capita Income in Hanna City?
Per Capita income in Hanna City is $37,729.
What is the Median Family Income in Hanna City?
Median Family Income in Hanna City is $85,694.
What is the Median Household income in Hanna City?
Median Household Income in Hanna City is $67,500.
What is Income or Wage Gap in Hanna City?
Income or Wage Gap in Hanna City is 46.3%.
Women in Hanna City earn 53.7 cents for every dollar earned by a man.
What is Family Income Deficit in Hanna City?
Family Income Deficit in Hanna City is $7,586.
Families that are below poverty line in Hanna City earn $7,586 less on average than the poverty threshold level.
What is Inequality or Gini Index in Hanna City?
Inequality or Gini Index in Hanna City is 0.33.
What is the Total Population of Hanna City?
Total Population of Hanna City is 1,417.
What is the Total Male Population of Hanna City?
Total Male Population of Hanna City is 722.
What is the Total Female Population of Hanna City?
Total Female Population of Hanna City is 695.
What is the Ratio of Males per 100 Females in Hanna City?
There are 103.88 Males per 100 Females in Hanna City.
What is the Ratio of Females per 100 Males in Hanna City?
There are 96.26 Females per 100 Males in Hanna City.
What is the Median Population Age in Hanna City?
Median Population Age in Hanna City is 54.9 Years.
What is the Average Family Size in Hanna City
Average Family Size in Hanna City is 2.5 People.
What is the Average Household Size in Hanna City
Average Household Size in Hanna City is 1.9 People.
How Large is the Labor Force in Hanna City?
There are 767 People in the Labor Forcein in Hanna City.
What is the Percentage of People in the Labor Force in Hanna City?
60.0% of People are in the Labor Force in Hanna City.
What is the Unemployment Rate in Hanna City?
Unemployment Rate in Hanna City is 2.0%.