Grand Tower, IL Map & Demographics
Grand Tower Map
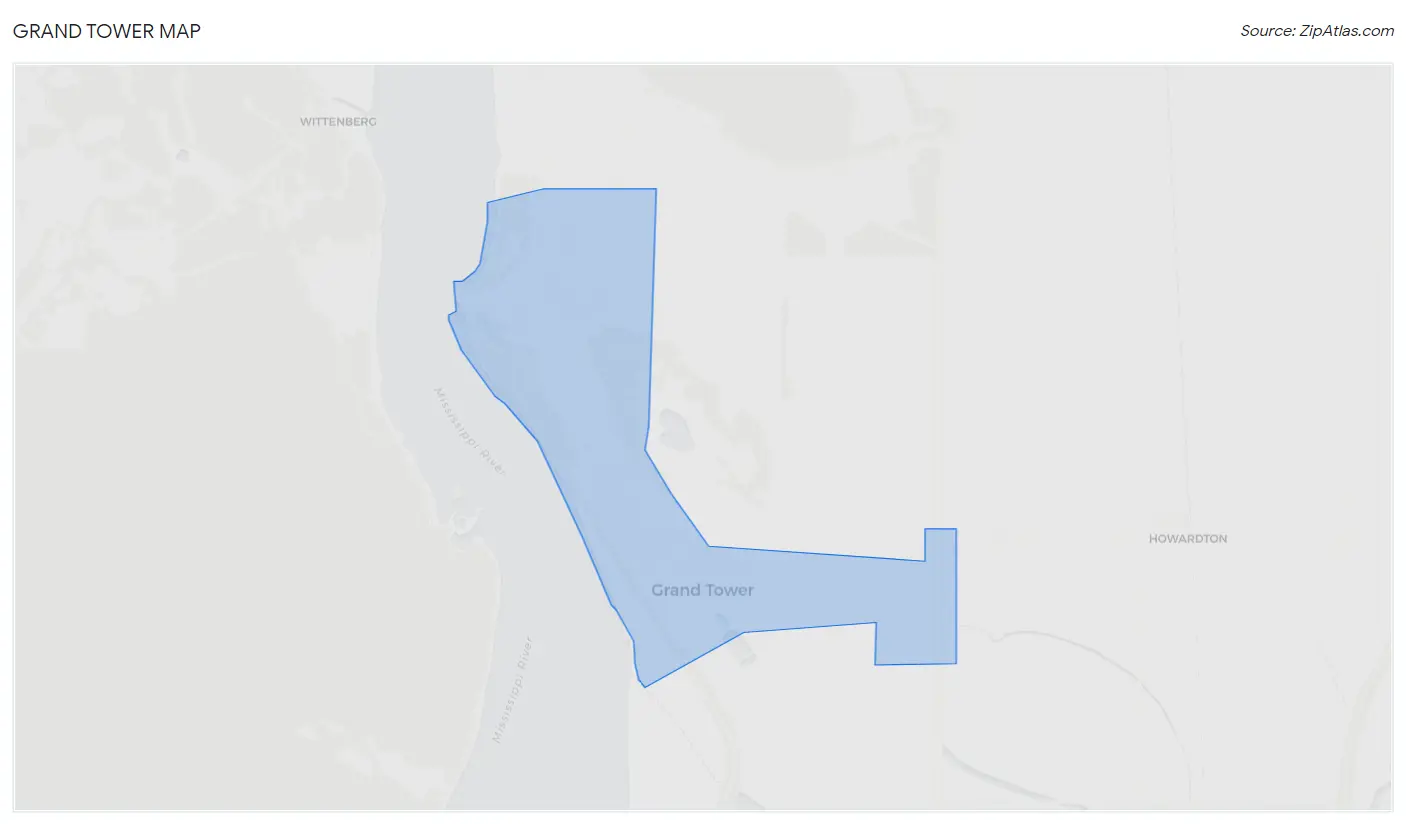
Grand Tower Overview
$24,387
PER CAPITA INCOME
$61,563
AVG FAMILY INCOME
$56,944
AVG HOUSEHOLD INCOME
0.37
INEQUALITY / GINI INDEX
505
TOTAL POPULATION
263
MALE POPULATION
242
FEMALE POPULATION
108.68
MALES / 100 FEMALES
92.02
FEMALES / 100 MALES
32.4
MEDIAN AGE
3.2
AVG FAMILY SIZE
2.7
AVG HOUSEHOLD SIZE
251
LABOR FORCE [ PEOPLE ]
66.2%
PERCENT IN LABOR FORCE
9.2%
UNEMPLOYMENT RATE
Grand Tower Zip Codes
Grand Tower Area Codes
Income in Grand Tower
Income Overview in Grand Tower
Per Capita Income in Grand Tower is $24,387, while median incomes of families and households are $61,563 and $56,944 respectively.
| Characteristic | Number | Measure |
| Per Capita Income | 505 | $24,387 |
| Median Family Income | 113 | $61,563 |
| Mean Family Income | 113 | $66,261 |
| Median Household Income | 190 | $56,944 |
| Mean Household Income | 190 | $61,919 |
| Income Deficit | 113 | $0 |
| Wage / Income Gap (%) | 505 | 0.00% |
| Wage / Income Gap ($) | 505 | 100.00¢ per $1 |
| Gini / Inequality Index | 505 | 0.37 |
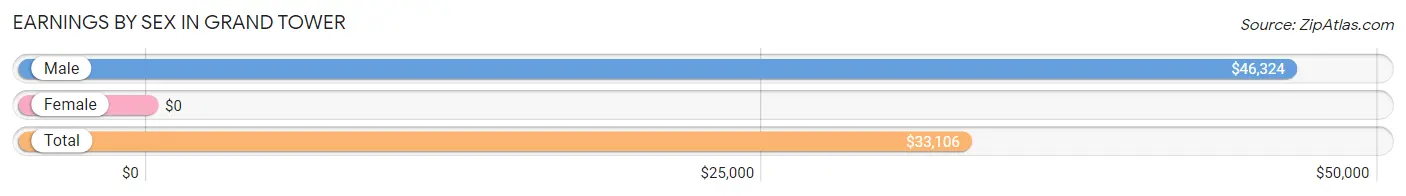
Earnings by Sex in Grand Tower
| Sex | Number | Average Earnings |
| Male | 142 (53.8%) | $46,324 |
| Female | 122 (46.2%) | $0 |
| Total | 264 (100.0%) | $33,106 |
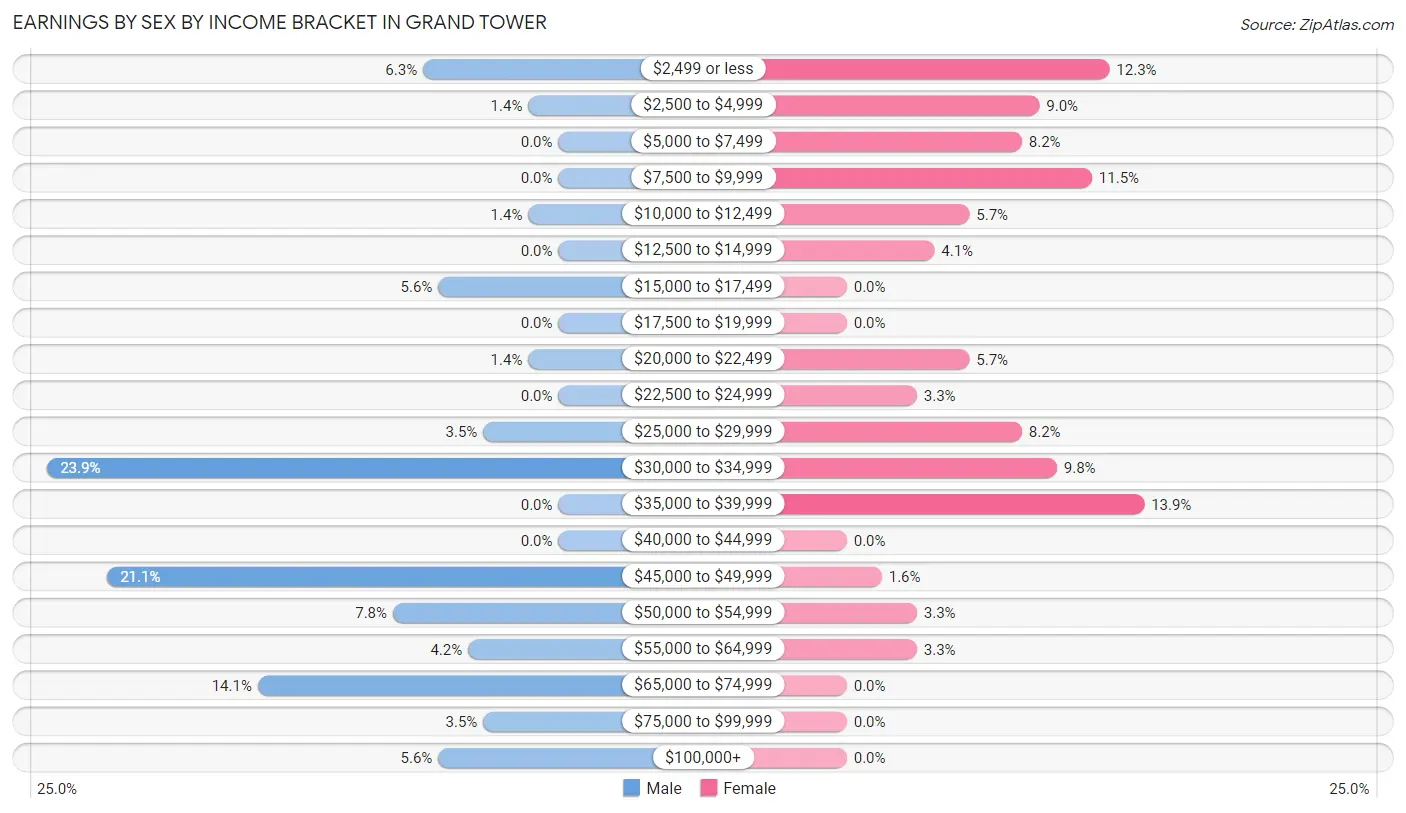
Earnings by Sex by Income Bracket in Grand Tower
The most common earnings brackets in Grand Tower are $30,000 to $34,999 for men (34 | 23.9%) and $35,000 to $39,999 for women (17 | 13.9%).
| Income | Male | Female |
| $2,499 or less | 9 (6.3%) | 15 (12.3%) |
| $2,500 to $4,999 | 2 (1.4%) | 11 (9.0%) |
| $5,000 to $7,499 | 0 (0.0%) | 10 (8.2%) |
| $7,500 to $9,999 | 0 (0.0%) | 14 (11.5%) |
| $10,000 to $12,499 | 2 (1.4%) | 7 (5.7%) |
| $12,500 to $14,999 | 0 (0.0%) | 5 (4.1%) |
| $15,000 to $17,499 | 8 (5.6%) | 0 (0.0%) |
| $17,500 to $19,999 | 0 (0.0%) | 0 (0.0%) |
| $20,000 to $22,499 | 2 (1.4%) | 7 (5.7%) |
| $22,500 to $24,999 | 0 (0.0%) | 4 (3.3%) |
| $25,000 to $29,999 | 5 (3.5%) | 10 (8.2%) |
| $30,000 to $34,999 | 34 (23.9%) | 12 (9.8%) |
| $35,000 to $39,999 | 0 (0.0%) | 17 (13.9%) |
| $40,000 to $44,999 | 0 (0.0%) | 0 (0.0%) |
| $45,000 to $49,999 | 30 (21.1%) | 2 (1.6%) |
| $50,000 to $54,999 | 11 (7.7%) | 4 (3.3%) |
| $55,000 to $64,999 | 6 (4.2%) | 4 (3.3%) |
| $65,000 to $74,999 | 20 (14.1%) | 0 (0.0%) |
| $75,000 to $99,999 | 5 (3.5%) | 0 (0.0%) |
| $100,000+ | 8 (5.6%) | 0 (0.0%) |
| Total | 142 (100.0%) | 122 (100.0%) |
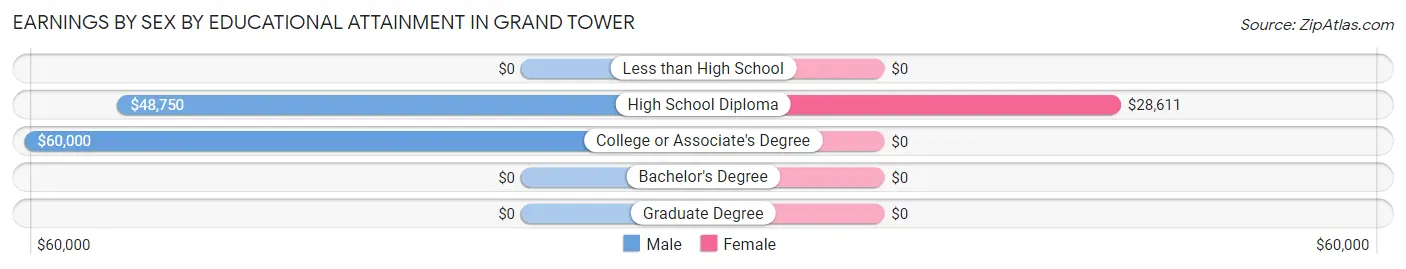
Earnings by Sex by Educational Attainment in Grand Tower
Average earnings in Grand Tower are $53,295 for men and $28,375 for women, a difference of 46.8%. Men with an educational attainment of college or associate's degree enjoy the highest average annual earnings of $60,000, while those with high school diploma education earn the least with $48,750. Women with an educational attainment of high school diploma earn the most with the average annual earnings of $28,611, while those with high school diploma education have the smallest earnings of $28,611.
| Educational Attainment | Male Income | Female Income |
| Less than High School | - | - |
| High School Diploma | $48,750 | $28,611 |
| College or Associate's Degree | $60,000 | $0 |
| Bachelor's Degree | - | - |
| Graduate Degree | - | - |
| Total | $53,295 | $28,375 |
Family Income in Grand Tower
Family Income Brackets in Grand Tower
According to the Grand Tower family income data, there are 32 families falling into the $75,000 to $99,999 income range, which is the most common income bracket and makes up 28.3% of all families.
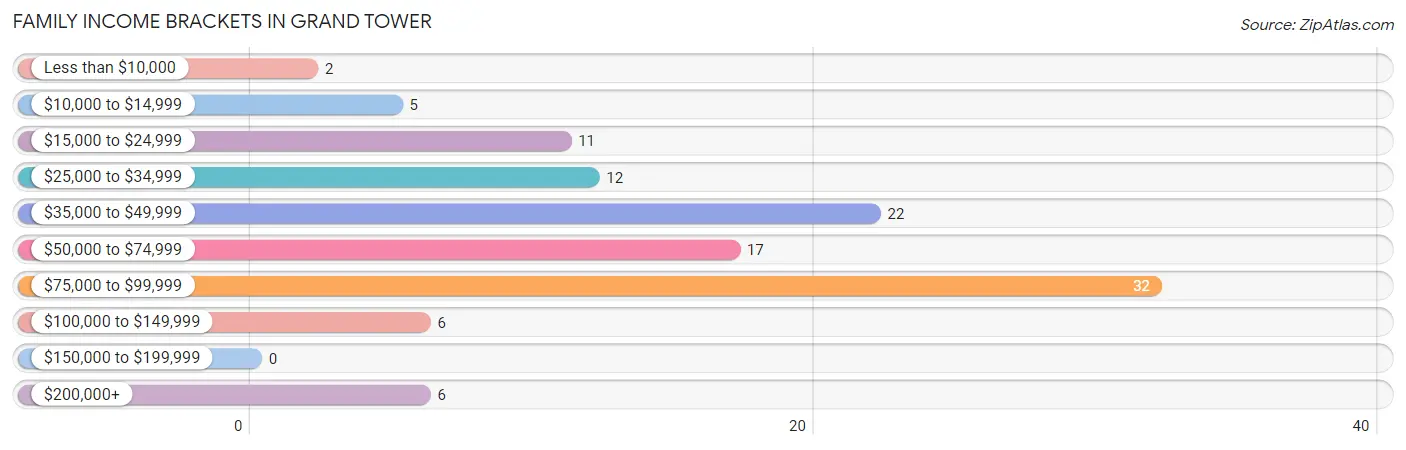
| Income Bracket | # Families | % Families |
| Less than $10,000 | 2 | 1.8% |
| $10,000 to $14,999 | 5 | 4.4% |
| $15,000 to $24,999 | 11 | 9.7% |
| $25,000 to $34,999 | 12 | 10.6% |
| $35,000 to $49,999 | 22 | 19.5% |
| $50,000 to $74,999 | 17 | 15.0% |
| $75,000 to $99,999 | 32 | 28.3% |
| $100,000 to $149,999 | 6 | 5.3% |
| $150,000 to $199,999 | 0 | 0.0% |
| $200,000+ | 6 | 5.3% |
Family Income by Famaliy Size in Grand Tower
4-person families (14 | 12.4%) account for the highest median family income in Grand Tower with $83,125 per family, while 2-person families (59 | 52.2%) have the highest median income of $29,062 per family member.
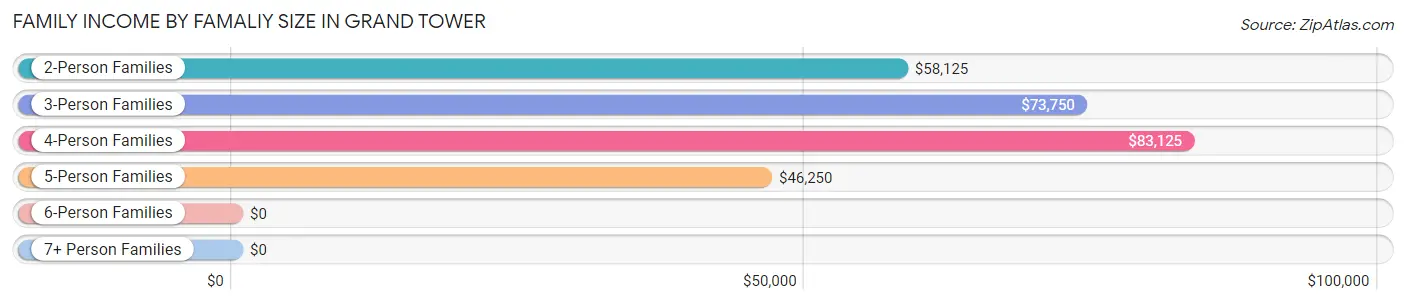
| Income Bracket | # Families | Median Income |
| 2-Person Families | 59 (52.2%) | $58,125 |
| 3-Person Families | 21 (18.6%) | $73,750 |
| 4-Person Families | 14 (12.4%) | $83,125 |
| 5-Person Families | 19 (16.8%) | $46,250 |
| 6-Person Families | 0 (0.0%) | $0 |
| 7+ Person Families | 0 (0.0%) | $0 |
| Total | 113 (100.0%) | $61,563 |
Family Income by Number of Earners in Grand Tower
The median family income in Grand Tower is $61,563, with families comprising 2 earners (26) having the highest median family income of $83,750, while families with no earners (11) have the lowest median family income of $33,750, accounting for 23.0% and 9.7% of families, respectively.
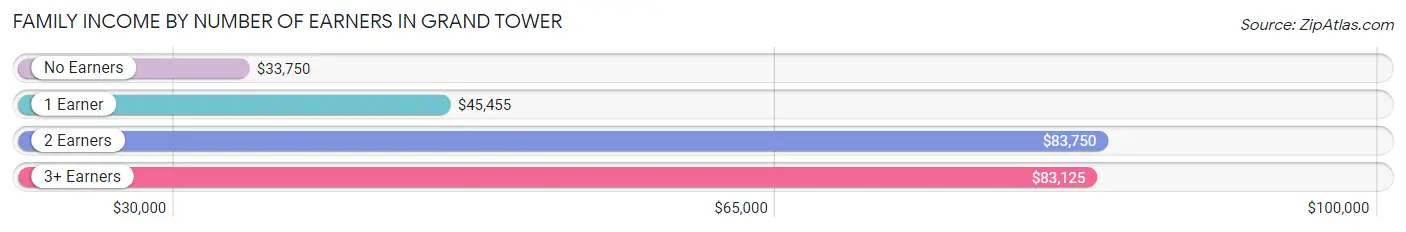
| Number of Earners | # Families | Median Income |
| No Earners | 11 (9.7%) | $33,750 |
| 1 Earner | 60 (53.1%) | $45,455 |
| 2 Earners | 26 (23.0%) | $83,750 |
| 3+ Earners | 16 (14.2%) | $83,125 |
| Total | 113 (100.0%) | $61,563 |
Household Income in Grand Tower
Household Income Brackets in Grand Tower
With 41 households falling in the category, the $75,000 to $99,999 income range is the most frequent in Grand Tower, accounting for 21.6% of all households.
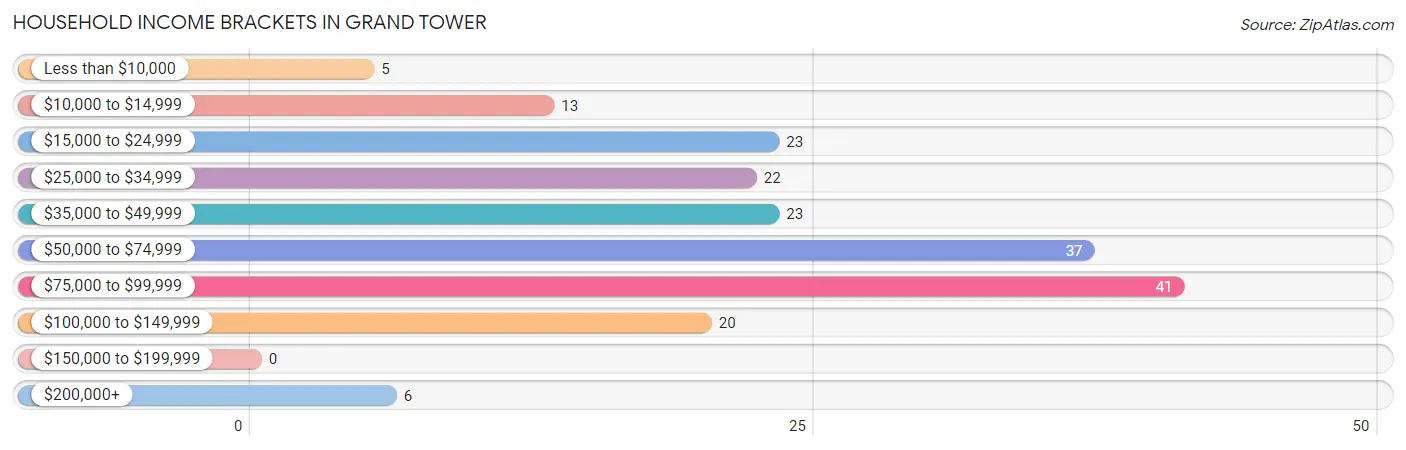
| Income Bracket | # Households | % Households |
| Less than $10,000 | 5 | 2.6% |
| $10,000 to $14,999 | 13 | 6.8% |
| $15,000 to $24,999 | 23 | 12.1% |
| $25,000 to $34,999 | 22 | 11.6% |
| $35,000 to $49,999 | 23 | 12.1% |
| $50,000 to $74,999 | 37 | 19.5% |
| $75,000 to $99,999 | 41 | 21.6% |
| $100,000 to $149,999 | 20 | 10.5% |
| $150,000 to $199,999 | 0 | 0.0% |
| $200,000+ | 6 | 3.2% |
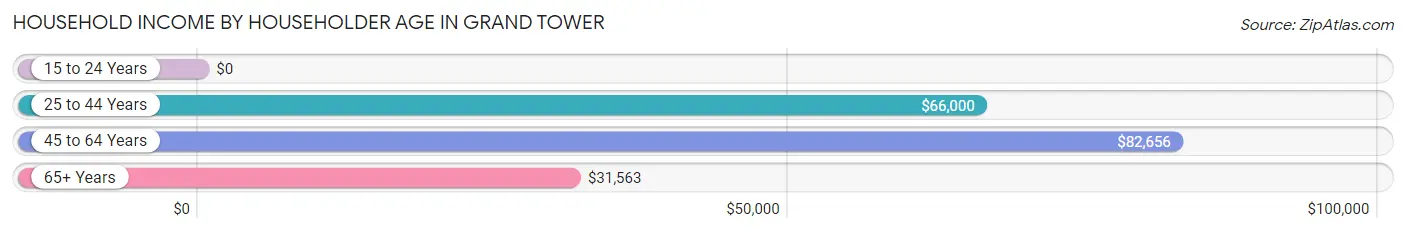
Household Income by Householder Age in Grand Tower
The median household income in Grand Tower is $56,944, with the highest median household income of $82,656 found in the 45 to 64 years age bracket for the primary householder. A total of 73 households (38.4%) fall into this category. Meanwhile, the 15 to 24 years age bracket for the primary householder has the lowest median household income of $0, with 25 households (13.2%) in this group.
| Income Bracket | # Households | Median Income |
| 15 to 24 Years | 25 (13.2%) | $0 |
| 25 to 44 Years | 58 (30.5%) | $66,000 |
| 45 to 64 Years | 73 (38.4%) | $82,656 |
| 65+ Years | 34 (17.9%) | $31,563 |
| Total | 190 (100.0%) | $56,944 |
Poverty in Grand Tower
Income Below Poverty by Sex and Age in Grand Tower
With 12.9% poverty level for males and 28.8% for females among the residents of Grand Tower, 12 to 14 year old males and under 5 year old females are the most vulnerable to poverty, with 5 males (45.5%) and 8 females (100.0%) in their respective age groups living below the poverty level.
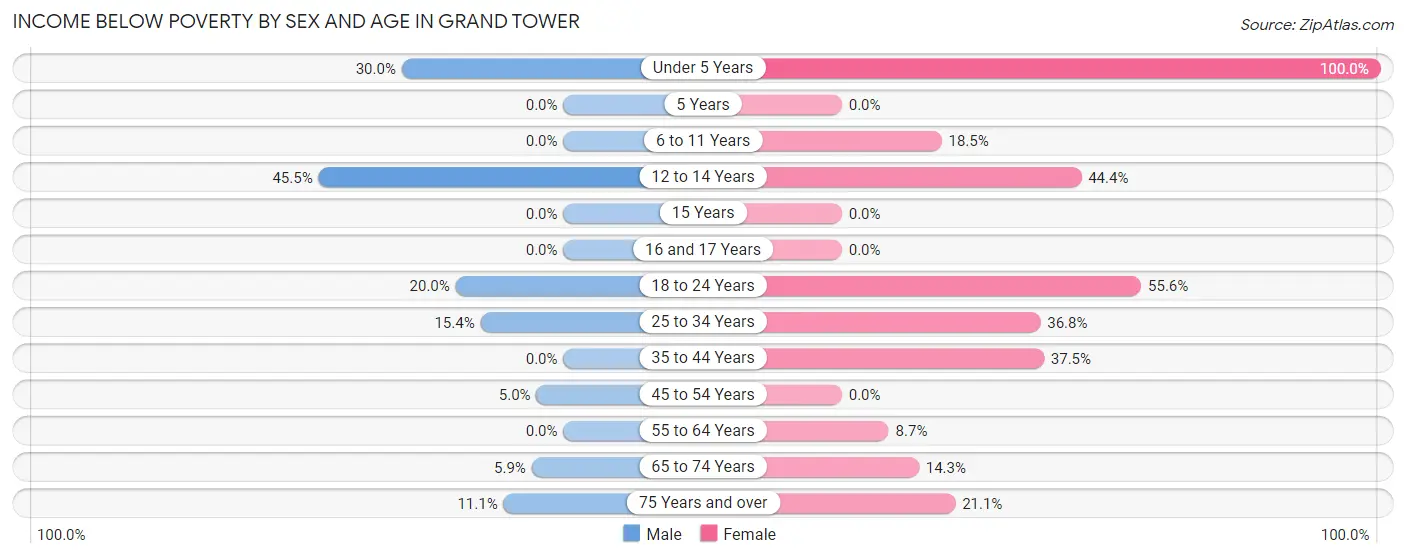
| Age Bracket | Male | Female |
| Under 5 Years | 12 (30.0%) | 8 (100.0%) |
| 5 Years | 0 (0.0%) | 0 (0.0%) |
| 6 to 11 Years | 0 (0.0%) | 5 (18.5%) |
| 12 to 14 Years | 5 (45.5%) | 4 (44.4%) |
| 15 Years | 0 (0.0%) | 0 (0.0%) |
| 16 and 17 Years | 0 (0.0%) | 0 (0.0%) |
| 18 to 24 Years | 11 (20.0%) | 20 (55.6%) |
| 25 to 34 Years | 2 (15.4%) | 14 (36.8%) |
| 35 to 44 Years | 0 (0.0%) | 9 (37.5%) |
| 45 to 54 Years | 2 (5.0%) | 0 (0.0%) |
| 55 to 64 Years | 0 (0.0%) | 2 (8.7%) |
| 65 to 74 Years | 1 (5.9%) | 2 (14.3%) |
| 75 Years and over | 1 (11.1%) | 4 (21.0%) |
| Total | 34 (12.9%) | 68 (28.8%) |
Income Above Poverty by Sex and Age in Grand Tower
According to the poverty statistics in Grand Tower, males aged 5 years and females aged 5 years are the age groups that are most secure financially, with 100.0% of males and 100.0% of females in these age groups living above the poverty line.
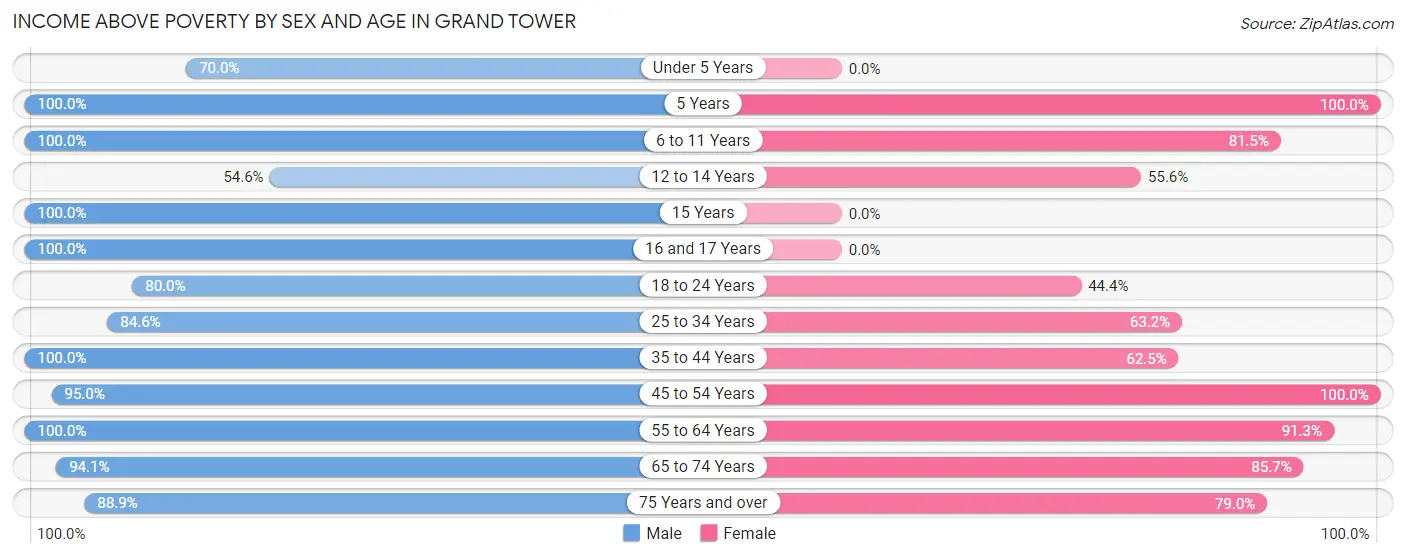
| Age Bracket | Male | Female |
| Under 5 Years | 28 (70.0%) | 0 (0.0%) |
| 5 Years | 10 (100.0%) | 2 (100.0%) |
| 6 to 11 Years | 10 (100.0%) | 22 (81.5%) |
| 12 to 14 Years | 6 (54.5%) | 5 (55.6%) |
| 15 Years | 3 (100.0%) | 0 (0.0%) |
| 16 and 17 Years | 3 (100.0%) | 0 (0.0%) |
| 18 to 24 Years | 44 (80.0%) | 16 (44.4%) |
| 25 to 34 Years | 11 (84.6%) | 24 (63.2%) |
| 35 to 44 Years | 39 (100.0%) | 15 (62.5%) |
| 45 to 54 Years | 38 (95.0%) | 36 (100.0%) |
| 55 to 64 Years | 13 (100.0%) | 21 (91.3%) |
| 65 to 74 Years | 16 (94.1%) | 12 (85.7%) |
| 75 Years and over | 8 (88.9%) | 15 (78.9%) |
| Total | 229 (87.1%) | 168 (71.2%) |
Income Below Poverty Among Married-Couple Families in Grand Tower
The poverty statistics for married-couple families in Grand Tower show that 14.1% or 9 of the total 64 families live below the poverty line. Families with no children have the highest poverty rate of 17.6%, comprising of 9 families. On the other hand, families with 1 or 2 children have the lowest poverty rate of 0.0%, which includes 0 families.
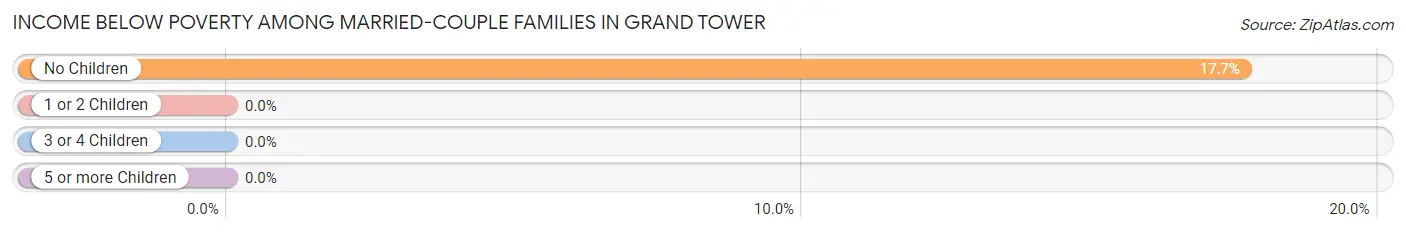
| Children | Above Poverty | Below Poverty |
| No Children | 42 (82.4%) | 9 (17.6%) |
| 1 or 2 Children | 8 (100.0%) | 0 (0.0%) |
| 3 or 4 Children | 5 (100.0%) | 0 (0.0%) |
| 5 or more Children | 0 (0.0%) | 0 (0.0%) |
| Total | 55 (85.9%) | 9 (14.1%) |
Income Below Poverty Among Single-Parent Households in Grand Tower
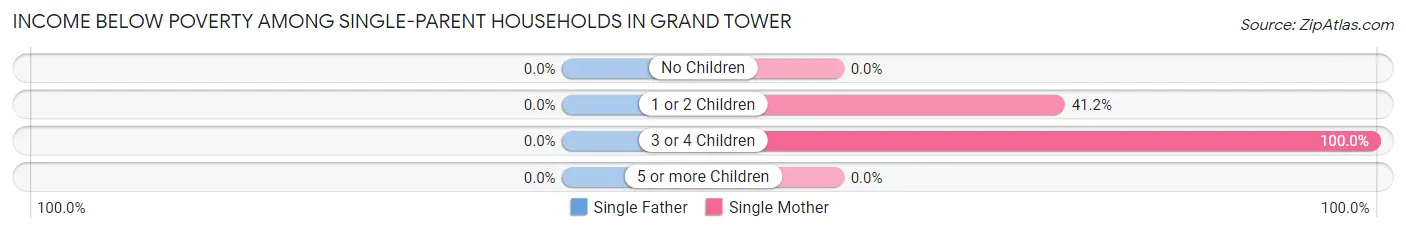
| Children | Single Father | Single Mother |
| No Children | 0 (0.0%) | 0 (0.0%) |
| 1 or 2 Children | 0 (0.0%) | 7 (41.2%) |
| 3 or 4 Children | 0 (0.0%) | 5 (100.0%) |
| 5 or more Children | 0 (0.0%) | 0 (0.0%) |
| Total | 0 (0.0%) | 12 (37.5%) |
Income Below Poverty Among Married-Couple vs Single-Parent Households in Grand Tower
The poverty data for Grand Tower shows that 9 of the married-couple family households (14.1%) and 12 of the single-parent households (24.5%) are living below the poverty level. Within the married-couple family households, those with no children have the highest poverty rate, with 9 households (17.6%) falling below the poverty line. Among the single-parent households, those with 3 or 4 children have the highest poverty rate, with 5 household (35.7%) living below poverty.
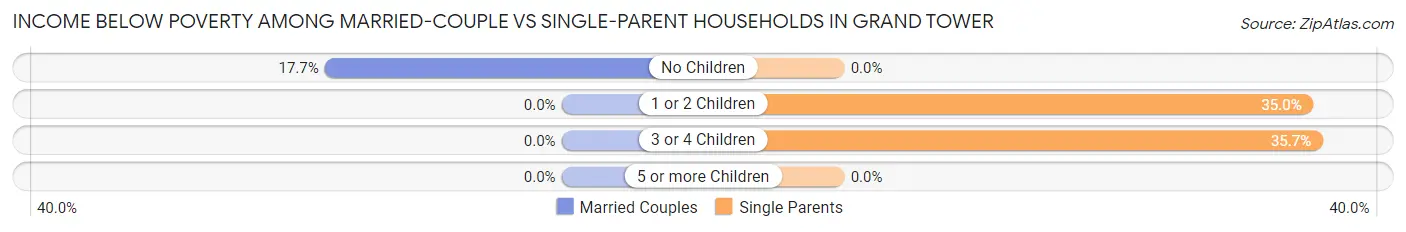
| Children | Married-Couple Families | Single-Parent Households |
| No Children | 9 (17.6%) | 0 (0.0%) |
| 1 or 2 Children | 0 (0.0%) | 7 (35.0%) |
| 3 or 4 Children | 0 (0.0%) | 5 (35.7%) |
| 5 or more Children | 0 (0.0%) | 0 (0.0%) |
| Total | 9 (14.1%) | 12 (24.5%) |
Race in Grand Tower
The most populous races in Grand Tower are White / Caucasian (462 | 91.5%), Hispanic or Latino (41 | 8.1%), and Two or more Races (33 | 6.5%).
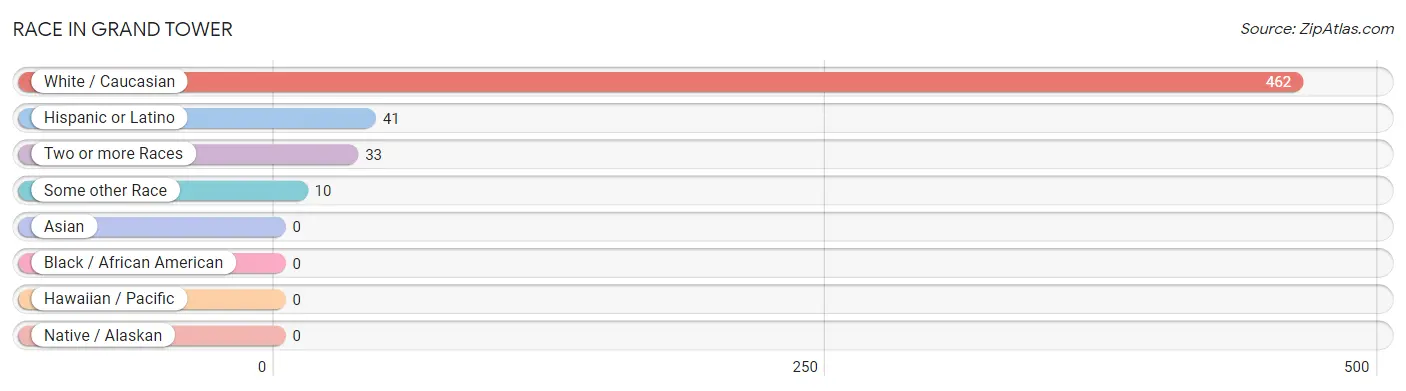
| Race | # Population | % Population |
| Asian | 0 | 0.0% |
| Black / African American | 0 | 0.0% |
| Hawaiian / Pacific | 0 | 0.0% |
| Hispanic or Latino | 41 | 8.1% |
| Native / Alaskan | 0 | 0.0% |
| White / Caucasian | 462 | 91.5% |
| Two or more Races | 33 | 6.5% |
| Some other Race | 10 | 2.0% |
| Total | 505 | 100.0% |
Ancestry in Grand Tower
The most populous ancestries reported in Grand Tower are German (44 | 8.7%), Mexican (41 | 8.1%), English (36 | 7.1%), Irish (32 | 6.3%), and American (25 | 5.0%), together accounting for 35.2% of all Grand Tower residents.
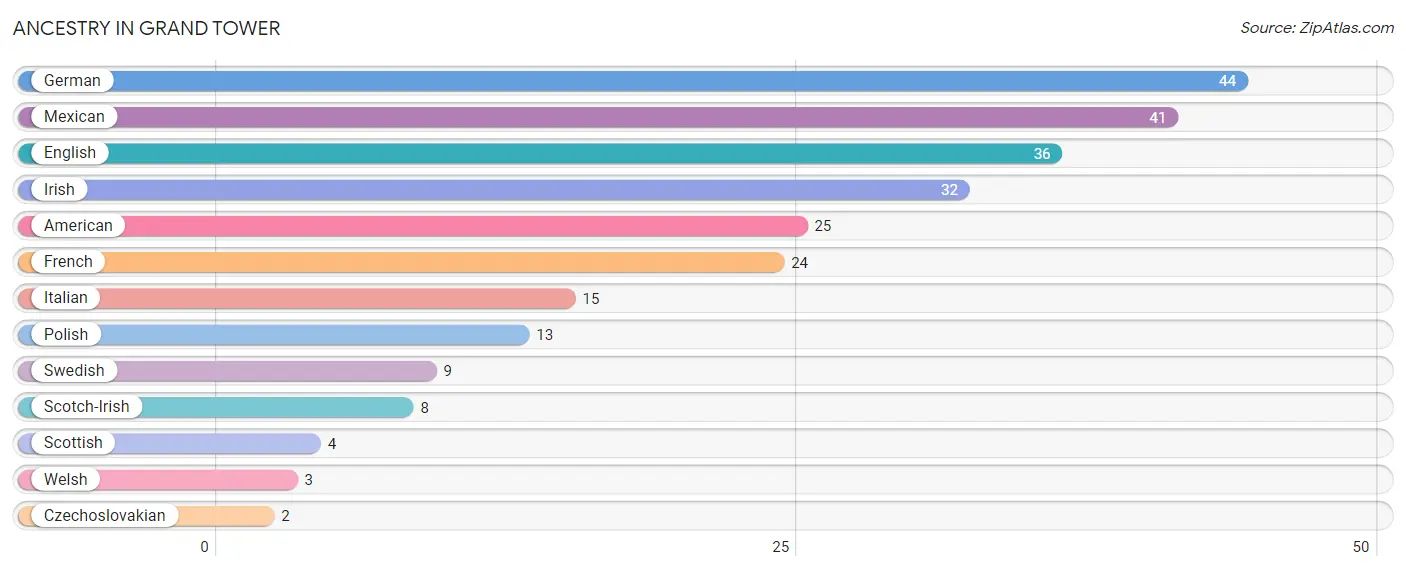
| Ancestry | # Population | % Population |
| American | 25 | 5.0% |
| Czechoslovakian | 2 | 0.4% |
| English | 36 | 7.1% |
| French | 24 | 4.8% |
| German | 44 | 8.7% |
| Irish | 32 | 6.3% |
| Italian | 15 | 3.0% |
| Mexican | 41 | 8.1% |
| Polish | 13 | 2.6% |
| Scotch-Irish | 8 | 1.6% |
| Scottish | 4 | 0.8% |
| Swedish | 9 | 1.8% |
| Welsh | 3 | 0.6% | View All 13 Rows |
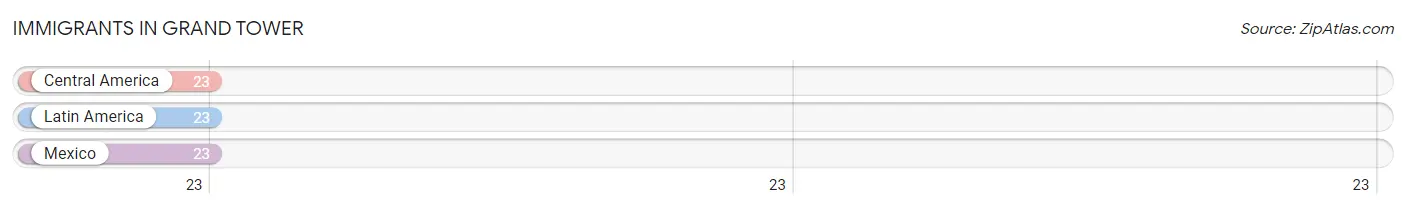
Immigrants in Grand Tower
The most numerous immigrant groups reported in Grand Tower came from Central America (23 | 4.5%), Latin America (23 | 4.5%), and Mexico (23 | 4.5%), together accounting for 13.7% of all Grand Tower residents.
| Immigration Origin | # Population | % Population |
| Central America | 23 | 4.5% |
| Latin America | 23 | 4.5% |
| Mexico | 23 | 4.5% | View All 3 Rows |
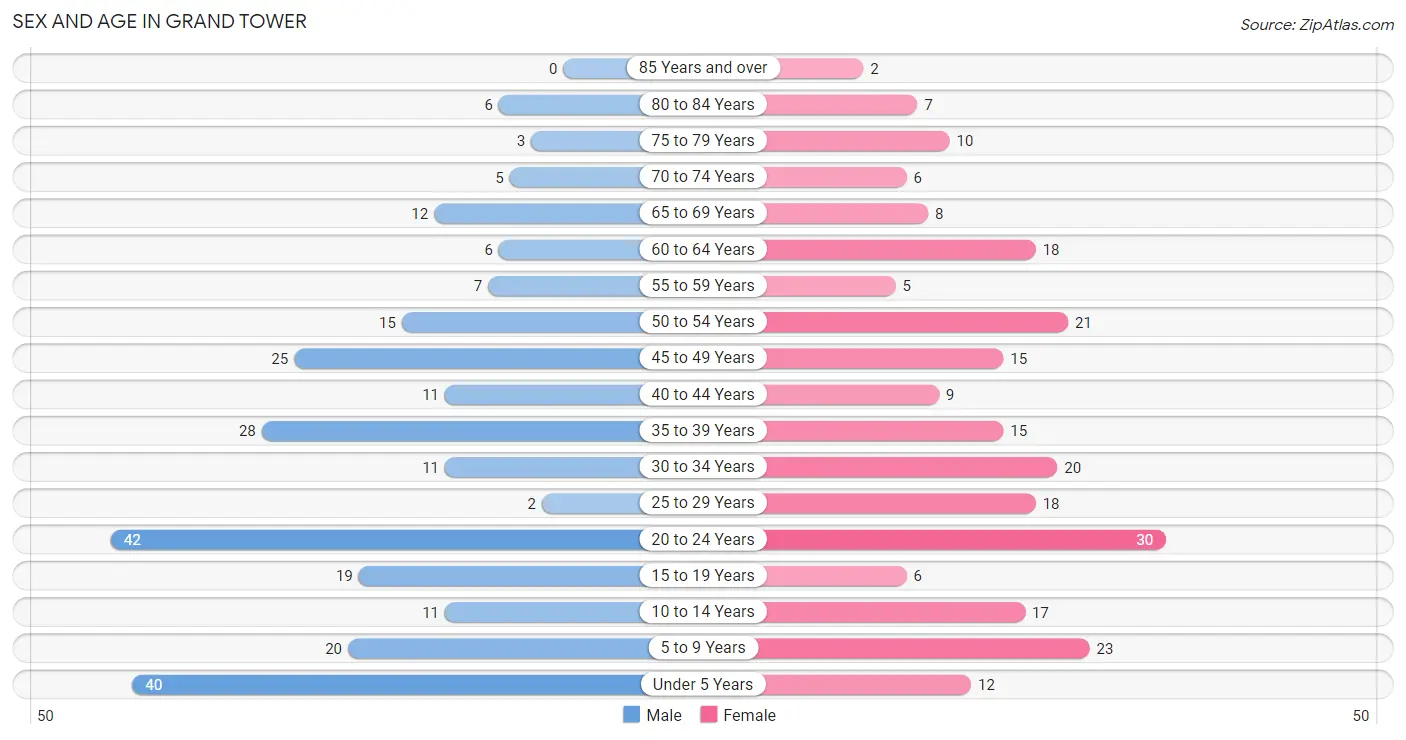
Sex and Age in Grand Tower
Sex and Age in Grand Tower
The most populous age groups in Grand Tower are 20 to 24 Years (42 | 16.0%) for men and 20 to 24 Years (30 | 12.4%) for women.
| Age Bracket | Male | Female |
| Under 5 Years | 40 (15.2%) | 12 (5.0%) |
| 5 to 9 Years | 20 (7.6%) | 23 (9.5%) |
| 10 to 14 Years | 11 (4.2%) | 17 (7.0%) |
| 15 to 19 Years | 19 (7.2%) | 6 (2.5%) |
| 20 to 24 Years | 42 (16.0%) | 30 (12.4%) |
| 25 to 29 Years | 2 (0.8%) | 18 (7.4%) |
| 30 to 34 Years | 11 (4.2%) | 20 (8.3%) |
| 35 to 39 Years | 28 (10.6%) | 15 (6.2%) |
| 40 to 44 Years | 11 (4.2%) | 9 (3.7%) |
| 45 to 49 Years | 25 (9.5%) | 15 (6.2%) |
| 50 to 54 Years | 15 (5.7%) | 21 (8.7%) |
| 55 to 59 Years | 7 (2.7%) | 5 (2.1%) |
| 60 to 64 Years | 6 (2.3%) | 18 (7.4%) |
| 65 to 69 Years | 12 (4.6%) | 8 (3.3%) |
| 70 to 74 Years | 5 (1.9%) | 6 (2.5%) |
| 75 to 79 Years | 3 (1.1%) | 10 (4.1%) |
| 80 to 84 Years | 6 (2.3%) | 7 (2.9%) |
| 85 Years and over | 0 (0.0%) | 2 (0.8%) |
| Total | 263 (100.0%) | 242 (100.0%) |
Families and Households in Grand Tower
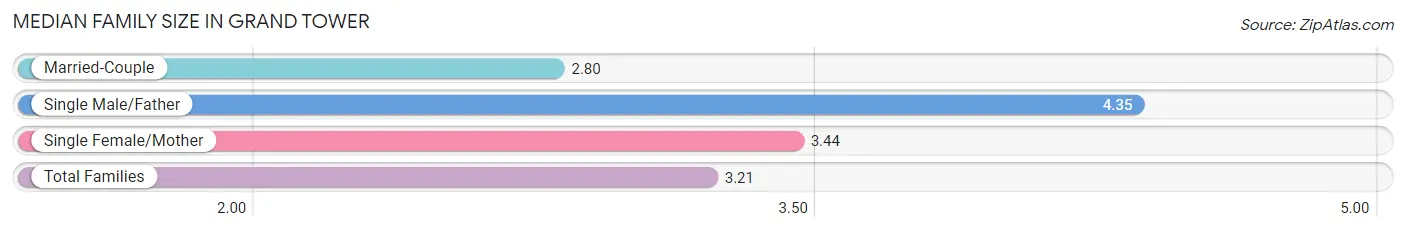
Median Family Size in Grand Tower
The median family size in Grand Tower is 3.21 persons per family, with single male/father families (17 | 15.0%) accounting for the largest median family size of 4.35 persons per family. On the other hand, married-couple families (64 | 56.6%) represent the smallest median family size with 2.80 persons per family.
| Family Type | # Families | Family Size |
| Married-Couple | 64 (56.6%) | 2.80 |
| Single Male/Father | 17 (15.0%) | 4.35 |
| Single Female/Mother | 32 (28.3%) | 3.44 |
| Total Families | 113 (100.0%) | 3.21 |
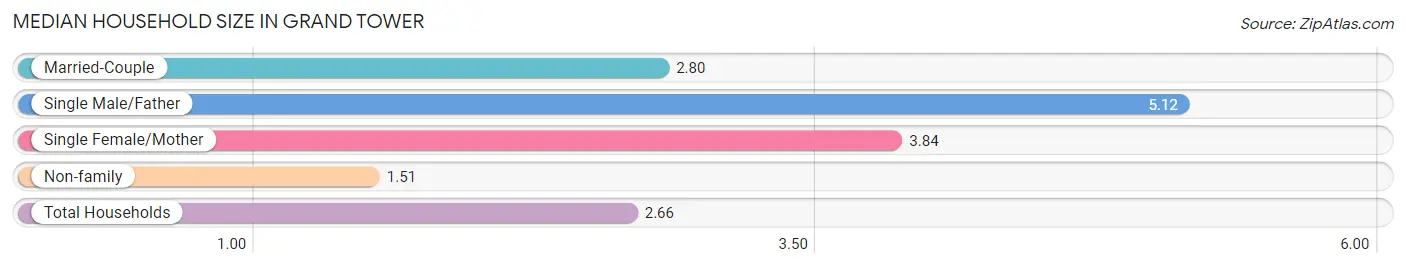
Median Household Size in Grand Tower
The median household size in Grand Tower is 2.66 persons per household, with single male/father households (17 | 8.9%) accounting for the largest median household size of 5.12 persons per household. non-family households (77 | 40.5%) represent the smallest median household size with 1.51 persons per household.
| Household Type | # Households | Household Size |
| Married-Couple | 64 (33.7%) | 2.80 |
| Single Male/Father | 17 (8.9%) | 5.12 |
| Single Female/Mother | 32 (16.8%) | 3.84 |
| Non-family | 77 (40.5%) | 1.51 |
| Total Households | 190 (100.0%) | 2.66 |
Household Size by Marriage Status in Grand Tower
Out of a total of 190 households in Grand Tower, 113 (59.5%) are family households, while 77 (40.5%) are nonfamily households. The most numerous type of family households are 2-person households, comprising 49, and the most common type of nonfamily households are 1-person households, comprising 43.
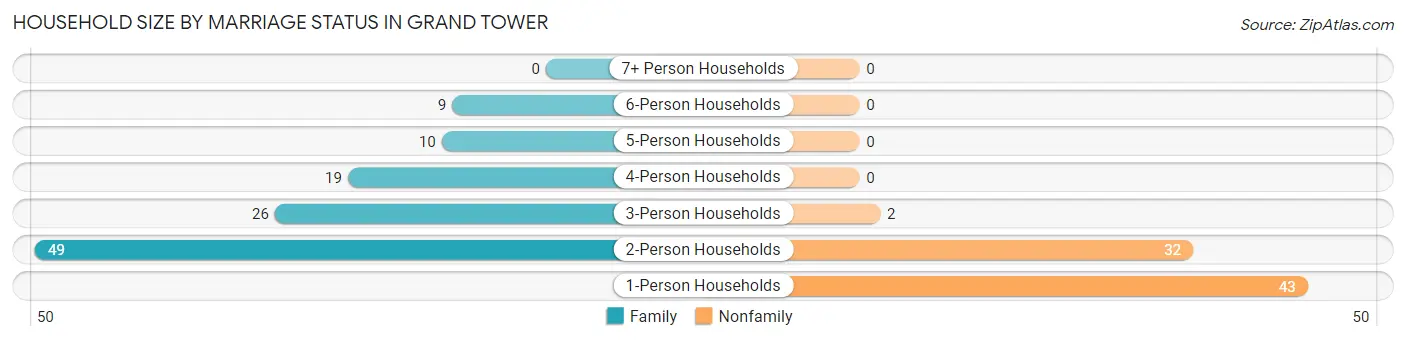
| Household Size | Family Households | Nonfamily Households |
| 1-Person Households | - | 43 (22.6%) |
| 2-Person Households | 49 (25.8%) | 32 (16.8%) |
| 3-Person Households | 26 (13.7%) | 2 (1.1%) |
| 4-Person Households | 19 (10.0%) | 0 (0.0%) |
| 5-Person Households | 10 (5.3%) | 0 (0.0%) |
| 6-Person Households | 9 (4.7%) | 0 (0.0%) |
| 7+ Person Households | 0 (0.0%) | 0 (0.0%) |
| Total | 113 (59.5%) | 77 (40.5%) |
Female Fertility in Grand Tower
Fertility by Age in Grand Tower
Average fertility rate in Grand Tower is 70.0 births per 1,000 women. Women in the age bracket of 20 to 34 years have the highest fertility rate with 132.0 births per 1,000 women. Women in the age bracket of 20 to 34 years acount for 100.0% of all women with births.
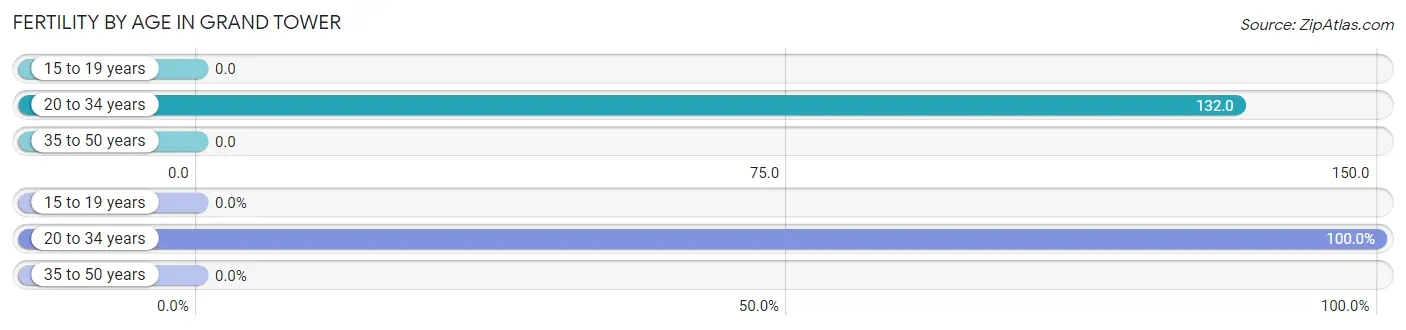
| Age Bracket | Women with Births | Births / 1,000 Women |
| 15 to 19 years | 0 (0.0%) | 0.0 |
| 20 to 34 years | 9 (100.0%) | 132.0 |
| 35 to 50 years | 0 (0.0%) | 0.0 |
| Total | 9 (100.0%) | 70.0 |
Fertility by Age by Marriage Status in Grand Tower
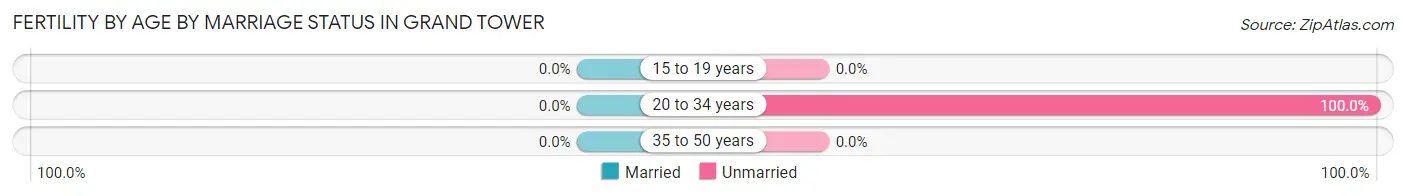
| Age Bracket | Married | Unmarried |
| 15 to 19 years | 0 (0.0%) | 0 (0.0%) |
| 20 to 34 years | 0 (0.0%) | 9 (100.0%) |
| 35 to 50 years | 0 (0.0%) | 0 (0.0%) |
| Total | 0 (0.0%) | 9 (100.0%) |
Fertility by Education in Grand Tower
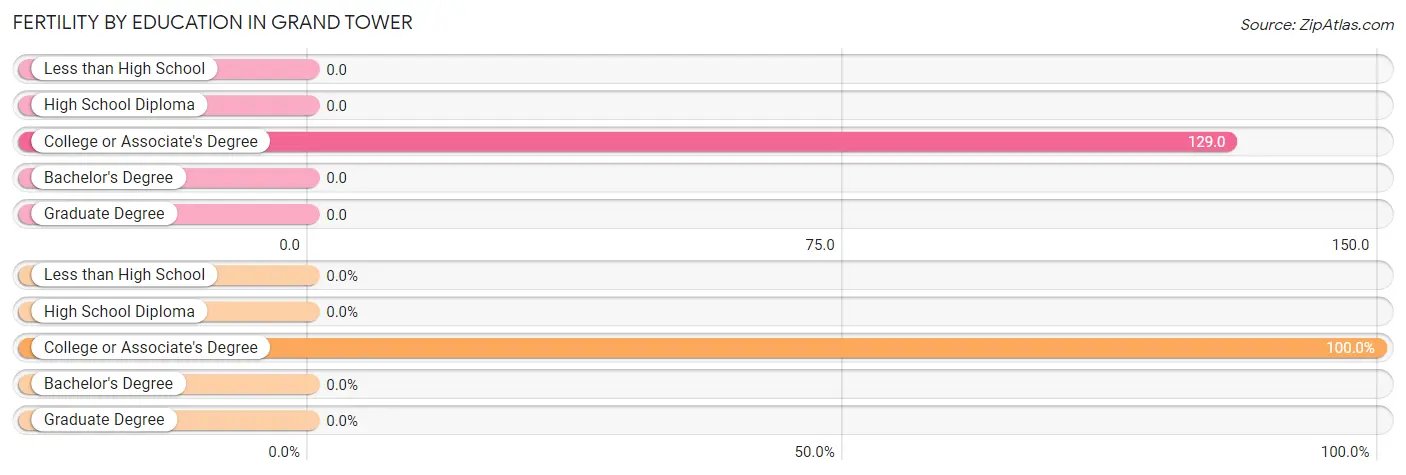
| Educational Attainment | Women with Births | Births / 1,000 Women |
| Less than High School | 0 (0.0%) | 0.0 |
| High School Diploma | 0 (0.0%) | 0.0 |
| College or Associate's Degree | 9 (100.0%) | 129.0 |
| Bachelor's Degree | 0 (0.0%) | 0.0 |
| Graduate Degree | 0 (0.0%) | 0.0 |
| Total | 9 (100.0%) | 70.0 |
Fertility by Education by Marriage Status in Grand Tower
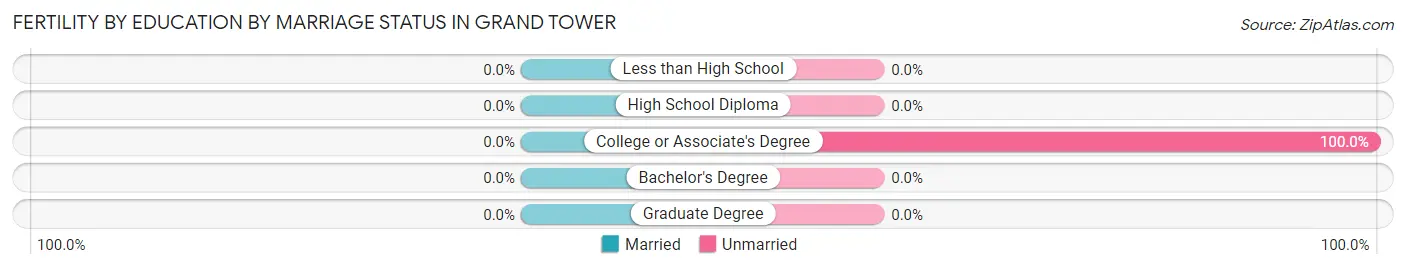
| Educational Attainment | Married | Unmarried |
| Less than High School | 0 (0.0%) | 0 (0.0%) |
| High School Diploma | 0 (0.0%) | 0 (0.0%) |
| College or Associate's Degree | 0 (0.0%) | 9 (100.0%) |
| Bachelor's Degree | 0 (0.0%) | 0 (0.0%) |
| Graduate Degree | 0 (0.0%) | 0 (0.0%) |
| Total | 0 (0.0%) | 9 (100.0%) |
Employment Characteristics in Grand Tower
Employment by Class of Employer in Grand Tower
Among the 221 employed individuals in Grand Tower, private company employees (177 | 80.1%), state government employees (36 | 16.3%), and self-employed (not incorporated) (4 | 1.8%) make up the most common classes of employment.
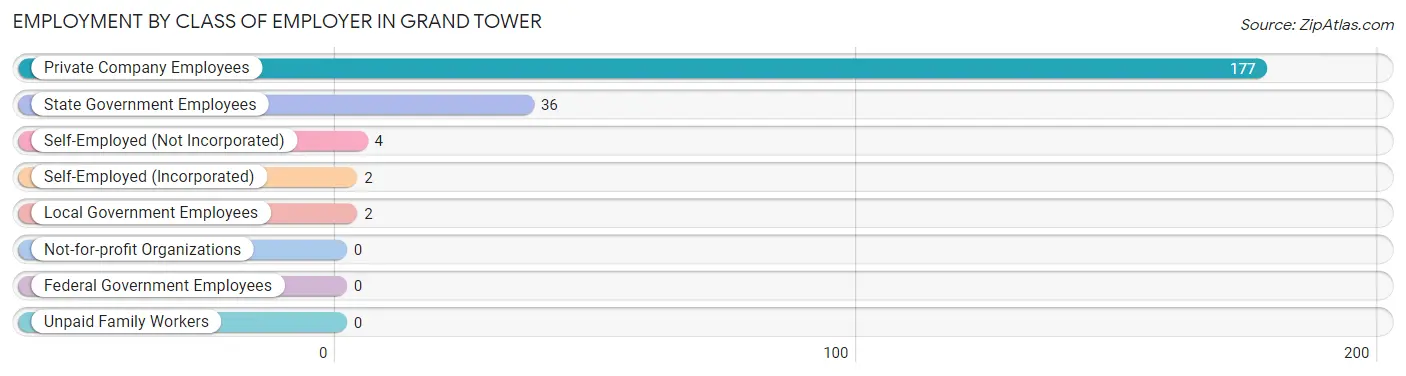
| Employer Class | # Employees | % Employees |
| Private Company Employees | 177 | 80.1% |
| Self-Employed (Incorporated) | 2 | 0.9% |
| Self-Employed (Not Incorporated) | 4 | 1.8% |
| Not-for-profit Organizations | 0 | 0.0% |
| Local Government Employees | 2 | 0.9% |
| State Government Employees | 36 | 16.3% |
| Federal Government Employees | 0 | 0.0% |
| Unpaid Family Workers | 0 | 0.0% |
| Total | 221 | 100.0% |
Employment Status by Age in Grand Tower
According to the labor force statistics for Grand Tower, out of the total population over 16 years of age (379), 66.2% or 251 individuals are in the labor force, with 9.2% or 23 of them unemployed. The age group with the highest labor force participation rate is 30 to 34 years, with 93.5% or 29 individuals in the labor force. Within the labor force, the 20 to 24 years age range has the highest percentage of unemployed individuals, with 17.2% or 11 of them being unemployed.
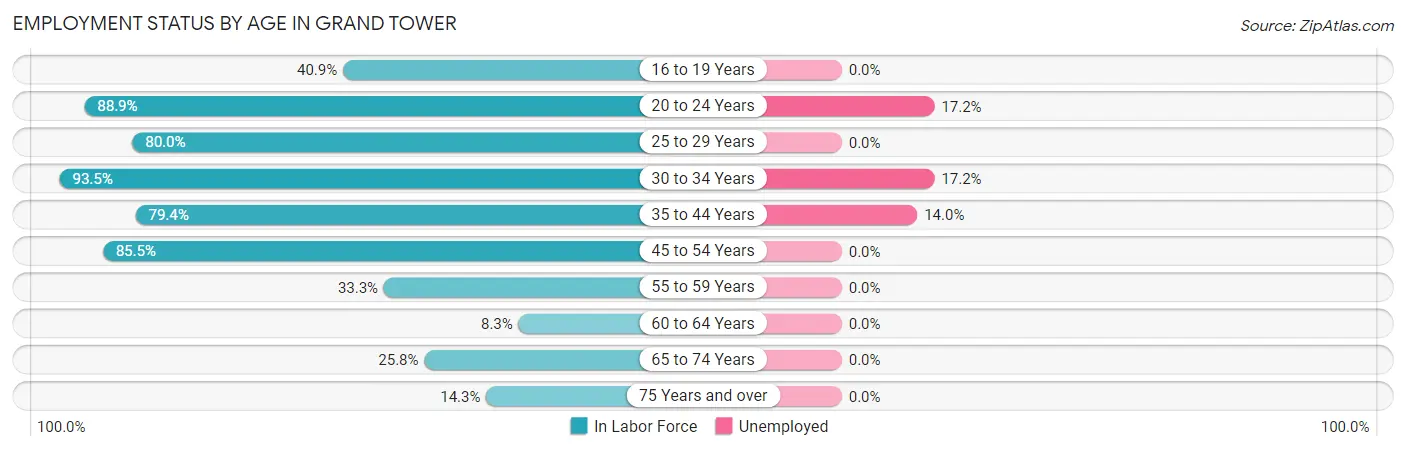
| Age Bracket | In Labor Force | Unemployed |
| 16 to 19 Years | 9 (40.9%) | 0 (0.0%) |
| 20 to 24 Years | 64 (88.9%) | 11 (17.2%) |
| 25 to 29 Years | 16 (80.0%) | 0 (0.0%) |
| 30 to 34 Years | 29 (93.5%) | 5 (17.2%) |
| 35 to 44 Years | 50 (79.4%) | 7 (14.0%) |
| 45 to 54 Years | 65 (85.5%) | 0 (0.0%) |
| 55 to 59 Years | 4 (33.3%) | 0 (0.0%) |
| 60 to 64 Years | 2 (8.3%) | 0 (0.0%) |
| 65 to 74 Years | 8 (25.8%) | 0 (0.0%) |
| 75 Years and over | 4 (14.3%) | 0 (0.0%) |
| Total | 251 (66.2%) | 23 (9.2%) |
Employment Status by Educational Attainment in Grand Tower
According to labor force statistics for Grand Tower, 73.5% of individuals (166) out of the total population between 25 and 64 years of age (226) are in the labor force, with 7.2% or 12 of them being unemployed. The group with the highest labor force participation rate are those with the educational attainment of high school diploma, with 78.5% or 62 individuals in the labor force. Within the labor force, individuals with less than high school education have the highest percentage of unemployment, with 45.5% or 5 of them being unemployed.
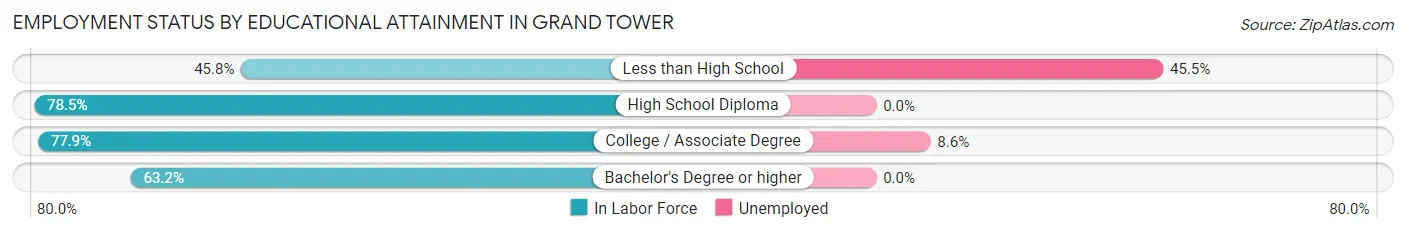
| Educational Attainment | In Labor Force | Unemployed |
| Less than High School | 11 (45.8%) | 11 (45.5%) |
| High School Diploma | 62 (78.5%) | 0 (0.0%) |
| College / Associate Degree | 81 (77.9%) | 9 (8.6%) |
| Bachelor's Degree or higher | 12 (63.2%) | 0 (0.0%) |
| Total | 166 (73.5%) | 16 (7.2%) |
Employment Occupations by Sex in Grand Tower
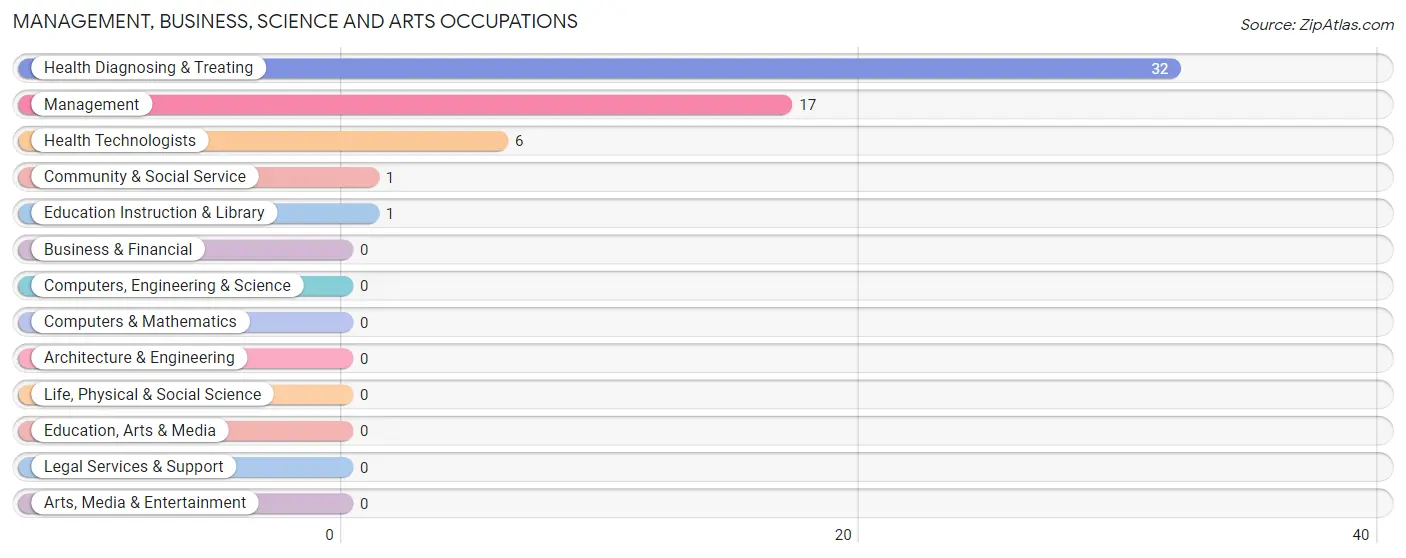
Management, Business, Science and Arts Occupations
The most common Management, Business, Science and Arts occupations in Grand Tower are Health Diagnosing & Treating (32 | 14.0%), Management (17 | 7.5%), Health Technologists (6 | 2.6%), Community & Social Service (1 | 0.4%), and Education Instruction & Library (1 | 0.4%).
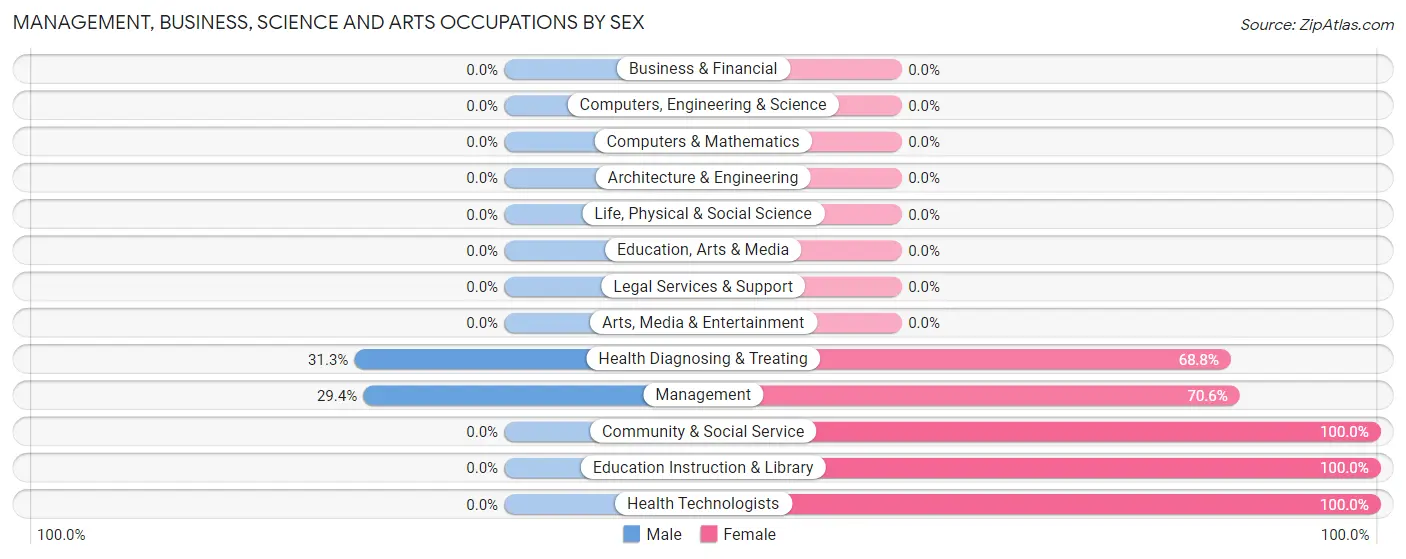
Management, Business, Science and Arts Occupations by Sex
Within the Management, Business, Science and Arts occupations in Grand Tower, the most male-oriented occupations are Health Diagnosing & Treating (31.2%), and Management (29.4%), while the most female-oriented occupations are Community & Social Service (100.0%), Education Instruction & Library (100.0%), and Health Technologists (100.0%).
| Occupation | Male | Female |
| Management | 5 (29.4%) | 12 (70.6%) |
| Business & Financial | 0 (0.0%) | 0 (0.0%) |
| Computers, Engineering & Science | 0 (0.0%) | 0 (0.0%) |
| Computers & Mathematics | 0 (0.0%) | 0 (0.0%) |
| Architecture & Engineering | 0 (0.0%) | 0 (0.0%) |
| Life, Physical & Social Science | 0 (0.0%) | 0 (0.0%) |
| Community & Social Service | 0 (0.0%) | 1 (100.0%) |
| Education, Arts & Media | 0 (0.0%) | 0 (0.0%) |
| Legal Services & Support | 0 (0.0%) | 0 (0.0%) |
| Education Instruction & Library | 0 (0.0%) | 1 (100.0%) |
| Arts, Media & Entertainment | 0 (0.0%) | 0 (0.0%) |
| Health Diagnosing & Treating | 10 (31.2%) | 22 (68.8%) |
| Health Technologists | 0 (0.0%) | 6 (100.0%) |
| Total (Category) | 15 (30.0%) | 35 (70.0%) |
| Total (Overall) | 135 (59.2%) | 93 (40.8%) |
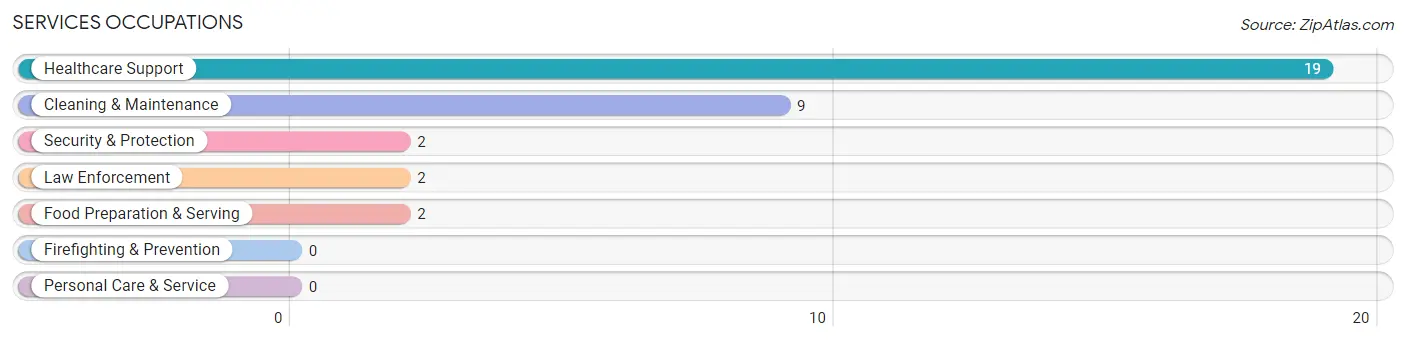
Services Occupations
The most common Services occupations in Grand Tower are Healthcare Support (19 | 8.3%), Cleaning & Maintenance (9 | 4.0%), Security & Protection (2 | 0.9%), Law Enforcement (2 | 0.9%), and Food Preparation & Serving (2 | 0.9%).
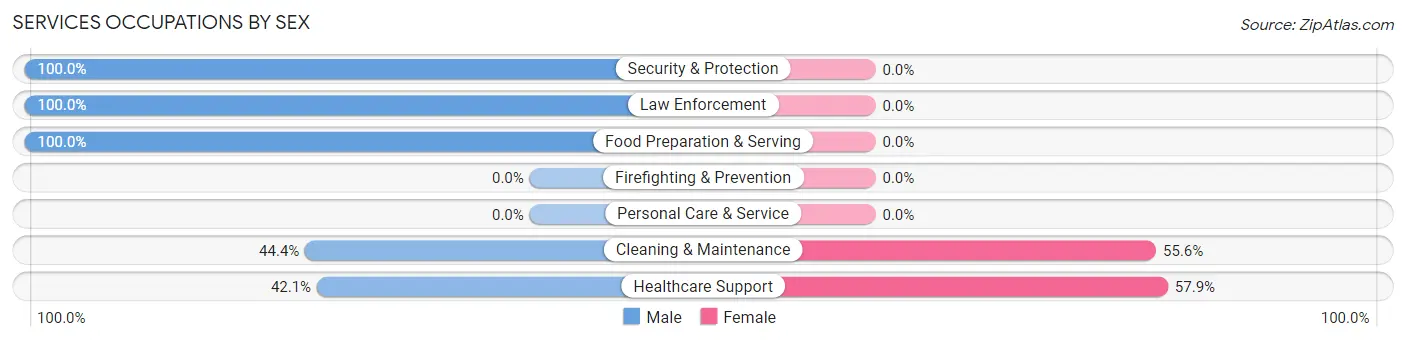
Services Occupations by Sex
Within the Services occupations in Grand Tower, the most male-oriented occupations are Security & Protection (100.0%), Law Enforcement (100.0%), and Food Preparation & Serving (100.0%), while the most female-oriented occupations are Healthcare Support (57.9%), and Cleaning & Maintenance (55.6%).
| Occupation | Male | Female |
| Healthcare Support | 8 (42.1%) | 11 (57.9%) |
| Security & Protection | 2 (100.0%) | 0 (0.0%) |
| Firefighting & Prevention | 0 (0.0%) | 0 (0.0%) |
| Law Enforcement | 2 (100.0%) | 0 (0.0%) |
| Food Preparation & Serving | 2 (100.0%) | 0 (0.0%) |
| Cleaning & Maintenance | 4 (44.4%) | 5 (55.6%) |
| Personal Care & Service | 0 (0.0%) | 0 (0.0%) |
| Total (Category) | 16 (50.0%) | 16 (50.0%) |
| Total (Overall) | 135 (59.2%) | 93 (40.8%) |
Sales and Office Occupations
The most common Sales and Office occupations in Grand Tower are Office & Administration (27 | 11.8%), and Sales & Related (21 | 9.2%).

Sales and Office Occupations by Sex

| Occupation | Male | Female |
| Sales & Related | 16 (76.2%) | 5 (23.8%) |
| Office & Administration | 0 (0.0%) | 27 (100.0%) |
| Total (Category) | 16 (33.3%) | 32 (66.7%) |
| Total (Overall) | 135 (59.2%) | 93 (40.8%) |
Natural Resources, Construction and Maintenance Occupations
The most common Natural Resources, Construction and Maintenance occupations in Grand Tower are Installation, Maintenance & Repair (5 | 2.2%), Construction & Extraction (4 | 1.8%), and Farming, Fishing & Forestry (3 | 1.3%).
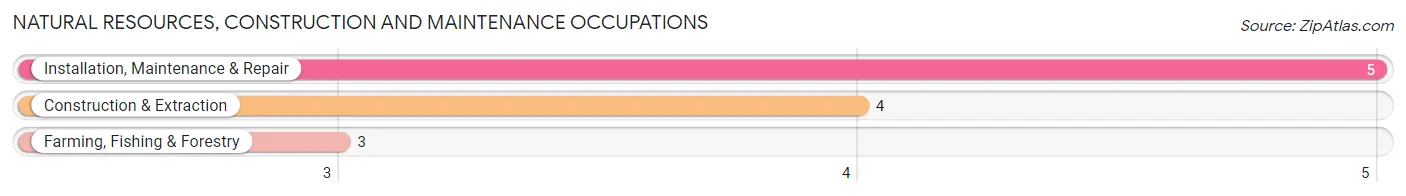
Natural Resources, Construction and Maintenance Occupations by Sex

| Occupation | Male | Female |
| Farming, Fishing & Forestry | 3 (100.0%) | 0 (0.0%) |
| Construction & Extraction | 4 (100.0%) | 0 (0.0%) |
| Installation, Maintenance & Repair | 5 (100.0%) | 0 (0.0%) |
| Total (Category) | 12 (100.0%) | 0 (0.0%) |
| Total (Overall) | 135 (59.2%) | 93 (40.8%) |
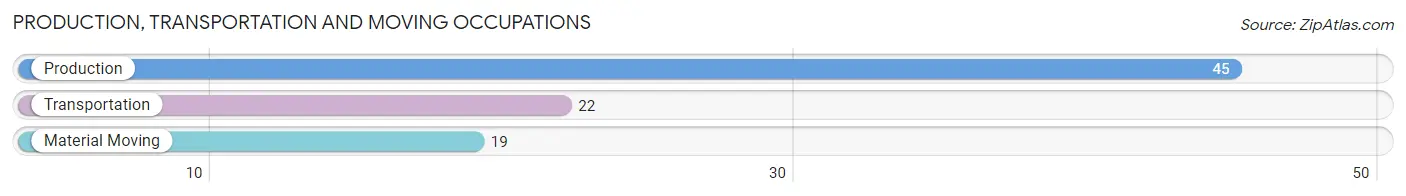
Production, Transportation and Moving Occupations
The most common Production, Transportation and Moving occupations in Grand Tower are Production (45 | 19.7%), Transportation (22 | 9.7%), and Material Moving (19 | 8.3%).
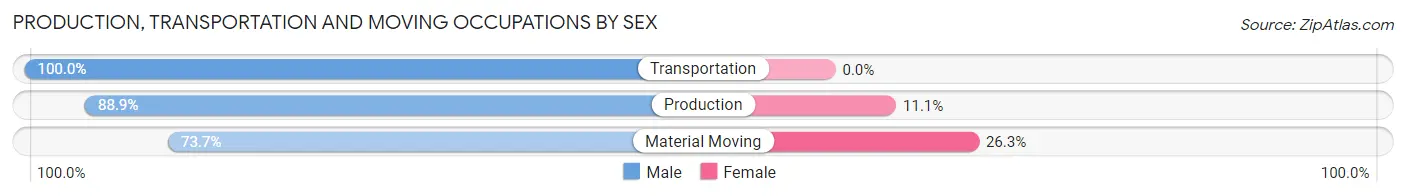
Production, Transportation and Moving Occupations by Sex
| Occupation | Male | Female |
| Production | 40 (88.9%) | 5 (11.1%) |
| Transportation | 22 (100.0%) | 0 (0.0%) |
| Material Moving | 14 (73.7%) | 5 (26.3%) |
| Total (Category) | 76 (88.4%) | 10 (11.6%) |
| Total (Overall) | 135 (59.2%) | 93 (40.8%) |
Employment Industries by Sex in Grand Tower
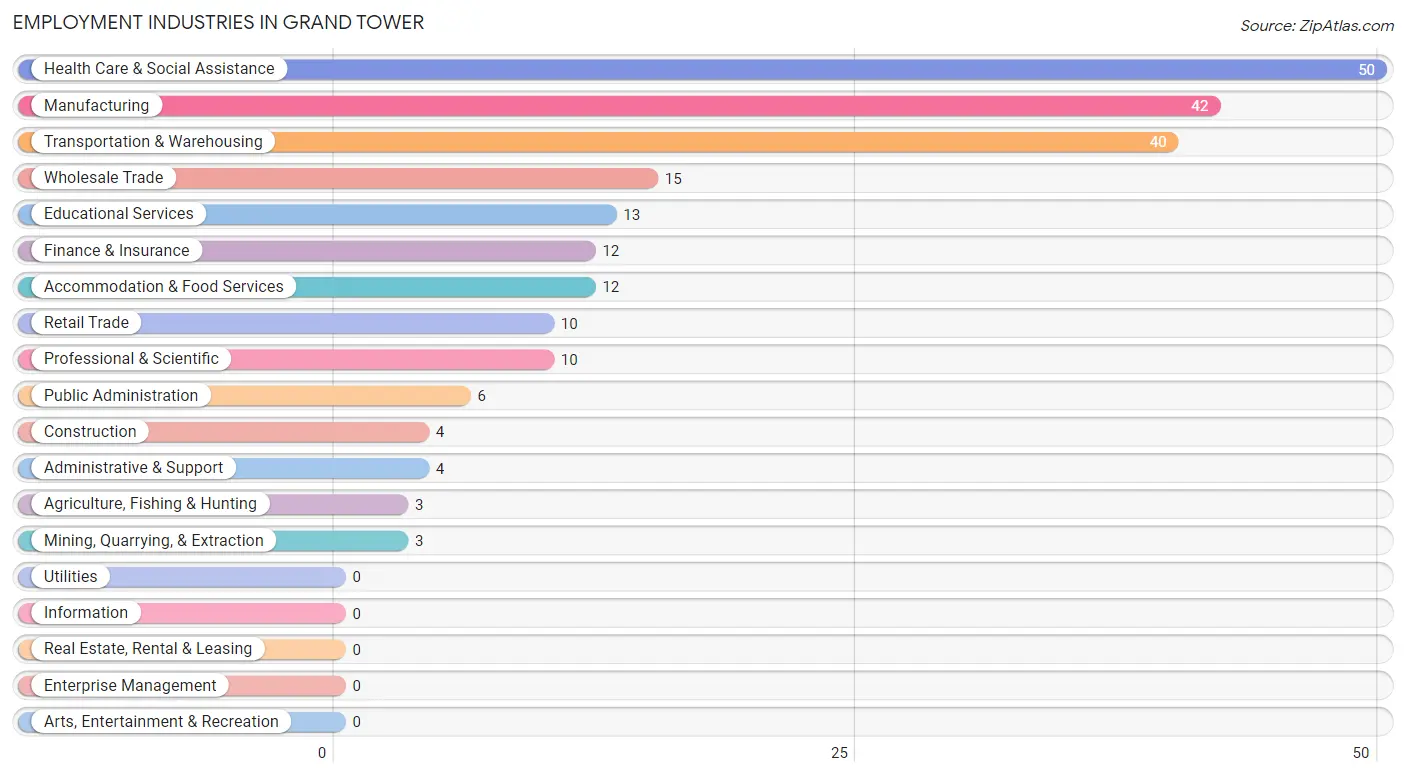
Employment Industries in Grand Tower
The major employment industries in Grand Tower include Health Care & Social Assistance (50 | 21.9%), Manufacturing (42 | 18.4%), Transportation & Warehousing (40 | 17.5%), Wholesale Trade (15 | 6.6%), and Educational Services (13 | 5.7%).
Employment Industries by Sex in Grand Tower
The Grand Tower industries that see more men than women are Agriculture, Fishing & Hunting (100.0%), Mining, Quarrying, & Extraction (100.0%), and Construction (100.0%), whereas the industries that tend to have a higher number of women are Retail Trade (100.0%), Educational Services (100.0%), and Finance & Insurance (75.0%).
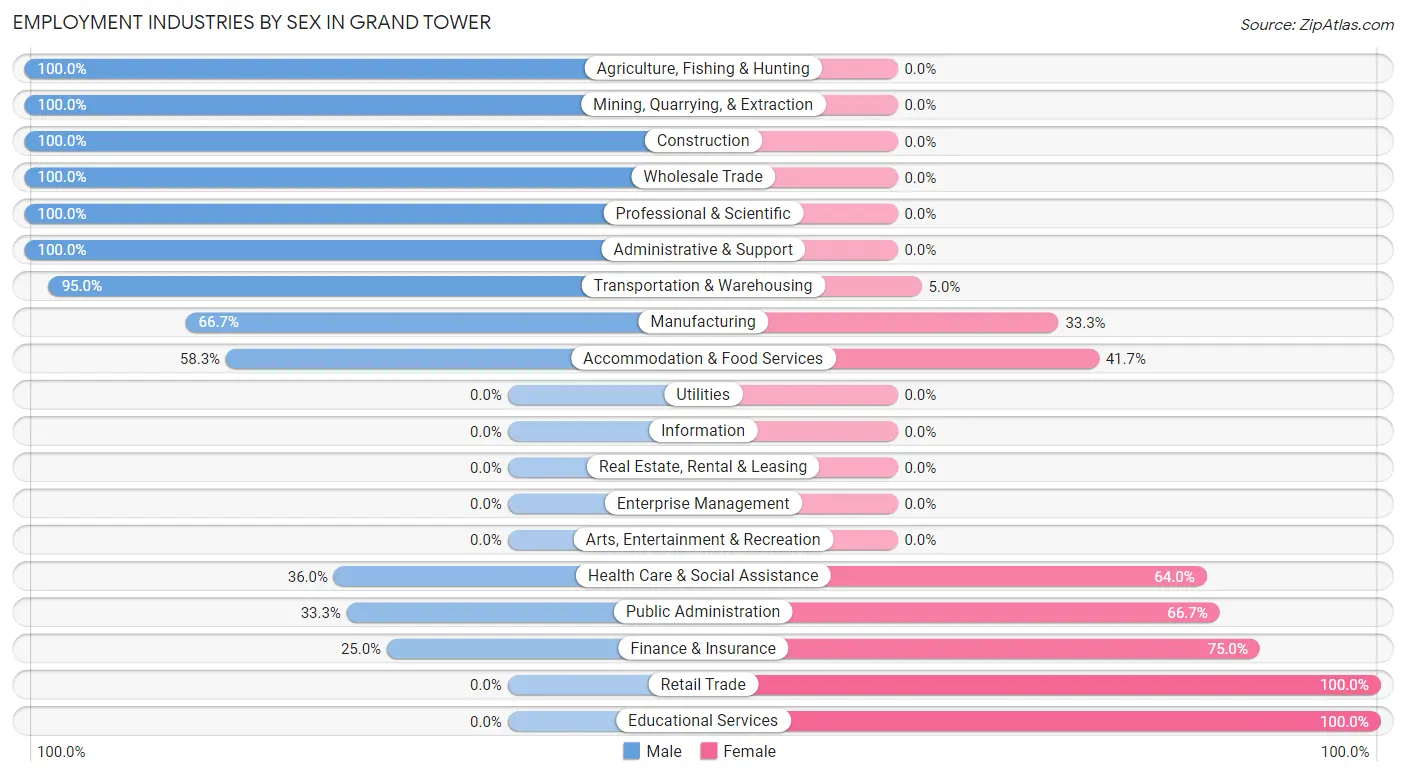
| Industry | Male | Female |
| Agriculture, Fishing & Hunting | 3 (100.0%) | 0 (0.0%) |
| Mining, Quarrying, & Extraction | 3 (100.0%) | 0 (0.0%) |
| Construction | 4 (100.0%) | 0 (0.0%) |
| Manufacturing | 28 (66.7%) | 14 (33.3%) |
| Wholesale Trade | 15 (100.0%) | 0 (0.0%) |
| Retail Trade | 0 (0.0%) | 10 (100.0%) |
| Transportation & Warehousing | 38 (95.0%) | 2 (5.0%) |
| Utilities | 0 (0.0%) | 0 (0.0%) |
| Information | 0 (0.0%) | 0 (0.0%) |
| Finance & Insurance | 3 (25.0%) | 9 (75.0%) |
| Real Estate, Rental & Leasing | 0 (0.0%) | 0 (0.0%) |
| Professional & Scientific | 10 (100.0%) | 0 (0.0%) |
| Enterprise Management | 0 (0.0%) | 0 (0.0%) |
| Administrative & Support | 4 (100.0%) | 0 (0.0%) |
| Educational Services | 0 (0.0%) | 13 (100.0%) |
| Health Care & Social Assistance | 18 (36.0%) | 32 (64.0%) |
| Arts, Entertainment & Recreation | 0 (0.0%) | 0 (0.0%) |
| Accommodation & Food Services | 7 (58.3%) | 5 (41.7%) |
| Public Administration | 2 (33.3%) | 4 (66.7%) |
| Total | 135 (59.2%) | 93 (40.8%) |
Education in Grand Tower
School Enrollment in Grand Tower
The most common levels of schooling among the 145 students in Grand Tower are college / undergraduate (33 | 22.8%), kindergarten (31 | 21.4%), and nursery / preschool (27 | 18.6%).
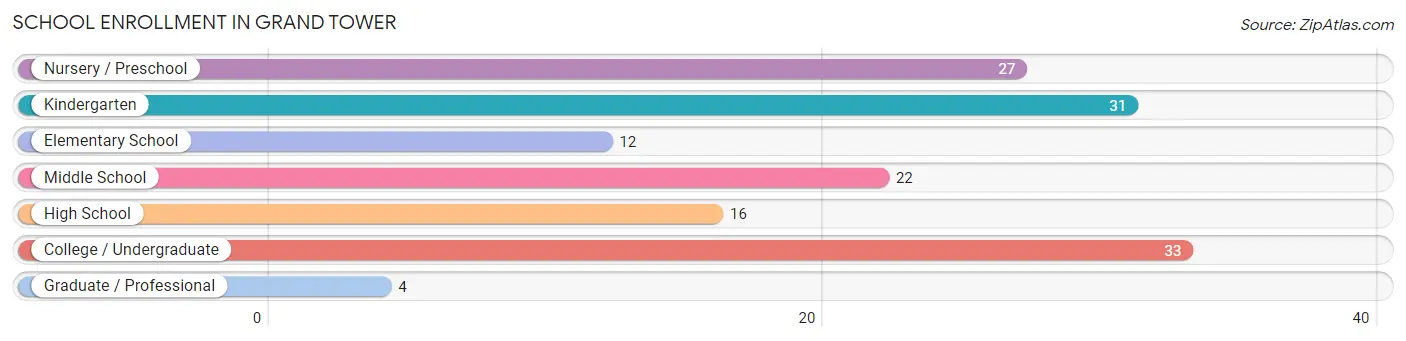
| School Level | # Students | % Students |
| Nursery / Preschool | 27 | 18.6% |
| Kindergarten | 31 | 21.4% |
| Elementary School | 12 | 8.3% |
| Middle School | 22 | 15.2% |
| High School | 16 | 11.0% |
| College / Undergraduate | 33 | 22.8% |
| Graduate / Professional | 4 | 2.8% |
| Total | 145 | 100.0% |
School Enrollment by Age by Funding Source in Grand Tower
Out of a total of 145 students who are enrolled in schools in Grand Tower, 21 (14.5%) attend a private institution, while the remaining 124 (85.5%) are enrolled in public schools. The age group of 3 to 4 year olds has the highest likelihood of being enrolled in private schools, with 12 (48.0% in the age bracket) enrolled. Conversely, the age group of 5 to 9 year old has the lowest likelihood of being enrolled in a private school, with 43 (100.0% in the age bracket) attending a public institution.
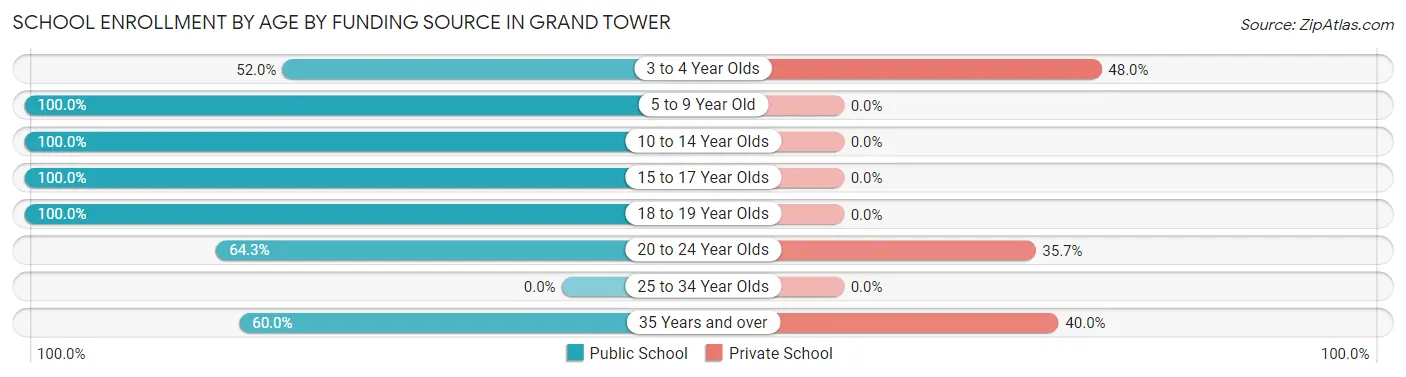
| Age Bracket | Public School | Private School |
| 3 to 4 Year Olds | 13 (52.0%) | 12 (48.0%) |
| 5 to 9 Year Old | 43 (100.0%) | 0 (0.0%) |
| 10 to 14 Year Olds | 28 (100.0%) | 0 (0.0%) |
| 15 to 17 Year Olds | 6 (100.0%) | 0 (0.0%) |
| 18 to 19 Year Olds | 19 (100.0%) | 0 (0.0%) |
| 20 to 24 Year Olds | 9 (64.3%) | 5 (35.7%) |
| 25 to 34 Year Olds | 0 (0.0%) | 0 (0.0%) |
| 35 Years and over | 6 (60.0%) | 4 (40.0%) |
| Total | 124 (85.5%) | 21 (14.5%) |
Educational Attainment by Field of Study in Grand Tower
Psychology (12 | 60.0%), education (6 | 30.0%), and arts & humanities (2 | 10.0%) are the most common fields of study among 20 individuals in Grand Tower who have obtained a bachelor's degree or higher.
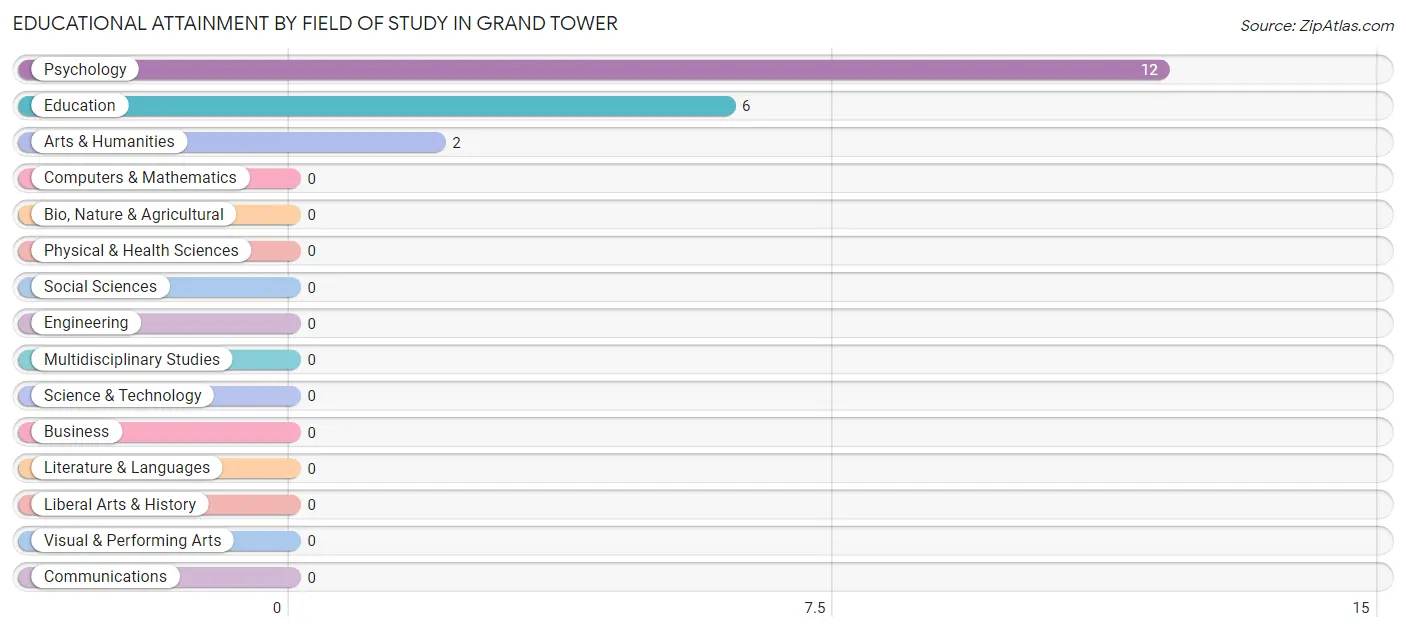
| Field of Study | # Graduates | % Graduates |
| Computers & Mathematics | 0 | 0.0% |
| Bio, Nature & Agricultural | 0 | 0.0% |
| Physical & Health Sciences | 0 | 0.0% |
| Psychology | 12 | 60.0% |
| Social Sciences | 0 | 0.0% |
| Engineering | 0 | 0.0% |
| Multidisciplinary Studies | 0 | 0.0% |
| Science & Technology | 0 | 0.0% |
| Business | 0 | 0.0% |
| Education | 6 | 30.0% |
| Literature & Languages | 0 | 0.0% |
| Liberal Arts & History | 0 | 0.0% |
| Visual & Performing Arts | 0 | 0.0% |
| Communications | 0 | 0.0% |
| Arts & Humanities | 2 | 10.0% |
| Total | 20 | 100.0% |
Transportation & Commute in Grand Tower
Vehicle Availability by Sex in Grand Tower
The most prevalent vehicle ownership categories in Grand Tower are males with 2 vehicles (61, accounting for 45.2%) and females with 2 vehicles (39, making up 70.9%).
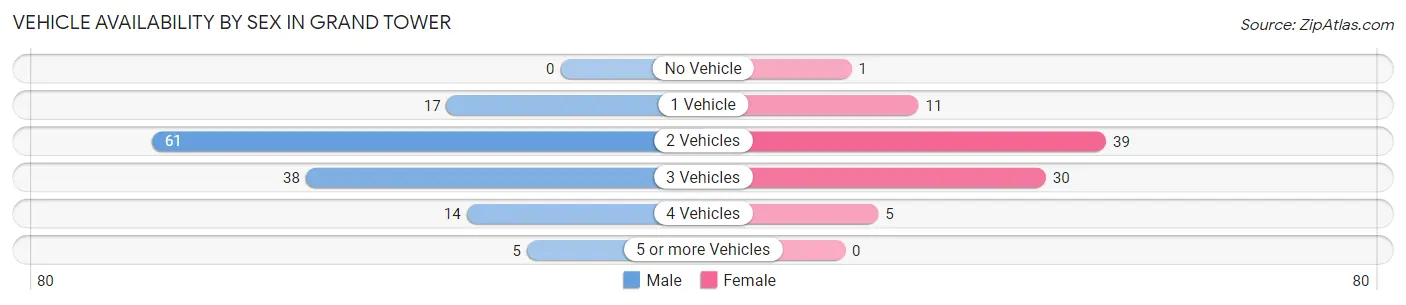
| Vehicles Available | Male | Female |
| No Vehicle | 0 (0.0%) | 1 (1.2%) |
| 1 Vehicle | 17 (12.6%) | 11 (12.8%) |
| 2 Vehicles | 61 (45.2%) | 39 (45.4%) |
| 3 Vehicles | 38 (28.1%) | 30 (34.9%) |
| 4 Vehicles | 14 (10.4%) | 5 (5.8%) |
| 5 or more Vehicles | 5 (3.7%) | 0 (0.0%) |
| Total | 135 (100.0%) | 86 (100.0%) |
Commute Time in Grand Tower
The most frequently occuring commute durations in Grand Tower are 30 to 34 minutes (49 commuters, 22.3%), 25 to 29 minutes (30 commuters, 13.6%), and less than 5 minutes (23 commuters, 10.4%).
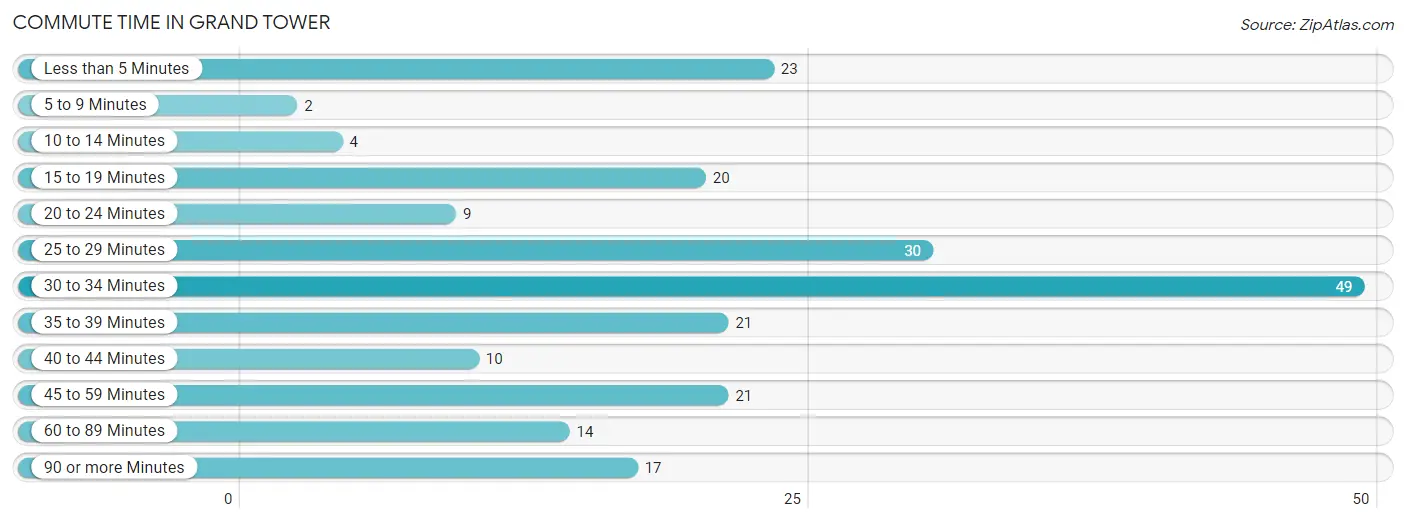
| Commute Time | # Commuters | % Commuters |
| Less than 5 Minutes | 23 | 10.4% |
| 5 to 9 Minutes | 2 | 0.9% |
| 10 to 14 Minutes | 4 | 1.8% |
| 15 to 19 Minutes | 20 | 9.1% |
| 20 to 24 Minutes | 9 | 4.1% |
| 25 to 29 Minutes | 30 | 13.6% |
| 30 to 34 Minutes | 49 | 22.3% |
| 35 to 39 Minutes | 21 | 9.6% |
| 40 to 44 Minutes | 10 | 4.5% |
| 45 to 59 Minutes | 21 | 9.6% |
| 60 to 89 Minutes | 14 | 6.4% |
| 90 or more Minutes | 17 | 7.7% |
Commute Time by Sex in Grand Tower
The most common commute times in Grand Tower are 30 to 34 minutes (34 commuters, 25.2%) for males and 25 to 29 minutes (15 commuters, 17.6%) for females.
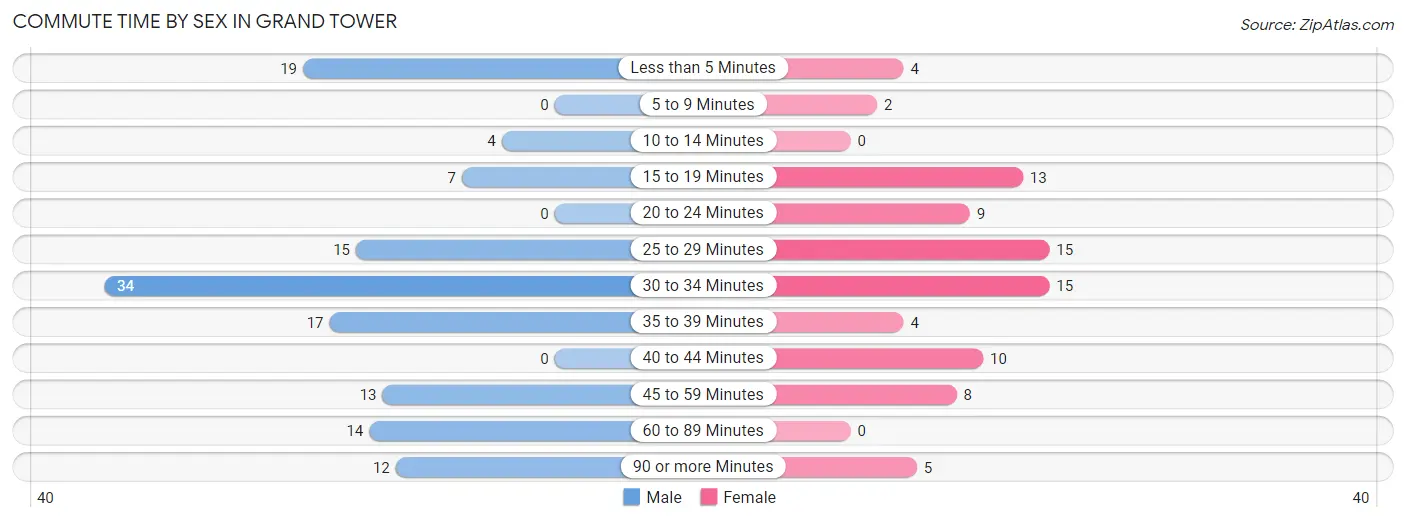
| Commute Time | Male | Female |
| Less than 5 Minutes | 19 (14.1%) | 4 (4.7%) |
| 5 to 9 Minutes | 0 (0.0%) | 2 (2.4%) |
| 10 to 14 Minutes | 4 (3.0%) | 0 (0.0%) |
| 15 to 19 Minutes | 7 (5.2%) | 13 (15.3%) |
| 20 to 24 Minutes | 0 (0.0%) | 9 (10.6%) |
| 25 to 29 Minutes | 15 (11.1%) | 15 (17.6%) |
| 30 to 34 Minutes | 34 (25.2%) | 15 (17.6%) |
| 35 to 39 Minutes | 17 (12.6%) | 4 (4.7%) |
| 40 to 44 Minutes | 0 (0.0%) | 10 (11.8%) |
| 45 to 59 Minutes | 13 (9.6%) | 8 (9.4%) |
| 60 to 89 Minutes | 14 (10.4%) | 0 (0.0%) |
| 90 or more Minutes | 12 (8.9%) | 5 (5.9%) |
Time of Departure to Work by Sex in Grand Tower
The most frequent times of departure to work in Grand Tower are 12:00 PM to 3:59 PM (42, 31.1%) for males and 6:30 AM to 6:59 AM (24, 28.2%) for females.
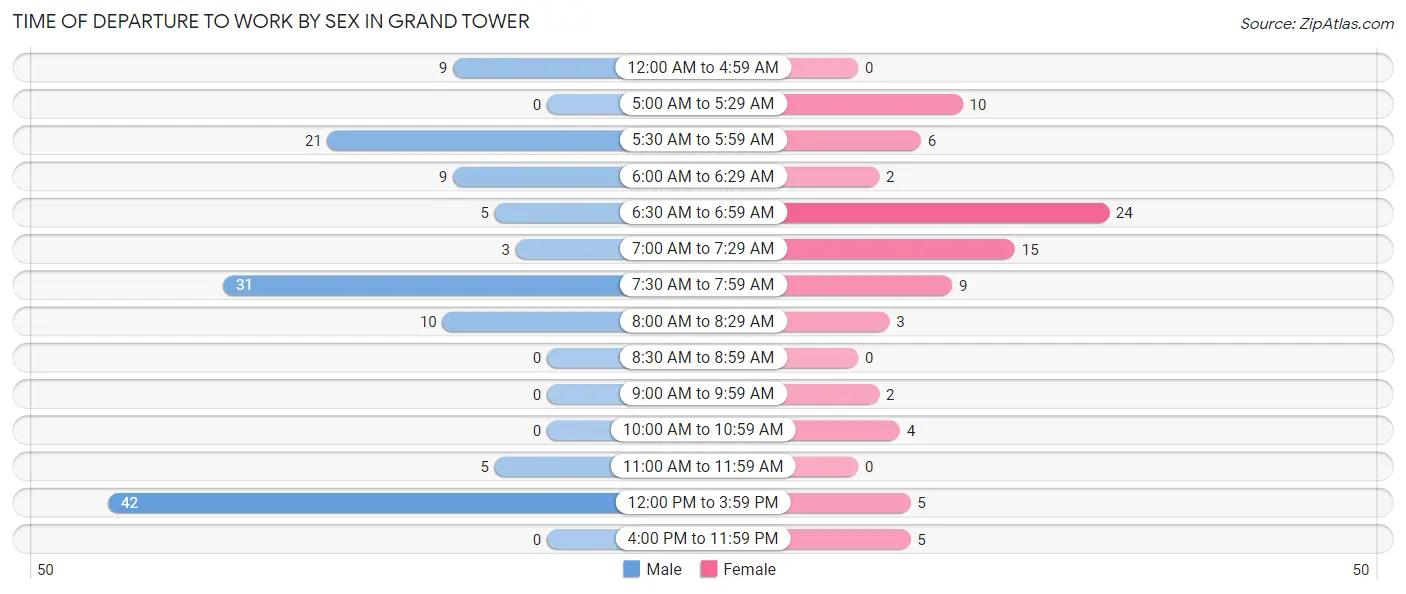
| Time of Departure | Male | Female |
| 12:00 AM to 4:59 AM | 9 (6.7%) | 0 (0.0%) |
| 5:00 AM to 5:29 AM | 0 (0.0%) | 10 (11.8%) |
| 5:30 AM to 5:59 AM | 21 (15.6%) | 6 (7.1%) |
| 6:00 AM to 6:29 AM | 9 (6.7%) | 2 (2.4%) |
| 6:30 AM to 6:59 AM | 5 (3.7%) | 24 (28.2%) |
| 7:00 AM to 7:29 AM | 3 (2.2%) | 15 (17.6%) |
| 7:30 AM to 7:59 AM | 31 (23.0%) | 9 (10.6%) |
| 8:00 AM to 8:29 AM | 10 (7.4%) | 3 (3.5%) |
| 8:30 AM to 8:59 AM | 0 (0.0%) | 0 (0.0%) |
| 9:00 AM to 9:59 AM | 0 (0.0%) | 2 (2.4%) |
| 10:00 AM to 10:59 AM | 0 (0.0%) | 4 (4.7%) |
| 11:00 AM to 11:59 AM | 5 (3.7%) | 0 (0.0%) |
| 12:00 PM to 3:59 PM | 42 (31.1%) | 5 (5.9%) |
| 4:00 PM to 11:59 PM | 0 (0.0%) | 5 (5.9%) |
| Total | 135 (100.0%) | 85 (100.0%) |
Housing Occupancy in Grand Tower
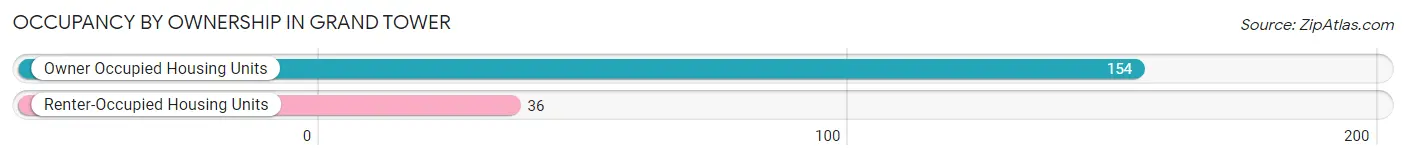
Occupancy by Ownership in Grand Tower
Of the total 190 dwellings in Grand Tower, owner-occupied units account for 154 (81.0%), while renter-occupied units make up 36 (19.0%).
| Occupancy | # Housing Units | % Housing Units |
| Owner Occupied Housing Units | 154 | 81.0% |
| Renter-Occupied Housing Units | 36 | 19.0% |
| Total Occupied Housing Units | 190 | 100.0% |
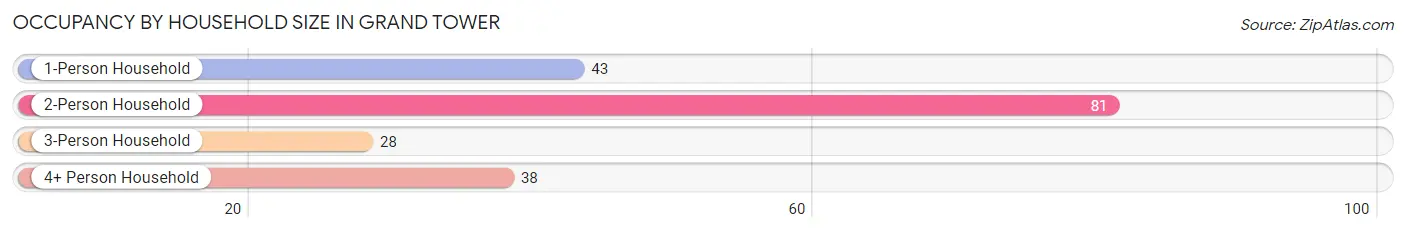
Occupancy by Household Size in Grand Tower
| Household Size | # Housing Units | % Housing Units |
| 1-Person Household | 43 | 22.6% |
| 2-Person Household | 81 | 42.6% |
| 3-Person Household | 28 | 14.7% |
| 4+ Person Household | 38 | 20.0% |
| Total Housing Units | 190 | 100.0% |
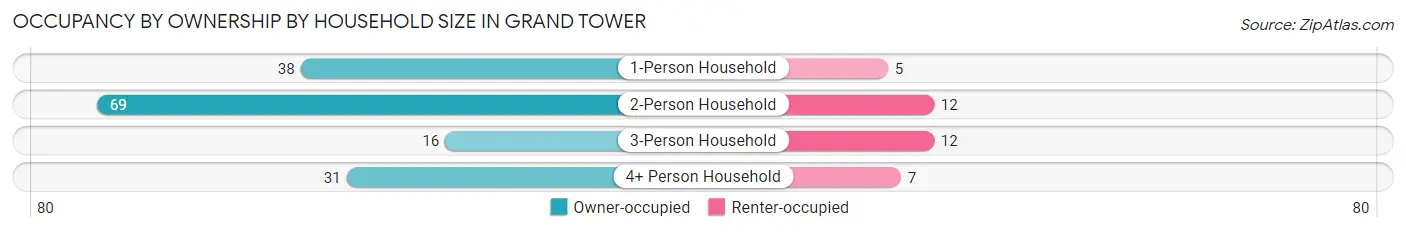
Occupancy by Ownership by Household Size in Grand Tower
| Household Size | Owner-occupied | Renter-occupied |
| 1-Person Household | 38 (88.4%) | 5 (11.6%) |
| 2-Person Household | 69 (85.2%) | 12 (14.8%) |
| 3-Person Household | 16 (57.1%) | 12 (42.9%) |
| 4+ Person Household | 31 (81.6%) | 7 (18.4%) |
| Total Housing Units | 154 (81.0%) | 36 (19.0%) |
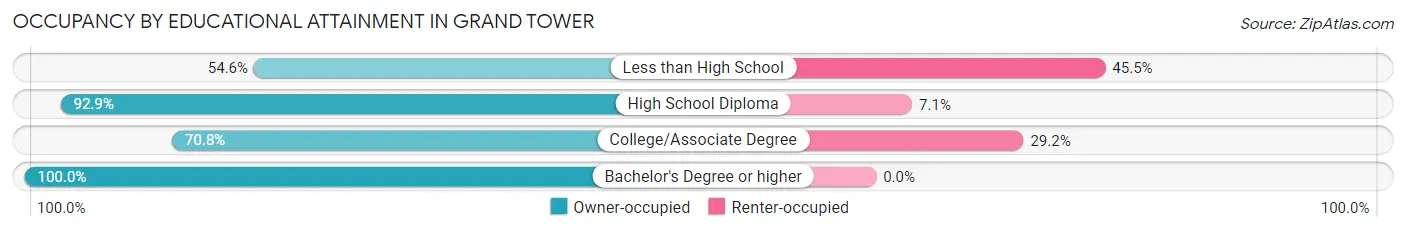
Occupancy by Educational Attainment in Grand Tower
| Household Size | Owner-occupied | Renter-occupied |
| Less than High School | 6 (54.5%) | 5 (45.5%) |
| High School Diploma | 65 (92.9%) | 5 (7.1%) |
| College/Associate Degree | 63 (70.8%) | 26 (29.2%) |
| Bachelor's Degree or higher | 20 (100.0%) | 0 (0.0%) |
Occupancy by Age of Householder in Grand Tower
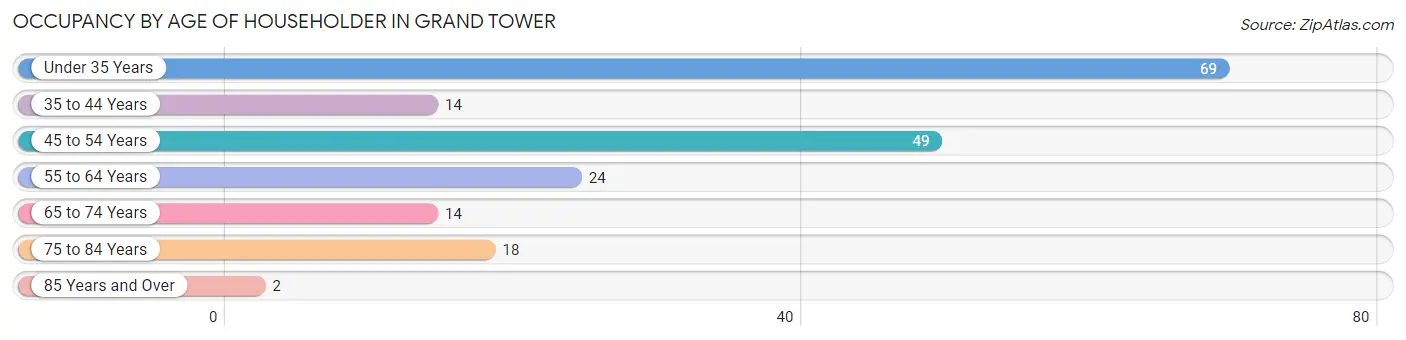
| Age Bracket | # Households | % Households |
| Under 35 Years | 69 | 36.3% |
| 35 to 44 Years | 14 | 7.4% |
| 45 to 54 Years | 49 | 25.8% |
| 55 to 64 Years | 24 | 12.6% |
| 65 to 74 Years | 14 | 7.4% |
| 75 to 84 Years | 18 | 9.5% |
| 85 Years and Over | 2 | 1.1% |
| Total | 190 | 100.0% |
Housing Finances in Grand Tower
Median Income by Occupancy in Grand Tower
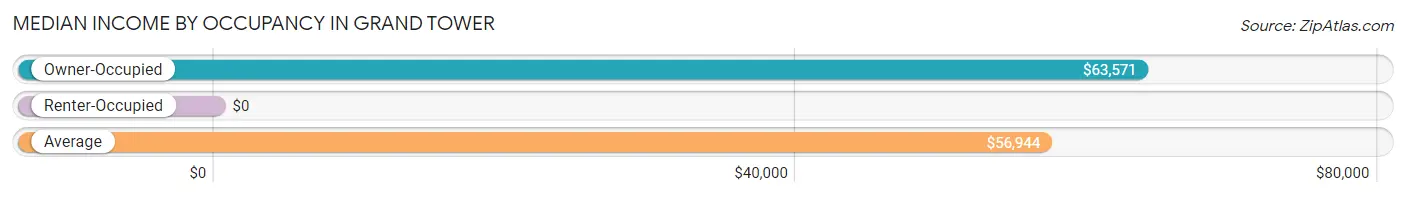
| Occupancy Type | # Households | Median Income |
| Owner-Occupied | 154 (81.0%) | $63,571 |
| Renter-Occupied | 36 (19.0%) | $0 |
| Average | 190 (100.0%) | $56,944 |
Occupancy by Householder Income Bracket in Grand Tower
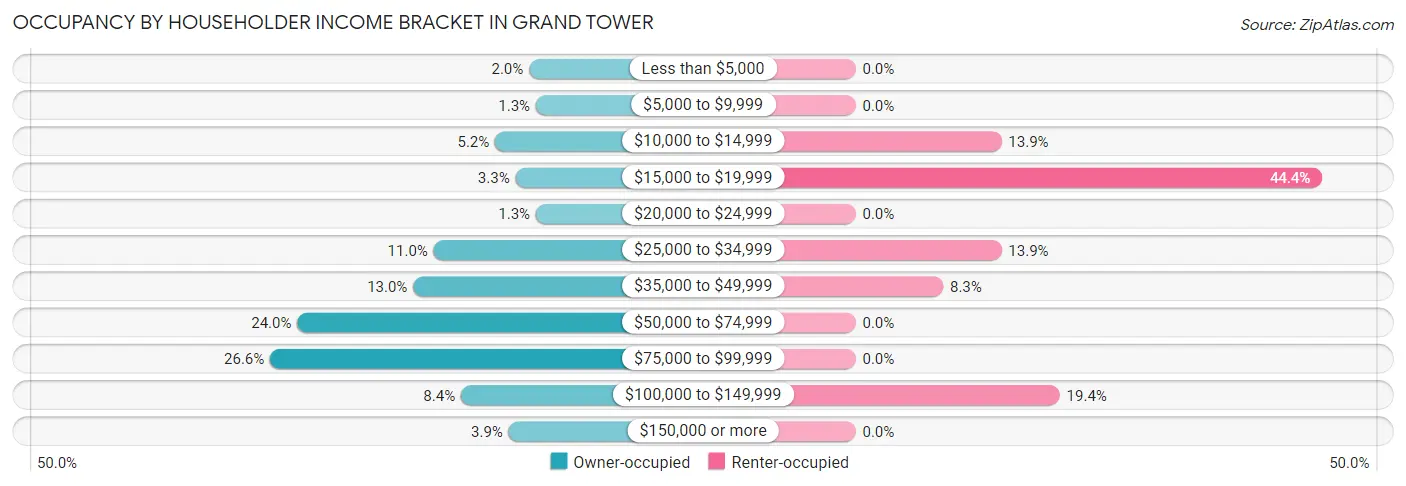
| Income Bracket | Owner-occupied | Renter-occupied |
| Less than $5,000 | 3 (1.9%) | 0 (0.0%) |
| $5,000 to $9,999 | 2 (1.3%) | 0 (0.0%) |
| $10,000 to $14,999 | 8 (5.2%) | 5 (13.9%) |
| $15,000 to $19,999 | 5 (3.3%) | 16 (44.4%) |
| $20,000 to $24,999 | 2 (1.3%) | 0 (0.0%) |
| $25,000 to $34,999 | 17 (11.0%) | 5 (13.9%) |
| $35,000 to $49,999 | 20 (13.0%) | 3 (8.3%) |
| $50,000 to $74,999 | 37 (24.0%) | 0 (0.0%) |
| $75,000 to $99,999 | 41 (26.6%) | 0 (0.0%) |
| $100,000 to $149,999 | 13 (8.4%) | 7 (19.4%) |
| $150,000 or more | 6 (3.9%) | 0 (0.0%) |
| Total | 154 (100.0%) | 36 (100.0%) |
Monthly Housing Cost Tiers in Grand Tower
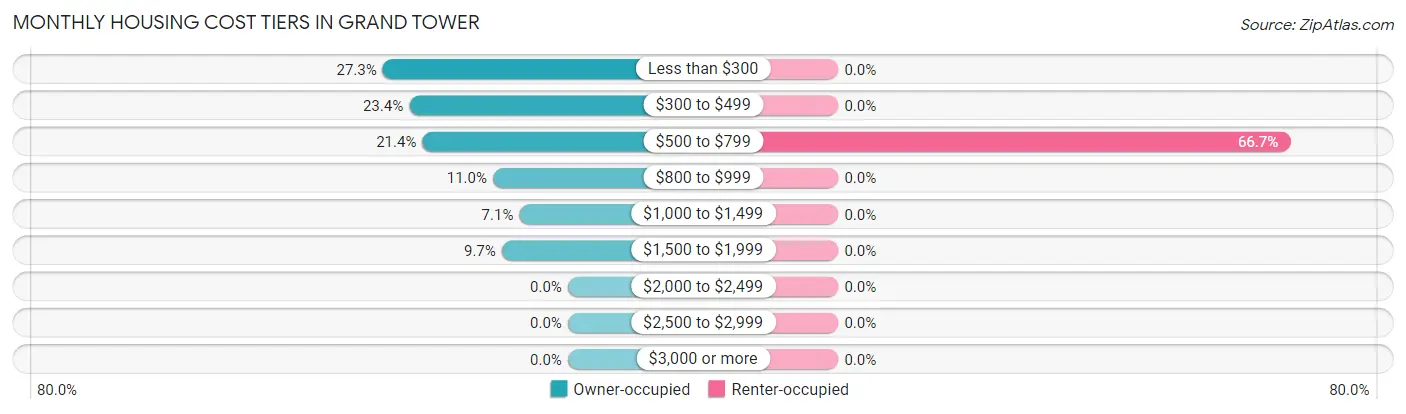
| Monthly Cost | Owner-occupied | Renter-occupied |
| Less than $300 | 42 (27.3%) | 0 (0.0%) |
| $300 to $499 | 36 (23.4%) | 0 (0.0%) |
| $500 to $799 | 33 (21.4%) | 24 (66.7%) |
| $800 to $999 | 17 (11.0%) | 0 (0.0%) |
| $1,000 to $1,499 | 11 (7.1%) | 0 (0.0%) |
| $1,500 to $1,999 | 15 (9.7%) | 0 (0.0%) |
| $2,000 to $2,499 | 0 (0.0%) | 0 (0.0%) |
| $2,500 to $2,999 | 0 (0.0%) | 0 (0.0%) |
| $3,000 or more | 0 (0.0%) | 0 (0.0%) |
| Total | 154 (100.0%) | 36 (100.0%) |
Physical Housing Characteristics in Grand Tower
Housing Structures in Grand Tower
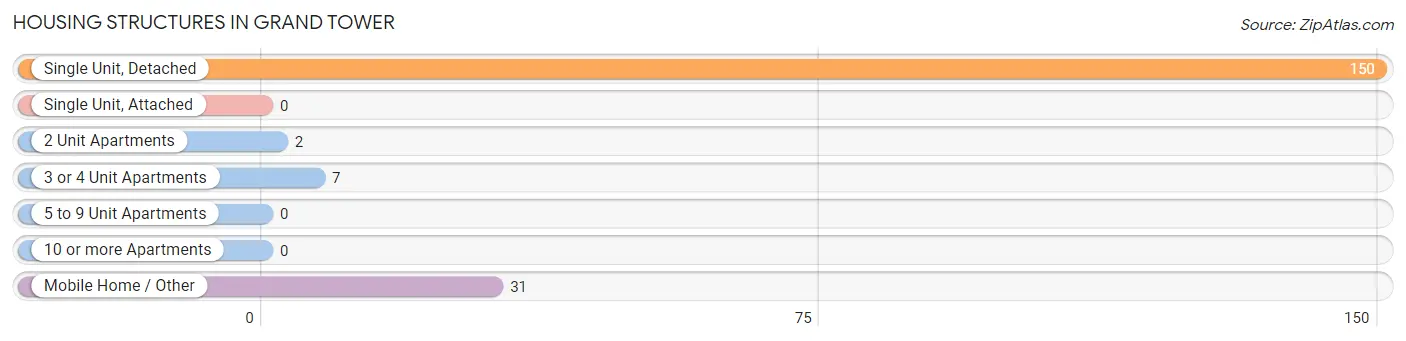
| Structure Type | # Housing Units | % Housing Units |
| Single Unit, Detached | 150 | 78.9% |
| Single Unit, Attached | 0 | 0.0% |
| 2 Unit Apartments | 2 | 1.1% |
| 3 or 4 Unit Apartments | 7 | 3.7% |
| 5 to 9 Unit Apartments | 0 | 0.0% |
| 10 or more Apartments | 0 | 0.0% |
| Mobile Home / Other | 31 | 16.3% |
| Total | 190 | 100.0% |
Housing Structures by Occupancy in Grand Tower
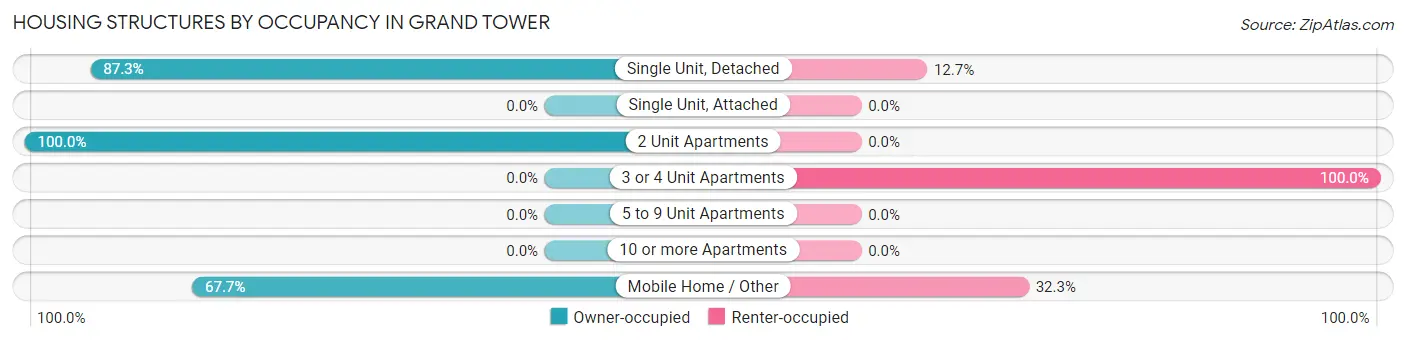
| Structure Type | Owner-occupied | Renter-occupied |
| Single Unit, Detached | 131 (87.3%) | 19 (12.7%) |
| Single Unit, Attached | 0 (0.0%) | 0 (0.0%) |
| 2 Unit Apartments | 2 (100.0%) | 0 (0.0%) |
| 3 or 4 Unit Apartments | 0 (0.0%) | 7 (100.0%) |
| 5 to 9 Unit Apartments | 0 (0.0%) | 0 (0.0%) |
| 10 or more Apartments | 0 (0.0%) | 0 (0.0%) |
| Mobile Home / Other | 21 (67.7%) | 10 (32.3%) |
| Total | 154 (81.0%) | 36 (19.0%) |
Housing Structures by Number of Rooms in Grand Tower
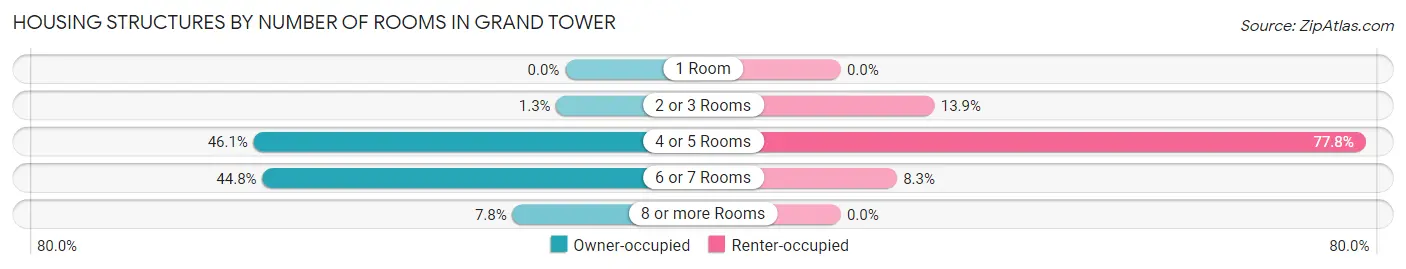
| Number of Rooms | Owner-occupied | Renter-occupied |
| 1 Room | 0 (0.0%) | 0 (0.0%) |
| 2 or 3 Rooms | 2 (1.3%) | 5 (13.9%) |
| 4 or 5 Rooms | 71 (46.1%) | 28 (77.8%) |
| 6 or 7 Rooms | 69 (44.8%) | 3 (8.3%) |
| 8 or more Rooms | 12 (7.8%) | 0 (0.0%) |
| Total | 154 (100.0%) | 36 (100.0%) |
Housing Structure by Heating Type in Grand Tower
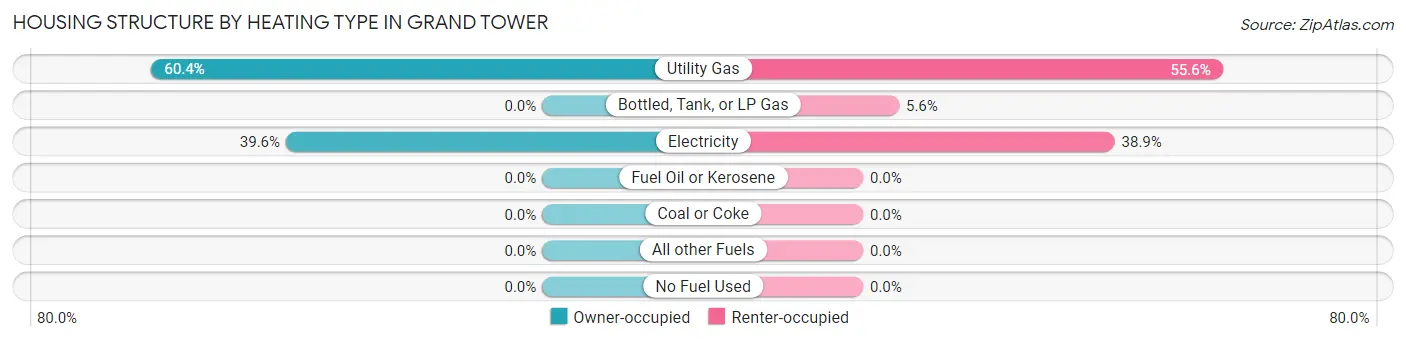
| Heating Type | Owner-occupied | Renter-occupied |
| Utility Gas | 93 (60.4%) | 20 (55.6%) |
| Bottled, Tank, or LP Gas | 0 (0.0%) | 2 (5.6%) |
| Electricity | 61 (39.6%) | 14 (38.9%) |
| Fuel Oil or Kerosene | 0 (0.0%) | 0 (0.0%) |
| Coal or Coke | 0 (0.0%) | 0 (0.0%) |
| All other Fuels | 0 (0.0%) | 0 (0.0%) |
| No Fuel Used | 0 (0.0%) | 0 (0.0%) |
| Total | 154 (100.0%) | 36 (100.0%) |
Household Vehicle Usage in Grand Tower
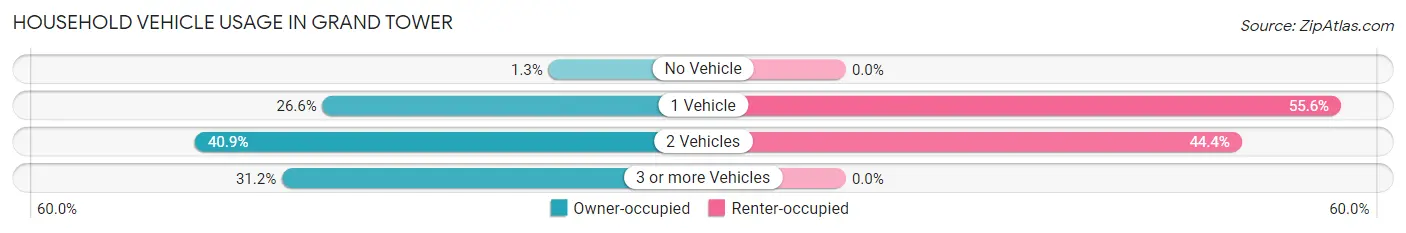
| Vehicles per Household | Owner-occupied | Renter-occupied |
| No Vehicle | 2 (1.3%) | 0 (0.0%) |
| 1 Vehicle | 41 (26.6%) | 20 (55.6%) |
| 2 Vehicles | 63 (40.9%) | 16 (44.4%) |
| 3 or more Vehicles | 48 (31.2%) | 0 (0.0%) |
| Total | 154 (100.0%) | 36 (100.0%) |
Real Estate & Mortgages in Grand Tower
Real Estate and Mortgage Overview in Grand Tower
| Characteristic | Without Mortgage | With Mortgage |
| Housing Units | 82 | 72 |
| Median Property Value | $22,200 | $32,300 |
| Median Household Income | $50,000 | $5 |
| Monthly Housing Costs | $297 | $0 |
| Real Estate Taxes | $310 | $19 |
Property Value by Mortgage Status in Grand Tower
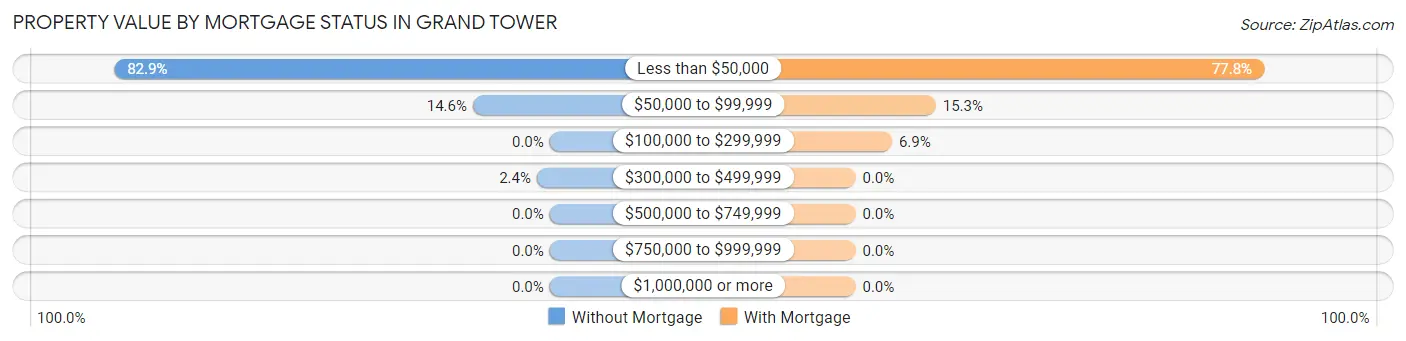
| Property Value | Without Mortgage | With Mortgage |
| Less than $50,000 | 68 (82.9%) | 56 (77.8%) |
| $50,000 to $99,999 | 12 (14.6%) | 11 (15.3%) |
| $100,000 to $299,999 | 0 (0.0%) | 5 (6.9%) |
| $300,000 to $499,999 | 2 (2.4%) | 0 (0.0%) |
| $500,000 to $749,999 | 0 (0.0%) | 0 (0.0%) |
| $750,000 to $999,999 | 0 (0.0%) | 0 (0.0%) |
| $1,000,000 or more | 0 (0.0%) | 0 (0.0%) |
| Total | 82 (100.0%) | 72 (100.0%) |
Household Income by Mortgage Status in Grand Tower
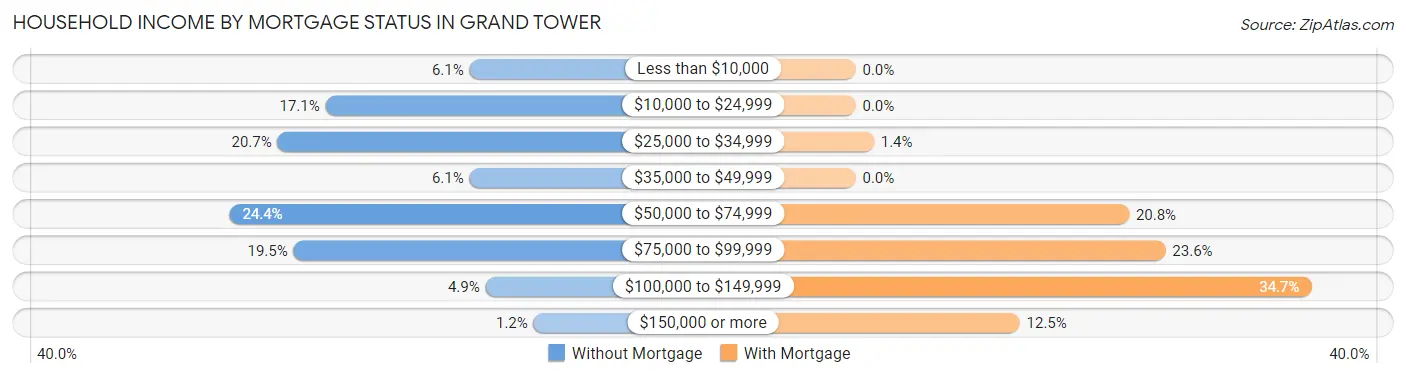
| Household Income | Without Mortgage | With Mortgage |
| Less than $10,000 | 5 (6.1%) | 0 (0.0%) |
| $10,000 to $24,999 | 14 (17.1%) | 0 (0.0%) |
| $25,000 to $34,999 | 17 (20.7%) | 1 (1.4%) |
| $35,000 to $49,999 | 5 (6.1%) | 0 (0.0%) |
| $50,000 to $74,999 | 20 (24.4%) | 15 (20.8%) |
| $75,000 to $99,999 | 16 (19.5%) | 17 (23.6%) |
| $100,000 to $149,999 | 4 (4.9%) | 25 (34.7%) |
| $150,000 or more | 1 (1.2%) | 9 (12.5%) |
| Total | 82 (100.0%) | 72 (100.0%) |
Property Value to Household Income Ratio in Grand Tower
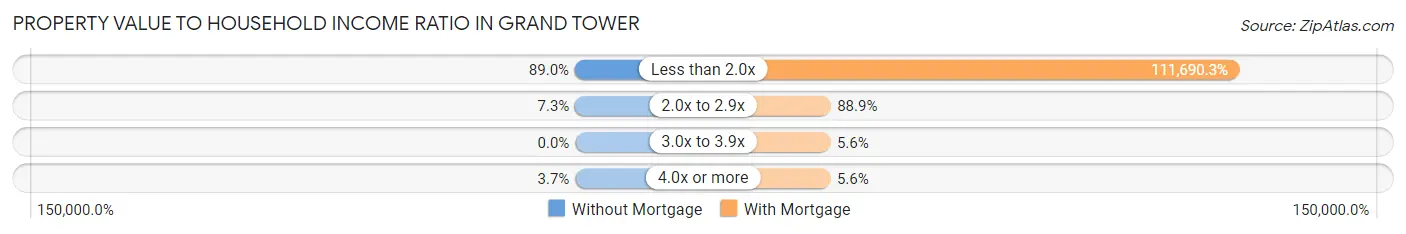
| Value-to-Income Ratio | Without Mortgage | With Mortgage |
| Less than 2.0x | 73 (89.0%) | 80,417 (111,690.3%) |
| 2.0x to 2.9x | 6 (7.3%) | 64 (88.9%) |
| 3.0x to 3.9x | 0 (0.0%) | 4 (5.6%) |
| 4.0x or more | 3 (3.7%) | 4 (5.6%) |
| Total | 82 (100.0%) | 72 (100.0%) |
Real Estate Taxes by Mortgage Status in Grand Tower
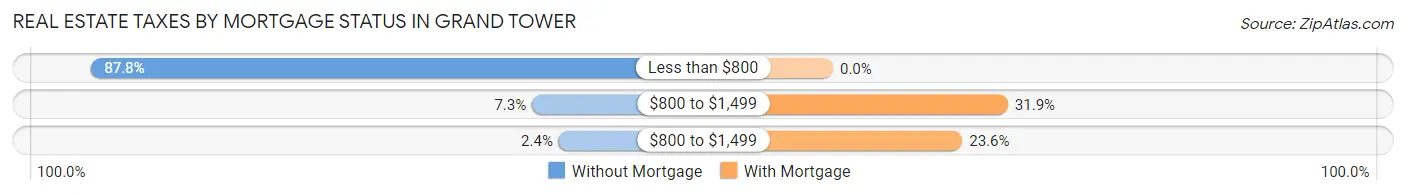
| Property Taxes | Without Mortgage | With Mortgage |
| Less than $800 | 72 (87.8%) | 0 (0.0%) |
| $800 to $1,499 | 6 (7.3%) | 23 (31.9%) |
| $800 to $1,499 | 2 (2.4%) | 17 (23.6%) |
| Total | 82 (100.0%) | 72 (100.0%) |
Health & Disability in Grand Tower
Health Insurance Coverage by Age in Grand Tower
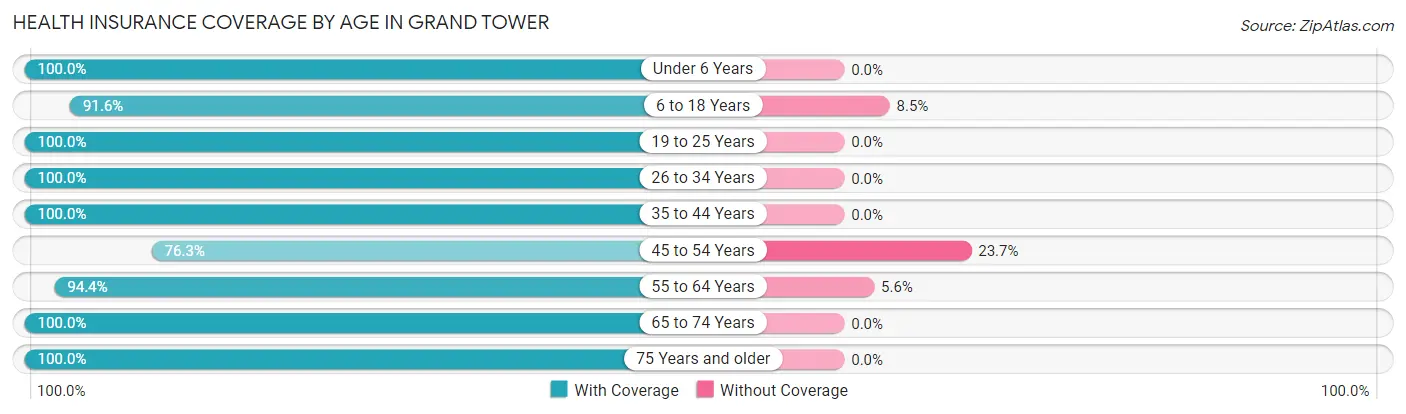
| Age Bracket | With Coverage | Without Coverage |
| Under 6 Years | 64 (100.0%) | 0 (0.0%) |
| 6 to 18 Years | 65 (91.5%) | 6 (8.5%) |
| 19 to 25 Years | 89 (100.0%) | 0 (0.0%) |
| 26 to 34 Years | 47 (100.0%) | 0 (0.0%) |
| 35 to 44 Years | 63 (100.0%) | 0 (0.0%) |
| 45 to 54 Years | 58 (76.3%) | 18 (23.7%) |
| 55 to 64 Years | 34 (94.4%) | 2 (5.6%) |
| 65 to 74 Years | 31 (100.0%) | 0 (0.0%) |
| 75 Years and older | 28 (100.0%) | 0 (0.0%) |
| Total | 479 (94.9%) | 26 (5.1%) |
Health Insurance Coverage by Citizenship Status in Grand Tower
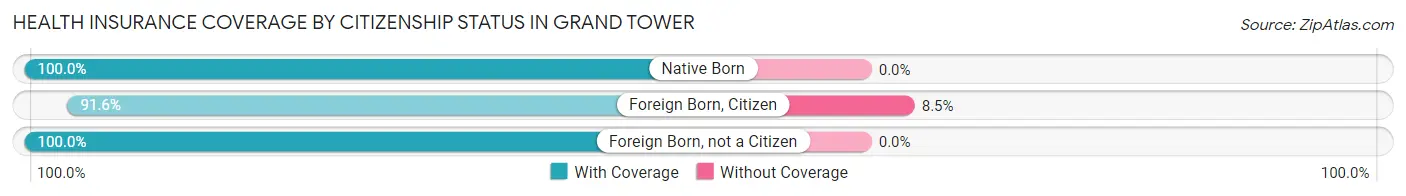
| Citizenship Status | With Coverage | Without Coverage |
| Native Born | 64 (100.0%) | 0 (0.0%) |
| Foreign Born, Citizen | 65 (91.5%) | 6 (8.5%) |
| Foreign Born, not a Citizen | 89 (100.0%) | 0 (0.0%) |
Health Insurance Coverage by Household Income in Grand Tower
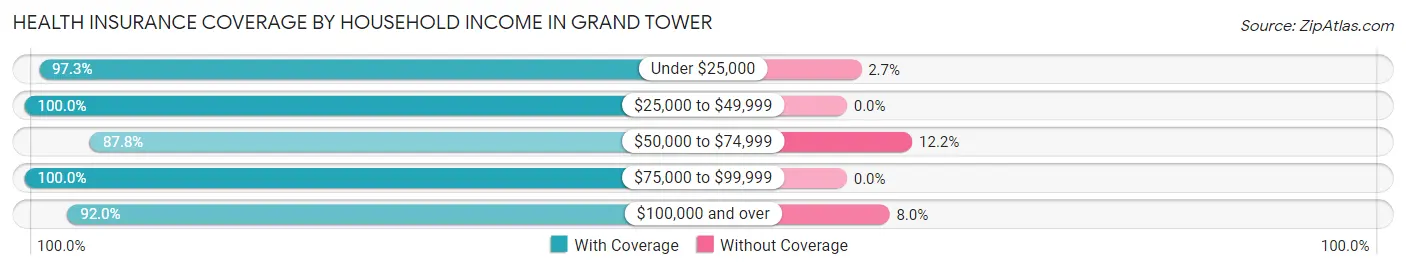
| Household Income | With Coverage | Without Coverage |
| Under $25,000 | 72 (97.3%) | 2 (2.7%) |
| $25,000 to $49,999 | 95 (100.0%) | 0 (0.0%) |
| $50,000 to $74,999 | 129 (87.8%) | 18 (12.2%) |
| $75,000 to $99,999 | 114 (100.0%) | 0 (0.0%) |
| $100,000 and over | 69 (92.0%) | 6 (8.0%) |
Public vs Private Health Insurance Coverage by Age in Grand Tower
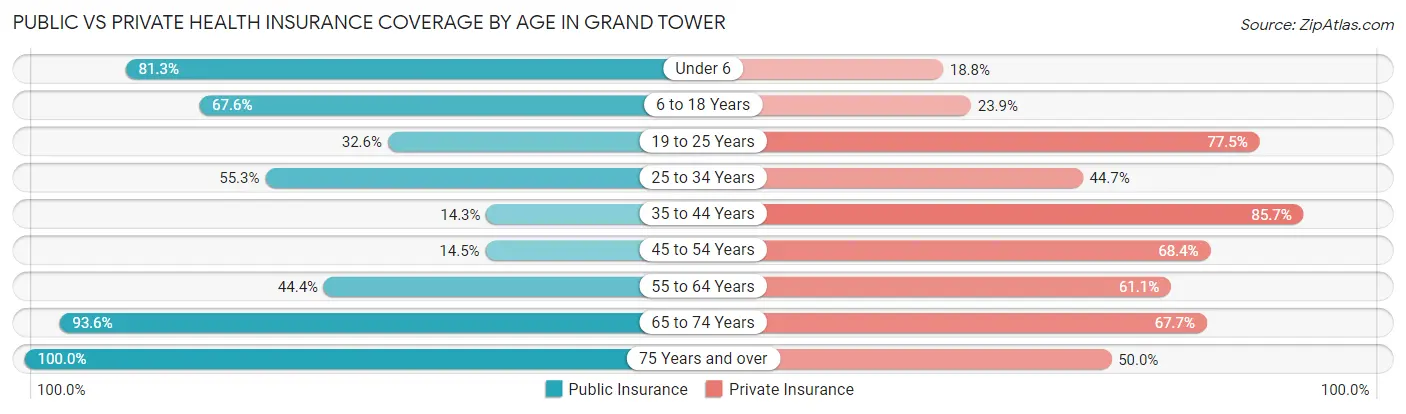
| Age Bracket | Public Insurance | Private Insurance |
| Under 6 | 52 (81.2%) | 12 (18.8%) |
| 6 to 18 Years | 48 (67.6%) | 17 (23.9%) |
| 19 to 25 Years | 29 (32.6%) | 69 (77.5%) |
| 25 to 34 Years | 26 (55.3%) | 21 (44.7%) |
| 35 to 44 Years | 9 (14.3%) | 54 (85.7%) |
| 45 to 54 Years | 11 (14.5%) | 52 (68.4%) |
| 55 to 64 Years | 16 (44.4%) | 22 (61.1%) |
| 65 to 74 Years | 29 (93.5%) | 21 (67.7%) |
| 75 Years and over | 28 (100.0%) | 14 (50.0%) |
| Total | 248 (49.1%) | 282 (55.8%) |
Disability Status by Sex by Age in Grand Tower
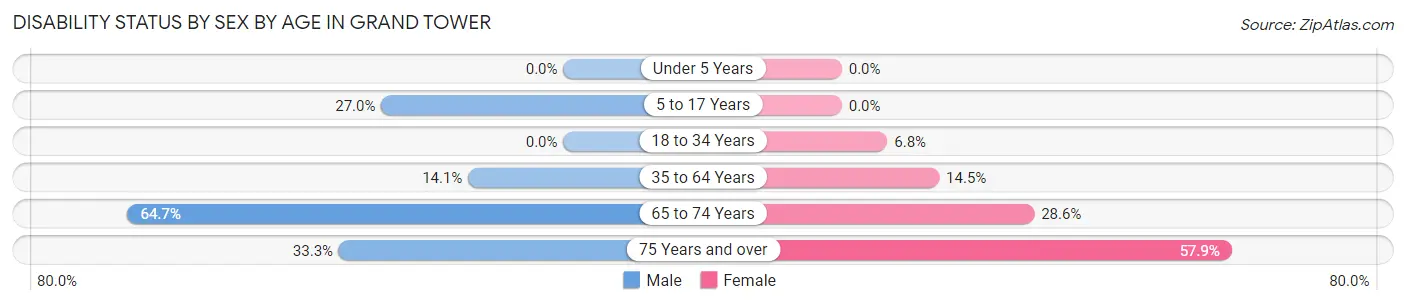
| Age Bracket | Male | Female |
| Under 5 Years | 0 (0.0%) | 0 (0.0%) |
| 5 to 17 Years | 10 (27.0%) | 0 (0.0%) |
| 18 to 34 Years | 0 (0.0%) | 5 (6.8%) |
| 35 to 64 Years | 13 (14.1%) | 12 (14.5%) |
| 65 to 74 Years | 11 (64.7%) | 4 (28.6%) |
| 75 Years and over | 3 (33.3%) | 11 (57.9%) |
Disability Class by Sex by Age in Grand Tower
Disability Class: Hearing Difficulty
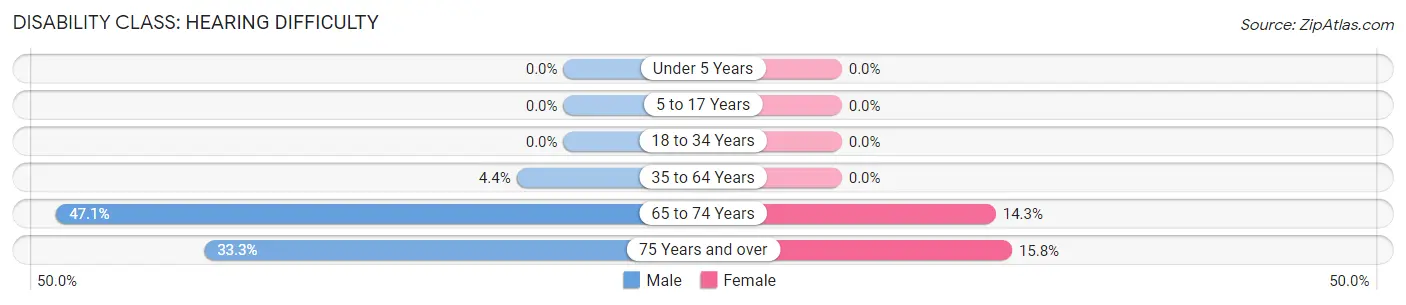
| Age Bracket | Male | Female |
| Under 5 Years | 0 (0.0%) | 0 (0.0%) |
| 5 to 17 Years | 0 (0.0%) | 0 (0.0%) |
| 18 to 34 Years | 0 (0.0%) | 0 (0.0%) |
| 35 to 64 Years | 4 (4.3%) | 0 (0.0%) |
| 65 to 74 Years | 8 (47.1%) | 2 (14.3%) |
| 75 Years and over | 3 (33.3%) | 3 (15.8%) |
Disability Class: Vision Difficulty
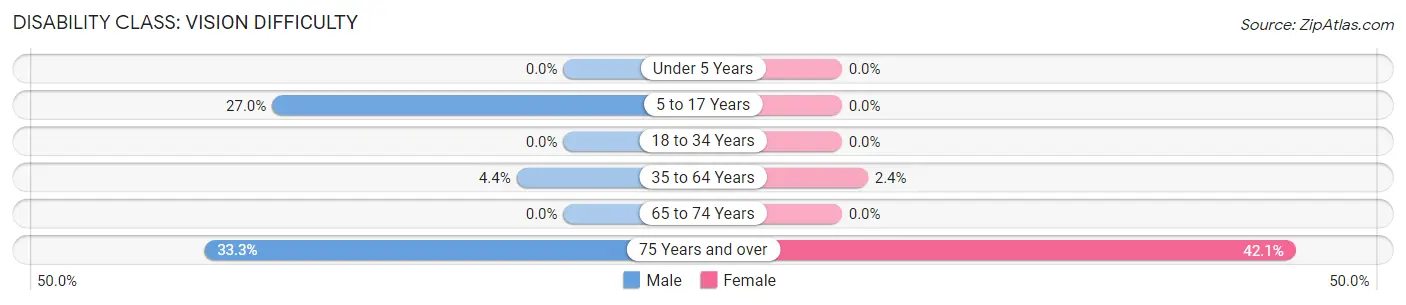
| Age Bracket | Male | Female |
| Under 5 Years | 0 (0.0%) | 0 (0.0%) |
| 5 to 17 Years | 10 (27.0%) | 0 (0.0%) |
| 18 to 34 Years | 0 (0.0%) | 0 (0.0%) |
| 35 to 64 Years | 4 (4.3%) | 2 (2.4%) |
| 65 to 74 Years | 0 (0.0%) | 0 (0.0%) |
| 75 Years and over | 3 (33.3%) | 8 (42.1%) |
Disability Class: Cognitive Difficulty
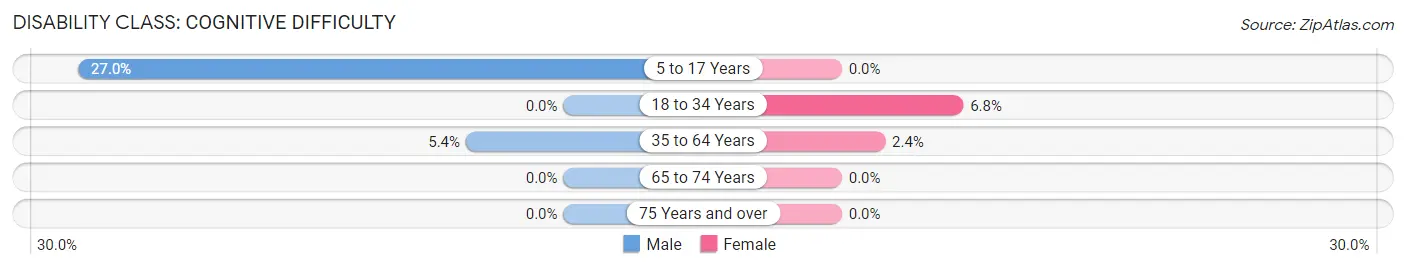
| Age Bracket | Male | Female |
| 5 to 17 Years | 10 (27.0%) | 0 (0.0%) |
| 18 to 34 Years | 0 (0.0%) | 5 (6.8%) |
| 35 to 64 Years | 5 (5.4%) | 2 (2.4%) |
| 65 to 74 Years | 0 (0.0%) | 0 (0.0%) |
| 75 Years and over | 0 (0.0%) | 0 (0.0%) |
Disability Class: Ambulatory Difficulty
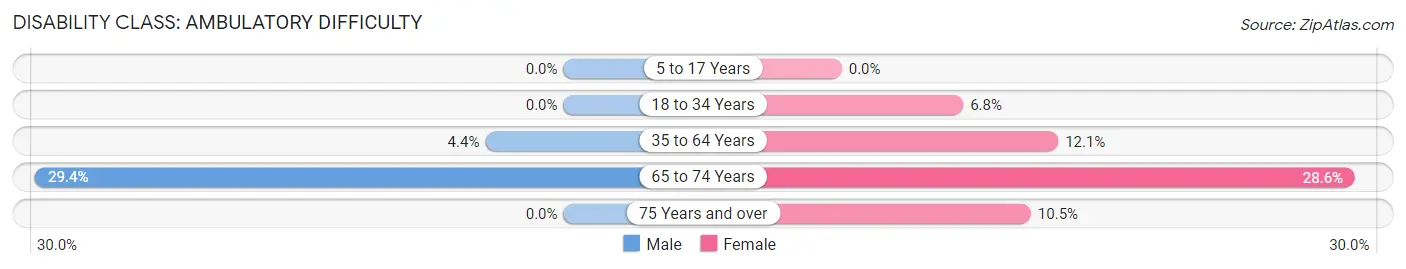
| Age Bracket | Male | Female |
| 5 to 17 Years | 0 (0.0%) | 0 (0.0%) |
| 18 to 34 Years | 0 (0.0%) | 5 (6.8%) |
| 35 to 64 Years | 4 (4.3%) | 10 (12.0%) |
| 65 to 74 Years | 5 (29.4%) | 4 (28.6%) |
| 75 Years and over | 0 (0.0%) | 2 (10.5%) |
Disability Class: Self-Care Difficulty
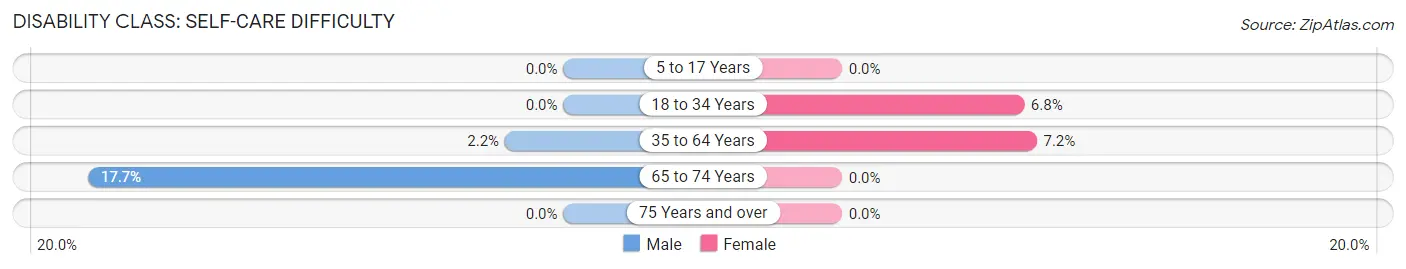
| Age Bracket | Male | Female |
| 5 to 17 Years | 0 (0.0%) | 0 (0.0%) |
| 18 to 34 Years | 0 (0.0%) | 5 (6.8%) |
| 35 to 64 Years | 2 (2.2%) | 6 (7.2%) |
| 65 to 74 Years | 3 (17.6%) | 0 (0.0%) |
| 75 Years and over | 0 (0.0%) | 0 (0.0%) |
Technology Access in Grand Tower
Computing Device Access in Grand Tower
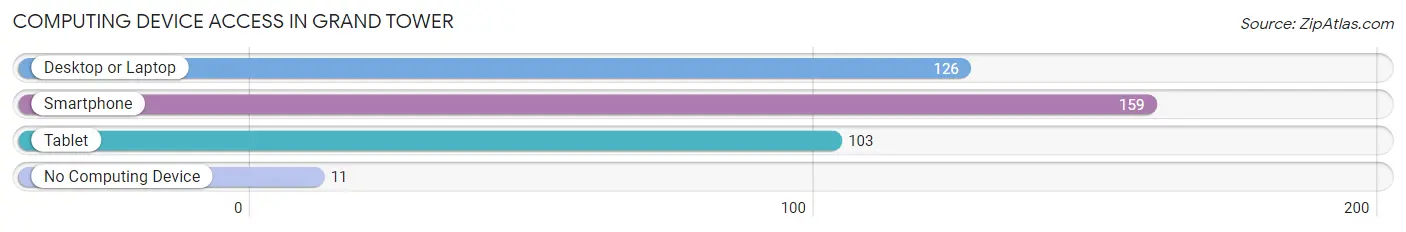
| Device Type | # Households | % Households |
| Desktop or Laptop | 126 | 66.3% |
| Smartphone | 159 | 83.7% |
| Tablet | 103 | 54.2% |
| No Computing Device | 11 | 5.8% |
| Total | 190 | 100.0% |
Internet Access in Grand Tower
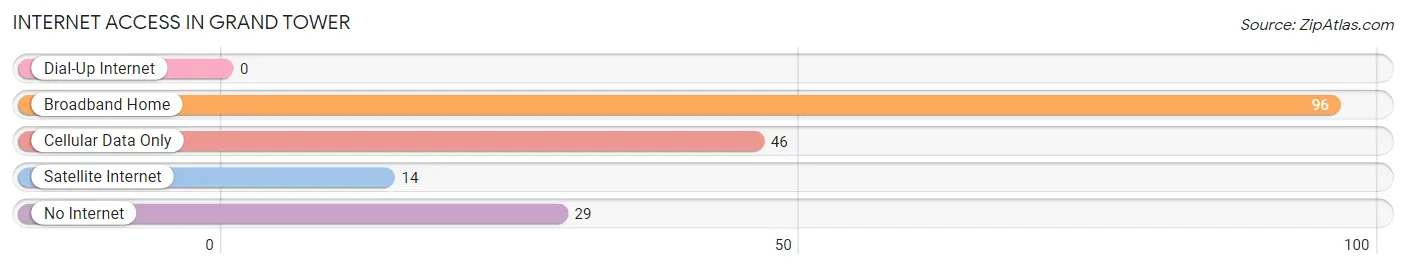
| Internet Type | # Households | % Households |
| Dial-Up Internet | 0 | 0.0% |
| Broadband Home | 96 | 50.5% |
| Cellular Data Only | 46 | 24.2% |
| Satellite Internet | 14 | 7.4% |
| No Internet | 29 | 15.3% |
| Total | 190 | 100.0% |
Grand Tower Summary
Tower, Illinois is a small city located in Jackson County, Illinois, United States. The city is situated on the banks of the Mississippi River, and is part of the Metro East region of the St. Louis metropolitan area. The city has a population of approximately 2,500 people, and is the county seat of Jackson County.
History
The area that is now known as Grand Tower was first settled in the early 1800s by French and German immigrants. The first settlers were attracted to the area due to its proximity to the Mississippi River, which provided a means of transportation and trade. The first permanent settlement was established in 1818, and the town was officially incorporated in 1837.
The city was named after the nearby Grand Tower, a limestone bluff that rises over 200 feet above the Mississippi River. The bluff was used as a lookout point by Native Americans, and was also used by the French and Spanish during the colonial period.
The city was an important port during the 19th century, and was a major hub for the steamboat trade. The city was also a major center for the lumber industry, and was home to several sawmills and lumberyards.
Geography
Grand Tower is located in Jackson County, Illinois, on the banks of the Mississippi River. The city is situated at the intersection of Interstate 57 and U.S. Route 51. The city is located approximately 30 miles south of St. Louis, Missouri, and is part of the Metro East region of the St. Louis metropolitan area.
The city has a total area of 1.2 square miles, all of which is land. The city is located in a hilly region, and is surrounded by wooded areas. The city is located in a humid subtropical climate zone, and experiences hot, humid summers and cold, wet winters.
Economy
The economy of Grand Tower is largely based on tourism and agriculture. The city is home to several tourist attractions, including the Grand Tower National Wildlife Refuge, the Grand Tower State Park, and the Grand Tower Marina. The city is also home to several wineries, and is a popular destination for wine tasting.
Agriculture is also an important part of the local economy. The city is home to several farms, and is a major producer of corn, soybeans, and wheat.
Demographics
As of the 2010 census, the population of Grand Tower was 2,500. The racial makeup of the city was 97.2% White, 0.8% African American, 0.4% Native American, 0.4% Asian, and 0.2% from other races. Hispanic or Latino of any race were 1.2% of the population.
The median household income in Grand Tower was $37,500, and the median family income was $45,000. The per capita income for the city was $18,000. About 11.2% of families and 14.2% of the population were below the poverty line, including 18.2% of those under age 18 and 8.2% of those age 65 or over.
Common Questions
What is Per Capita Income in Grand Tower?
Per Capita income in Grand Tower is $24,387.
What is the Median Family Income in Grand Tower?
Median Family Income in Grand Tower is $61,563.
What is the Median Household income in Grand Tower?
Median Household Income in Grand Tower is $56,944.
What is Inequality or Gini Index in Grand Tower?
Inequality or Gini Index in Grand Tower is 0.37.
What is the Total Population of Grand Tower?
Total Population of Grand Tower is 505.
What is the Total Male Population of Grand Tower?
Total Male Population of Grand Tower is 263.
What is the Total Female Population of Grand Tower?
Total Female Population of Grand Tower is 242.
What is the Ratio of Males per 100 Females in Grand Tower?
There are 108.68 Males per 100 Females in Grand Tower.
What is the Ratio of Females per 100 Males in Grand Tower?
There are 92.02 Females per 100 Males in Grand Tower.
What is the Median Population Age in Grand Tower?
Median Population Age in Grand Tower is 32.4 Years.
What is the Average Family Size in Grand Tower
Average Family Size in Grand Tower is 3.2 People.
What is the Average Household Size in Grand Tower
Average Household Size in Grand Tower is 2.7 People.
How Large is the Labor Force in Grand Tower?
There are 251 People in the Labor Forcein in Grand Tower.
What is the Percentage of People in the Labor Force in Grand Tower?
66.2% of People are in the Labor Force in Grand Tower.
What is the Unemployment Rate in Grand Tower?
Unemployment Rate in Grand Tower is 9.2%.