Godfrey, IL Map & Demographics
Godfrey Map
Godfrey Overview
$44,278
PER CAPITA INCOME
$103,083
AVG FAMILY INCOME
$84,920
AVG HOUSEHOLD INCOME
24.0%
WAGE / INCOME GAP [ % ]
76.0¢/ $1
WAGE / INCOME GAP [ $ ]
$8,562
FAMILY INCOME DEFICIT
0.39
INEQUALITY / GINI INDEX
17,791
TOTAL POPULATION
8,735
MALE POPULATION
9,056
FEMALE POPULATION
96.46
MALES / 100 FEMALES
103.67
FEMALES / 100 MALES
50.5
MEDIAN AGE
2.8
AVG FAMILY SIZE
2.3
AVG HOUSEHOLD SIZE
9,482
LABOR FORCE [ PEOPLE ]
62.4%
PERCENT IN LABOR FORCE
3.7%
UNEMPLOYMENT RATE
Godfrey Zip Codes
Godfrey Area Codes
Income in Godfrey
Income Overview in Godfrey
Per Capita Income in Godfrey is $44,278, while median incomes of families and households are $103,083 and $84,920 respectively.
| Characteristic | Number | Measure |
| Per Capita Income | 17,791 | $44,278 |
| Median Family Income | 5,149 | $103,083 |
| Mean Family Income | 5,149 | $119,983 |
| Median Household Income | 7,536 | $84,920 |
| Mean Household Income | 7,536 | $103,530 |
| Income Deficit | 5,149 | $8,562 |
| Wage / Income Gap (%) | 17,791 | 24.03% |
| Wage / Income Gap ($) | 17,791 | 75.97¢ per $1 |
| Gini / Inequality Index | 17,791 | 0.39 |
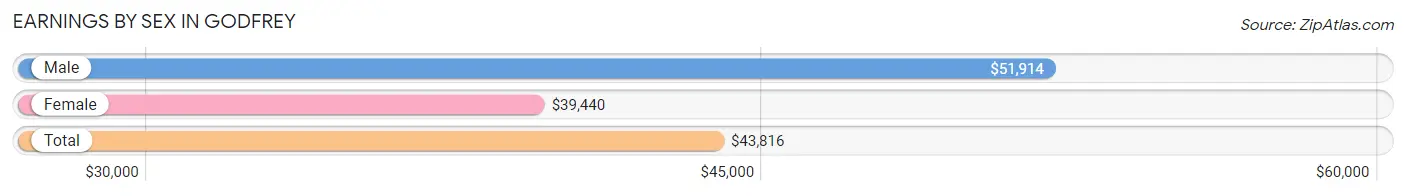
Earnings by Sex in Godfrey
Average Earnings in Godfrey are $43,816, $51,914 for men and $39,440 for women, a difference of 24.0%.
| Sex | Number | Average Earnings |
| Male | 5,095 (51.5%) | $51,914 |
| Female | 4,806 (48.5%) | $39,440 |
| Total | 9,901 (100.0%) | $43,816 |
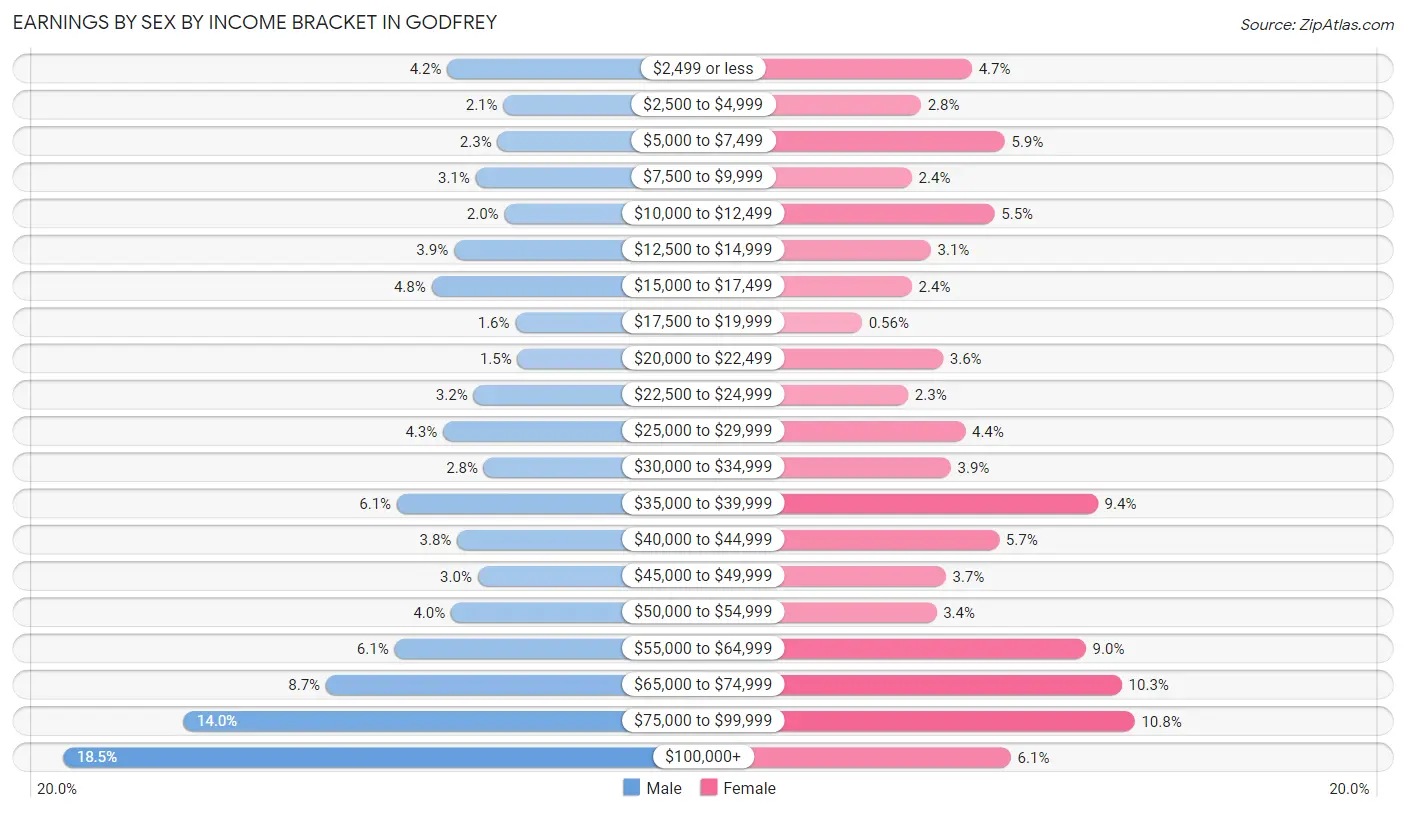
Earnings by Sex by Income Bracket in Godfrey
The most common earnings brackets in Godfrey are $100,000+ for men (944 | 18.5%) and $75,000 to $99,999 for women (518 | 10.8%).
| Income | Male | Female |
| $2,499 or less | 212 (4.2%) | 225 (4.7%) |
| $2,500 to $4,999 | 105 (2.1%) | 133 (2.8%) |
| $5,000 to $7,499 | 116 (2.3%) | 284 (5.9%) |
| $7,500 to $9,999 | 158 (3.1%) | 117 (2.4%) |
| $10,000 to $12,499 | 103 (2.0%) | 266 (5.5%) |
| $12,500 to $14,999 | 199 (3.9%) | 151 (3.1%) |
| $15,000 to $17,499 | 242 (4.8%) | 117 (2.4%) |
| $17,500 to $19,999 | 82 (1.6%) | 27 (0.6%) |
| $20,000 to $22,499 | 78 (1.5%) | 173 (3.6%) |
| $22,500 to $24,999 | 162 (3.2%) | 110 (2.3%) |
| $25,000 to $29,999 | 220 (4.3%) | 213 (4.4%) |
| $30,000 to $34,999 | 142 (2.8%) | 187 (3.9%) |
| $35,000 to $39,999 | 308 (6.0%) | 452 (9.4%) |
| $40,000 to $44,999 | 193 (3.8%) | 274 (5.7%) |
| $45,000 to $49,999 | 154 (3.0%) | 178 (3.7%) |
| $50,000 to $54,999 | 205 (4.0%) | 161 (3.4%) |
| $55,000 to $64,999 | 313 (6.1%) | 430 (8.9%) |
| $65,000 to $74,999 | 444 (8.7%) | 495 (10.3%) |
| $75,000 to $99,999 | 715 (14.0%) | 518 (10.8%) |
| $100,000+ | 944 (18.5%) | 295 (6.1%) |
| Total | 5,095 (100.0%) | 4,806 (100.0%) |
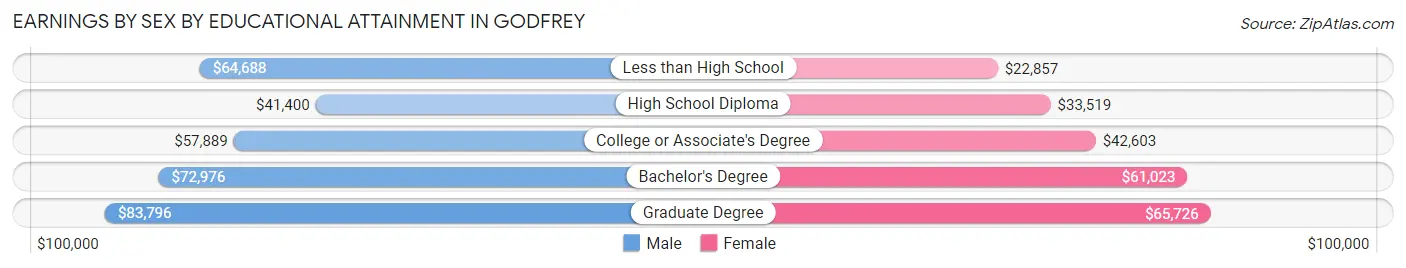
Earnings by Sex by Educational Attainment in Godfrey
Average earnings in Godfrey are $63,750 for men and $43,239 for women, a difference of 32.2%. Men with an educational attainment of graduate degree enjoy the highest average annual earnings of $83,796, while those with high school diploma education earn the least with $41,400. Women with an educational attainment of graduate degree earn the most with the average annual earnings of $65,726, while those with less than high school education have the smallest earnings of $22,857.
| Educational Attainment | Male Income | Female Income |
| Less than High School | $64,688 | $22,857 |
| High School Diploma | $41,400 | $33,519 |
| College or Associate's Degree | $57,889 | $42,603 |
| Bachelor's Degree | $72,976 | $61,023 |
| Graduate Degree | $83,796 | $65,726 |
| Total | $63,750 | $43,239 |
Family Income in Godfrey
Family Income Brackets in Godfrey
According to the Godfrey family income data, there are 1,519 families falling into the $100,000 to $149,999 income range, which is the most common income bracket and makes up 29.5% of all families. Conversely, the $10,000 to $14,999 income bracket is the least frequent group with only 51 families (1.0%) belonging to this category.
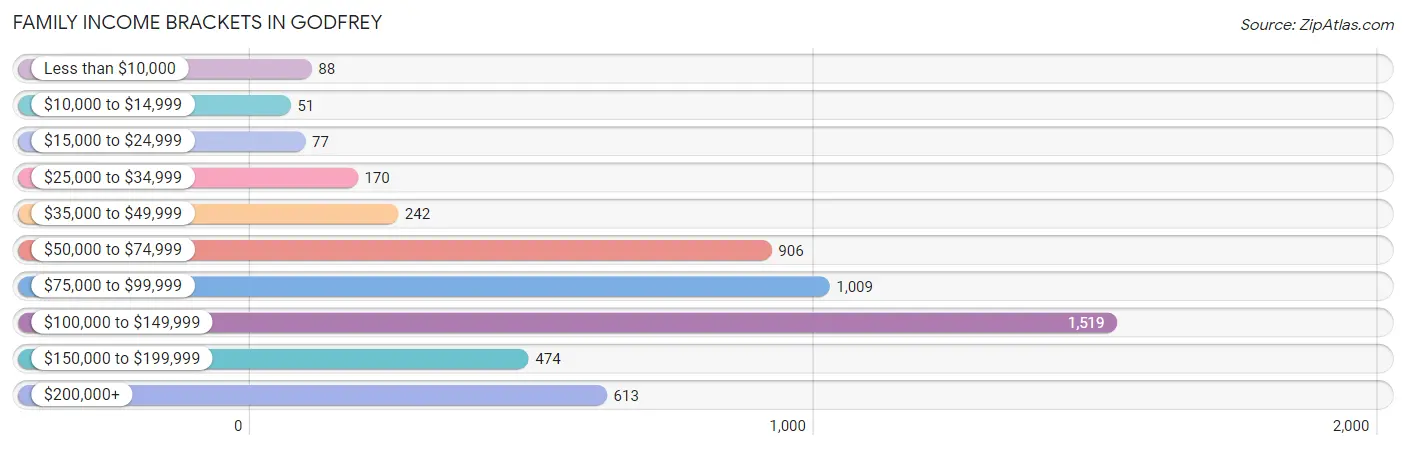
| Income Bracket | # Families | % Families |
| Less than $10,000 | 88 | 1.7% |
| $10,000 to $14,999 | 51 | 1.0% |
| $15,000 to $24,999 | 77 | 1.5% |
| $25,000 to $34,999 | 170 | 3.3% |
| $35,000 to $49,999 | 242 | 4.7% |
| $50,000 to $74,999 | 906 | 17.6% |
| $75,000 to $99,999 | 1,009 | 19.6% |
| $100,000 to $149,999 | 1,519 | 29.5% |
| $150,000 to $199,999 | 474 | 9.2% |
| $200,000+ | 613 | 11.9% |
Family Income by Famaliy Size in Godfrey
6-person families (94 | 1.8%) account for the highest median family income in Godfrey with $220,102 per family, while 2-person families (2,860 | 55.5%) have the highest median income of $47,568 per family member.
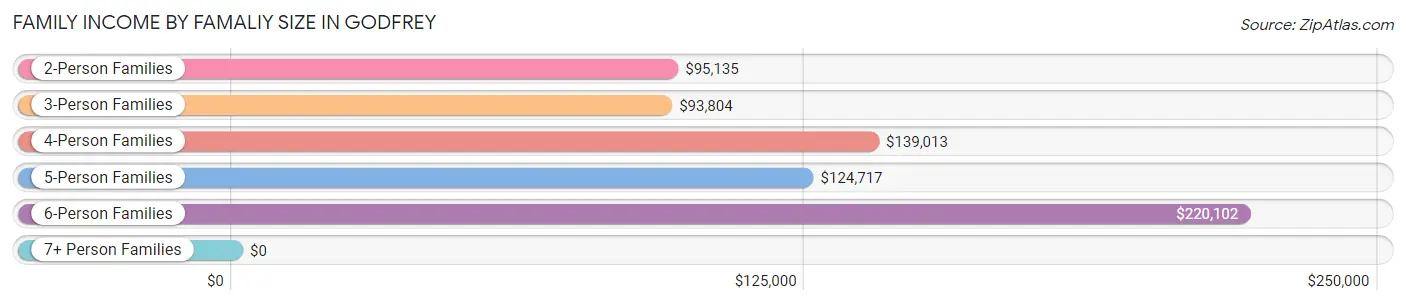
| Income Bracket | # Families | Median Income |
| 2-Person Families | 2,860 (55.5%) | $95,135 |
| 3-Person Families | 1,072 (20.8%) | $93,804 |
| 4-Person Families | 811 (15.8%) | $139,013 |
| 5-Person Families | 300 (5.8%) | $124,717 |
| 6-Person Families | 94 (1.8%) | $220,102 |
| 7+ Person Families | 12 (0.2%) | $0 |
| Total | 5,149 (100.0%) | $103,083 |
Family Income by Number of Earners in Godfrey
The median family income in Godfrey is $103,083, with families comprising 3+ earners (646) having the highest median family income of $189,615, while families with no earners (925) have the lowest median family income of $72,356, accounting for 12.6% and 18.0% of families, respectively.
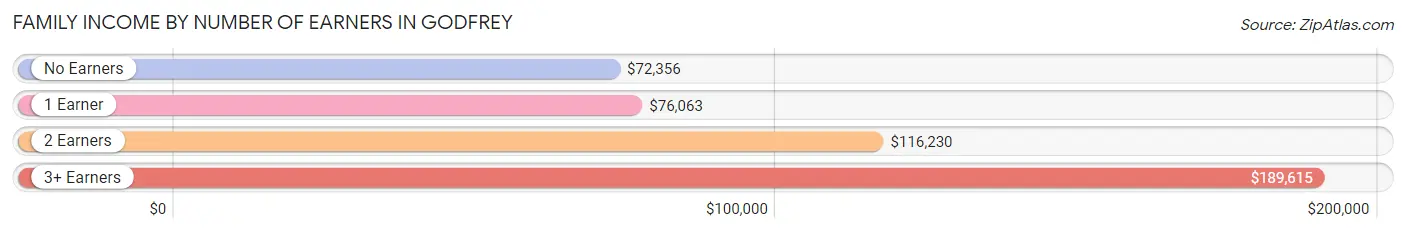
| Number of Earners | # Families | Median Income |
| No Earners | 925 (18.0%) | $72,356 |
| 1 Earner | 1,321 (25.7%) | $76,063 |
| 2 Earners | 2,257 (43.8%) | $116,230 |
| 3+ Earners | 646 (12.6%) | $189,615 |
| Total | 5,149 (100.0%) | $103,083 |
Household Income in Godfrey
Household Income Brackets in Godfrey
With 1,786 households falling in the category, the $100,000 to $149,999 income range is the most frequent in Godfrey, accounting for 23.7% of all households. In contrast, only 128 households (1.7%) fall into the $10,000 to $14,999 income bracket, making it the least populous group.
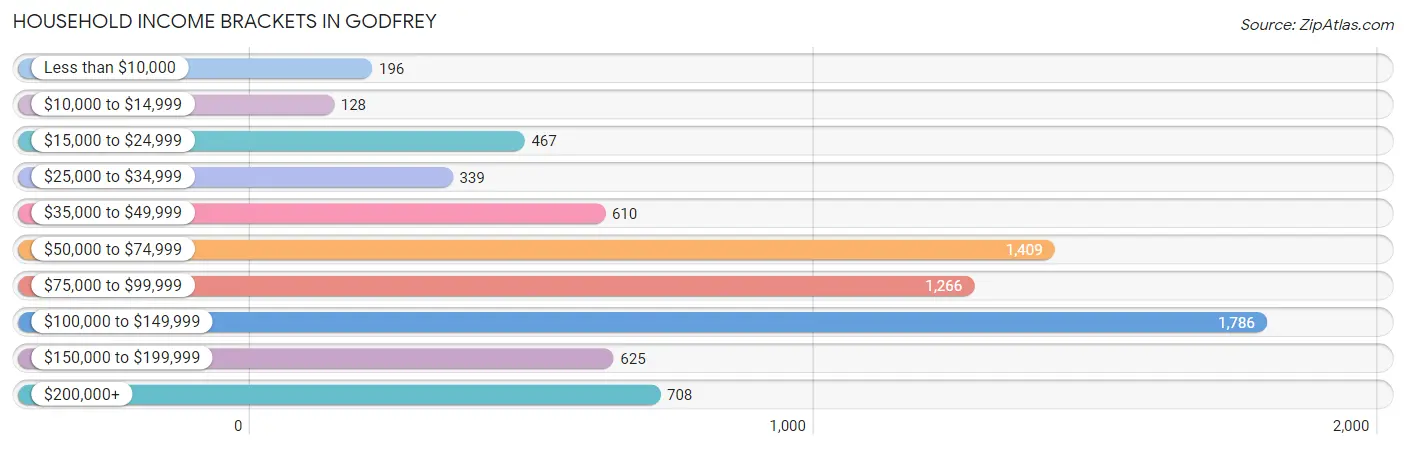
| Income Bracket | # Households | % Households |
| Less than $10,000 | 196 | 2.6% |
| $10,000 to $14,999 | 128 | 1.7% |
| $15,000 to $24,999 | 467 | 6.2% |
| $25,000 to $34,999 | 339 | 4.5% |
| $35,000 to $49,999 | 610 | 8.1% |
| $50,000 to $74,999 | 1,409 | 18.7% |
| $75,000 to $99,999 | 1,266 | 16.8% |
| $100,000 to $149,999 | 1,786 | 23.7% |
| $150,000 to $199,999 | 625 | 8.3% |
| $200,000+ | 708 | 9.4% |
Household Income by Householder Age in Godfrey
The median household income in Godfrey is $84,920, with the highest median household income of $119,074 found in the 45 to 64 years age bracket for the primary householder. A total of 2,878 households (38.2%) fall into this category. Meanwhile, the 65+ years age bracket for the primary householder has the lowest median household income of $63,140, with 2,937 households (39.0%) in this group.
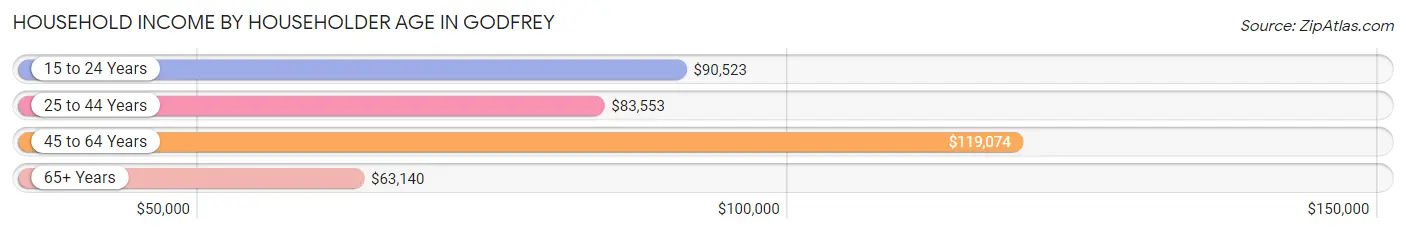
| Income Bracket | # Households | Median Income |
| 15 to 24 Years | 87 (1.1%) | $90,523 |
| 25 to 44 Years | 1,634 (21.7%) | $83,553 |
| 45 to 64 Years | 2,878 (38.2%) | $119,074 |
| 65+ Years | 2,937 (39.0%) | $63,140 |
| Total | 7,536 (100.0%) | $84,920 |
Poverty in Godfrey
Income Below Poverty by Sex and Age in Godfrey
With 7.1% poverty level for males and 6.2% for females among the residents of Godfrey, 6 to 11 year old males and 15 year old females are the most vulnerable to poverty, with 134 males (23.8%) and 14 females (14.0%) in their respective age groups living below the poverty level.
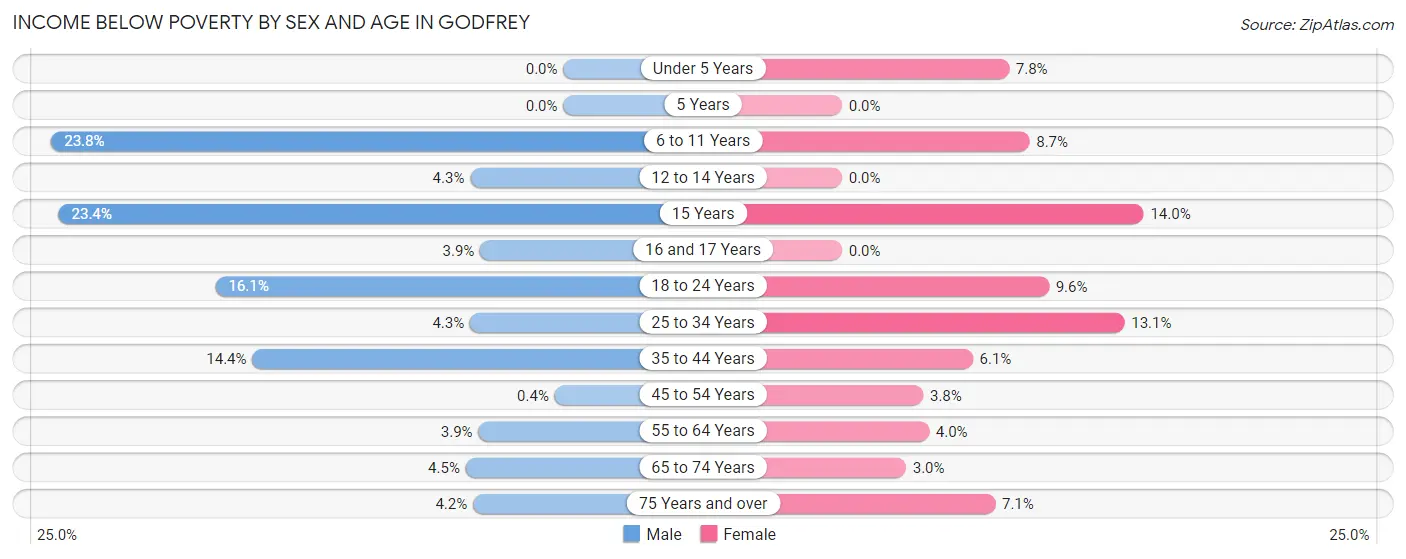
| Age Bracket | Male | Female |
| Under 5 Years | 0 (0.0%) | 21 (7.7%) |
| 5 Years | 0 (0.0%) | 0 (0.0%) |
| 6 to 11 Years | 134 (23.8%) | 48 (8.7%) |
| 12 to 14 Years | 6 (4.3%) | 0 (0.0%) |
| 15 Years | 26 (23.4%) | 14 (14.0%) |
| 16 and 17 Years | 9 (3.9%) | 0 (0.0%) |
| 18 to 24 Years | 138 (16.1%) | 41 (9.6%) |
| 25 to 34 Years | 36 (4.3%) | 152 (13.1%) |
| 35 to 44 Years | 116 (14.4%) | 42 (6.1%) |
| 45 to 54 Years | 4 (0.4%) | 45 (3.8%) |
| 55 to 64 Years | 57 (3.9%) | 66 (4.0%) |
| 65 to 74 Years | 58 (4.5%) | 38 (3.0%) |
| 75 Years and over | 35 (4.2%) | 95 (7.1%) |
| Total | 619 (7.1%) | 562 (6.2%) |
Income Above Poverty by Sex and Age in Godfrey
According to the poverty statistics in Godfrey, males aged under 5 years and females aged 5 years are the age groups that are most secure financially, with 100.0% of males and 100.0% of females in these age groups living above the poverty line.
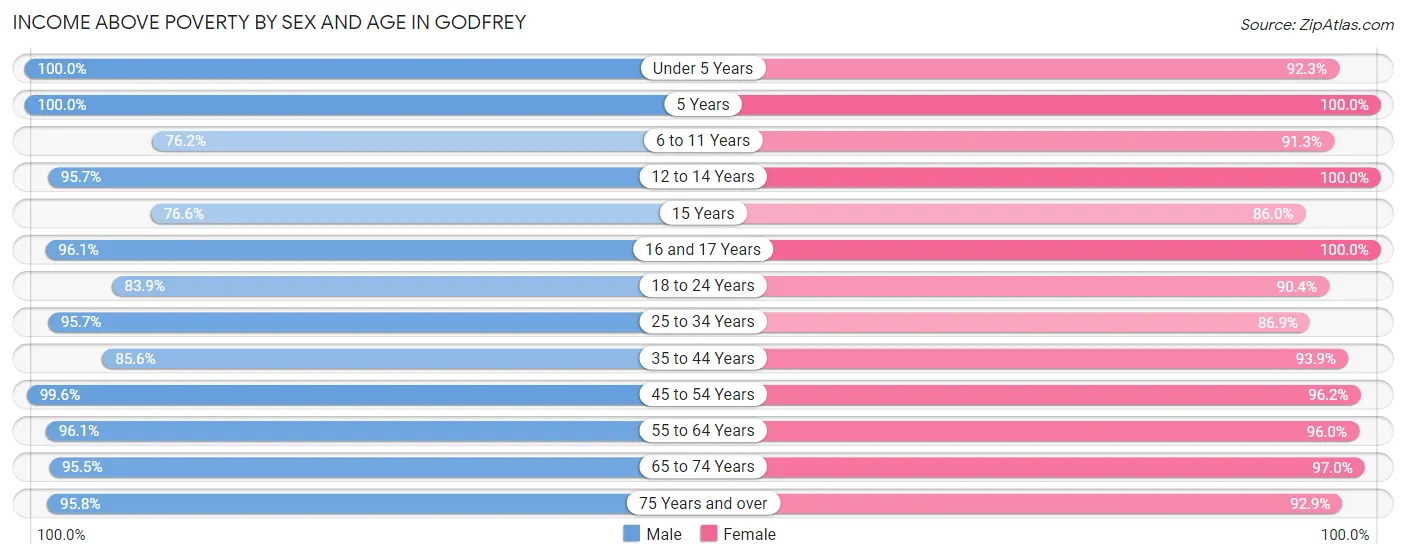
| Age Bracket | Male | Female |
| Under 5 Years | 516 (100.0%) | 250 (92.2%) |
| 5 Years | 75 (100.0%) | 46 (100.0%) |
| 6 to 11 Years | 430 (76.2%) | 504 (91.3%) |
| 12 to 14 Years | 133 (95.7%) | 207 (100.0%) |
| 15 Years | 85 (76.6%) | 86 (86.0%) |
| 16 and 17 Years | 224 (96.1%) | 113 (100.0%) |
| 18 to 24 Years | 717 (83.9%) | 386 (90.4%) |
| 25 to 34 Years | 795 (95.7%) | 1,007 (86.9%) |
| 35 to 44 Years | 688 (85.6%) | 650 (93.9%) |
| 45 to 54 Years | 1,000 (99.6%) | 1,150 (96.2%) |
| 55 to 64 Years | 1,388 (96.1%) | 1,566 (96.0%) |
| 65 to 74 Years | 1,222 (95.5%) | 1,243 (97.0%) |
| 75 Years and over | 801 (95.8%) | 1,241 (92.9%) |
| Total | 8,074 (92.9%) | 8,449 (93.8%) |
Income Below Poverty Among Married-Couple Families in Godfrey
The poverty statistics for married-couple families in Godfrey show that 1.7% or 71 of the total 4,205 families live below the poverty line. Families with 1 or 2 children have the highest poverty rate of 4.3%, comprising of 47 families. On the other hand, families with 3 or 4 children have the lowest poverty rate of 0.0%, which includes 0 families.
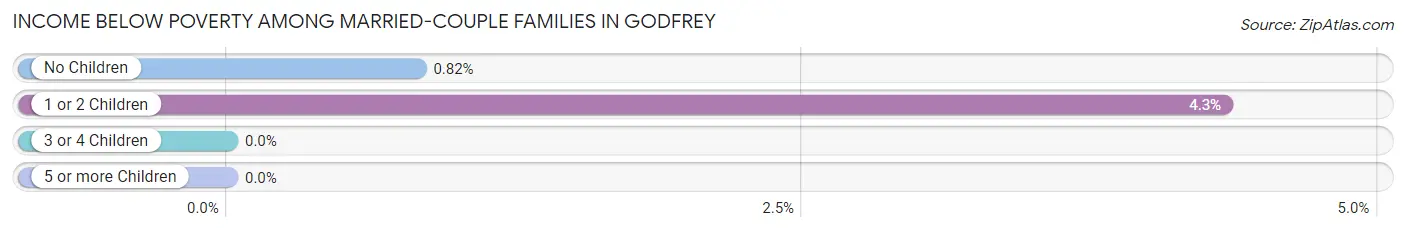
| Children | Above Poverty | Below Poverty |
| No Children | 2,899 (99.2%) | 24 (0.8%) |
| 1 or 2 Children | 1,039 (95.7%) | 47 (4.3%) |
| 3 or 4 Children | 184 (100.0%) | 0 (0.0%) |
| 5 or more Children | 12 (100.0%) | 0 (0.0%) |
| Total | 4,134 (98.3%) | 71 (1.7%) |
Income Below Poverty Among Single-Parent Households in Godfrey
According to the poverty data in Godfrey, 37.7% or 95 single-father households and 6.8% or 47 single-mother households are living below the poverty line. Among single-father households, those with 1 or 2 children have the highest poverty rate, with 64 households (54.2%) experiencing poverty. Likewise, among single-mother households, those with 1 or 2 children have the highest poverty rate, with 47 households (19.8%) falling below the poverty line.
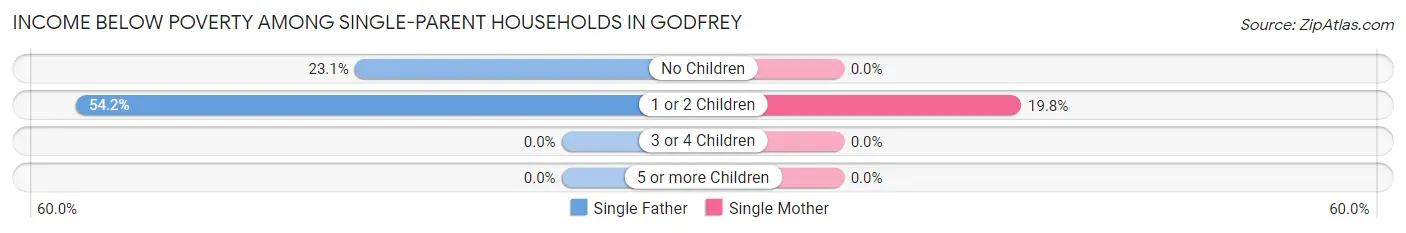
| Children | Single Father | Single Mother |
| No Children | 31 (23.1%) | 0 (0.0%) |
| 1 or 2 Children | 64 (54.2%) | 47 (19.8%) |
| 3 or 4 Children | 0 (0.0%) | 0 (0.0%) |
| 5 or more Children | 0 (0.0%) | 0 (0.0%) |
| Total | 95 (37.7%) | 47 (6.8%) |
Income Below Poverty Among Married-Couple vs Single-Parent Households in Godfrey
The poverty data for Godfrey shows that 71 of the married-couple family households (1.7%) and 142 of the single-parent households (15.0%) are living below the poverty level. Within the married-couple family households, those with 1 or 2 children have the highest poverty rate, with 47 households (4.3%) falling below the poverty line. Among the single-parent households, those with 1 or 2 children have the highest poverty rate, with 111 household (31.3%) living below poverty.
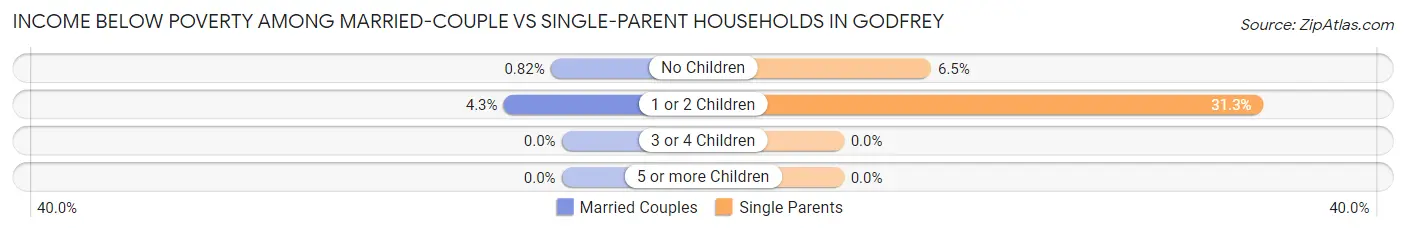
| Children | Married-Couple Families | Single-Parent Households |
| No Children | 24 (0.8%) | 31 (6.5%) |
| 1 or 2 Children | 47 (4.3%) | 111 (31.3%) |
| 3 or 4 Children | 0 (0.0%) | 0 (0.0%) |
| 5 or more Children | 0 (0.0%) | 0 (0.0%) |
| Total | 71 (1.7%) | 142 (15.0%) |
Race in Godfrey
The most populous races in Godfrey are White / Caucasian (16,037 | 90.1%), Two or more Races (919 | 5.2%), and Black / African American (791 | 4.4%).
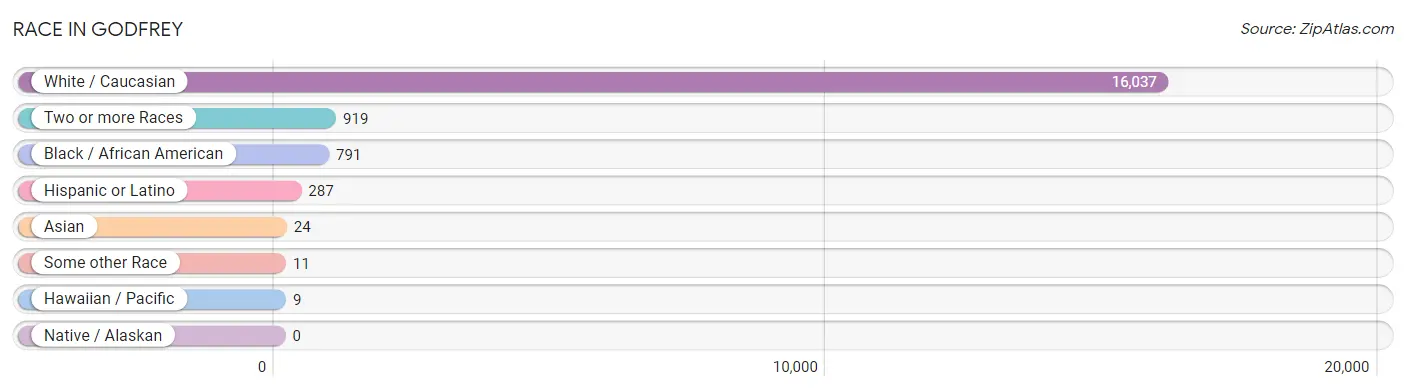
| Race | # Population | % Population |
| Asian | 24 | 0.1% |
| Black / African American | 791 | 4.4% |
| Hawaiian / Pacific | 9 | 0.1% |
| Hispanic or Latino | 287 | 1.6% |
| Native / Alaskan | 0 | 0.0% |
| White / Caucasian | 16,037 | 90.1% |
| Two or more Races | 919 | 5.2% |
| Some other Race | 11 | 0.1% |
| Total | 17,791 | 100.0% |
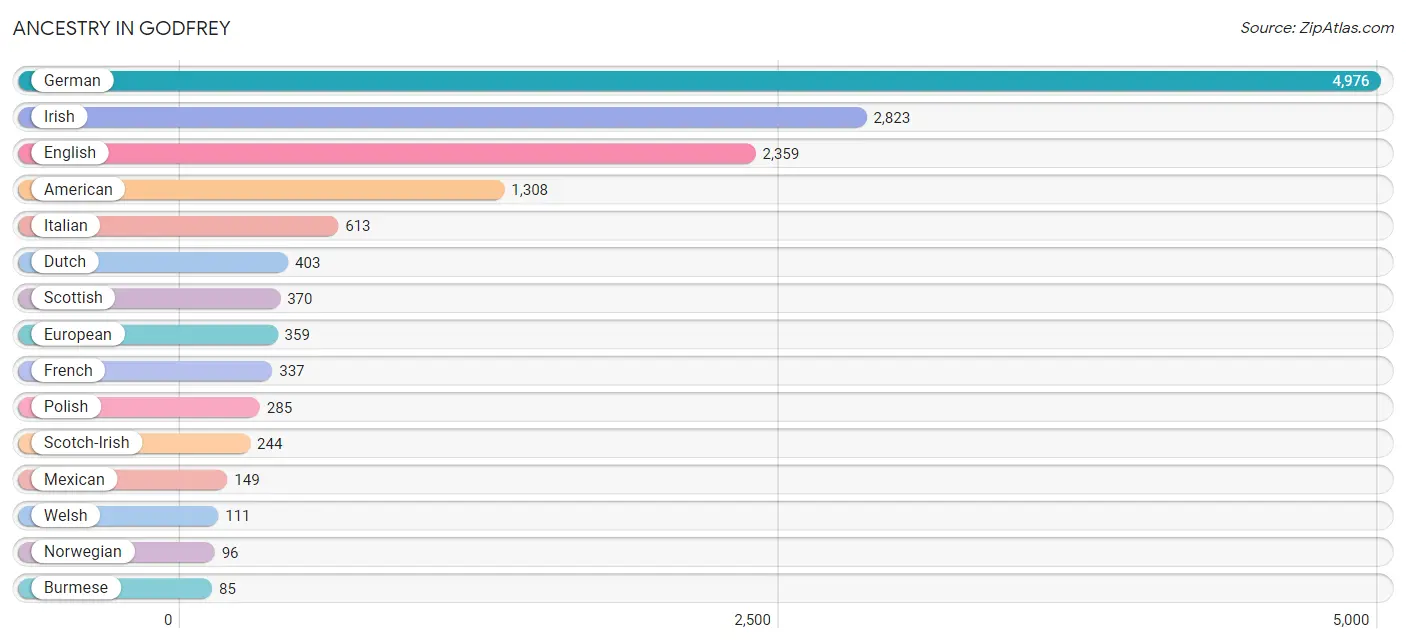
Ancestry in Godfrey
The most populous ancestries reported in Godfrey are German (4,976 | 28.0%), Irish (2,823 | 15.9%), English (2,359 | 13.3%), American (1,308 | 7.3%), and Italian (613 | 3.5%), together accounting for 67.9% of all Godfrey residents.
| Ancestry | # Population | % Population |
| African | 41 | 0.2% |
| American | 1,308 | 7.3% |
| Arab | 46 | 0.3% |
| Australian | 2 | 0.0% |
| Austrian | 8 | 0.0% |
| Bhutanese | 25 | 0.1% |
| British | 80 | 0.4% |
| Burmese | 85 | 0.5% |
| Cherokee | 16 | 0.1% |
| Chilean | 10 | 0.1% |
| Colombian | 46 | 0.3% |
| Croatian | 6 | 0.0% |
| Cuban | 8 | 0.0% |
| Czechoslovakian | 10 | 0.1% |
| Danish | 30 | 0.2% |
| Dutch | 403 | 2.3% |
| Eastern European | 83 | 0.5% |
| English | 2,359 | 13.3% |
| European | 359 | 2.0% |
| French | 337 | 1.9% |
| French Canadian | 54 | 0.3% |
| German | 4,976 | 28.0% |
| Greek | 34 | 0.2% |
| Hungarian | 6 | 0.0% |
| Irish | 2,823 | 15.9% |
| Italian | 613 | 3.5% |
| Jamaican | 10 | 0.1% |
| Jordanian | 46 | 0.3% |
| Korean | 64 | 0.4% |
| Lithuanian | 20 | 0.1% |
| Macedonian | 14 | 0.1% |
| Mexican | 149 | 0.8% |
| Nigerian | 1 | 0.0% |
| Northern European | 23 | 0.1% |
| Norwegian | 96 | 0.5% |
| Peruvian | 29 | 0.2% |
| Polish | 285 | 1.6% |
| Pueblo | 2 | 0.0% |
| Puerto Rican | 45 | 0.3% |
| Samoan | 35 | 0.2% |
| Scandinavian | 34 | 0.2% |
| Scotch-Irish | 244 | 1.4% |
| Scottish | 370 | 2.1% |
| Slavic | 32 | 0.2% |
| South American | 85 | 0.5% |
| Subsaharan African | 42 | 0.2% |
| Swedish | 84 | 0.5% |
| Swiss | 77 | 0.4% |
| Welsh | 111 | 0.6% | View All 49 Rows |
Immigrants in Godfrey
The most numerous immigrant groups reported in Godfrey came from Europe (101 | 0.6%), Northern Europe (52 | 0.3%), England (44 | 0.3%), Latin America (39 | 0.2%), and South America (28 | 0.2%), together accounting for 1.5% of all Godfrey residents.
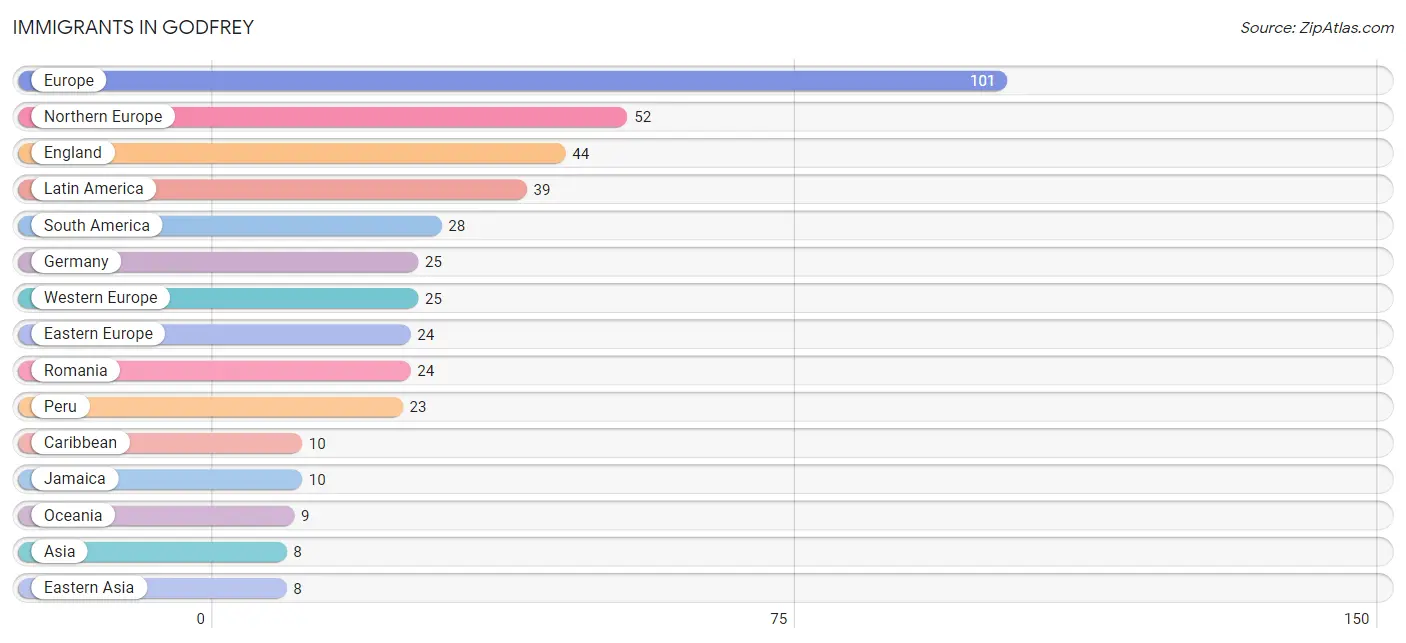
| Immigration Origin | # Population | % Population |
| Africa | 1 | 0.0% |
| Asia | 8 | 0.0% |
| Caribbean | 10 | 0.1% |
| Central America | 1 | 0.0% |
| Chile | 5 | 0.0% |
| Eastern Asia | 8 | 0.0% |
| Eastern Europe | 24 | 0.1% |
| England | 44 | 0.3% |
| Europe | 101 | 0.6% |
| Germany | 25 | 0.1% |
| Jamaica | 10 | 0.1% |
| Japan | 8 | 0.0% |
| Latin America | 39 | 0.2% |
| Mexico | 1 | 0.0% |
| Nigeria | 1 | 0.0% |
| Northern Europe | 52 | 0.3% |
| Oceania | 9 | 0.1% |
| Peru | 23 | 0.1% |
| Romania | 24 | 0.1% |
| South America | 28 | 0.2% |
| Western Africa | 1 | 0.0% |
| Western Europe | 25 | 0.1% | View All 22 Rows |
Sex and Age in Godfrey
Sex and Age in Godfrey
The most populous age groups in Godfrey are 55 to 59 Years (793 | 9.1%) for men and 55 to 59 Years (916 | 10.1%) for women.
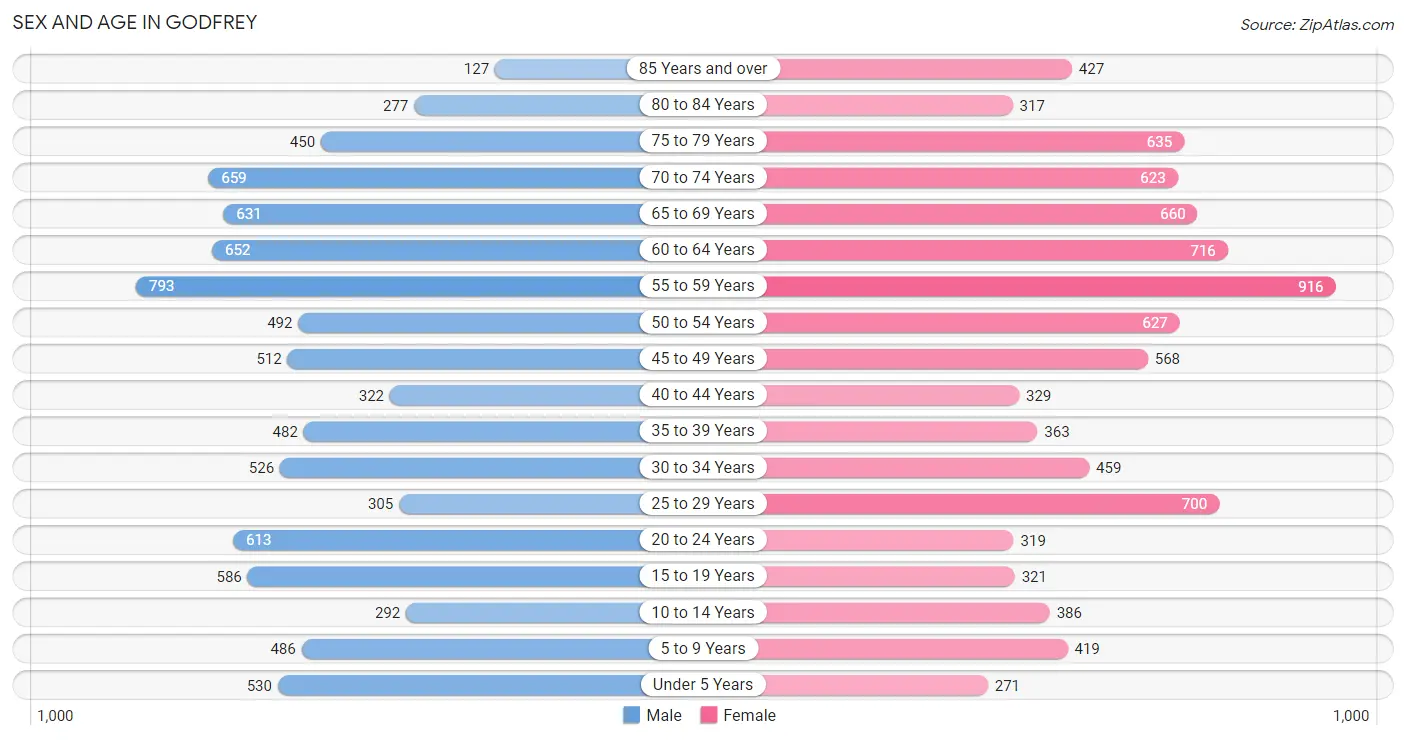
| Age Bracket | Male | Female |
| Under 5 Years | 530 (6.1%) | 271 (3.0%) |
| 5 to 9 Years | 486 (5.6%) | 419 (4.6%) |
| 10 to 14 Years | 292 (3.3%) | 386 (4.3%) |
| 15 to 19 Years | 586 (6.7%) | 321 (3.5%) |
| 20 to 24 Years | 613 (7.0%) | 319 (3.5%) |
| 25 to 29 Years | 305 (3.5%) | 700 (7.7%) |
| 30 to 34 Years | 526 (6.0%) | 459 (5.1%) |
| 35 to 39 Years | 482 (5.5%) | 363 (4.0%) |
| 40 to 44 Years | 322 (3.7%) | 329 (3.6%) |
| 45 to 49 Years | 512 (5.9%) | 568 (6.3%) |
| 50 to 54 Years | 492 (5.6%) | 627 (6.9%) |
| 55 to 59 Years | 793 (9.1%) | 916 (10.1%) |
| 60 to 64 Years | 652 (7.5%) | 716 (7.9%) |
| 65 to 69 Years | 631 (7.2%) | 660 (7.3%) |
| 70 to 74 Years | 659 (7.5%) | 623 (6.9%) |
| 75 to 79 Years | 450 (5.1%) | 635 (7.0%) |
| 80 to 84 Years | 277 (3.2%) | 317 (3.5%) |
| 85 Years and over | 127 (1.5%) | 427 (4.7%) |
| Total | 8,735 (100.0%) | 9,056 (100.0%) |
Families and Households in Godfrey
Median Family Size in Godfrey
The median family size in Godfrey is 2.81 persons per family, with single male/father families (252 | 4.9%) accounting for the largest median family size of 2.82 persons per family. On the other hand, married-couple families (4,205 | 81.7%) represent the smallest median family size with 2.80 persons per family.
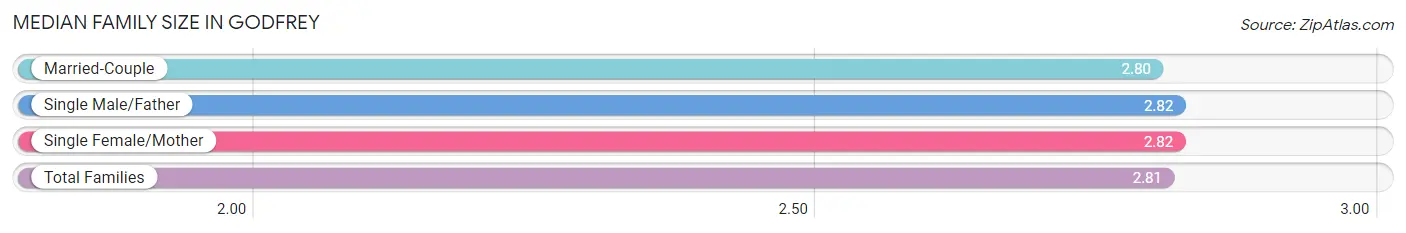
| Family Type | # Families | Family Size |
| Married-Couple | 4,205 (81.7%) | 2.80 |
| Single Male/Father | 252 (4.9%) | 2.82 |
| Single Female/Mother | 692 (13.4%) | 2.82 |
| Total Families | 5,149 (100.0%) | 2.81 |
Median Household Size in Godfrey
The median household size in Godfrey is 2.32 persons per household, with single male/father households (252 | 3.3%) accounting for the largest median household size of 3.13 persons per household. non-family households (2,387 | 31.7%) represent the smallest median household size with 1.16 persons per household.
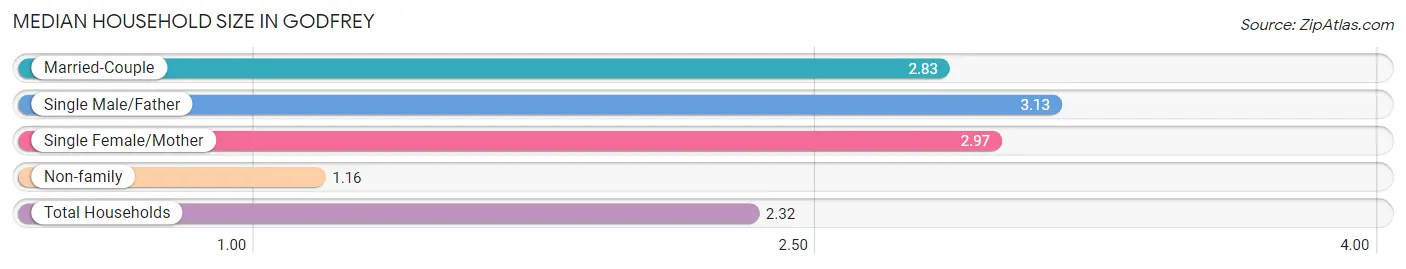
| Household Type | # Households | Household Size |
| Married-Couple | 4,205 (55.8%) | 2.83 |
| Single Male/Father | 252 (3.3%) | 3.13 |
| Single Female/Mother | 692 (9.2%) | 2.97 |
| Non-family | 2,387 (31.7%) | 1.16 |
| Total Households | 7,536 (100.0%) | 2.32 |
Household Size by Marriage Status in Godfrey
Out of a total of 7,536 households in Godfrey, 5,149 (68.3%) are family households, while 2,387 (31.7%) are nonfamily households. The most numerous type of family households are 2-person households, comprising 2,801, and the most common type of nonfamily households are 1-person households, comprising 2,023.
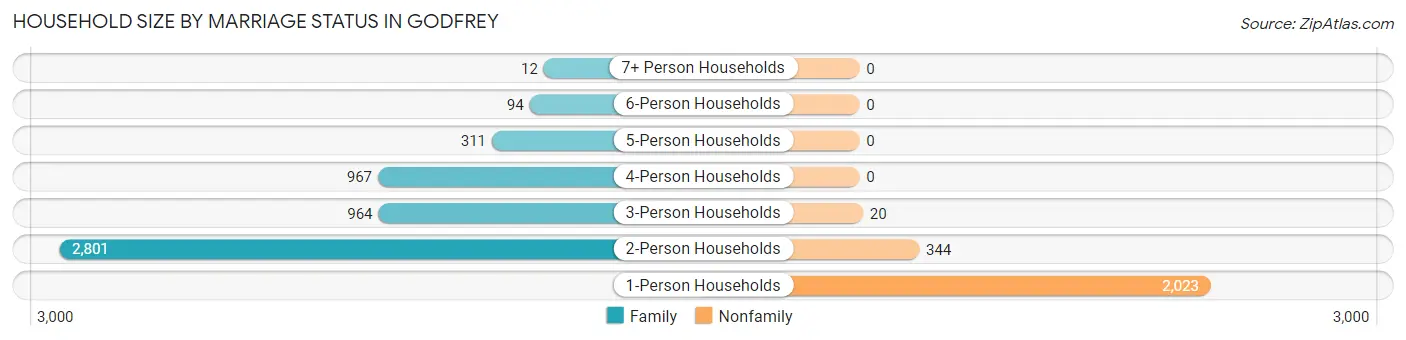
| Household Size | Family Households | Nonfamily Households |
| 1-Person Households | - | 2,023 (26.8%) |
| 2-Person Households | 2,801 (37.2%) | 344 (4.6%) |
| 3-Person Households | 964 (12.8%) | 20 (0.3%) |
| 4-Person Households | 967 (12.8%) | 0 (0.0%) |
| 5-Person Households | 311 (4.1%) | 0 (0.0%) |
| 6-Person Households | 94 (1.3%) | 0 (0.0%) |
| 7+ Person Households | 12 (0.2%) | 0 (0.0%) |
| Total | 5,149 (68.3%) | 2,387 (31.7%) |
Female Fertility in Godfrey
Fertility by Age in Godfrey
Average fertility rate in Godfrey is 57.0 births per 1,000 women. Women in the age bracket of 20 to 34 years have the highest fertility rate with 99.0 births per 1,000 women. Women in the age bracket of 20 to 34 years acount for 80.7% of all women with births.
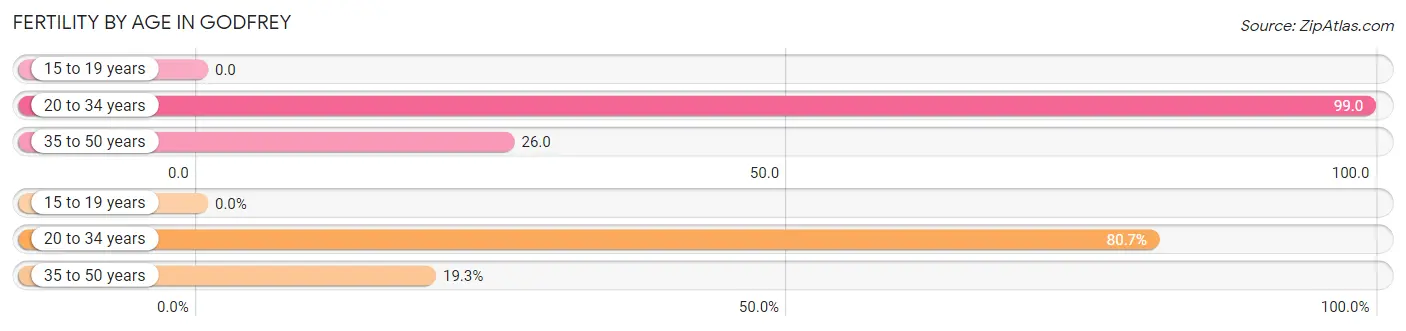
| Age Bracket | Women with Births | Births / 1,000 Women |
| 15 to 19 years | 0 (0.0%) | 0.0 |
| 20 to 34 years | 146 (80.7%) | 99.0 |
| 35 to 50 years | 35 (19.3%) | 26.0 |
| Total | 181 (100.0%) | 57.0 |
Fertility by Age by Marriage Status in Godfrey
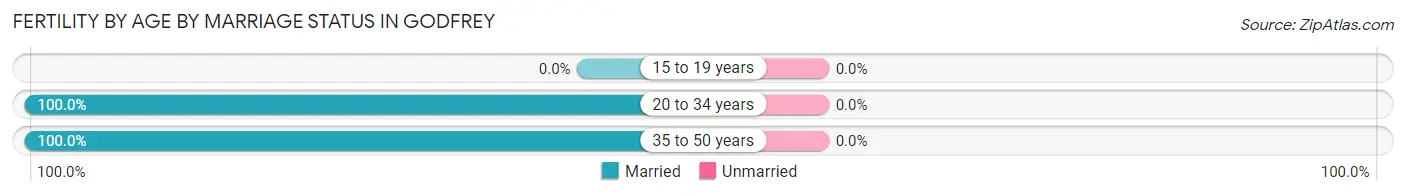
| Age Bracket | Married | Unmarried |
| 15 to 19 years | 0 (0.0%) | 0 (0.0%) |
| 20 to 34 years | 146 (100.0%) | 0 (0.0%) |
| 35 to 50 years | 35 (100.0%) | 0 (0.0%) |
| Total | 181 (100.0%) | 0 (0.0%) |
Fertility by Education in Godfrey
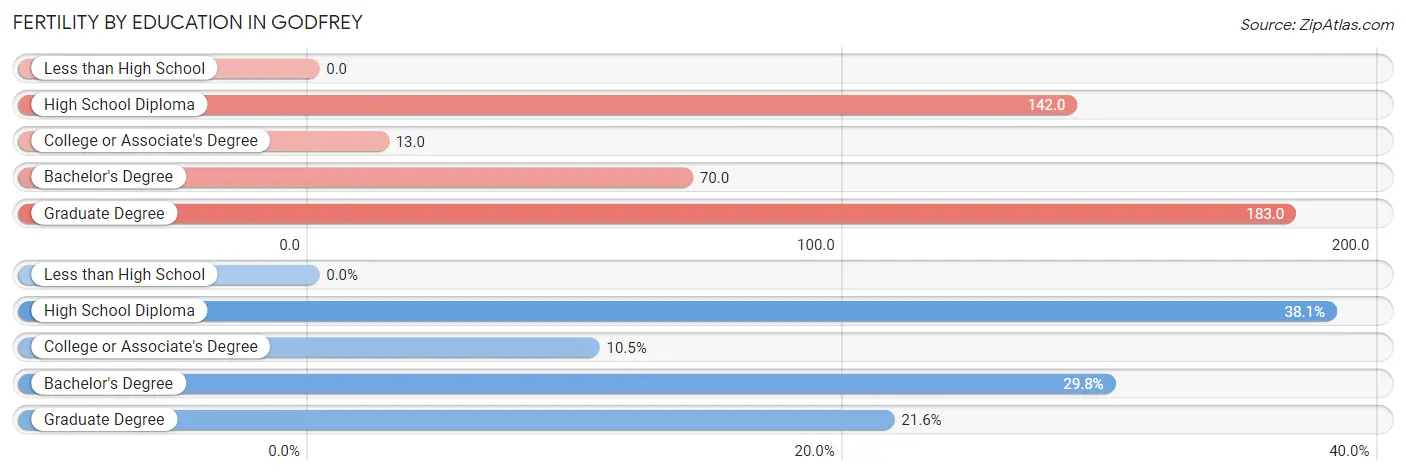
| Educational Attainment | Women with Births | Births / 1,000 Women |
| Less than High School | 0 (0.0%) | 0.0 |
| High School Diploma | 69 (38.1%) | 142.0 |
| College or Associate's Degree | 19 (10.5%) | 13.0 |
| Bachelor's Degree | 54 (29.8%) | 70.0 |
| Graduate Degree | 39 (21.5%) | 183.0 |
| Total | 181 (100.0%) | 57.0 |
Fertility by Education by Marriage Status in Godfrey
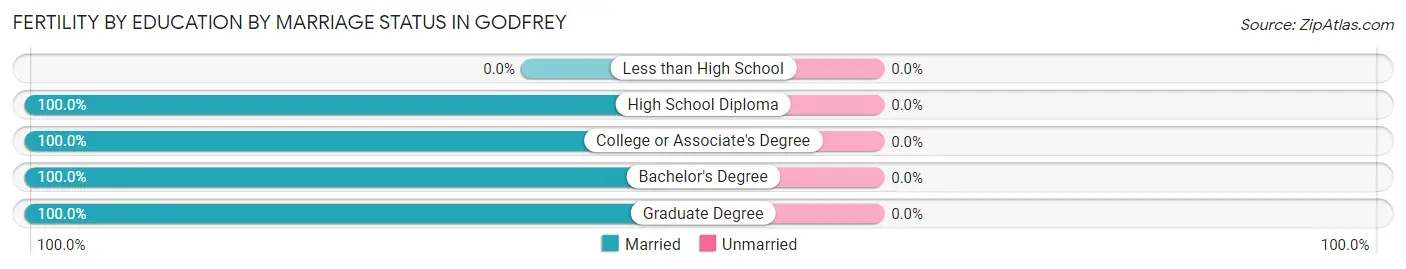
| Educational Attainment | Married | Unmarried |
| Less than High School | 0 (0.0%) | 0 (0.0%) |
| High School Diploma | 69 (100.0%) | 0 (0.0%) |
| College or Associate's Degree | 19 (100.0%) | 0 (0.0%) |
| Bachelor's Degree | 54 (100.0%) | 0 (0.0%) |
| Graduate Degree | 39 (100.0%) | 0 (0.0%) |
| Total | 181 (100.0%) | 0 (0.0%) |
Employment Characteristics in Godfrey
Employment by Class of Employer in Godfrey
Among the 9,000 employed individuals in Godfrey, private company employees (6,480 | 72.0%), not-for-profit organizations (819 | 9.1%), and local government employees (494 | 5.5%) make up the most common classes of employment.
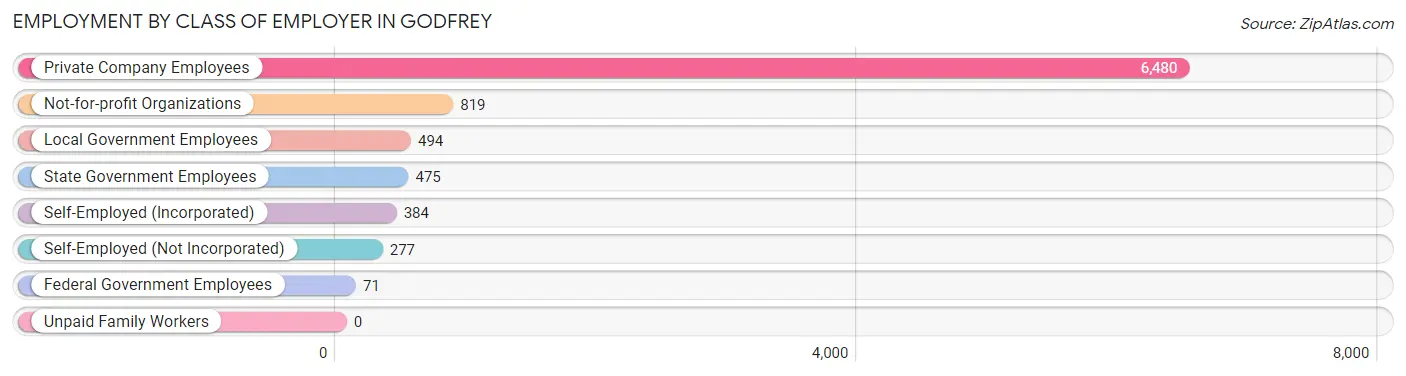
| Employer Class | # Employees | % Employees |
| Private Company Employees | 6,480 | 72.0% |
| Self-Employed (Incorporated) | 384 | 4.3% |
| Self-Employed (Not Incorporated) | 277 | 3.1% |
| Not-for-profit Organizations | 819 | 9.1% |
| Local Government Employees | 494 | 5.5% |
| State Government Employees | 475 | 5.3% |
| Federal Government Employees | 71 | 0.8% |
| Unpaid Family Workers | 0 | 0.0% |
| Total | 9,000 | 100.0% |
Employment Status by Age in Godfrey
According to the labor force statistics for Godfrey, out of the total population over 16 years of age (15,196), 62.4% or 9,482 individuals are in the labor force, with 3.7% or 351 of them unemployed. The age group with the highest labor force participation rate is 30 to 34 years, with 95.3% or 939 individuals in the labor force. Within the labor force, the 20 to 24 years age range has the highest percentage of unemployed individuals, with 16.3% or 110 of them being unemployed.
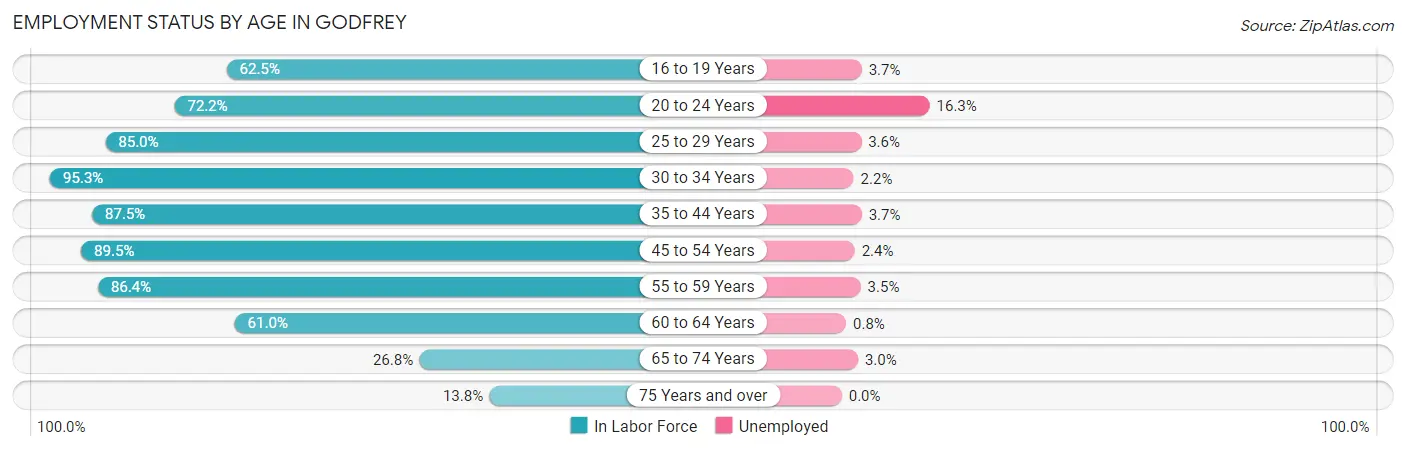
| Age Bracket | In Labor Force | Unemployed |
| 16 to 19 Years | 435 (62.5%) | 16 (3.7%) |
| 20 to 24 Years | 673 (72.2%) | 110 (16.3%) |
| 25 to 29 Years | 854 (85.0%) | 31 (3.6%) |
| 30 to 34 Years | 939 (95.3%) | 21 (2.2%) |
| 35 to 44 Years | 1,309 (87.5%) | 48 (3.7%) |
| 45 to 54 Years | 1,968 (89.5%) | 47 (2.4%) |
| 55 to 59 Years | 1,477 (86.4%) | 52 (3.5%) |
| 60 to 64 Years | 834 (61.0%) | 7 (0.8%) |
| 65 to 74 Years | 690 (26.8%) | 21 (3.0%) |
| 75 Years and over | 308 (13.8%) | 0 (0.0%) |
| Total | 9,482 (62.4%) | 351 (3.7%) |
Employment Status by Educational Attainment in Godfrey
According to labor force statistics for Godfrey, 84.3% of individuals (7,386) out of the total population between 25 and 64 years of age (8,762) are in the labor force, with 2.8% or 207 of them being unemployed. The group with the highest labor force participation rate are those with the educational attainment of bachelor's degree or higher, with 88.5% or 2,626 individuals in the labor force. Within the labor force, individuals with bachelor's degree or higher education have the highest percentage of unemployment, with 5.1% or 134 of them being unemployed.
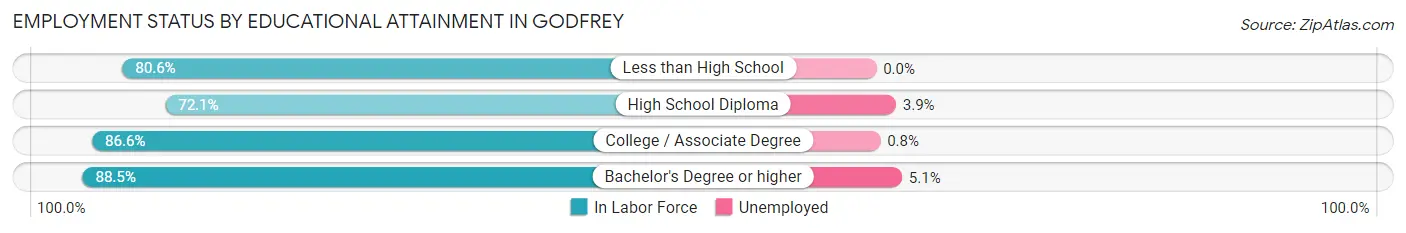
| Educational Attainment | In Labor Force | Unemployed |
| Less than High School | 166 (80.6%) | 0 (0.0%) |
| High School Diploma | 1,237 (72.1%) | 67 (3.9%) |
| College / Associate Degree | 3,355 (86.6%) | 31 (0.8%) |
| Bachelor's Degree or higher | 2,626 (88.5%) | 151 (5.1%) |
| Total | 7,386 (84.3%) | 245 (2.8%) |
Employment Occupations by Sex in Godfrey
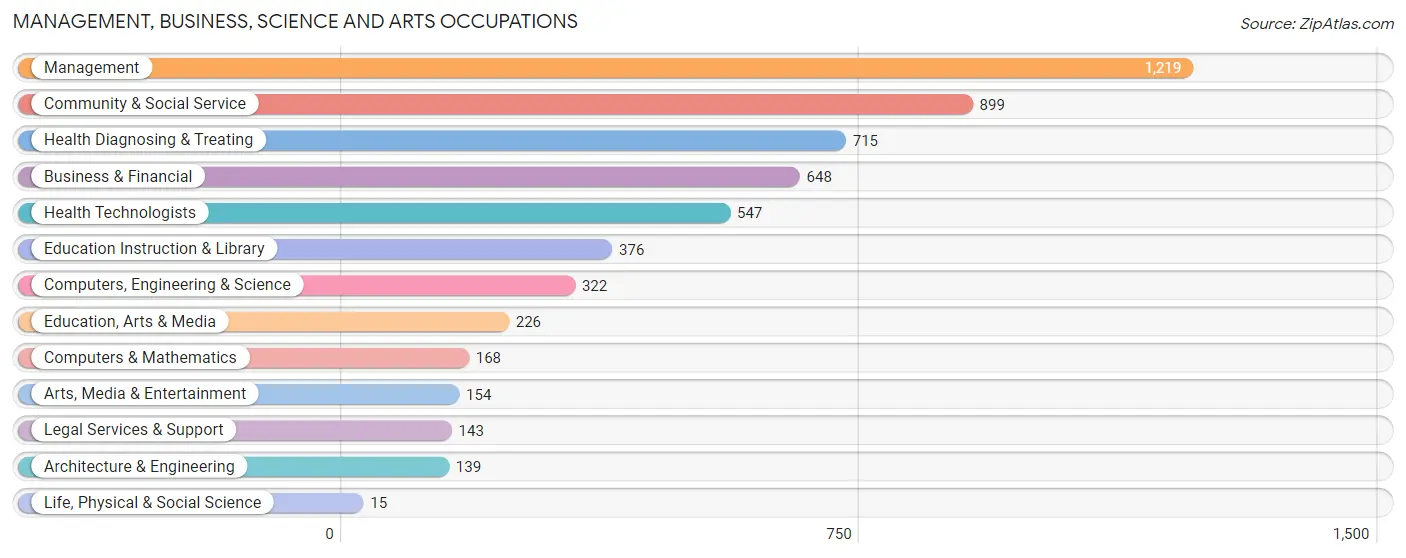
Management, Business, Science and Arts Occupations
The most common Management, Business, Science and Arts occupations in Godfrey are Management (1,219 | 13.4%), Community & Social Service (899 | 9.9%), Health Diagnosing & Treating (715 | 7.8%), Business & Financial (648 | 7.1%), and Health Technologists (547 | 6.0%).
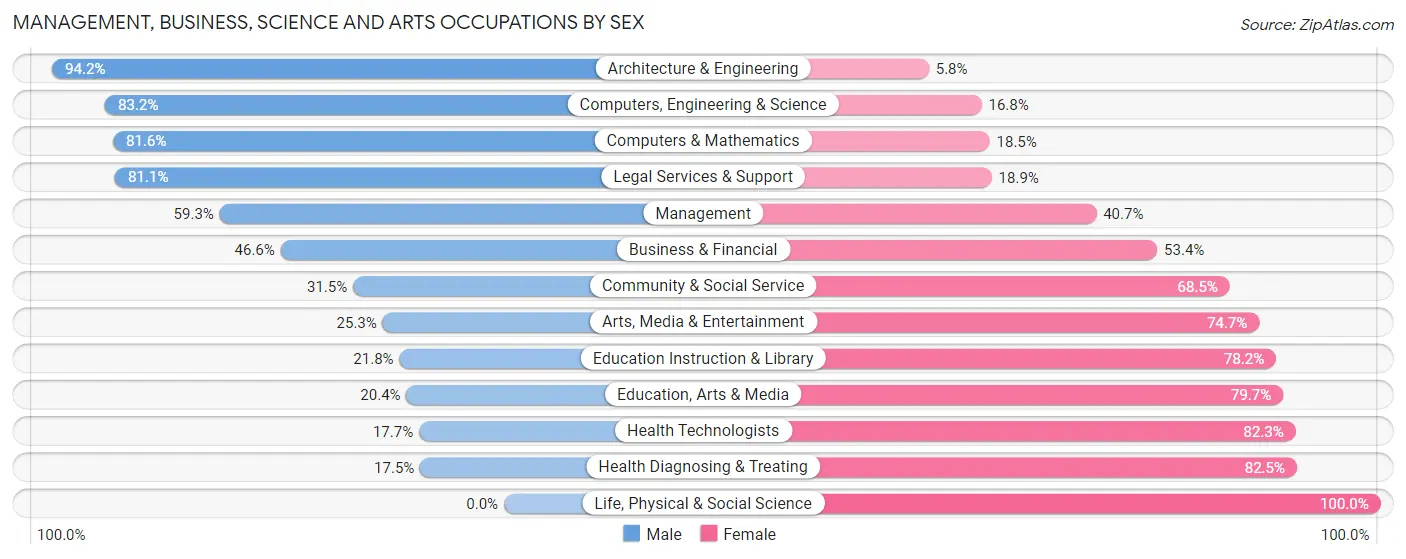
Management, Business, Science and Arts Occupations by Sex
Within the Management, Business, Science and Arts occupations in Godfrey, the most male-oriented occupations are Architecture & Engineering (94.2%), Computers, Engineering & Science (83.2%), and Computers & Mathematics (81.6%), while the most female-oriented occupations are Life, Physical & Social Science (100.0%), Health Diagnosing & Treating (82.5%), and Health Technologists (82.3%).
| Occupation | Male | Female |
| Management | 723 (59.3%) | 496 (40.7%) |
| Business & Financial | 302 (46.6%) | 346 (53.4%) |
| Computers, Engineering & Science | 268 (83.2%) | 54 (16.8%) |
| Computers & Mathematics | 137 (81.6%) | 31 (18.4%) |
| Architecture & Engineering | 131 (94.2%) | 8 (5.8%) |
| Life, Physical & Social Science | 0 (0.0%) | 15 (100.0%) |
| Community & Social Service | 283 (31.5%) | 616 (68.5%) |
| Education, Arts & Media | 46 (20.3%) | 180 (79.6%) |
| Legal Services & Support | 116 (81.1%) | 27 (18.9%) |
| Education Instruction & Library | 82 (21.8%) | 294 (78.2%) |
| Arts, Media & Entertainment | 39 (25.3%) | 115 (74.7%) |
| Health Diagnosing & Treating | 125 (17.5%) | 590 (82.5%) |
| Health Technologists | 97 (17.7%) | 450 (82.3%) |
| Total (Category) | 1,701 (44.7%) | 2,102 (55.3%) |
| Total (Overall) | 4,789 (52.5%) | 4,326 (47.5%) |
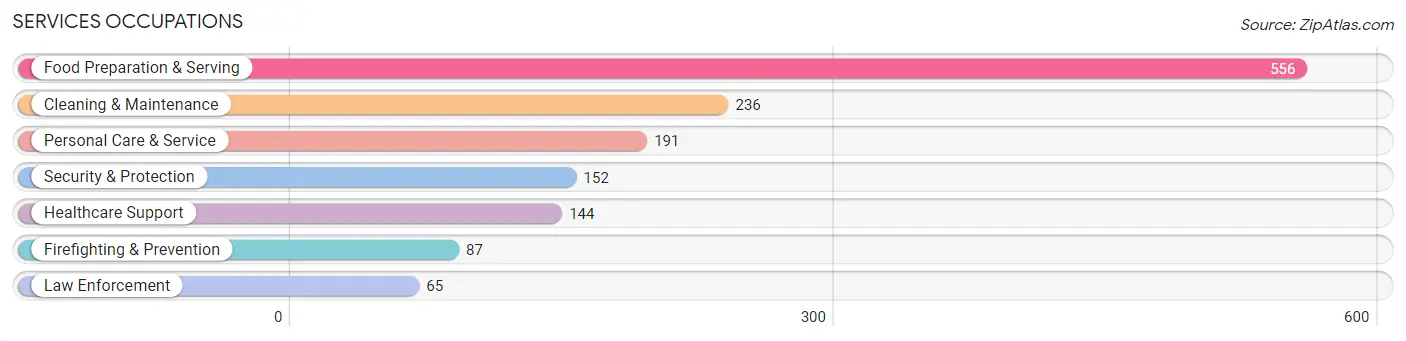
Services Occupations
The most common Services occupations in Godfrey are Food Preparation & Serving (556 | 6.1%), Cleaning & Maintenance (236 | 2.6%), Personal Care & Service (191 | 2.1%), Security & Protection (152 | 1.7%), and Healthcare Support (144 | 1.6%).
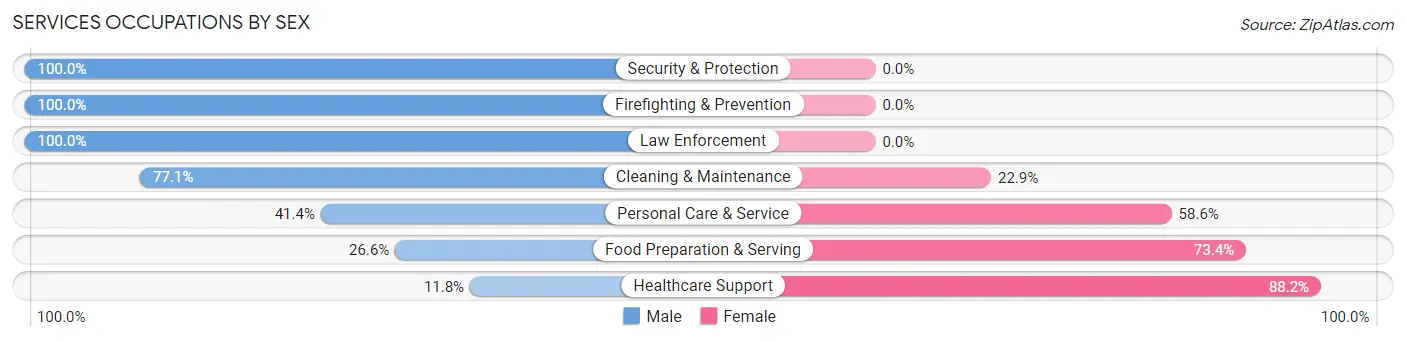
Services Occupations by Sex
Within the Services occupations in Godfrey, the most male-oriented occupations are Security & Protection (100.0%), Firefighting & Prevention (100.0%), and Law Enforcement (100.0%), while the most female-oriented occupations are Healthcare Support (88.2%), Food Preparation & Serving (73.4%), and Personal Care & Service (58.6%).
| Occupation | Male | Female |
| Healthcare Support | 17 (11.8%) | 127 (88.2%) |
| Security & Protection | 152 (100.0%) | 0 (0.0%) |
| Firefighting & Prevention | 87 (100.0%) | 0 (0.0%) |
| Law Enforcement | 65 (100.0%) | 0 (0.0%) |
| Food Preparation & Serving | 148 (26.6%) | 408 (73.4%) |
| Cleaning & Maintenance | 182 (77.1%) | 54 (22.9%) |
| Personal Care & Service | 79 (41.4%) | 112 (58.6%) |
| Total (Category) | 578 (45.2%) | 701 (54.8%) |
| Total (Overall) | 4,789 (52.5%) | 4,326 (47.5%) |
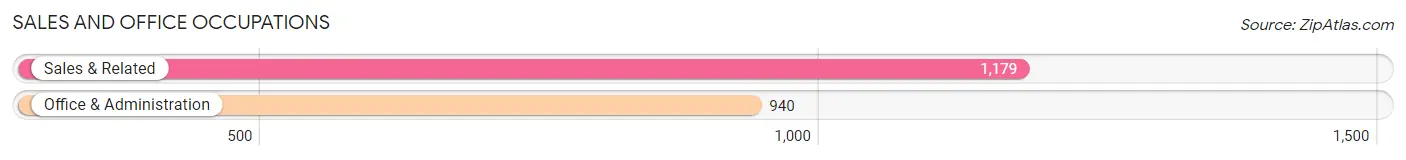
Sales and Office Occupations
The most common Sales and Office occupations in Godfrey are Sales & Related (1,179 | 12.9%), and Office & Administration (940 | 10.3%).
Sales and Office Occupations by Sex
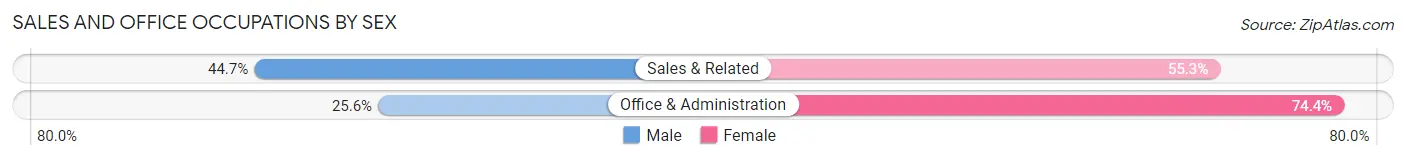
| Occupation | Male | Female |
| Sales & Related | 527 (44.7%) | 652 (55.3%) |
| Office & Administration | 241 (25.6%) | 699 (74.4%) |
| Total (Category) | 768 (36.2%) | 1,351 (63.8%) |
| Total (Overall) | 4,789 (52.5%) | 4,326 (47.5%) |
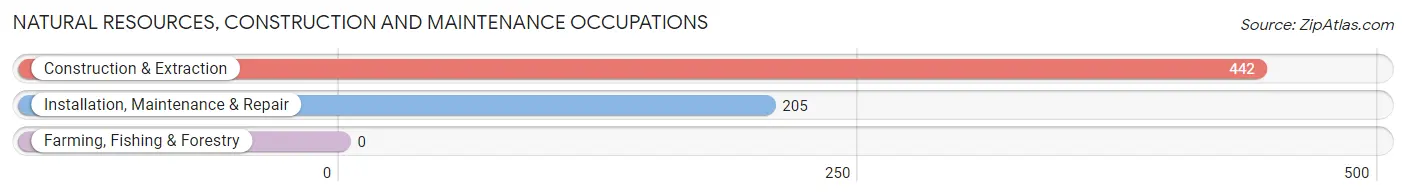
Natural Resources, Construction and Maintenance Occupations
The most common Natural Resources, Construction and Maintenance occupations in Godfrey are Construction & Extraction (442 | 4.9%), and Installation, Maintenance & Repair (205 | 2.2%).
Natural Resources, Construction and Maintenance Occupations by Sex
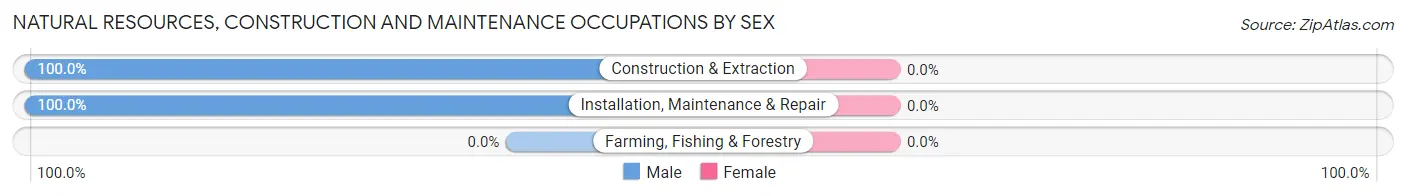
| Occupation | Male | Female |
| Farming, Fishing & Forestry | 0 (0.0%) | 0 (0.0%) |
| Construction & Extraction | 442 (100.0%) | 0 (0.0%) |
| Installation, Maintenance & Repair | 205 (100.0%) | 0 (0.0%) |
| Total (Category) | 647 (100.0%) | 0 (0.0%) |
| Total (Overall) | 4,789 (52.5%) | 4,326 (47.5%) |
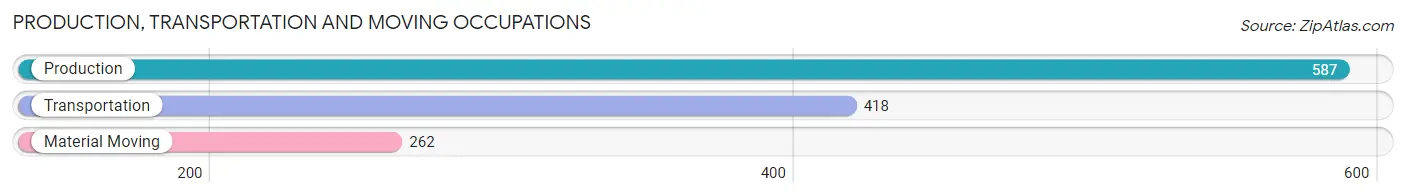
Production, Transportation and Moving Occupations
The most common Production, Transportation and Moving occupations in Godfrey are Production (587 | 6.4%), Transportation (418 | 4.6%), and Material Moving (262 | 2.9%).
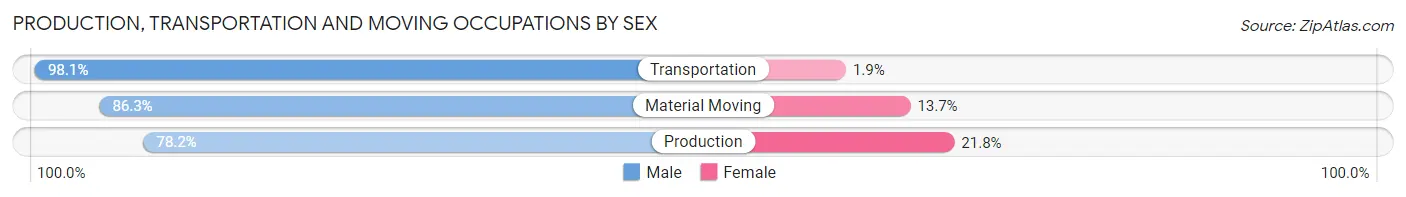
Production, Transportation and Moving Occupations by Sex
| Occupation | Male | Female |
| Production | 459 (78.2%) | 128 (21.8%) |
| Transportation | 410 (98.1%) | 8 (1.9%) |
| Material Moving | 226 (86.3%) | 36 (13.7%) |
| Total (Category) | 1,095 (86.4%) | 172 (13.6%) |
| Total (Overall) | 4,789 (52.5%) | 4,326 (47.5%) |
Employment Industries by Sex in Godfrey
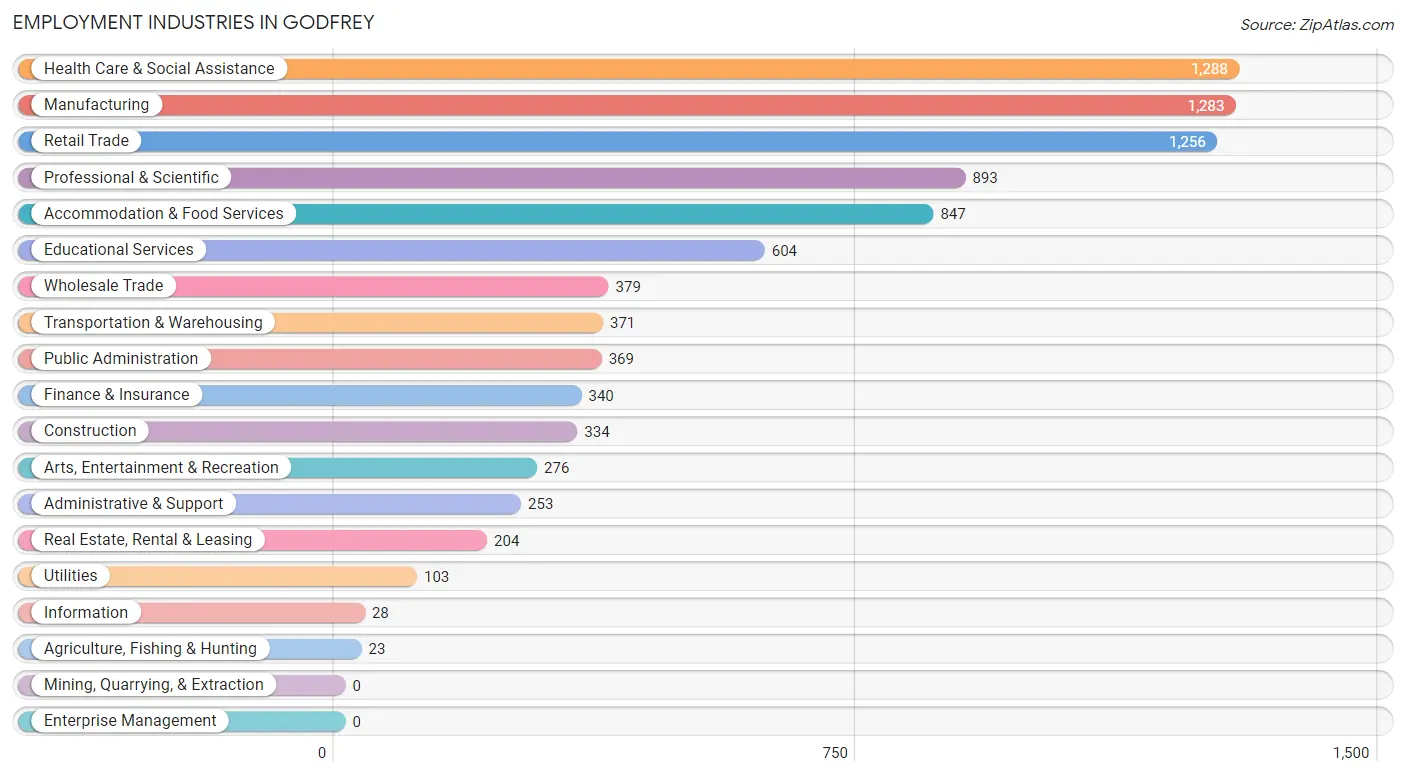
Employment Industries in Godfrey
The major employment industries in Godfrey include Health Care & Social Assistance (1,288 | 14.1%), Manufacturing (1,283 | 14.1%), Retail Trade (1,256 | 13.8%), Professional & Scientific (893 | 9.8%), and Accommodation & Food Services (847 | 9.3%).
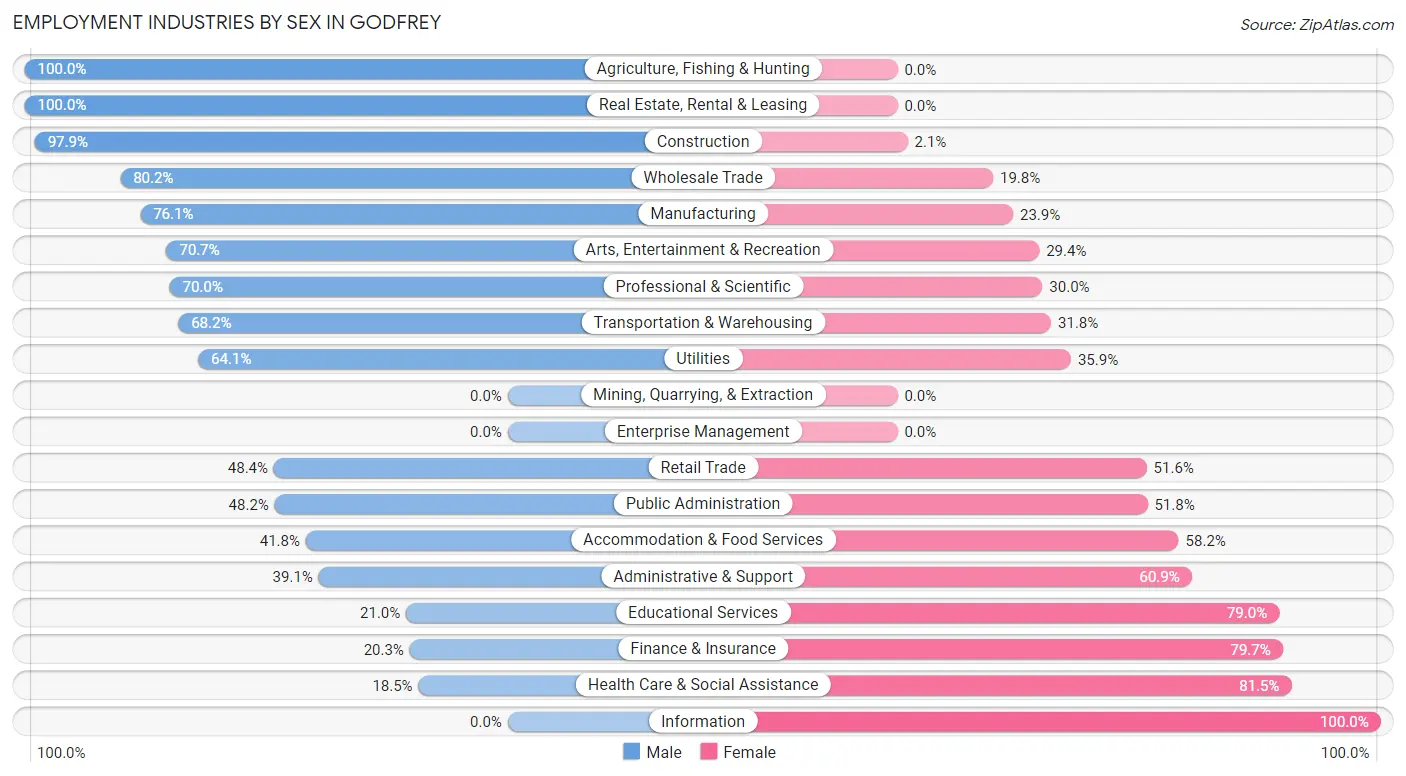
Employment Industries by Sex in Godfrey
The Godfrey industries that see more men than women are Agriculture, Fishing & Hunting (100.0%), Real Estate, Rental & Leasing (100.0%), and Construction (97.9%), whereas the industries that tend to have a higher number of women are Information (100.0%), Health Care & Social Assistance (81.5%), and Finance & Insurance (79.7%).
| Industry | Male | Female |
| Agriculture, Fishing & Hunting | 23 (100.0%) | 0 (0.0%) |
| Mining, Quarrying, & Extraction | 0 (0.0%) | 0 (0.0%) |
| Construction | 327 (97.9%) | 7 (2.1%) |
| Manufacturing | 976 (76.1%) | 307 (23.9%) |
| Wholesale Trade | 304 (80.2%) | 75 (19.8%) |
| Retail Trade | 608 (48.4%) | 648 (51.6%) |
| Transportation & Warehousing | 253 (68.2%) | 118 (31.8%) |
| Utilities | 66 (64.1%) | 37 (35.9%) |
| Information | 0 (0.0%) | 28 (100.0%) |
| Finance & Insurance | 69 (20.3%) | 271 (79.7%) |
| Real Estate, Rental & Leasing | 204 (100.0%) | 0 (0.0%) |
| Professional & Scientific | 625 (70.0%) | 268 (30.0%) |
| Enterprise Management | 0 (0.0%) | 0 (0.0%) |
| Administrative & Support | 99 (39.1%) | 154 (60.9%) |
| Educational Services | 127 (21.0%) | 477 (79.0%) |
| Health Care & Social Assistance | 238 (18.5%) | 1,050 (81.5%) |
| Arts, Entertainment & Recreation | 195 (70.7%) | 81 (29.3%) |
| Accommodation & Food Services | 354 (41.8%) | 493 (58.2%) |
| Public Administration | 178 (48.2%) | 191 (51.8%) |
| Total | 4,789 (52.5%) | 4,326 (47.5%) |
Education in Godfrey
School Enrollment in Godfrey
The most common levels of schooling among the 3,572 students in Godfrey are college / undergraduate (1,079 | 30.2%), elementary school (765 | 21.4%), and high school (735 | 20.6%).
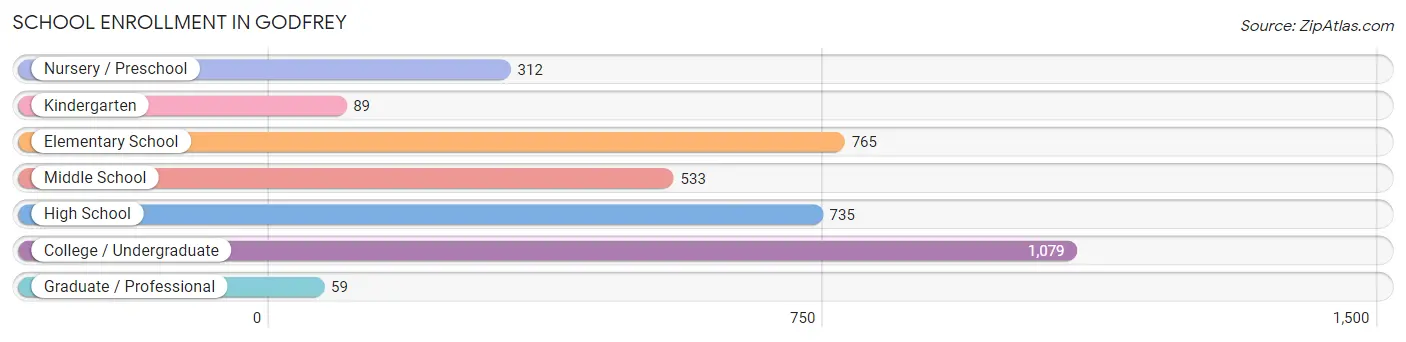
| School Level | # Students | % Students |
| Nursery / Preschool | 312 | 8.7% |
| Kindergarten | 89 | 2.5% |
| Elementary School | 765 | 21.4% |
| Middle School | 533 | 14.9% |
| High School | 735 | 20.6% |
| College / Undergraduate | 1,079 | 30.2% |
| Graduate / Professional | 59 | 1.7% |
| Total | 3,572 | 100.0% |
School Enrollment by Age by Funding Source in Godfrey
Out of a total of 3,572 students who are enrolled in schools in Godfrey, 747 (20.9%) attend a private institution, while the remaining 2,825 (79.1%) are enrolled in public schools. The age group of 3 to 4 year olds has the highest likelihood of being enrolled in private schools, with 148 (71.2% in the age bracket) enrolled. Conversely, the age group of 20 to 24 year olds has the lowest likelihood of being enrolled in a private school, with 325 (98.5% in the age bracket) attending a public institution.
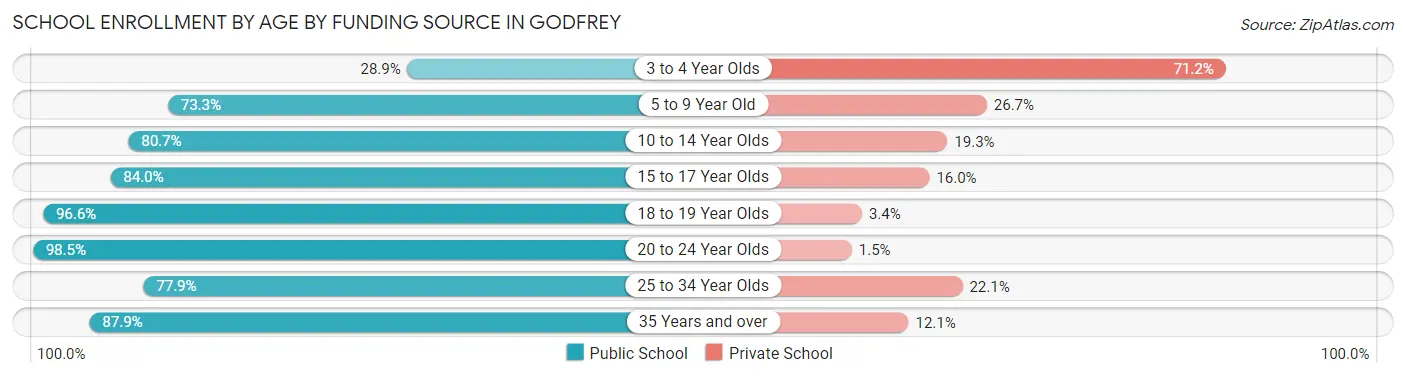
| Age Bracket | Public School | Private School |
| 3 to 4 Year Olds | 60 (28.8%) | 148 (71.2%) |
| 5 to 9 Year Old | 638 (73.3%) | 232 (26.7%) |
| 10 to 14 Year Olds | 547 (80.7%) | 131 (19.3%) |
| 15 to 17 Year Olds | 468 (84.0%) | 89 (16.0%) |
| 18 to 19 Year Olds | 226 (96.6%) | 8 (3.4%) |
| 20 to 24 Year Olds | 325 (98.5%) | 5 (1.5%) |
| 25 to 34 Year Olds | 380 (77.9%) | 108 (22.1%) |
| 35 Years and over | 182 (87.9%) | 25 (12.1%) |
| Total | 2,825 (79.1%) | 747 (20.9%) |
Educational Attainment by Field of Study in Godfrey
Business (1,154 | 25.3%), education (600 | 13.2%), science & technology (495 | 10.8%), social sciences (353 | 7.7%), and psychology (274 | 6.0%) are the most common fields of study among 4,564 individuals in Godfrey who have obtained a bachelor's degree or higher.
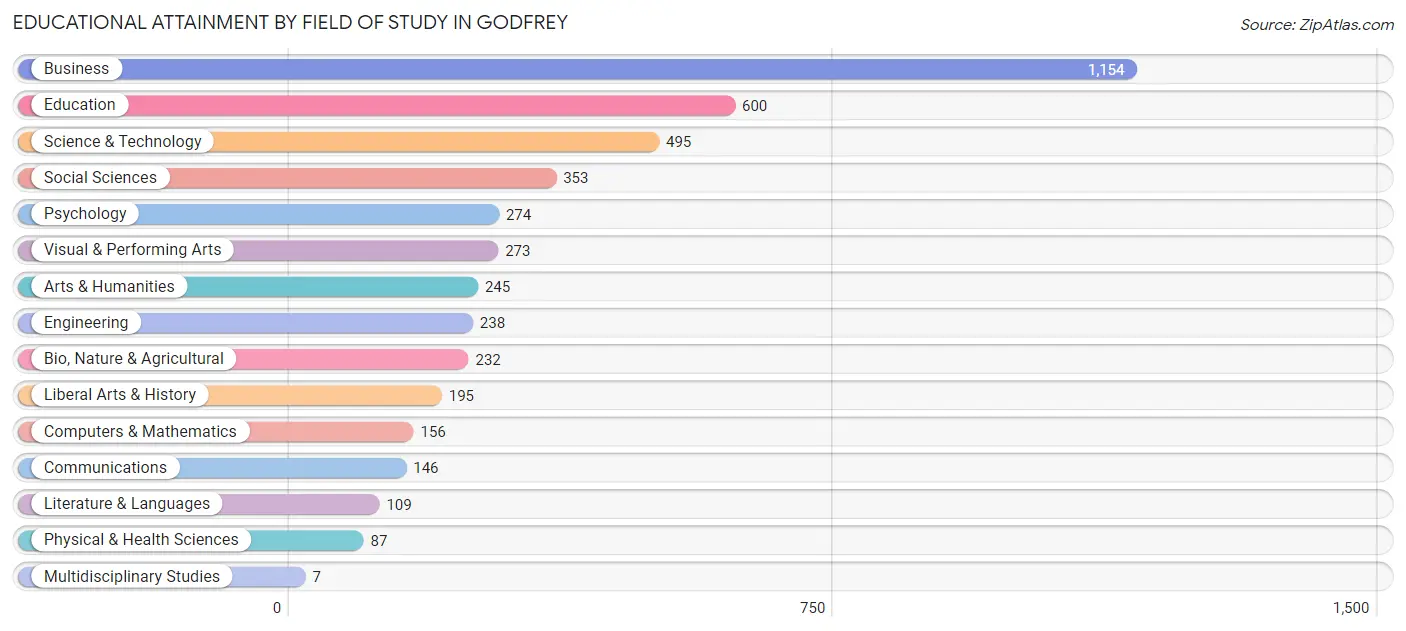
| Field of Study | # Graduates | % Graduates |
| Computers & Mathematics | 156 | 3.4% |
| Bio, Nature & Agricultural | 232 | 5.1% |
| Physical & Health Sciences | 87 | 1.9% |
| Psychology | 274 | 6.0% |
| Social Sciences | 353 | 7.7% |
| Engineering | 238 | 5.2% |
| Multidisciplinary Studies | 7 | 0.2% |
| Science & Technology | 495 | 10.8% |
| Business | 1,154 | 25.3% |
| Education | 600 | 13.2% |
| Literature & Languages | 109 | 2.4% |
| Liberal Arts & History | 195 | 4.3% |
| Visual & Performing Arts | 273 | 6.0% |
| Communications | 146 | 3.2% |
| Arts & Humanities | 245 | 5.4% |
| Total | 4,564 | 100.0% |
Transportation & Commute in Godfrey
Vehicle Availability by Sex in Godfrey
The most prevalent vehicle ownership categories in Godfrey are males with 2 vehicles (2,048, accounting for 43.6%) and females with 2 vehicles (2,007, making up 47.8%).
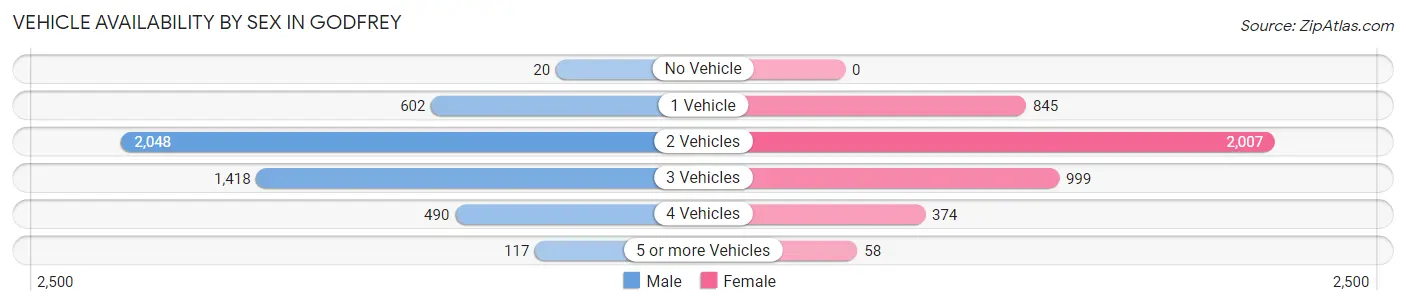
| Vehicles Available | Male | Female |
| No Vehicle | 20 (0.4%) | 0 (0.0%) |
| 1 Vehicle | 602 (12.8%) | 845 (19.7%) |
| 2 Vehicles | 2,048 (43.6%) | 2,007 (46.9%) |
| 3 Vehicles | 1,418 (30.2%) | 999 (23.3%) |
| 4 Vehicles | 490 (10.4%) | 374 (8.7%) |
| 5 or more Vehicles | 117 (2.5%) | 58 (1.3%) |
| Total | 4,695 (100.0%) | 4,283 (100.0%) |
Commute Time in Godfrey
The most frequently occuring commute durations in Godfrey are 10 to 14 minutes (1,175 commuters, 14.7%), 5 to 9 minutes (1,146 commuters, 14.3%), and 30 to 34 minutes (1,063 commuters, 13.3%).
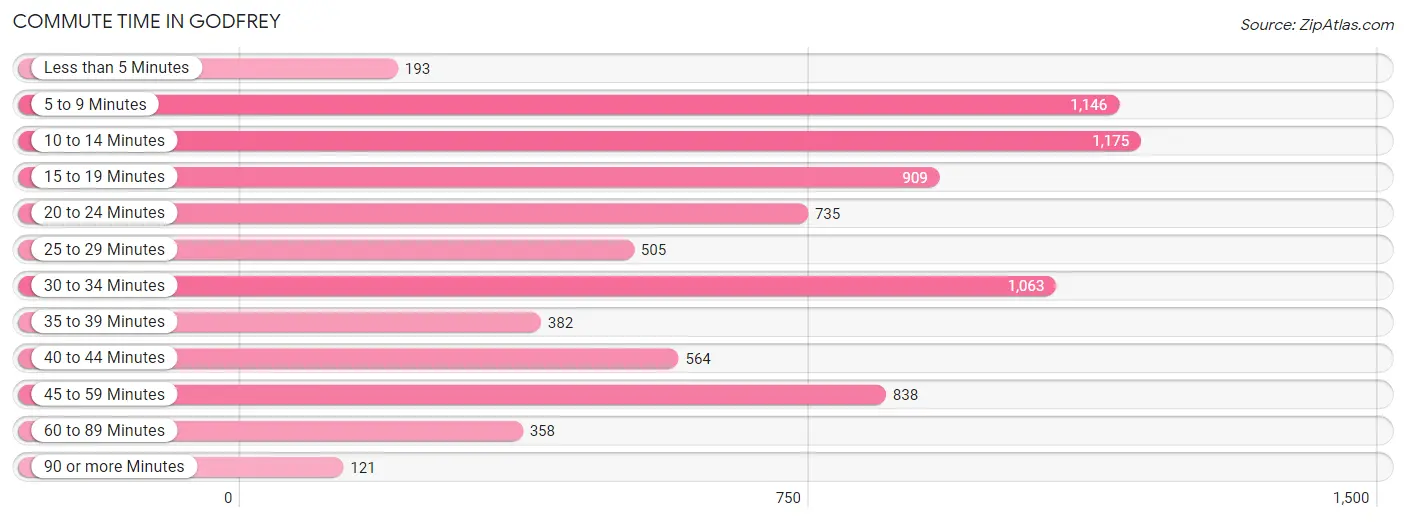
| Commute Time | # Commuters | % Commuters |
| Less than 5 Minutes | 193 | 2.4% |
| 5 to 9 Minutes | 1,146 | 14.3% |
| 10 to 14 Minutes | 1,175 | 14.7% |
| 15 to 19 Minutes | 909 | 11.4% |
| 20 to 24 Minutes | 735 | 9.2% |
| 25 to 29 Minutes | 505 | 6.3% |
| 30 to 34 Minutes | 1,063 | 13.3% |
| 35 to 39 Minutes | 382 | 4.8% |
| 40 to 44 Minutes | 564 | 7.1% |
| 45 to 59 Minutes | 838 | 10.5% |
| 60 to 89 Minutes | 358 | 4.5% |
| 90 or more Minutes | 121 | 1.5% |
Commute Time by Sex in Godfrey
The most common commute times in Godfrey are 10 to 14 minutes (733 commuters, 17.4%) for males and 5 to 9 minutes (520 commuters, 13.8%) for females.
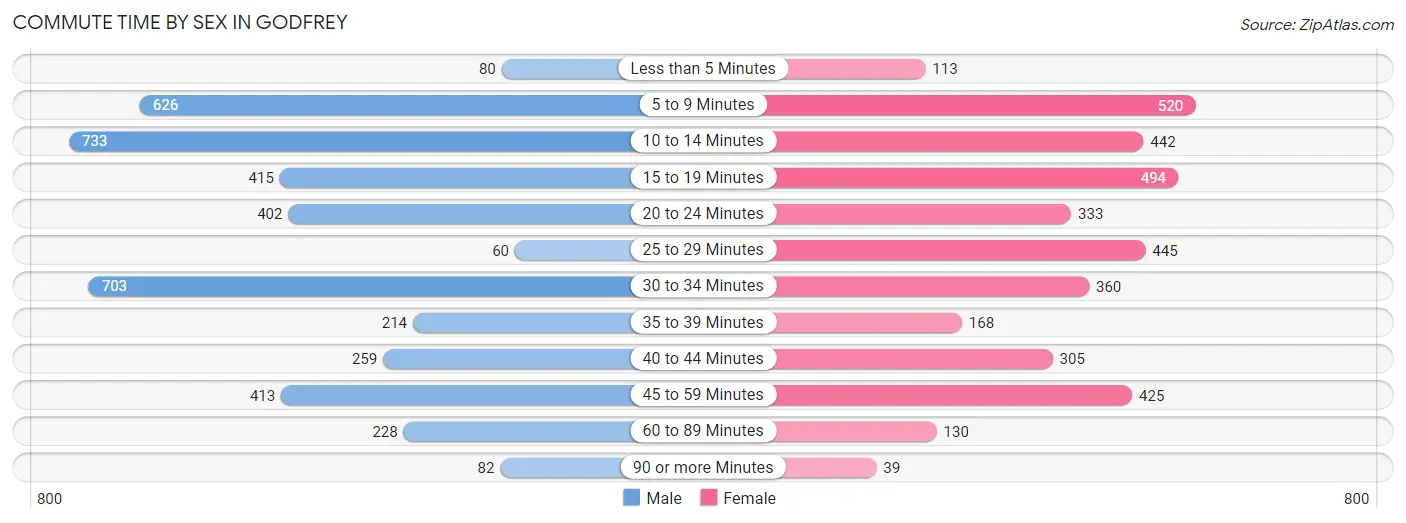
| Commute Time | Male | Female |
| Less than 5 Minutes | 80 (1.9%) | 113 (3.0%) |
| 5 to 9 Minutes | 626 (14.8%) | 520 (13.8%) |
| 10 to 14 Minutes | 733 (17.4%) | 442 (11.7%) |
| 15 to 19 Minutes | 415 (9.9%) | 494 (13.1%) |
| 20 to 24 Minutes | 402 (9.5%) | 333 (8.8%) |
| 25 to 29 Minutes | 60 (1.4%) | 445 (11.8%) |
| 30 to 34 Minutes | 703 (16.7%) | 360 (9.5%) |
| 35 to 39 Minutes | 214 (5.1%) | 168 (4.4%) |
| 40 to 44 Minutes | 259 (6.1%) | 305 (8.1%) |
| 45 to 59 Minutes | 413 (9.8%) | 425 (11.3%) |
| 60 to 89 Minutes | 228 (5.4%) | 130 (3.4%) |
| 90 or more Minutes | 82 (1.9%) | 39 (1.0%) |
Time of Departure to Work by Sex in Godfrey
The most frequent times of departure to work in Godfrey are 6:00 AM to 6:29 AM (732, 17.4%) for males and 6:30 AM to 6:59 AM (540, 14.3%) for females.
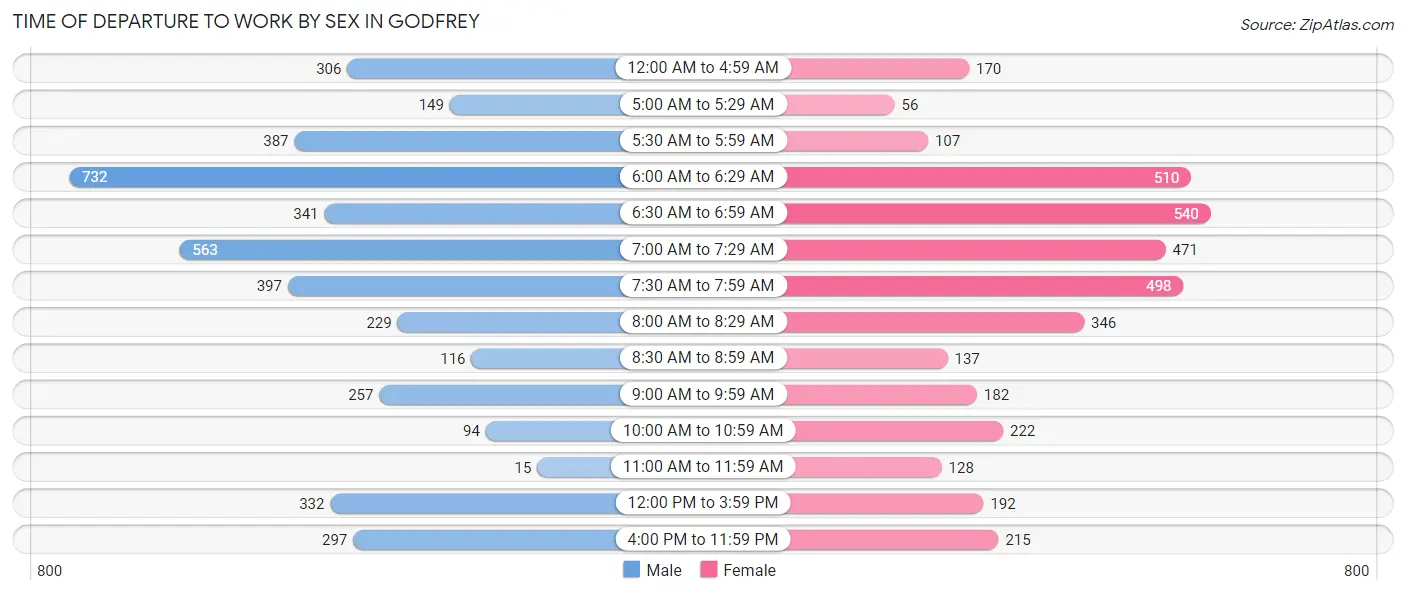
| Time of Departure | Male | Female |
| 12:00 AM to 4:59 AM | 306 (7.3%) | 170 (4.5%) |
| 5:00 AM to 5:29 AM | 149 (3.5%) | 56 (1.5%) |
| 5:30 AM to 5:59 AM | 387 (9.2%) | 107 (2.8%) |
| 6:00 AM to 6:29 AM | 732 (17.4%) | 510 (13.5%) |
| 6:30 AM to 6:59 AM | 341 (8.1%) | 540 (14.3%) |
| 7:00 AM to 7:29 AM | 563 (13.4%) | 471 (12.5%) |
| 7:30 AM to 7:59 AM | 397 (9.4%) | 498 (13.2%) |
| 8:00 AM to 8:29 AM | 229 (5.4%) | 346 (9.2%) |
| 8:30 AM to 8:59 AM | 116 (2.8%) | 137 (3.6%) |
| 9:00 AM to 9:59 AM | 257 (6.1%) | 182 (4.8%) |
| 10:00 AM to 10:59 AM | 94 (2.2%) | 222 (5.9%) |
| 11:00 AM to 11:59 AM | 15 (0.4%) | 128 (3.4%) |
| 12:00 PM to 3:59 PM | 332 (7.9%) | 192 (5.1%) |
| 4:00 PM to 11:59 PM | 297 (7.0%) | 215 (5.7%) |
| Total | 4,215 (100.0%) | 3,774 (100.0%) |
Housing Occupancy in Godfrey
Occupancy by Ownership in Godfrey
Of the total 7,536 dwellings in Godfrey, owner-occupied units account for 6,252 (83.0%), while renter-occupied units make up 1,284 (17.0%).
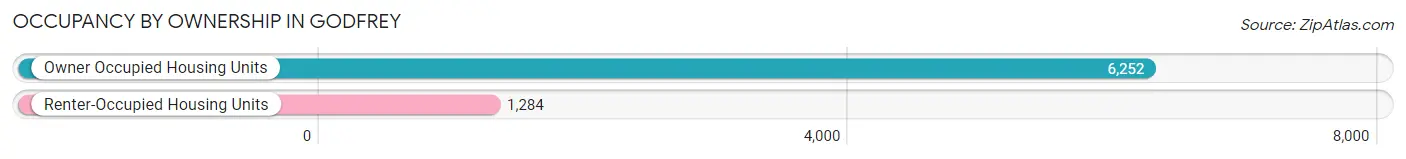
| Occupancy | # Housing Units | % Housing Units |
| Owner Occupied Housing Units | 6,252 | 83.0% |
| Renter-Occupied Housing Units | 1,284 | 17.0% |
| Total Occupied Housing Units | 7,536 | 100.0% |
Occupancy by Household Size in Godfrey
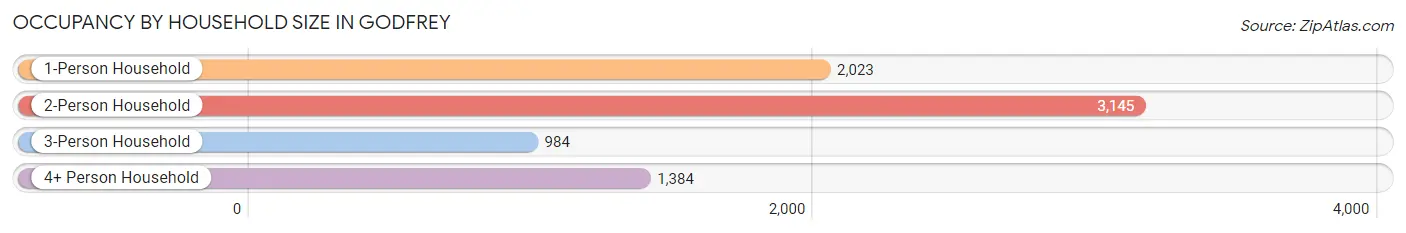
| Household Size | # Housing Units | % Housing Units |
| 1-Person Household | 2,023 | 26.8% |
| 2-Person Household | 3,145 | 41.7% |
| 3-Person Household | 984 | 13.1% |
| 4+ Person Household | 1,384 | 18.4% |
| Total Housing Units | 7,536 | 100.0% |
Occupancy by Ownership by Household Size in Godfrey
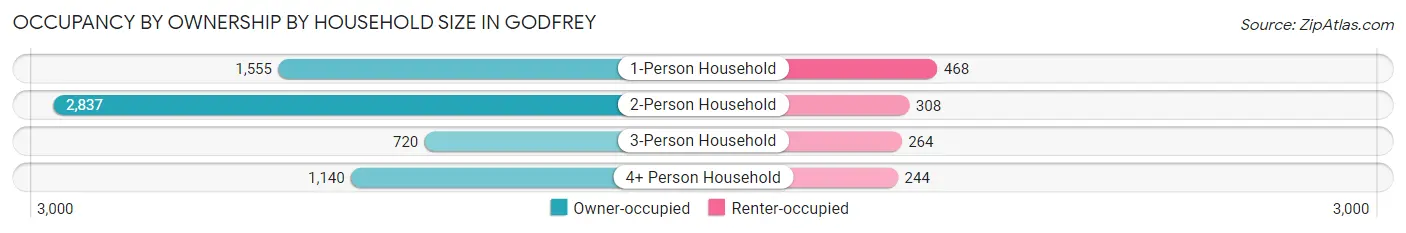
| Household Size | Owner-occupied | Renter-occupied |
| 1-Person Household | 1,555 (76.9%) | 468 (23.1%) |
| 2-Person Household | 2,837 (90.2%) | 308 (9.8%) |
| 3-Person Household | 720 (73.2%) | 264 (26.8%) |
| 4+ Person Household | 1,140 (82.4%) | 244 (17.6%) |
| Total Housing Units | 6,252 (83.0%) | 1,284 (17.0%) |
Occupancy by Educational Attainment in Godfrey
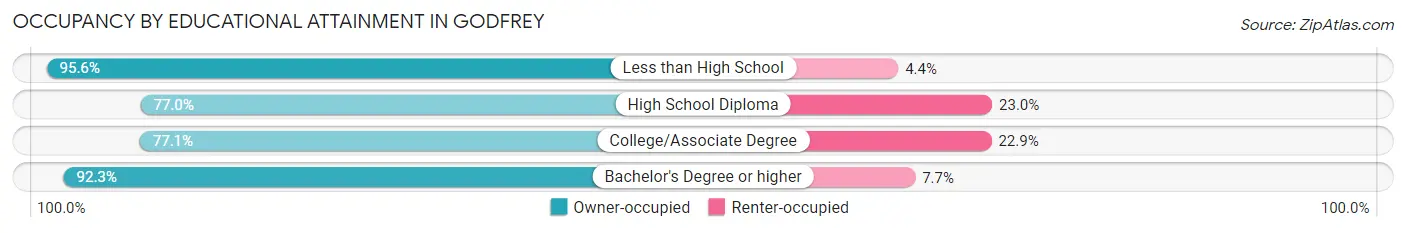
| Household Size | Owner-occupied | Renter-occupied |
| Less than High School | 219 (95.6%) | 10 (4.4%) |
| High School Diploma | 1,229 (77.0%) | 367 (23.0%) |
| College/Associate Degree | 2,372 (77.1%) | 703 (22.9%) |
| Bachelor's Degree or higher | 2,432 (92.3%) | 204 (7.7%) |
Occupancy by Age of Householder in Godfrey
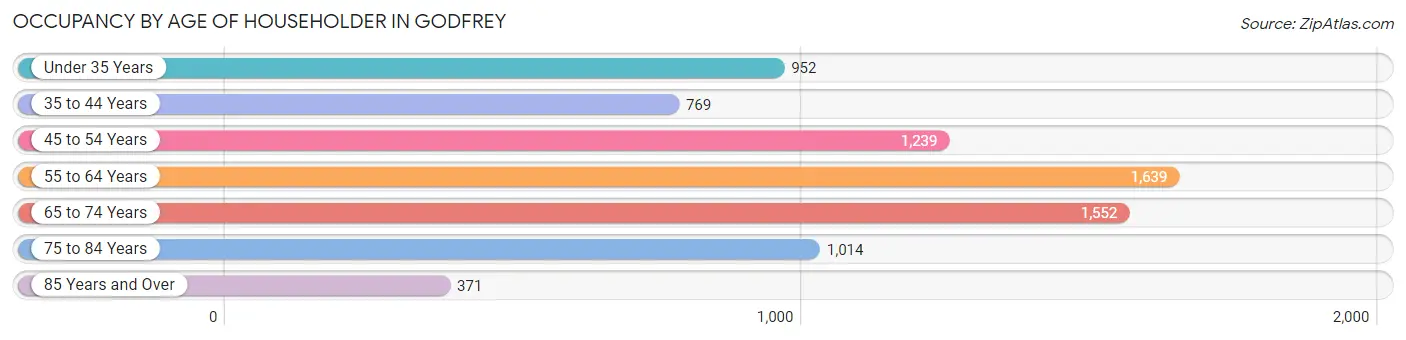
| Age Bracket | # Households | % Households |
| Under 35 Years | 952 | 12.6% |
| 35 to 44 Years | 769 | 10.2% |
| 45 to 54 Years | 1,239 | 16.4% |
| 55 to 64 Years | 1,639 | 21.7% |
| 65 to 74 Years | 1,552 | 20.6% |
| 75 to 84 Years | 1,014 | 13.5% |
| 85 Years and Over | 371 | 4.9% |
| Total | 7,536 | 100.0% |
Housing Finances in Godfrey
Median Income by Occupancy in Godfrey
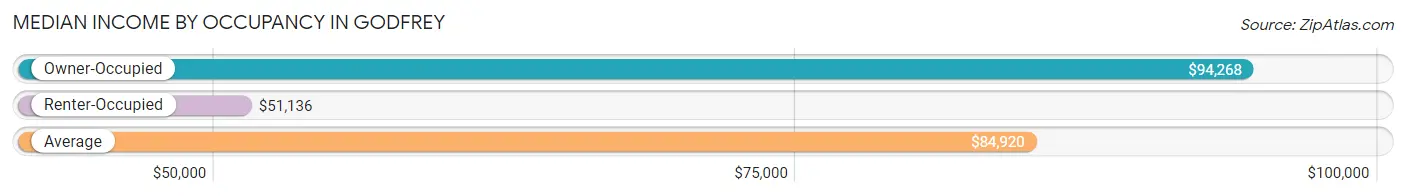
| Occupancy Type | # Households | Median Income |
| Owner-Occupied | 6,252 (83.0%) | $94,268 |
| Renter-Occupied | 1,284 (17.0%) | $51,136 |
| Average | 7,536 (100.0%) | $84,920 |
Occupancy by Householder Income Bracket in Godfrey
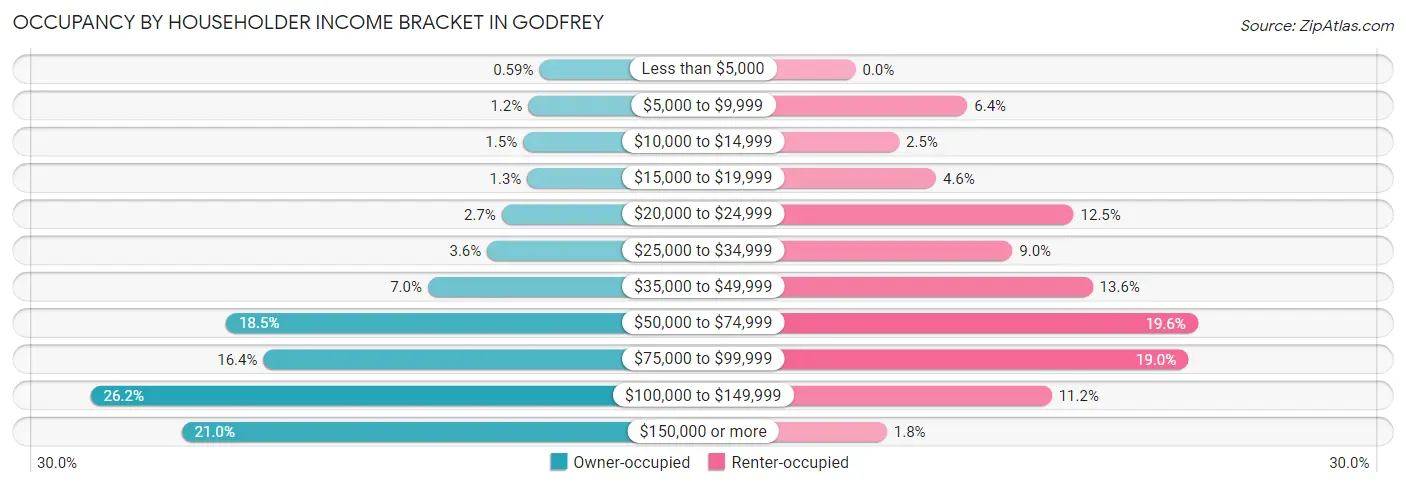
| Income Bracket | Owner-occupied | Renter-occupied |
| Less than $5,000 | 37 (0.6%) | 0 (0.0%) |
| $5,000 to $9,999 | 77 (1.2%) | 82 (6.4%) |
| $10,000 to $14,999 | 95 (1.5%) | 32 (2.5%) |
| $15,000 to $19,999 | 80 (1.3%) | 59 (4.6%) |
| $20,000 to $24,999 | 171 (2.7%) | 160 (12.5%) |
| $25,000 to $34,999 | 223 (3.6%) | 115 (9.0%) |
| $35,000 to $49,999 | 435 (7.0%) | 174 (13.6%) |
| $50,000 to $74,999 | 1,156 (18.5%) | 251 (19.6%) |
| $75,000 to $99,999 | 1,023 (16.4%) | 244 (19.0%) |
| $100,000 to $149,999 | 1,640 (26.2%) | 144 (11.2%) |
| $150,000 or more | 1,315 (21.0%) | 23 (1.8%) |
| Total | 6,252 (100.0%) | 1,284 (100.0%) |
Monthly Housing Cost Tiers in Godfrey
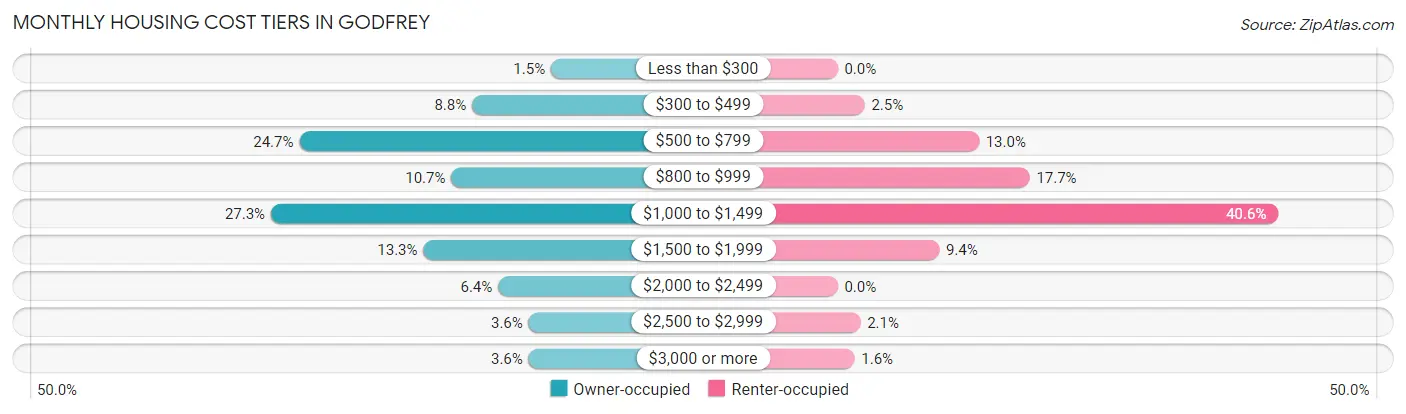
| Monthly Cost | Owner-occupied | Renter-occupied |
| Less than $300 | 96 (1.5%) | 0 (0.0%) |
| $300 to $499 | 551 (8.8%) | 32 (2.5%) |
| $500 to $799 | 1,545 (24.7%) | 167 (13.0%) |
| $800 to $999 | 670 (10.7%) | 227 (17.7%) |
| $1,000 to $1,499 | 1,708 (27.3%) | 521 (40.6%) |
| $1,500 to $1,999 | 831 (13.3%) | 120 (9.3%) |
| $2,000 to $2,499 | 401 (6.4%) | 0 (0.0%) |
| $2,500 to $2,999 | 225 (3.6%) | 27 (2.1%) |
| $3,000 or more | 225 (3.6%) | 20 (1.6%) |
| Total | 6,252 (100.0%) | 1,284 (100.0%) |
Physical Housing Characteristics in Godfrey
Housing Structures in Godfrey
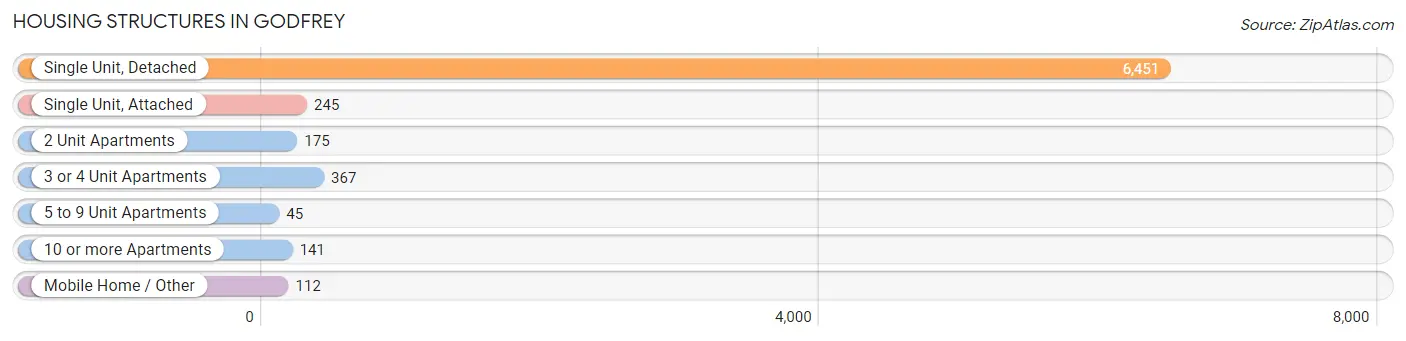
| Structure Type | # Housing Units | % Housing Units |
| Single Unit, Detached | 6,451 | 85.6% |
| Single Unit, Attached | 245 | 3.3% |
| 2 Unit Apartments | 175 | 2.3% |
| 3 or 4 Unit Apartments | 367 | 4.9% |
| 5 to 9 Unit Apartments | 45 | 0.6% |
| 10 or more Apartments | 141 | 1.9% |
| Mobile Home / Other | 112 | 1.5% |
| Total | 7,536 | 100.0% |
Housing Structures by Occupancy in Godfrey
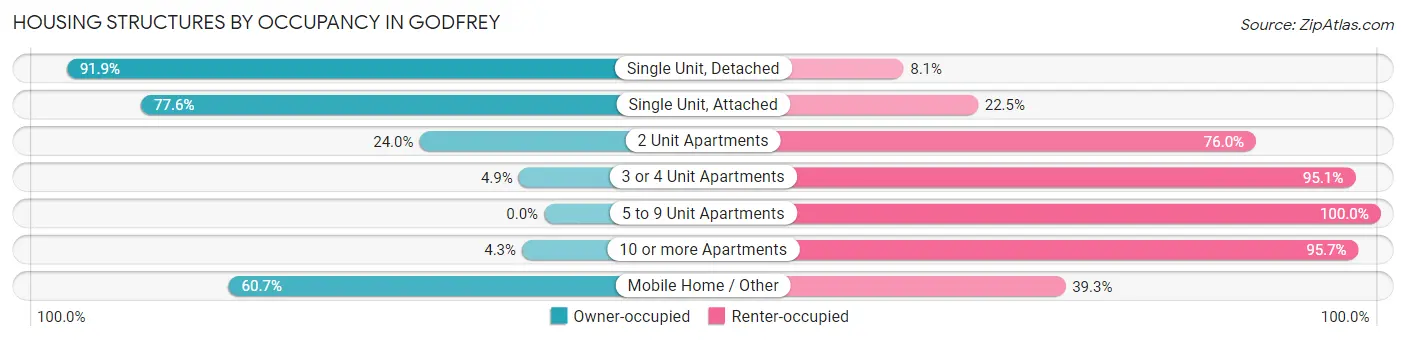
| Structure Type | Owner-occupied | Renter-occupied |
| Single Unit, Detached | 5,928 (91.9%) | 523 (8.1%) |
| Single Unit, Attached | 190 (77.5%) | 55 (22.5%) |
| 2 Unit Apartments | 42 (24.0%) | 133 (76.0%) |
| 3 or 4 Unit Apartments | 18 (4.9%) | 349 (95.1%) |
| 5 to 9 Unit Apartments | 0 (0.0%) | 45 (100.0%) |
| 10 or more Apartments | 6 (4.3%) | 135 (95.7%) |
| Mobile Home / Other | 68 (60.7%) | 44 (39.3%) |
| Total | 6,252 (83.0%) | 1,284 (17.0%) |
Housing Structures by Number of Rooms in Godfrey
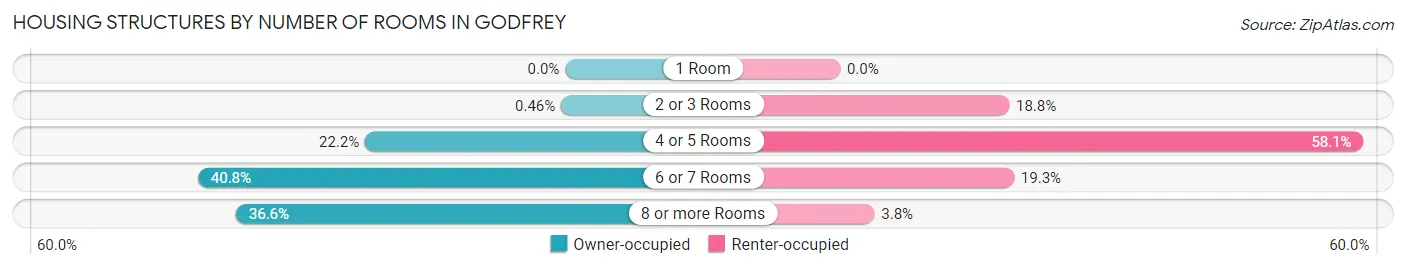
| Number of Rooms | Owner-occupied | Renter-occupied |
| 1 Room | 0 (0.0%) | 0 (0.0%) |
| 2 or 3 Rooms | 29 (0.5%) | 241 (18.8%) |
| 4 or 5 Rooms | 1,389 (22.2%) | 746 (58.1%) |
| 6 or 7 Rooms | 2,549 (40.8%) | 248 (19.3%) |
| 8 or more Rooms | 2,285 (36.5%) | 49 (3.8%) |
| Total | 6,252 (100.0%) | 1,284 (100.0%) |
Housing Structure by Heating Type in Godfrey
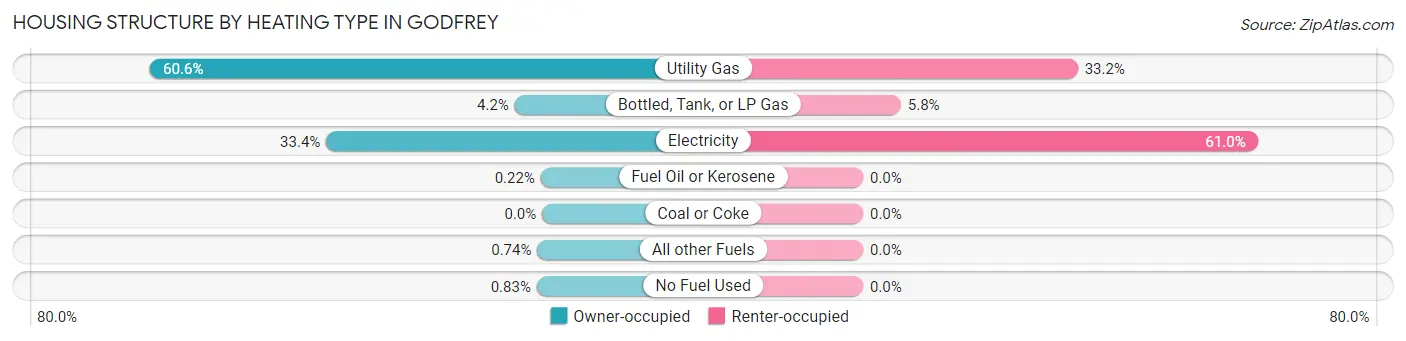
| Heating Type | Owner-occupied | Renter-occupied |
| Utility Gas | 3,788 (60.6%) | 426 (33.2%) |
| Bottled, Tank, or LP Gas | 265 (4.2%) | 75 (5.8%) |
| Electricity | 2,087 (33.4%) | 783 (61.0%) |
| Fuel Oil or Kerosene | 14 (0.2%) | 0 (0.0%) |
| Coal or Coke | 0 (0.0%) | 0 (0.0%) |
| All other Fuels | 46 (0.7%) | 0 (0.0%) |
| No Fuel Used | 52 (0.8%) | 0 (0.0%) |
| Total | 6,252 (100.0%) | 1,284 (100.0%) |
Household Vehicle Usage in Godfrey
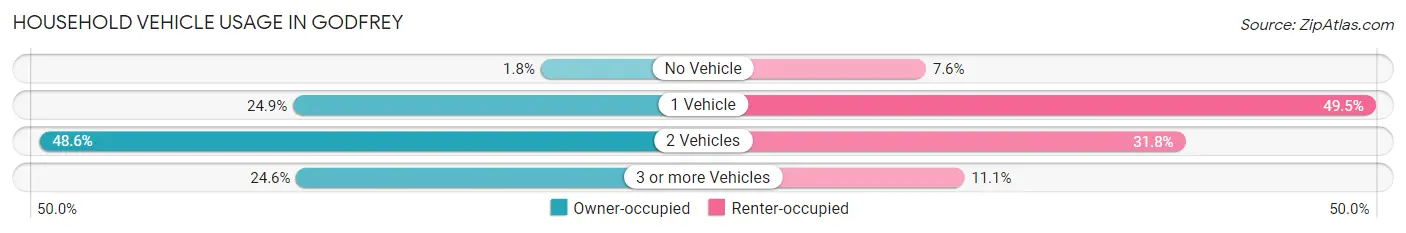
| Vehicles per Household | Owner-occupied | Renter-occupied |
| No Vehicle | 114 (1.8%) | 97 (7.5%) |
| 1 Vehicle | 1,559 (24.9%) | 636 (49.5%) |
| 2 Vehicles | 3,039 (48.6%) | 408 (31.8%) |
| 3 or more Vehicles | 1,540 (24.6%) | 143 (11.1%) |
| Total | 6,252 (100.0%) | 1,284 (100.0%) |
Real Estate & Mortgages in Godfrey
Real Estate and Mortgage Overview in Godfrey
| Characteristic | Without Mortgage | With Mortgage |
| Housing Units | 2,801 | 3,451 |
| Median Property Value | $166,800 | $173,600 |
| Median Household Income | $72,474 | $958 |
| Monthly Housing Costs | $663 | $209 |
| Real Estate Taxes | $3,416 | $0 |
Property Value by Mortgage Status in Godfrey
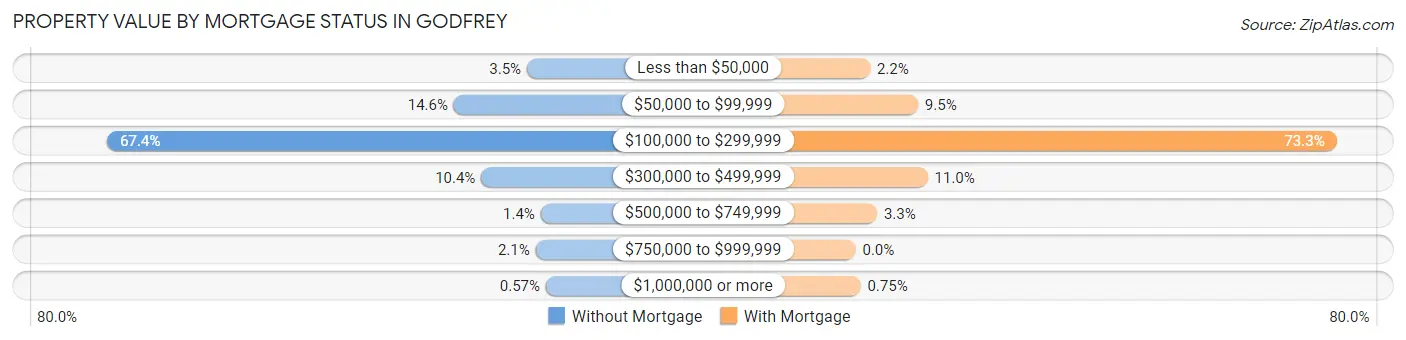
| Property Value | Without Mortgage | With Mortgage |
| Less than $50,000 | 97 (3.5%) | 76 (2.2%) |
| $50,000 to $99,999 | 409 (14.6%) | 328 (9.5%) |
| $100,000 to $299,999 | 1,889 (67.4%) | 2,529 (73.3%) |
| $300,000 to $499,999 | 292 (10.4%) | 379 (11.0%) |
| $500,000 to $749,999 | 38 (1.4%) | 113 (3.3%) |
| $750,000 to $999,999 | 60 (2.1%) | 0 (0.0%) |
| $1,000,000 or more | 16 (0.6%) | 26 (0.7%) |
| Total | 2,801 (100.0%) | 3,451 (100.0%) |
Household Income by Mortgage Status in Godfrey
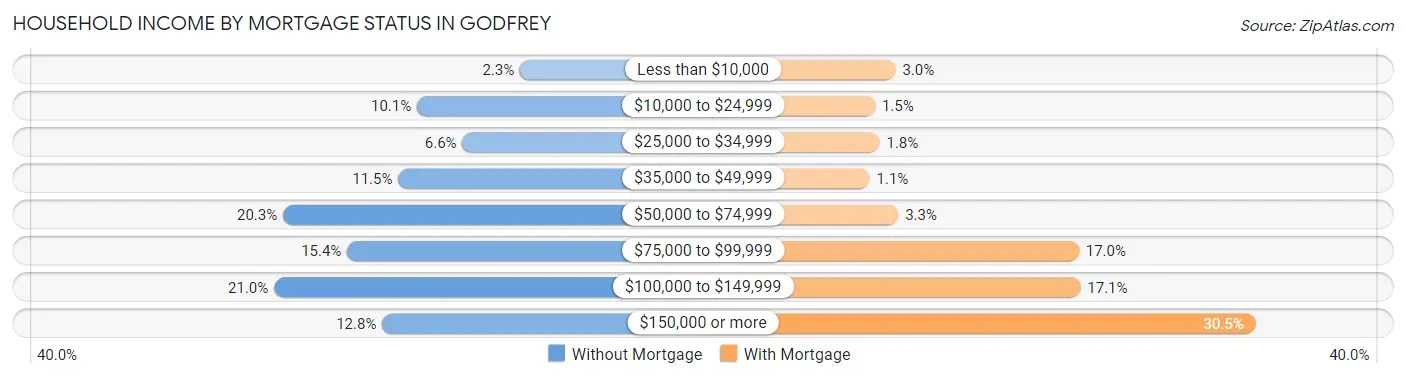
| Household Income | Without Mortgage | With Mortgage |
| Less than $10,000 | 63 (2.2%) | 105 (3.0%) |
| $10,000 to $24,999 | 283 (10.1%) | 51 (1.5%) |
| $25,000 to $34,999 | 186 (6.6%) | 63 (1.8%) |
| $35,000 to $49,999 | 323 (11.5%) | 37 (1.1%) |
| $50,000 to $74,999 | 569 (20.3%) | 112 (3.3%) |
| $75,000 to $99,999 | 432 (15.4%) | 587 (17.0%) |
| $100,000 to $149,999 | 588 (21.0%) | 591 (17.1%) |
| $150,000 or more | 357 (12.8%) | 1,052 (30.5%) |
| Total | 2,801 (100.0%) | 3,451 (100.0%) |
Property Value to Household Income Ratio in Godfrey
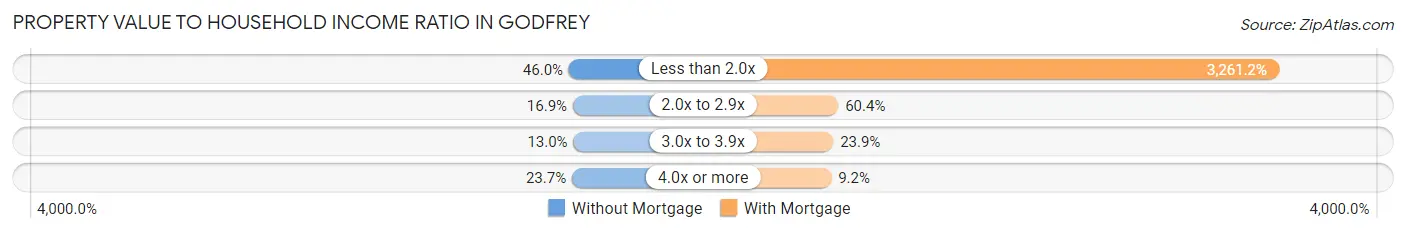
| Value-to-Income Ratio | Without Mortgage | With Mortgage |
| Less than 2.0x | 1,287 (46.0%) | 112,544 (3,261.2%) |
| 2.0x to 2.9x | 474 (16.9%) | 2,085 (60.4%) |
| 3.0x to 3.9x | 363 (13.0%) | 826 (23.9%) |
| 4.0x or more | 663 (23.7%) | 317 (9.2%) |
| Total | 2,801 (100.0%) | 3,451 (100.0%) |
Real Estate Taxes by Mortgage Status in Godfrey
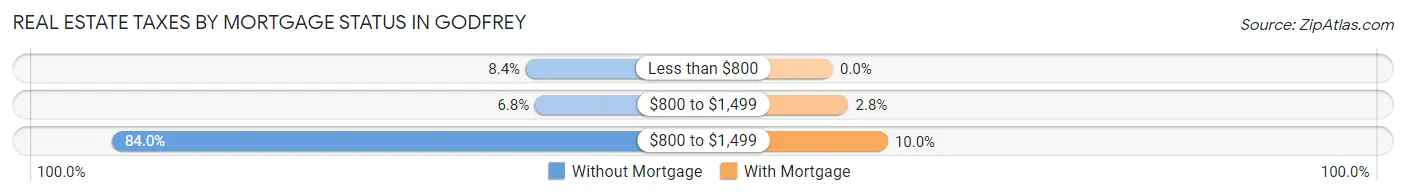
| Property Taxes | Without Mortgage | With Mortgage |
| Less than $800 | 236 (8.4%) | 0 (0.0%) |
| $800 to $1,499 | 189 (6.8%) | 98 (2.8%) |
| $800 to $1,499 | 2,354 (84.0%) | 346 (10.0%) |
| Total | 2,801 (100.0%) | 3,451 (100.0%) |
Health & Disability in Godfrey
Health Insurance Coverage by Age in Godfrey
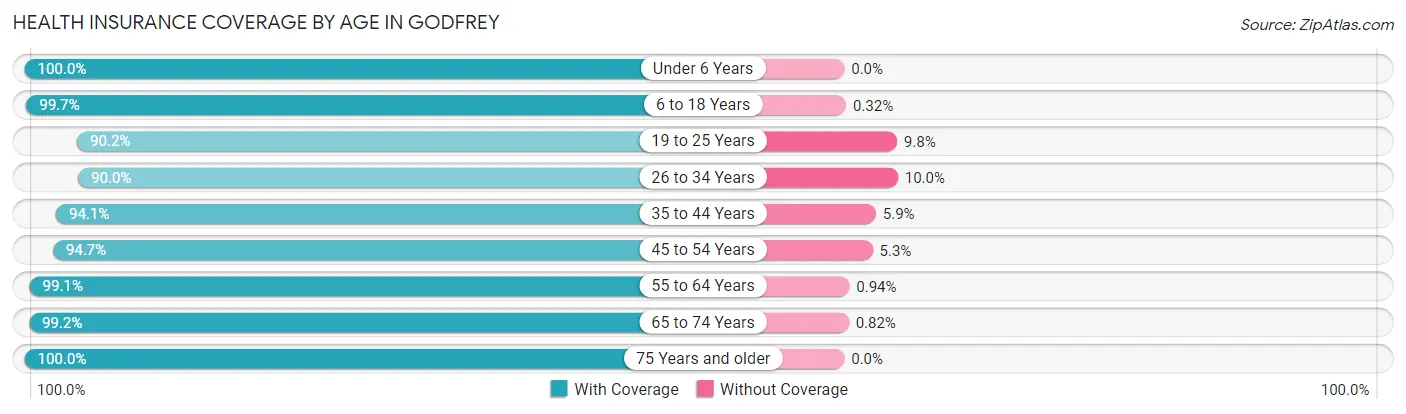
| Age Bracket | With Coverage | Without Coverage |
| Under 6 Years | 922 (100.0%) | 0 (0.0%) |
| 6 to 18 Years | 2,172 (99.7%) | 7 (0.3%) |
| 19 to 25 Years | 1,351 (90.2%) | 147 (9.8%) |
| 26 to 34 Years | 1,436 (90.0%) | 159 (10.0%) |
| 35 to 44 Years | 1,408 (94.1%) | 88 (5.9%) |
| 45 to 54 Years | 2,083 (94.7%) | 116 (5.3%) |
| 55 to 64 Years | 3,048 (99.1%) | 29 (0.9%) |
| 65 to 74 Years | 2,540 (99.2%) | 21 (0.8%) |
| 75 Years and older | 2,172 (100.0%) | 0 (0.0%) |
| Total | 17,132 (96.8%) | 567 (3.2%) |
Health Insurance Coverage by Citizenship Status in Godfrey
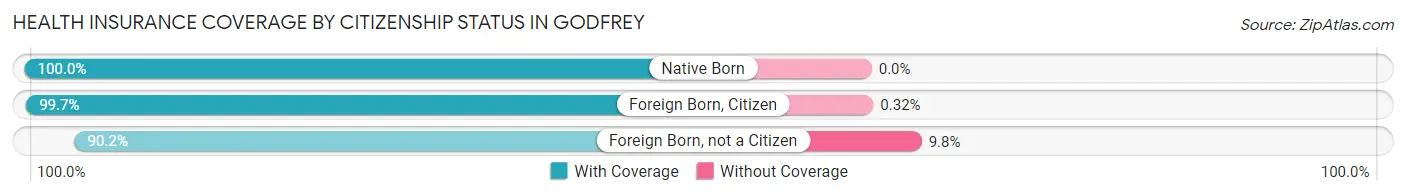
| Citizenship Status | With Coverage | Without Coverage |
| Native Born | 922 (100.0%) | 0 (0.0%) |
| Foreign Born, Citizen | 2,172 (99.7%) | 7 (0.3%) |
| Foreign Born, not a Citizen | 1,351 (90.2%) | 147 (9.8%) |
Health Insurance Coverage by Household Income in Godfrey
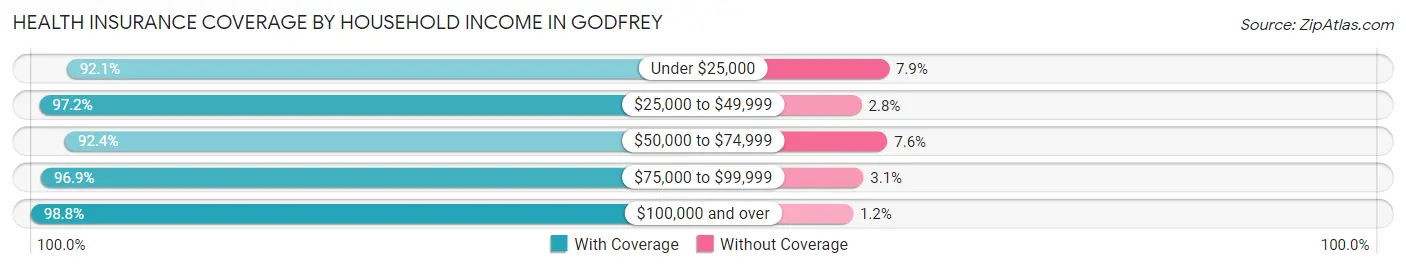
| Household Income | With Coverage | Without Coverage |
| Under $25,000 | 1,131 (92.1%) | 97 (7.9%) |
| $25,000 to $49,999 | 1,582 (97.2%) | 45 (2.8%) |
| $50,000 to $74,999 | 2,838 (92.4%) | 233 (7.6%) |
| $75,000 to $99,999 | 2,877 (96.9%) | 92 (3.1%) |
| $100,000 and over | 8,486 (98.8%) | 100 (1.2%) |
Public vs Private Health Insurance Coverage by Age in Godfrey
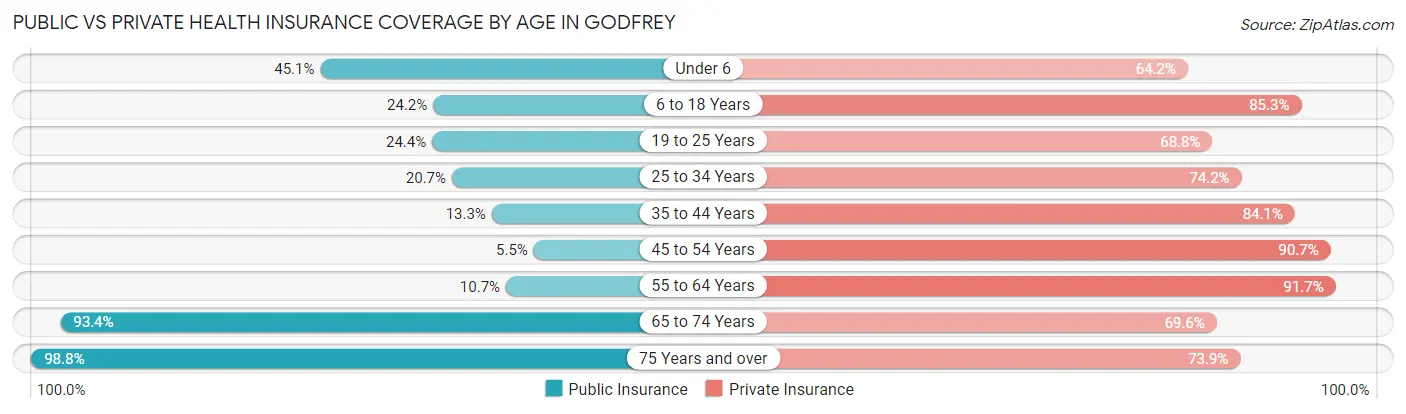
| Age Bracket | Public Insurance | Private Insurance |
| Under 6 | 416 (45.1%) | 592 (64.2%) |
| 6 to 18 Years | 527 (24.2%) | 1,858 (85.3%) |
| 19 to 25 Years | 365 (24.4%) | 1,030 (68.8%) |
| 25 to 34 Years | 330 (20.7%) | 1,183 (74.2%) |
| 35 to 44 Years | 199 (13.3%) | 1,258 (84.1%) |
| 45 to 54 Years | 121 (5.5%) | 1,995 (90.7%) |
| 55 to 64 Years | 328 (10.7%) | 2,820 (91.6%) |
| 65 to 74 Years | 2,391 (93.4%) | 1,782 (69.6%) |
| 75 Years and over | 2,145 (98.8%) | 1,606 (73.9%) |
| Total | 6,822 (38.5%) | 14,124 (79.8%) |
Disability Status by Sex by Age in Godfrey
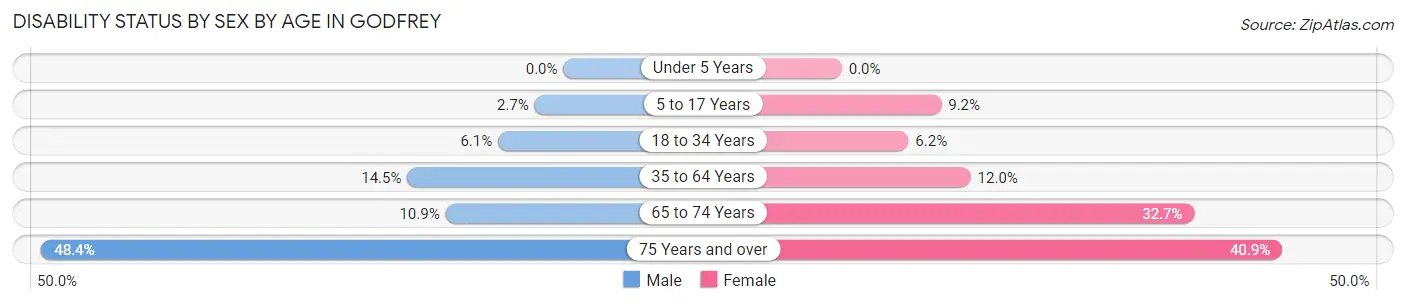
| Age Bracket | Male | Female |
| Under 5 Years | 0 (0.0%) | 0 (0.0%) |
| 5 to 17 Years | 30 (2.7%) | 94 (9.2%) |
| 18 to 34 Years | 101 (6.1%) | 98 (6.2%) |
| 35 to 64 Years | 471 (14.5%) | 421 (12.0%) |
| 65 to 74 Years | 140 (10.9%) | 419 (32.7%) |
| 75 Years and over | 405 (48.4%) | 546 (40.9%) |
Disability Class by Sex by Age in Godfrey
Disability Class: Hearing Difficulty
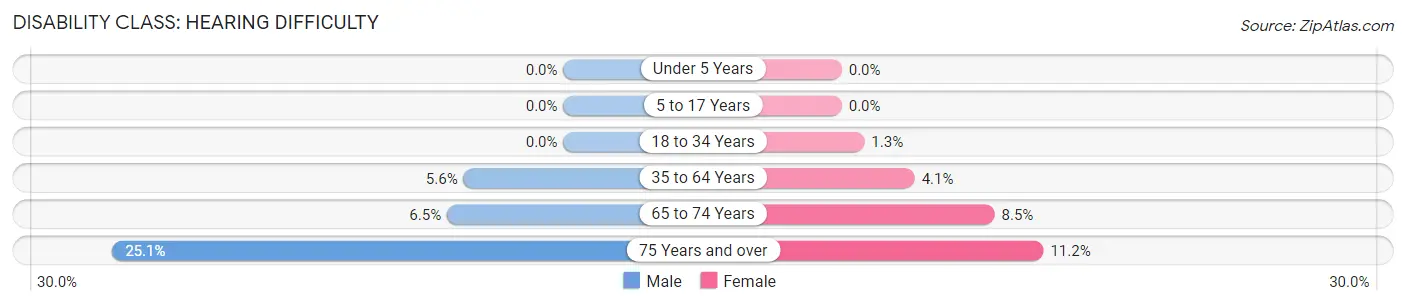
| Age Bracket | Male | Female |
| Under 5 Years | 0 (0.0%) | 0 (0.0%) |
| 5 to 17 Years | 0 (0.0%) | 0 (0.0%) |
| 18 to 34 Years | 0 (0.0%) | 20 (1.3%) |
| 35 to 64 Years | 181 (5.6%) | 143 (4.1%) |
| 65 to 74 Years | 83 (6.5%) | 109 (8.5%) |
| 75 Years and over | 210 (25.1%) | 150 (11.2%) |
Disability Class: Vision Difficulty
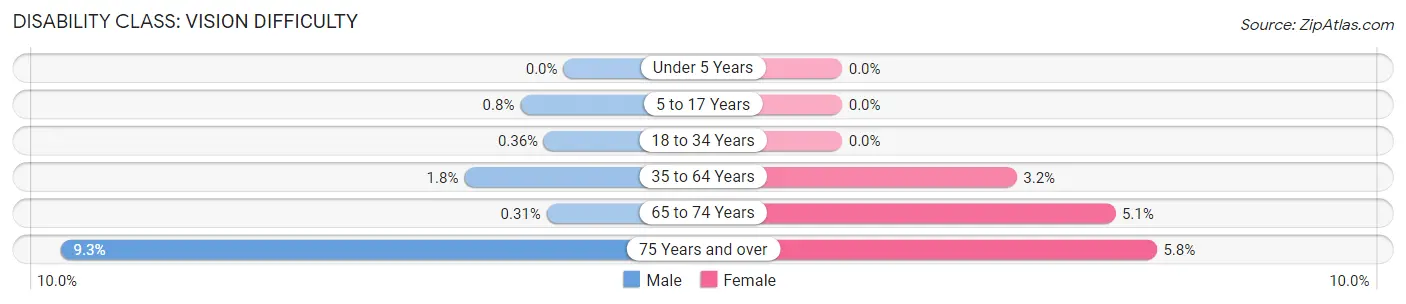
| Age Bracket | Male | Female |
| Under 5 Years | 0 (0.0%) | 0 (0.0%) |
| 5 to 17 Years | 9 (0.8%) | 0 (0.0%) |
| 18 to 34 Years | 6 (0.4%) | 0 (0.0%) |
| 35 to 64 Years | 60 (1.8%) | 114 (3.2%) |
| 65 to 74 Years | 4 (0.3%) | 65 (5.1%) |
| 75 Years and over | 78 (9.3%) | 78 (5.8%) |
Disability Class: Cognitive Difficulty
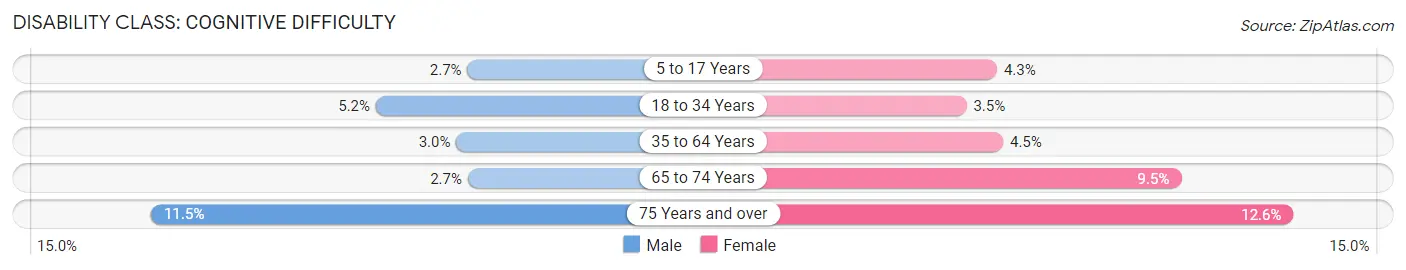
| Age Bracket | Male | Female |
| 5 to 17 Years | 30 (2.7%) | 44 (4.3%) |
| 18 to 34 Years | 87 (5.2%) | 55 (3.5%) |
| 35 to 64 Years | 97 (3.0%) | 158 (4.5%) |
| 65 to 74 Years | 34 (2.7%) | 121 (9.5%) |
| 75 Years and over | 96 (11.5%) | 168 (12.6%) |
Disability Class: Ambulatory Difficulty
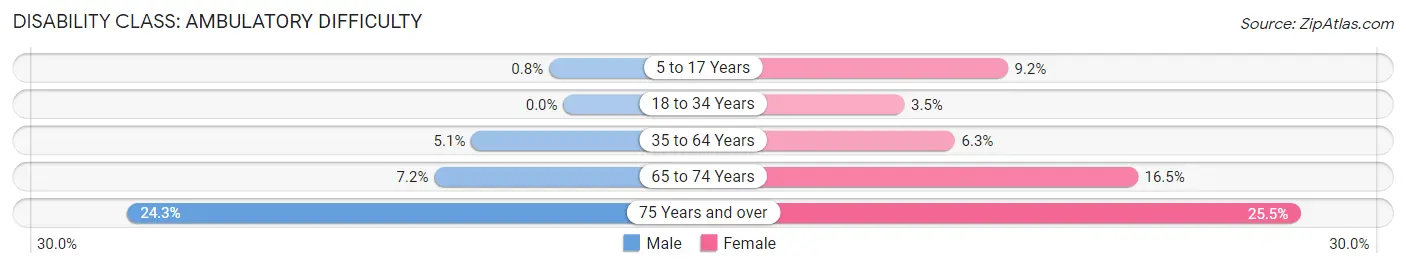
| Age Bracket | Male | Female |
| 5 to 17 Years | 9 (0.8%) | 94 (9.2%) |
| 18 to 34 Years | 0 (0.0%) | 55 (3.5%) |
| 35 to 64 Years | 167 (5.1%) | 221 (6.3%) |
| 65 to 74 Years | 92 (7.2%) | 211 (16.5%) |
| 75 Years and over | 203 (24.3%) | 341 (25.5%) |
Disability Class: Self-Care Difficulty
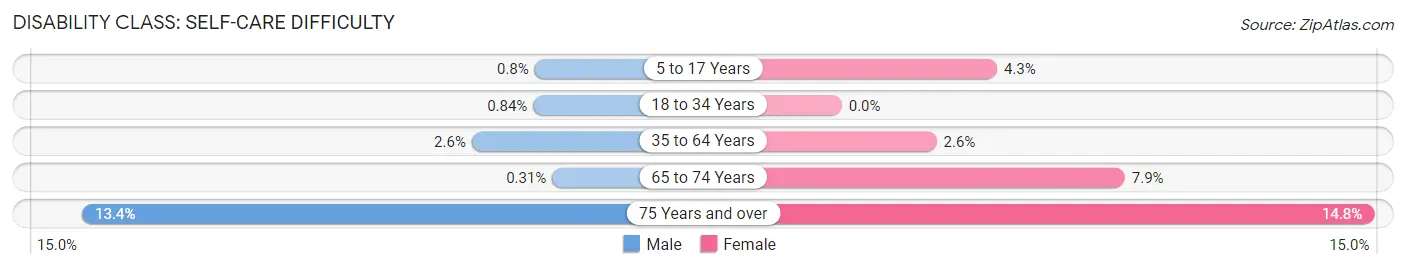
| Age Bracket | Male | Female |
| 5 to 17 Years | 9 (0.8%) | 44 (4.3%) |
| 18 to 34 Years | 14 (0.8%) | 0 (0.0%) |
| 35 to 64 Years | 83 (2.5%) | 93 (2.6%) |
| 65 to 74 Years | 4 (0.3%) | 101 (7.9%) |
| 75 Years and over | 112 (13.4%) | 198 (14.8%) |
Technology Access in Godfrey
Computing Device Access in Godfrey
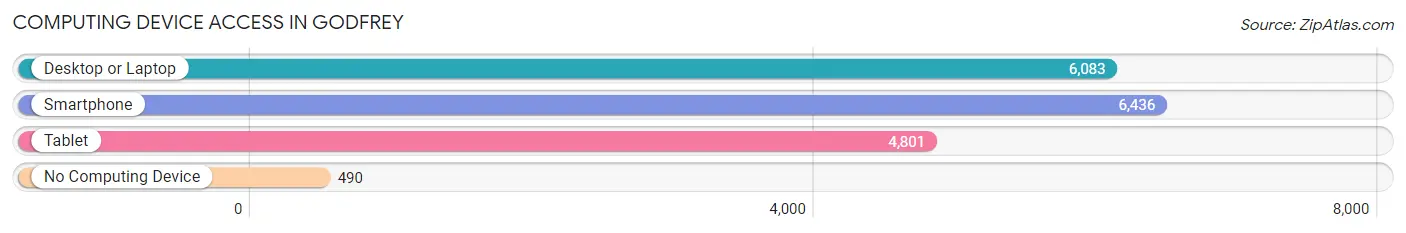
| Device Type | # Households | % Households |
| Desktop or Laptop | 6,083 | 80.7% |
| Smartphone | 6,436 | 85.4% |
| Tablet | 4,801 | 63.7% |
| No Computing Device | 490 | 6.5% |
| Total | 7,536 | 100.0% |
Internet Access in Godfrey
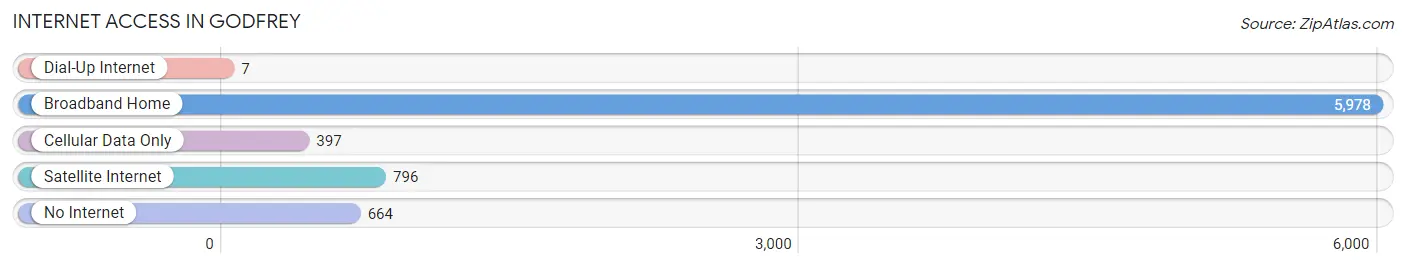
| Internet Type | # Households | % Households |
| Dial-Up Internet | 7 | 0.1% |
| Broadband Home | 5,978 | 79.3% |
| Cellular Data Only | 397 | 5.3% |
| Satellite Internet | 796 | 10.6% |
| No Internet | 664 | 8.8% |
| Total | 7,536 | 100.0% |
Godfrey Summary
Godfrey, Illinois is a village located in Madison County, Illinois, United States. It is part of the Greater St. Louis metropolitan area. The population was 17,982 at the 2010 census.
History
Godfrey was founded in 1818 by Captain Benjamin Godfrey, a Revolutionary War veteran. He purchased the land from the federal government and named the area after himself. The village was incorporated in 1859.
Godfrey was a major stop on the Alton & Sangamon Railroad, which ran from Alton to Springfield, Illinois. The railroad was a major factor in the growth of the village.
Geography
Godfrey is located at 38°56'45" North, 90°10'45" West (38.94583, -90.17917). It is situated on the banks of the Mississippi River, just north of Alton.
The village has a total area of 8.3 square miles, of which 8.2 square miles is land and 0.1 square miles is water.
Economy
Godfrey is home to several businesses, including a number of manufacturing companies. The village is also home to Lewis and Clark Community College, which offers a variety of educational programs.
Godfrey is also home to a number of restaurants, including the Godfrey Steakhouse, which has been in business since the 1950s.
Demographics
As of the 2010 census, there were 17,982 people, 6,945 households, and 4,845 families residing in the village. The population density was 2,190.3 people per square mile. The racial makeup of the village was 94.2% White, 1.7% African American, 0.3% Native American, 0.7% Asian, 0.1% Pacific Islander, 1.3% from other races, and 1.9% from two or more races. Hispanic or Latino of any race were 3.3% of the population.
The median income for a household in the village was $50,945, and the median income for a family was $62,917. The per capita income for the village was $24,945. About 4.2% of families and 6.2% of the population were below the poverty line, including 8.2% of those under age 18 and 4.2% of those age 65 or over.
Godfrey is served by the Alton School District. The village is also home to several private schools, including St. Ambrose Catholic School and St. Mary's Catholic School.
Common Questions
What is Per Capita Income in Godfrey?
Per Capita income in Godfrey is $44,278.
What is the Median Family Income in Godfrey?
Median Family Income in Godfrey is $103,083.
What is the Median Household income in Godfrey?
Median Household Income in Godfrey is $84,920.
What is Income or Wage Gap in Godfrey?
Income or Wage Gap in Godfrey is 24.0%.
Women in Godfrey earn 76.0 cents for every dollar earned by a man.
What is Family Income Deficit in Godfrey?
Family Income Deficit in Godfrey is $8,562.
Families that are below poverty line in Godfrey earn $8,562 less on average than the poverty threshold level.
What is Inequality or Gini Index in Godfrey?
Inequality or Gini Index in Godfrey is 0.39.
What is the Total Population of Godfrey?
Total Population of Godfrey is 17,791.
What is the Total Male Population of Godfrey?
Total Male Population of Godfrey is 8,735.
What is the Total Female Population of Godfrey?
Total Female Population of Godfrey is 9,056.
What is the Ratio of Males per 100 Females in Godfrey?
There are 96.46 Males per 100 Females in Godfrey.
What is the Ratio of Females per 100 Males in Godfrey?
There are 103.67 Females per 100 Males in Godfrey.
What is the Median Population Age in Godfrey?
Median Population Age in Godfrey is 50.5 Years.
What is the Average Family Size in Godfrey
Average Family Size in Godfrey is 2.8 People.
What is the Average Household Size in Godfrey
Average Household Size in Godfrey is 2.3 People.
How Large is the Labor Force in Godfrey?
There are 9,482 People in the Labor Forcein in Godfrey.
What is the Percentage of People in the Labor Force in Godfrey?
62.4% of People are in the Labor Force in Godfrey.
What is the Unemployment Rate in Godfrey?
Unemployment Rate in Godfrey is 3.7%.