Farmington, IL Map & Demographics
Farmington Map
Farmington Overview
$30,057
PER CAPITA INCOME
$64,861
AVG FAMILY INCOME
$59,091
AVG HOUSEHOLD INCOME
25.1%
WAGE / INCOME GAP [ % ]
74.9¢/ $1
WAGE / INCOME GAP [ $ ]
0.39
INEQUALITY / GINI INDEX
2,097
TOTAL POPULATION
1,046
MALE POPULATION
1,051
FEMALE POPULATION
99.52
MALES / 100 FEMALES
100.48
FEMALES / 100 MALES
36.7
MEDIAN AGE
2.9
AVG FAMILY SIZE
2.3
AVG HOUSEHOLD SIZE
1,117
LABOR FORCE [ PEOPLE ]
68.8%
PERCENT IN LABOR FORCE
8.4%
UNEMPLOYMENT RATE
Farmington Zip Codes
Farmington Area Codes
Income in Farmington
Income Overview in Farmington
Per Capita Income in Farmington is $30,057, while median incomes of families and households are $64,861 and $59,091 respectively.
| Characteristic | Number | Measure |
| Per Capita Income | 2,097 | $30,057 |
| Median Family Income | 591 | $64,861 |
| Mean Family Income | 591 | $80,928 |
| Median Household Income | 898 | $59,091 |
| Mean Household Income | 898 | $69,619 |
| Income Deficit | 591 | $0 |
| Wage / Income Gap (%) | 2,097 | 25.13% |
| Wage / Income Gap ($) | 2,097 | 74.87¢ per $1 |
| Gini / Inequality Index | 2,097 | 0.39 |
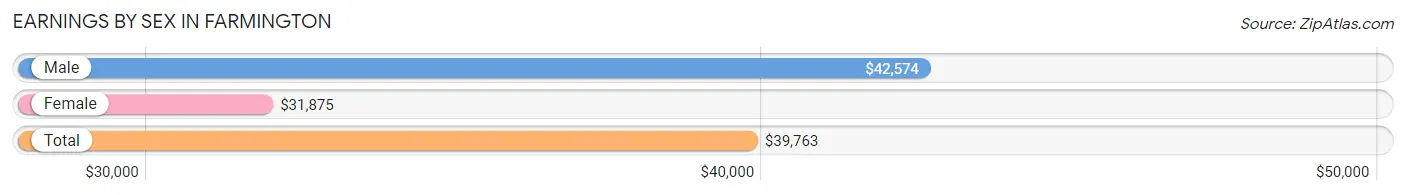
Earnings by Sex in Farmington
Average Earnings in Farmington are $39,763, $42,574 for men and $31,875 for women, a difference of 25.1%.
| Sex | Number | Average Earnings |
| Male | 617 (56.0%) | $42,574 |
| Female | 484 (44.0%) | $31,875 |
| Total | 1,101 (100.0%) | $39,763 |
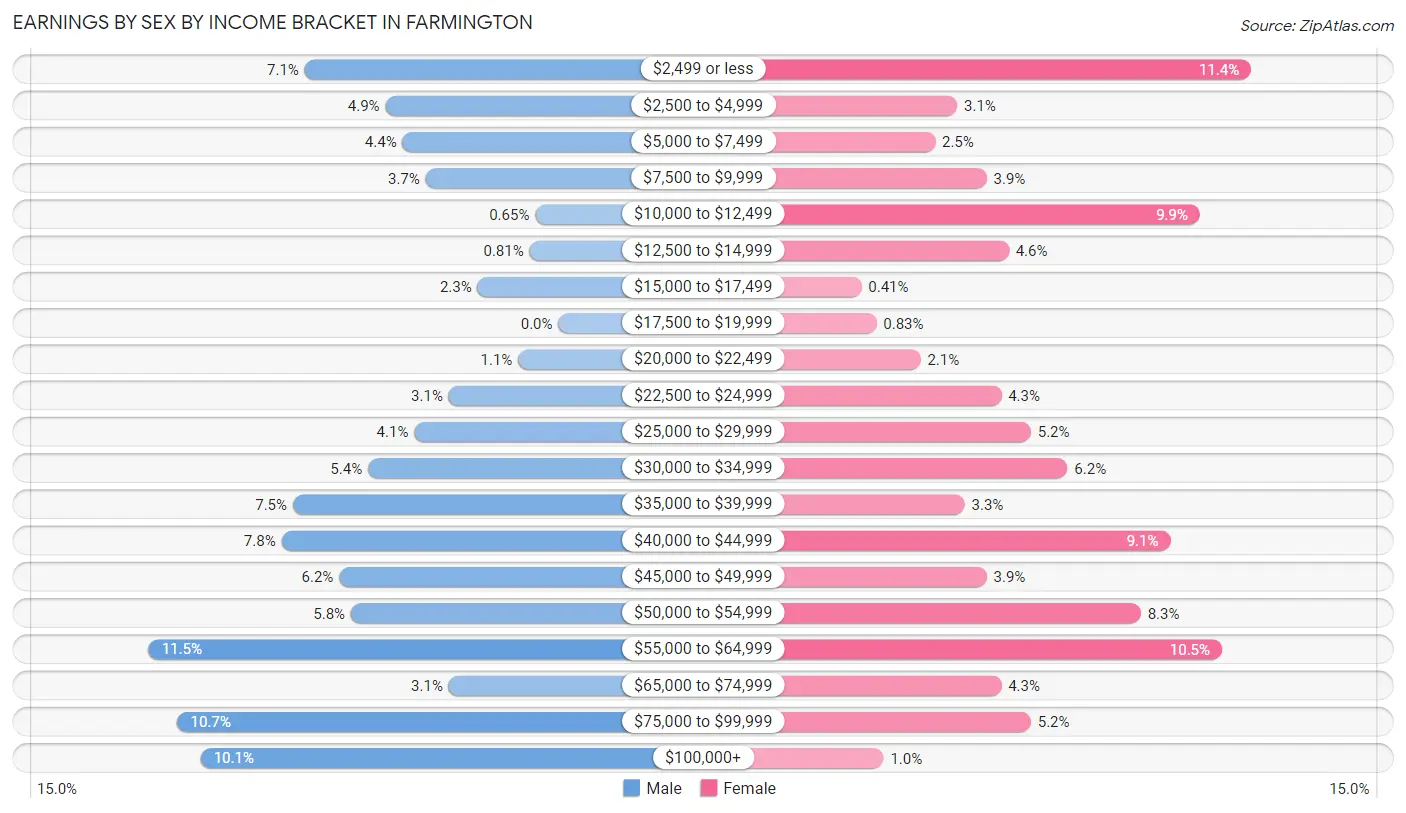
Earnings by Sex by Income Bracket in Farmington
The most common earnings brackets in Farmington are $55,000 to $64,999 for men (71 | 11.5%) and $2,499 or less for women (55 | 11.4%).
| Income | Male | Female |
| $2,499 or less | 44 (7.1%) | 55 (11.4%) |
| $2,500 to $4,999 | 30 (4.9%) | 15 (3.1%) |
| $5,000 to $7,499 | 27 (4.4%) | 12 (2.5%) |
| $7,500 to $9,999 | 23 (3.7%) | 19 (3.9%) |
| $10,000 to $12,499 | 4 (0.6%) | 48 (9.9%) |
| $12,500 to $14,999 | 5 (0.8%) | 22 (4.5%) |
| $15,000 to $17,499 | 14 (2.3%) | 2 (0.4%) |
| $17,500 to $19,999 | 0 (0.0%) | 4 (0.8%) |
| $20,000 to $22,499 | 7 (1.1%) | 10 (2.1%) |
| $22,500 to $24,999 | 19 (3.1%) | 21 (4.3%) |
| $25,000 to $29,999 | 25 (4.1%) | 25 (5.2%) |
| $30,000 to $34,999 | 33 (5.3%) | 30 (6.2%) |
| $35,000 to $39,999 | 46 (7.5%) | 16 (3.3%) |
| $40,000 to $44,999 | 48 (7.8%) | 44 (9.1%) |
| $45,000 to $49,999 | 38 (6.2%) | 19 (3.9%) |
| $50,000 to $54,999 | 36 (5.8%) | 40 (8.3%) |
| $55,000 to $64,999 | 71 (11.5%) | 51 (10.5%) |
| $65,000 to $74,999 | 19 (3.1%) | 21 (4.3%) |
| $75,000 to $99,999 | 66 (10.7%) | 25 (5.2%) |
| $100,000+ | 62 (10.1%) | 5 (1.0%) |
| Total | 617 (100.0%) | 484 (100.0%) |
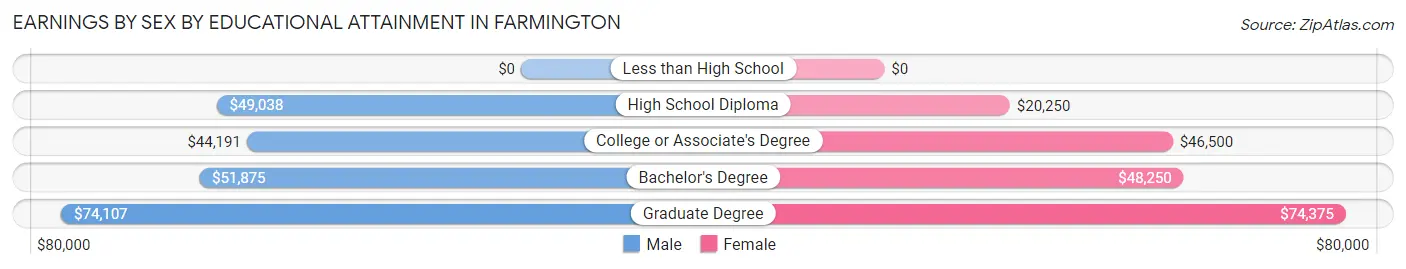
Earnings by Sex by Educational Attainment in Farmington
Average earnings in Farmington are $49,276 for men and $40,729 for women, a difference of 17.3%. Men with an educational attainment of graduate degree enjoy the highest average annual earnings of $74,107, while those with college or associate's degree education earn the least with $44,191. Women with an educational attainment of graduate degree earn the most with the average annual earnings of $74,375, while those with high school diploma education have the smallest earnings of $20,250.
| Educational Attainment | Male Income | Female Income |
| Less than High School | - | - |
| High School Diploma | $49,038 | $20,250 |
| College or Associate's Degree | $44,191 | $46,500 |
| Bachelor's Degree | $51,875 | $48,250 |
| Graduate Degree | $74,107 | $74,375 |
| Total | $49,276 | $40,729 |
Family Income in Farmington
Family Income Brackets in Farmington
According to the Farmington family income data, there are 206 families falling into the $50,000 to $74,999 income range, which is the most common income bracket and makes up 34.9% of all families.
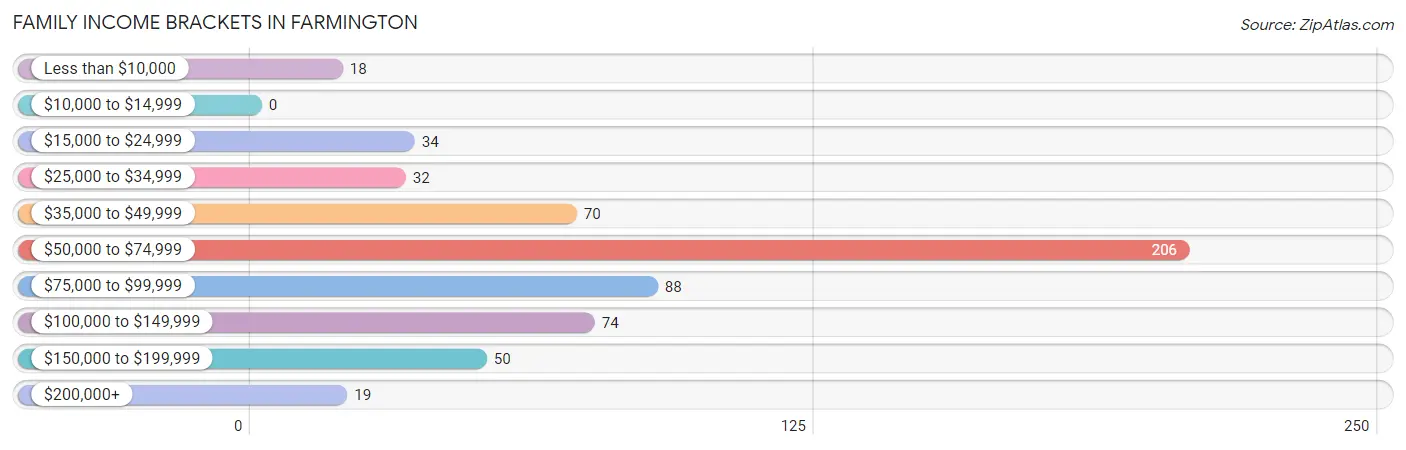
| Income Bracket | # Families | % Families |
| Less than $10,000 | 18 | 3.0% |
| $10,000 to $14,999 | 0 | 0.0% |
| $15,000 to $24,999 | 34 | 5.8% |
| $25,000 to $34,999 | 32 | 5.4% |
| $35,000 to $49,999 | 70 | 11.8% |
| $50,000 to $74,999 | 206 | 34.9% |
| $75,000 to $99,999 | 88 | 14.9% |
| $100,000 to $149,999 | 74 | 12.5% |
| $150,000 to $199,999 | 50 | 8.5% |
| $200,000+ | 19 | 3.2% |
Family Income by Famaliy Size in Farmington
6-person families (24 | 4.1%) account for the highest median family income in Farmington with $113,125 per family, while 2-person families (321 | 54.3%) have the highest median income of $29,186 per family member.
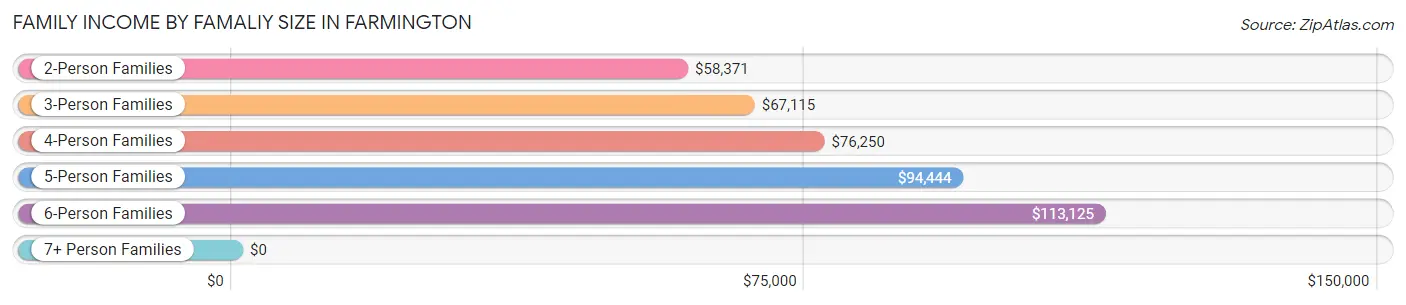
| Income Bracket | # Families | Median Income |
| 2-Person Families | 321 (54.3%) | $58,371 |
| 3-Person Families | 128 (21.7%) | $67,115 |
| 4-Person Families | 54 (9.1%) | $76,250 |
| 5-Person Families | 52 (8.8%) | $94,444 |
| 6-Person Families | 24 (4.1%) | $113,125 |
| 7+ Person Families | 12 (2.0%) | $0 |
| Total | 591 (100.0%) | $64,861 |
Family Income by Number of Earners in Farmington
The median family income in Farmington is $64,861, with families comprising 3+ earners (46) having the highest median family income of $154,000, while families with no earners (67) have the lowest median family income of $51,250, accounting for 7.8% and 11.3% of families, respectively.
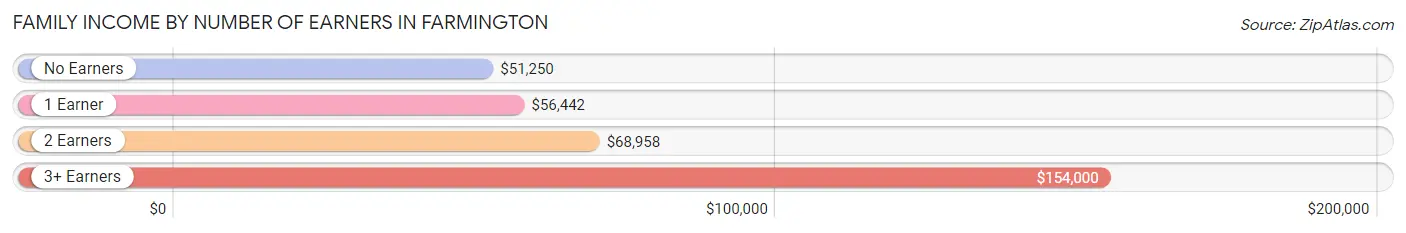
| Number of Earners | # Families | Median Income |
| No Earners | 67 (11.3%) | $51,250 |
| 1 Earner | 234 (39.6%) | $56,442 |
| 2 Earners | 244 (41.3%) | $68,958 |
| 3+ Earners | 46 (7.8%) | $154,000 |
| Total | 591 (100.0%) | $64,861 |
Household Income in Farmington
Household Income Brackets in Farmington
With 273 households falling in the category, the $50,000 to $74,999 income range is the most frequent in Farmington, accounting for 30.4% of all households. In contrast, only 14 households (1.6%) fall into the $10,000 to $14,999 income bracket, making it the least populous group.
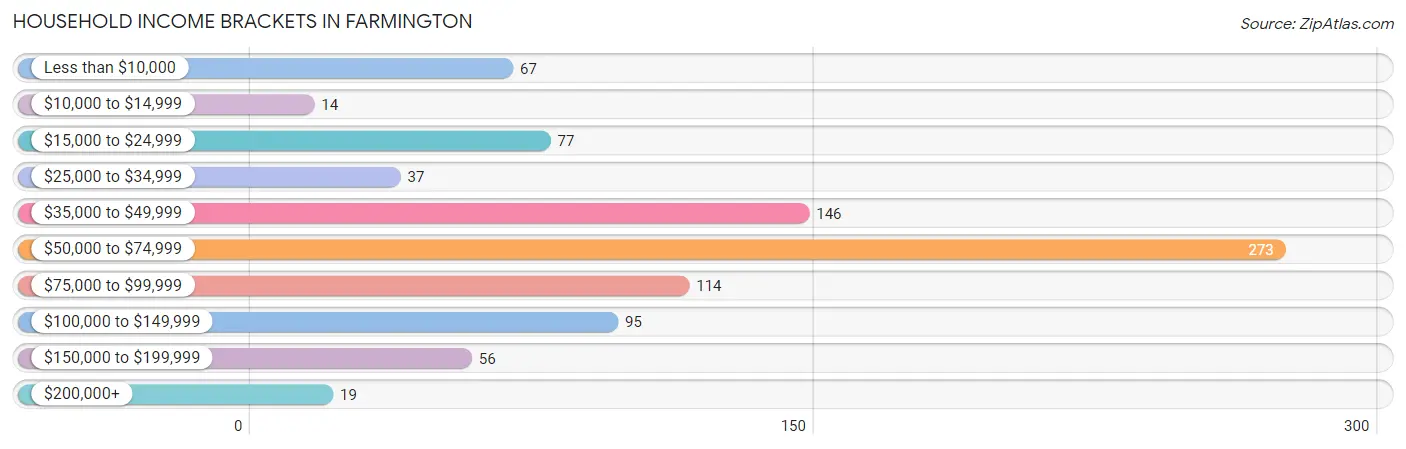
| Income Bracket | # Households | % Households |
| Less than $10,000 | 67 | 7.5% |
| $10,000 to $14,999 | 14 | 1.6% |
| $15,000 to $24,999 | 77 | 8.6% |
| $25,000 to $34,999 | 37 | 4.1% |
| $35,000 to $49,999 | 146 | 16.3% |
| $50,000 to $74,999 | 273 | 30.4% |
| $75,000 to $99,999 | 114 | 12.7% |
| $100,000 to $149,999 | 95 | 10.6% |
| $150,000 to $199,999 | 56 | 6.2% |
| $200,000+ | 19 | 2.1% |
Household Income by Householder Age in Farmington
The median household income in Farmington is $59,091, with the highest median household income of $61,250 found in the 25 to 44 years age bracket for the primary householder. A total of 348 households (38.8%) fall into this category. Meanwhile, the 15 to 24 years age bracket for the primary householder has the lowest median household income of $36,125, with 25 households (2.8%) in this group.
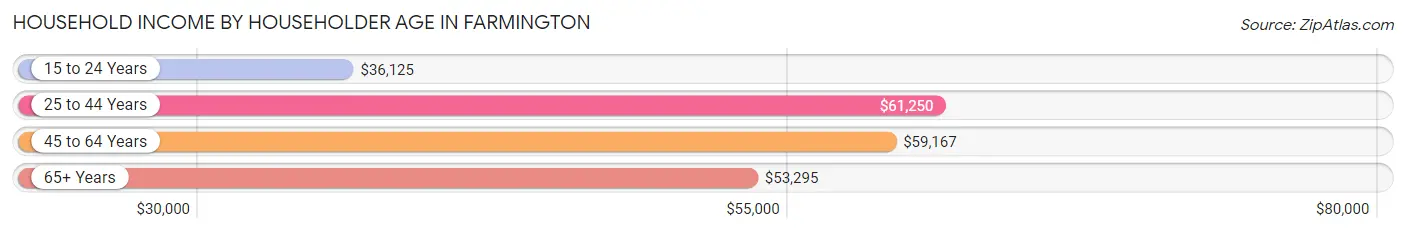
| Income Bracket | # Households | Median Income |
| 15 to 24 Years | 25 (2.8%) | $36,125 |
| 25 to 44 Years | 348 (38.8%) | $61,250 |
| 45 to 64 Years | 306 (34.1%) | $59,167 |
| 65+ Years | 219 (24.4%) | $53,295 |
| Total | 898 (100.0%) | $59,091 |
Poverty in Farmington
Income Below Poverty by Sex and Age in Farmington
With 7.5% poverty level for males and 11.6% for females among the residents of Farmington, 45 to 54 year old males and 75 year old and over females are the most vulnerable to poverty, with 28 males (28.9%) and 17 females (22.4%) in their respective age groups living below the poverty level.
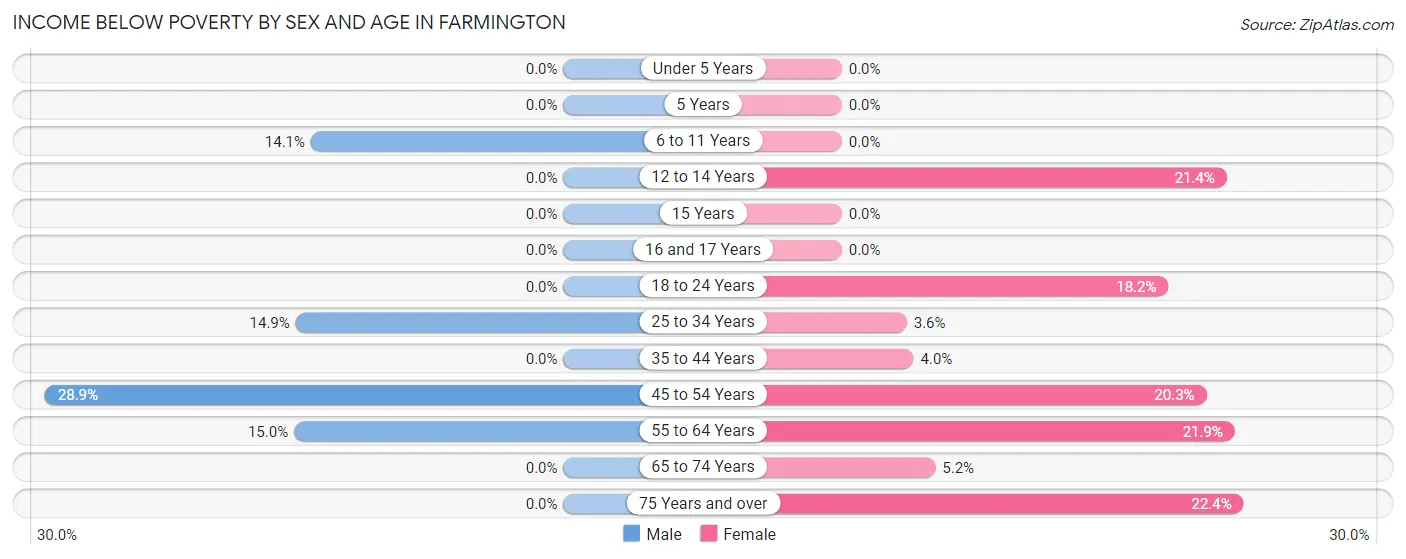
| Age Bracket | Male | Female |
| Under 5 Years | 0 (0.0%) | 0 (0.0%) |
| 5 Years | 0 (0.0%) | 0 (0.0%) |
| 6 to 11 Years | 9 (14.1%) | 0 (0.0%) |
| 12 to 14 Years | 0 (0.0%) | 18 (21.4%) |
| 15 Years | 0 (0.0%) | 0 (0.0%) |
| 16 and 17 Years | 0 (0.0%) | 0 (0.0%) |
| 18 to 24 Years | 0 (0.0%) | 16 (18.2%) |
| 25 to 34 Years | 24 (14.9%) | 5 (3.6%) |
| 35 to 44 Years | 0 (0.0%) | 4 (4.0%) |
| 45 to 54 Years | 28 (28.9%) | 27 (20.3%) |
| 55 to 64 Years | 18 (15.0%) | 28 (21.9%) |
| 65 to 74 Years | 0 (0.0%) | 5 (5.2%) |
| 75 Years and over | 0 (0.0%) | 17 (22.4%) |
| Total | 79 (7.5%) | 120 (11.6%) |
Income Above Poverty by Sex and Age in Farmington
According to the poverty statistics in Farmington, males aged under 5 years and females aged under 5 years are the age groups that are most secure financially, with 100.0% of males and 100.0% of females in these age groups living above the poverty line.
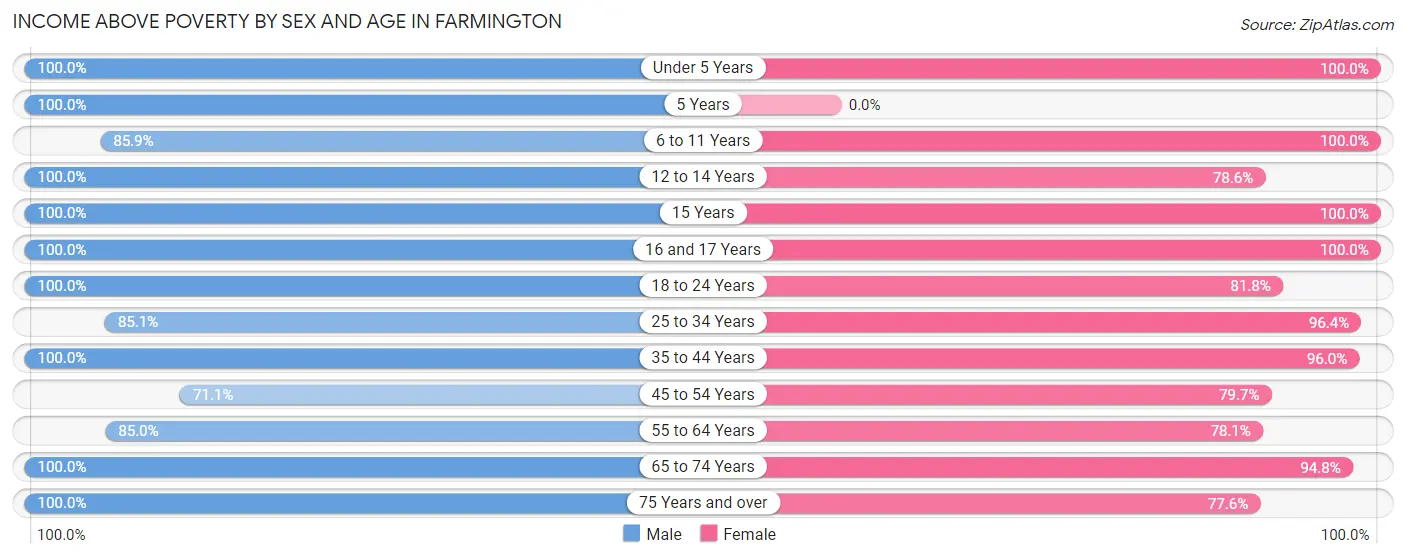
| Age Bracket | Male | Female |
| Under 5 Years | 36 (100.0%) | 77 (100.0%) |
| 5 Years | 8 (100.0%) | 0 (0.0%) |
| 6 to 11 Years | 55 (85.9%) | 55 (100.0%) |
| 12 to 14 Years | 95 (100.0%) | 66 (78.6%) |
| 15 Years | 12 (100.0%) | 27 (100.0%) |
| 16 and 17 Years | 49 (100.0%) | 33 (100.0%) |
| 18 to 24 Years | 79 (100.0%) | 72 (81.8%) |
| 25 to 34 Years | 137 (85.1%) | 133 (96.4%) |
| 35 to 44 Years | 170 (100.0%) | 96 (96.0%) |
| 45 to 54 Years | 69 (71.1%) | 106 (79.7%) |
| 55 to 64 Years | 102 (85.0%) | 100 (78.1%) |
| 65 to 74 Years | 77 (100.0%) | 91 (94.8%) |
| 75 Years and over | 78 (100.0%) | 59 (77.6%) |
| Total | 967 (92.4%) | 915 (88.4%) |
Income Below Poverty Among Married-Couple Families in Farmington
The poverty statistics for married-couple families in Farmington show that 7.8% or 32 of the total 412 families live below the poverty line. Families with 1 or 2 children have the highest poverty rate of 12.7%, comprising of 15 families. On the other hand, families with 3 or 4 children have the lowest poverty rate of 0.0%, which includes 0 families.
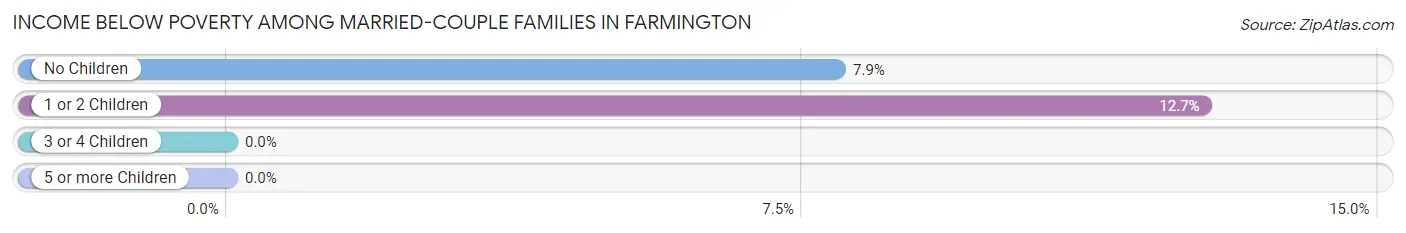
| Children | Above Poverty | Below Poverty |
| No Children | 197 (92.1%) | 17 (7.9%) |
| 1 or 2 Children | 103 (87.3%) | 15 (12.7%) |
| 3 or 4 Children | 80 (100.0%) | 0 (0.0%) |
| 5 or more Children | 0 (0.0%) | 0 (0.0%) |
| Total | 380 (92.2%) | 32 (7.8%) |
Income Below Poverty Among Single-Parent Households in Farmington
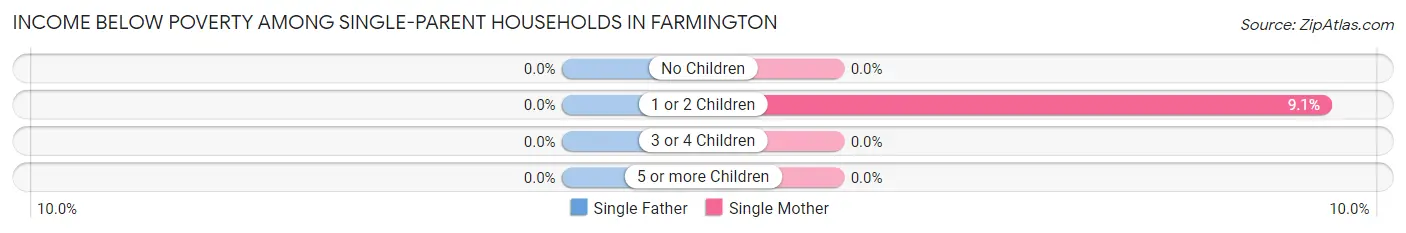
| Children | Single Father | Single Mother |
| No Children | 0 (0.0%) | 0 (0.0%) |
| 1 or 2 Children | 0 (0.0%) | 5 (9.1%) |
| 3 or 4 Children | 0 (0.0%) | 0 (0.0%) |
| 5 or more Children | 0 (0.0%) | 0 (0.0%) |
| Total | 0 (0.0%) | 5 (4.3%) |
Income Below Poverty Among Married-Couple vs Single-Parent Households in Farmington
The poverty data for Farmington shows that 32 of the married-couple family households (7.8%) and 5 of the single-parent households (2.8%) are living below the poverty level. Within the married-couple family households, those with 1 or 2 children have the highest poverty rate, with 15 households (12.7%) falling below the poverty line. Among the single-parent households, those with 1 or 2 children have the highest poverty rate, with 5 household (5.3%) living below poverty.
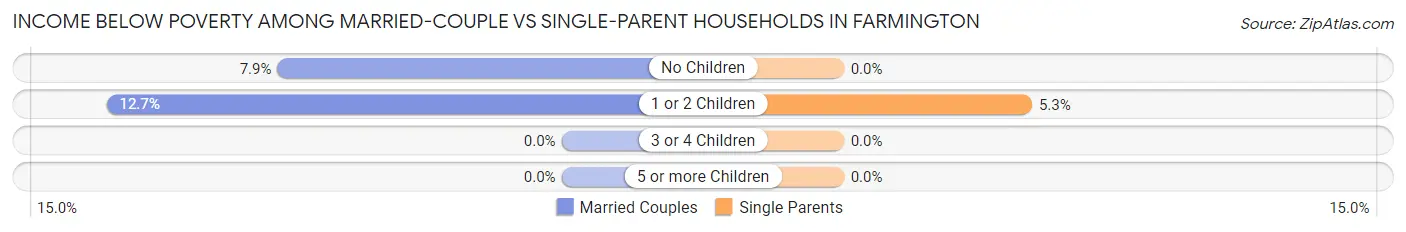
| Children | Married-Couple Families | Single-Parent Households |
| No Children | 17 (7.9%) | 0 (0.0%) |
| 1 or 2 Children | 15 (12.7%) | 5 (5.3%) |
| 3 or 4 Children | 0 (0.0%) | 0 (0.0%) |
| 5 or more Children | 0 (0.0%) | 0 (0.0%) |
| Total | 32 (7.8%) | 5 (2.8%) |
Race in Farmington
The most populous races in Farmington are White / Caucasian (2,020 | 96.3%), Hispanic or Latino (88 | 4.2%), and Some other Race (39 | 1.9%).
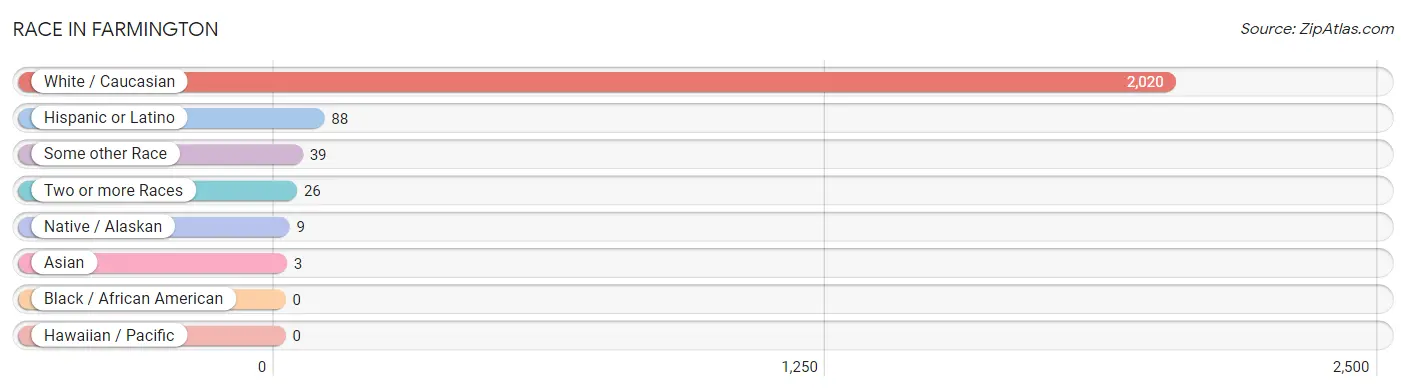
| Race | # Population | % Population |
| Asian | 3 | 0.1% |
| Black / African American | 0 | 0.0% |
| Hawaiian / Pacific | 0 | 0.0% |
| Hispanic or Latino | 88 | 4.2% |
| Native / Alaskan | 9 | 0.4% |
| White / Caucasian | 2,020 | 96.3% |
| Two or more Races | 26 | 1.2% |
| Some other Race | 39 | 1.9% |
| Total | 2,097 | 100.0% |
Ancestry in Farmington
The most populous ancestries reported in Farmington are German (455 | 21.7%), English (352 | 16.8%), Italian (207 | 9.9%), Irish (186 | 8.9%), and American (182 | 8.7%), together accounting for 65.9% of all Farmington residents.
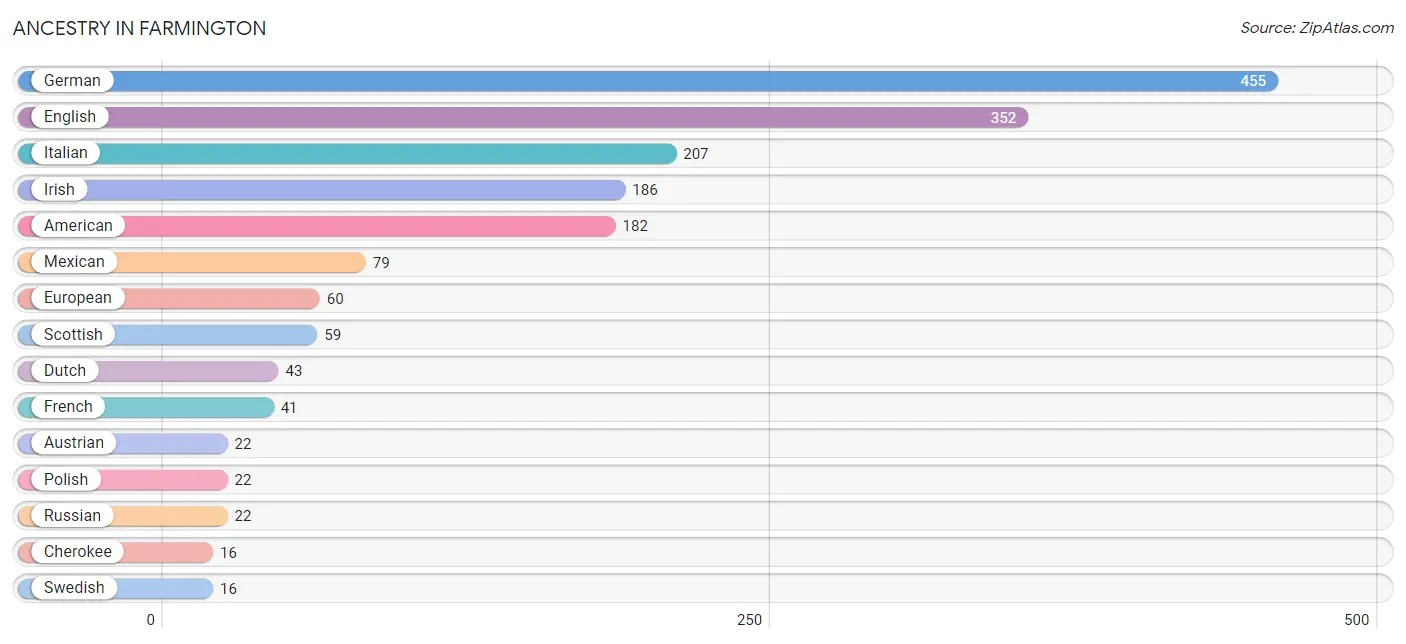
| Ancestry | # Population | % Population |
| American | 182 | 8.7% |
| Austrian | 22 | 1.1% |
| Bhutanese | 3 | 0.1% |
| British | 13 | 0.6% |
| Cherokee | 16 | 0.8% |
| Czech | 4 | 0.2% |
| Dutch | 43 | 2.1% |
| Eastern European | 3 | 0.1% |
| English | 352 | 16.8% |
| European | 60 | 2.9% |
| French | 41 | 2.0% |
| German | 455 | 21.7% |
| Irish | 186 | 8.9% |
| Italian | 207 | 9.9% |
| Mexican | 79 | 3.8% |
| Norwegian | 11 | 0.5% |
| Paraguayan | 5 | 0.2% |
| Polish | 22 | 1.1% |
| Pueblo | 9 | 0.4% |
| Russian | 22 | 1.1% |
| Scotch-Irish | 4 | 0.2% |
| Scottish | 59 | 2.8% |
| Slovak | 4 | 0.2% |
| South American | 5 | 0.2% |
| Swedish | 16 | 0.8% |
| Swiss | 13 | 0.6% |
| Welsh | 11 | 0.5% | View All 27 Rows |
Immigrants in Farmington
The most numerous immigrant groups reported in Farmington came from Latin America (11 | 0.5%), Central America (8 | 0.4%), Mexico (8 | 0.4%), Europe (5 | 0.2%), and Germany (5 | 0.2%), together accounting for 1.8% of all Farmington residents.
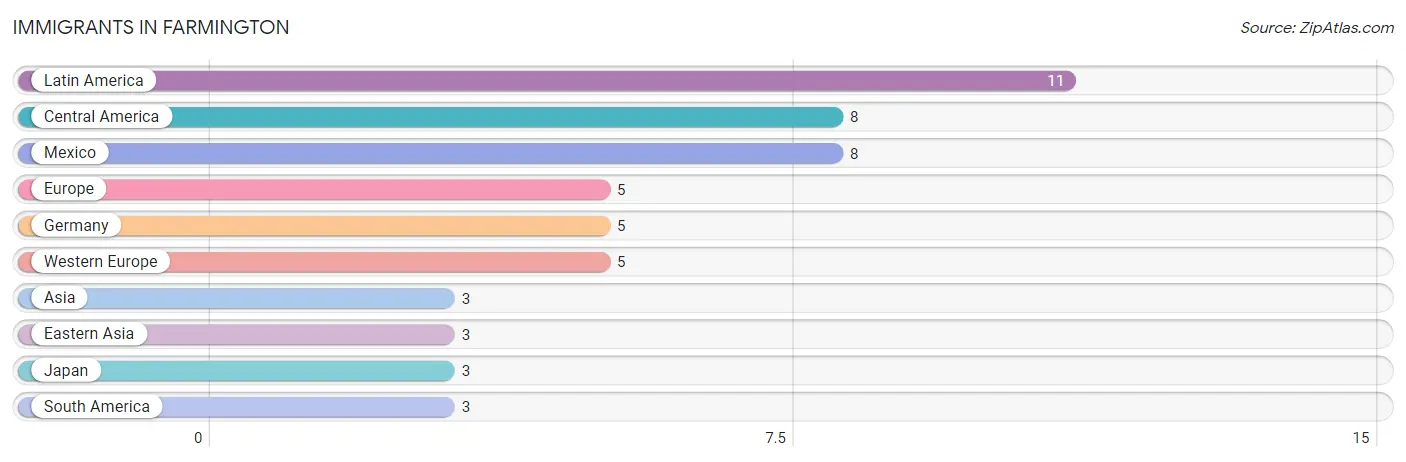
| Immigration Origin | # Population | % Population |
| Asia | 3 | 0.1% |
| Central America | 8 | 0.4% |
| Eastern Asia | 3 | 0.1% |
| Europe | 5 | 0.2% |
| Germany | 5 | 0.2% |
| Japan | 3 | 0.1% |
| Latin America | 11 | 0.5% |
| Mexico | 8 | 0.4% |
| South America | 3 | 0.1% |
| Western Europe | 5 | 0.2% | View All 10 Rows |
Sex and Age in Farmington
Sex and Age in Farmington
The most populous age groups in Farmington are 10 to 14 Years (120 | 11.5%) for men and 10 to 14 Years (101 | 9.6%) for women.
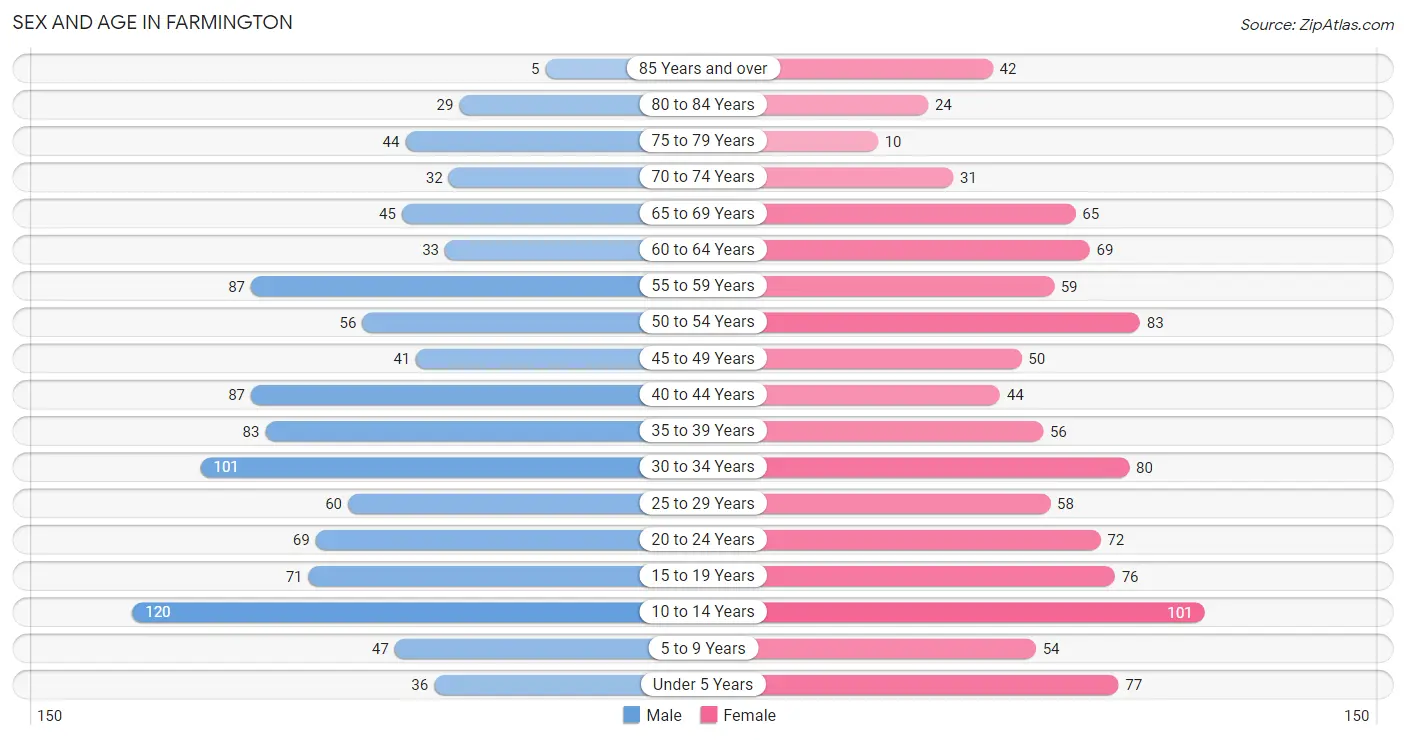
| Age Bracket | Male | Female |
| Under 5 Years | 36 (3.4%) | 77 (7.3%) |
| 5 to 9 Years | 47 (4.5%) | 54 (5.1%) |
| 10 to 14 Years | 120 (11.5%) | 101 (9.6%) |
| 15 to 19 Years | 71 (6.8%) | 76 (7.2%) |
| 20 to 24 Years | 69 (6.6%) | 72 (6.9%) |
| 25 to 29 Years | 60 (5.7%) | 58 (5.5%) |
| 30 to 34 Years | 101 (9.7%) | 80 (7.6%) |
| 35 to 39 Years | 83 (7.9%) | 56 (5.3%) |
| 40 to 44 Years | 87 (8.3%) | 44 (4.2%) |
| 45 to 49 Years | 41 (3.9%) | 50 (4.8%) |
| 50 to 54 Years | 56 (5.3%) | 83 (7.9%) |
| 55 to 59 Years | 87 (8.3%) | 59 (5.6%) |
| 60 to 64 Years | 33 (3.2%) | 69 (6.6%) |
| 65 to 69 Years | 45 (4.3%) | 65 (6.2%) |
| 70 to 74 Years | 32 (3.1%) | 31 (2.9%) |
| 75 to 79 Years | 44 (4.2%) | 10 (0.9%) |
| 80 to 84 Years | 29 (2.8%) | 24 (2.3%) |
| 85 Years and over | 5 (0.5%) | 42 (4.0%) |
| Total | 1,046 (100.0%) | 1,051 (100.0%) |
Families and Households in Farmington
Median Family Size in Farmington
The median family size in Farmington is 2.88 persons per family, with married-couple families (412 | 69.7%) accounting for the largest median family size of 3.07 persons per family. On the other hand, single male/father families (64 | 10.8%) represent the smallest median family size with 2.17 persons per family.
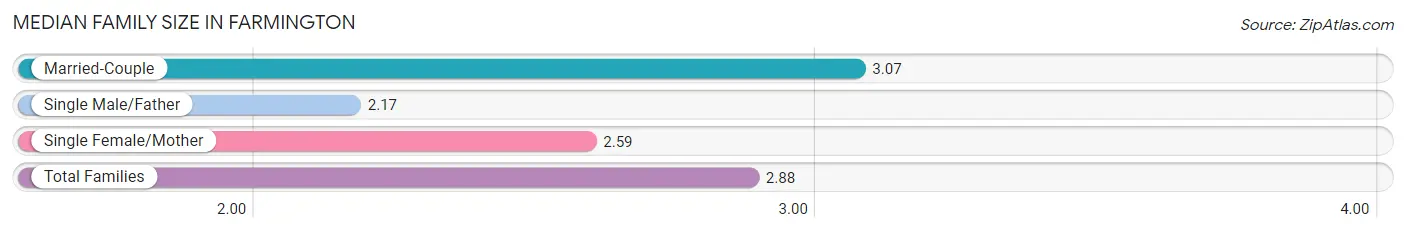
| Family Type | # Families | Family Size |
| Married-Couple | 412 (69.7%) | 3.07 |
| Single Male/Father | 64 (10.8%) | 2.17 |
| Single Female/Mother | 115 (19.5%) | 2.59 |
| Total Families | 591 (100.0%) | 2.88 |
Median Household Size in Farmington
The median household size in Farmington is 2.34 persons per household, with married-couple households (412 | 45.9%) accounting for the largest median household size of 3.1 persons per household. non-family households (307 | 34.2%) represent the smallest median household size with 1.12 persons per household.
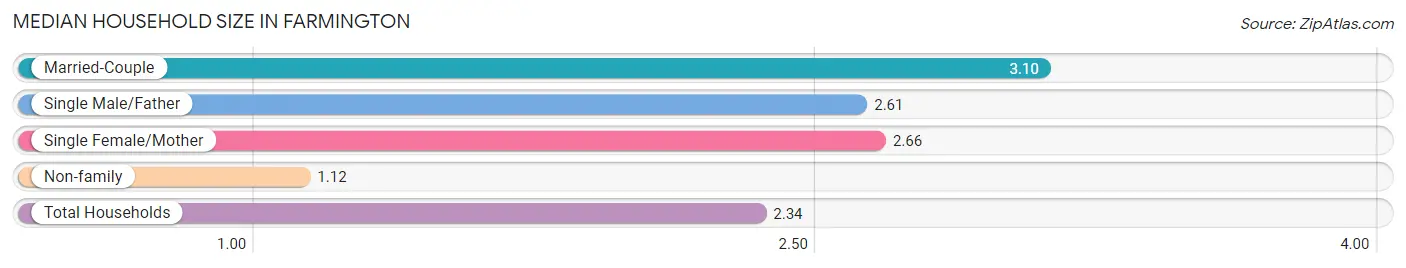
| Household Type | # Households | Household Size |
| Married-Couple | 412 (45.9%) | 3.10 |
| Single Male/Father | 64 (7.1%) | 2.61 |
| Single Female/Mother | 115 (12.8%) | 2.66 |
| Non-family | 307 (34.2%) | 1.12 |
| Total Households | 898 (100.0%) | 2.34 |
Household Size by Marriage Status in Farmington
Out of a total of 898 households in Farmington, 591 (65.8%) are family households, while 307 (34.2%) are nonfamily households. The most numerous type of family households are 2-person households, comprising 305, and the most common type of nonfamily households are 1-person households, comprising 269.
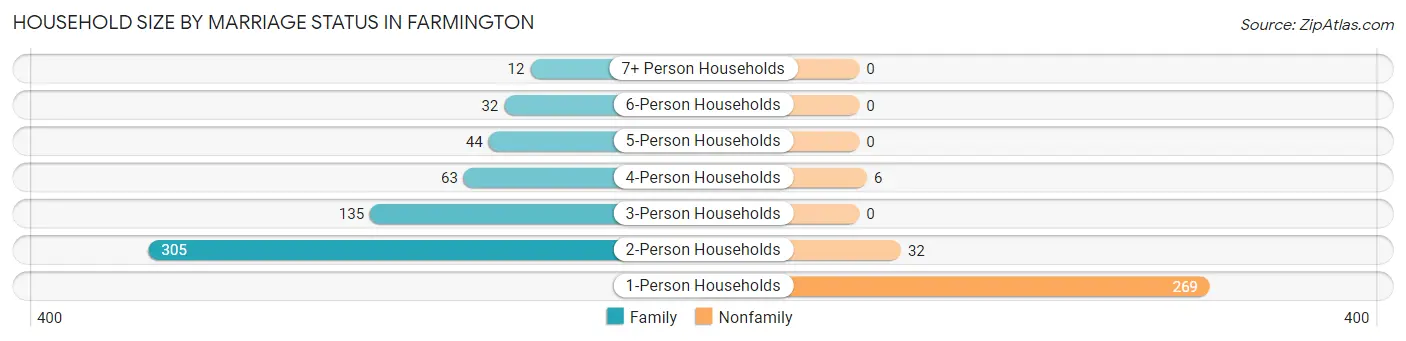
| Household Size | Family Households | Nonfamily Households |
| 1-Person Households | - | 269 (30.0%) |
| 2-Person Households | 305 (34.0%) | 32 (3.6%) |
| 3-Person Households | 135 (15.0%) | 0 (0.0%) |
| 4-Person Households | 63 (7.0%) | 6 (0.7%) |
| 5-Person Households | 44 (4.9%) | 0 (0.0%) |
| 6-Person Households | 32 (3.6%) | 0 (0.0%) |
| 7+ Person Households | 12 (1.3%) | 0 (0.0%) |
| Total | 591 (65.8%) | 307 (34.2%) |
Female Fertility in Farmington
Fertility by Age in Farmington
Average fertility rate in Farmington is 42.0 births per 1,000 women. Women in the age bracket of 20 to 34 years have the highest fertility rate with 90.0 births per 1,000 women. Women in the age bracket of 20 to 34 years acount for 100.0% of all women with births.
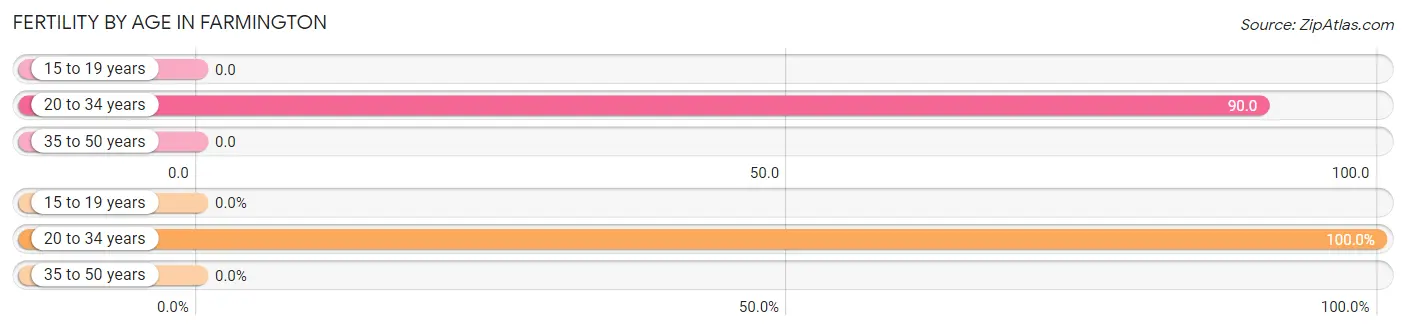
| Age Bracket | Women with Births | Births / 1,000 Women |
| 15 to 19 years | 0 (0.0%) | 0.0 |
| 20 to 34 years | 19 (100.0%) | 90.0 |
| 35 to 50 years | 0 (0.0%) | 0.0 |
| Total | 19 (100.0%) | 42.0 |
Fertility by Age by Marriage Status in Farmington
52.6% of women with births (19) in Farmington are married. The highest percentage of unmarried women with births falls into 20 to 34 years age bracket with 47.4% of them unmarried at the time of birth, while the lowest percentage of unmarried women with births belong to 20 to 34 years age bracket with 47.4% of them unmarried.
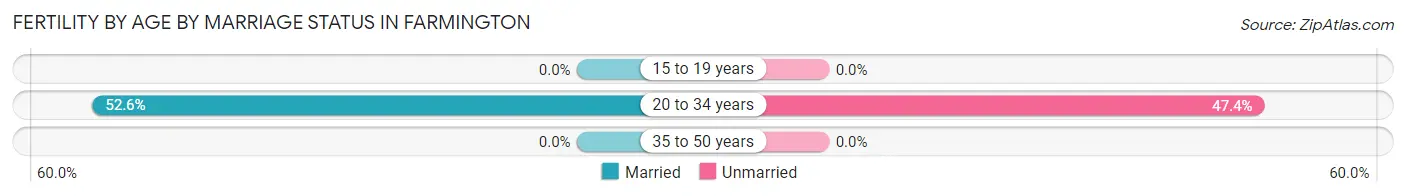
| Age Bracket | Married | Unmarried |
| 15 to 19 years | 0 (0.0%) | 0 (0.0%) |
| 20 to 34 years | 10 (52.6%) | 9 (47.4%) |
| 35 to 50 years | 0 (0.0%) | 0 (0.0%) |
| Total | 10 (52.6%) | 9 (47.4%) |
Fertility by Education in Farmington
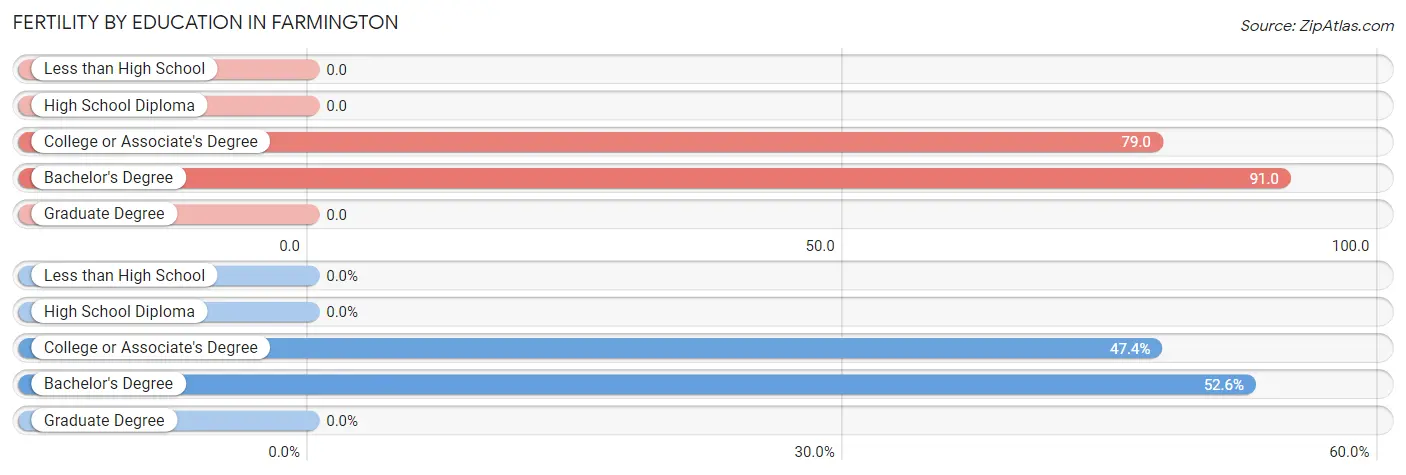
| Educational Attainment | Women with Births | Births / 1,000 Women |
| Less than High School | 0 (0.0%) | 0.0 |
| High School Diploma | 0 (0.0%) | 0.0 |
| College or Associate's Degree | 9 (47.4%) | 79.0 |
| Bachelor's Degree | 10 (52.6%) | 91.0 |
| Graduate Degree | 0 (0.0%) | 0.0 |
| Total | 19 (100.0%) | 42.0 |
Fertility by Education by Marriage Status in Farmington
47.4% of women with births in Farmington are unmarried. Women with the educational attainment of bachelor's degree are most likely to be married with 100.0% of them married at childbirth, while women with the educational attainment of college or associate's degree are least likely to be married with 100.0% of them unmarried at childbirth.
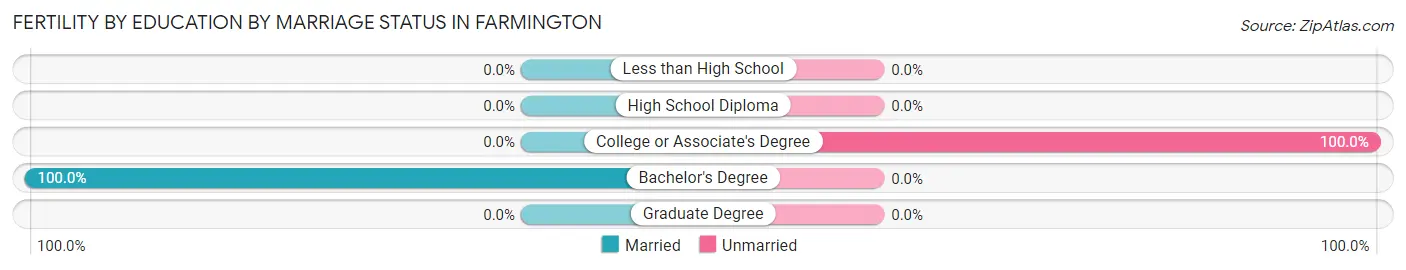
| Educational Attainment | Married | Unmarried |
| Less than High School | 0 (0.0%) | 0 (0.0%) |
| High School Diploma | 0 (0.0%) | 0 (0.0%) |
| College or Associate's Degree | 0 (0.0%) | 9 (100.0%) |
| Bachelor's Degree | 10 (100.0%) | 0 (0.0%) |
| Graduate Degree | 0 (0.0%) | 0 (0.0%) |
| Total | 10 (52.6%) | 9 (47.4%) |
Employment Characteristics in Farmington
Employment by Class of Employer in Farmington
Among the 1,013 employed individuals in Farmington, private company employees (720 | 71.1%), not-for-profit organizations (87 | 8.6%), and local government employees (83 | 8.2%) make up the most common classes of employment.
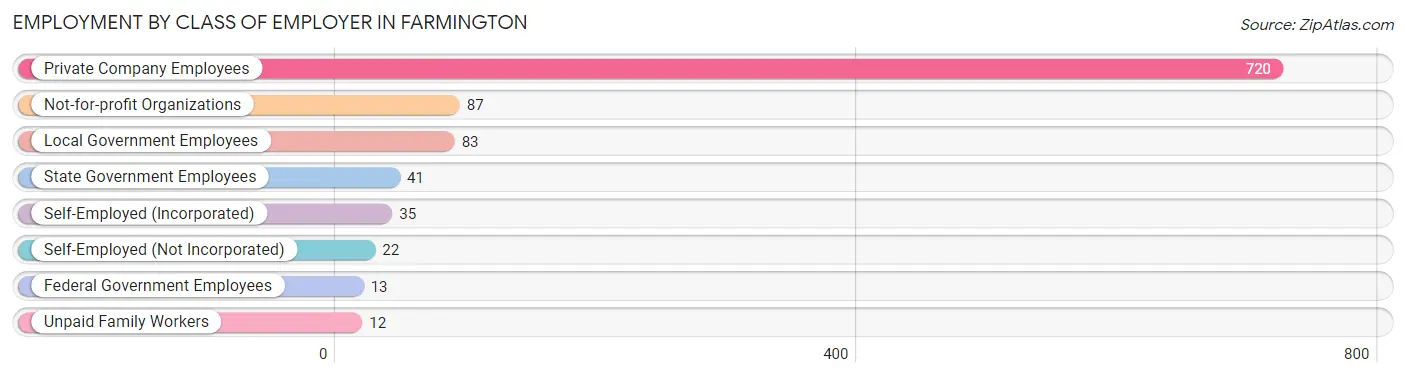
| Employer Class | # Employees | % Employees |
| Private Company Employees | 720 | 71.1% |
| Self-Employed (Incorporated) | 35 | 3.5% |
| Self-Employed (Not Incorporated) | 22 | 2.2% |
| Not-for-profit Organizations | 87 | 8.6% |
| Local Government Employees | 83 | 8.2% |
| State Government Employees | 41 | 4.1% |
| Federal Government Employees | 13 | 1.3% |
| Unpaid Family Workers | 12 | 1.2% |
| Total | 1,013 | 100.0% |
Employment Status by Age in Farmington
According to the labor force statistics for Farmington, out of the total population over 16 years of age (1,623), 68.8% or 1,117 individuals are in the labor force, with 8.4% or 94 of them unemployed. The age group with the highest labor force participation rate is 25 to 29 years, with 100.0% or 118 individuals in the labor force. Within the labor force, the 16 to 19 years age range has the highest percentage of unemployed individuals, with 54.5% or 33 of them being unemployed.
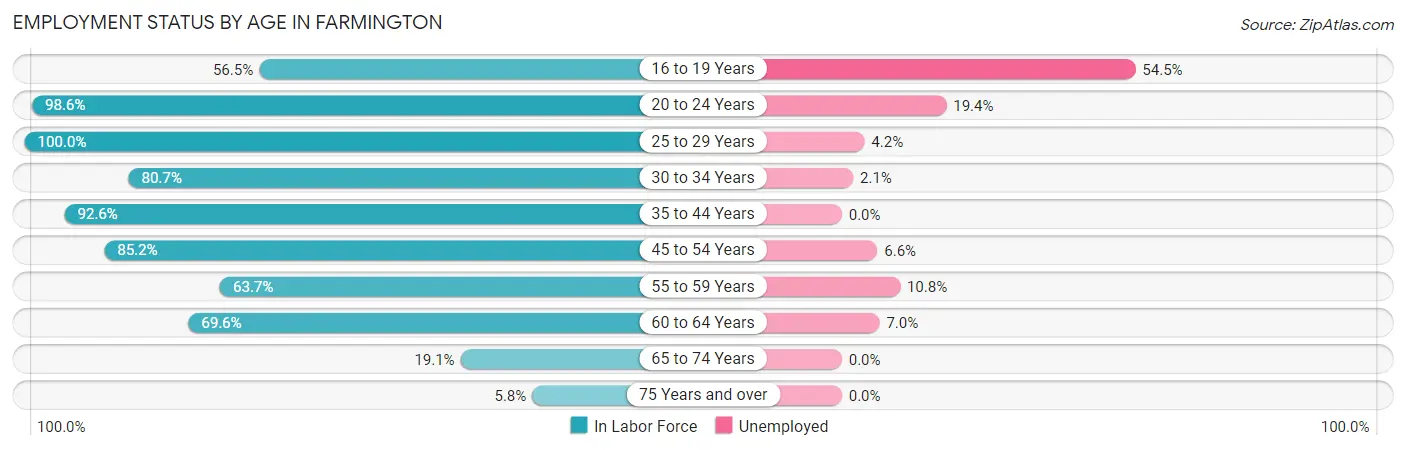
| Age Bracket | In Labor Force | Unemployed |
| 16 to 19 Years | 61 (56.5%) | 33 (54.5%) |
| 20 to 24 Years | 139 (98.6%) | 27 (19.4%) |
| 25 to 29 Years | 118 (100.0%) | 5 (4.2%) |
| 30 to 34 Years | 146 (80.7%) | 3 (2.1%) |
| 35 to 44 Years | 250 (92.6%) | 0 (0.0%) |
| 45 to 54 Years | 196 (85.2%) | 13 (6.6%) |
| 55 to 59 Years | 93 (63.7%) | 10 (10.8%) |
| 60 to 64 Years | 71 (69.6%) | 5 (7.0%) |
| 65 to 74 Years | 33 (19.1%) | 0 (0.0%) |
| 75 Years and over | 9 (5.8%) | 0 (0.0%) |
| Total | 1,117 (68.8%) | 94 (8.4%) |
Employment Status by Educational Attainment in Farmington
According to labor force statistics for Farmington, 83.5% of individuals (874) out of the total population between 25 and 64 years of age (1,047) are in the labor force, with 4.1% or 36 of them being unemployed. The group with the highest labor force participation rate are those with the educational attainment of bachelor's degree or higher, with 90.7% or 215 individuals in the labor force. Within the labor force, individuals with less than high school education have the highest percentage of unemployment, with 16.7% or 3 of them being unemployed.
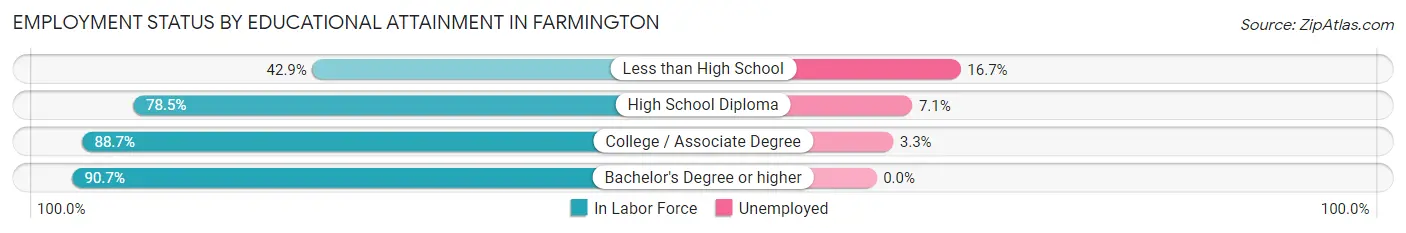
| Educational Attainment | In Labor Force | Unemployed |
| Less than High School | 18 (42.9%) | 7 (16.7%) |
| High School Diploma | 310 (78.5%) | 28 (7.1%) |
| College / Associate Degree | 331 (88.7%) | 12 (3.3%) |
| Bachelor's Degree or higher | 215 (90.7%) | 0 (0.0%) |
| Total | 874 (83.5%) | 43 (4.1%) |
Employment Occupations by Sex in Farmington
Management, Business, Science and Arts Occupations
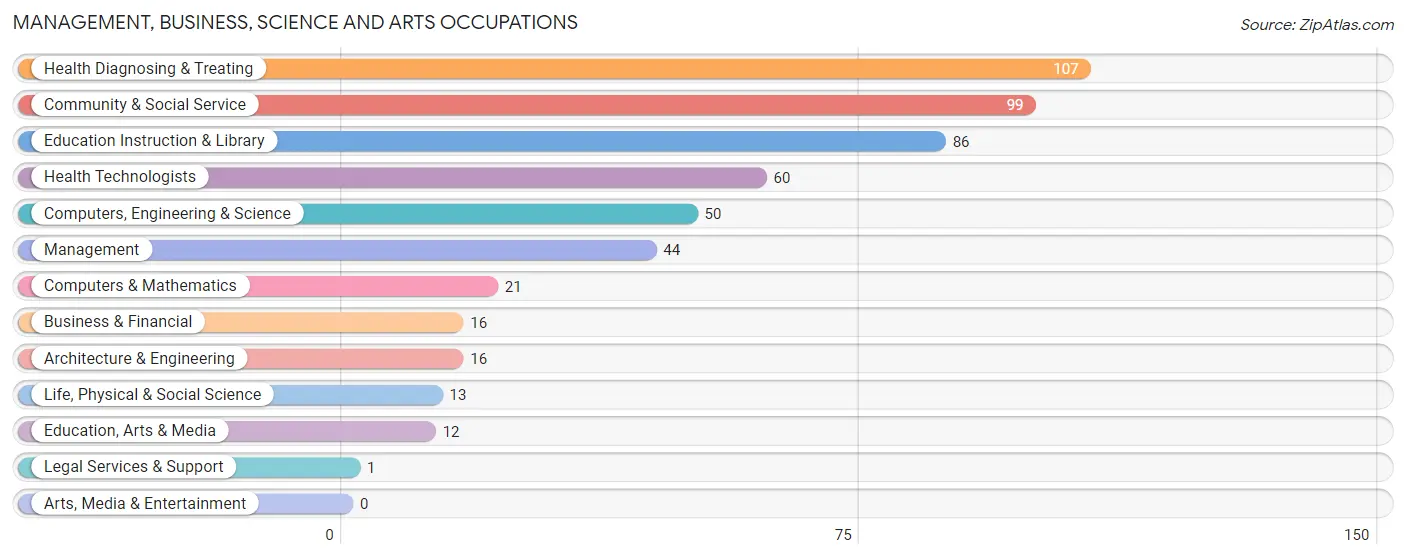
The most common Management, Business, Science and Arts occupations in Farmington are Health Diagnosing & Treating (107 | 10.5%), Community & Social Service (99 | 9.7%), Education Instruction & Library (86 | 8.5%), Health Technologists (60 | 5.9%), and Computers, Engineering & Science (50 | 4.9%).
Management, Business, Science and Arts Occupations by Sex
Within the Management, Business, Science and Arts occupations in Farmington, the most male-oriented occupations are Architecture & Engineering (100.0%), Education, Arts & Media (100.0%), and Computers, Engineering & Science (54.0%), while the most female-oriented occupations are Business & Financial (100.0%), Life, Physical & Social Science (100.0%), and Legal Services & Support (100.0%).
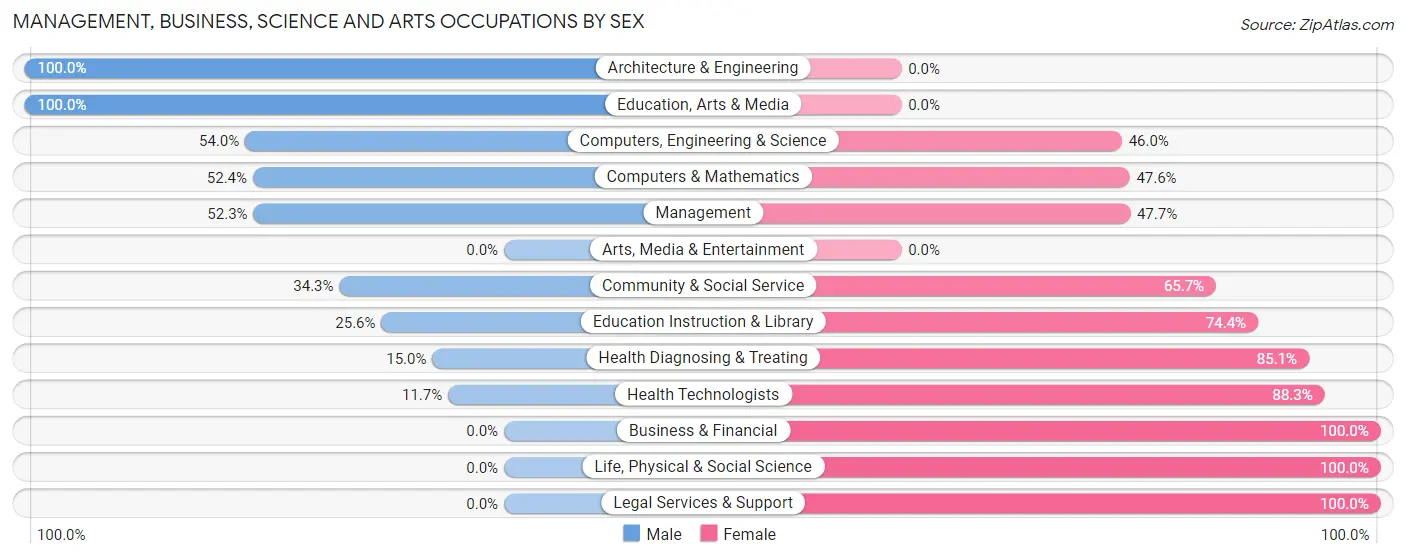
| Occupation | Male | Female |
| Management | 23 (52.3%) | 21 (47.7%) |
| Business & Financial | 0 (0.0%) | 16 (100.0%) |
| Computers, Engineering & Science | 27 (54.0%) | 23 (46.0%) |
| Computers & Mathematics | 11 (52.4%) | 10 (47.6%) |
| Architecture & Engineering | 16 (100.0%) | 0 (0.0%) |
| Life, Physical & Social Science | 0 (0.0%) | 13 (100.0%) |
| Community & Social Service | 34 (34.3%) | 65 (65.7%) |
| Education, Arts & Media | 12 (100.0%) | 0 (0.0%) |
| Legal Services & Support | 0 (0.0%) | 1 (100.0%) |
| Education Instruction & Library | 22 (25.6%) | 64 (74.4%) |
| Arts, Media & Entertainment | 0 (0.0%) | 0 (0.0%) |
| Health Diagnosing & Treating | 16 (14.9%) | 91 (85.1%) |
| Health Technologists | 7 (11.7%) | 53 (88.3%) |
| Total (Category) | 100 (31.7%) | 216 (68.3%) |
| Total (Overall) | 564 (55.5%) | 453 (44.5%) |
Services Occupations
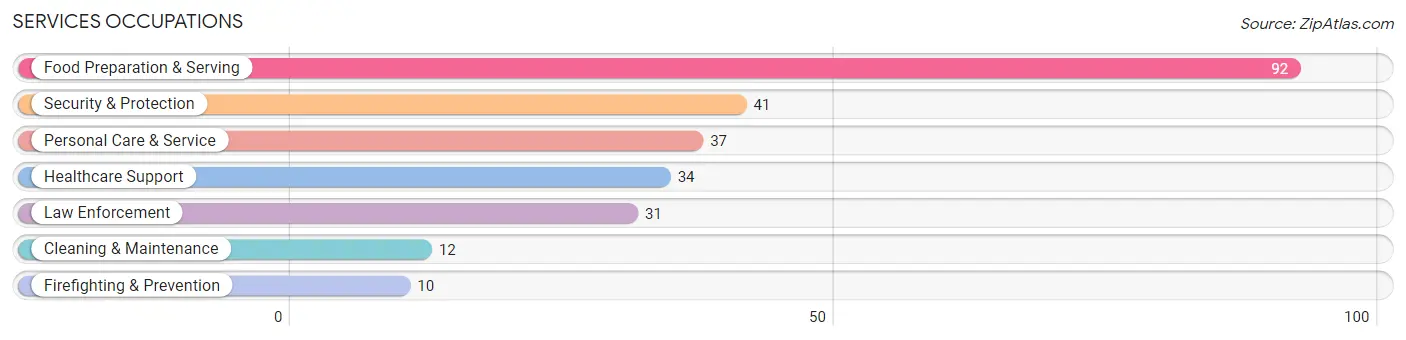
The most common Services occupations in Farmington are Food Preparation & Serving (92 | 9.0%), Security & Protection (41 | 4.0%), Personal Care & Service (37 | 3.6%), Healthcare Support (34 | 3.3%), and Law Enforcement (31 | 3.0%).
Services Occupations by Sex
Within the Services occupations in Farmington, the most male-oriented occupations are Firefighting & Prevention (100.0%), Security & Protection (90.2%), and Law Enforcement (87.1%), while the most female-oriented occupations are Healthcare Support (100.0%), Personal Care & Service (75.7%), and Food Preparation & Serving (55.4%).
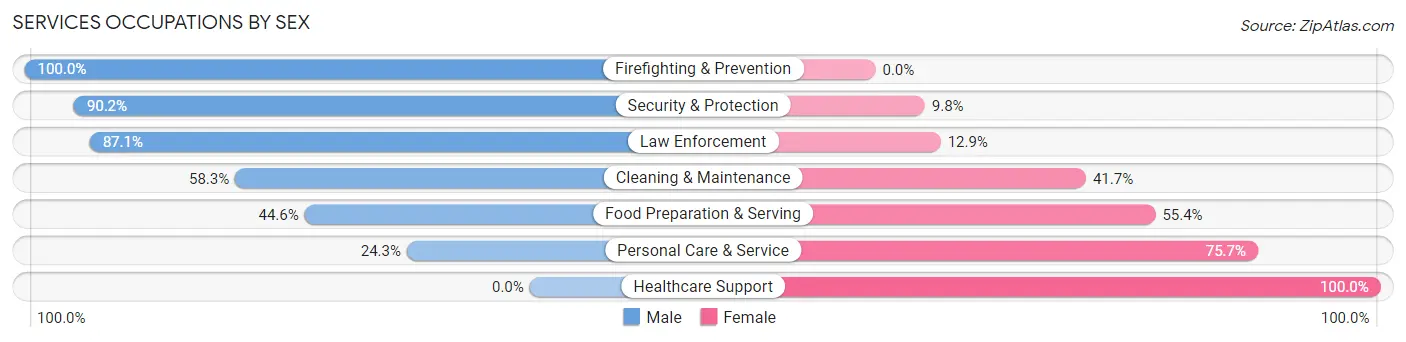
| Occupation | Male | Female |
| Healthcare Support | 0 (0.0%) | 34 (100.0%) |
| Security & Protection | 37 (90.2%) | 4 (9.8%) |
| Firefighting & Prevention | 10 (100.0%) | 0 (0.0%) |
| Law Enforcement | 27 (87.1%) | 4 (12.9%) |
| Food Preparation & Serving | 41 (44.6%) | 51 (55.4%) |
| Cleaning & Maintenance | 7 (58.3%) | 5 (41.7%) |
| Personal Care & Service | 9 (24.3%) | 28 (75.7%) |
| Total (Category) | 94 (43.5%) | 122 (56.5%) |
| Total (Overall) | 564 (55.5%) | 453 (44.5%) |
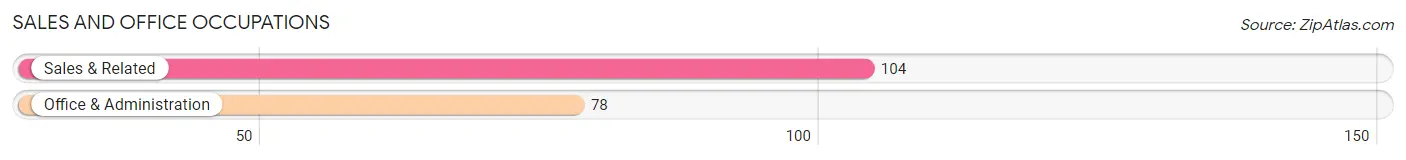
Sales and Office Occupations
The most common Sales and Office occupations in Farmington are Sales & Related (104 | 10.2%), and Office & Administration (78 | 7.7%).
Sales and Office Occupations by Sex
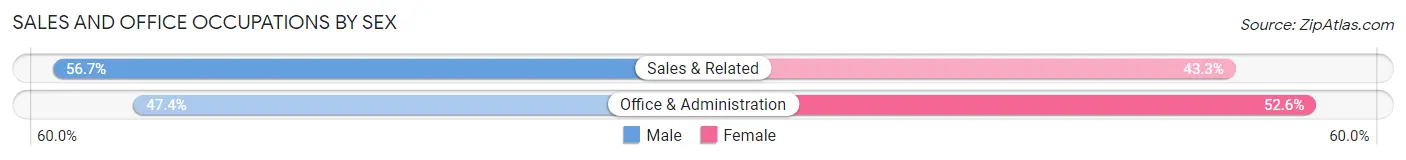
| Occupation | Male | Female |
| Sales & Related | 59 (56.7%) | 45 (43.3%) |
| Office & Administration | 37 (47.4%) | 41 (52.6%) |
| Total (Category) | 96 (52.7%) | 86 (47.2%) |
| Total (Overall) | 564 (55.5%) | 453 (44.5%) |
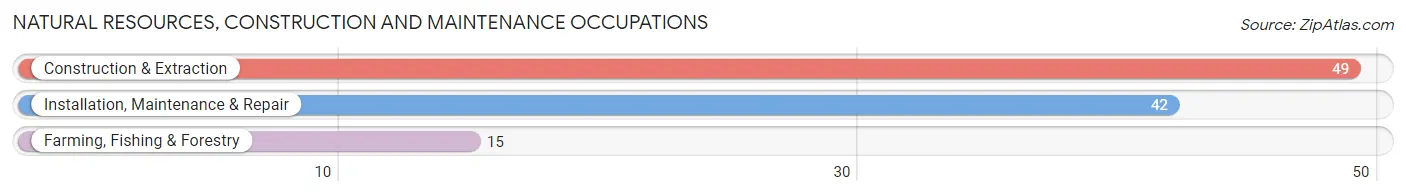
Natural Resources, Construction and Maintenance Occupations
The most common Natural Resources, Construction and Maintenance occupations in Farmington are Construction & Extraction (49 | 4.8%), Installation, Maintenance & Repair (42 | 4.1%), and Farming, Fishing & Forestry (15 | 1.5%).
Natural Resources, Construction and Maintenance Occupations by Sex
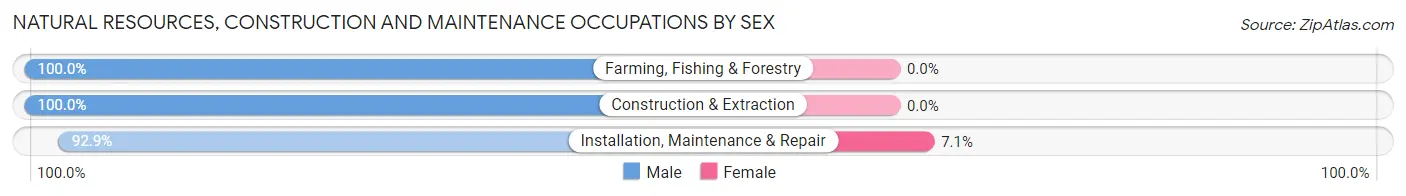
| Occupation | Male | Female |
| Farming, Fishing & Forestry | 15 (100.0%) | 0 (0.0%) |
| Construction & Extraction | 49 (100.0%) | 0 (0.0%) |
| Installation, Maintenance & Repair | 39 (92.9%) | 3 (7.1%) |
| Total (Category) | 103 (97.2%) | 3 (2.8%) |
| Total (Overall) | 564 (55.5%) | 453 (44.5%) |
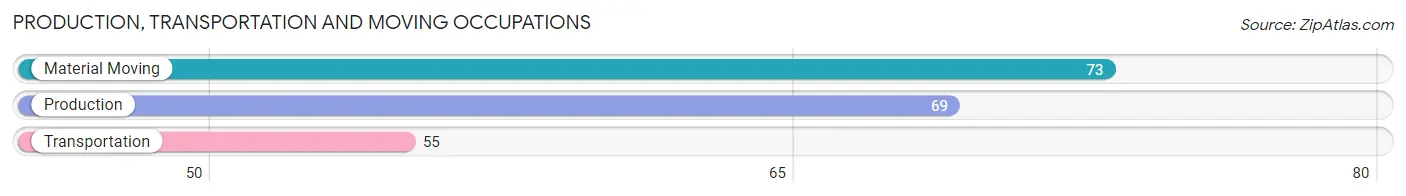
Production, Transportation and Moving Occupations
The most common Production, Transportation and Moving occupations in Farmington are Material Moving (73 | 7.2%), Production (69 | 6.8%), and Transportation (55 | 5.4%).
Production, Transportation and Moving Occupations by Sex
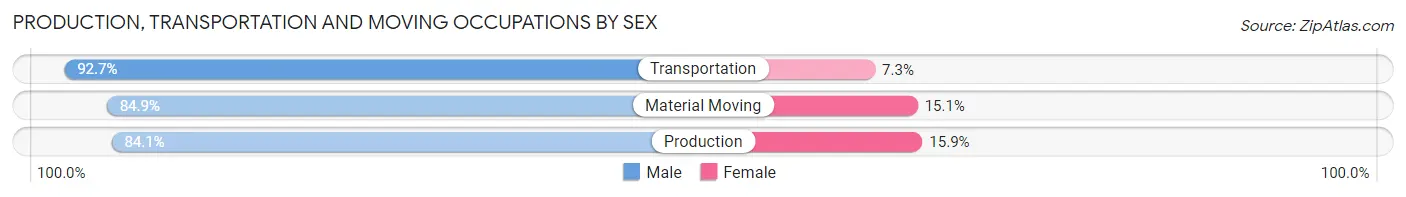
| Occupation | Male | Female |
| Production | 58 (84.1%) | 11 (15.9%) |
| Transportation | 51 (92.7%) | 4 (7.3%) |
| Material Moving | 62 (84.9%) | 11 (15.1%) |
| Total (Category) | 171 (86.8%) | 26 (13.2%) |
| Total (Overall) | 564 (55.5%) | 453 (44.5%) |
Employment Industries by Sex in Farmington
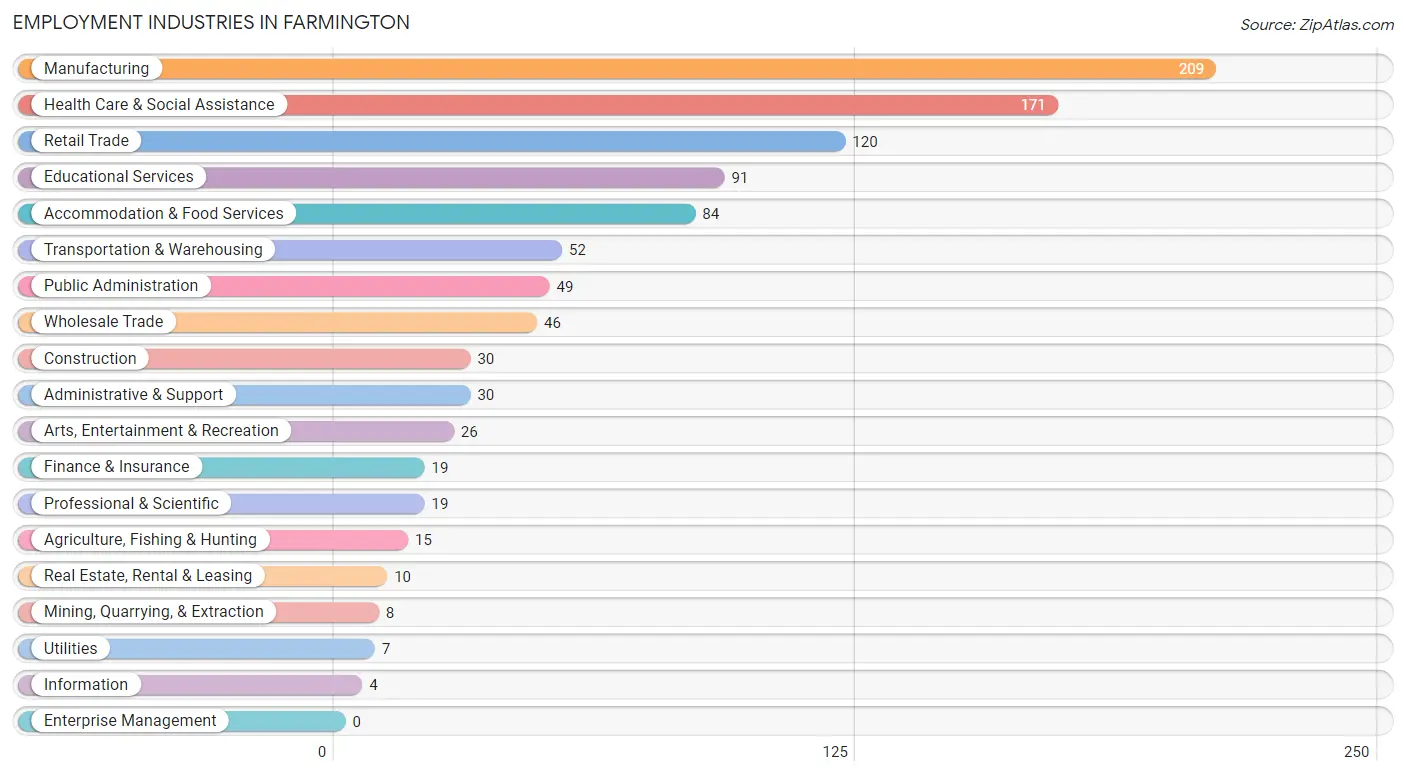
Employment Industries in Farmington
The major employment industries in Farmington include Manufacturing (209 | 20.5%), Health Care & Social Assistance (171 | 16.8%), Retail Trade (120 | 11.8%), Educational Services (91 | 8.9%), and Accommodation & Food Services (84 | 8.3%).
Employment Industries by Sex in Farmington
The Farmington industries that see more men than women are Agriculture, Fishing & Hunting (100.0%), Mining, Quarrying, & Extraction (100.0%), and Construction (100.0%), whereas the industries that tend to have a higher number of women are Utilities (100.0%), Health Care & Social Assistance (87.1%), and Educational Services (71.4%).
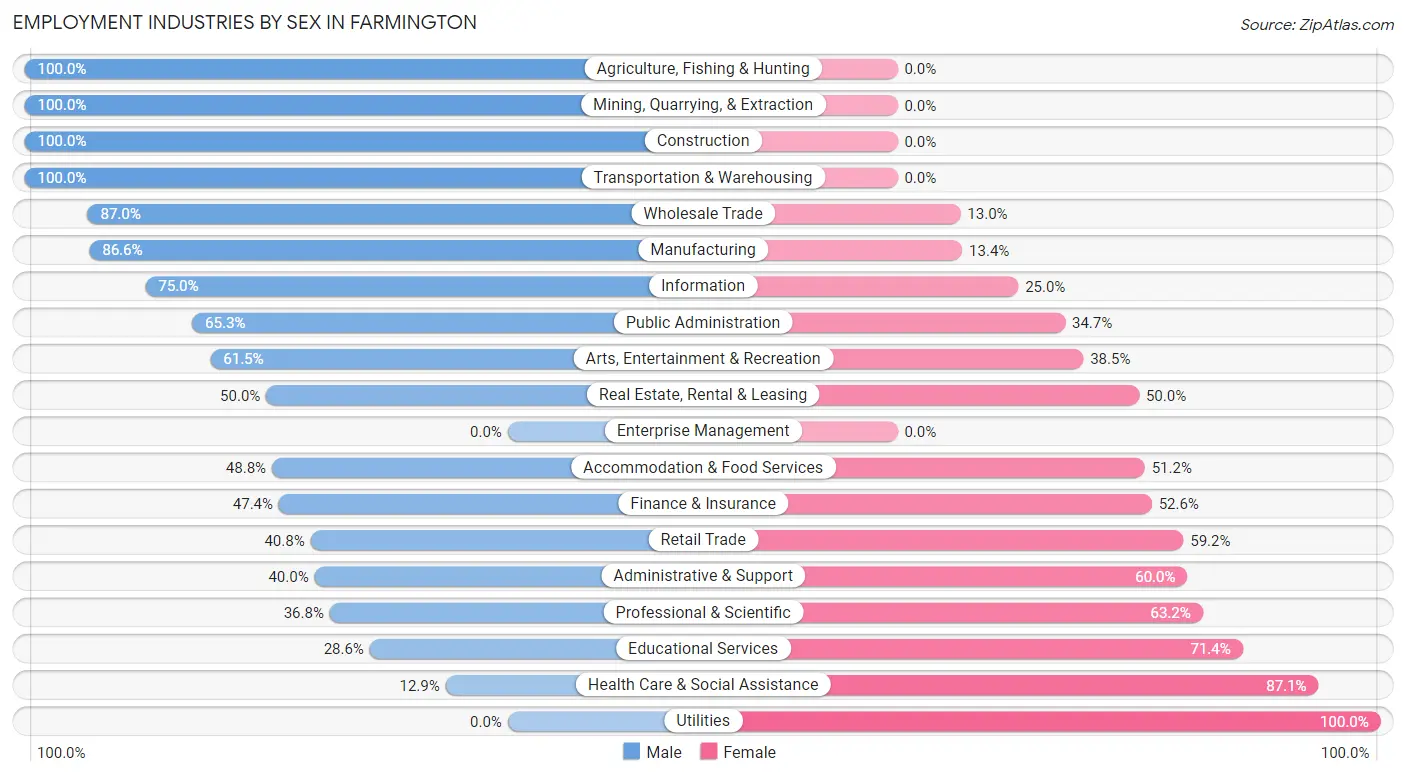
| Industry | Male | Female |
| Agriculture, Fishing & Hunting | 15 (100.0%) | 0 (0.0%) |
| Mining, Quarrying, & Extraction | 8 (100.0%) | 0 (0.0%) |
| Construction | 30 (100.0%) | 0 (0.0%) |
| Manufacturing | 181 (86.6%) | 28 (13.4%) |
| Wholesale Trade | 40 (87.0%) | 6 (13.0%) |
| Retail Trade | 49 (40.8%) | 71 (59.2%) |
| Transportation & Warehousing | 52 (100.0%) | 0 (0.0%) |
| Utilities | 0 (0.0%) | 7 (100.0%) |
| Information | 3 (75.0%) | 1 (25.0%) |
| Finance & Insurance | 9 (47.4%) | 10 (52.6%) |
| Real Estate, Rental & Leasing | 5 (50.0%) | 5 (50.0%) |
| Professional & Scientific | 7 (36.8%) | 12 (63.2%) |
| Enterprise Management | 0 (0.0%) | 0 (0.0%) |
| Administrative & Support | 12 (40.0%) | 18 (60.0%) |
| Educational Services | 26 (28.6%) | 65 (71.4%) |
| Health Care & Social Assistance | 22 (12.9%) | 149 (87.1%) |
| Arts, Entertainment & Recreation | 16 (61.5%) | 10 (38.5%) |
| Accommodation & Food Services | 41 (48.8%) | 43 (51.2%) |
| Public Administration | 32 (65.3%) | 17 (34.7%) |
| Total | 564 (55.5%) | 453 (44.5%) |
Education in Farmington
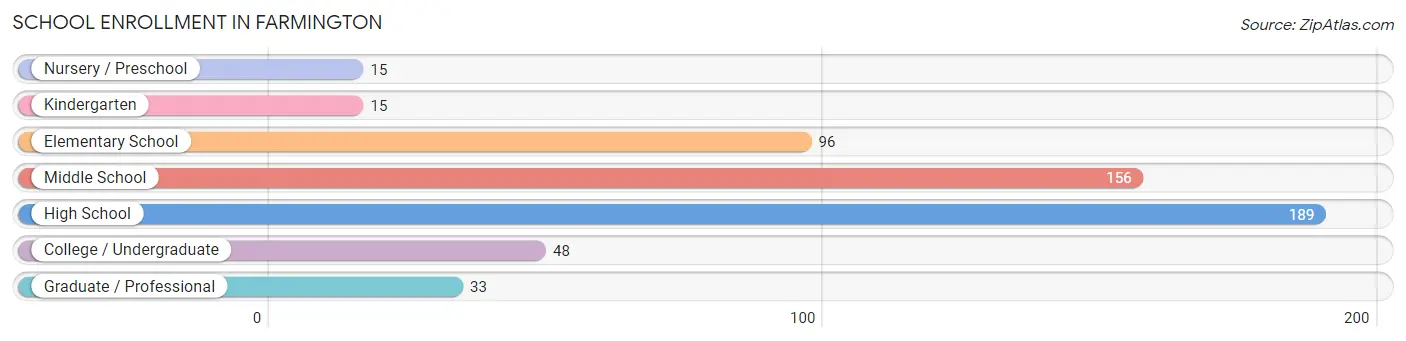
School Enrollment in Farmington
The most common levels of schooling among the 552 students in Farmington are high school (189 | 34.2%), middle school (156 | 28.3%), and elementary school (96 | 17.4%).
| School Level | # Students | % Students |
| Nursery / Preschool | 15 | 2.7% |
| Kindergarten | 15 | 2.7% |
| Elementary School | 96 | 17.4% |
| Middle School | 156 | 28.3% |
| High School | 189 | 34.2% |
| College / Undergraduate | 48 | 8.7% |
| Graduate / Professional | 33 | 6.0% |
| Total | 552 | 100.0% |
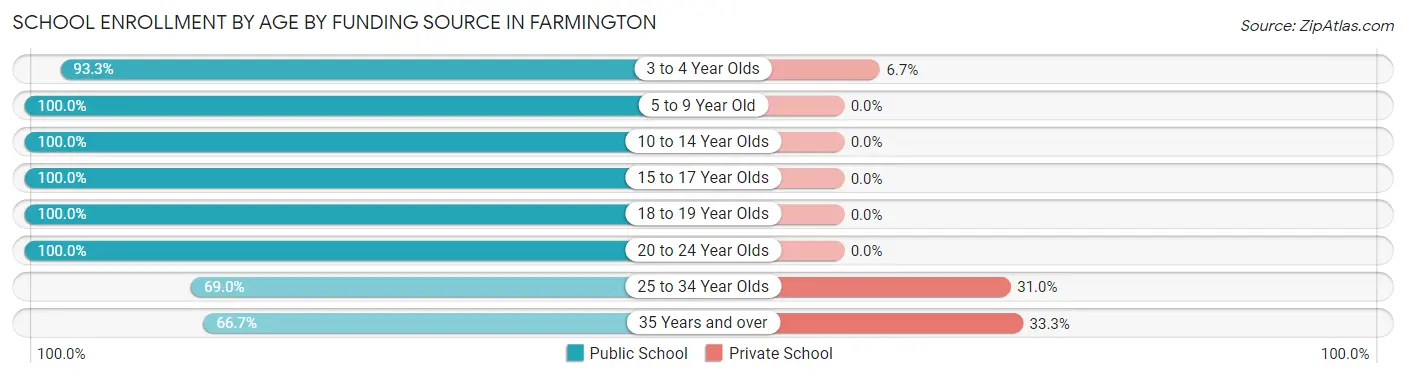
School Enrollment by Age by Funding Source in Farmington
Out of a total of 552 students who are enrolled in schools in Farmington, 16 (2.9%) attend a private institution, while the remaining 536 (97.1%) are enrolled in public schools. The age group of 35 years and over has the highest likelihood of being enrolled in private schools, with 6 (33.3% in the age bracket) enrolled. Conversely, the age group of 5 to 9 year old has the lowest likelihood of being enrolled in a private school, with 98 (100.0% in the age bracket) attending a public institution.
| Age Bracket | Public School | Private School |
| 3 to 4 Year Olds | 14 (93.3%) | 1 (6.7%) |
| 5 to 9 Year Old | 98 (100.0%) | 0 (0.0%) |
| 10 to 14 Year Olds | 221 (100.0%) | 0 (0.0%) |
| 15 to 17 Year Olds | 115 (100.0%) | 0 (0.0%) |
| 18 to 19 Year Olds | 22 (100.0%) | 0 (0.0%) |
| 20 to 24 Year Olds | 34 (100.0%) | 0 (0.0%) |
| 25 to 34 Year Olds | 20 (69.0%) | 9 (31.0%) |
| 35 Years and over | 12 (66.7%) | 6 (33.3%) |
| Total | 536 (97.1%) | 16 (2.9%) |
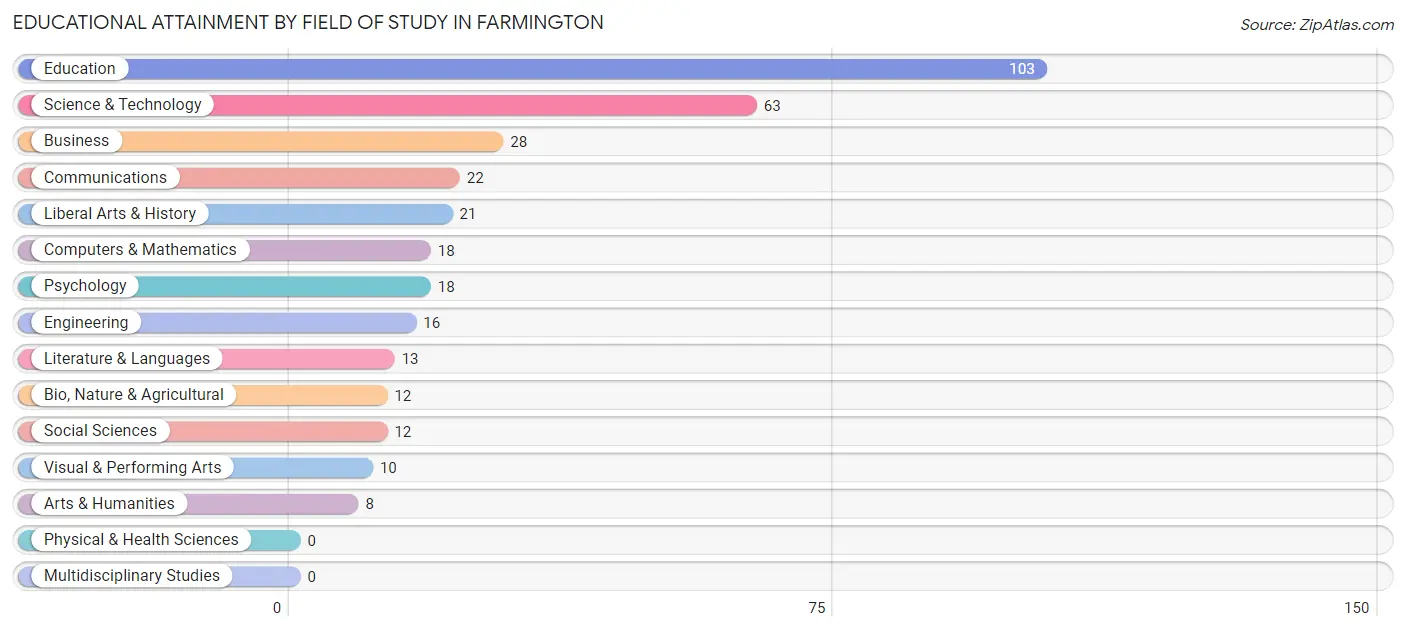
Educational Attainment by Field of Study in Farmington
Education (103 | 29.9%), science & technology (63 | 18.3%), business (28 | 8.1%), communications (22 | 6.4%), and liberal arts & history (21 | 6.1%) are the most common fields of study among 344 individuals in Farmington who have obtained a bachelor's degree or higher.
| Field of Study | # Graduates | % Graduates |
| Computers & Mathematics | 18 | 5.2% |
| Bio, Nature & Agricultural | 12 | 3.5% |
| Physical & Health Sciences | 0 | 0.0% |
| Psychology | 18 | 5.2% |
| Social Sciences | 12 | 3.5% |
| Engineering | 16 | 4.6% |
| Multidisciplinary Studies | 0 | 0.0% |
| Science & Technology | 63 | 18.3% |
| Business | 28 | 8.1% |
| Education | 103 | 29.9% |
| Literature & Languages | 13 | 3.8% |
| Liberal Arts & History | 21 | 6.1% |
| Visual & Performing Arts | 10 | 2.9% |
| Communications | 22 | 6.4% |
| Arts & Humanities | 8 | 2.3% |
| Total | 344 | 100.0% |
Transportation & Commute in Farmington
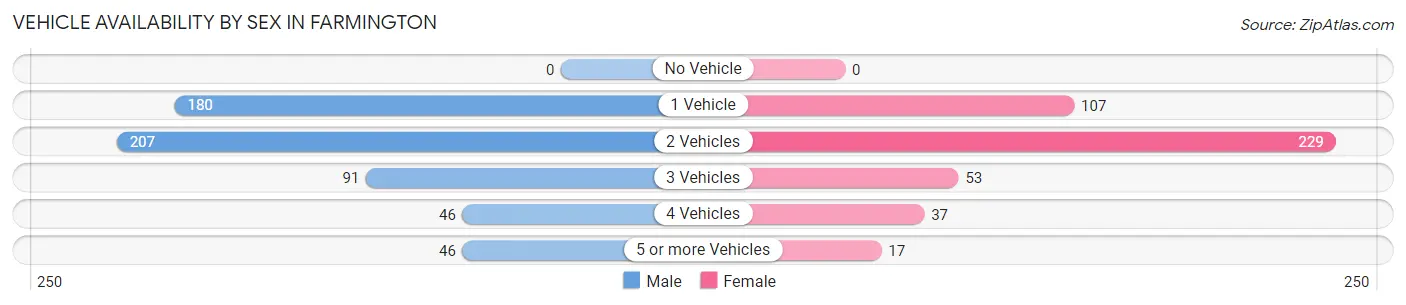
Vehicle Availability by Sex in Farmington
The most prevalent vehicle ownership categories in Farmington are males with 2 vehicles (207, accounting for 36.3%) and females with 2 vehicles (229, making up 46.7%).
| Vehicles Available | Male | Female |
| No Vehicle | 0 (0.0%) | 0 (0.0%) |
| 1 Vehicle | 180 (31.6%) | 107 (24.1%) |
| 2 Vehicles | 207 (36.3%) | 229 (51.7%) |
| 3 Vehicles | 91 (16.0%) | 53 (12.0%) |
| 4 Vehicles | 46 (8.1%) | 37 (8.4%) |
| 5 or more Vehicles | 46 (8.1%) | 17 (3.8%) |
| Total | 570 (100.0%) | 443 (100.0%) |
Commute Time in Farmington
The most frequently occuring commute durations in Farmington are 5 to 9 minutes (212 commuters, 21.0%), less than 5 minutes (148 commuters, 14.7%), and 25 to 29 minutes (97 commuters, 9.6%).
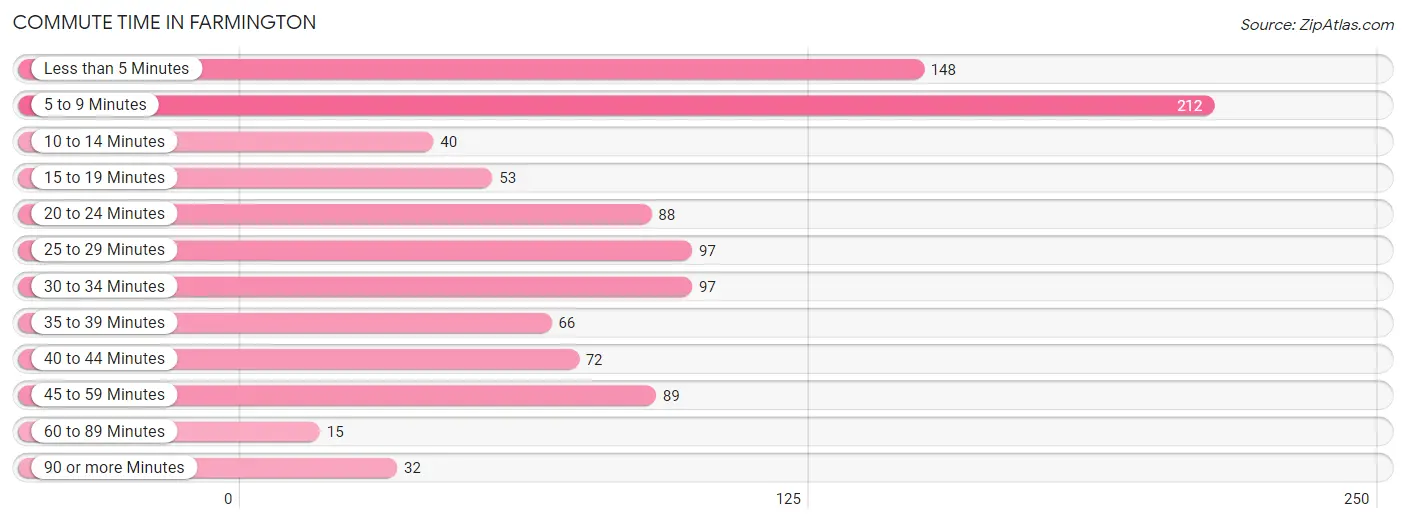
| Commute Time | # Commuters | % Commuters |
| Less than 5 Minutes | 148 | 14.7% |
| 5 to 9 Minutes | 212 | 21.0% |
| 10 to 14 Minutes | 40 | 4.0% |
| 15 to 19 Minutes | 53 | 5.2% |
| 20 to 24 Minutes | 88 | 8.7% |
| 25 to 29 Minutes | 97 | 9.6% |
| 30 to 34 Minutes | 97 | 9.6% |
| 35 to 39 Minutes | 66 | 6.5% |
| 40 to 44 Minutes | 72 | 7.1% |
| 45 to 59 Minutes | 89 | 8.8% |
| 60 to 89 Minutes | 15 | 1.5% |
| 90 or more Minutes | 32 | 3.2% |
Commute Time by Sex in Farmington
The most common commute times in Farmington are 5 to 9 minutes (135 commuters, 23.8%) for males and 5 to 9 minutes (77 commuters, 17.4%) for females.
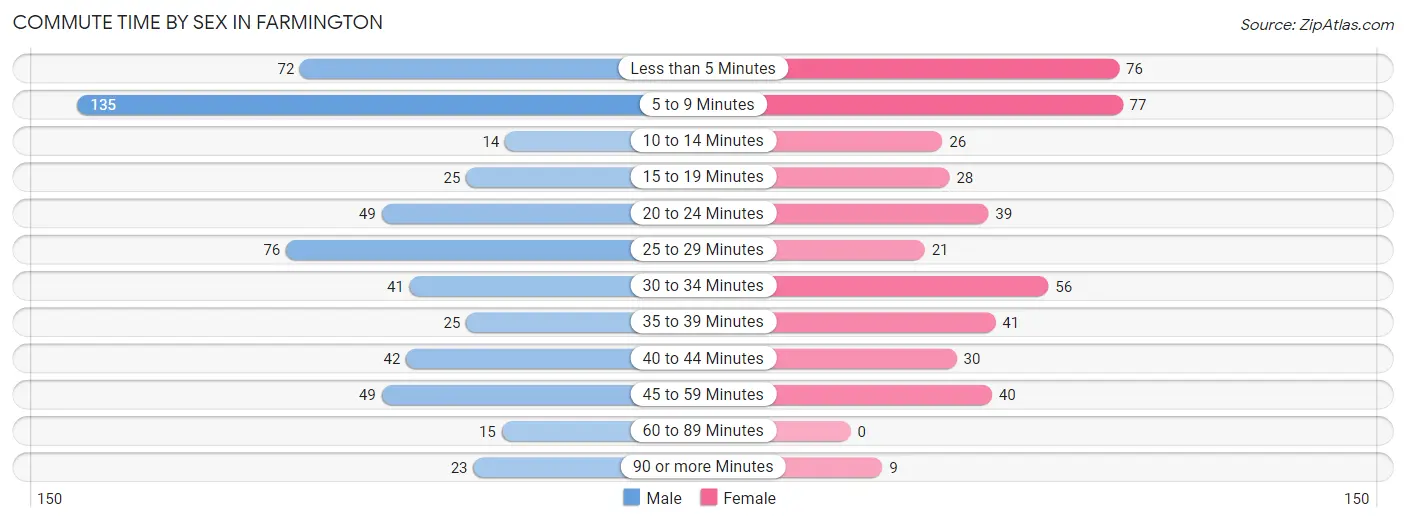
| Commute Time | Male | Female |
| Less than 5 Minutes | 72 (12.7%) | 76 (17.2%) |
| 5 to 9 Minutes | 135 (23.8%) | 77 (17.4%) |
| 10 to 14 Minutes | 14 (2.5%) | 26 (5.9%) |
| 15 to 19 Minutes | 25 (4.4%) | 28 (6.3%) |
| 20 to 24 Minutes | 49 (8.7%) | 39 (8.8%) |
| 25 to 29 Minutes | 76 (13.4%) | 21 (4.7%) |
| 30 to 34 Minutes | 41 (7.2%) | 56 (12.6%) |
| 35 to 39 Minutes | 25 (4.4%) | 41 (9.3%) |
| 40 to 44 Minutes | 42 (7.4%) | 30 (6.8%) |
| 45 to 59 Minutes | 49 (8.7%) | 40 (9.0%) |
| 60 to 89 Minutes | 15 (2.6%) | 0 (0.0%) |
| 90 or more Minutes | 23 (4.1%) | 9 (2.0%) |
Time of Departure to Work by Sex in Farmington
The most frequent times of departure to work in Farmington are 6:00 AM to 6:29 AM (85, 15.0%) for males and 7:30 AM to 7:59 AM (91, 20.5%) for females.
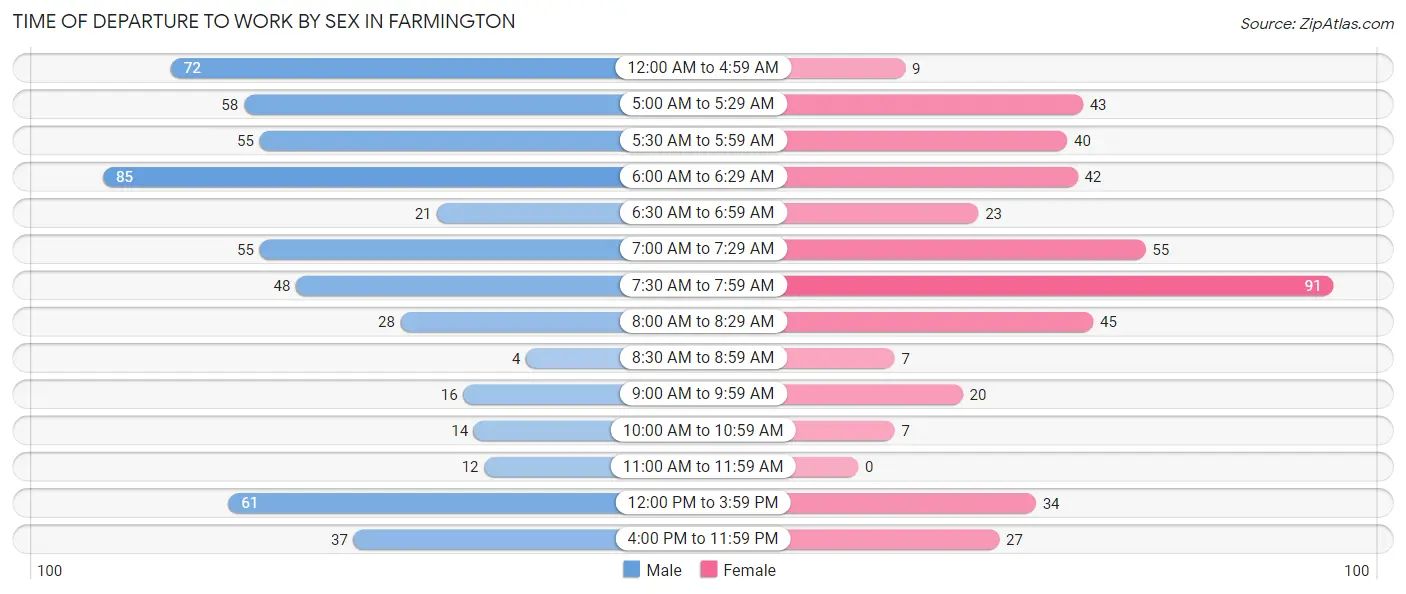
| Time of Departure | Male | Female |
| 12:00 AM to 4:59 AM | 72 (12.7%) | 9 (2.0%) |
| 5:00 AM to 5:29 AM | 58 (10.2%) | 43 (9.7%) |
| 5:30 AM to 5:59 AM | 55 (9.7%) | 40 (9.0%) |
| 6:00 AM to 6:29 AM | 85 (15.0%) | 42 (9.5%) |
| 6:30 AM to 6:59 AM | 21 (3.7%) | 23 (5.2%) |
| 7:00 AM to 7:29 AM | 55 (9.7%) | 55 (12.4%) |
| 7:30 AM to 7:59 AM | 48 (8.5%) | 91 (20.5%) |
| 8:00 AM to 8:29 AM | 28 (5.0%) | 45 (10.2%) |
| 8:30 AM to 8:59 AM | 4 (0.7%) | 7 (1.6%) |
| 9:00 AM to 9:59 AM | 16 (2.8%) | 20 (4.5%) |
| 10:00 AM to 10:59 AM | 14 (2.5%) | 7 (1.6%) |
| 11:00 AM to 11:59 AM | 12 (2.1%) | 0 (0.0%) |
| 12:00 PM to 3:59 PM | 61 (10.8%) | 34 (7.7%) |
| 4:00 PM to 11:59 PM | 37 (6.5%) | 27 (6.1%) |
| Total | 566 (100.0%) | 443 (100.0%) |
Housing Occupancy in Farmington
Occupancy by Ownership in Farmington
Of the total 898 dwellings in Farmington, owner-occupied units account for 633 (70.5%), while renter-occupied units make up 265 (29.5%).
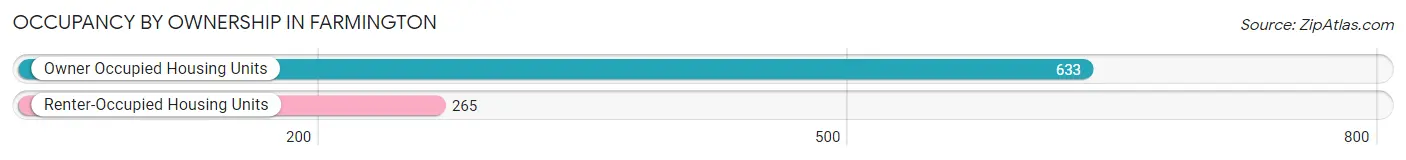
| Occupancy | # Housing Units | % Housing Units |
| Owner Occupied Housing Units | 633 | 70.5% |
| Renter-Occupied Housing Units | 265 | 29.5% |
| Total Occupied Housing Units | 898 | 100.0% |
Occupancy by Household Size in Farmington
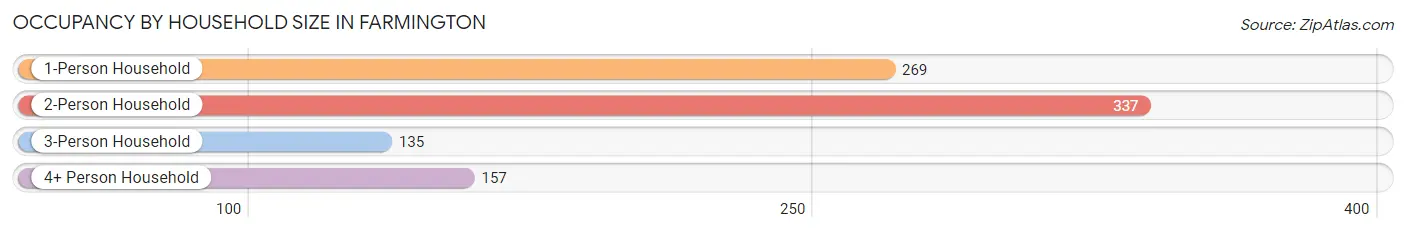
| Household Size | # Housing Units | % Housing Units |
| 1-Person Household | 269 | 30.0% |
| 2-Person Household | 337 | 37.5% |
| 3-Person Household | 135 | 15.0% |
| 4+ Person Household | 157 | 17.5% |
| Total Housing Units | 898 | 100.0% |
Occupancy by Ownership by Household Size in Farmington
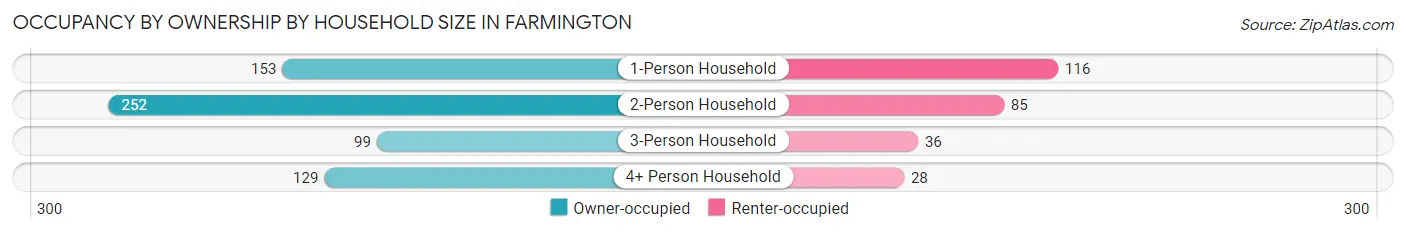
| Household Size | Owner-occupied | Renter-occupied |
| 1-Person Household | 153 (56.9%) | 116 (43.1%) |
| 2-Person Household | 252 (74.8%) | 85 (25.2%) |
| 3-Person Household | 99 (73.3%) | 36 (26.7%) |
| 4+ Person Household | 129 (82.2%) | 28 (17.8%) |
| Total Housing Units | 633 (70.5%) | 265 (29.5%) |
Occupancy by Educational Attainment in Farmington
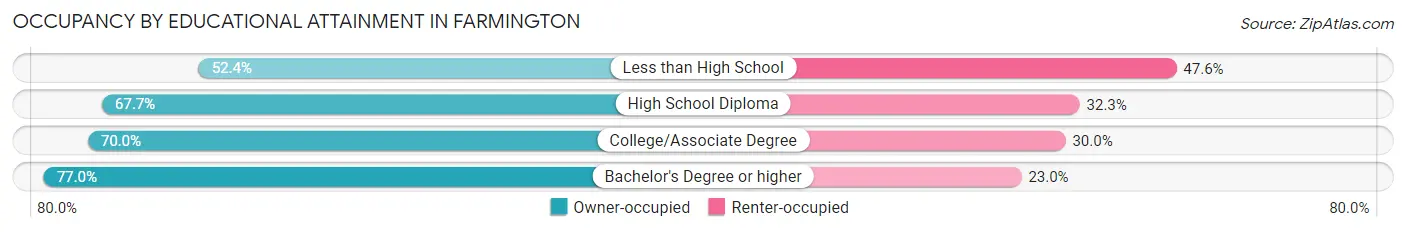
| Household Size | Owner-occupied | Renter-occupied |
| Less than High School | 11 (52.4%) | 10 (47.6%) |
| High School Diploma | 233 (67.7%) | 111 (32.3%) |
| College/Associate Degree | 212 (70.0%) | 91 (30.0%) |
| Bachelor's Degree or higher | 177 (77.0%) | 53 (23.0%) |
Occupancy by Age of Householder in Farmington
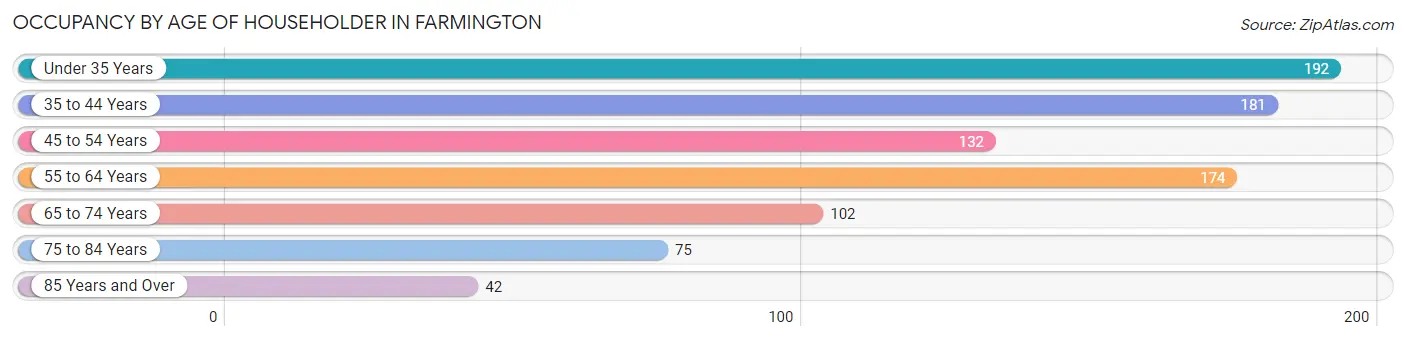
| Age Bracket | # Households | % Households |
| Under 35 Years | 192 | 21.4% |
| 35 to 44 Years | 181 | 20.2% |
| 45 to 54 Years | 132 | 14.7% |
| 55 to 64 Years | 174 | 19.4% |
| 65 to 74 Years | 102 | 11.4% |
| 75 to 84 Years | 75 | 8.4% |
| 85 Years and Over | 42 | 4.7% |
| Total | 898 | 100.0% |
Housing Finances in Farmington
Median Income by Occupancy in Farmington
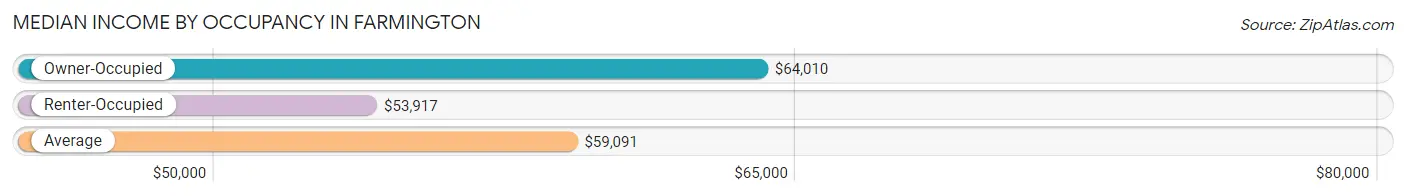
| Occupancy Type | # Households | Median Income |
| Owner-Occupied | 633 (70.5%) | $64,010 |
| Renter-Occupied | 265 (29.5%) | $53,917 |
| Average | 898 (100.0%) | $59,091 |
Occupancy by Householder Income Bracket in Farmington
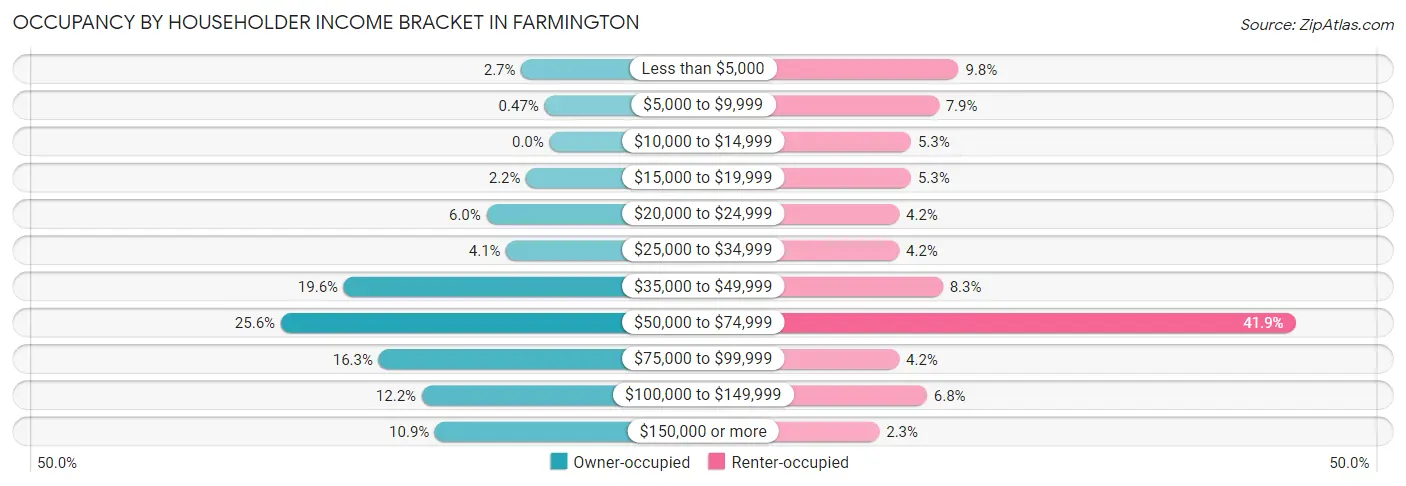
| Income Bracket | Owner-occupied | Renter-occupied |
| Less than $5,000 | 17 (2.7%) | 26 (9.8%) |
| $5,000 to $9,999 | 3 (0.5%) | 21 (7.9%) |
| $10,000 to $14,999 | 0 (0.0%) | 14 (5.3%) |
| $15,000 to $19,999 | 14 (2.2%) | 14 (5.3%) |
| $20,000 to $24,999 | 38 (6.0%) | 11 (4.2%) |
| $25,000 to $34,999 | 26 (4.1%) | 11 (4.2%) |
| $35,000 to $49,999 | 124 (19.6%) | 22 (8.3%) |
| $50,000 to $74,999 | 162 (25.6%) | 111 (41.9%) |
| $75,000 to $99,999 | 103 (16.3%) | 11 (4.2%) |
| $100,000 to $149,999 | 77 (12.2%) | 18 (6.8%) |
| $150,000 or more | 69 (10.9%) | 6 (2.3%) |
| Total | 633 (100.0%) | 265 (100.0%) |
Monthly Housing Cost Tiers in Farmington
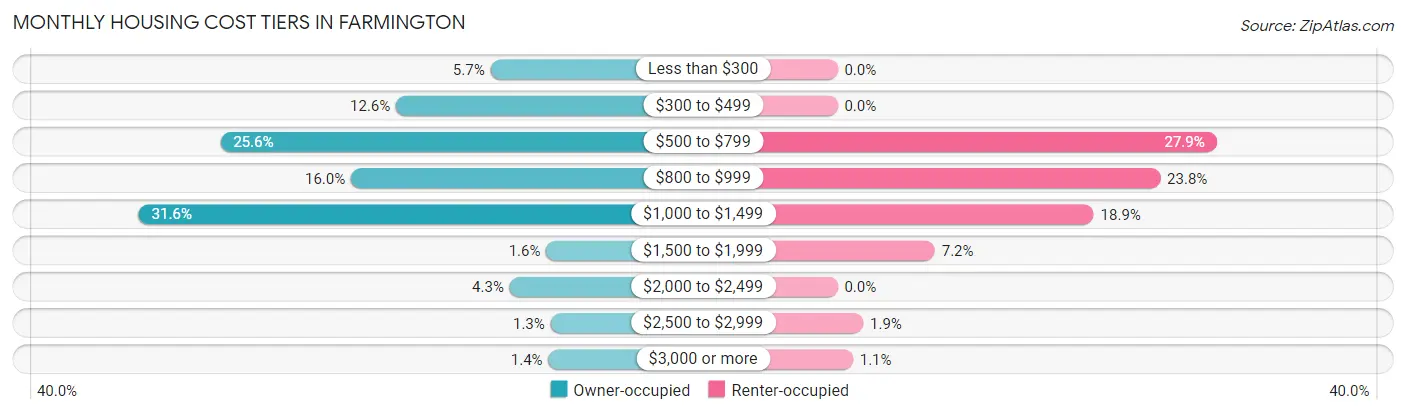
| Monthly Cost | Owner-occupied | Renter-occupied |
| Less than $300 | 36 (5.7%) | 0 (0.0%) |
| $300 to $499 | 80 (12.6%) | 0 (0.0%) |
| $500 to $799 | 162 (25.6%) | 74 (27.9%) |
| $800 to $999 | 101 (16.0%) | 63 (23.8%) |
| $1,000 to $1,499 | 200 (31.6%) | 50 (18.9%) |
| $1,500 to $1,999 | 10 (1.6%) | 19 (7.2%) |
| $2,000 to $2,499 | 27 (4.3%) | 0 (0.0%) |
| $2,500 to $2,999 | 8 (1.3%) | 5 (1.9%) |
| $3,000 or more | 9 (1.4%) | 3 (1.1%) |
| Total | 633 (100.0%) | 265 (100.0%) |
Physical Housing Characteristics in Farmington
Housing Structures in Farmington
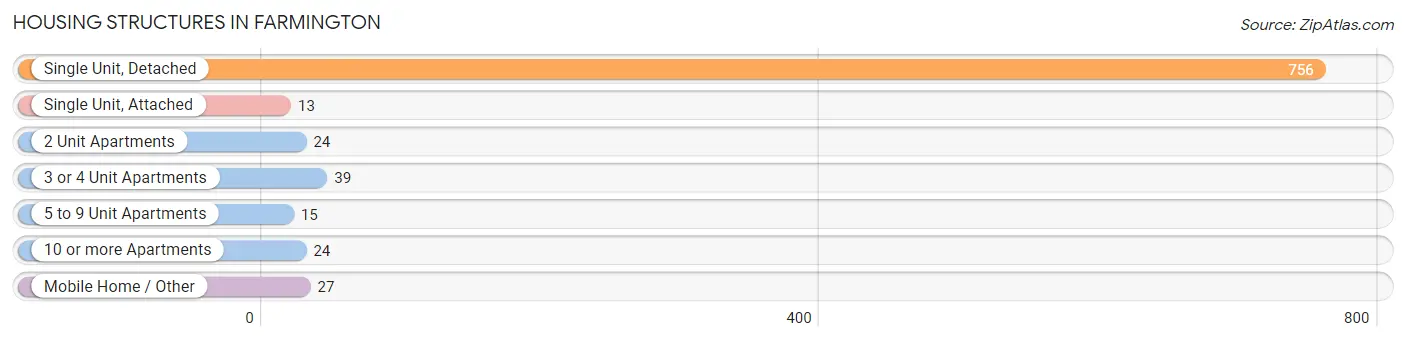
| Structure Type | # Housing Units | % Housing Units |
| Single Unit, Detached | 756 | 84.2% |
| Single Unit, Attached | 13 | 1.5% |
| 2 Unit Apartments | 24 | 2.7% |
| 3 or 4 Unit Apartments | 39 | 4.3% |
| 5 to 9 Unit Apartments | 15 | 1.7% |
| 10 or more Apartments | 24 | 2.7% |
| Mobile Home / Other | 27 | 3.0% |
| Total | 898 | 100.0% |
Housing Structures by Occupancy in Farmington
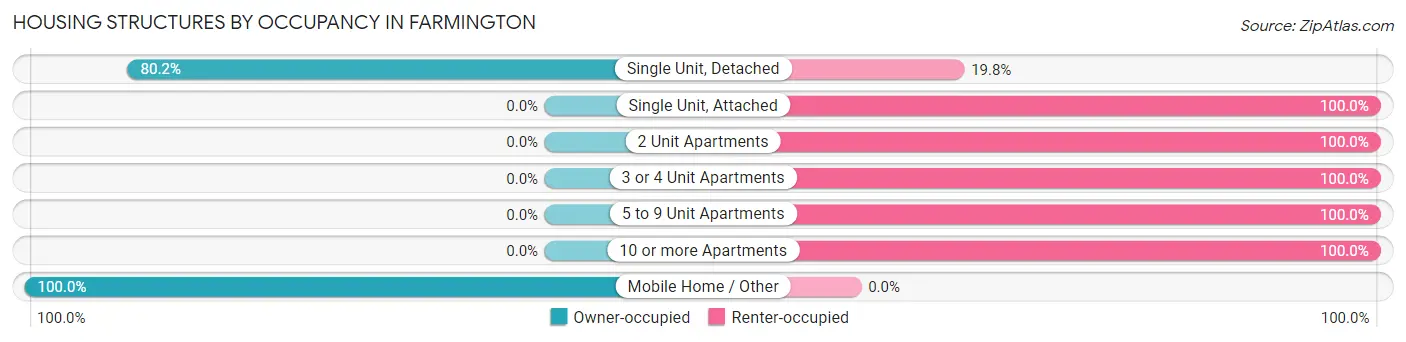
| Structure Type | Owner-occupied | Renter-occupied |
| Single Unit, Detached | 606 (80.2%) | 150 (19.8%) |
| Single Unit, Attached | 0 (0.0%) | 13 (100.0%) |
| 2 Unit Apartments | 0 (0.0%) | 24 (100.0%) |
| 3 or 4 Unit Apartments | 0 (0.0%) | 39 (100.0%) |
| 5 to 9 Unit Apartments | 0 (0.0%) | 15 (100.0%) |
| 10 or more Apartments | 0 (0.0%) | 24 (100.0%) |
| Mobile Home / Other | 27 (100.0%) | 0 (0.0%) |
| Total | 633 (70.5%) | 265 (29.5%) |
Housing Structures by Number of Rooms in Farmington
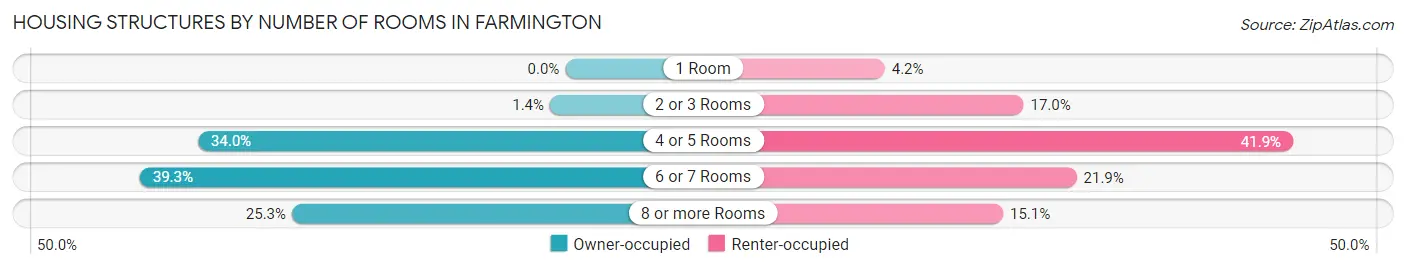
| Number of Rooms | Owner-occupied | Renter-occupied |
| 1 Room | 0 (0.0%) | 11 (4.2%) |
| 2 or 3 Rooms | 9 (1.4%) | 45 (17.0%) |
| 4 or 5 Rooms | 215 (34.0%) | 111 (41.9%) |
| 6 or 7 Rooms | 249 (39.3%) | 58 (21.9%) |
| 8 or more Rooms | 160 (25.3%) | 40 (15.1%) |
| Total | 633 (100.0%) | 265 (100.0%) |
Housing Structure by Heating Type in Farmington
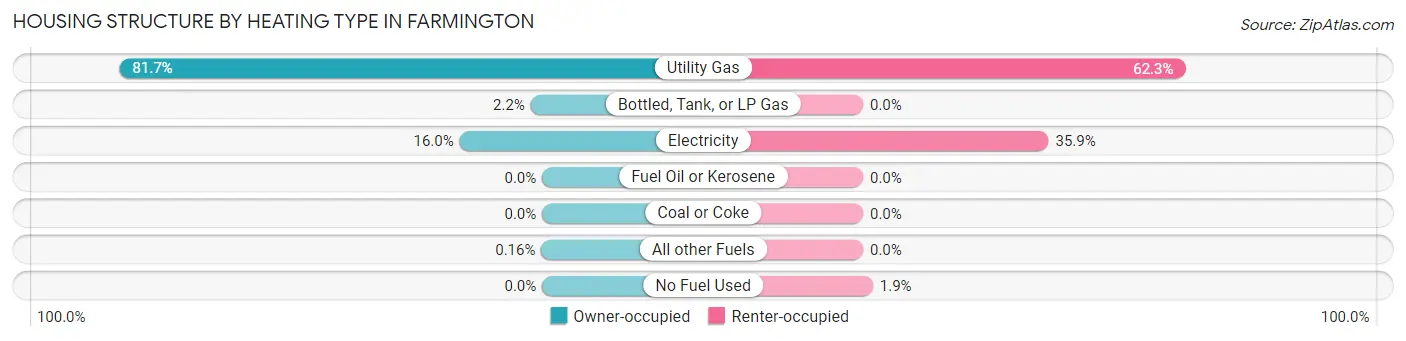
| Heating Type | Owner-occupied | Renter-occupied |
| Utility Gas | 517 (81.7%) | 165 (62.3%) |
| Bottled, Tank, or LP Gas | 14 (2.2%) | 0 (0.0%) |
| Electricity | 101 (16.0%) | 95 (35.8%) |
| Fuel Oil or Kerosene | 0 (0.0%) | 0 (0.0%) |
| Coal or Coke | 0 (0.0%) | 0 (0.0%) |
| All other Fuels | 1 (0.2%) | 0 (0.0%) |
| No Fuel Used | 0 (0.0%) | 5 (1.9%) |
| Total | 633 (100.0%) | 265 (100.0%) |
Household Vehicle Usage in Farmington
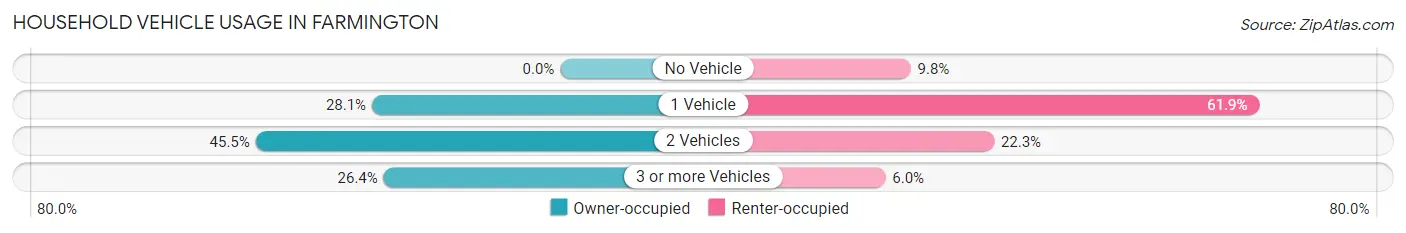
| Vehicles per Household | Owner-occupied | Renter-occupied |
| No Vehicle | 0 (0.0%) | 26 (9.8%) |
| 1 Vehicle | 178 (28.1%) | 164 (61.9%) |
| 2 Vehicles | 288 (45.5%) | 59 (22.3%) |
| 3 or more Vehicles | 167 (26.4%) | 16 (6.0%) |
| Total | 633 (100.0%) | 265 (100.0%) |
Real Estate & Mortgages in Farmington
Real Estate and Mortgage Overview in Farmington
| Characteristic | Without Mortgage | With Mortgage |
| Housing Units | 252 | 381 |
| Median Property Value | $90,000 | $93,200 |
| Median Household Income | $62,727 | $43 |
| Monthly Housing Costs | $521 | $9 |
| Real Estate Taxes | $1,989 | $6 |
Property Value by Mortgage Status in Farmington
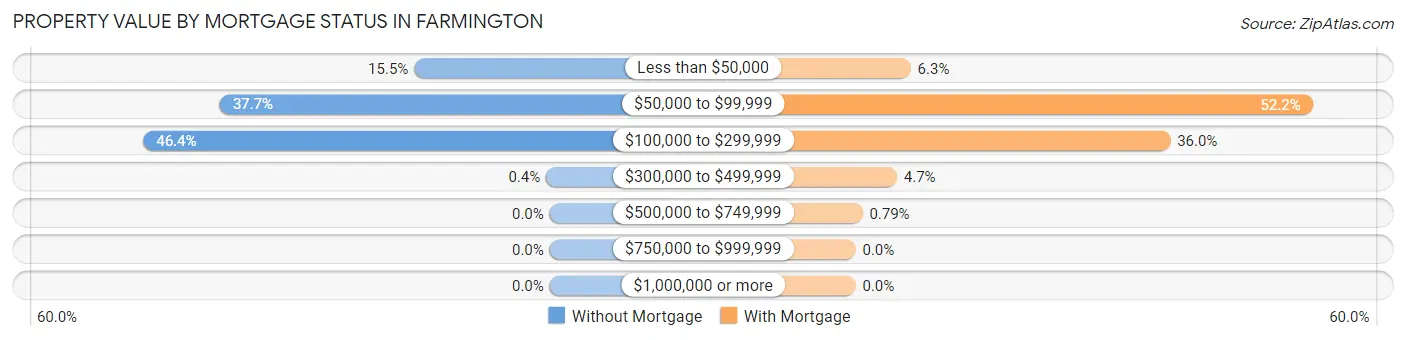
| Property Value | Without Mortgage | With Mortgage |
| Less than $50,000 | 39 (15.5%) | 24 (6.3%) |
| $50,000 to $99,999 | 95 (37.7%) | 199 (52.2%) |
| $100,000 to $299,999 | 117 (46.4%) | 137 (36.0%) |
| $300,000 to $499,999 | 1 (0.4%) | 18 (4.7%) |
| $500,000 to $749,999 | 0 (0.0%) | 3 (0.8%) |
| $750,000 to $999,999 | 0 (0.0%) | 0 (0.0%) |
| $1,000,000 or more | 0 (0.0%) | 0 (0.0%) |
| Total | 252 (100.0%) | 381 (100.0%) |
Household Income by Mortgage Status in Farmington
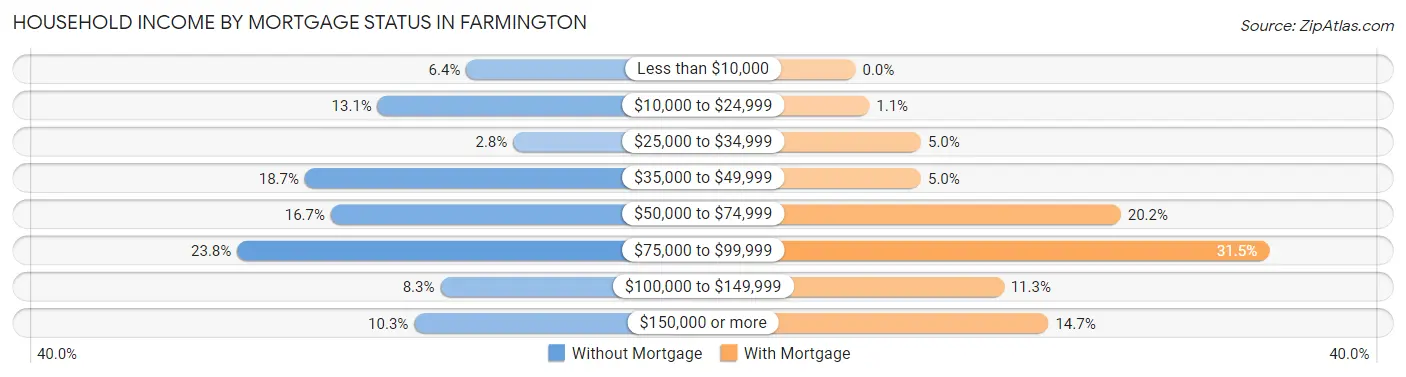
| Household Income | Without Mortgage | With Mortgage |
| Less than $10,000 | 16 (6.4%) | 0 (0.0%) |
| $10,000 to $24,999 | 33 (13.1%) | 4 (1.1%) |
| $25,000 to $34,999 | 7 (2.8%) | 19 (5.0%) |
| $35,000 to $49,999 | 47 (18.6%) | 19 (5.0%) |
| $50,000 to $74,999 | 42 (16.7%) | 77 (20.2%) |
| $75,000 to $99,999 | 60 (23.8%) | 120 (31.5%) |
| $100,000 to $149,999 | 21 (8.3%) | 43 (11.3%) |
| $150,000 or more | 26 (10.3%) | 56 (14.7%) |
| Total | 252 (100.0%) | 381 (100.0%) |
Property Value to Household Income Ratio in Farmington
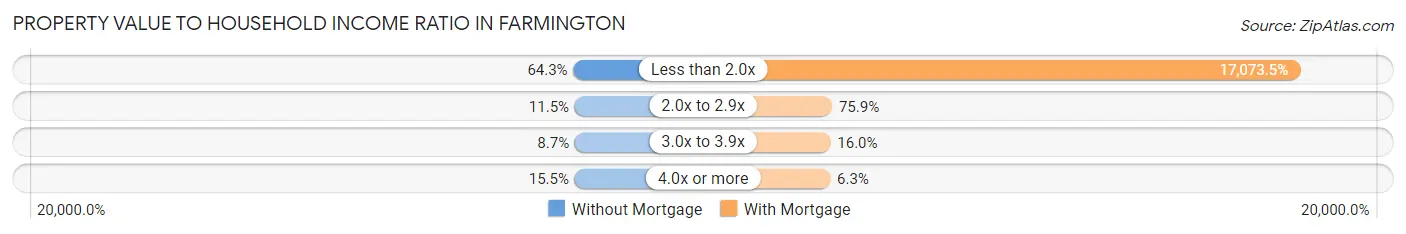
| Value-to-Income Ratio | Without Mortgage | With Mortgage |
| Less than 2.0x | 162 (64.3%) | 65,050 (17,073.5%) |
| 2.0x to 2.9x | 29 (11.5%) | 289 (75.8%) |
| 3.0x to 3.9x | 22 (8.7%) | 61 (16.0%) |
| 4.0x or more | 39 (15.5%) | 24 (6.3%) |
| Total | 252 (100.0%) | 381 (100.0%) |
Real Estate Taxes by Mortgage Status in Farmington
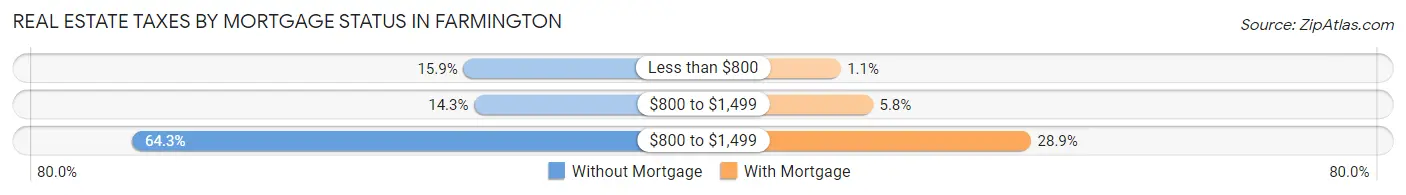
| Property Taxes | Without Mortgage | With Mortgage |
| Less than $800 | 40 (15.9%) | 4 (1.1%) |
| $800 to $1,499 | 36 (14.3%) | 22 (5.8%) |
| $800 to $1,499 | 162 (64.3%) | 110 (28.9%) |
| Total | 252 (100.0%) | 381 (100.0%) |
Health & Disability in Farmington
Health Insurance Coverage by Age in Farmington
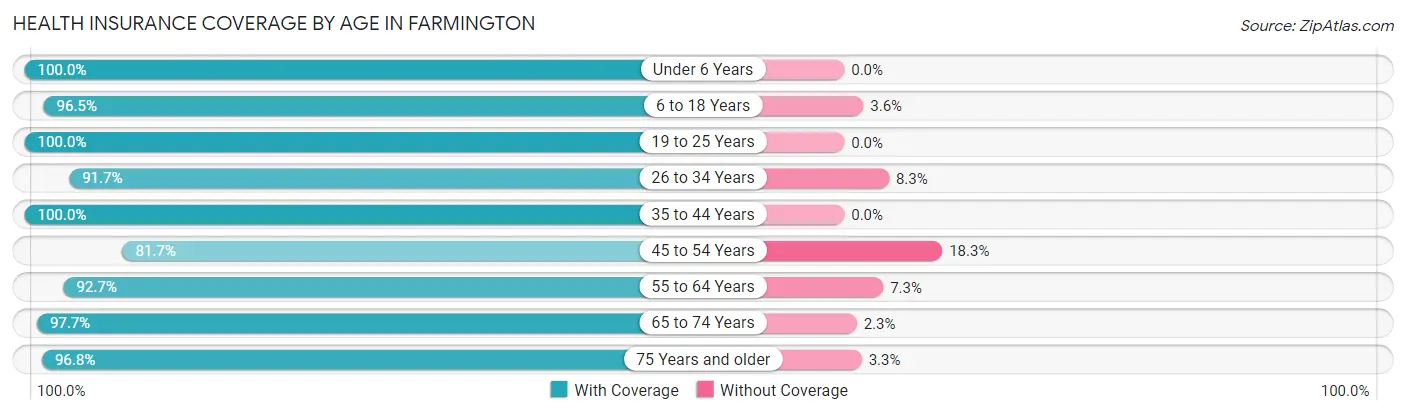
| Age Bracket | With Coverage | Without Coverage |
| Under 6 Years | 121 (100.0%) | 0 (0.0%) |
| 6 to 18 Years | 435 (96.5%) | 16 (3.5%) |
| 19 to 25 Years | 156 (100.0%) | 0 (0.0%) |
| 26 to 34 Years | 264 (91.7%) | 24 (8.3%) |
| 35 to 44 Years | 270 (100.0%) | 0 (0.0%) |
| 45 to 54 Years | 188 (81.7%) | 42 (18.3%) |
| 55 to 64 Years | 230 (92.7%) | 18 (7.3%) |
| 65 to 74 Years | 169 (97.7%) | 4 (2.3%) |
| 75 Years and older | 149 (96.8%) | 5 (3.3%) |
| Total | 1,982 (94.8%) | 109 (5.2%) |
Health Insurance Coverage by Citizenship Status in Farmington
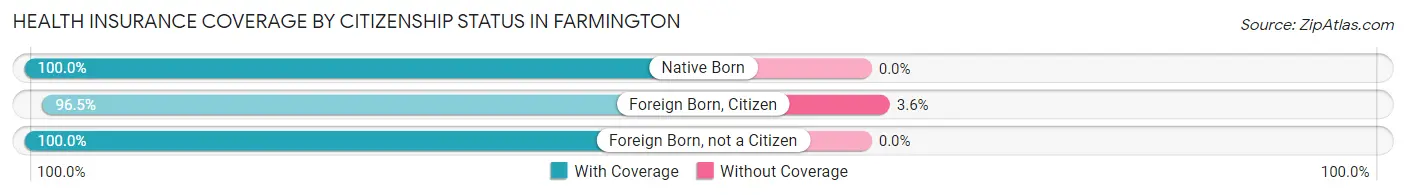
| Citizenship Status | With Coverage | Without Coverage |
| Native Born | 121 (100.0%) | 0 (0.0%) |
| Foreign Born, Citizen | 435 (96.5%) | 16 (3.5%) |
| Foreign Born, not a Citizen | 156 (100.0%) | 0 (0.0%) |
Health Insurance Coverage by Household Income in Farmington
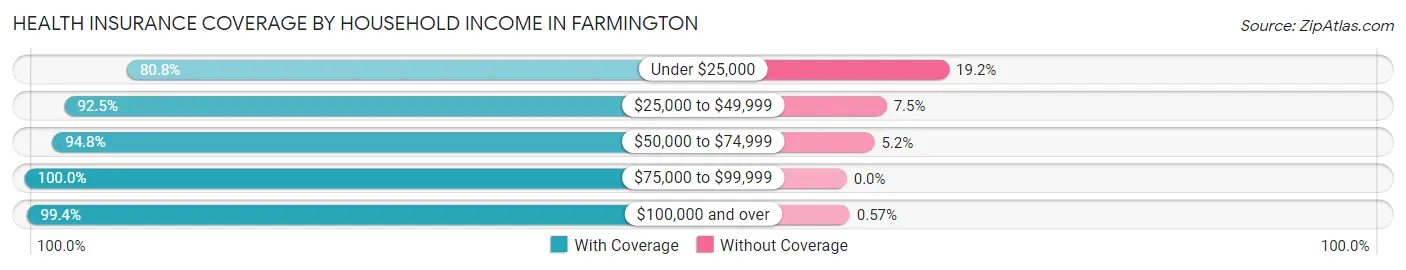
| Household Income | With Coverage | Without Coverage |
| Under $25,000 | 198 (80.8%) | 47 (19.2%) |
| $25,000 to $49,999 | 297 (92.5%) | 24 (7.5%) |
| $50,000 to $74,999 | 639 (94.8%) | 35 (5.2%) |
| $75,000 to $99,999 | 328 (100.0%) | 0 (0.0%) |
| $100,000 and over | 520 (99.4%) | 3 (0.6%) |
Public vs Private Health Insurance Coverage by Age in Farmington
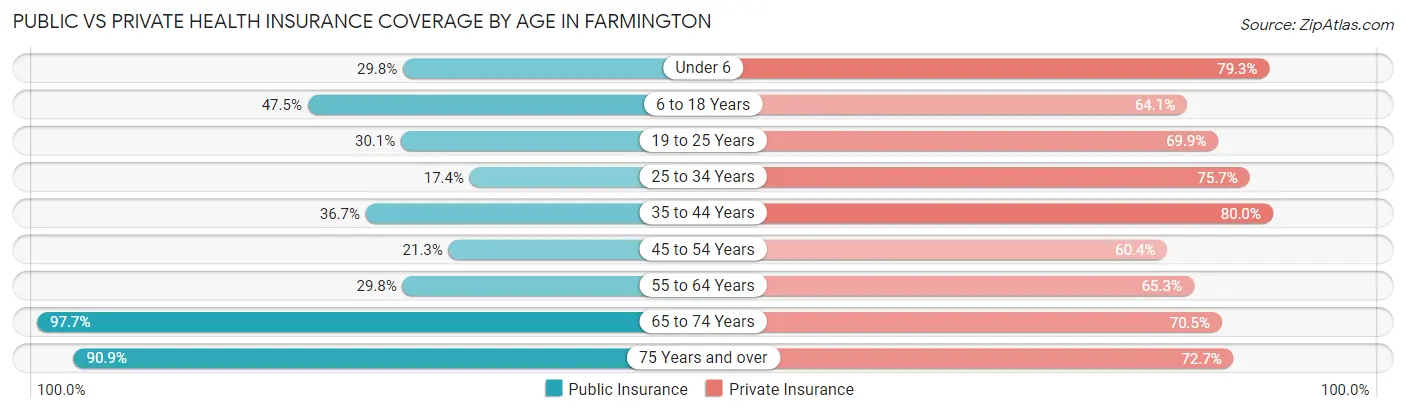
| Age Bracket | Public Insurance | Private Insurance |
| Under 6 | 36 (29.7%) | 96 (79.3%) |
| 6 to 18 Years | 214 (47.4%) | 289 (64.1%) |
| 19 to 25 Years | 47 (30.1%) | 109 (69.9%) |
| 25 to 34 Years | 50 (17.4%) | 218 (75.7%) |
| 35 to 44 Years | 99 (36.7%) | 216 (80.0%) |
| 45 to 54 Years | 49 (21.3%) | 139 (60.4%) |
| 55 to 64 Years | 74 (29.8%) | 162 (65.3%) |
| 65 to 74 Years | 169 (97.7%) | 122 (70.5%) |
| 75 Years and over | 140 (90.9%) | 112 (72.7%) |
| Total | 878 (42.0%) | 1,463 (70.0%) |
Disability Status by Sex by Age in Farmington
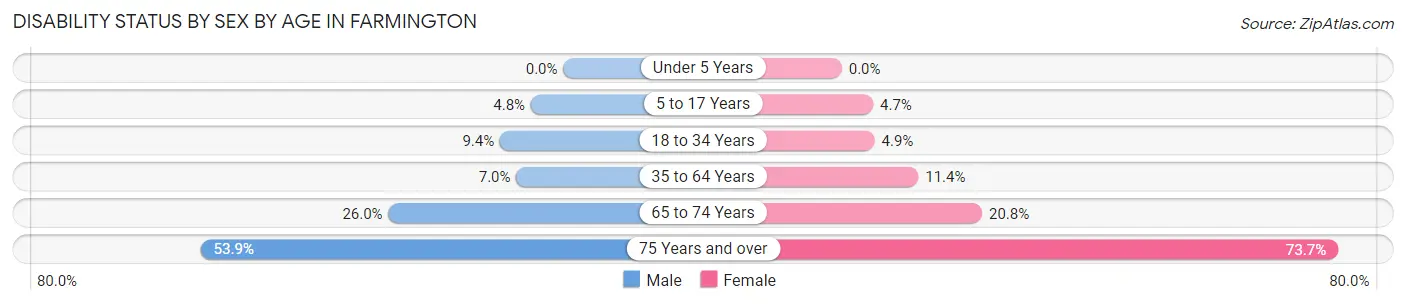
| Age Bracket | Male | Female |
| Under 5 Years | 0 (0.0%) | 0 (0.0%) |
| 5 to 17 Years | 11 (4.8%) | 10 (4.6%) |
| 18 to 34 Years | 22 (9.4%) | 11 (4.9%) |
| 35 to 64 Years | 27 (7.0%) | 41 (11.4%) |
| 65 to 74 Years | 20 (26.0%) | 20 (20.8%) |
| 75 Years and over | 42 (53.8%) | 56 (73.7%) |
Disability Class by Sex by Age in Farmington
Disability Class: Hearing Difficulty
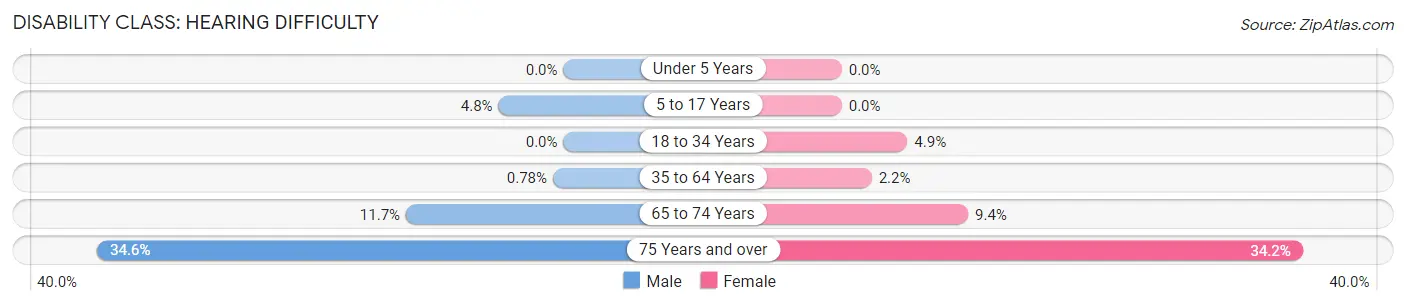
| Age Bracket | Male | Female |
| Under 5 Years | 0 (0.0%) | 0 (0.0%) |
| 5 to 17 Years | 11 (4.8%) | 0 (0.0%) |
| 18 to 34 Years | 0 (0.0%) | 11 (4.9%) |
| 35 to 64 Years | 3 (0.8%) | 8 (2.2%) |
| 65 to 74 Years | 9 (11.7%) | 9 (9.4%) |
| 75 Years and over | 27 (34.6%) | 26 (34.2%) |
Disability Class: Vision Difficulty
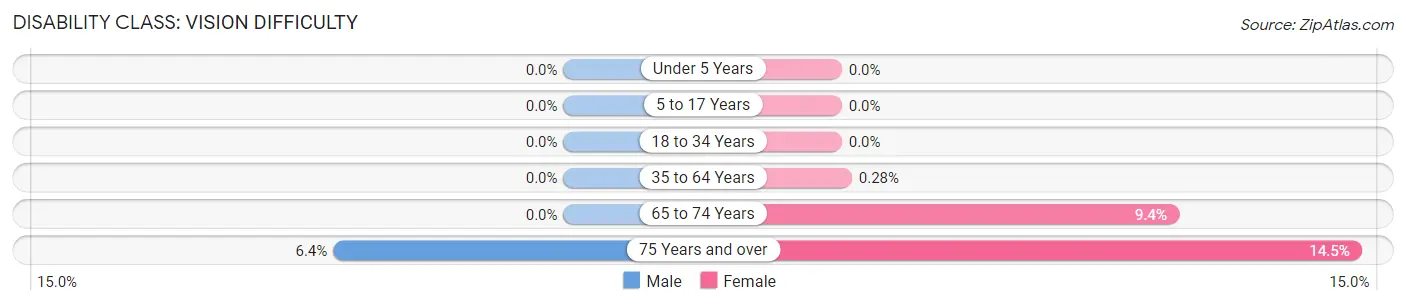
| Age Bracket | Male | Female |
| Under 5 Years | 0 (0.0%) | 0 (0.0%) |
| 5 to 17 Years | 0 (0.0%) | 0 (0.0%) |
| 18 to 34 Years | 0 (0.0%) | 0 (0.0%) |
| 35 to 64 Years | 0 (0.0%) | 1 (0.3%) |
| 65 to 74 Years | 0 (0.0%) | 9 (9.4%) |
| 75 Years and over | 5 (6.4%) | 11 (14.5%) |
Disability Class: Cognitive Difficulty
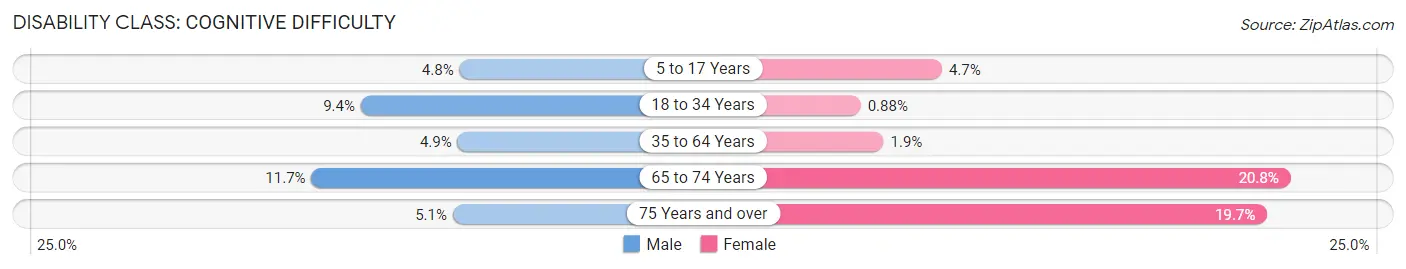
| Age Bracket | Male | Female |
| 5 to 17 Years | 11 (4.8%) | 10 (4.6%) |
| 18 to 34 Years | 22 (9.4%) | 2 (0.9%) |
| 35 to 64 Years | 19 (4.9%) | 7 (1.9%) |
| 65 to 74 Years | 9 (11.7%) | 20 (20.8%) |
| 75 Years and over | 4 (5.1%) | 15 (19.7%) |
Disability Class: Ambulatory Difficulty
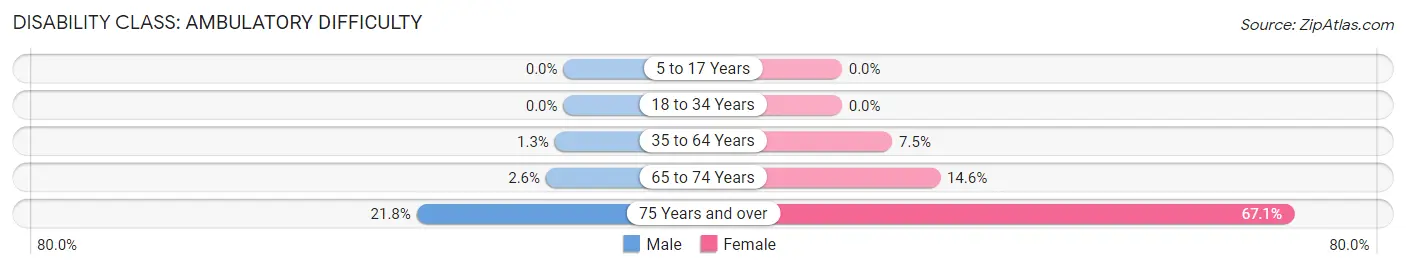
| Age Bracket | Male | Female |
| 5 to 17 Years | 0 (0.0%) | 0 (0.0%) |
| 18 to 34 Years | 0 (0.0%) | 0 (0.0%) |
| 35 to 64 Years | 5 (1.3%) | 27 (7.5%) |
| 65 to 74 Years | 2 (2.6%) | 14 (14.6%) |
| 75 Years and over | 17 (21.8%) | 51 (67.1%) |
Disability Class: Self-Care Difficulty
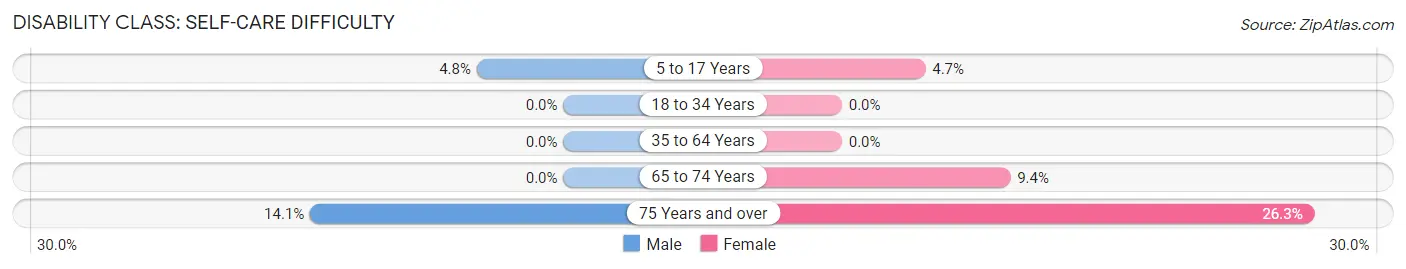
| Age Bracket | Male | Female |
| 5 to 17 Years | 11 (4.8%) | 10 (4.6%) |
| 18 to 34 Years | 0 (0.0%) | 0 (0.0%) |
| 35 to 64 Years | 0 (0.0%) | 0 (0.0%) |
| 65 to 74 Years | 0 (0.0%) | 9 (9.4%) |
| 75 Years and over | 11 (14.1%) | 20 (26.3%) |
Technology Access in Farmington
Computing Device Access in Farmington
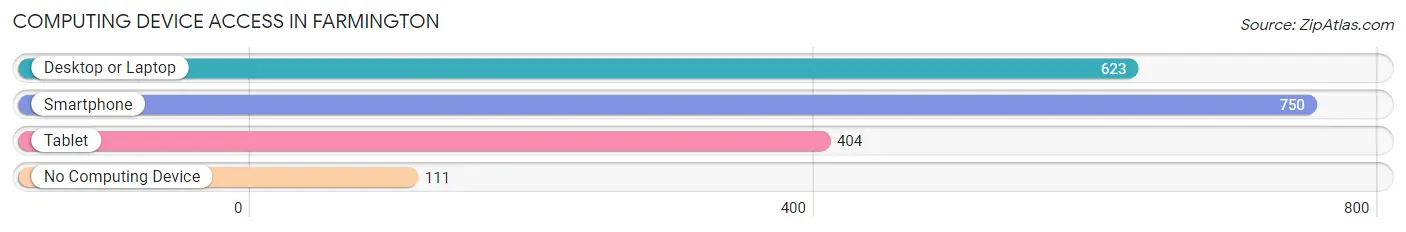
| Device Type | # Households | % Households |
| Desktop or Laptop | 623 | 69.4% |
| Smartphone | 750 | 83.5% |
| Tablet | 404 | 45.0% |
| No Computing Device | 111 | 12.4% |
| Total | 898 | 100.0% |
Internet Access in Farmington
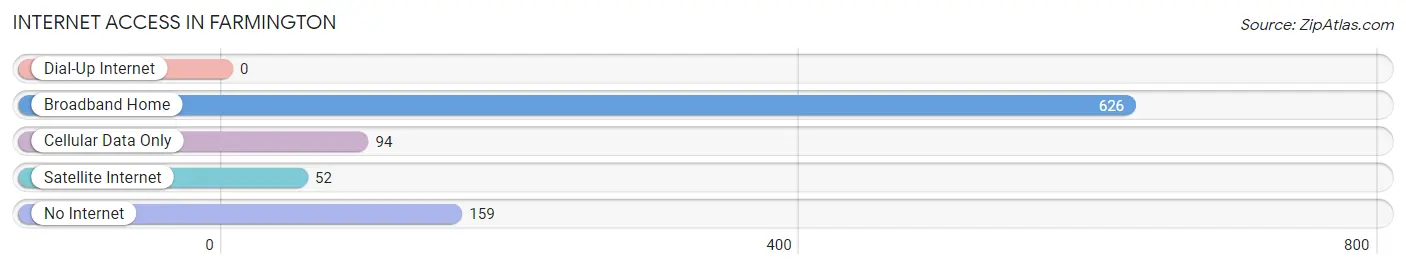
| Internet Type | # Households | % Households |
| Dial-Up Internet | 0 | 0.0% |
| Broadband Home | 626 | 69.7% |
| Cellular Data Only | 94 | 10.5% |
| Satellite Internet | 52 | 5.8% |
| No Internet | 159 | 17.7% |
| Total | 898 | 100.0% |
Farmington Summary
History
The history of Farmington, Illinois dates back to the early 1800s when the area was first settled by pioneers. The town was founded in 1819 by William and Mary Ann Smith, who were among the first settlers in the area. The town was originally known as Smith's Settlement, but was later renamed Farmington in 1837.
The town was an important stop on the Underground Railroad, with many of the town's residents helping to hide and transport escaped slaves. The town was also a major stop on the Illinois Central Railroad, which helped to spur economic growth in the area.
In the late 1800s, Farmington was a thriving agricultural community, with many of the town's residents working in the local farms and orchards. The town was also home to several businesses, including a flour mill, a sawmill, a brickyard, and a blacksmith shop.
Geography
Farmington is located in Fulton County, Illinois, about 30 miles northwest of Peoria. The town is situated on the banks of the Spoon River, which flows through the town and provides a scenic backdrop. The town is surrounded by rolling hills and farmland, and is home to several parks and recreational areas.
The climate in Farmington is typical of the Midwest, with hot summers and cold winters. The average temperature in the summer is around 75 degrees Fahrenheit, while the average temperature in the winter is around 25 degrees Fahrenheit.
Economy
The economy of Farmington is largely based on agriculture, with many of the town's residents working in the local farms and orchards. The town is also home to several businesses, including a flour mill, a sawmill, a brickyard, and a blacksmith shop.
In recent years, the town has seen an influx of new businesses, including a winery, a brewery, and several restaurants. The town is also home to several small manufacturing companies, as well as a number of retail stores.
Demographics
As of the 2010 census, the population of Farmington was 2,845. The town is predominantly white, with about 95% of the population identifying as Caucasian. The median household income in the town is $45,000, and the median age is 40.
Conclusion
Farmington, Illinois is a small town with a rich history and a vibrant economy. The town is home to many farms and orchards, as well as several businesses and retail stores. The town is predominantly white, with a median household income of $45,000 and a median age of 40. Farmington is a great place to live, work, and raise a family.
Common Questions
What is Per Capita Income in Farmington?
Per Capita income in Farmington is $30,057.
What is the Median Family Income in Farmington?
Median Family Income in Farmington is $64,861.
What is the Median Household income in Farmington?
Median Household Income in Farmington is $59,091.
What is Income or Wage Gap in Farmington?
Income or Wage Gap in Farmington is 25.1%.
Women in Farmington earn 74.9 cents for every dollar earned by a man.
What is Inequality or Gini Index in Farmington?
Inequality or Gini Index in Farmington is 0.39.
What is the Total Population of Farmington?
Total Population of Farmington is 2,097.
What is the Total Male Population of Farmington?
Total Male Population of Farmington is 1,046.
What is the Total Female Population of Farmington?
Total Female Population of Farmington is 1,051.
What is the Ratio of Males per 100 Females in Farmington?
There are 99.52 Males per 100 Females in Farmington.
What is the Ratio of Females per 100 Males in Farmington?
There are 100.48 Females per 100 Males in Farmington.
What is the Median Population Age in Farmington?
Median Population Age in Farmington is 36.7 Years.
What is the Average Family Size in Farmington
Average Family Size in Farmington is 2.9 People.
What is the Average Household Size in Farmington
Average Household Size in Farmington is 2.3 People.
How Large is the Labor Force in Farmington?
There are 1,117 People in the Labor Forcein in Farmington.
What is the Percentage of People in the Labor Force in Farmington?
68.8% of People are in the Labor Force in Farmington.
What is the Unemployment Rate in Farmington?
Unemployment Rate in Farmington is 8.4%.