Fairview, IL Map & Demographics
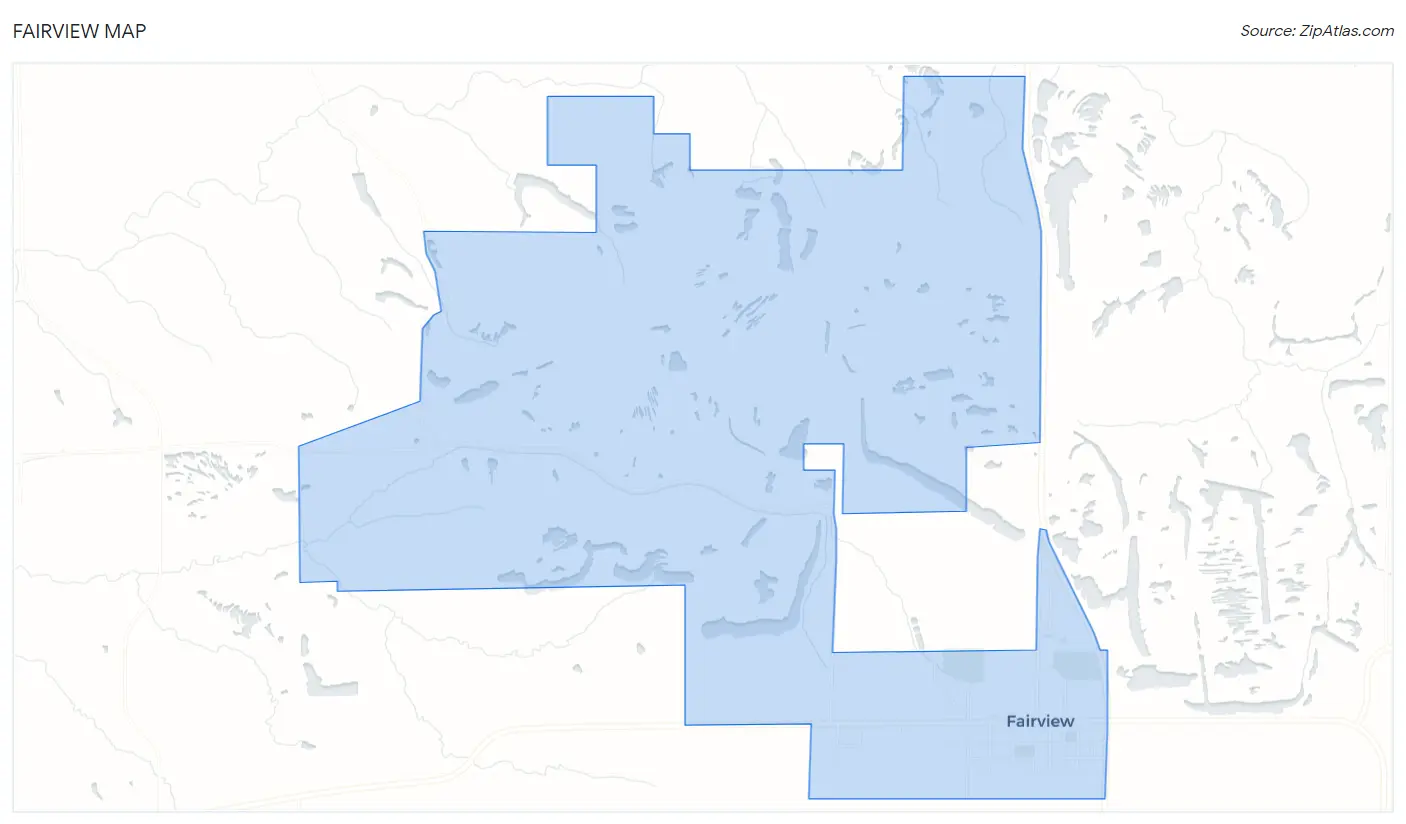
Fairview Map
Fairview Overview
$37,069
PER CAPITA INCOME
$86,591
AVG FAMILY INCOME
$70,417
AVG HOUSEHOLD INCOME
36.4%
WAGE / INCOME GAP [ % ]
63.6¢/ $1
WAGE / INCOME GAP [ $ ]
0.34
INEQUALITY / GINI INDEX
380
TOTAL POPULATION
185
MALE POPULATION
195
FEMALE POPULATION
94.87
MALES / 100 FEMALES
105.41
FEMALES / 100 MALES
49.9
MEDIAN AGE
2.8
AVG FAMILY SIZE
2.1
AVG HOUSEHOLD SIZE
190
LABOR FORCE [ PEOPLE ]
57.6%
PERCENT IN LABOR FORCE
Fairview Zip Codes
Fairview Area Codes
Income in Fairview
Income Overview in Fairview
Per Capita Income in Fairview is $37,069, while median incomes of families and households are $86,591 and $70,417 respectively.
| Characteristic | Number | Measure |
| Per Capita Income | 380 | $37,069 |
| Median Family Income | 98 | $86,591 |
| Mean Family Income | 98 | $90,239 |
| Median Household Income | 184 | $70,417 |
| Mean Household Income | 184 | $76,904 |
| Income Deficit | 98 | $0 |
| Wage / Income Gap (%) | 380 | 36.38% |
| Wage / Income Gap ($) | 380 | 63.62¢ per $1 |
| Gini / Inequality Index | 380 | 0.34 |
Earnings by Sex in Fairview
Average Earnings in Fairview are $45,667, $50,104 for men and $31,875 for women, a difference of 36.4%.
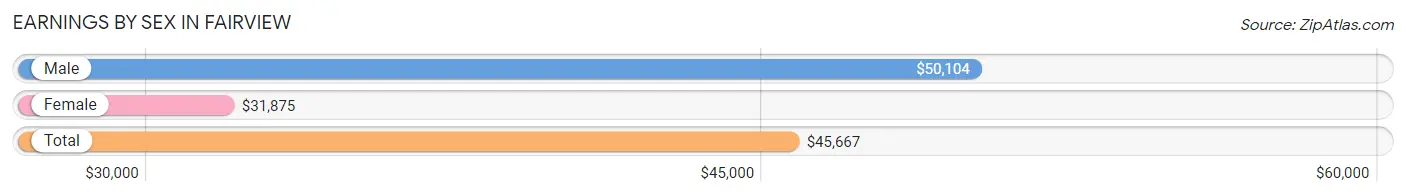
| Sex | Number | Average Earnings |
| Male | 105 (50.0%) | $50,104 |
| Female | 105 (50.0%) | $31,875 |
| Total | 210 (100.0%) | $45,667 |
Earnings by Sex by Income Bracket in Fairview
The most common earnings brackets in Fairview are $55,000 to $64,999 for men (15 | 14.3%) and $5,000 to $7,499 for women (17 | 16.2%).
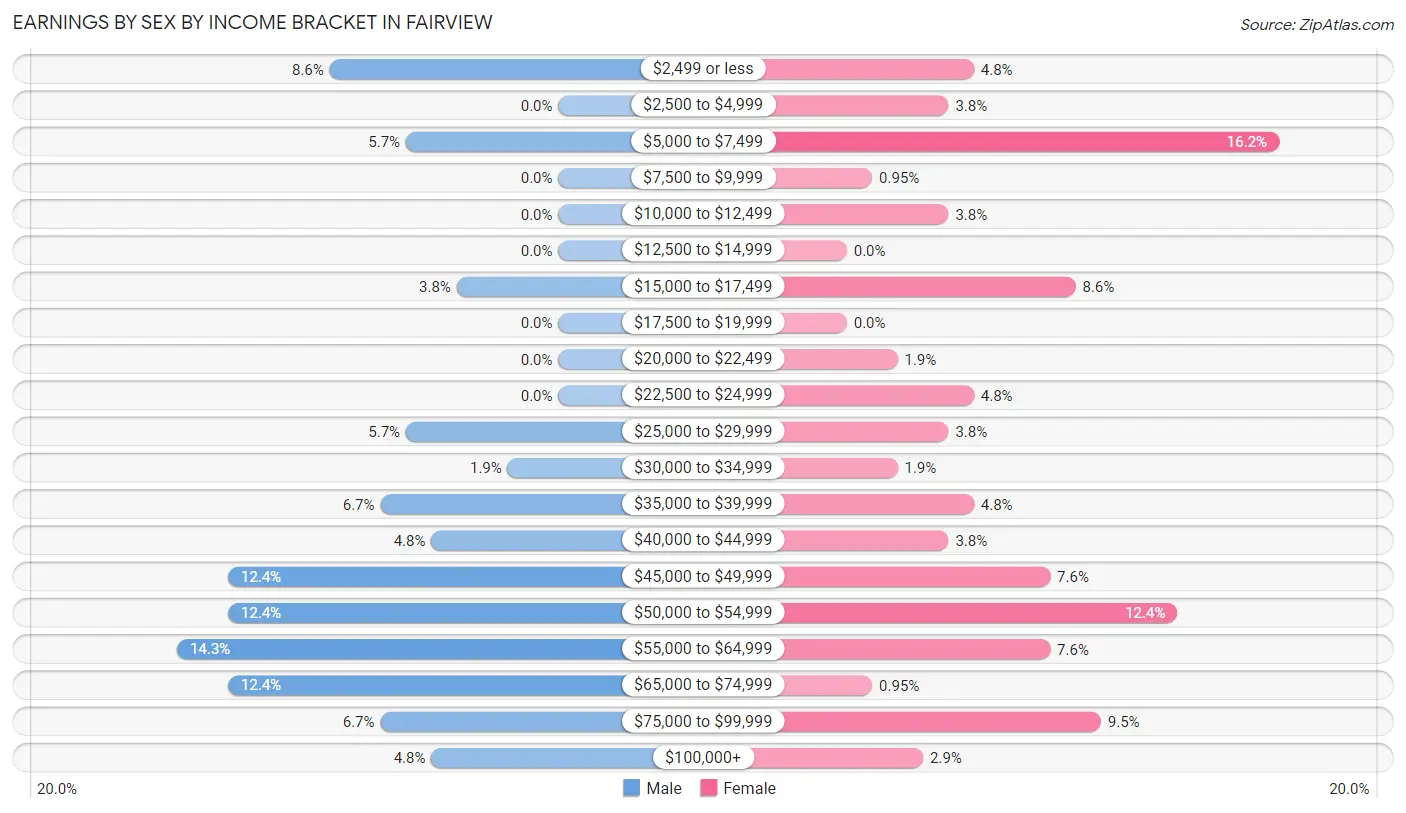
| Income | Male | Female |
| $2,499 or less | 9 (8.6%) | 5 (4.8%) |
| $2,500 to $4,999 | 0 (0.0%) | 4 (3.8%) |
| $5,000 to $7,499 | 6 (5.7%) | 17 (16.2%) |
| $7,500 to $9,999 | 0 (0.0%) | 1 (0.9%) |
| $10,000 to $12,499 | 0 (0.0%) | 4 (3.8%) |
| $12,500 to $14,999 | 0 (0.0%) | 0 (0.0%) |
| $15,000 to $17,499 | 4 (3.8%) | 9 (8.6%) |
| $17,500 to $19,999 | 0 (0.0%) | 0 (0.0%) |
| $20,000 to $22,499 | 0 (0.0%) | 2 (1.9%) |
| $22,500 to $24,999 | 0 (0.0%) | 5 (4.8%) |
| $25,000 to $29,999 | 6 (5.7%) | 4 (3.8%) |
| $30,000 to $34,999 | 2 (1.9%) | 2 (1.9%) |
| $35,000 to $39,999 | 7 (6.7%) | 5 (4.8%) |
| $40,000 to $44,999 | 5 (4.8%) | 4 (3.8%) |
| $45,000 to $49,999 | 13 (12.4%) | 8 (7.6%) |
| $50,000 to $54,999 | 13 (12.4%) | 13 (12.4%) |
| $55,000 to $64,999 | 15 (14.3%) | 8 (7.6%) |
| $65,000 to $74,999 | 13 (12.4%) | 1 (0.9%) |
| $75,000 to $99,999 | 7 (6.7%) | 10 (9.5%) |
| $100,000+ | 5 (4.8%) | 3 (2.9%) |
| Total | 105 (100.0%) | 105 (100.0%) |
Earnings by Sex by Educational Attainment in Fairview
Average earnings in Fairview are $50,625 for men and $35,250 for women, a difference of 30.4%. Men with an educational attainment of college or associate's degree enjoy the highest average annual earnings of $60,000, while those with high school diploma education earn the least with $36,000. Women with an educational attainment of college or associate's degree earn the most with the average annual earnings of $29,375, while those with high school diploma education have the smallest earnings of $17,222.
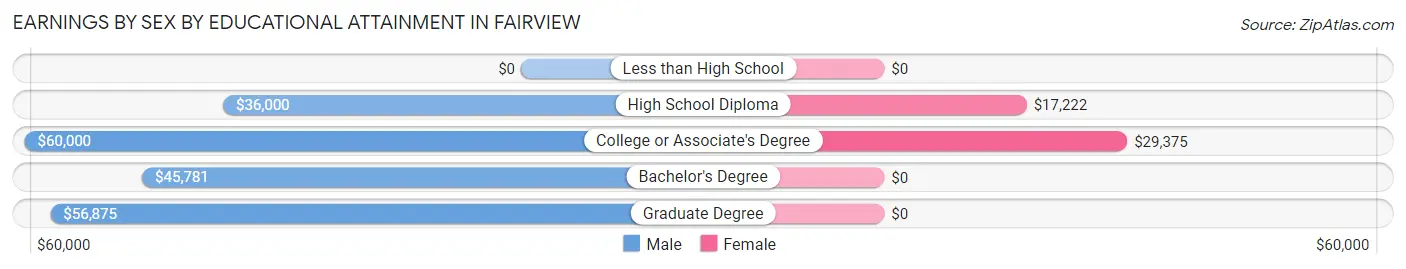
| Educational Attainment | Male Income | Female Income |
| Less than High School | - | - |
| High School Diploma | $36,000 | $17,222 |
| College or Associate's Degree | $60,000 | $29,375 |
| Bachelor's Degree | $45,781 | $0 |
| Graduate Degree | $56,875 | $0 |
| Total | $50,625 | $35,250 |
Family Income in Fairview
Family Income Brackets in Fairview
According to the Fairview family income data, there are 32 families falling into the $100,000 to $149,999 income range, which is the most common income bracket and makes up 32.7% of all families.
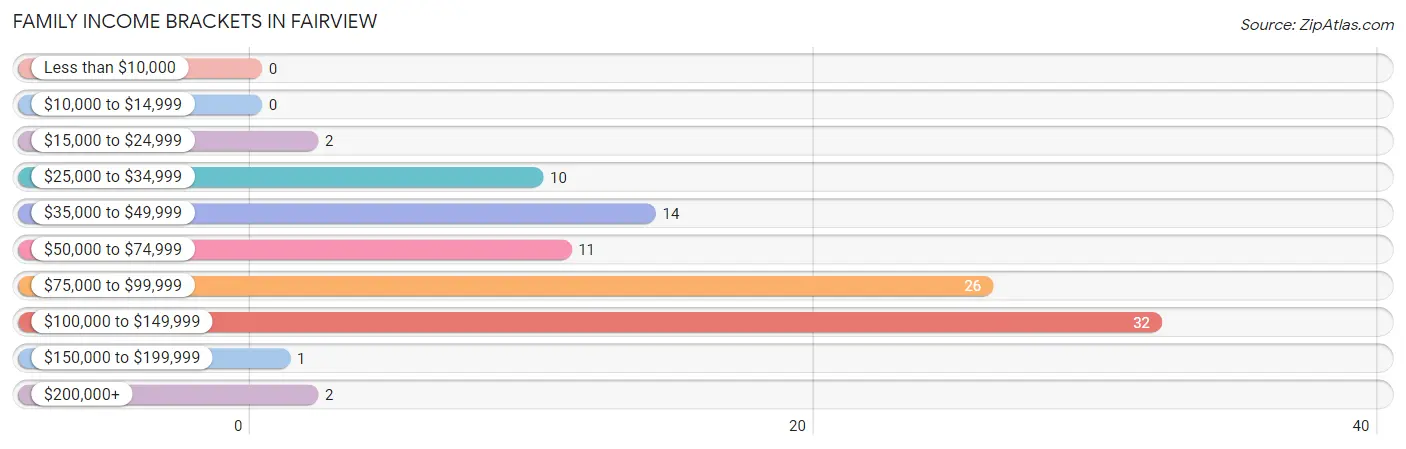
| Income Bracket | # Families | % Families |
| Less than $10,000 | 0 | 0.0% |
| $10,000 to $14,999 | 0 | 0.0% |
| $15,000 to $24,999 | 2 | 2.0% |
| $25,000 to $34,999 | 10 | 10.2% |
| $35,000 to $49,999 | 14 | 14.3% |
| $50,000 to $74,999 | 11 | 11.2% |
| $75,000 to $99,999 | 26 | 26.5% |
| $100,000 to $149,999 | 32 | 32.7% |
| $150,000 to $199,999 | 1 | 1.0% |
| $200,000+ | 2 | 2.0% |
Family Income by Famaliy Size in Fairview
4-person families (21 | 21.4%) account for the highest median family income in Fairview with $118,125 per family, while 2-person families (60 | 61.2%) have the highest median income of $43,036 per family member.
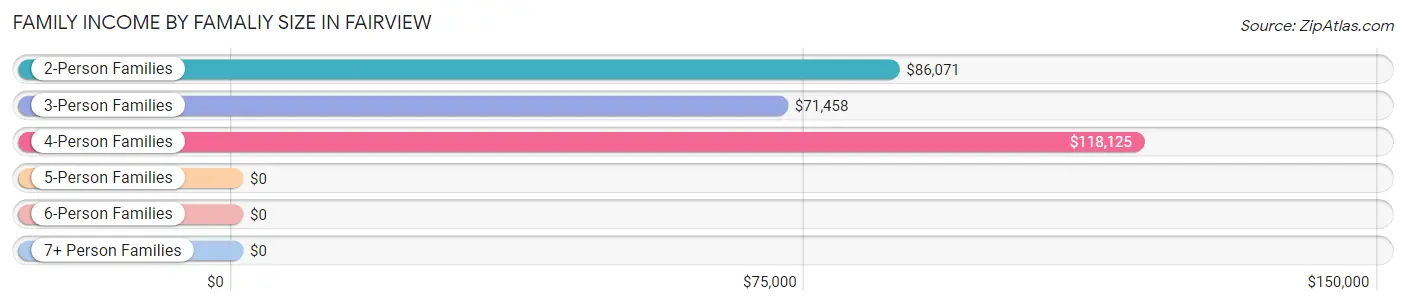
| Income Bracket | # Families | Median Income |
| 2-Person Families | 60 (61.2%) | $86,071 |
| 3-Person Families | 17 (17.3%) | $71,458 |
| 4-Person Families | 21 (21.4%) | $118,125 |
| 5-Person Families | 0 (0.0%) | $0 |
| 6-Person Families | 0 (0.0%) | $0 |
| 7+ Person Families | 0 (0.0%) | $0 |
| Total | 98 (100.0%) | $86,591 |
Family Income by Number of Earners in Fairview
The median family income in Fairview is $86,591, with families comprising 3+ earners (5) having the highest median family income of $148,438, while families with no earners (15) have the lowest median family income of $50,625, accounting for 5.1% and 15.3% of families, respectively.
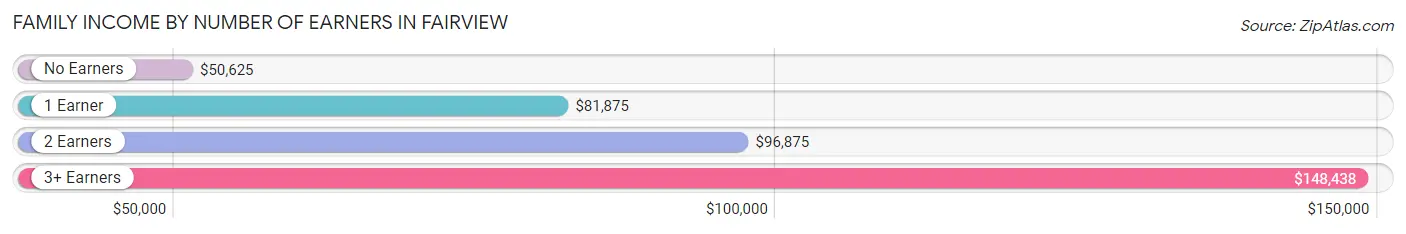
| Number of Earners | # Families | Median Income |
| No Earners | 15 (15.3%) | $50,625 |
| 1 Earner | 35 (35.7%) | $81,875 |
| 2 Earners | 43 (43.9%) | $96,875 |
| 3+ Earners | 5 (5.1%) | $148,438 |
| Total | 98 (100.0%) | $86,591 |
Household Income in Fairview
Household Income Brackets in Fairview
With 50 households falling in the category, the $100,000 to $149,999 income range is the most frequent in Fairview, accounting for 27.2% of all households.
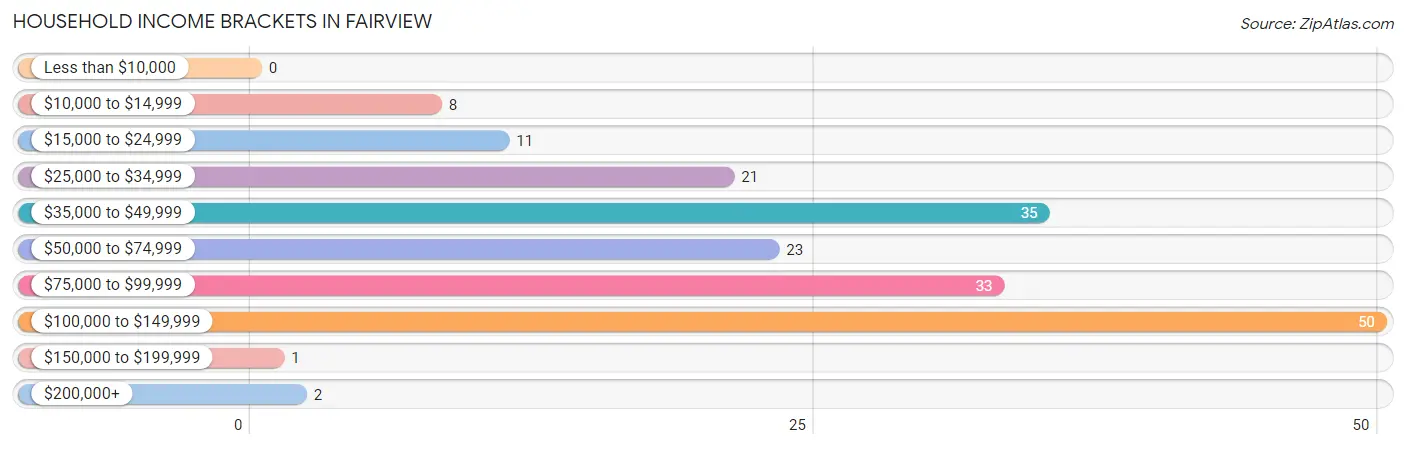
| Income Bracket | # Households | % Households |
| Less than $10,000 | 0 | 0.0% |
| $10,000 to $14,999 | 8 | 4.3% |
| $15,000 to $24,999 | 11 | 6.0% |
| $25,000 to $34,999 | 21 | 11.4% |
| $35,000 to $49,999 | 35 | 19.0% |
| $50,000 to $74,999 | 23 | 12.5% |
| $75,000 to $99,999 | 33 | 17.9% |
| $100,000 to $149,999 | 50 | 27.2% |
| $150,000 to $199,999 | 1 | 0.5% |
| $200,000+ | 2 | 1.1% |
Household Income by Householder Age in Fairview
The median household income in Fairview is $70,417, with the highest median household income of $78,750 found in the 45 to 64 years age bracket for the primary householder. A total of 72 households (39.1%) fall into this category. Meanwhile, the 15 to 24 years age bracket for the primary householder has the lowest median household income of $0, with 8 households (4.3%) in this group.
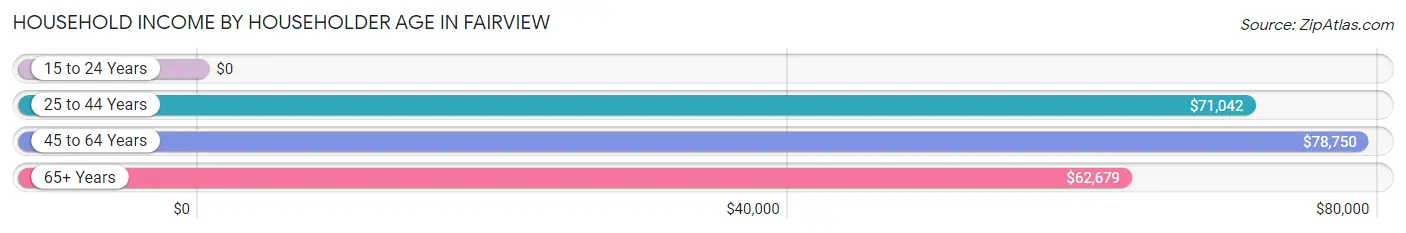
| Income Bracket | # Households | Median Income |
| 15 to 24 Years | 8 (4.3%) | $0 |
| 25 to 44 Years | 33 (17.9%) | $71,042 |
| 45 to 64 Years | 72 (39.1%) | $78,750 |
| 65+ Years | 71 (38.6%) | $62,679 |
| Total | 184 (100.0%) | $70,417 |
Poverty in Fairview
Income Below Poverty by Sex and Age in Fairview
With 4.9% poverty level for males and 9.2% for females among the residents of Fairview, 6 to 11 year old males and under 5 year old females are the most vulnerable to poverty, with 3 males (21.4%) and 7 females (63.6%) in their respective age groups living below the poverty level.
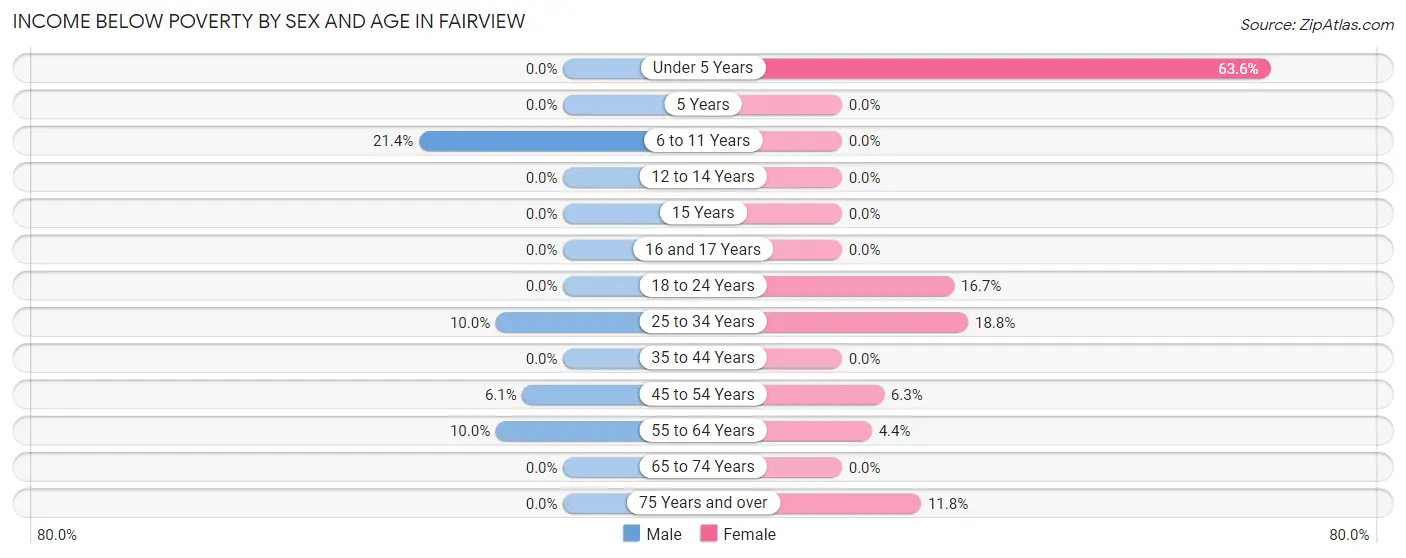
| Age Bracket | Male | Female |
| Under 5 Years | 0 (0.0%) | 7 (63.6%) |
| 5 Years | 0 (0.0%) | 0 (0.0%) |
| 6 to 11 Years | 3 (21.4%) | 0 (0.0%) |
| 12 to 14 Years | 0 (0.0%) | 0 (0.0%) |
| 15 Years | 0 (0.0%) | 0 (0.0%) |
| 16 and 17 Years | 0 (0.0%) | 0 (0.0%) |
| 18 to 24 Years | 0 (0.0%) | 2 (16.7%) |
| 25 to 34 Years | 2 (10.0%) | 3 (18.8%) |
| 35 to 44 Years | 0 (0.0%) | 0 (0.0%) |
| 45 to 54 Years | 2 (6.1%) | 2 (6.2%) |
| 55 to 64 Years | 2 (10.0%) | 2 (4.4%) |
| 65 to 74 Years | 0 (0.0%) | 0 (0.0%) |
| 75 Years and over | 0 (0.0%) | 2 (11.8%) |
| Total | 9 (4.9%) | 18 (9.2%) |
Income Above Poverty by Sex and Age in Fairview
According to the poverty statistics in Fairview, males aged under 5 years and females aged 12 to 14 years are the age groups that are most secure financially, with 100.0% of males and 100.0% of females in these age groups living above the poverty line.
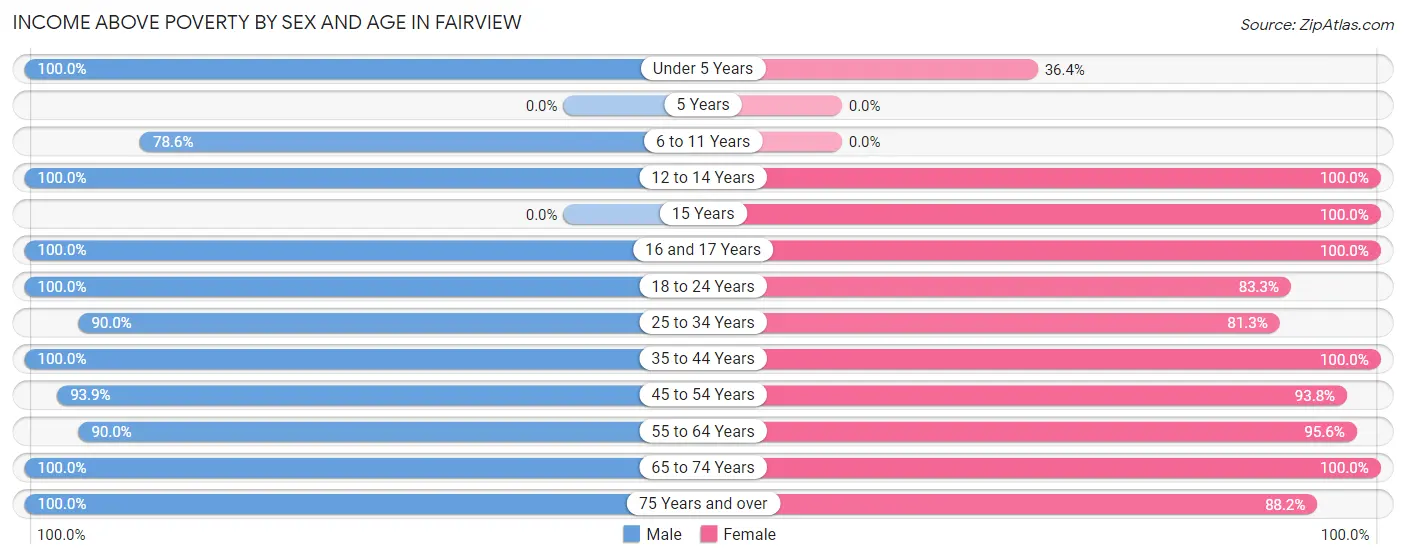
| Age Bracket | Male | Female |
| Under 5 Years | 5 (100.0%) | 4 (36.4%) |
| 5 Years | 0 (0.0%) | 0 (0.0%) |
| 6 to 11 Years | 11 (78.6%) | 0 (0.0%) |
| 12 to 14 Years | 6 (100.0%) | 5 (100.0%) |
| 15 Years | 0 (0.0%) | 9 (100.0%) |
| 16 and 17 Years | 1 (100.0%) | 8 (100.0%) |
| 18 to 24 Years | 17 (100.0%) | 10 (83.3%) |
| 25 to 34 Years | 18 (90.0%) | 13 (81.2%) |
| 35 to 44 Years | 14 (100.0%) | 7 (100.0%) |
| 45 to 54 Years | 31 (93.9%) | 30 (93.8%) |
| 55 to 64 Years | 18 (90.0%) | 43 (95.6%) |
| 65 to 74 Years | 29 (100.0%) | 33 (100.0%) |
| 75 Years and over | 26 (100.0%) | 15 (88.2%) |
| Total | 176 (95.1%) | 177 (90.8%) |
Income Below Poverty Among Married-Couple Families in Fairview
The poverty statistics for married-couple families in Fairview show that 4.6% or 4 of the total 86 families live below the poverty line. Families with 1 or 2 children have the highest poverty rate of 5.7%, comprising of 2 families. On the other hand, families with no children have the lowest poverty rate of 3.9%, which includes 2 families.
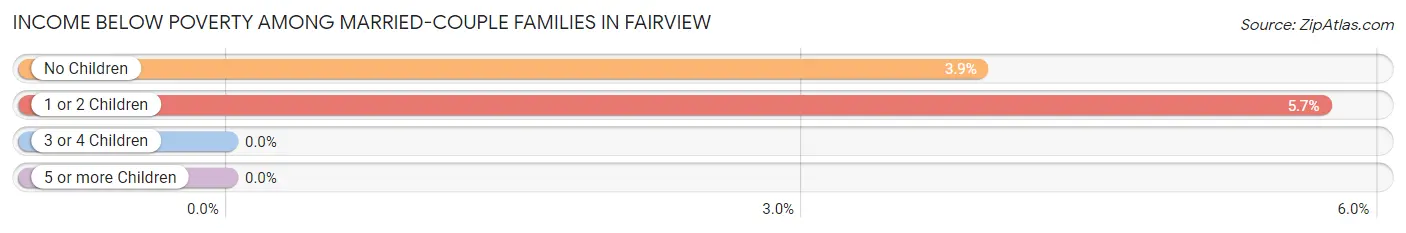
| Children | Above Poverty | Below Poverty |
| No Children | 49 (96.1%) | 2 (3.9%) |
| 1 or 2 Children | 33 (94.3%) | 2 (5.7%) |
| 3 or 4 Children | 0 (0.0%) | 0 (0.0%) |
| 5 or more Children | 0 (0.0%) | 0 (0.0%) |
| Total | 82 (95.4%) | 4 (4.6%) |
Income Below Poverty Among Single-Parent Households in Fairview
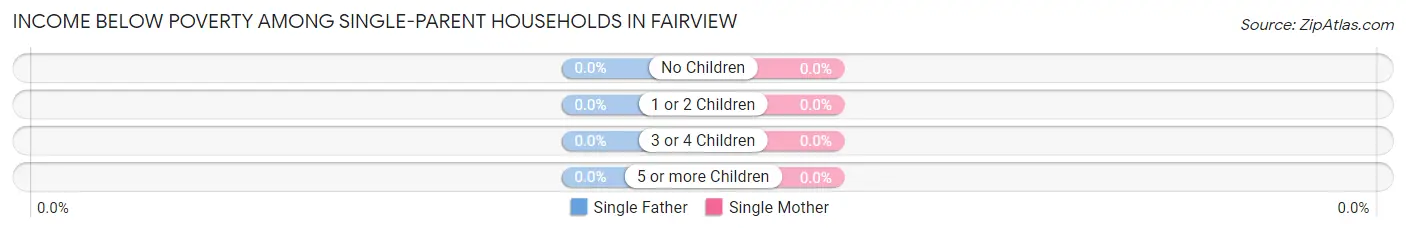
| Children | Single Father | Single Mother |
| No Children | 0 (0.0%) | 0 (0.0%) |
| 1 or 2 Children | 0 (0.0%) | 0 (0.0%) |
| 3 or 4 Children | 0 (0.0%) | 0 (0.0%) |
| 5 or more Children | 0 (0.0%) | 0 (0.0%) |
| Total | 0 (0.0%) | 0 (0.0%) |
Income Below Poverty Among Married-Couple vs Single-Parent Households in Fairview
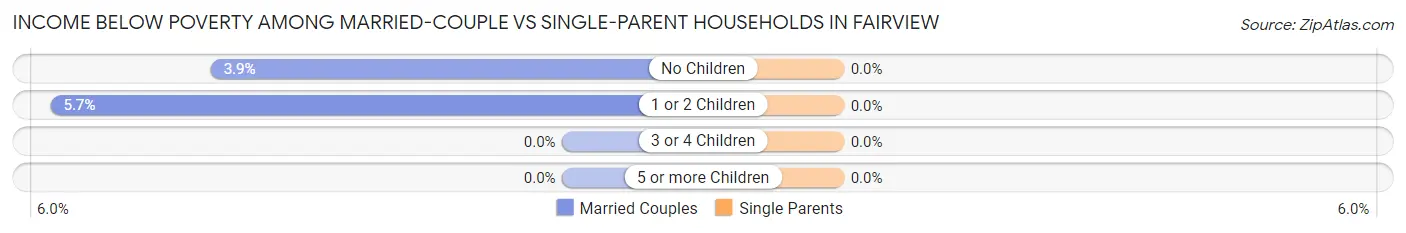
| Children | Married-Couple Families | Single-Parent Households |
| No Children | 2 (3.9%) | 0 (0.0%) |
| 1 or 2 Children | 2 (5.7%) | 0 (0.0%) |
| 3 or 4 Children | 0 (0.0%) | 0 (0.0%) |
| 5 or more Children | 0 (0.0%) | 0 (0.0%) |
| Total | 4 (4.6%) | 0 (0.0%) |
Race in Fairview
The most populous races in Fairview are White / Caucasian (375 | 98.7%), and Two or more Races (5 | 1.3%).
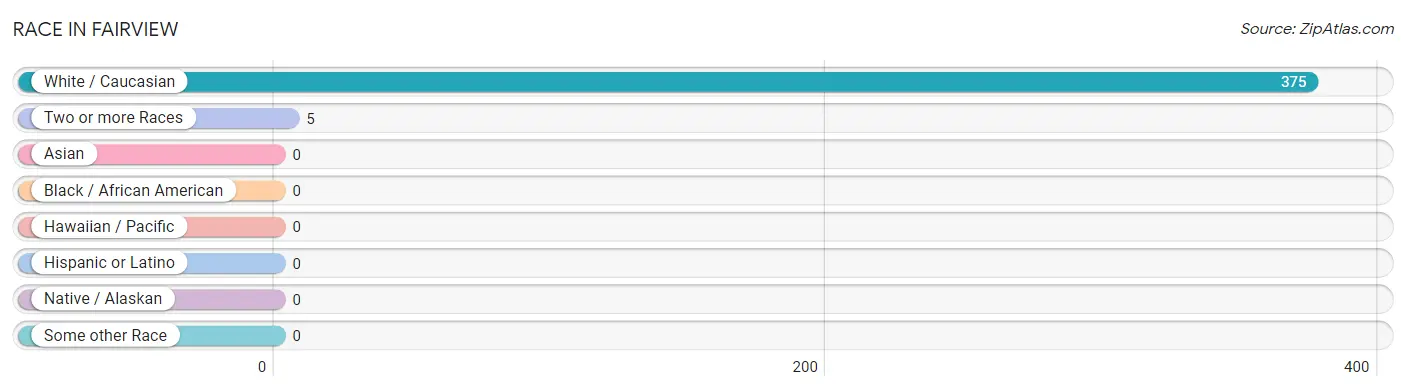
| Race | # Population | % Population |
| Asian | 0 | 0.0% |
| Black / African American | 0 | 0.0% |
| Hawaiian / Pacific | 0 | 0.0% |
| Hispanic or Latino | 0 | 0.0% |
| Native / Alaskan | 0 | 0.0% |
| White / Caucasian | 375 | 98.7% |
| Two or more Races | 5 | 1.3% |
| Some other Race | 0 | 0.0% |
| Total | 380 | 100.0% |
Ancestry in Fairview
The most populous ancestries reported in Fairview are German (111 | 29.2%), Irish (68 | 17.9%), English (56 | 14.7%), Italian (22 | 5.8%), and American (16 | 4.2%), together accounting for 71.8% of all Fairview residents.
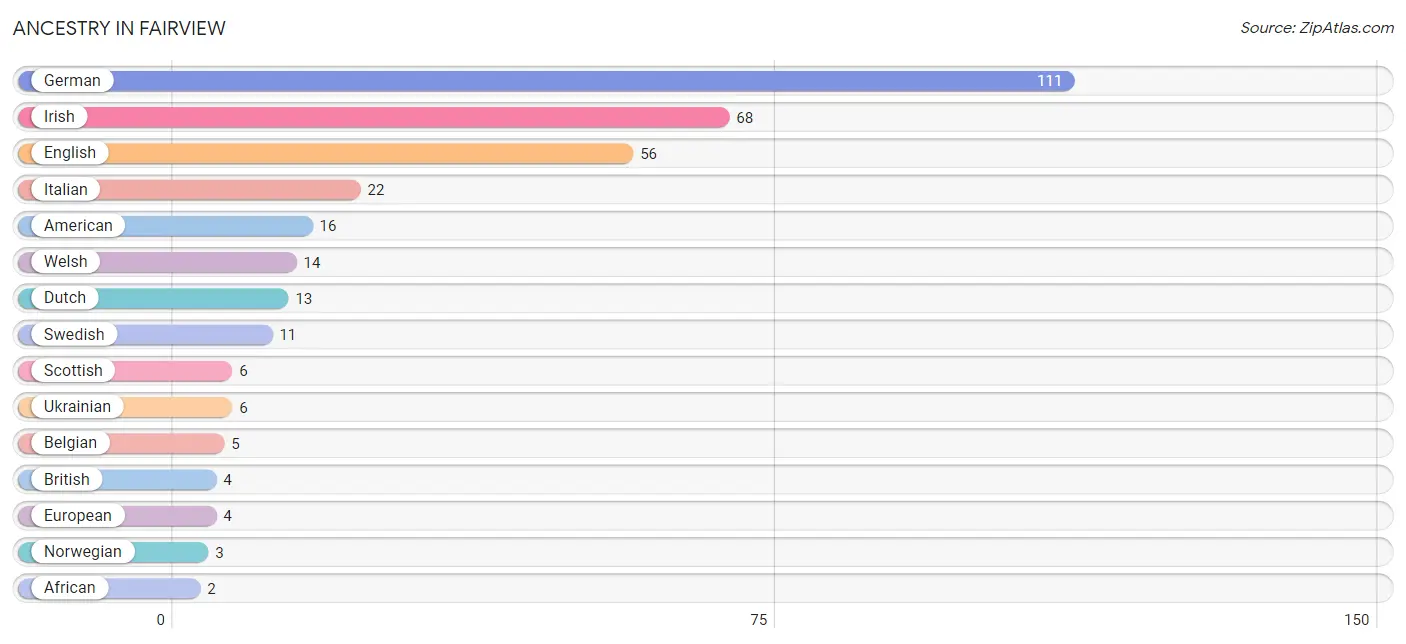
| Ancestry | # Population | % Population |
| African | 2 | 0.5% |
| American | 16 | 4.2% |
| Belgian | 5 | 1.3% |
| British | 4 | 1.1% |
| Burmese | 1 | 0.3% |
| Croatian | 2 | 0.5% |
| Dutch | 13 | 3.4% |
| English | 56 | 14.7% |
| European | 4 | 1.1% |
| French | 1 | 0.3% |
| German | 111 | 29.2% |
| Irish | 68 | 17.9% |
| Italian | 22 | 5.8% |
| Korean | 2 | 0.5% |
| Norwegian | 3 | 0.8% |
| Polish | 1 | 0.3% |
| Scotch-Irish | 2 | 0.5% |
| Scottish | 6 | 1.6% |
| Subsaharan African | 2 | 0.5% |
| Swedish | 11 | 2.9% |
| Ukrainian | 6 | 1.6% |
| Welsh | 14 | 3.7% | View All 22 Rows |
Immigrants in Fairview
The most numerous immigrant groups reported in Fairview came from Europe (3 | 0.8%), Eastern Europe (2 | 0.5%), Ukraine (2 | 0.5%), Germany (1 | 0.3%), and Western Europe (1 | 0.3%), together accounting for 2.4% of all Fairview residents.
| Immigration Origin | # Population | % Population |
| Eastern Europe | 2 | 0.5% |
| Europe | 3 | 0.8% |
| Germany | 1 | 0.3% |
| Ukraine | 2 | 0.5% |
| Western Europe | 1 | 0.3% | View All 5 Rows |
Sex and Age in Fairview
Sex and Age in Fairview
The most populous age groups in Fairview are 45 to 49 Years (24 | 13.0%) for men and 60 to 64 Years (30 | 15.4%) for women.
| Age Bracket | Male | Female |
| Under 5 Years | 5 (2.7%) | 11 (5.6%) |
| 5 to 9 Years | 14 (7.6%) | 0 (0.0%) |
| 10 to 14 Years | 6 (3.2%) | 5 (2.6%) |
| 15 to 19 Years | 8 (4.3%) | 21 (10.8%) |
| 20 to 24 Years | 10 (5.4%) | 8 (4.1%) |
| 25 to 29 Years | 16 (8.6%) | 5 (2.6%) |
| 30 to 34 Years | 4 (2.2%) | 11 (5.6%) |
| 35 to 39 Years | 0 (0.0%) | 2 (1.0%) |
| 40 to 44 Years | 14 (7.6%) | 5 (2.6%) |
| 45 to 49 Years | 24 (13.0%) | 22 (11.3%) |
| 50 to 54 Years | 9 (4.9%) | 10 (5.1%) |
| 55 to 59 Years | 9 (4.9%) | 15 (7.7%) |
| 60 to 64 Years | 11 (5.9%) | 30 (15.4%) |
| 65 to 69 Years | 20 (10.8%) | 9 (4.6%) |
| 70 to 74 Years | 9 (4.9%) | 24 (12.3%) |
| 75 to 79 Years | 19 (10.3%) | 3 (1.5%) |
| 80 to 84 Years | 2 (1.1%) | 5 (2.6%) |
| 85 Years and over | 5 (2.7%) | 9 (4.6%) |
| Total | 185 (100.0%) | 195 (100.0%) |
Families and Households in Fairview
Median Family Size in Fairview
The median family size in Fairview is 2.80 persons per family, with married-couple families (86 | 87.8%) accounting for the largest median family size of 2.91 persons per family. On the other hand, single male/father families (2 | 2.0%) represent the smallest median family size with 1.50 persons per family.
| Family Type | # Families | Family Size |
| Married-Couple | 86 (87.8%) | 2.91 |
| Single Male/Father | 2 (2.0%) | 1.50 |
| Single Female/Mother | 10 (10.2%) | 2.10 |
| Total Families | 98 (100.0%) | 2.80 |
Median Household Size in Fairview
The median household size in Fairview is 2.07 persons per household, with married-couple households (86 | 46.7%) accounting for the largest median household size of 2.97 persons per household. non-family households (86 | 46.7%) represent the smallest median household size with 1.17 persons per household.
| Household Type | # Households | Household Size |
| Married-Couple | 86 (46.7%) | 2.97 |
| Single Male/Father | 2 (1.1%) | 1.50 |
| Single Female/Mother | 10 (5.4%) | 2.10 |
| Non-family | 86 (46.7%) | 1.17 |
| Total Households | 184 (100.0%) | 2.07 |
Household Size by Marriage Status in Fairview
Out of a total of 184 households in Fairview, 98 (53.3%) are family households, while 86 (46.7%) are nonfamily households. The most numerous type of family households are 2-person households, comprising 60, and the most common type of nonfamily households are 1-person households, comprising 66.
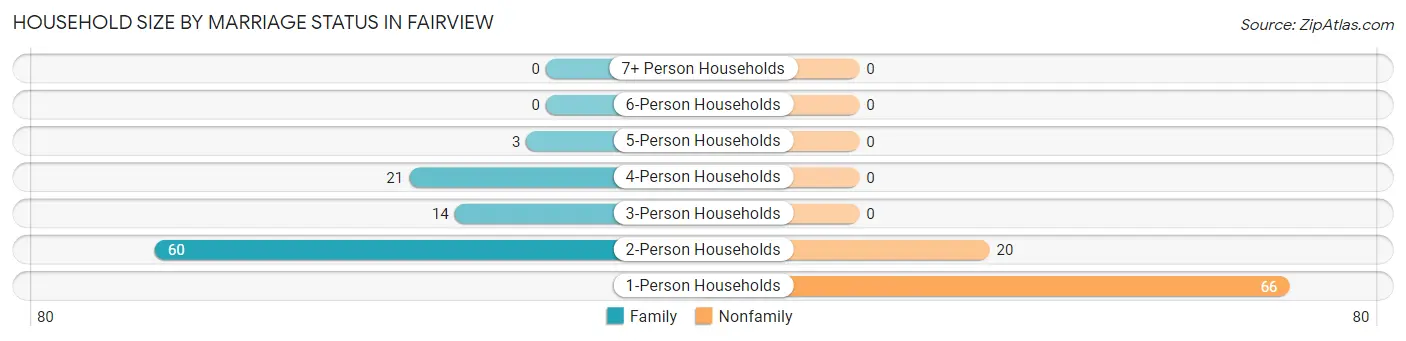
| Household Size | Family Households | Nonfamily Households |
| 1-Person Households | - | 66 (35.9%) |
| 2-Person Households | 60 (32.6%) | 20 (10.9%) |
| 3-Person Households | 14 (7.6%) | 0 (0.0%) |
| 4-Person Households | 21 (11.4%) | 0 (0.0%) |
| 5-Person Households | 3 (1.6%) | 0 (0.0%) |
| 6-Person Households | 0 (0.0%) | 0 (0.0%) |
| 7+ Person Households | 0 (0.0%) | 0 (0.0%) |
| Total | 98 (53.3%) | 86 (46.7%) |
Female Fertility in Fairview
Fertility by Age in Fairview
Average fertility rate in Fairview is 38.0 births per 1,000 women. Women in the age bracket of 20 to 34 years have the highest fertility rate with 125.0 births per 1,000 women. Women in the age bracket of 20 to 34 years acount for 100.0% of all women with births.
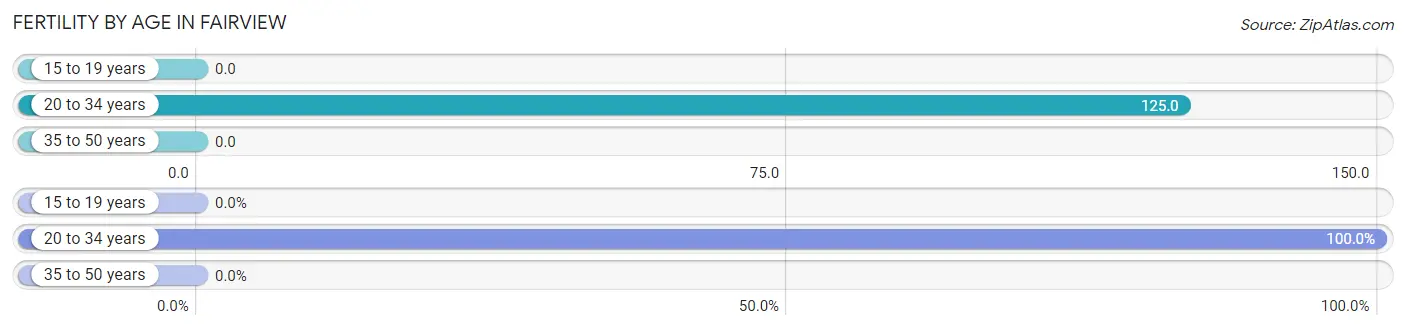
| Age Bracket | Women with Births | Births / 1,000 Women |
| 15 to 19 years | 0 (0.0%) | 0.0 |
| 20 to 34 years | 3 (100.0%) | 125.0 |
| 35 to 50 years | 0 (0.0%) | 0.0 |
| Total | 3 (100.0%) | 38.0 |
Fertility by Age by Marriage Status in Fairview
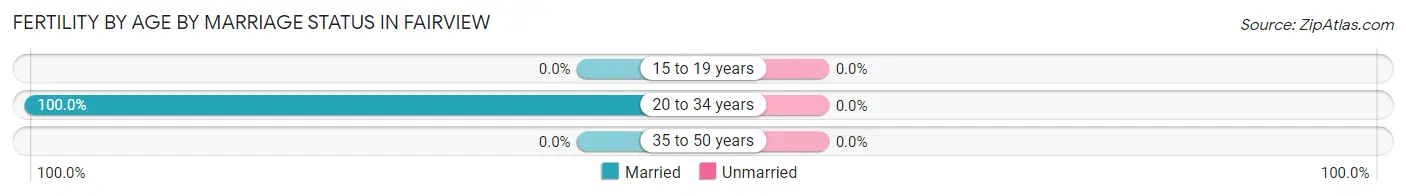
| Age Bracket | Married | Unmarried |
| 15 to 19 years | 0 (0.0%) | 0 (0.0%) |
| 20 to 34 years | 3 (100.0%) | 0 (0.0%) |
| 35 to 50 years | 0 (0.0%) | 0 (0.0%) |
| Total | 3 (100.0%) | 0 (0.0%) |
Fertility by Education in Fairview
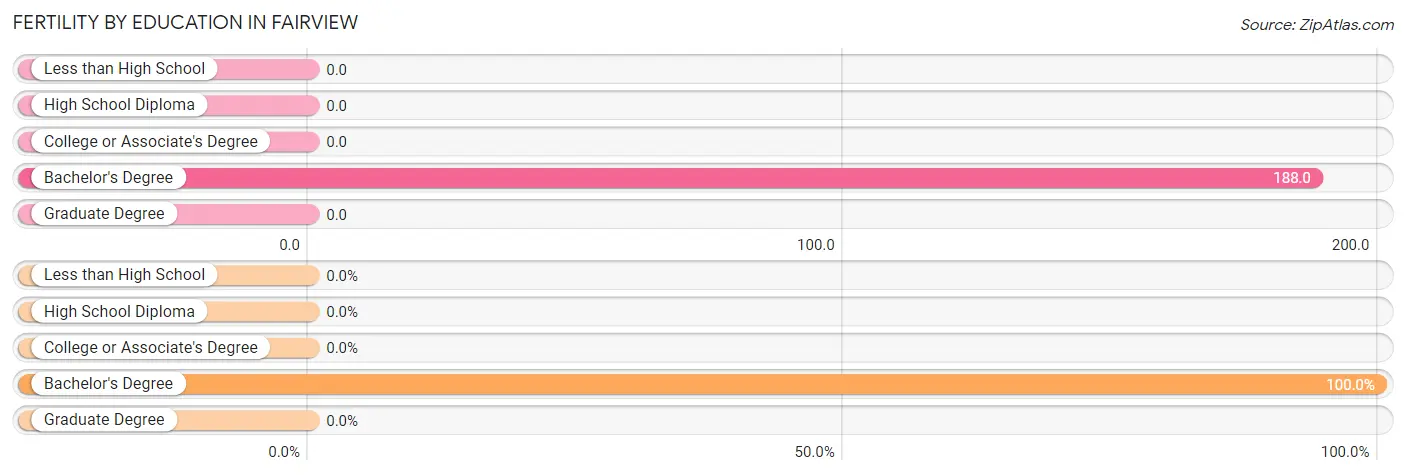
| Educational Attainment | Women with Births | Births / 1,000 Women |
| Less than High School | 0 (0.0%) | 0.0 |
| High School Diploma | 0 (0.0%) | 0.0 |
| College or Associate's Degree | 0 (0.0%) | 0.0 |
| Bachelor's Degree | 3 (100.0%) | 188.0 |
| Graduate Degree | 0 (0.0%) | 0.0 |
| Total | 3 (100.0%) | 38.0 |
Fertility by Education by Marriage Status in Fairview
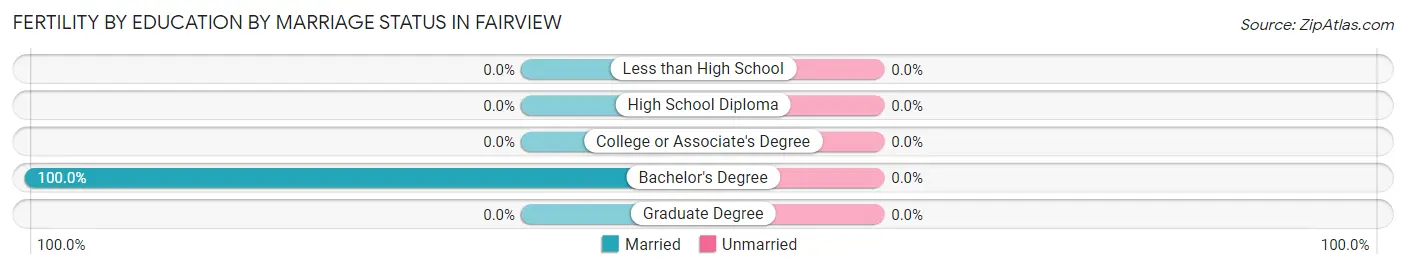
| Educational Attainment | Married | Unmarried |
| Less than High School | 0 (0.0%) | 0 (0.0%) |
| High School Diploma | 0 (0.0%) | 0 (0.0%) |
| College or Associate's Degree | 0 (0.0%) | 0 (0.0%) |
| Bachelor's Degree | 3 (100.0%) | 0 (0.0%) |
| Graduate Degree | 0 (0.0%) | 0 (0.0%) |
| Total | 3 (100.0%) | 0 (0.0%) |
Employment Characteristics in Fairview
Employment by Class of Employer in Fairview
Among the 190 employed individuals in Fairview, private company employees (126 | 66.3%), not-for-profit organizations (23 | 12.1%), and state government employees (21 | 11.1%) make up the most common classes of employment.
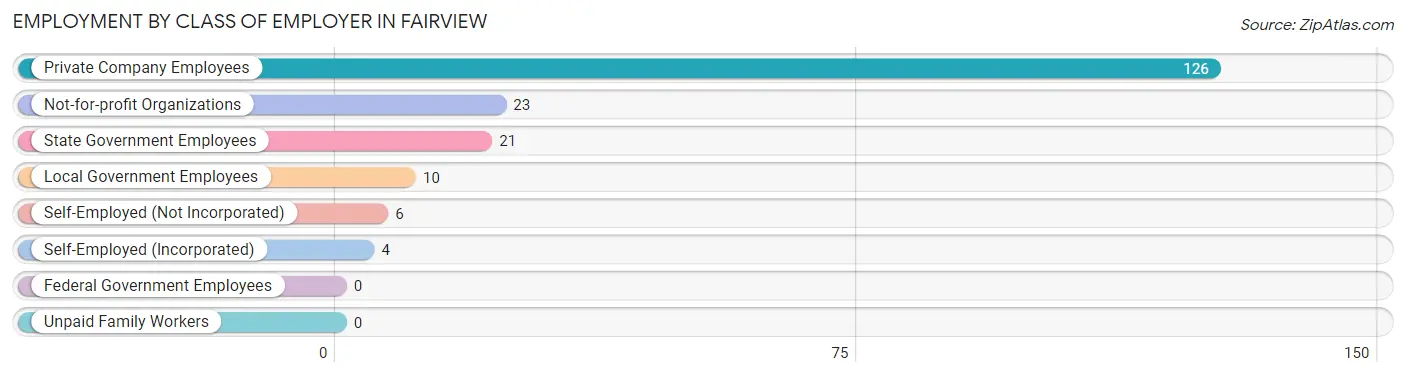
| Employer Class | # Employees | % Employees |
| Private Company Employees | 126 | 66.3% |
| Self-Employed (Incorporated) | 4 | 2.1% |
| Self-Employed (Not Incorporated) | 6 | 3.2% |
| Not-for-profit Organizations | 23 | 12.1% |
| Local Government Employees | 10 | 5.3% |
| State Government Employees | 21 | 11.1% |
| Federal Government Employees | 0 | 0.0% |
| Unpaid Family Workers | 0 | 0.0% |
| Total | 190 | 100.0% |
Employment Status by Age in Fairview
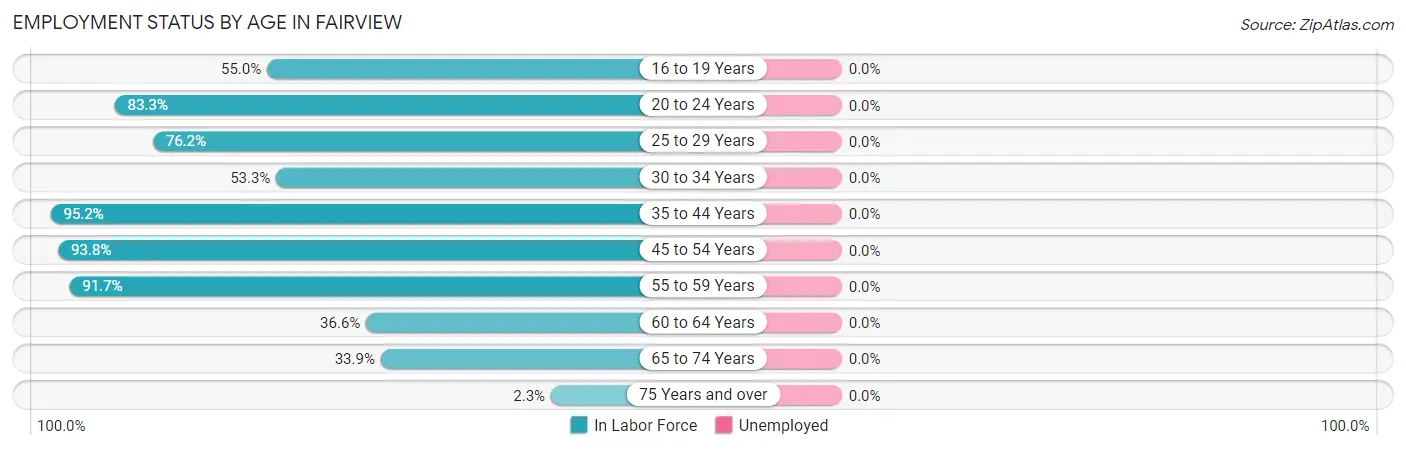
| Age Bracket | In Labor Force | Unemployed |
| 16 to 19 Years | 11 (55.0%) | 0 (0.0%) |
| 20 to 24 Years | 15 (83.3%) | 0 (0.0%) |
| 25 to 29 Years | 16 (76.2%) | 0 (0.0%) |
| 30 to 34 Years | 8 (53.3%) | 0 (0.0%) |
| 35 to 44 Years | 20 (95.2%) | 0 (0.0%) |
| 45 to 54 Years | 61 (93.8%) | 0 (0.0%) |
| 55 to 59 Years | 22 (91.7%) | 0 (0.0%) |
| 60 to 64 Years | 15 (36.6%) | 0 (0.0%) |
| 65 to 74 Years | 21 (33.9%) | 0 (0.0%) |
| 75 Years and over | 1 (2.3%) | 0 (0.0%) |
| Total | 190 (57.6%) | 0 (0.0%) |
Employment Status by Educational Attainment in Fairview
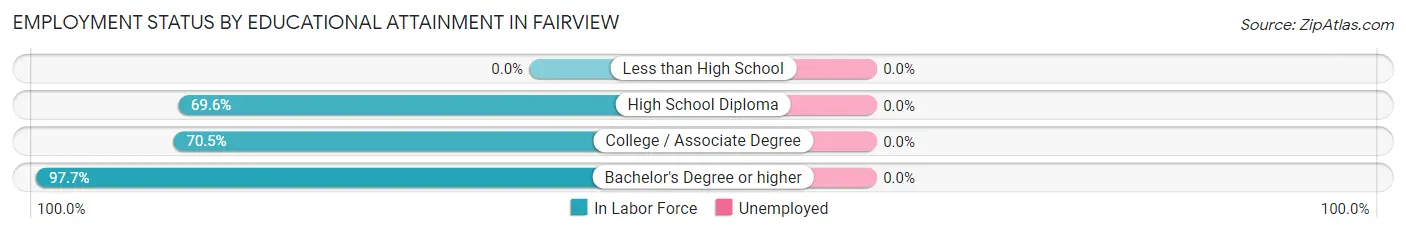
| Educational Attainment | In Labor Force | Unemployed |
| Less than High School | 0 (0.0%) | 0 (0.0%) |
| High School Diploma | 32 (69.6%) | 0 (0.0%) |
| College / Associate Degree | 67 (70.5%) | 0 (0.0%) |
| Bachelor's Degree or higher | 43 (97.7%) | 0 (0.0%) |
| Total | 142 (75.9%) | 0 (0.0%) |
Employment Occupations by Sex in Fairview
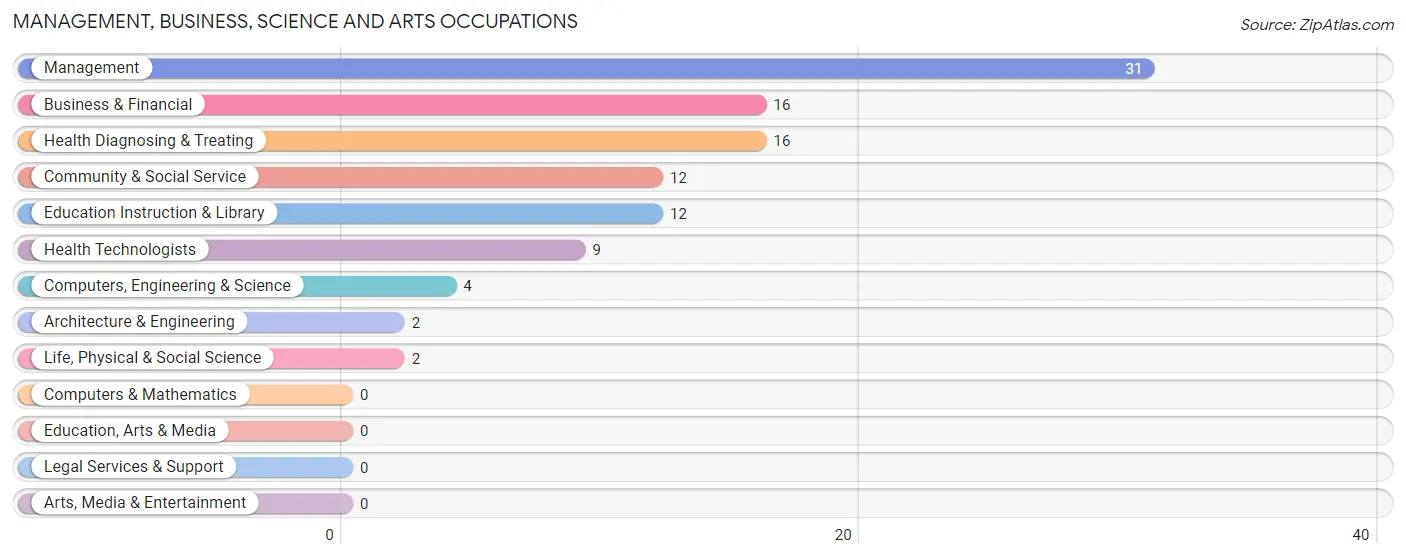
Management, Business, Science and Arts Occupations
The most common Management, Business, Science and Arts occupations in Fairview are Management (31 | 16.3%), Business & Financial (16 | 8.4%), Health Diagnosing & Treating (16 | 8.4%), Community & Social Service (12 | 6.3%), and Education Instruction & Library (12 | 6.3%).
Management, Business, Science and Arts Occupations by Sex
Within the Management, Business, Science and Arts occupations in Fairview, the most male-oriented occupations are Architecture & Engineering (100.0%), Business & Financial (50.0%), and Computers, Engineering & Science (50.0%), while the most female-oriented occupations are Life, Physical & Social Science (100.0%), Health Technologists (100.0%), and Community & Social Service (83.3%).
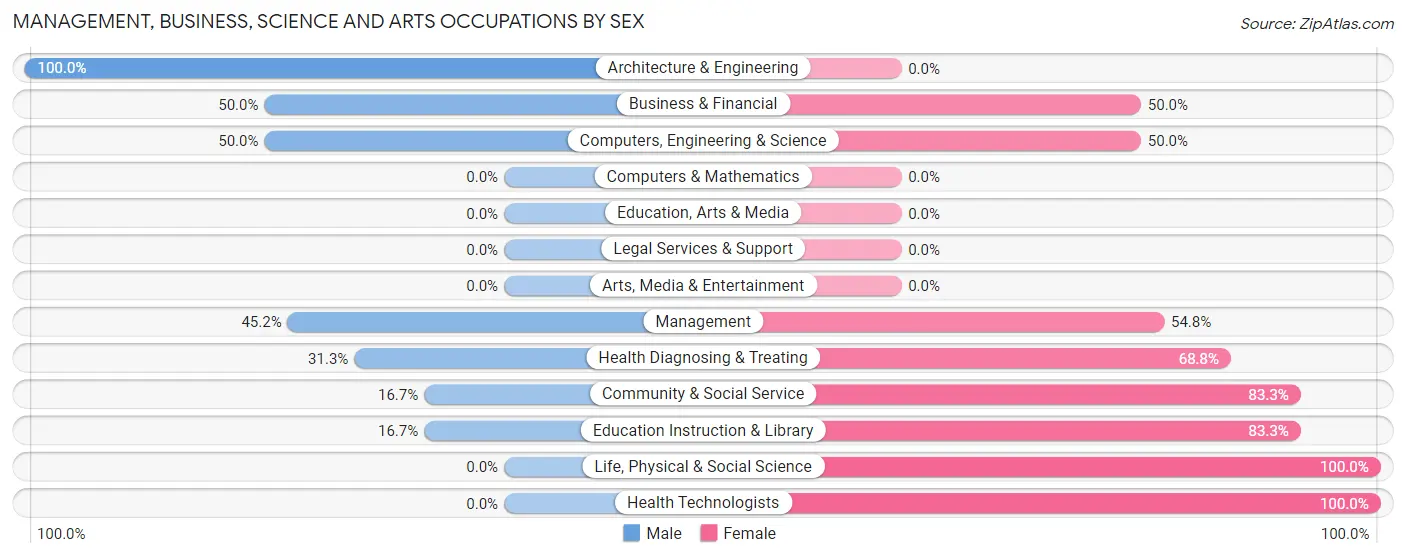
| Occupation | Male | Female |
| Management | 14 (45.2%) | 17 (54.8%) |
| Business & Financial | 8 (50.0%) | 8 (50.0%) |
| Computers, Engineering & Science | 2 (50.0%) | 2 (50.0%) |
| Computers & Mathematics | 0 (0.0%) | 0 (0.0%) |
| Architecture & Engineering | 2 (100.0%) | 0 (0.0%) |
| Life, Physical & Social Science | 0 (0.0%) | 2 (100.0%) |
| Community & Social Service | 2 (16.7%) | 10 (83.3%) |
| Education, Arts & Media | 0 (0.0%) | 0 (0.0%) |
| Legal Services & Support | 0 (0.0%) | 0 (0.0%) |
| Education Instruction & Library | 2 (16.7%) | 10 (83.3%) |
| Arts, Media & Entertainment | 0 (0.0%) | 0 (0.0%) |
| Health Diagnosing & Treating | 5 (31.2%) | 11 (68.8%) |
| Health Technologists | 0 (0.0%) | 9 (100.0%) |
| Total (Category) | 31 (39.2%) | 48 (60.8%) |
| Total (Overall) | 103 (54.2%) | 87 (45.8%) |
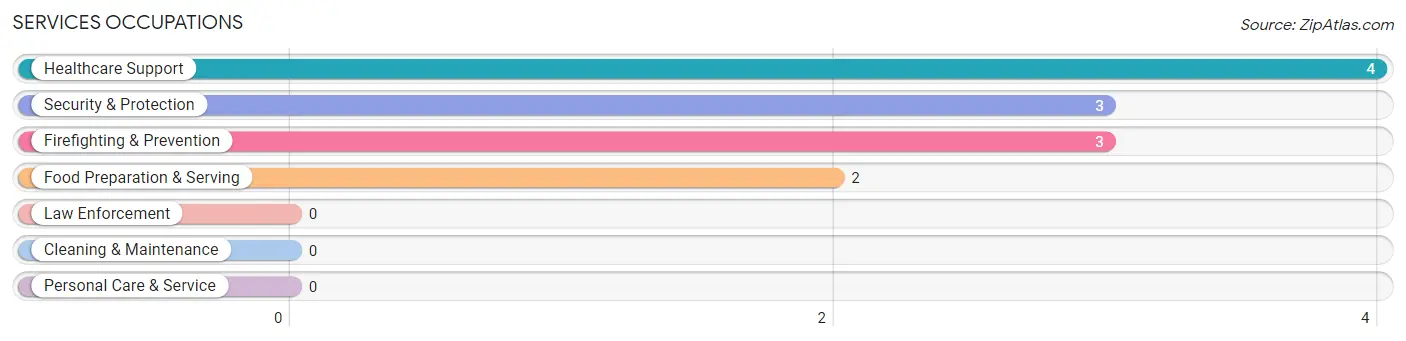
Services Occupations
The most common Services occupations in Fairview are Healthcare Support (4 | 2.1%), Security & Protection (3 | 1.6%), Firefighting & Prevention (3 | 1.6%), and Food Preparation & Serving (2 | 1.1%).
Services Occupations by Sex
Within the Services occupations in Fairview, the most male-oriented occupations are Security & Protection (100.0%), and Firefighting & Prevention (100.0%), while the most female-oriented occupations are Healthcare Support (100.0%), and Food Preparation & Serving (100.0%).
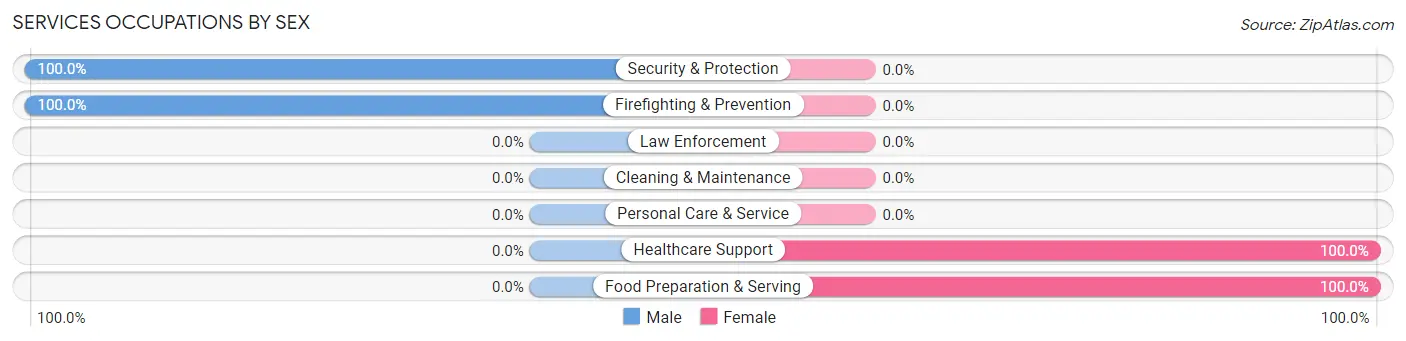
| Occupation | Male | Female |
| Healthcare Support | 0 (0.0%) | 4 (100.0%) |
| Security & Protection | 3 (100.0%) | 0 (0.0%) |
| Firefighting & Prevention | 3 (100.0%) | 0 (0.0%) |
| Law Enforcement | 0 (0.0%) | 0 (0.0%) |
| Food Preparation & Serving | 0 (0.0%) | 2 (100.0%) |
| Cleaning & Maintenance | 0 (0.0%) | 0 (0.0%) |
| Personal Care & Service | 0 (0.0%) | 0 (0.0%) |
| Total (Category) | 3 (33.3%) | 6 (66.7%) |
| Total (Overall) | 103 (54.2%) | 87 (45.8%) |
Sales and Office Occupations
The most common Sales and Office occupations in Fairview are Office & Administration (24 | 12.6%), and Sales & Related (9 | 4.7%).
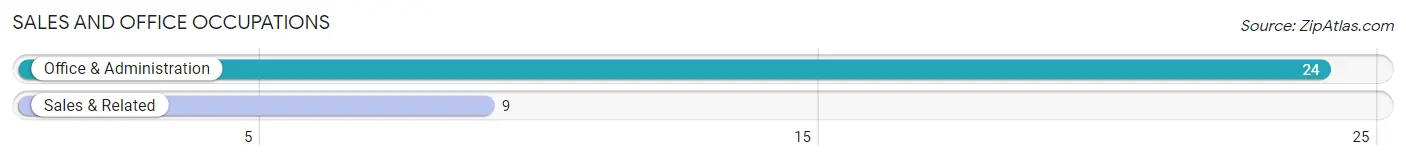
Sales and Office Occupations by Sex
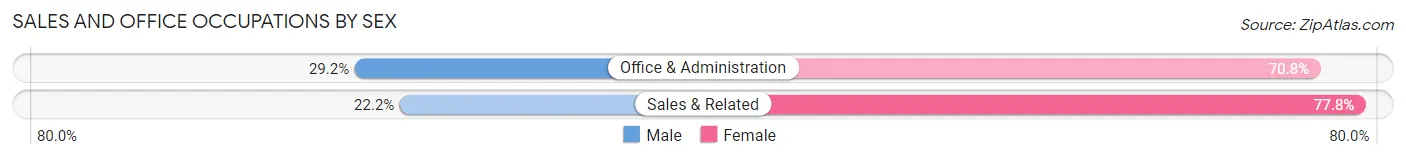
| Occupation | Male | Female |
| Sales & Related | 2 (22.2%) | 7 (77.8%) |
| Office & Administration | 7 (29.2%) | 17 (70.8%) |
| Total (Category) | 9 (27.3%) | 24 (72.7%) |
| Total (Overall) | 103 (54.2%) | 87 (45.8%) |
Natural Resources, Construction and Maintenance Occupations
The most common Natural Resources, Construction and Maintenance occupations in Fairview are Installation, Maintenance & Repair (18 | 9.5%), Farming, Fishing & Forestry (7 | 3.7%), and Construction & Extraction (7 | 3.7%).
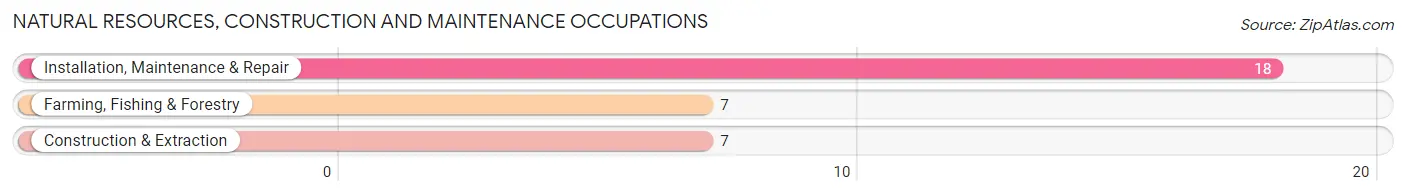
Natural Resources, Construction and Maintenance Occupations by Sex

| Occupation | Male | Female |
| Farming, Fishing & Forestry | 7 (100.0%) | 0 (0.0%) |
| Construction & Extraction | 7 (100.0%) | 0 (0.0%) |
| Installation, Maintenance & Repair | 18 (100.0%) | 0 (0.0%) |
| Total (Category) | 32 (100.0%) | 0 (0.0%) |
| Total (Overall) | 103 (54.2%) | 87 (45.8%) |
Production, Transportation and Moving Occupations
The most common Production, Transportation and Moving occupations in Fairview are Production (17 | 8.9%), Material Moving (11 | 5.8%), and Transportation (9 | 4.7%).
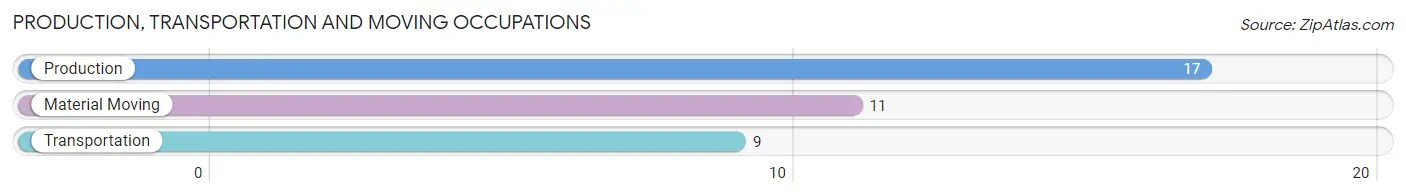
Production, Transportation and Moving Occupations by Sex
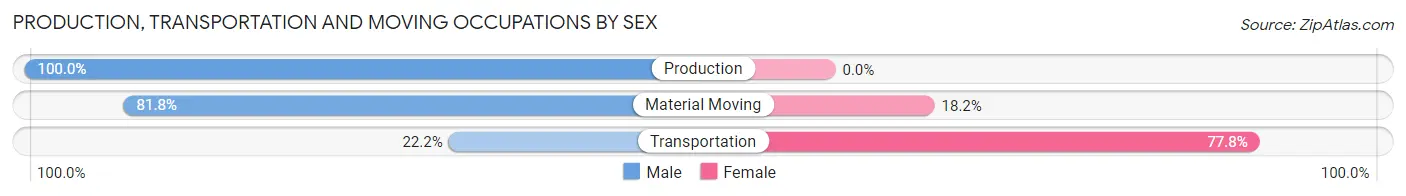
| Occupation | Male | Female |
| Production | 17 (100.0%) | 0 (0.0%) |
| Transportation | 2 (22.2%) | 7 (77.8%) |
| Material Moving | 9 (81.8%) | 2 (18.2%) |
| Total (Category) | 28 (75.7%) | 9 (24.3%) |
| Total (Overall) | 103 (54.2%) | 87 (45.8%) |
Employment Industries by Sex in Fairview
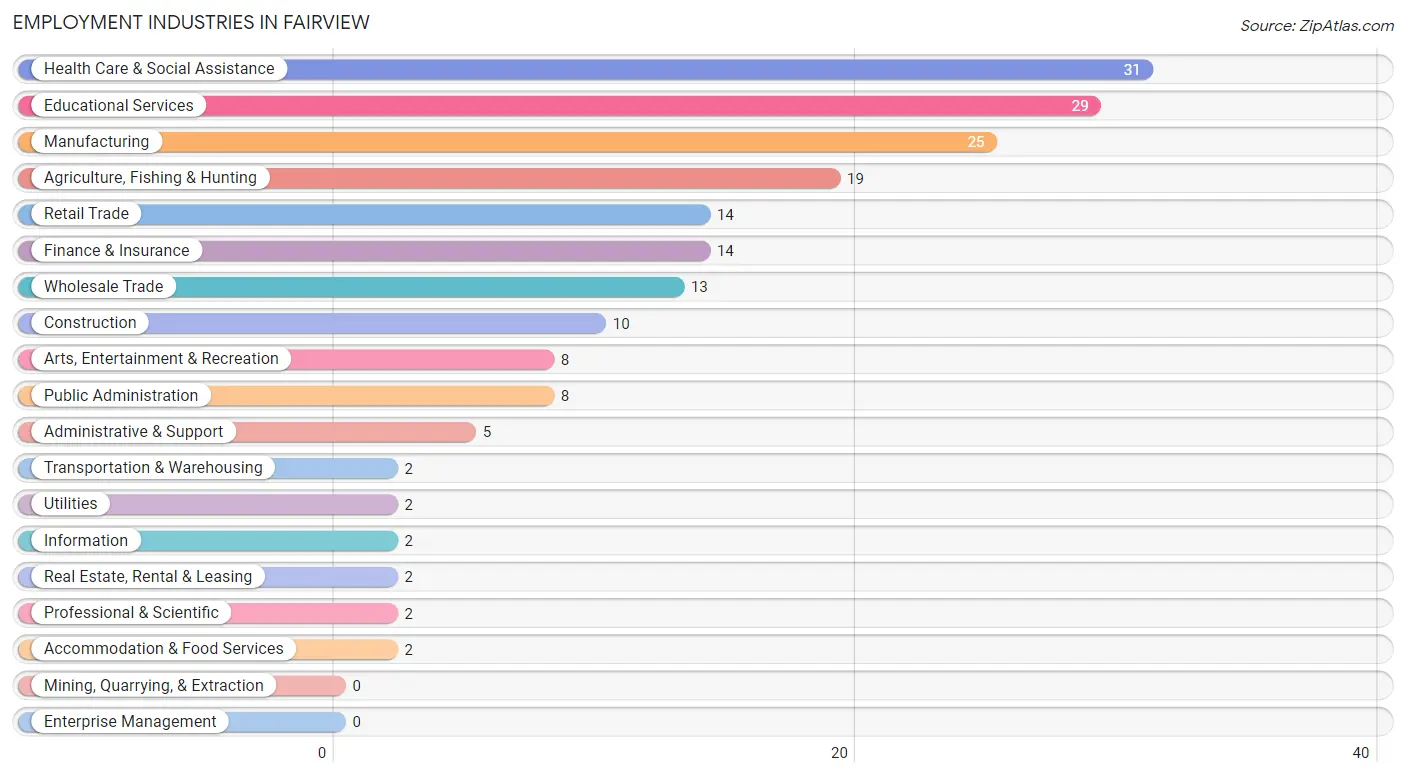
Employment Industries in Fairview
The major employment industries in Fairview include Health Care & Social Assistance (31 | 16.3%), Educational Services (29 | 15.3%), Manufacturing (25 | 13.2%), Agriculture, Fishing & Hunting (19 | 10.0%), and Retail Trade (14 | 7.4%).
Employment Industries by Sex in Fairview
The Fairview industries that see more men than women are Agriculture, Fishing & Hunting (100.0%), Utilities (100.0%), and Real Estate, Rental & Leasing (100.0%), whereas the industries that tend to have a higher number of women are Transportation & Warehousing (100.0%), Information (100.0%), and Accommodation & Food Services (100.0%).
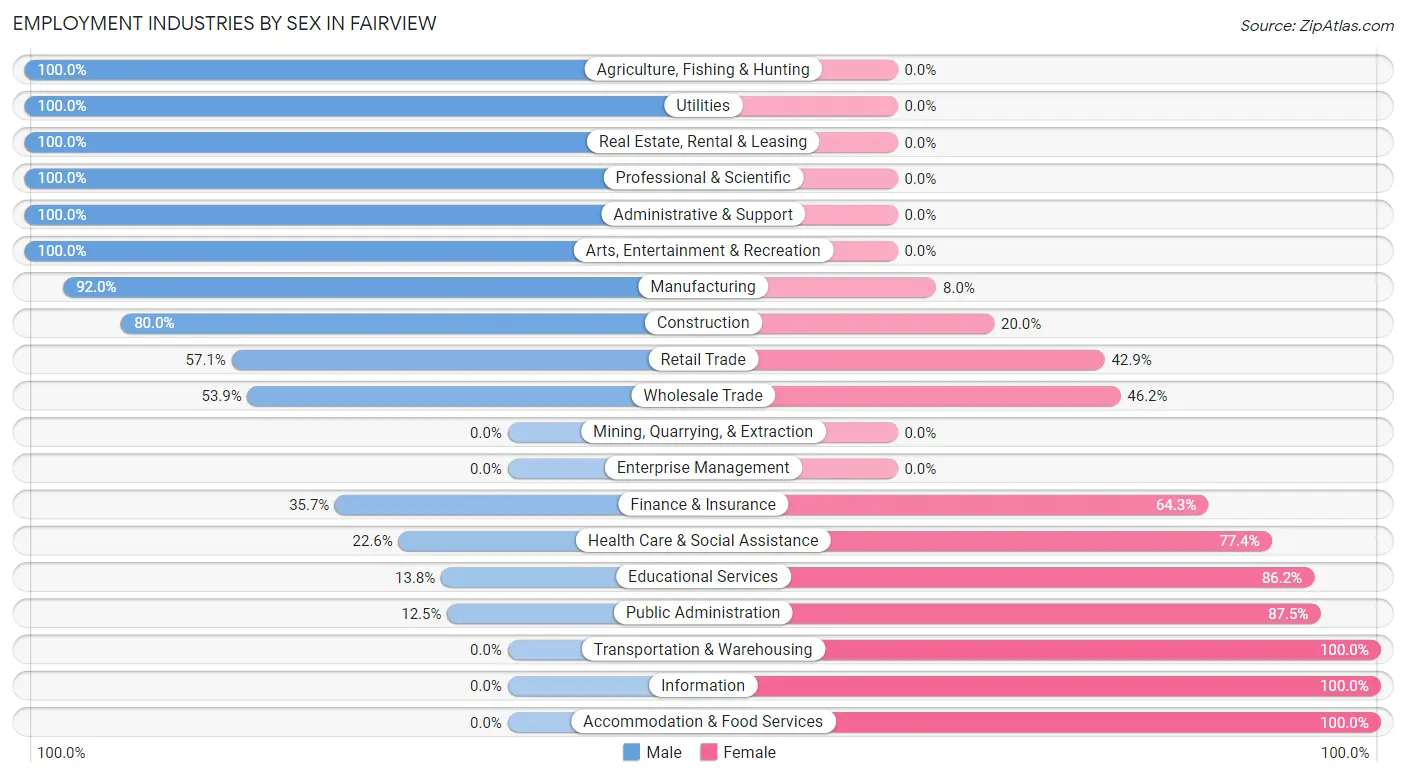
| Industry | Male | Female |
| Agriculture, Fishing & Hunting | 19 (100.0%) | 0 (0.0%) |
| Mining, Quarrying, & Extraction | 0 (0.0%) | 0 (0.0%) |
| Construction | 8 (80.0%) | 2 (20.0%) |
| Manufacturing | 23 (92.0%) | 2 (8.0%) |
| Wholesale Trade | 7 (53.8%) | 6 (46.2%) |
| Retail Trade | 8 (57.1%) | 6 (42.9%) |
| Transportation & Warehousing | 0 (0.0%) | 2 (100.0%) |
| Utilities | 2 (100.0%) | 0 (0.0%) |
| Information | 0 (0.0%) | 2 (100.0%) |
| Finance & Insurance | 5 (35.7%) | 9 (64.3%) |
| Real Estate, Rental & Leasing | 2 (100.0%) | 0 (0.0%) |
| Professional & Scientific | 2 (100.0%) | 0 (0.0%) |
| Enterprise Management | 0 (0.0%) | 0 (0.0%) |
| Administrative & Support | 5 (100.0%) | 0 (0.0%) |
| Educational Services | 4 (13.8%) | 25 (86.2%) |
| Health Care & Social Assistance | 7 (22.6%) | 24 (77.4%) |
| Arts, Entertainment & Recreation | 8 (100.0%) | 0 (0.0%) |
| Accommodation & Food Services | 0 (0.0%) | 2 (100.0%) |
| Public Administration | 1 (12.5%) | 7 (87.5%) |
| Total | 103 (54.2%) | 87 (45.8%) |
Education in Fairview
School Enrollment in Fairview
The most common levels of schooling among the 61 students in Fairview are high school (22 | 36.1%), elementary school (10 | 16.4%), and nursery / preschool (9 | 14.7%).
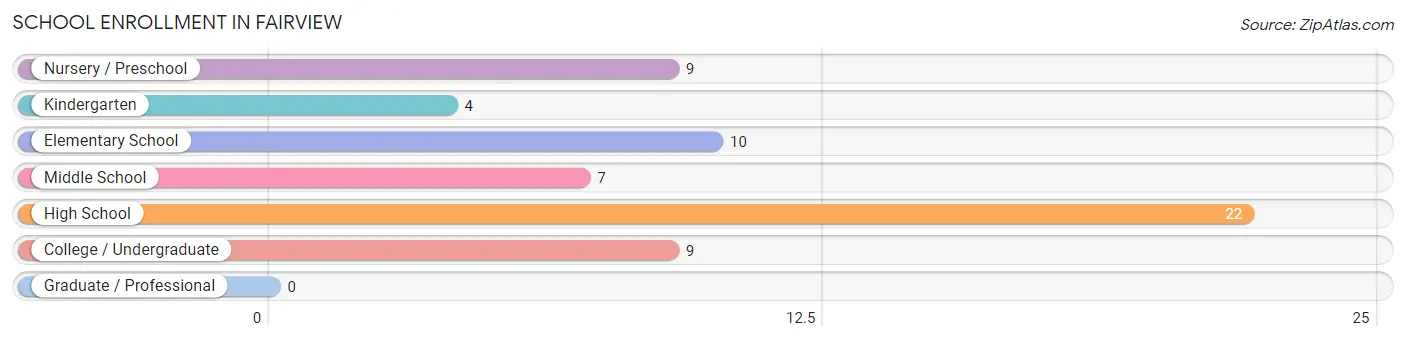
| School Level | # Students | % Students |
| Nursery / Preschool | 9 | 14.7% |
| Kindergarten | 4 | 6.6% |
| Elementary School | 10 | 16.4% |
| Middle School | 7 | 11.5% |
| High School | 22 | 36.1% |
| College / Undergraduate | 9 | 14.7% |
| Graduate / Professional | 0 | 0.0% |
| Total | 61 | 100.0% |
School Enrollment by Age by Funding Source in Fairview
Out of a total of 61 students who are enrolled in schools in Fairview, 2 (3.3%) attend a private institution, while the remaining 59 (96.7%) are enrolled in public schools. The age group of 3 to 4 year olds has the highest likelihood of being enrolled in private schools, with 2 (22.2% in the age bracket) enrolled. Conversely, the age group of 5 to 9 year old has the lowest likelihood of being enrolled in a private school, with 14 (100.0% in the age bracket) attending a public institution.
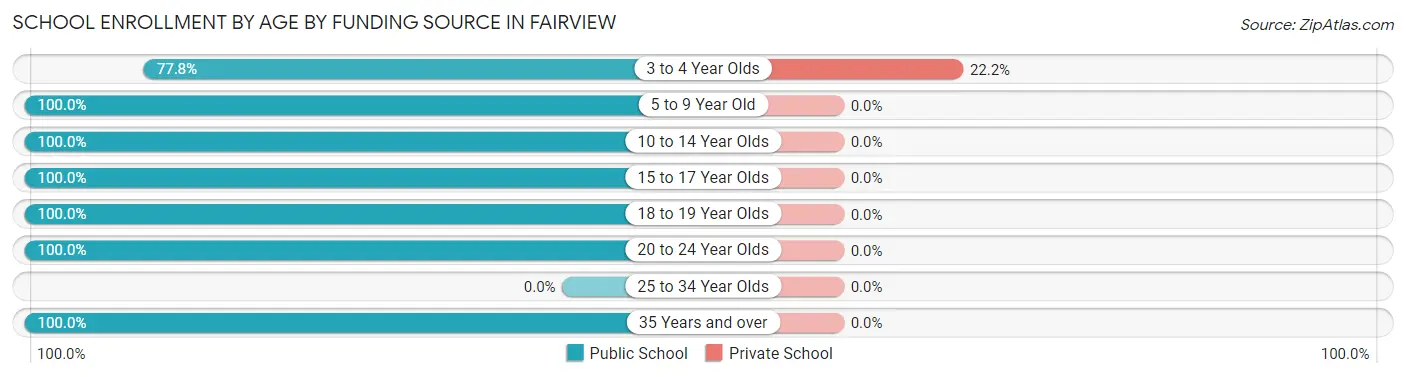
| Age Bracket | Public School | Private School |
| 3 to 4 Year Olds | 7 (77.8%) | 2 (22.2%) |
| 5 to 9 Year Old | 14 (100.0%) | 0 (0.0%) |
| 10 to 14 Year Olds | 11 (100.0%) | 0 (0.0%) |
| 15 to 17 Year Olds | 11 (100.0%) | 0 (0.0%) |
| 18 to 19 Year Olds | 9 (100.0%) | 0 (0.0%) |
| 20 to 24 Year Olds | 3 (100.0%) | 0 (0.0%) |
| 25 to 34 Year Olds | 0 (0.0%) | 0 (0.0%) |
| 35 Years and over | 4 (100.0%) | 0 (0.0%) |
| Total | 59 (96.7%) | 2 (3.3%) |
Educational Attainment by Field of Study in Fairview
Business (19 | 32.8%), education (16 | 27.6%), science & technology (8 | 13.8%), arts & humanities (7 | 12.1%), and literature & languages (6 | 10.3%) are the most common fields of study among 58 individuals in Fairview who have obtained a bachelor's degree or higher.
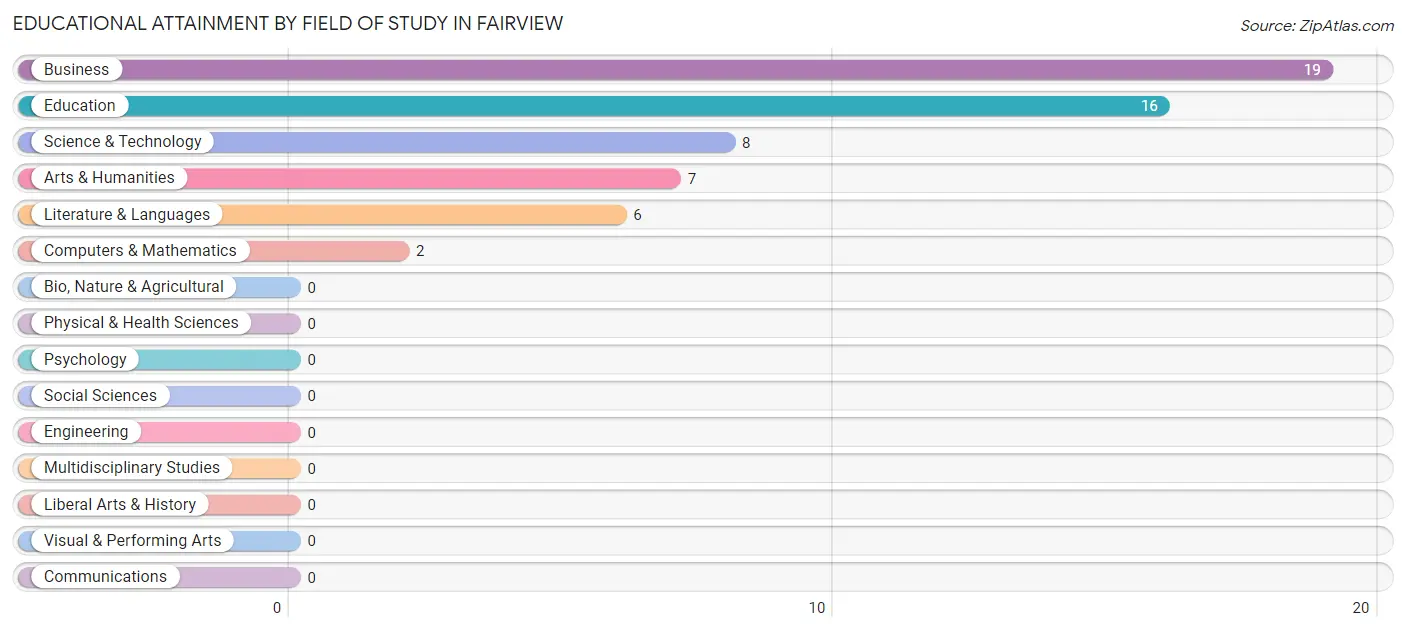
| Field of Study | # Graduates | % Graduates |
| Computers & Mathematics | 2 | 3.5% |
| Bio, Nature & Agricultural | 0 | 0.0% |
| Physical & Health Sciences | 0 | 0.0% |
| Psychology | 0 | 0.0% |
| Social Sciences | 0 | 0.0% |
| Engineering | 0 | 0.0% |
| Multidisciplinary Studies | 0 | 0.0% |
| Science & Technology | 8 | 13.8% |
| Business | 19 | 32.8% |
| Education | 16 | 27.6% |
| Literature & Languages | 6 | 10.3% |
| Liberal Arts & History | 0 | 0.0% |
| Visual & Performing Arts | 0 | 0.0% |
| Communications | 0 | 0.0% |
| Arts & Humanities | 7 | 12.1% |
| Total | 58 | 100.0% |
Transportation & Commute in Fairview
Vehicle Availability by Sex in Fairview
The most prevalent vehicle ownership categories in Fairview are males with 2 vehicles (73, accounting for 70.9%) and females with 2 vehicles (47, making up 83.9%).
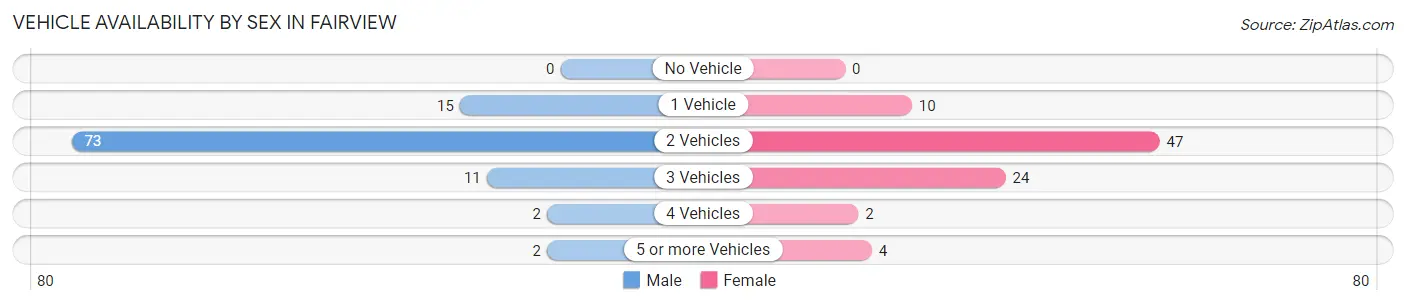
| Vehicles Available | Male | Female |
| No Vehicle | 0 (0.0%) | 0 (0.0%) |
| 1 Vehicle | 15 (14.6%) | 10 (11.5%) |
| 2 Vehicles | 73 (70.9%) | 47 (54.0%) |
| 3 Vehicles | 11 (10.7%) | 24 (27.6%) |
| 4 Vehicles | 2 (1.9%) | 2 (2.3%) |
| 5 or more Vehicles | 2 (1.9%) | 4 (4.6%) |
| Total | 103 (100.0%) | 87 (100.0%) |
Commute Time in Fairview
The most frequently occuring commute durations in Fairview are 10 to 14 minutes (34 commuters, 18.0%), 45 to 59 minutes (32 commuters, 16.9%), and 15 to 19 minutes (31 commuters, 16.4%).
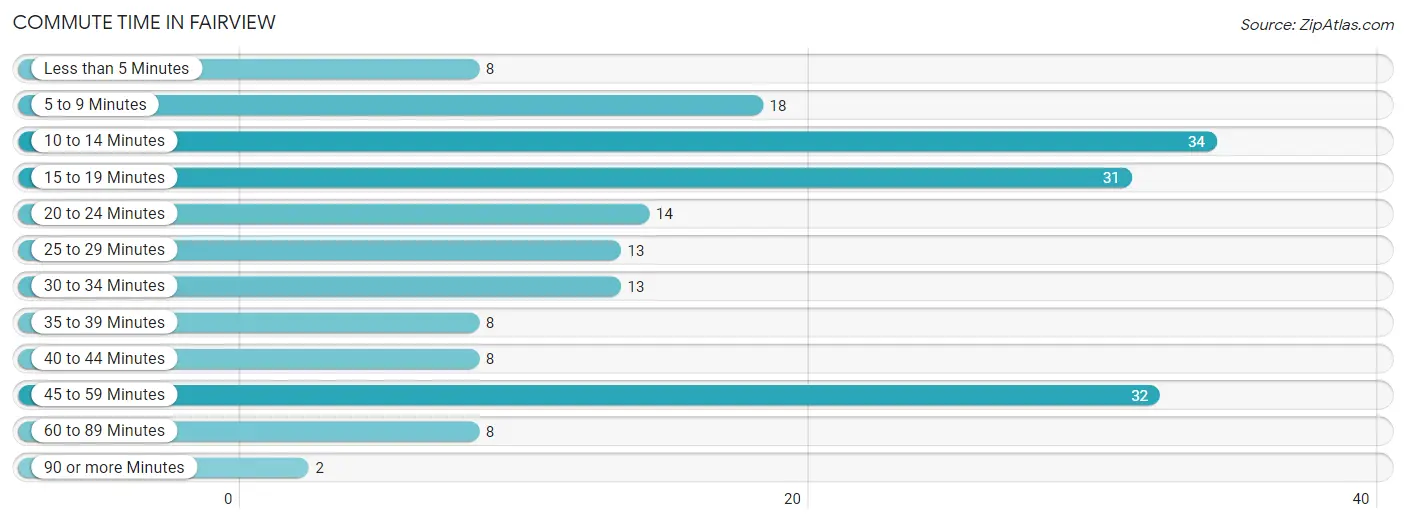
| Commute Time | # Commuters | % Commuters |
| Less than 5 Minutes | 8 | 4.2% |
| 5 to 9 Minutes | 18 | 9.5% |
| 10 to 14 Minutes | 34 | 18.0% |
| 15 to 19 Minutes | 31 | 16.4% |
| 20 to 24 Minutes | 14 | 7.4% |
| 25 to 29 Minutes | 13 | 6.9% |
| 30 to 34 Minutes | 13 | 6.9% |
| 35 to 39 Minutes | 8 | 4.2% |
| 40 to 44 Minutes | 8 | 4.2% |
| 45 to 59 Minutes | 32 | 16.9% |
| 60 to 89 Minutes | 8 | 4.2% |
| 90 or more Minutes | 2 | 1.1% |
Commute Time by Sex in Fairview
The most common commute times in Fairview are 45 to 59 minutes (17 commuters, 16.7%) for males and 15 to 19 minutes (19 commuters, 21.8%) for females.
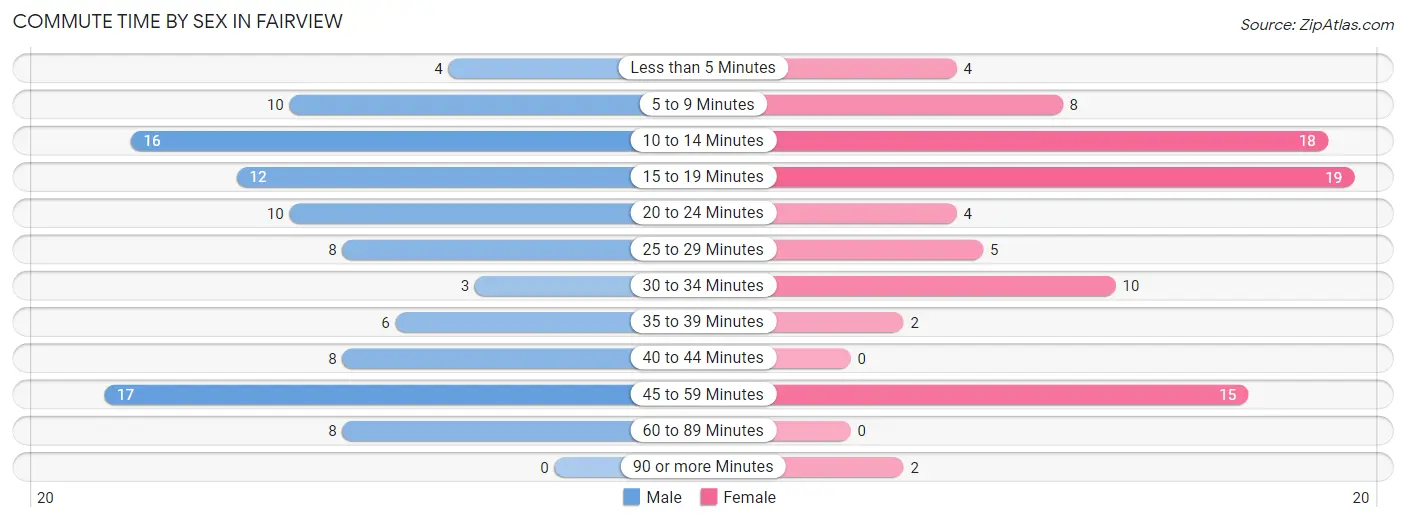
| Commute Time | Male | Female |
| Less than 5 Minutes | 4 (3.9%) | 4 (4.6%) |
| 5 to 9 Minutes | 10 (9.8%) | 8 (9.2%) |
| 10 to 14 Minutes | 16 (15.7%) | 18 (20.7%) |
| 15 to 19 Minutes | 12 (11.8%) | 19 (21.8%) |
| 20 to 24 Minutes | 10 (9.8%) | 4 (4.6%) |
| 25 to 29 Minutes | 8 (7.8%) | 5 (5.8%) |
| 30 to 34 Minutes | 3 (2.9%) | 10 (11.5%) |
| 35 to 39 Minutes | 6 (5.9%) | 2 (2.3%) |
| 40 to 44 Minutes | 8 (7.8%) | 0 (0.0%) |
| 45 to 59 Minutes | 17 (16.7%) | 15 (17.2%) |
| 60 to 89 Minutes | 8 (7.8%) | 0 (0.0%) |
| 90 or more Minutes | 0 (0.0%) | 2 (2.3%) |
Time of Departure to Work by Sex in Fairview
The most frequent times of departure to work in Fairview are 6:00 AM to 6:29 AM (19, 18.6%) for males and 7:00 AM to 7:29 AM (21, 24.1%) for females.
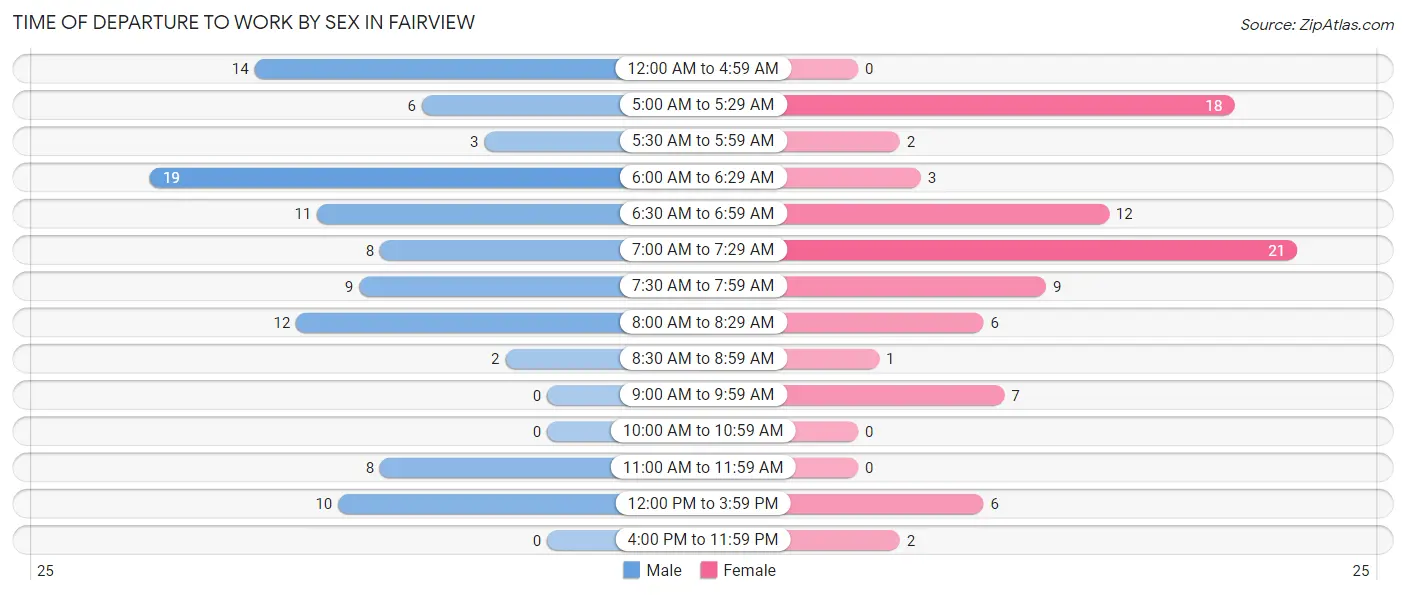
| Time of Departure | Male | Female |
| 12:00 AM to 4:59 AM | 14 (13.7%) | 0 (0.0%) |
| 5:00 AM to 5:29 AM | 6 (5.9%) | 18 (20.7%) |
| 5:30 AM to 5:59 AM | 3 (2.9%) | 2 (2.3%) |
| 6:00 AM to 6:29 AM | 19 (18.6%) | 3 (3.5%) |
| 6:30 AM to 6:59 AM | 11 (10.8%) | 12 (13.8%) |
| 7:00 AM to 7:29 AM | 8 (7.8%) | 21 (24.1%) |
| 7:30 AM to 7:59 AM | 9 (8.8%) | 9 (10.3%) |
| 8:00 AM to 8:29 AM | 12 (11.8%) | 6 (6.9%) |
| 8:30 AM to 8:59 AM | 2 (2.0%) | 1 (1.1%) |
| 9:00 AM to 9:59 AM | 0 (0.0%) | 7 (8.1%) |
| 10:00 AM to 10:59 AM | 0 (0.0%) | 0 (0.0%) |
| 11:00 AM to 11:59 AM | 8 (7.8%) | 0 (0.0%) |
| 12:00 PM to 3:59 PM | 10 (9.8%) | 6 (6.9%) |
| 4:00 PM to 11:59 PM | 0 (0.0%) | 2 (2.3%) |
| Total | 102 (100.0%) | 87 (100.0%) |
Housing Occupancy in Fairview
Occupancy by Ownership in Fairview
Of the total 184 dwellings in Fairview, owner-occupied units account for 173 (94.0%), while renter-occupied units make up 11 (6.0%).
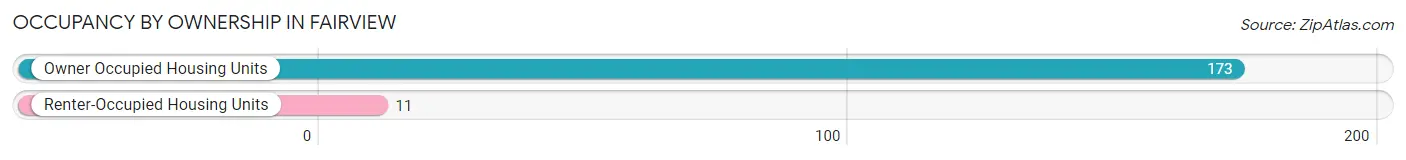
| Occupancy | # Housing Units | % Housing Units |
| Owner Occupied Housing Units | 173 | 94.0% |
| Renter-Occupied Housing Units | 11 | 6.0% |
| Total Occupied Housing Units | 184 | 100.0% |
Occupancy by Household Size in Fairview
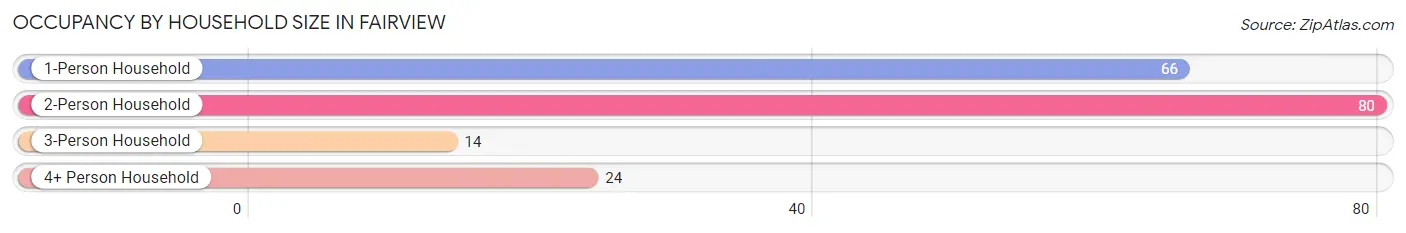
| Household Size | # Housing Units | % Housing Units |
| 1-Person Household | 66 | 35.9% |
| 2-Person Household | 80 | 43.5% |
| 3-Person Household | 14 | 7.6% |
| 4+ Person Household | 24 | 13.0% |
| Total Housing Units | 184 | 100.0% |
Occupancy by Ownership by Household Size in Fairview
| Household Size | Owner-occupied | Renter-occupied |
| 1-Person Household | 57 (86.4%) | 9 (13.6%) |
| 2-Person Household | 80 (100.0%) | 0 (0.0%) |
| 3-Person Household | 12 (85.7%) | 2 (14.3%) |
| 4+ Person Household | 24 (100.0%) | 0 (0.0%) |
| Total Housing Units | 173 (94.0%) | 11 (6.0%) |
Occupancy by Educational Attainment in Fairview
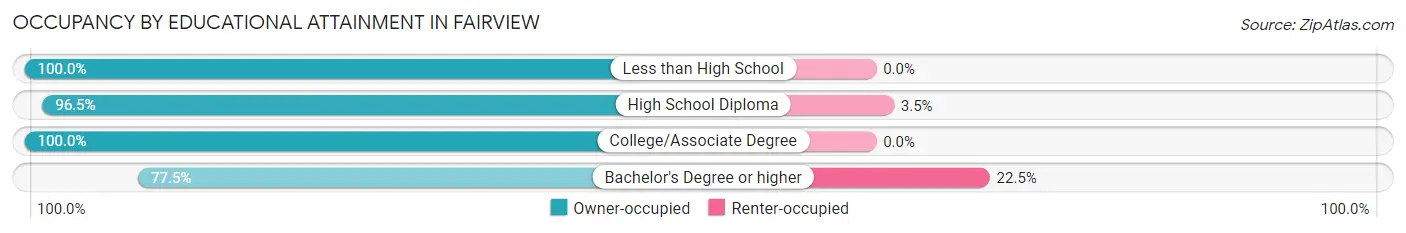
| Household Size | Owner-occupied | Renter-occupied |
| Less than High School | 4 (100.0%) | 0 (0.0%) |
| High School Diploma | 55 (96.5%) | 2 (3.5%) |
| College/Associate Degree | 83 (100.0%) | 0 (0.0%) |
| Bachelor's Degree or higher | 31 (77.5%) | 9 (22.5%) |
Occupancy by Age of Householder in Fairview
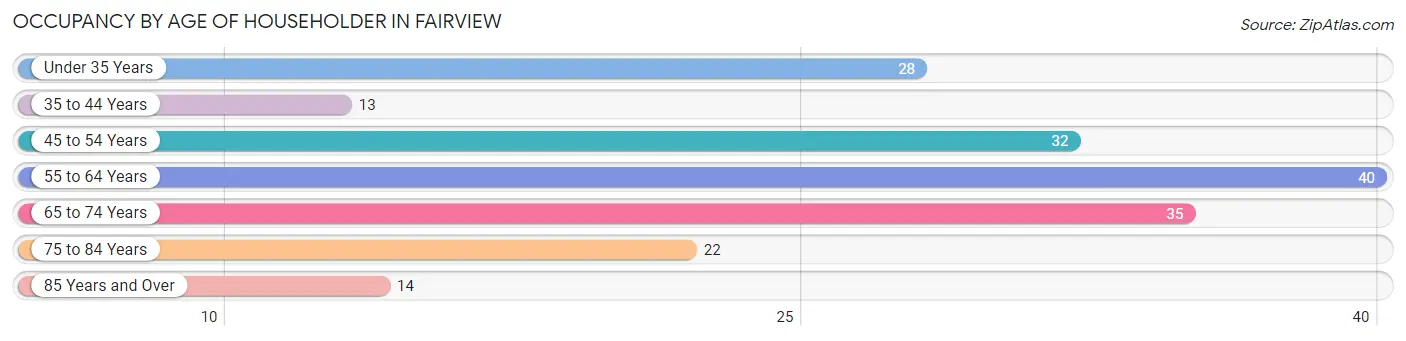
| Age Bracket | # Households | % Households |
| Under 35 Years | 28 | 15.2% |
| 35 to 44 Years | 13 | 7.1% |
| 45 to 54 Years | 32 | 17.4% |
| 55 to 64 Years | 40 | 21.7% |
| 65 to 74 Years | 35 | 19.0% |
| 75 to 84 Years | 22 | 12.0% |
| 85 Years and Over | 14 | 7.6% |
| Total | 184 | 100.0% |
Housing Finances in Fairview
Median Income by Occupancy in Fairview
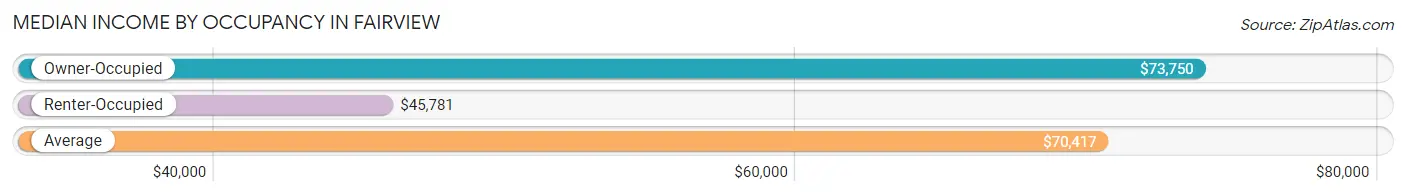
| Occupancy Type | # Households | Median Income |
| Owner-Occupied | 173 (94.0%) | $73,750 |
| Renter-Occupied | 11 (6.0%) | $45,781 |
| Average | 184 (100.0%) | $70,417 |
Occupancy by Householder Income Bracket in Fairview
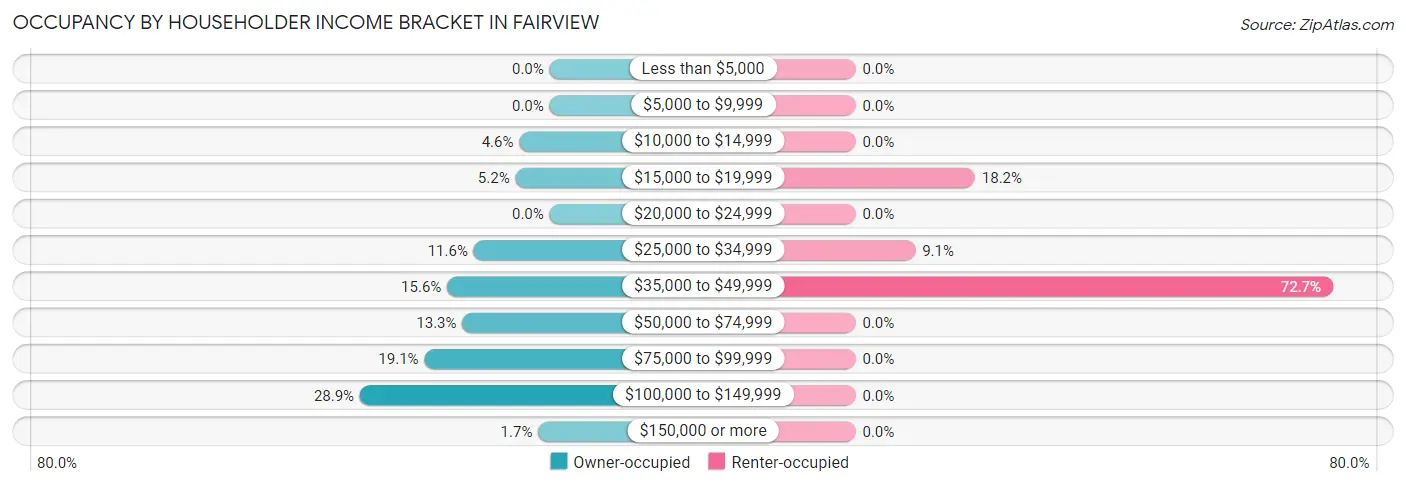
| Income Bracket | Owner-occupied | Renter-occupied |
| Less than $5,000 | 0 (0.0%) | 0 (0.0%) |
| $5,000 to $9,999 | 0 (0.0%) | 0 (0.0%) |
| $10,000 to $14,999 | 8 (4.6%) | 0 (0.0%) |
| $15,000 to $19,999 | 9 (5.2%) | 2 (18.2%) |
| $20,000 to $24,999 | 0 (0.0%) | 0 (0.0%) |
| $25,000 to $34,999 | 20 (11.6%) | 1 (9.1%) |
| $35,000 to $49,999 | 27 (15.6%) | 8 (72.7%) |
| $50,000 to $74,999 | 23 (13.3%) | 0 (0.0%) |
| $75,000 to $99,999 | 33 (19.1%) | 0 (0.0%) |
| $100,000 to $149,999 | 50 (28.9%) | 0 (0.0%) |
| $150,000 or more | 3 (1.7%) | 0 (0.0%) |
| Total | 173 (100.0%) | 11 (100.0%) |
Monthly Housing Cost Tiers in Fairview
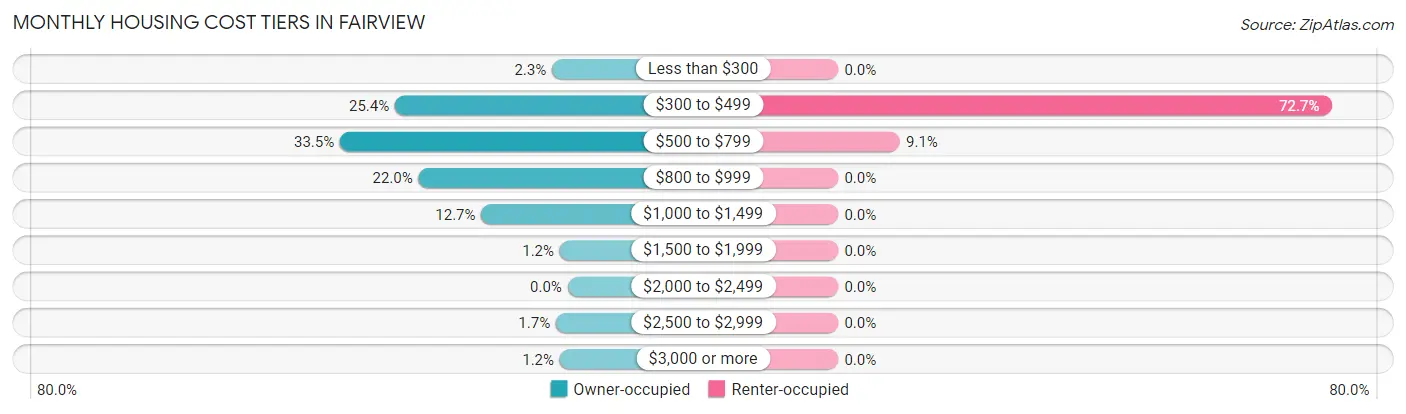
| Monthly Cost | Owner-occupied | Renter-occupied |
| Less than $300 | 4 (2.3%) | 0 (0.0%) |
| $300 to $499 | 44 (25.4%) | 8 (72.7%) |
| $500 to $799 | 58 (33.5%) | 1 (9.1%) |
| $800 to $999 | 38 (22.0%) | 0 (0.0%) |
| $1,000 to $1,499 | 22 (12.7%) | 0 (0.0%) |
| $1,500 to $1,999 | 2 (1.2%) | 0 (0.0%) |
| $2,000 to $2,499 | 0 (0.0%) | 0 (0.0%) |
| $2,500 to $2,999 | 3 (1.7%) | 0 (0.0%) |
| $3,000 or more | 2 (1.2%) | 0 (0.0%) |
| Total | 173 (100.0%) | 11 (100.0%) |
Physical Housing Characteristics in Fairview
Housing Structures in Fairview
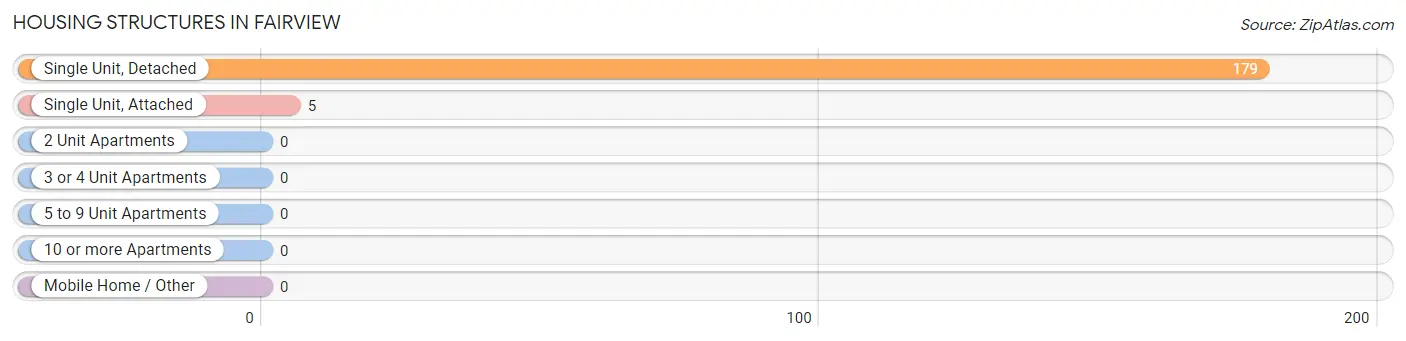
| Structure Type | # Housing Units | % Housing Units |
| Single Unit, Detached | 179 | 97.3% |
| Single Unit, Attached | 5 | 2.7% |
| 2 Unit Apartments | 0 | 0.0% |
| 3 or 4 Unit Apartments | 0 | 0.0% |
| 5 to 9 Unit Apartments | 0 | 0.0% |
| 10 or more Apartments | 0 | 0.0% |
| Mobile Home / Other | 0 | 0.0% |
| Total | 184 | 100.0% |
Housing Structures by Occupancy in Fairview
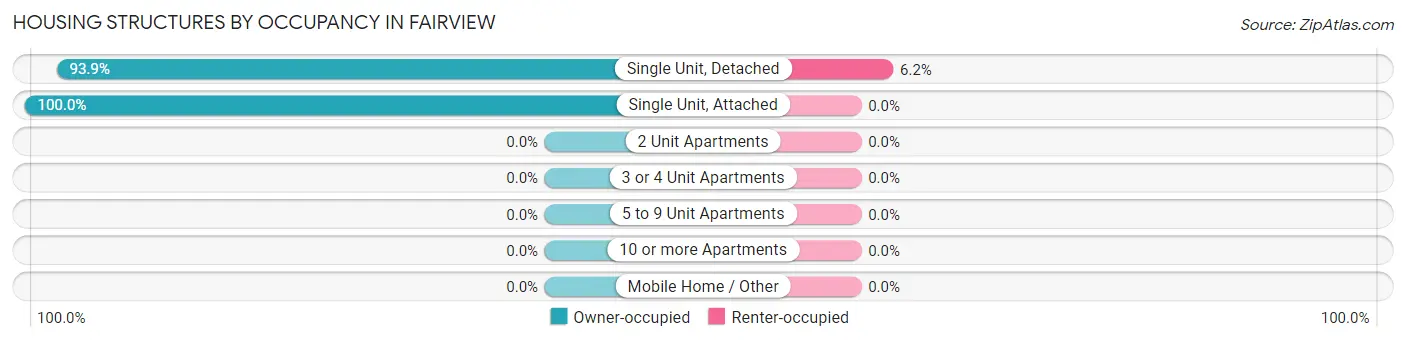
| Structure Type | Owner-occupied | Renter-occupied |
| Single Unit, Detached | 168 (93.9%) | 11 (6.1%) |
| Single Unit, Attached | 5 (100.0%) | 0 (0.0%) |
| 2 Unit Apartments | 0 (0.0%) | 0 (0.0%) |
| 3 or 4 Unit Apartments | 0 (0.0%) | 0 (0.0%) |
| 5 to 9 Unit Apartments | 0 (0.0%) | 0 (0.0%) |
| 10 or more Apartments | 0 (0.0%) | 0 (0.0%) |
| Mobile Home / Other | 0 (0.0%) | 0 (0.0%) |
| Total | 173 (94.0%) | 11 (6.0%) |
Housing Structures by Number of Rooms in Fairview
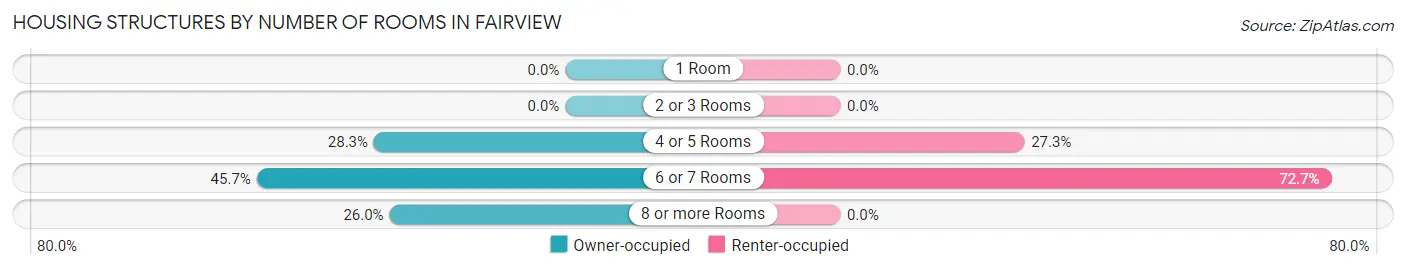
| Number of Rooms | Owner-occupied | Renter-occupied |
| 1 Room | 0 (0.0%) | 0 (0.0%) |
| 2 or 3 Rooms | 0 (0.0%) | 0 (0.0%) |
| 4 or 5 Rooms | 49 (28.3%) | 3 (27.3%) |
| 6 or 7 Rooms | 79 (45.7%) | 8 (72.7%) |
| 8 or more Rooms | 45 (26.0%) | 0 (0.0%) |
| Total | 173 (100.0%) | 11 (100.0%) |
Housing Structure by Heating Type in Fairview
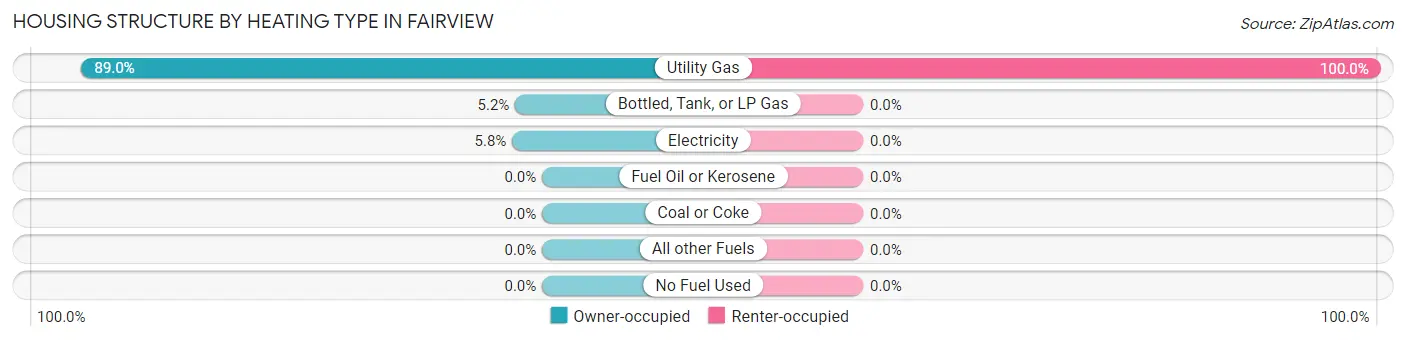
| Heating Type | Owner-occupied | Renter-occupied |
| Utility Gas | 154 (89.0%) | 11 (100.0%) |
| Bottled, Tank, or LP Gas | 9 (5.2%) | 0 (0.0%) |
| Electricity | 10 (5.8%) | 0 (0.0%) |
| Fuel Oil or Kerosene | 0 (0.0%) | 0 (0.0%) |
| Coal or Coke | 0 (0.0%) | 0 (0.0%) |
| All other Fuels | 0 (0.0%) | 0 (0.0%) |
| No Fuel Used | 0 (0.0%) | 0 (0.0%) |
| Total | 173 (100.0%) | 11 (100.0%) |
Household Vehicle Usage in Fairview
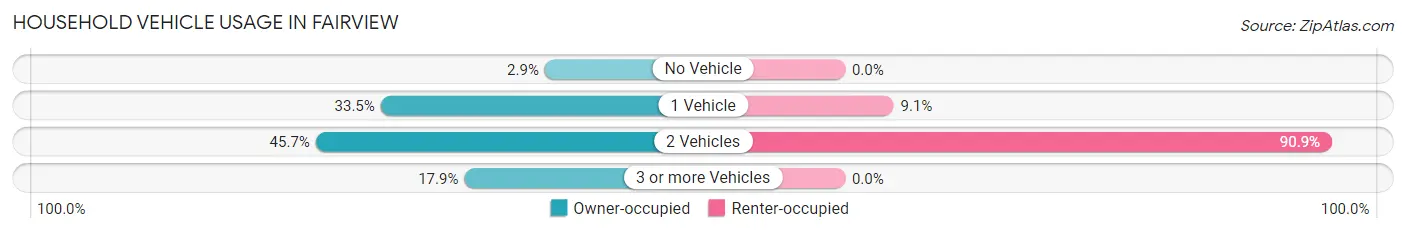
| Vehicles per Household | Owner-occupied | Renter-occupied |
| No Vehicle | 5 (2.9%) | 0 (0.0%) |
| 1 Vehicle | 58 (33.5%) | 1 (9.1%) |
| 2 Vehicles | 79 (45.7%) | 10 (90.9%) |
| 3 or more Vehicles | 31 (17.9%) | 0 (0.0%) |
| Total | 173 (100.0%) | 11 (100.0%) |
Real Estate & Mortgages in Fairview
Real Estate and Mortgage Overview in Fairview
| Characteristic | Without Mortgage | With Mortgage |
| Housing Units | 79 | 94 |
| Median Property Value | $78,000 | $81,300 |
| Median Household Income | $63,036 | $1 |
| Monthly Housing Costs | $480 | $2 |
| Real Estate Taxes | $1,764 | $10 |
Property Value by Mortgage Status in Fairview
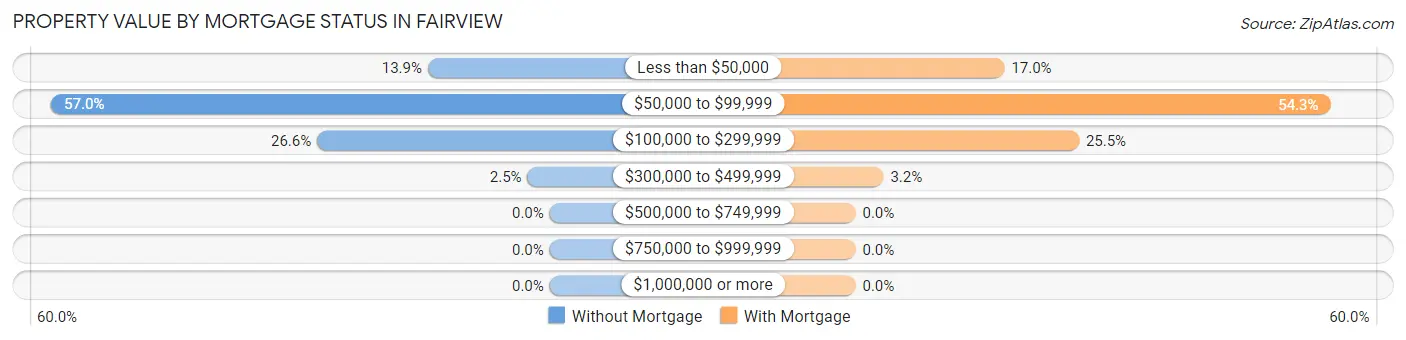
| Property Value | Without Mortgage | With Mortgage |
| Less than $50,000 | 11 (13.9%) | 16 (17.0%) |
| $50,000 to $99,999 | 45 (57.0%) | 51 (54.3%) |
| $100,000 to $299,999 | 21 (26.6%) | 24 (25.5%) |
| $300,000 to $499,999 | 2 (2.5%) | 3 (3.2%) |
| $500,000 to $749,999 | 0 (0.0%) | 0 (0.0%) |
| $750,000 to $999,999 | 0 (0.0%) | 0 (0.0%) |
| $1,000,000 or more | 0 (0.0%) | 0 (0.0%) |
| Total | 79 (100.0%) | 94 (100.0%) |
Household Income by Mortgage Status in Fairview
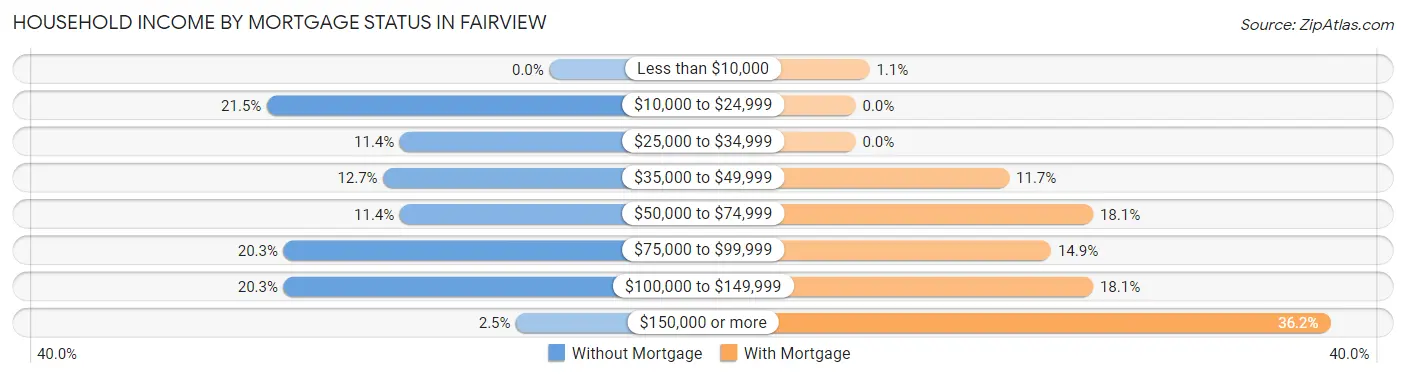
| Household Income | Without Mortgage | With Mortgage |
| Less than $10,000 | 0 (0.0%) | 1 (1.1%) |
| $10,000 to $24,999 | 17 (21.5%) | 0 (0.0%) |
| $25,000 to $34,999 | 9 (11.4%) | 0 (0.0%) |
| $35,000 to $49,999 | 10 (12.7%) | 11 (11.7%) |
| $50,000 to $74,999 | 9 (11.4%) | 17 (18.1%) |
| $75,000 to $99,999 | 16 (20.3%) | 14 (14.9%) |
| $100,000 to $149,999 | 16 (20.3%) | 17 (18.1%) |
| $150,000 or more | 2 (2.5%) | 34 (36.2%) |
| Total | 79 (100.0%) | 94 (100.0%) |
Property Value to Household Income Ratio in Fairview
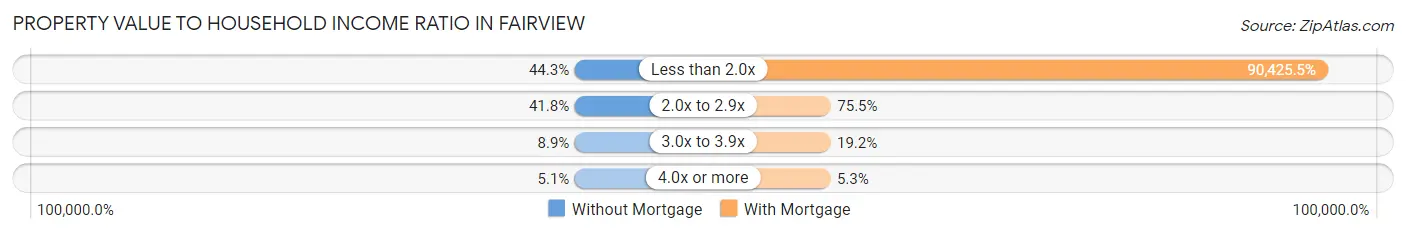
| Value-to-Income Ratio | Without Mortgage | With Mortgage |
| Less than 2.0x | 35 (44.3%) | 85,000 (90,425.5%) |
| 2.0x to 2.9x | 33 (41.8%) | 71 (75.5%) |
| 3.0x to 3.9x | 7 (8.9%) | 18 (19.2%) |
| 4.0x or more | 4 (5.1%) | 5 (5.3%) |
| Total | 79 (100.0%) | 94 (100.0%) |
Real Estate Taxes by Mortgage Status in Fairview
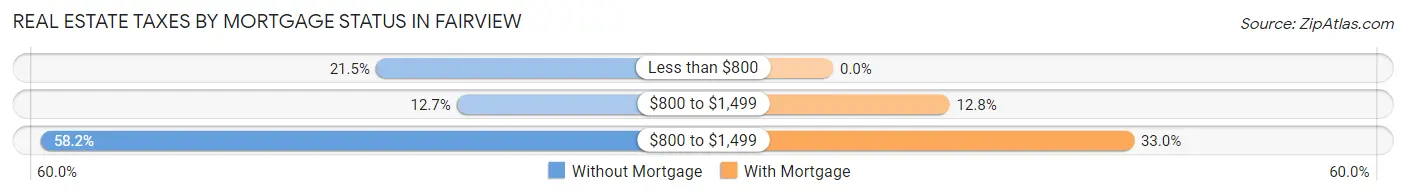
| Property Taxes | Without Mortgage | With Mortgage |
| Less than $800 | 17 (21.5%) | 0 (0.0%) |
| $800 to $1,499 | 10 (12.7%) | 12 (12.8%) |
| $800 to $1,499 | 46 (58.2%) | 31 (33.0%) |
| Total | 79 (100.0%) | 94 (100.0%) |
Health & Disability in Fairview
Health Insurance Coverage by Age in Fairview
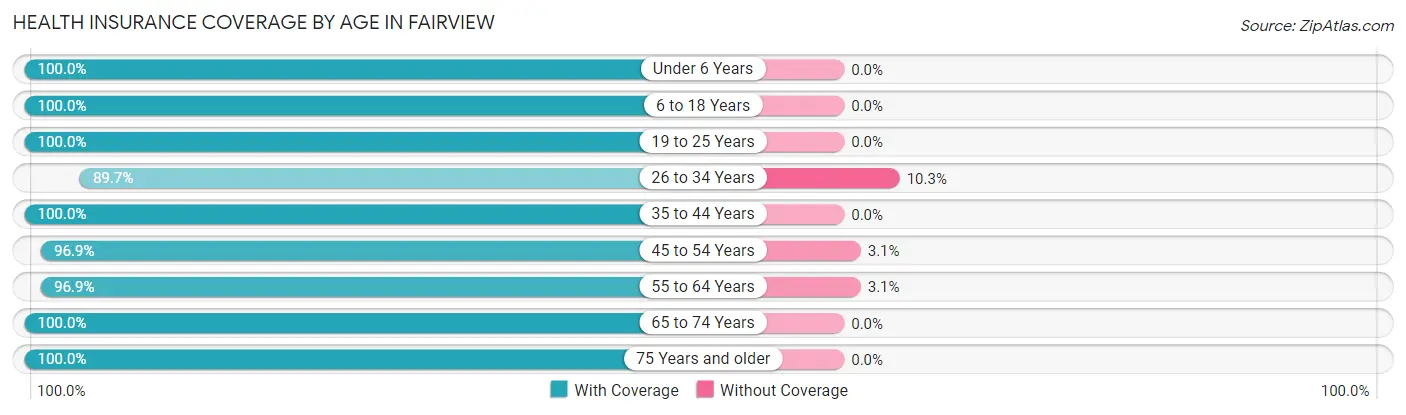
| Age Bracket | With Coverage | Without Coverage |
| Under 6 Years | 16 (100.0%) | 0 (0.0%) |
| 6 to 18 Years | 52 (100.0%) | 0 (0.0%) |
| 19 to 25 Years | 27 (100.0%) | 0 (0.0%) |
| 26 to 34 Years | 26 (89.7%) | 3 (10.3%) |
| 35 to 44 Years | 21 (100.0%) | 0 (0.0%) |
| 45 to 54 Years | 63 (96.9%) | 2 (3.1%) |
| 55 to 64 Years | 63 (96.9%) | 2 (3.1%) |
| 65 to 74 Years | 62 (100.0%) | 0 (0.0%) |
| 75 Years and older | 43 (100.0%) | 0 (0.0%) |
| Total | 373 (98.2%) | 7 (1.8%) |
Health Insurance Coverage by Citizenship Status in Fairview
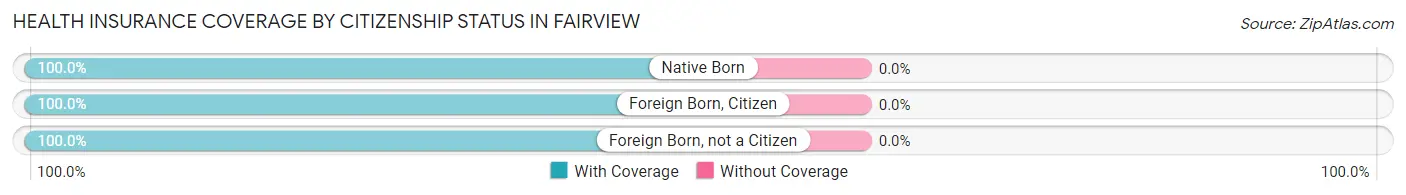
| Citizenship Status | With Coverage | Without Coverage |
| Native Born | 16 (100.0%) | 0 (0.0%) |
| Foreign Born, Citizen | 52 (100.0%) | 0 (0.0%) |
| Foreign Born, not a Citizen | 27 (100.0%) | 0 (0.0%) |
Health Insurance Coverage by Household Income in Fairview
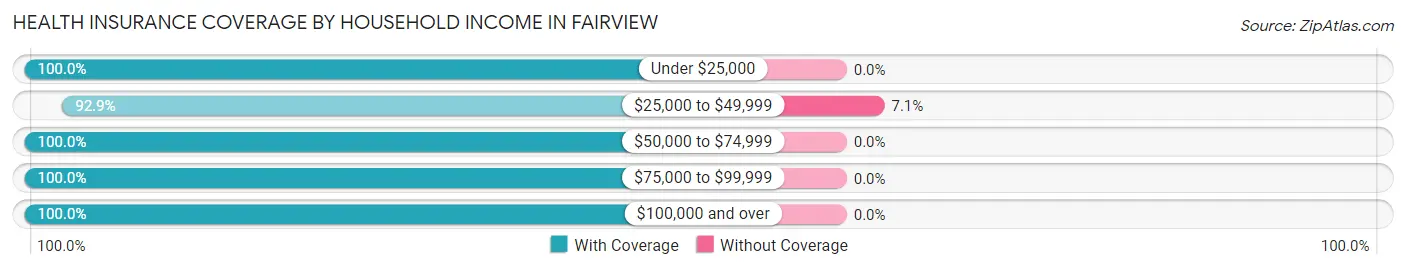
| Household Income | With Coverage | Without Coverage |
| Under $25,000 | 23 (100.0%) | 0 (0.0%) |
| $25,000 to $49,999 | 92 (92.9%) | 7 (7.1%) |
| $50,000 to $74,999 | 42 (100.0%) | 0 (0.0%) |
| $75,000 to $99,999 | 74 (100.0%) | 0 (0.0%) |
| $100,000 and over | 142 (100.0%) | 0 (0.0%) |
Public vs Private Health Insurance Coverage by Age in Fairview
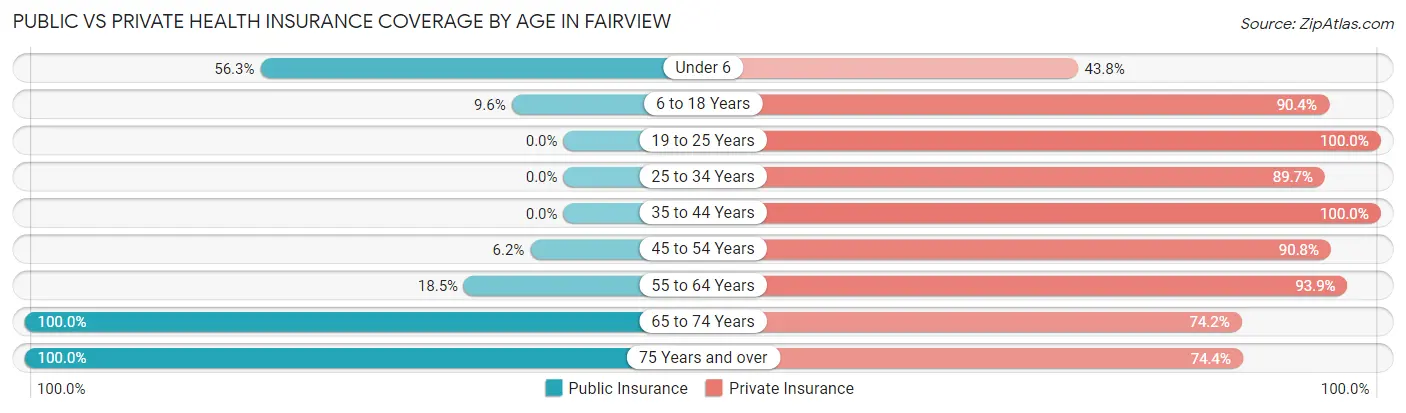
| Age Bracket | Public Insurance | Private Insurance |
| Under 6 | 9 (56.2%) | 7 (43.8%) |
| 6 to 18 Years | 5 (9.6%) | 47 (90.4%) |
| 19 to 25 Years | 0 (0.0%) | 27 (100.0%) |
| 25 to 34 Years | 0 (0.0%) | 26 (89.7%) |
| 35 to 44 Years | 0 (0.0%) | 21 (100.0%) |
| 45 to 54 Years | 4 (6.1%) | 59 (90.8%) |
| 55 to 64 Years | 12 (18.5%) | 61 (93.9%) |
| 65 to 74 Years | 62 (100.0%) | 46 (74.2%) |
| 75 Years and over | 43 (100.0%) | 32 (74.4%) |
| Total | 135 (35.5%) | 326 (85.8%) |
Disability Status by Sex by Age in Fairview
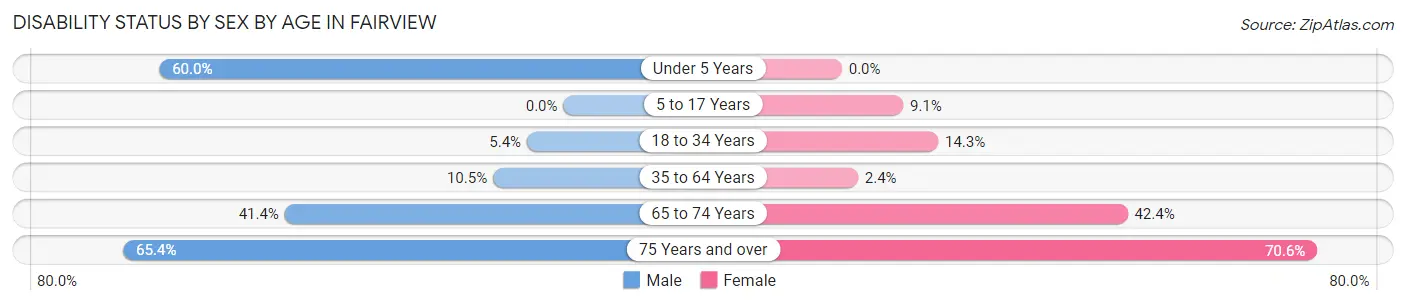
| Age Bracket | Male | Female |
| Under 5 Years | 3 (60.0%) | 0 (0.0%) |
| 5 to 17 Years | 0 (0.0%) | 2 (9.1%) |
| 18 to 34 Years | 2 (5.4%) | 4 (14.3%) |
| 35 to 64 Years | 7 (10.4%) | 2 (2.4%) |
| 65 to 74 Years | 12 (41.4%) | 14 (42.4%) |
| 75 Years and over | 17 (65.4%) | 12 (70.6%) |
Disability Class by Sex by Age in Fairview
Disability Class: Hearing Difficulty
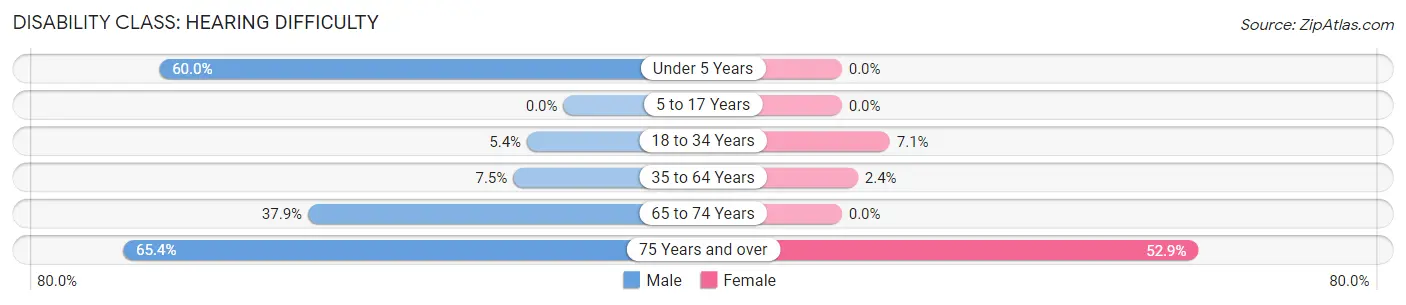
| Age Bracket | Male | Female |
| Under 5 Years | 3 (60.0%) | 0 (0.0%) |
| 5 to 17 Years | 0 (0.0%) | 0 (0.0%) |
| 18 to 34 Years | 2 (5.4%) | 2 (7.1%) |
| 35 to 64 Years | 5 (7.5%) | 2 (2.4%) |
| 65 to 74 Years | 11 (37.9%) | 0 (0.0%) |
| 75 Years and over | 17 (65.4%) | 9 (52.9%) |
Disability Class: Vision Difficulty
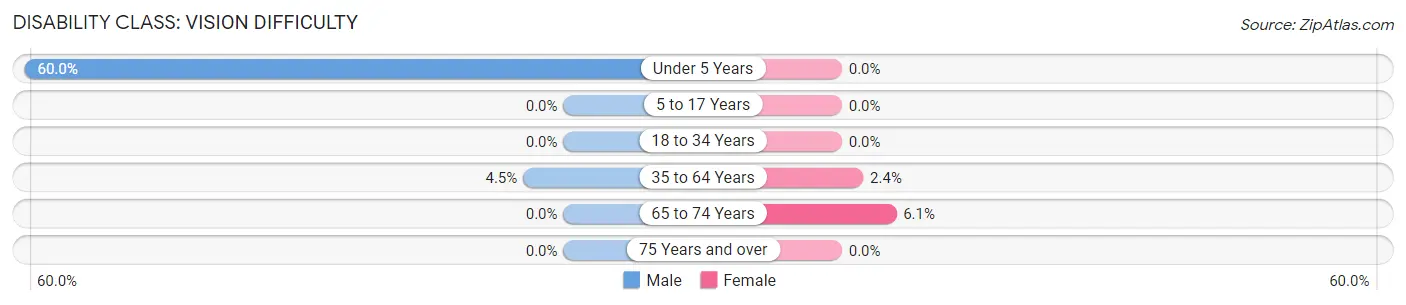
| Age Bracket | Male | Female |
| Under 5 Years | 3 (60.0%) | 0 (0.0%) |
| 5 to 17 Years | 0 (0.0%) | 0 (0.0%) |
| 18 to 34 Years | 0 (0.0%) | 0 (0.0%) |
| 35 to 64 Years | 3 (4.5%) | 2 (2.4%) |
| 65 to 74 Years | 0 (0.0%) | 2 (6.1%) |
| 75 Years and over | 0 (0.0%) | 0 (0.0%) |
Disability Class: Cognitive Difficulty
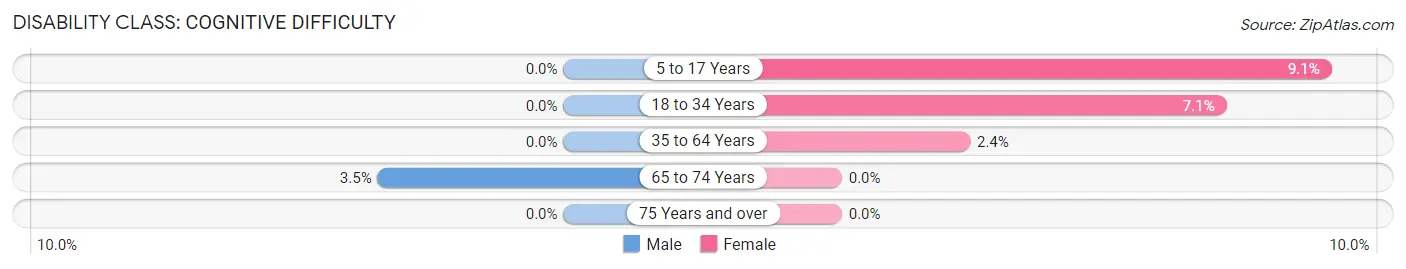
| Age Bracket | Male | Female |
| 5 to 17 Years | 0 (0.0%) | 2 (9.1%) |
| 18 to 34 Years | 0 (0.0%) | 2 (7.1%) |
| 35 to 64 Years | 0 (0.0%) | 2 (2.4%) |
| 65 to 74 Years | 1 (3.5%) | 0 (0.0%) |
| 75 Years and over | 0 (0.0%) | 0 (0.0%) |
Disability Class: Ambulatory Difficulty
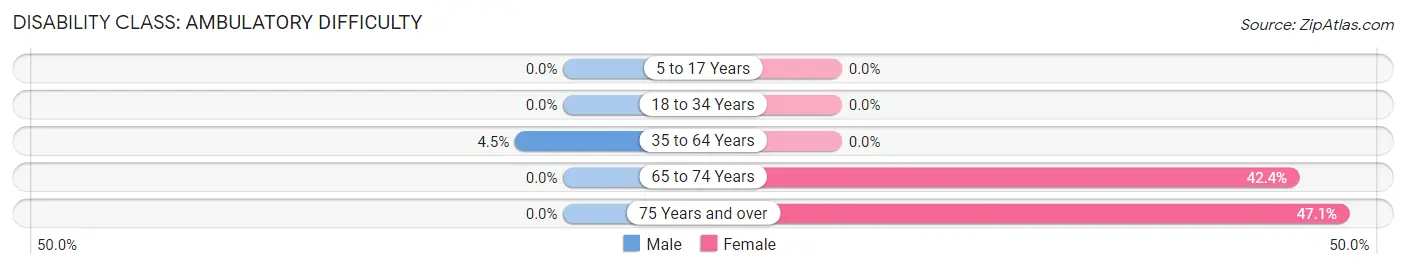
| Age Bracket | Male | Female |
| 5 to 17 Years | 0 (0.0%) | 0 (0.0%) |
| 18 to 34 Years | 0 (0.0%) | 0 (0.0%) |
| 35 to 64 Years | 3 (4.5%) | 0 (0.0%) |
| 65 to 74 Years | 0 (0.0%) | 14 (42.4%) |
| 75 Years and over | 0 (0.0%) | 8 (47.1%) |
Disability Class: Self-Care Difficulty
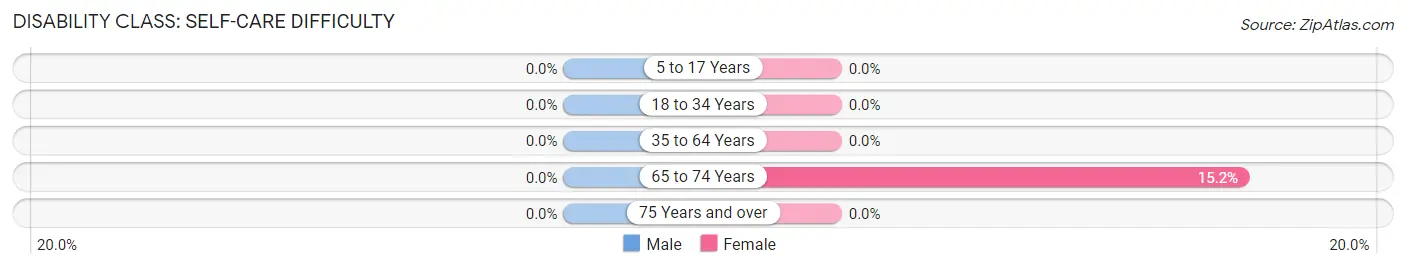
| Age Bracket | Male | Female |
| 5 to 17 Years | 0 (0.0%) | 0 (0.0%) |
| 18 to 34 Years | 0 (0.0%) | 0 (0.0%) |
| 35 to 64 Years | 0 (0.0%) | 0 (0.0%) |
| 65 to 74 Years | 0 (0.0%) | 5 (15.1%) |
| 75 Years and over | 0 (0.0%) | 0 (0.0%) |
Technology Access in Fairview
Computing Device Access in Fairview
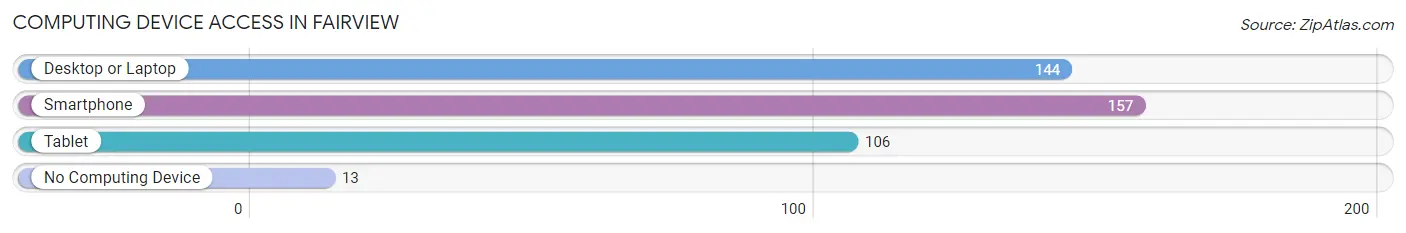
| Device Type | # Households | % Households |
| Desktop or Laptop | 144 | 78.3% |
| Smartphone | 157 | 85.3% |
| Tablet | 106 | 57.6% |
| No Computing Device | 13 | 7.1% |
| Total | 184 | 100.0% |
Internet Access in Fairview
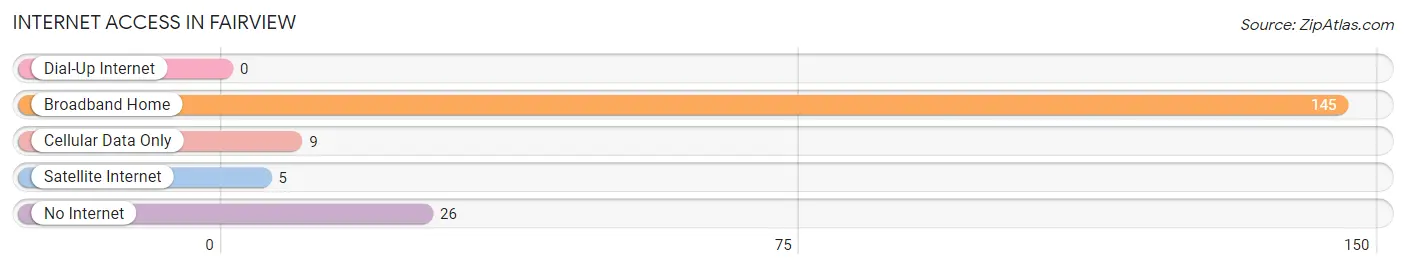
| Internet Type | # Households | % Households |
| Dial-Up Internet | 0 | 0.0% |
| Broadband Home | 145 | 78.8% |
| Cellular Data Only | 9 | 4.9% |
| Satellite Internet | 5 | 2.7% |
| No Internet | 26 | 14.1% |
| Total | 184 | 100.0% |
Fairview Summary
History
The small town of Fairview, Illinois is located in the northern part of the state, in the county of Ogle. It is situated on the banks of the Rock River, and is part of the Rockford Metropolitan Statistical Area. The town was first settled in 1835 by a group of settlers from New York, led by William and Mary Fairview. The town was named after the Fairview family, and the first post office was established in 1837.
The town grew slowly, but steadily, and by the late 19th century, it had become a thriving agricultural community. The town was home to several mills, a cheese factory, and a number of other businesses. The town also had a railroad station, which connected it to the larger cities of Rockford and Chicago.
In the early 20th century, the town began to experience a decline in population, as many of the younger generations moved away to pursue better opportunities in larger cities. However, the town was able to maintain its small-town charm, and it remains a popular destination for visitors looking for a quiet, rural getaway.
Geography
Fairview is located in the northern part of Illinois, in Ogle County. It is situated on the banks of the Rock River, and is part of the Rockford Metropolitan Statistical Area. The town is located approximately 60 miles northwest of Chicago, and is bordered by the towns of Leaf River, Forreston, and Oregon.
The town has a total area of 1.2 square miles, all of which is land. The terrain is mostly flat, with some rolling hills in the surrounding area. The climate is humid continental, with hot summers and cold winters.
Economy
The economy of Fairview is largely based on agriculture and tourism. The town is home to several farms, which produce a variety of crops, including corn, soybeans, and wheat. The town also has a number of small businesses, including restaurants, shops, and other services.
The town is also a popular destination for tourists, who come to enjoy the rural atmosphere and the nearby Rock River. The town is home to several parks, including the Fairview Park, which offers a variety of recreational activities, such as fishing, boating, and camping.
Demographics
As of the 2010 census, the population of Fairview was 1,845. The racial makeup of the town was 97.3% White, 0.7% African American, 0.2% Native American, 0.2% Asian, 0.1% Pacific Islander, 0.7% from other races, and 0.9% from two or more races. Hispanic or Latino of any race were 1.7% of the population.
The median household income in Fairview was $45,938, and the median family income was $51,250. The per capita income was $20,945. About 8.3% of families and 10.2% of the population were below the poverty line, including 14.2% of those under age 18 and 5.2% of those age 65 or over.
Common Questions
What is Per Capita Income in Fairview?
Per Capita income in Fairview is $37,069.
What is the Median Family Income in Fairview?
Median Family Income in Fairview is $86,591.
What is the Median Household income in Fairview?
Median Household Income in Fairview is $70,417.
What is Income or Wage Gap in Fairview?
Income or Wage Gap in Fairview is 36.4%.
Women in Fairview earn 63.6 cents for every dollar earned by a man.
What is Inequality or Gini Index in Fairview?
Inequality or Gini Index in Fairview is 0.34.
What is the Total Population of Fairview?
Total Population of Fairview is 380.
What is the Total Male Population of Fairview?
Total Male Population of Fairview is 185.
What is the Total Female Population of Fairview?
Total Female Population of Fairview is 195.
What is the Ratio of Males per 100 Females in Fairview?
There are 94.87 Males per 100 Females in Fairview.
What is the Ratio of Females per 100 Males in Fairview?
There are 105.41 Females per 100 Males in Fairview.
What is the Median Population Age in Fairview?
Median Population Age in Fairview is 49.9 Years.
What is the Average Family Size in Fairview
Average Family Size in Fairview is 2.8 People.
What is the Average Household Size in Fairview
Average Household Size in Fairview is 2.1 People.
How Large is the Labor Force in Fairview?
There are 190 People in the Labor Forcein in Fairview.
What is the Percentage of People in the Labor Force in Fairview?
57.6% of People are in the Labor Force in Fairview.