Fairfield, IL Map & Demographics
Fairfield Map
Fairfield Overview
$28,769
PER CAPITA INCOME
$69,639
AVG FAMILY INCOME
$43,681
AVG HOUSEHOLD INCOME
37.5%
WAGE / INCOME GAP [ % ]
62.5¢/ $1
WAGE / INCOME GAP [ $ ]
$10,809
FAMILY INCOME DEFICIT
0.43
INEQUALITY / GINI INDEX
4,773
TOTAL POPULATION
2,452
MALE POPULATION
2,321
FEMALE POPULATION
105.64
MALES / 100 FEMALES
94.66
FEMALES / 100 MALES
43.1
MEDIAN AGE
2.7
AVG FAMILY SIZE
2.0
AVG HOUSEHOLD SIZE
2,213
LABOR FORCE [ PEOPLE ]
56.4%
PERCENT IN LABOR FORCE
3.6%
UNEMPLOYMENT RATE
Fairfield Zip Codes
Fairfield Area Codes
Income in Fairfield
Income Overview in Fairfield
Per Capita Income in Fairfield is $28,769, while median incomes of families and households are $69,639 and $43,681 respectively.
| Characteristic | Number | Measure |
| Per Capita Income | 4,773 | $28,769 |
| Median Family Income | 1,287 | $69,639 |
| Mean Family Income | 1,287 | $78,580 |
| Median Household Income | 2,319 | $43,681 |
| Mean Household Income | 2,319 | $59,017 |
| Income Deficit | 1,287 | $10,809 |
| Wage / Income Gap (%) | 4,773 | 37.54% |
| Wage / Income Gap ($) | 4,773 | 62.46¢ per $1 |
| Gini / Inequality Index | 4,773 | 0.43 |
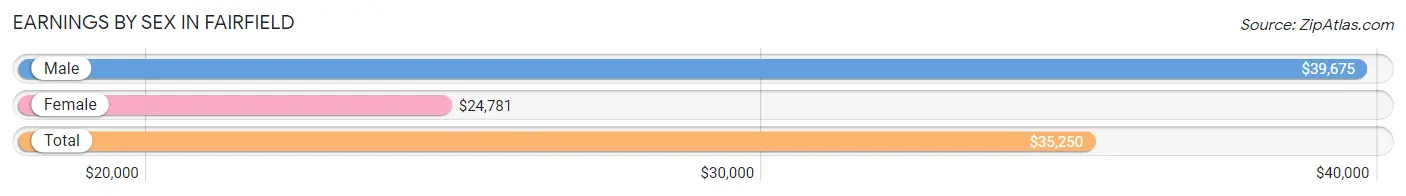
Earnings by Sex in Fairfield
Average Earnings in Fairfield are $35,250, $39,675 for men and $24,781 for women, a difference of 37.5%.
| Sex | Number | Average Earnings |
| Male | 1,306 (56.0%) | $39,675 |
| Female | 1,025 (44.0%) | $24,781 |
| Total | 2,331 (100.0%) | $35,250 |
Earnings by Sex by Income Bracket in Fairfield
The most common earnings brackets in Fairfield are $65,000 to $74,999 for men (191 | 14.6%) and $2,499 or less for women (132 | 12.9%).
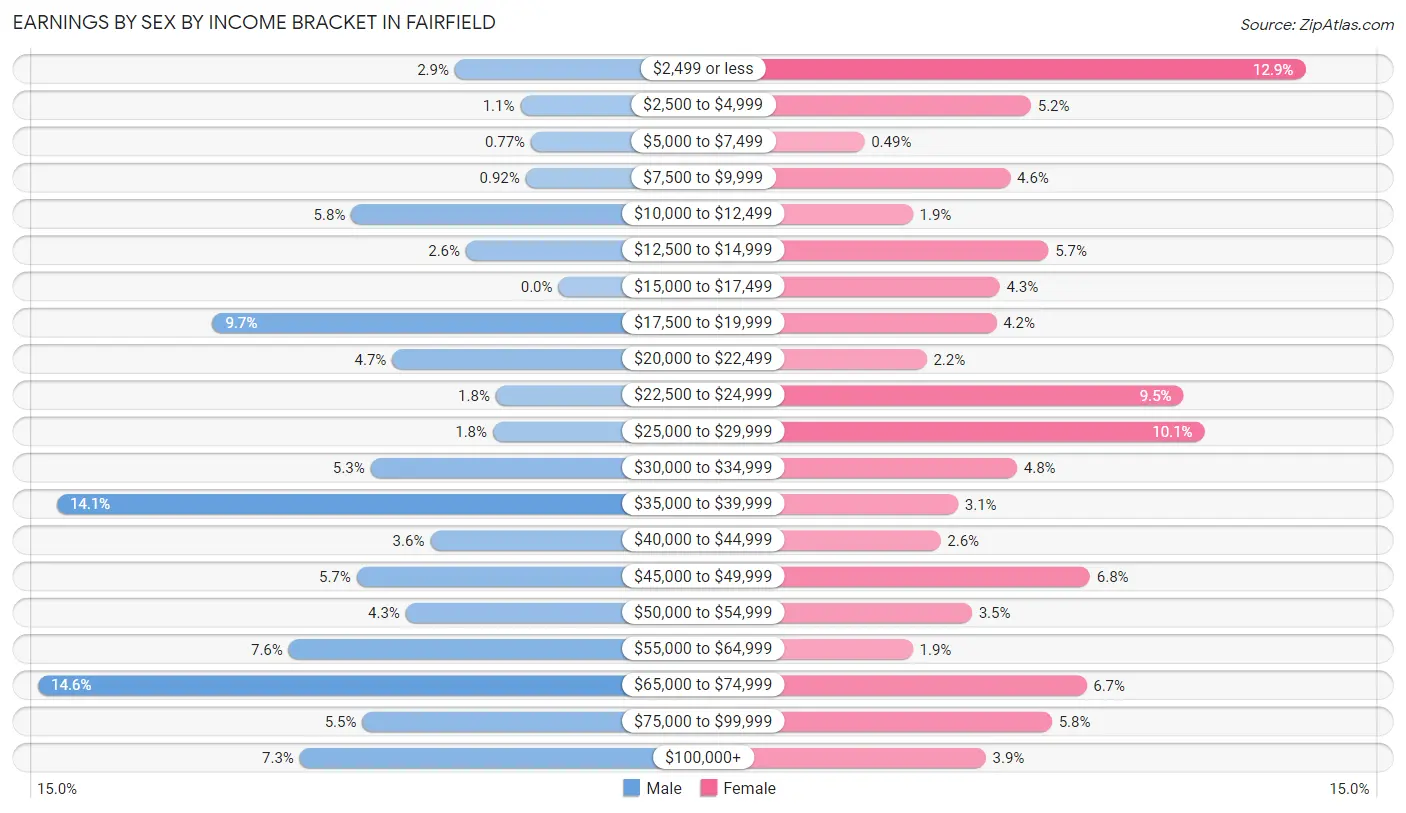
| Income | Male | Female |
| $2,499 or less | 38 (2.9%) | 132 (12.9%) |
| $2,500 to $4,999 | 14 (1.1%) | 53 (5.2%) |
| $5,000 to $7,499 | 10 (0.8%) | 5 (0.5%) |
| $7,500 to $9,999 | 12 (0.9%) | 47 (4.6%) |
| $10,000 to $12,499 | 76 (5.8%) | 19 (1.8%) |
| $12,500 to $14,999 | 34 (2.6%) | 58 (5.7%) |
| $15,000 to $17,499 | 0 (0.0%) | 44 (4.3%) |
| $17,500 to $19,999 | 127 (9.7%) | 43 (4.2%) |
| $20,000 to $22,499 | 61 (4.7%) | 23 (2.2%) |
| $22,500 to $24,999 | 23 (1.8%) | 97 (9.5%) |
| $25,000 to $29,999 | 24 (1.8%) | 103 (10.1%) |
| $30,000 to $34,999 | 69 (5.3%) | 49 (4.8%) |
| $35,000 to $39,999 | 184 (14.1%) | 32 (3.1%) |
| $40,000 to $44,999 | 47 (3.6%) | 27 (2.6%) |
| $45,000 to $49,999 | 74 (5.7%) | 70 (6.8%) |
| $50,000 to $54,999 | 56 (4.3%) | 36 (3.5%) |
| $55,000 to $64,999 | 99 (7.6%) | 19 (1.8%) |
| $65,000 to $74,999 | 191 (14.6%) | 69 (6.7%) |
| $75,000 to $99,999 | 72 (5.5%) | 59 (5.8%) |
| $100,000+ | 95 (7.3%) | 40 (3.9%) |
| Total | 1,306 (100.0%) | 1,025 (100.0%) |
Earnings by Sex by Educational Attainment in Fairfield
Average earnings in Fairfield are $45,028 for men and $25,881 for women, a difference of 42.5%. Men with an educational attainment of high school diploma enjoy the highest average annual earnings of $58,281, while those with college or associate's degree education earn the least with $38,676. Women with an educational attainment of graduate degree earn the most with the average annual earnings of $48,875, while those with high school diploma education have the smallest earnings of $16,000.
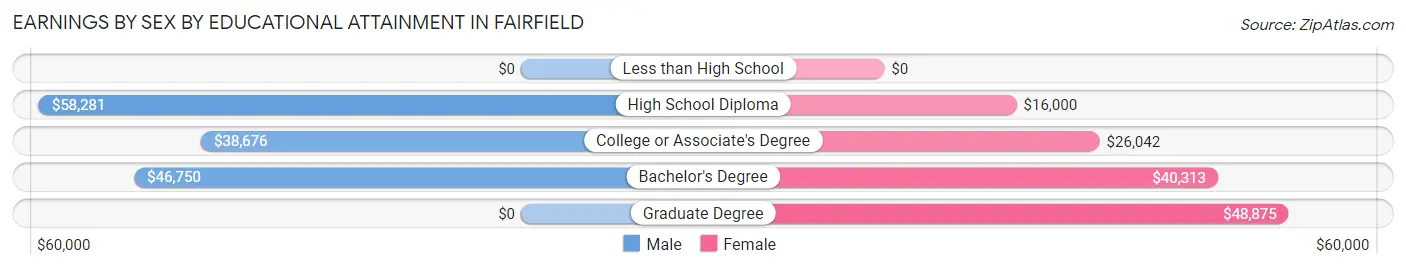
| Educational Attainment | Male Income | Female Income |
| Less than High School | - | - |
| High School Diploma | $58,281 | $16,000 |
| College or Associate's Degree | $38,676 | $26,042 |
| Bachelor's Degree | $46,750 | $40,313 |
| Graduate Degree | - | - |
| Total | $45,028 | $25,881 |
Family Income in Fairfield
Family Income Brackets in Fairfield
According to the Fairfield family income data, there are 309 families falling into the $50,000 to $74,999 income range, which is the most common income bracket and makes up 24.0% of all families. Conversely, the $150,000 to $199,999 income bracket is the least frequent group with only 12 families (0.9%) belonging to this category.
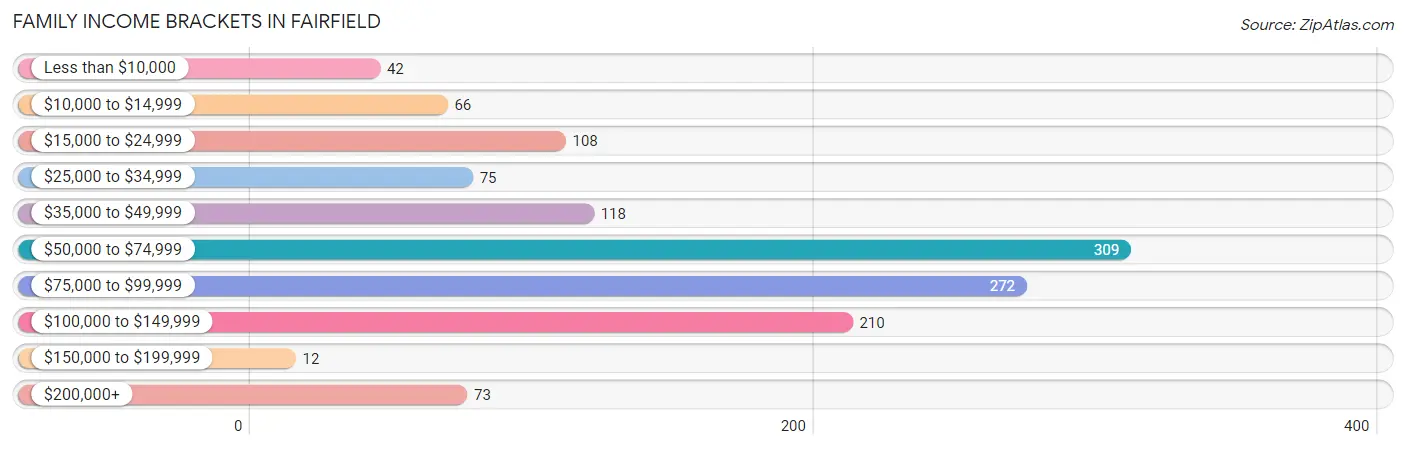
| Income Bracket | # Families | % Families |
| Less than $10,000 | 42 | 3.3% |
| $10,000 to $14,999 | 66 | 5.1% |
| $15,000 to $24,999 | 108 | 8.4% |
| $25,000 to $34,999 | 75 | 5.8% |
| $35,000 to $49,999 | 118 | 9.2% |
| $50,000 to $74,999 | 309 | 24.0% |
| $75,000 to $99,999 | 272 | 21.1% |
| $100,000 to $149,999 | 210 | 16.3% |
| $150,000 to $199,999 | 12 | 0.9% |
| $200,000+ | 73 | 5.7% |
Family Income by Famaliy Size in Fairfield
4-person families (243 | 18.9%) account for the highest median family income in Fairfield with $81,098 per family, while 2-person families (636 | 49.4%) have the highest median income of $31,707 per family member.
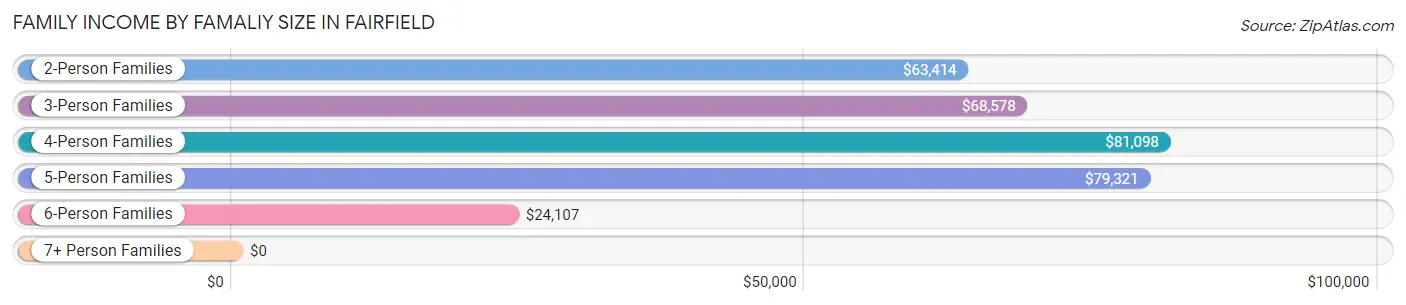
| Income Bracket | # Families | Median Income |
| 2-Person Families | 636 (49.4%) | $63,414 |
| 3-Person Families | 291 (22.6%) | $68,578 |
| 4-Person Families | 243 (18.9%) | $81,098 |
| 5-Person Families | 67 (5.2%) | $79,321 |
| 6-Person Families | 45 (3.5%) | $24,107 |
| 7+ Person Families | 5 (0.4%) | $0 |
| Total | 1,287 (100.0%) | $69,639 |
Family Income by Number of Earners in Fairfield
The median family income in Fairfield is $69,639, with families comprising 3+ earners (67) having the highest median family income of $115,673, while families with 1 earner (326) have the lowest median family income of $26,207, accounting for 5.2% and 25.3% of families, respectively.
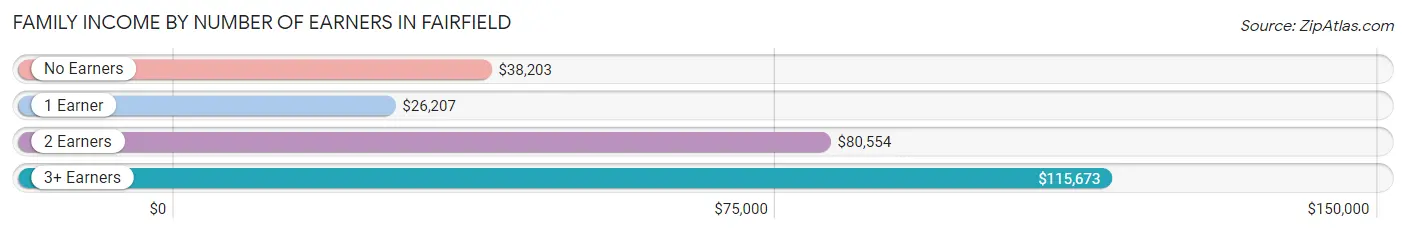
| Number of Earners | # Families | Median Income |
| No Earners | 209 (16.2%) | $38,203 |
| 1 Earner | 326 (25.3%) | $26,207 |
| 2 Earners | 685 (53.2%) | $80,554 |
| 3+ Earners | 67 (5.2%) | $115,673 |
| Total | 1,287 (100.0%) | $69,639 |
Household Income in Fairfield
Household Income Brackets in Fairfield
With 401 households falling in the category, the $50,000 to $74,999 income range is the most frequent in Fairfield, accounting for 17.3% of all households. In contrast, only 12 households (0.5%) fall into the $150,000 to $199,999 income bracket, making it the least populous group.
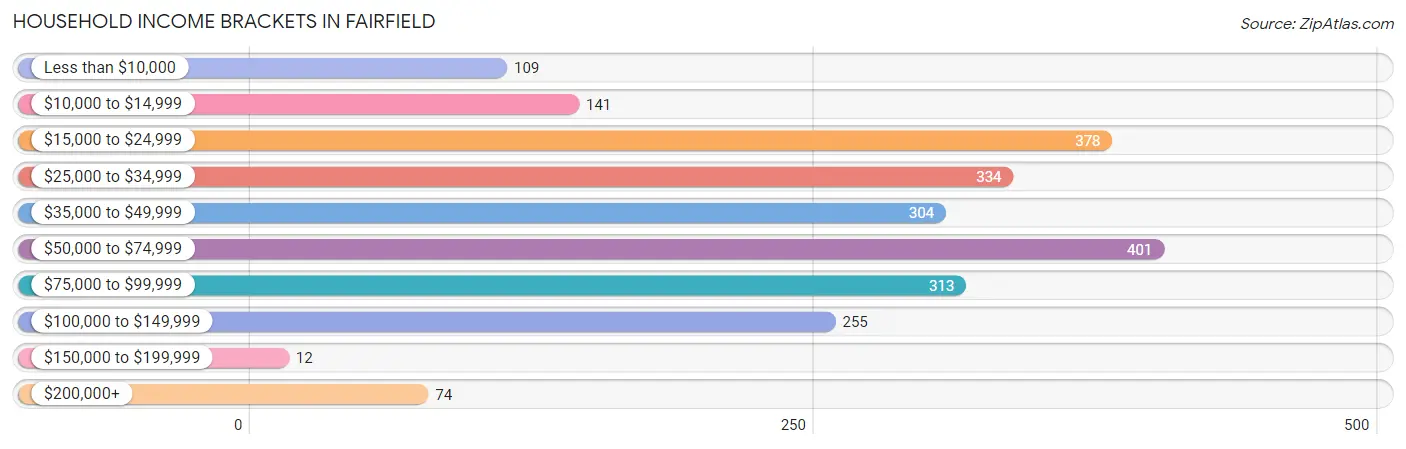
| Income Bracket | # Households | % Households |
| Less than $10,000 | 109 | 4.7% |
| $10,000 to $14,999 | 141 | 6.1% |
| $15,000 to $24,999 | 378 | 16.3% |
| $25,000 to $34,999 | 334 | 14.4% |
| $35,000 to $49,999 | 304 | 13.1% |
| $50,000 to $74,999 | 401 | 17.3% |
| $75,000 to $99,999 | 313 | 13.5% |
| $100,000 to $149,999 | 255 | 11.0% |
| $150,000 to $199,999 | 12 | 0.5% |
| $200,000+ | 74 | 3.2% |
Household Income by Householder Age in Fairfield
The median household income in Fairfield is $43,681, with the highest median household income of $71,250 found in the 25 to 44 years age bracket for the primary householder. A total of 670 households (28.9%) fall into this category. Meanwhile, the 15 to 24 years age bracket for the primary householder has the lowest median household income of $0, with 78 households (3.4%) in this group.
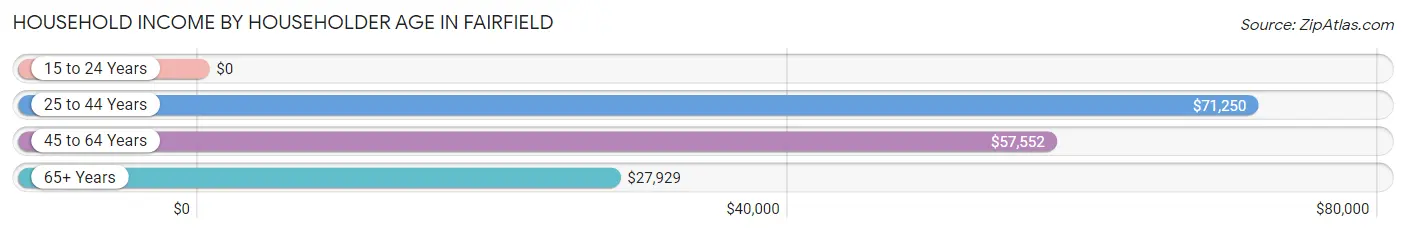
| Income Bracket | # Households | Median Income |
| 15 to 24 Years | 78 (3.4%) | $0 |
| 25 to 44 Years | 670 (28.9%) | $71,250 |
| 45 to 64 Years | 753 (32.5%) | $57,552 |
| 65+ Years | 818 (35.3%) | $27,929 |
| Total | 2,319 (100.0%) | $43,681 |
Poverty in Fairfield
Income Below Poverty by Sex and Age in Fairfield
With 17.3% poverty level for males and 20.1% for females among the residents of Fairfield, 15 year old males and 5 year old females are the most vulnerable to poverty, with 17 males (68.0%) and 9 females (69.2%) in their respective age groups living below the poverty level.
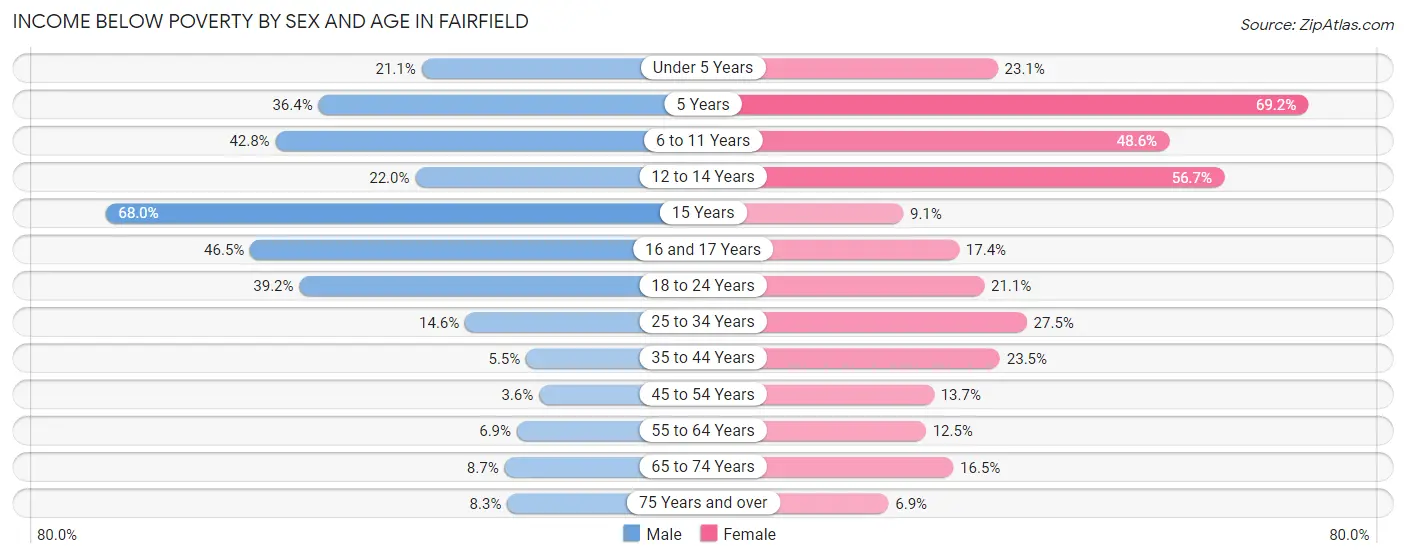
| Age Bracket | Male | Female |
| Under 5 Years | 40 (21.0%) | 28 (23.1%) |
| 5 Years | 8 (36.4%) | 9 (69.2%) |
| 6 to 11 Years | 59 (42.7%) | 68 (48.6%) |
| 12 to 14 Years | 20 (22.0%) | 38 (56.7%) |
| 15 Years | 17 (68.0%) | 3 (9.1%) |
| 16 and 17 Years | 20 (46.5%) | 4 (17.4%) |
| 18 to 24 Years | 127 (39.2%) | 34 (21.1%) |
| 25 to 34 Years | 48 (14.6%) | 70 (27.5%) |
| 35 to 44 Years | 12 (5.5%) | 65 (23.5%) |
| 45 to 54 Years | 10 (3.6%) | 40 (13.7%) |
| 55 to 64 Years | 24 (6.9%) | 38 (12.5%) |
| 65 to 74 Years | 18 (8.7%) | 44 (16.5%) |
| 75 Years and over | 18 (8.3%) | 25 (6.9%) |
| Total | 421 (17.3%) | 466 (20.1%) |
Income Above Poverty by Sex and Age in Fairfield
According to the poverty statistics in Fairfield, males aged 45 to 54 years and females aged 75 years and over are the age groups that are most secure financially, with 96.4% of males and 93.1% of females in these age groups living above the poverty line.
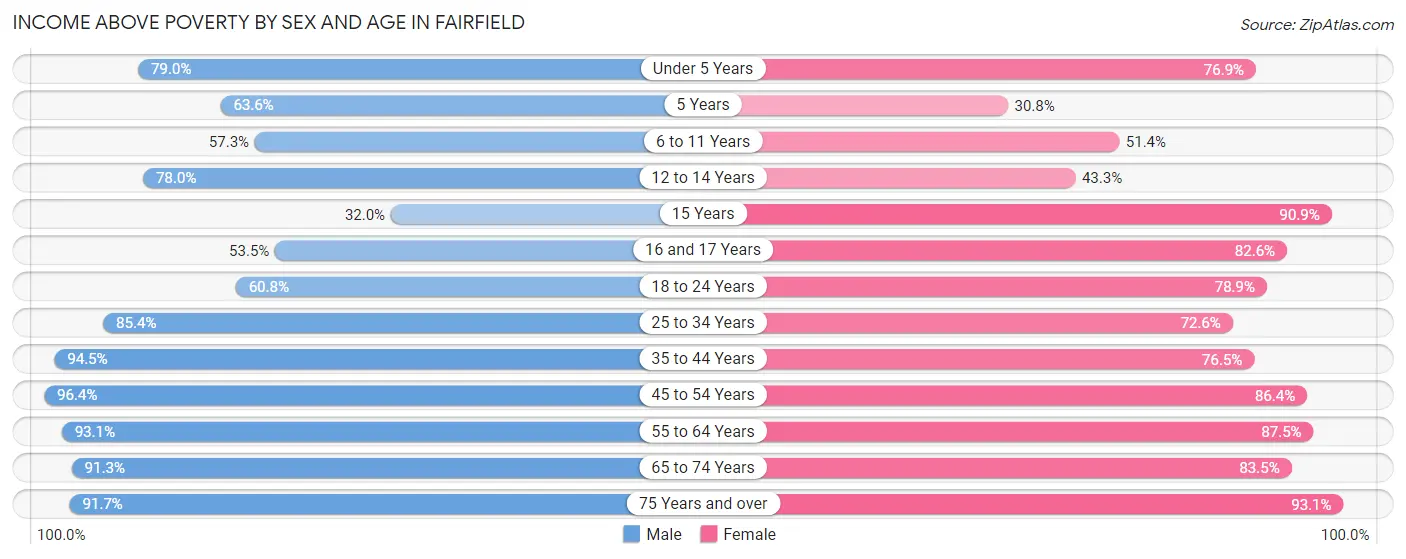
| Age Bracket | Male | Female |
| Under 5 Years | 150 (78.9%) | 93 (76.9%) |
| 5 Years | 14 (63.6%) | 4 (30.8%) |
| 6 to 11 Years | 79 (57.3%) | 72 (51.4%) |
| 12 to 14 Years | 71 (78.0%) | 29 (43.3%) |
| 15 Years | 8 (32.0%) | 30 (90.9%) |
| 16 and 17 Years | 23 (53.5%) | 19 (82.6%) |
| 18 to 24 Years | 197 (60.8%) | 127 (78.9%) |
| 25 to 34 Years | 281 (85.4%) | 185 (72.6%) |
| 35 to 44 Years | 205 (94.5%) | 212 (76.5%) |
| 45 to 54 Years | 267 (96.4%) | 253 (86.4%) |
| 55 to 64 Years | 324 (93.1%) | 267 (87.5%) |
| 65 to 74 Years | 188 (91.3%) | 222 (83.5%) |
| 75 Years and over | 198 (91.7%) | 337 (93.1%) |
| Total | 2,005 (82.7%) | 1,850 (79.9%) |
Income Below Poverty Among Married-Couple Families in Fairfield
The poverty statistics for married-couple families in Fairfield show that 2.8% or 27 of the total 957 families live below the poverty line. Families with 3 or 4 children have the highest poverty rate of 18.6%, comprising of 11 families. On the other hand, families with 1 or 2 children have the lowest poverty rate of 1.1%, which includes 4 families.
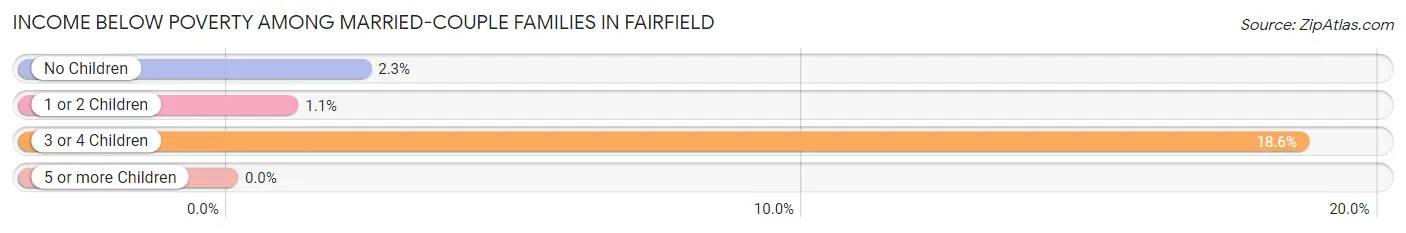
| Children | Above Poverty | Below Poverty |
| No Children | 506 (97.7%) | 12 (2.3%) |
| 1 or 2 Children | 376 (99.0%) | 4 (1.1%) |
| 3 or 4 Children | 48 (81.4%) | 11 (18.6%) |
| 5 or more Children | 0 (0.0%) | 0 (0.0%) |
| Total | 930 (97.2%) | 27 (2.8%) |
Income Below Poverty Among Single-Parent Households in Fairfield
According to the poverty data in Fairfield, 41.2% or 35 single-father households and 51.4% or 126 single-mother households are living below the poverty line. Among single-father households, those with no children have the highest poverty rate, with 2 households (100.0%) experiencing poverty. Likewise, among single-mother households, those with 3 or 4 children have the highest poverty rate, with 6 households (100.0%) falling below the poverty line.
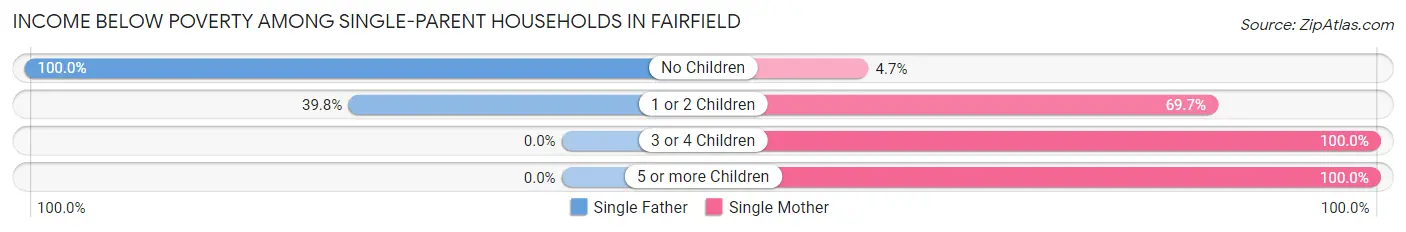
| Children | Single Father | Single Mother |
| No Children | 2 (100.0%) | 4 (4.6%) |
| 1 or 2 Children | 33 (39.8%) | 85 (69.7%) |
| 3 or 4 Children | 0 (0.0%) | 6 (100.0%) |
| 5 or more Children | 0 (0.0%) | 31 (100.0%) |
| Total | 35 (41.2%) | 126 (51.4%) |
Income Below Poverty Among Married-Couple vs Single-Parent Households in Fairfield
The poverty data for Fairfield shows that 27 of the married-couple family households (2.8%) and 161 of the single-parent households (48.8%) are living below the poverty level. Within the married-couple family households, those with 3 or 4 children have the highest poverty rate, with 11 households (18.6%) falling below the poverty line. Among the single-parent households, those with 3 or 4 children have the highest poverty rate, with 6 household (100.0%) living below poverty.
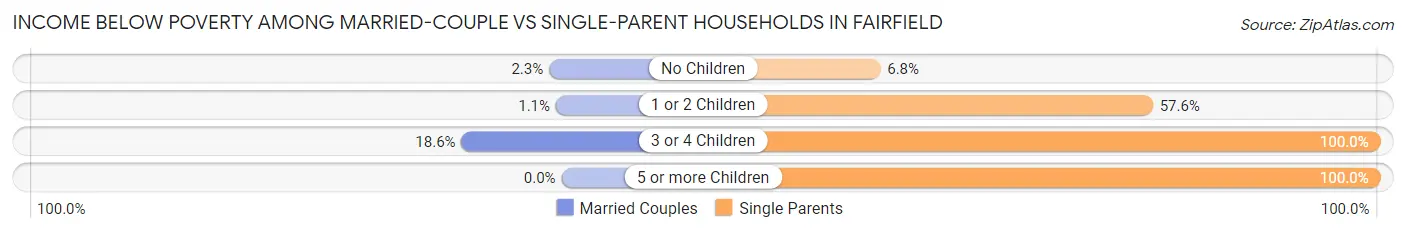
| Children | Married-Couple Families | Single-Parent Households |
| No Children | 12 (2.3%) | 6 (6.8%) |
| 1 or 2 Children | 4 (1.1%) | 118 (57.6%) |
| 3 or 4 Children | 11 (18.6%) | 6 (100.0%) |
| 5 or more Children | 0 (0.0%) | 31 (100.0%) |
| Total | 27 (2.8%) | 161 (48.8%) |
Race in Fairfield
The most populous races in Fairfield are White / Caucasian (4,511 | 94.5%), Black / African American (109 | 2.3%), and Two or more Races (72 | 1.5%).
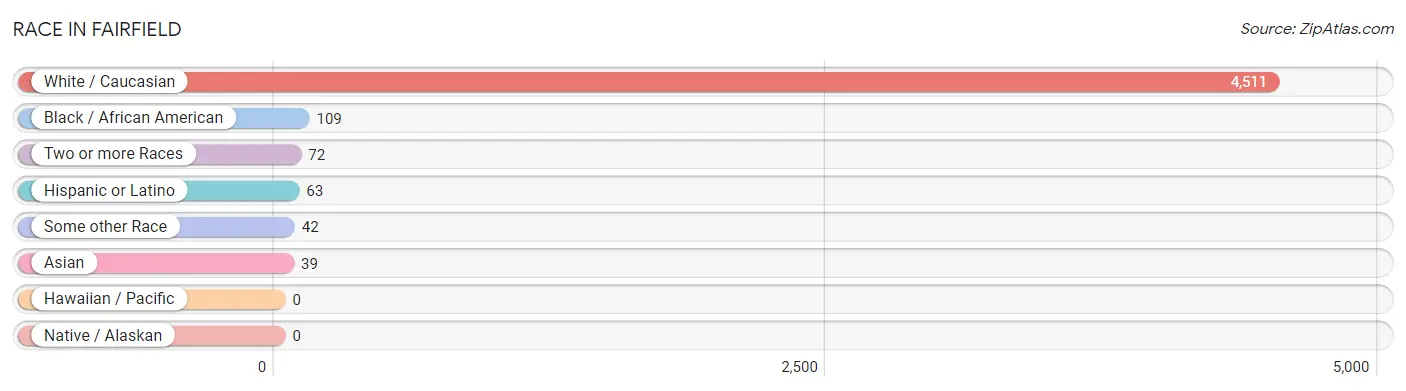
| Race | # Population | % Population |
| Asian | 39 | 0.8% |
| Black / African American | 109 | 2.3% |
| Hawaiian / Pacific | 0 | 0.0% |
| Hispanic or Latino | 63 | 1.3% |
| Native / Alaskan | 0 | 0.0% |
| White / Caucasian | 4,511 | 94.5% |
| Two or more Races | 72 | 1.5% |
| Some other Race | 42 | 0.9% |
| Total | 4,773 | 100.0% |
Ancestry in Fairfield
The most populous ancestries reported in Fairfield are English (844 | 17.7%), German (831 | 17.4%), Irish (638 | 13.4%), American (266 | 5.6%), and Swedish (177 | 3.7%), together accounting for 57.7% of all Fairfield residents.
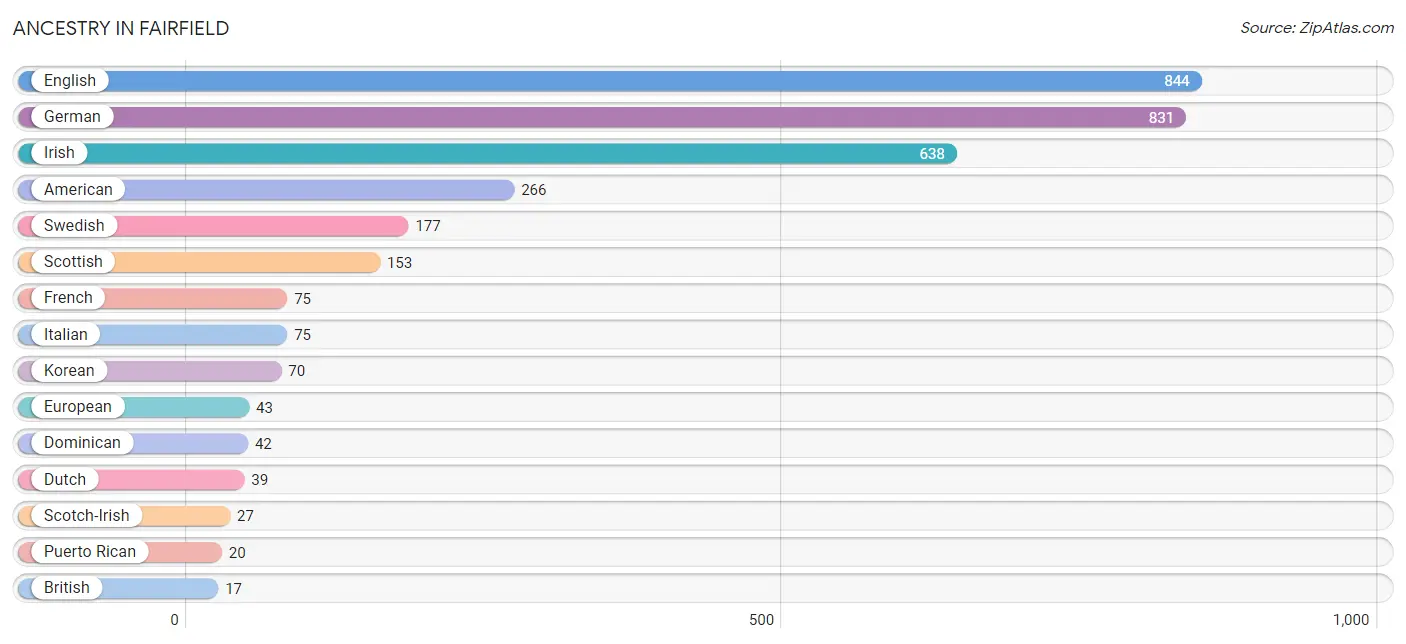
| Ancestry | # Population | % Population |
| American | 266 | 5.6% |
| Belgian | 7 | 0.2% |
| Blackfeet | 4 | 0.1% |
| British | 17 | 0.4% |
| Cherokee | 6 | 0.1% |
| Croatian | 10 | 0.2% |
| Danish | 14 | 0.3% |
| Dominican | 42 | 0.9% |
| Dutch | 39 | 0.8% |
| English | 844 | 17.7% |
| European | 43 | 0.9% |
| French | 75 | 1.6% |
| German | 831 | 17.4% |
| Irish | 638 | 13.4% |
| Italian | 75 | 1.6% |
| Korean | 70 | 1.5% |
| Norwegian | 11 | 0.2% |
| Polish | 11 | 0.2% |
| Portuguese | 2 | 0.0% |
| Potawatomi | 1 | 0.0% |
| Puerto Rican | 20 | 0.4% |
| Russian | 12 | 0.3% |
| Scotch-Irish | 27 | 0.6% |
| Scottish | 153 | 3.2% |
| Swedish | 177 | 3.7% |
| Swiss | 14 | 0.3% |
| Thai | 2 | 0.0% |
| Ukrainian | 11 | 0.2% | View All 28 Rows |
Immigrants in Fairfield
The most numerous immigrant groups reported in Fairfield came from Latin America (45 | 0.9%), Caribbean (42 | 0.9%), Dominican Republic (42 | 0.9%), Canada (37 | 0.8%), and Australia (14 | 0.3%), together accounting for 3.8% of all Fairfield residents.
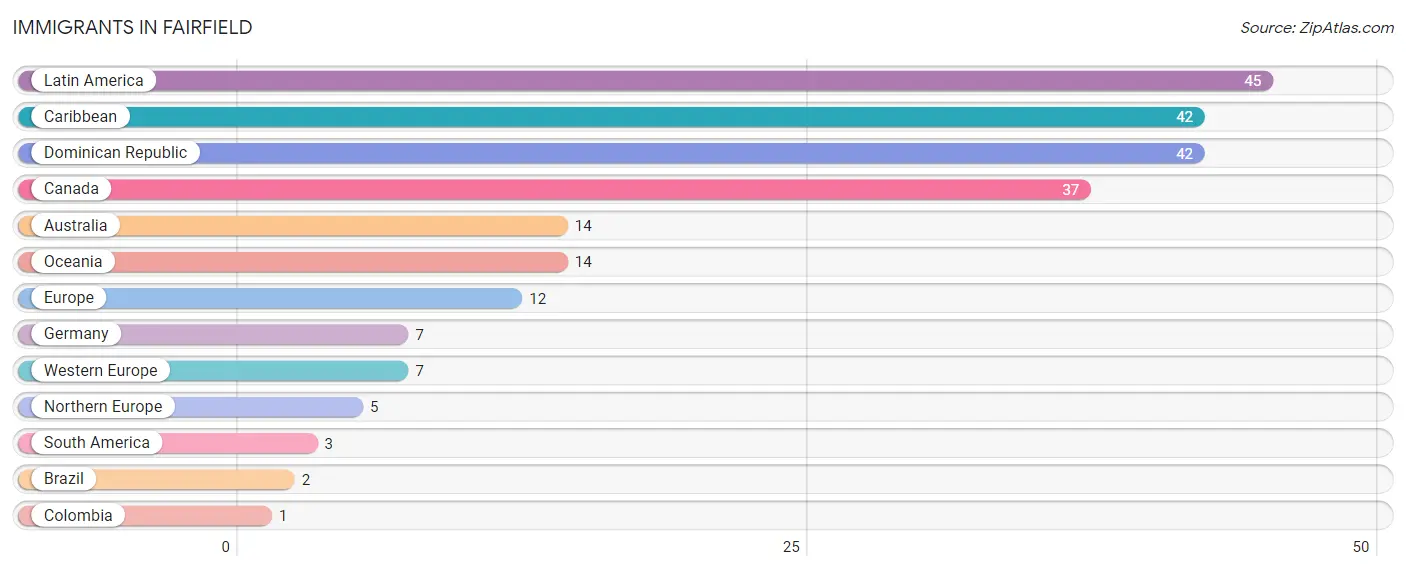
| Immigration Origin | # Population | % Population |
| Australia | 14 | 0.3% |
| Brazil | 2 | 0.0% |
| Canada | 37 | 0.8% |
| Caribbean | 42 | 0.9% |
| Colombia | 1 | 0.0% |
| Dominican Republic | 42 | 0.9% |
| Europe | 12 | 0.3% |
| Germany | 7 | 0.2% |
| Latin America | 45 | 0.9% |
| Northern Europe | 5 | 0.1% |
| Oceania | 14 | 0.3% |
| South America | 3 | 0.1% |
| Western Europe | 7 | 0.2% | View All 13 Rows |
Sex and Age in Fairfield
Sex and Age in Fairfield
The most populous age groups in Fairfield are 50 to 54 Years (220 | 9.0%) for men and 40 to 44 Years (217 | 9.3%) for women.
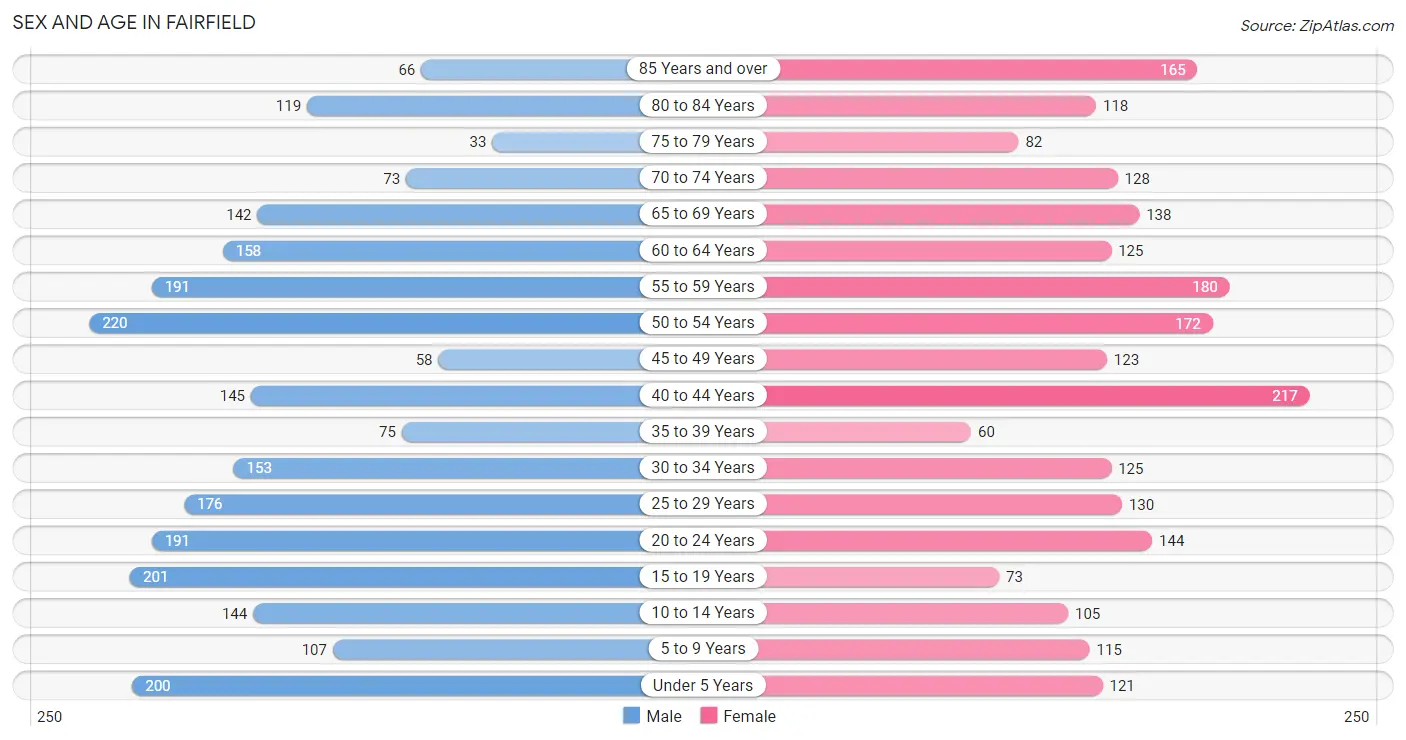
| Age Bracket | Male | Female |
| Under 5 Years | 200 (8.2%) | 121 (5.2%) |
| 5 to 9 Years | 107 (4.4%) | 115 (5.0%) |
| 10 to 14 Years | 144 (5.9%) | 105 (4.5%) |
| 15 to 19 Years | 201 (8.2%) | 73 (3.2%) |
| 20 to 24 Years | 191 (7.8%) | 144 (6.2%) |
| 25 to 29 Years | 176 (7.2%) | 130 (5.6%) |
| 30 to 34 Years | 153 (6.2%) | 125 (5.4%) |
| 35 to 39 Years | 75 (3.1%) | 60 (2.6%) |
| 40 to 44 Years | 145 (5.9%) | 217 (9.3%) |
| 45 to 49 Years | 58 (2.4%) | 123 (5.3%) |
| 50 to 54 Years | 220 (9.0%) | 172 (7.4%) |
| 55 to 59 Years | 191 (7.8%) | 180 (7.8%) |
| 60 to 64 Years | 158 (6.4%) | 125 (5.4%) |
| 65 to 69 Years | 142 (5.8%) | 138 (5.9%) |
| 70 to 74 Years | 73 (3.0%) | 128 (5.5%) |
| 75 to 79 Years | 33 (1.3%) | 82 (3.5%) |
| 80 to 84 Years | 119 (4.9%) | 118 (5.1%) |
| 85 Years and over | 66 (2.7%) | 165 (7.1%) |
| Total | 2,452 (100.0%) | 2,321 (100.0%) |
Families and Households in Fairfield
Median Family Size in Fairfield
The median family size in Fairfield is 2.67 persons per family, with single female/mother families (245 | 19.0%) accounting for the largest median family size of 2.9 persons per family. On the other hand, single male/father families (85 | 6.6%) represent the smallest median family size with 1.98 persons per family.
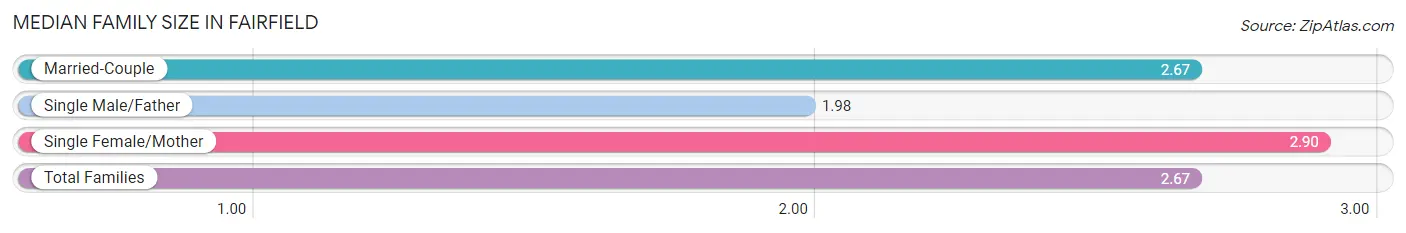
| Family Type | # Families | Family Size |
| Married-Couple | 957 (74.4%) | 2.67 |
| Single Male/Father | 85 (6.6%) | 1.98 |
| Single Female/Mother | 245 (19.0%) | 2.90 |
| Total Families | 1,287 (100.0%) | 2.67 |
Median Household Size in Fairfield
The median household size in Fairfield is 2.04 persons per household, with single female/mother households (245 | 10.6%) accounting for the largest median household size of 2.99 persons per household. non-family households (1,032 | 44.5%) represent the smallest median household size with 1.18 persons per household.
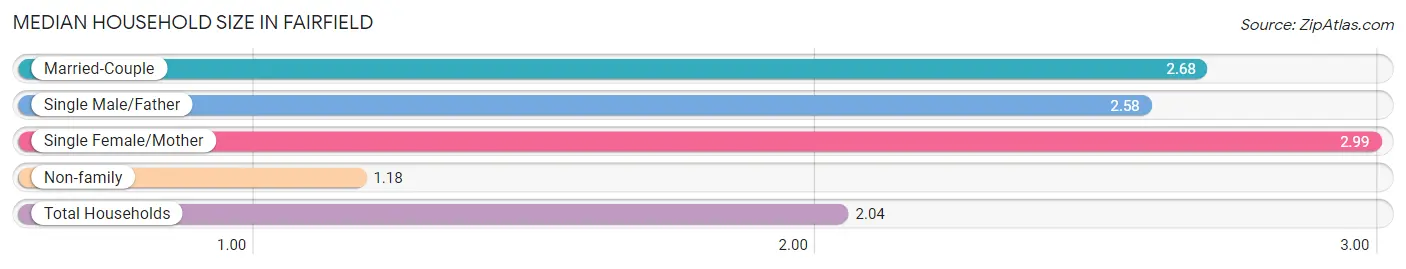
| Household Type | # Households | Household Size |
| Married-Couple | 957 (41.3%) | 2.68 |
| Single Male/Father | 85 (3.7%) | 2.58 |
| Single Female/Mother | 245 (10.6%) | 2.99 |
| Non-family | 1,032 (44.5%) | 1.18 |
| Total Households | 2,319 (100.0%) | 2.04 |
Household Size by Marriage Status in Fairfield
Out of a total of 2,319 households in Fairfield, 1,287 (55.5%) are family households, while 1,032 (44.5%) are nonfamily households. The most numerous type of family households are 2-person households, comprising 589, and the most common type of nonfamily households are 1-person households, comprising 958.
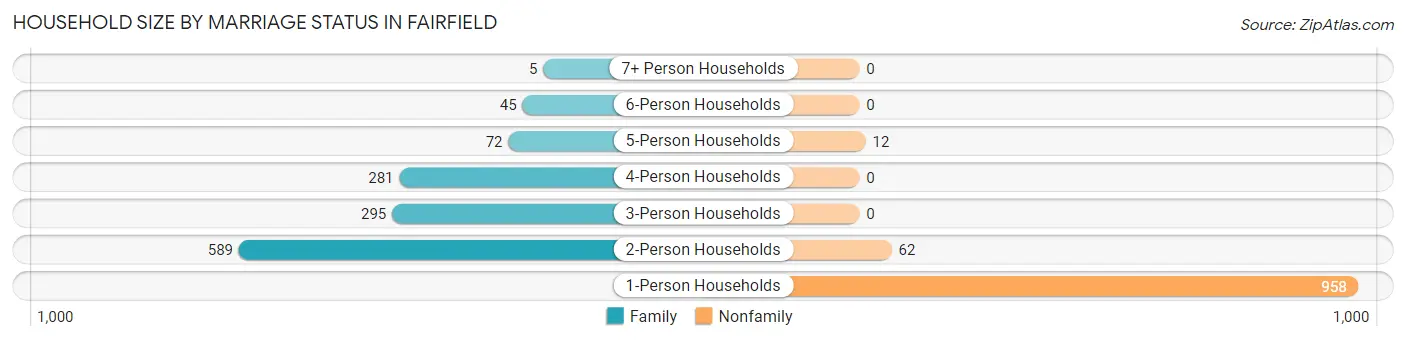
| Household Size | Family Households | Nonfamily Households |
| 1-Person Households | - | 958 (41.3%) |
| 2-Person Households | 589 (25.4%) | 62 (2.7%) |
| 3-Person Households | 295 (12.7%) | 0 (0.0%) |
| 4-Person Households | 281 (12.1%) | 0 (0.0%) |
| 5-Person Households | 72 (3.1%) | 12 (0.5%) |
| 6-Person Households | 45 (1.9%) | 0 (0.0%) |
| 7+ Person Households | 5 (0.2%) | 0 (0.0%) |
| Total | 1,287 (55.5%) | 1,032 (44.5%) |
Female Fertility in Fairfield
Fertility by Age in Fairfield
Average fertility rate in Fairfield is 37.0 births per 1,000 women. Women in the age bracket of 20 to 34 years have the highest fertility rate with 83.0 births per 1,000 women. Women in the age bracket of 20 to 34 years acount for 100.0% of all women with births.
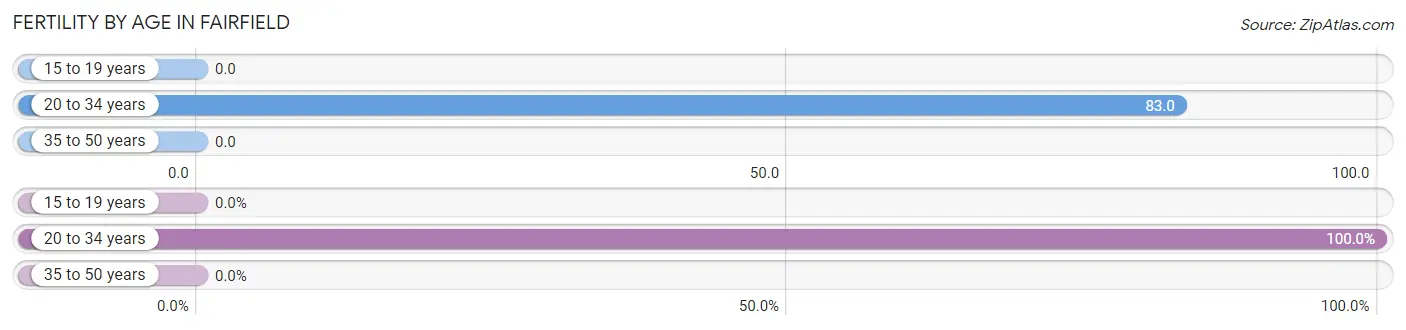
| Age Bracket | Women with Births | Births / 1,000 Women |
| 15 to 19 years | 0 (0.0%) | 0.0 |
| 20 to 34 years | 33 (100.0%) | 83.0 |
| 35 to 50 years | 0 (0.0%) | 0.0 |
| Total | 33 (100.0%) | 37.0 |
Fertility by Age by Marriage Status in Fairfield
21.2% of women with births (33) in Fairfield are married. The highest percentage of unmarried women with births falls into 20 to 34 years age bracket with 78.8% of them unmarried at the time of birth, while the lowest percentage of unmarried women with births belong to 20 to 34 years age bracket with 78.8% of them unmarried.
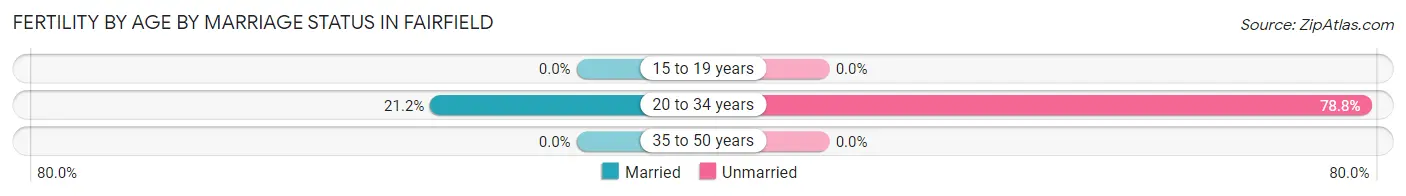
| Age Bracket | Married | Unmarried |
| 15 to 19 years | 0 (0.0%) | 0 (0.0%) |
| 20 to 34 years | 7 (21.2%) | 26 (78.8%) |
| 35 to 50 years | 0 (0.0%) | 0 (0.0%) |
| Total | 7 (21.2%) | 26 (78.8%) |
Fertility by Education in Fairfield
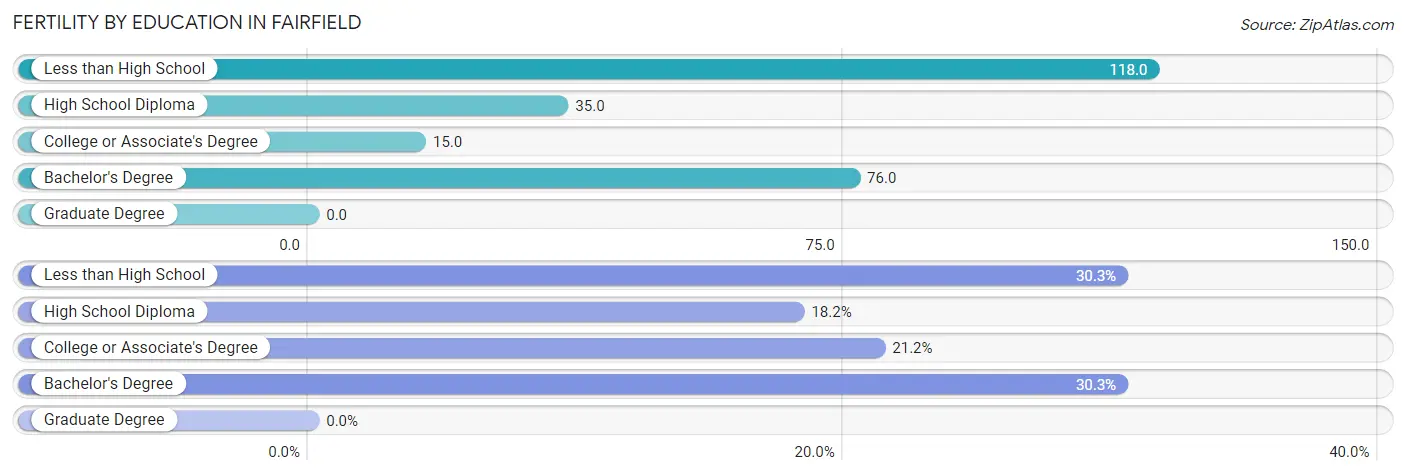
| Educational Attainment | Women with Births | Births / 1,000 Women |
| Less than High School | 10 (30.3%) | 118.0 |
| High School Diploma | 6 (18.2%) | 35.0 |
| College or Associate's Degree | 7 (21.2%) | 15.0 |
| Bachelor's Degree | 10 (30.3%) | 76.0 |
| Graduate Degree | 0 (0.0%) | 0.0 |
| Total | 33 (100.0%) | 37.0 |
Fertility by Education by Marriage Status in Fairfield
78.8% of women with births in Fairfield are unmarried. Women with the educational attainment of college or associate's degree are most likely to be married with 100.0% of them married at childbirth, while women with the educational attainment of less than high school are least likely to be married with 100.0% of them unmarried at childbirth.
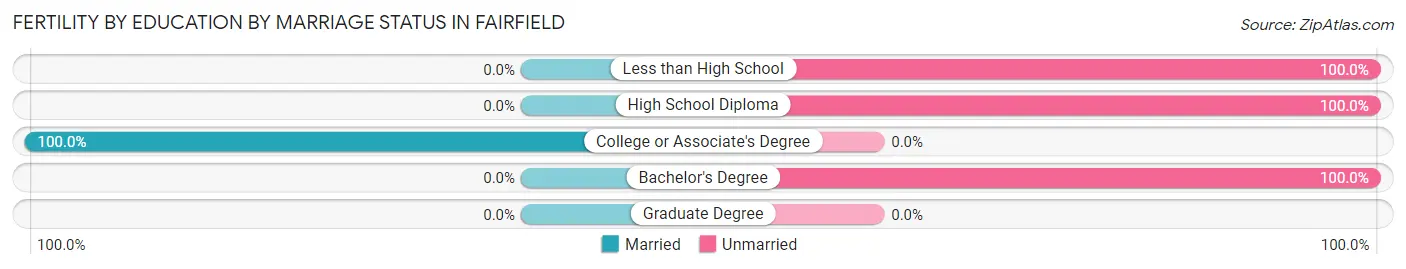
| Educational Attainment | Married | Unmarried |
| Less than High School | 0 (0.0%) | 10 (100.0%) |
| High School Diploma | 0 (0.0%) | 6 (100.0%) |
| College or Associate's Degree | 7 (100.0%) | 0 (0.0%) |
| Bachelor's Degree | 0 (0.0%) | 10 (100.0%) |
| Graduate Degree | 0 (0.0%) | 0 (0.0%) |
| Total | 7 (21.2%) | 26 (78.8%) |
Employment Characteristics in Fairfield
Employment by Class of Employer in Fairfield
Among the 2,103 employed individuals in Fairfield, private company employees (1,546 | 73.5%), local government employees (194 | 9.2%), and not-for-profit organizations (130 | 6.2%) make up the most common classes of employment.
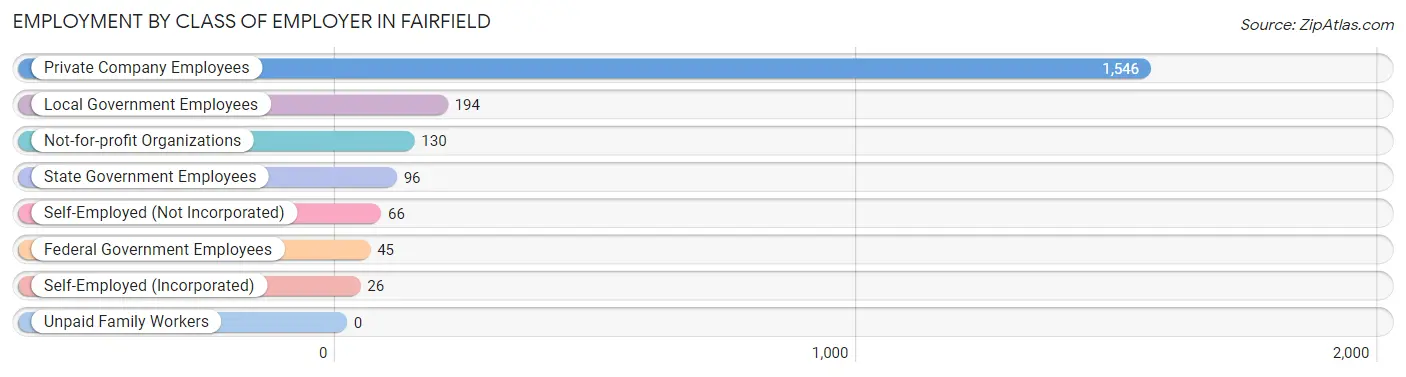
| Employer Class | # Employees | % Employees |
| Private Company Employees | 1,546 | 73.5% |
| Self-Employed (Incorporated) | 26 | 1.2% |
| Self-Employed (Not Incorporated) | 66 | 3.1% |
| Not-for-profit Organizations | 130 | 6.2% |
| Local Government Employees | 194 | 9.2% |
| State Government Employees | 96 | 4.6% |
| Federal Government Employees | 45 | 2.1% |
| Unpaid Family Workers | 0 | 0.0% |
| Total | 2,103 | 100.0% |
Employment Status by Age in Fairfield
According to the labor force statistics for Fairfield, out of the total population over 16 years of age (3,923), 56.4% or 2,213 individuals are in the labor force, with 3.6% or 80 of them unemployed. The age group with the highest labor force participation rate is 25 to 29 years, with 88.9% or 272 individuals in the labor force. Within the labor force, the 20 to 24 years age range has the highest percentage of unemployed individuals, with 17.8% or 39 of them being unemployed.
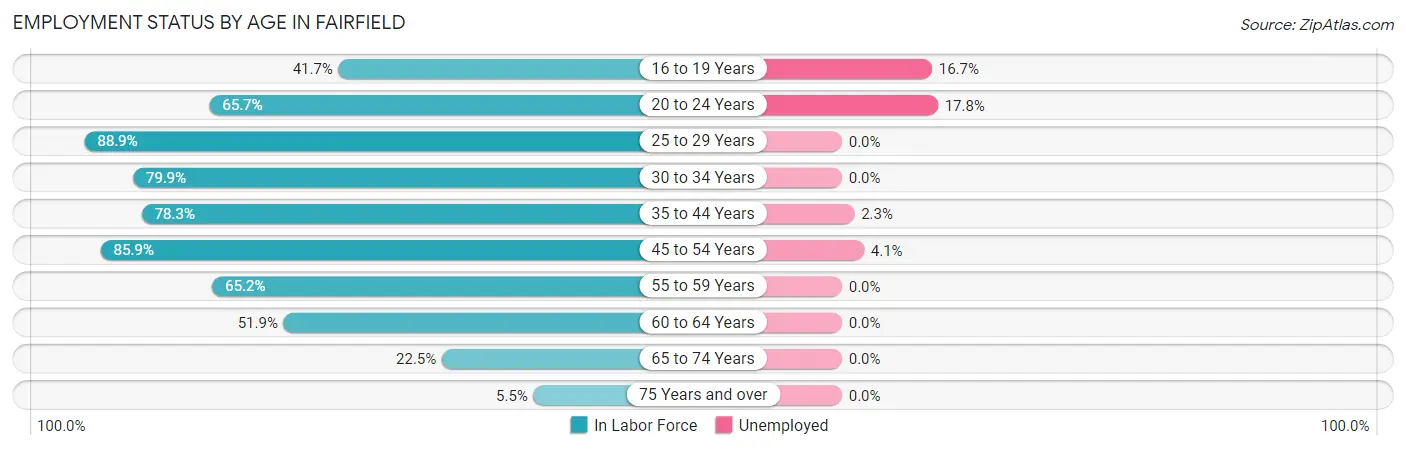
| Age Bracket | In Labor Force | Unemployed |
| 16 to 19 Years | 90 (41.7%) | 15 (16.7%) |
| 20 to 24 Years | 220 (65.7%) | 39 (17.8%) |
| 25 to 29 Years | 272 (88.9%) | 0 (0.0%) |
| 30 to 34 Years | 222 (79.9%) | 0 (0.0%) |
| 35 to 44 Years | 389 (78.3%) | 9 (2.3%) |
| 45 to 54 Years | 492 (85.9%) | 20 (4.1%) |
| 55 to 59 Years | 242 (65.2%) | 0 (0.0%) |
| 60 to 64 Years | 147 (51.9%) | 0 (0.0%) |
| 65 to 74 Years | 108 (22.5%) | 0 (0.0%) |
| 75 Years and over | 32 (5.5%) | 0 (0.0%) |
| Total | 2,213 (56.4%) | 80 (3.6%) |
Employment Status by Educational Attainment in Fairfield
According to labor force statistics for Fairfield, 76.4% of individuals (1,763) out of the total population between 25 and 64 years of age (2,308) are in the labor force, with 1.6% or 28 of them being unemployed. The group with the highest labor force participation rate are those with the educational attainment of bachelor's degree or higher, with 83.1% or 359 individuals in the labor force. Within the labor force, individuals with less than high school education have the highest percentage of unemployment, with 20.0% or 20 of them being unemployed.
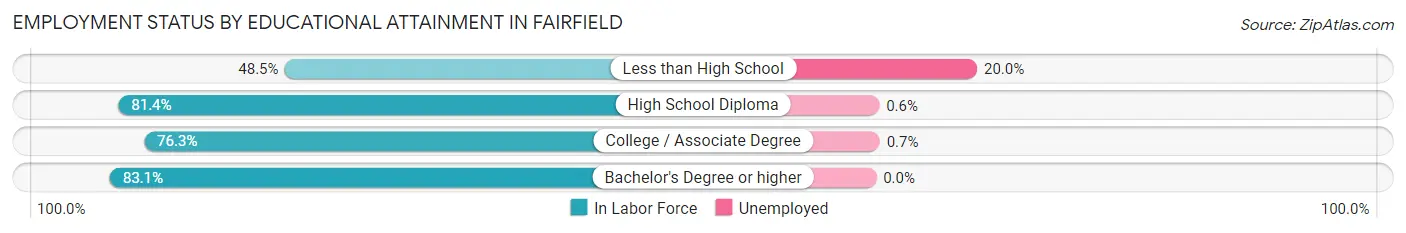
| Educational Attainment | In Labor Force | Unemployed |
| Less than High School | 100 (48.5%) | 41 (20.0%) |
| High School Diploma | 495 (81.4%) | 4 (0.6%) |
| College / Associate Degree | 810 (76.3%) | 7 (0.7%) |
| Bachelor's Degree or higher | 359 (83.1%) | 0 (0.0%) |
| Total | 1,763 (76.4%) | 37 (1.6%) |
Employment Occupations by Sex in Fairfield
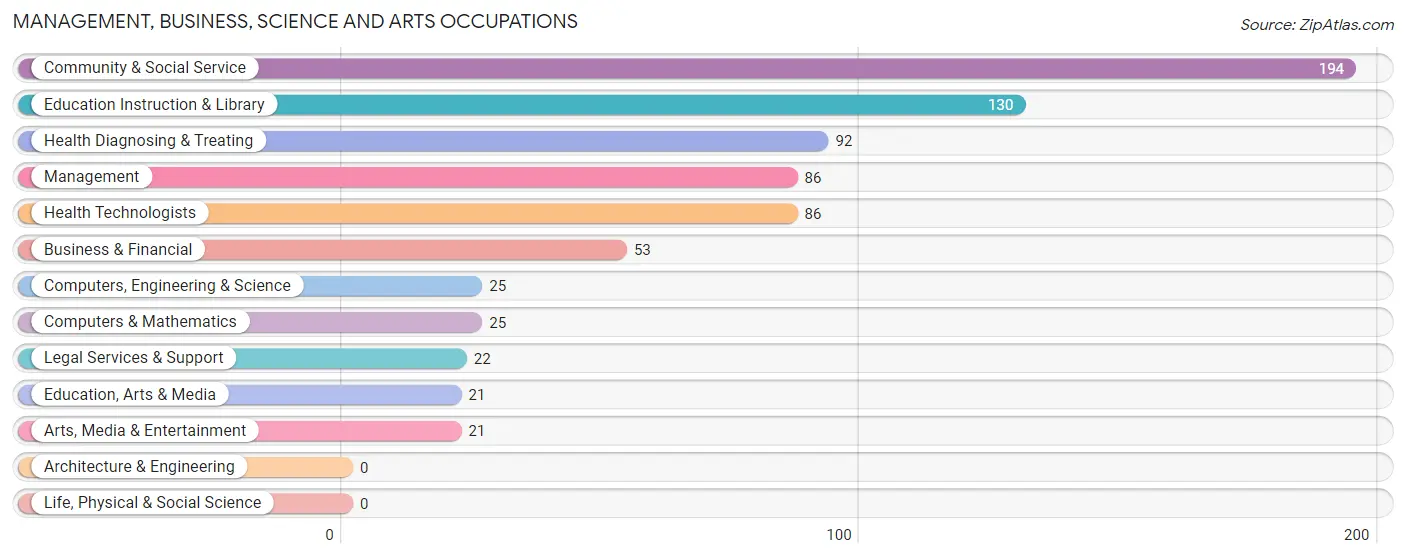
Management, Business, Science and Arts Occupations
The most common Management, Business, Science and Arts occupations in Fairfield are Community & Social Service (194 | 9.2%), Education Instruction & Library (130 | 6.2%), Health Diagnosing & Treating (92 | 4.4%), Management (86 | 4.1%), and Health Technologists (86 | 4.1%).
Management, Business, Science and Arts Occupations by Sex
Within the Management, Business, Science and Arts occupations in Fairfield, the most male-oriented occupations are Legal Services & Support (100.0%), Education, Arts & Media (71.4%), and Management (62.8%), while the most female-oriented occupations are Computers, Engineering & Science (100.0%), Computers & Mathematics (100.0%), and Arts, Media & Entertainment (100.0%).
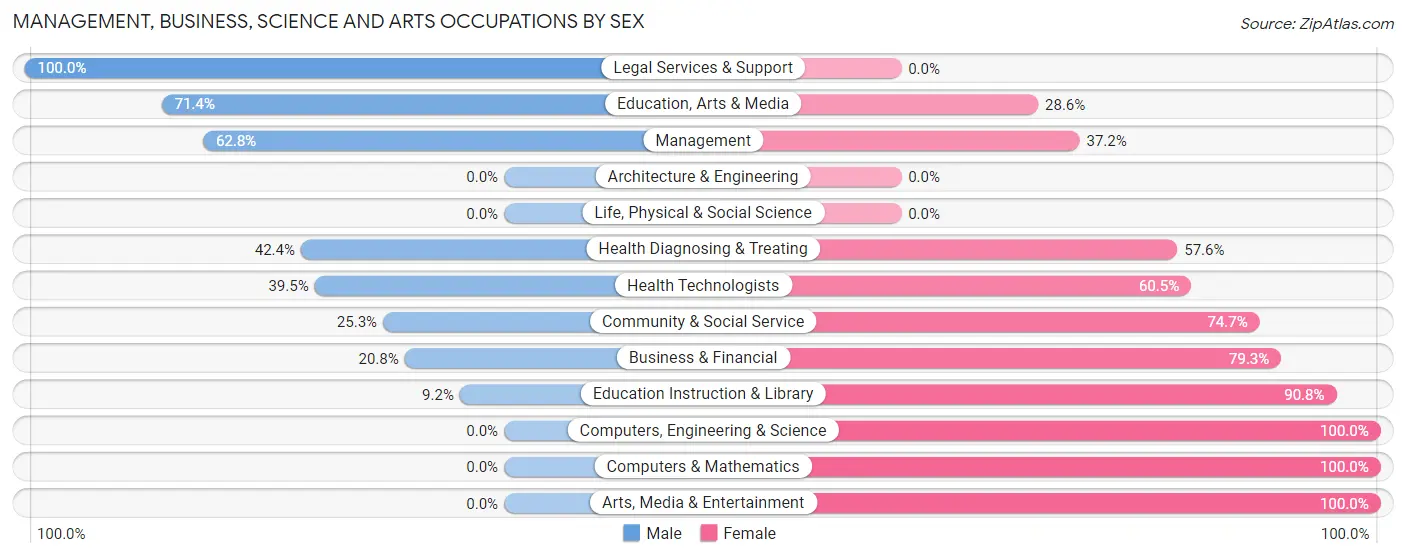
| Occupation | Male | Female |
| Management | 54 (62.8%) | 32 (37.2%) |
| Business & Financial | 11 (20.7%) | 42 (79.2%) |
| Computers, Engineering & Science | 0 (0.0%) | 25 (100.0%) |
| Computers & Mathematics | 0 (0.0%) | 25 (100.0%) |
| Architecture & Engineering | 0 (0.0%) | 0 (0.0%) |
| Life, Physical & Social Science | 0 (0.0%) | 0 (0.0%) |
| Community & Social Service | 49 (25.3%) | 145 (74.7%) |
| Education, Arts & Media | 15 (71.4%) | 6 (28.6%) |
| Legal Services & Support | 22 (100.0%) | 0 (0.0%) |
| Education Instruction & Library | 12 (9.2%) | 118 (90.8%) |
| Arts, Media & Entertainment | 0 (0.0%) | 21 (100.0%) |
| Health Diagnosing & Treating | 39 (42.4%) | 53 (57.6%) |
| Health Technologists | 34 (39.5%) | 52 (60.5%) |
| Total (Category) | 153 (34.0%) | 297 (66.0%) |
| Total (Overall) | 1,210 (57.3%) | 902 (42.7%) |
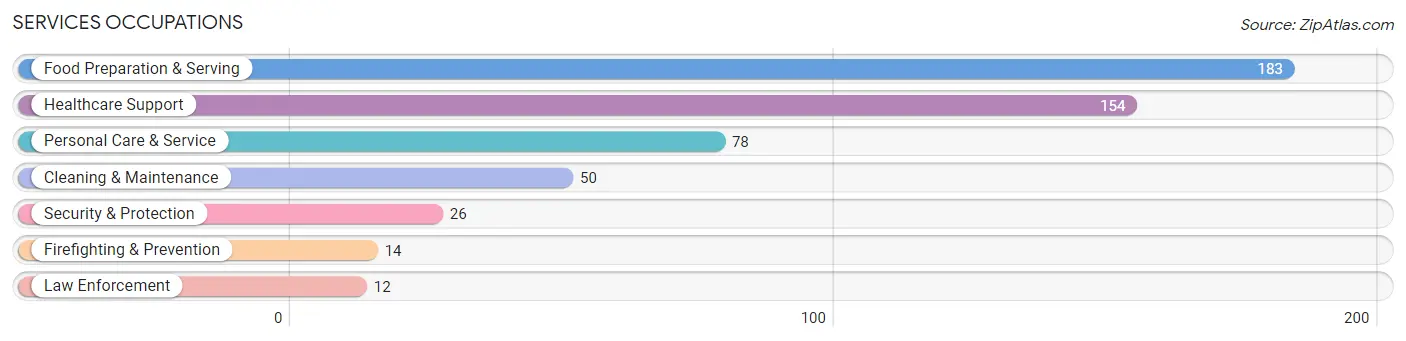
Services Occupations
The most common Services occupations in Fairfield are Food Preparation & Serving (183 | 8.7%), Healthcare Support (154 | 7.3%), Personal Care & Service (78 | 3.7%), Cleaning & Maintenance (50 | 2.4%), and Security & Protection (26 | 1.2%).
Services Occupations by Sex
Within the Services occupations in Fairfield, the most male-oriented occupations are Security & Protection (100.0%), Firefighting & Prevention (100.0%), and Law Enforcement (100.0%), while the most female-oriented occupations are Personal Care & Service (100.0%), Healthcare Support (87.7%), and Cleaning & Maintenance (64.0%).
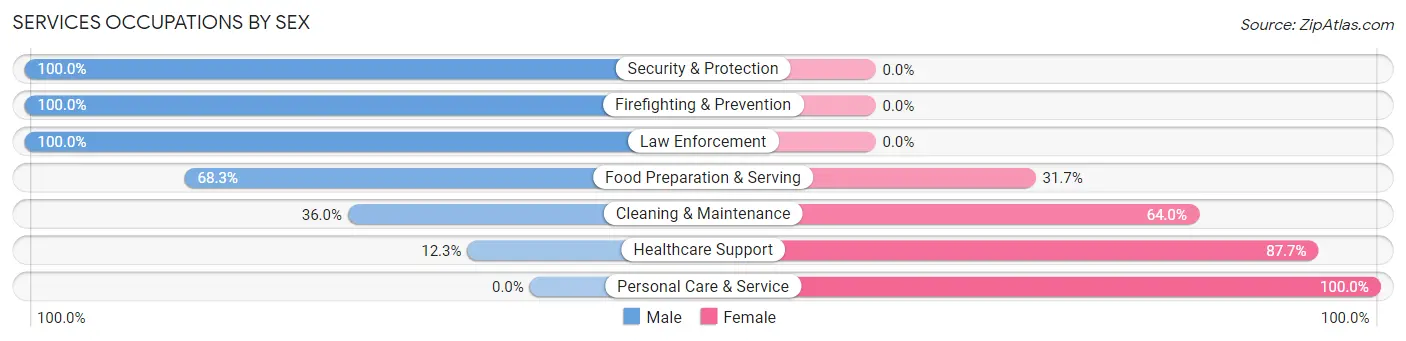
| Occupation | Male | Female |
| Healthcare Support | 19 (12.3%) | 135 (87.7%) |
| Security & Protection | 26 (100.0%) | 0 (0.0%) |
| Firefighting & Prevention | 14 (100.0%) | 0 (0.0%) |
| Law Enforcement | 12 (100.0%) | 0 (0.0%) |
| Food Preparation & Serving | 125 (68.3%) | 58 (31.7%) |
| Cleaning & Maintenance | 18 (36.0%) | 32 (64.0%) |
| Personal Care & Service | 0 (0.0%) | 78 (100.0%) |
| Total (Category) | 188 (38.3%) | 303 (61.7%) |
| Total (Overall) | 1,210 (57.3%) | 902 (42.7%) |
Sales and Office Occupations
The most common Sales and Office occupations in Fairfield are Office & Administration (307 | 14.5%), and Sales & Related (182 | 8.6%).
Sales and Office Occupations by Sex
| Occupation | Male | Female |
| Sales & Related | 150 (82.4%) | 32 (17.6%) |
| Office & Administration | 134 (43.6%) | 173 (56.4%) |
| Total (Category) | 284 (58.1%) | 205 (41.9%) |
| Total (Overall) | 1,210 (57.3%) | 902 (42.7%) |
Natural Resources, Construction and Maintenance Occupations
The most common Natural Resources, Construction and Maintenance occupations in Fairfield are Construction & Extraction (96 | 4.5%), Installation, Maintenance & Repair (79 | 3.7%), and Farming, Fishing & Forestry (59 | 2.8%).
Natural Resources, Construction and Maintenance Occupations by Sex
| Occupation | Male | Female |
| Farming, Fishing & Forestry | 24 (40.7%) | 35 (59.3%) |
| Construction & Extraction | 96 (100.0%) | 0 (0.0%) |
| Installation, Maintenance & Repair | 79 (100.0%) | 0 (0.0%) |
| Total (Category) | 199 (85.0%) | 35 (15.0%) |
| Total (Overall) | 1,210 (57.3%) | 902 (42.7%) |
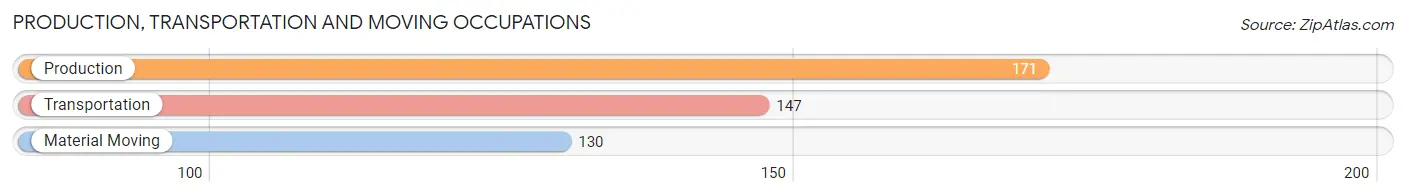
Production, Transportation and Moving Occupations
The most common Production, Transportation and Moving occupations in Fairfield are Production (171 | 8.1%), Transportation (147 | 7.0%), and Material Moving (130 | 6.2%).
Production, Transportation and Moving Occupations by Sex
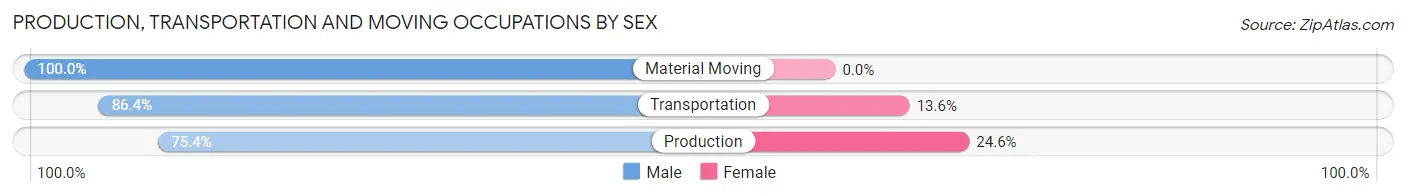
| Occupation | Male | Female |
| Production | 129 (75.4%) | 42 (24.6%) |
| Transportation | 127 (86.4%) | 20 (13.6%) |
| Material Moving | 130 (100.0%) | 0 (0.0%) |
| Total (Category) | 386 (86.2%) | 62 (13.8%) |
| Total (Overall) | 1,210 (57.3%) | 902 (42.7%) |
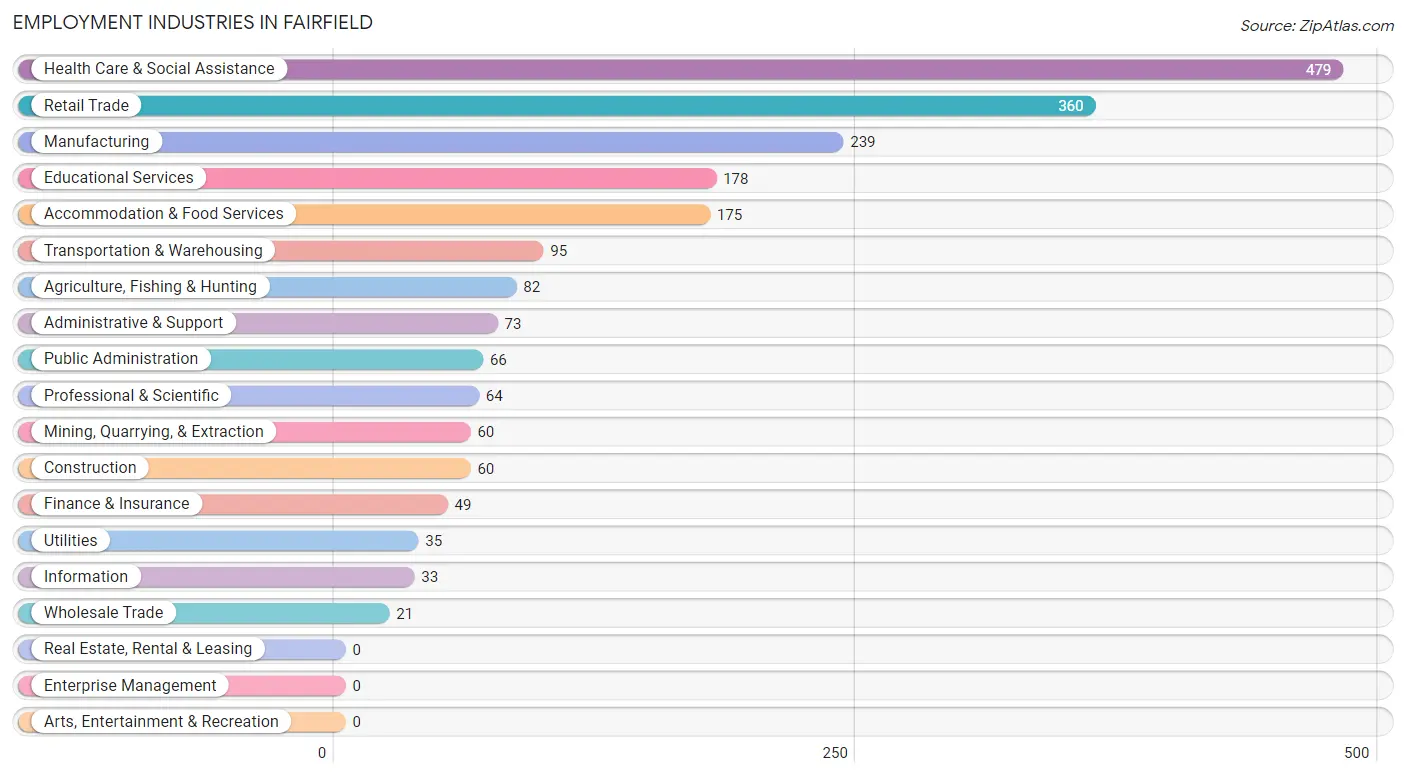
Employment Industries by Sex in Fairfield
Employment Industries in Fairfield
The major employment industries in Fairfield include Health Care & Social Assistance (479 | 22.7%), Retail Trade (360 | 17.1%), Manufacturing (239 | 11.3%), Educational Services (178 | 8.4%), and Accommodation & Food Services (175 | 8.3%).
Employment Industries by Sex in Fairfield
The Fairfield industries that see more men than women are Mining, Quarrying, & Extraction (100.0%), Wholesale Trade (100.0%), and Retail Trade (88.6%), whereas the industries that tend to have a higher number of women are Educational Services (82.6%), Health Care & Social Assistance (73.9%), and Professional & Scientific (64.1%).
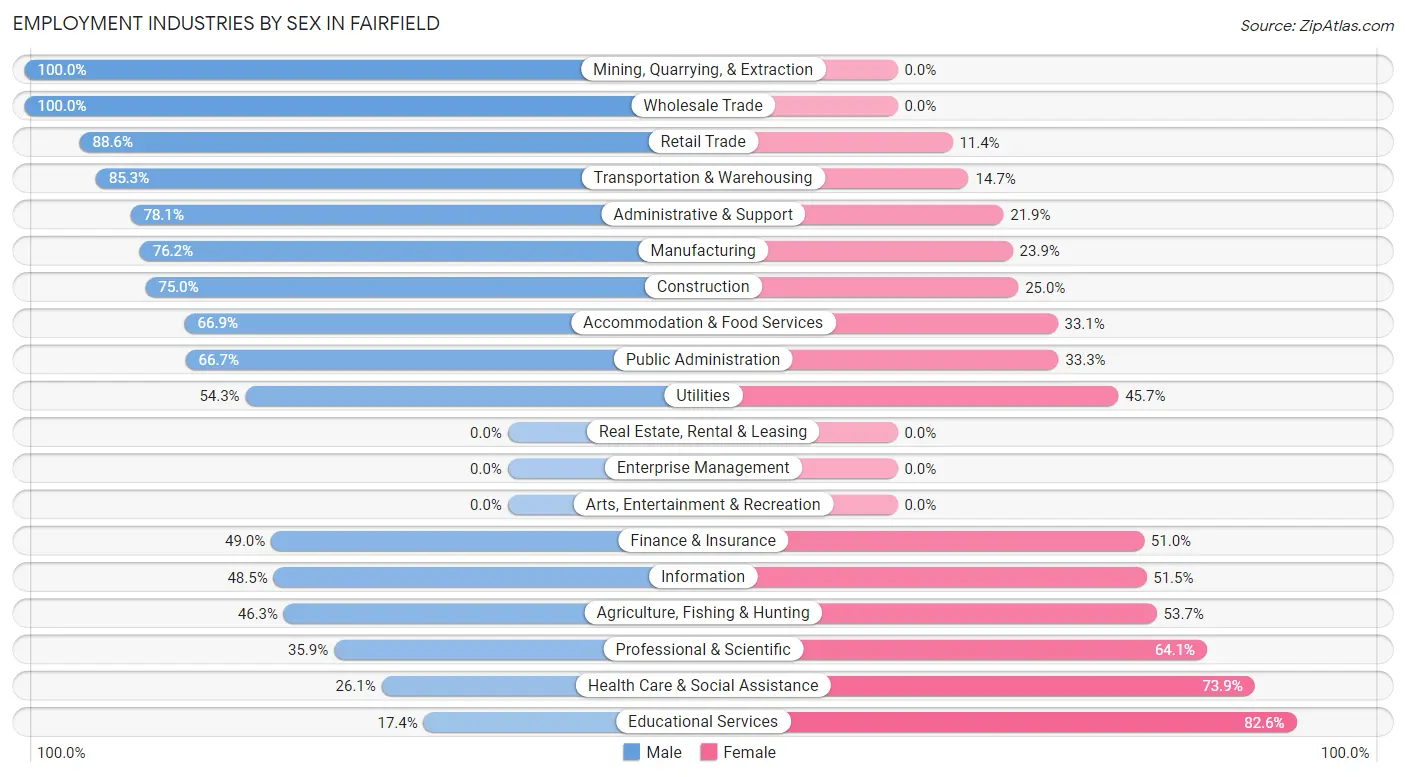
| Industry | Male | Female |
| Agriculture, Fishing & Hunting | 38 (46.3%) | 44 (53.7%) |
| Mining, Quarrying, & Extraction | 60 (100.0%) | 0 (0.0%) |
| Construction | 45 (75.0%) | 15 (25.0%) |
| Manufacturing | 182 (76.1%) | 57 (23.8%) |
| Wholesale Trade | 21 (100.0%) | 0 (0.0%) |
| Retail Trade | 319 (88.6%) | 41 (11.4%) |
| Transportation & Warehousing | 81 (85.3%) | 14 (14.7%) |
| Utilities | 19 (54.3%) | 16 (45.7%) |
| Information | 16 (48.5%) | 17 (51.5%) |
| Finance & Insurance | 24 (49.0%) | 25 (51.0%) |
| Real Estate, Rental & Leasing | 0 (0.0%) | 0 (0.0%) |
| Professional & Scientific | 23 (35.9%) | 41 (64.1%) |
| Enterprise Management | 0 (0.0%) | 0 (0.0%) |
| Administrative & Support | 57 (78.1%) | 16 (21.9%) |
| Educational Services | 31 (17.4%) | 147 (82.6%) |
| Health Care & Social Assistance | 125 (26.1%) | 354 (73.9%) |
| Arts, Entertainment & Recreation | 0 (0.0%) | 0 (0.0%) |
| Accommodation & Food Services | 117 (66.9%) | 58 (33.1%) |
| Public Administration | 44 (66.7%) | 22 (33.3%) |
| Total | 1,210 (57.3%) | 902 (42.7%) |
Education in Fairfield
School Enrollment in Fairfield
The most common levels of schooling among the 1,009 students in Fairfield are college / undergraduate (269 | 26.7%), elementary school (197 | 19.5%), and high school (196 | 19.4%).
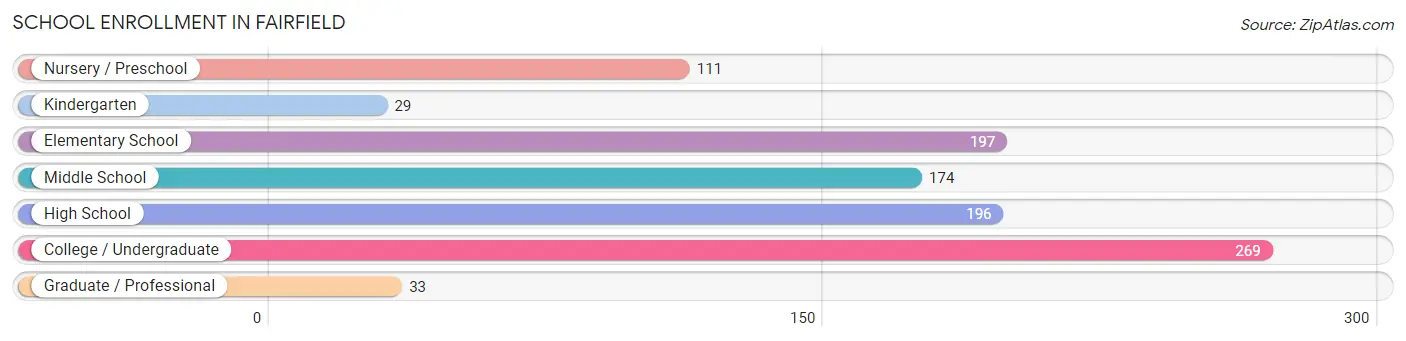
| School Level | # Students | % Students |
| Nursery / Preschool | 111 | 11.0% |
| Kindergarten | 29 | 2.9% |
| Elementary School | 197 | 19.5% |
| Middle School | 174 | 17.2% |
| High School | 196 | 19.4% |
| College / Undergraduate | 269 | 26.7% |
| Graduate / Professional | 33 | 3.3% |
| Total | 1,009 | 100.0% |
School Enrollment by Age by Funding Source in Fairfield
Out of a total of 1,009 students who are enrolled in schools in Fairfield, 125 (12.4%) attend a private institution, while the remaining 884 (87.6%) are enrolled in public schools. The age group of 35 years and over has the highest likelihood of being enrolled in private schools, with 14 (37.8% in the age bracket) enrolled. Conversely, the age group of 3 to 4 year olds has the lowest likelihood of being enrolled in a private school, with 92 (100.0% in the age bracket) attending a public institution.
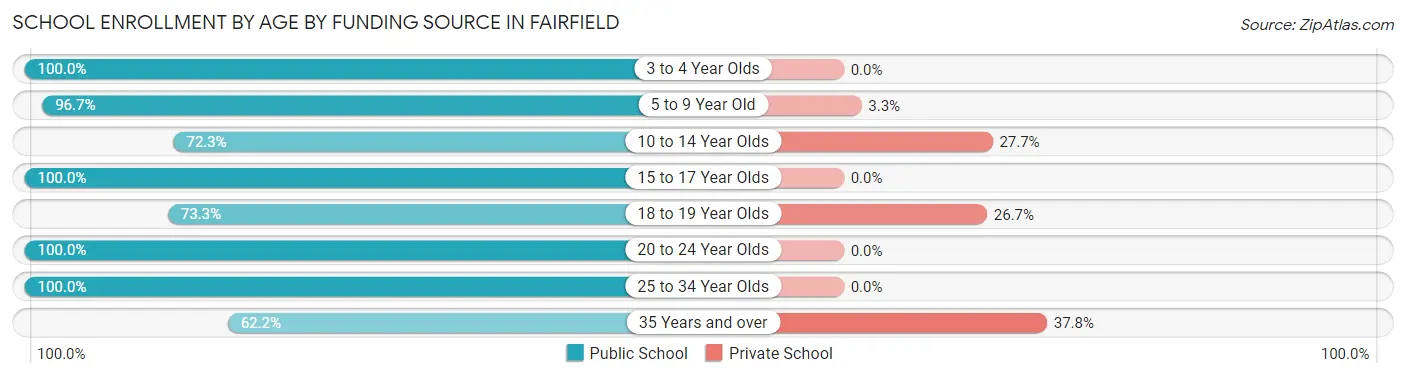
| Age Bracket | Public School | Private School |
| 3 to 4 Year Olds | 92 (100.0%) | 0 (0.0%) |
| 5 to 9 Year Old | 206 (96.7%) | 7 (3.3%) |
| 10 to 14 Year Olds | 167 (72.3%) | 64 (27.7%) |
| 15 to 17 Year Olds | 115 (100.0%) | 0 (0.0%) |
| 18 to 19 Year Olds | 110 (73.3%) | 40 (26.7%) |
| 20 to 24 Year Olds | 107 (100.0%) | 0 (0.0%) |
| 25 to 34 Year Olds | 64 (100.0%) | 0 (0.0%) |
| 35 Years and over | 23 (62.2%) | 14 (37.8%) |
| Total | 884 (87.6%) | 125 (12.4%) |
Educational Attainment by Field of Study in Fairfield
Education (133 | 22.6%), science & technology (79 | 13.4%), business (79 | 13.4%), liberal arts & history (74 | 12.6%), and arts & humanities (54 | 9.2%) are the most common fields of study among 589 individuals in Fairfield who have obtained a bachelor's degree or higher.
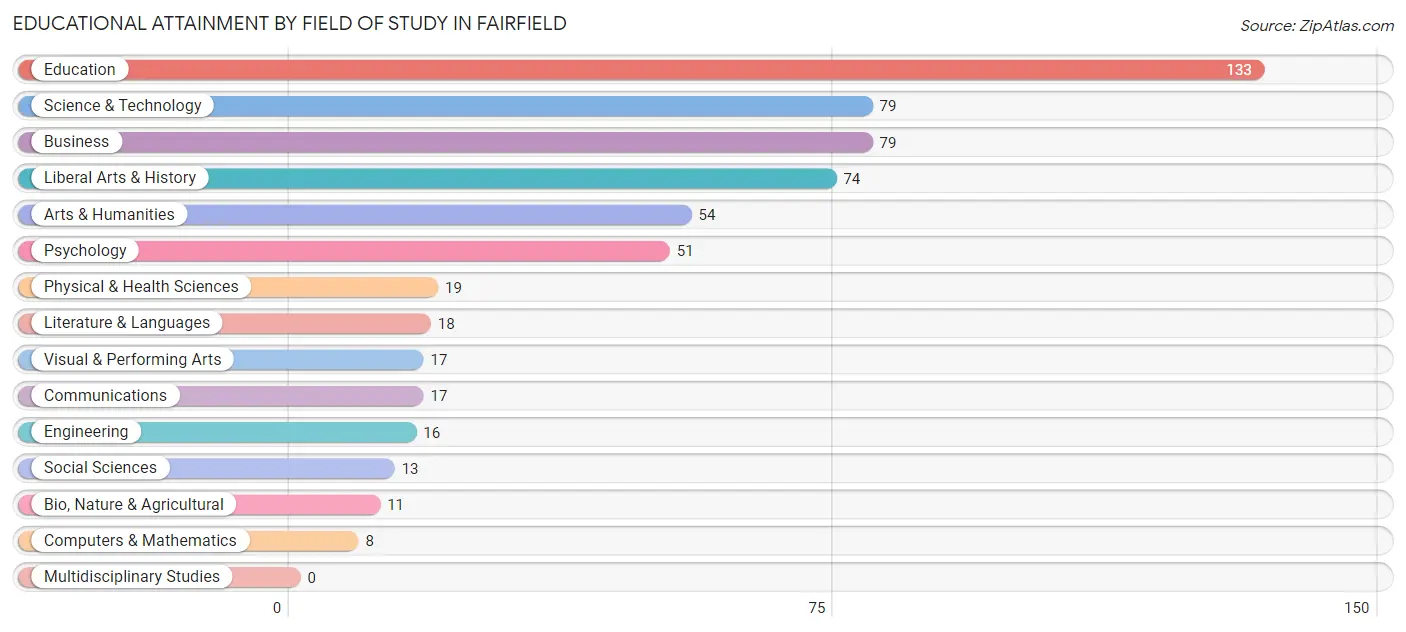
| Field of Study | # Graduates | % Graduates |
| Computers & Mathematics | 8 | 1.4% |
| Bio, Nature & Agricultural | 11 | 1.9% |
| Physical & Health Sciences | 19 | 3.2% |
| Psychology | 51 | 8.7% |
| Social Sciences | 13 | 2.2% |
| Engineering | 16 | 2.7% |
| Multidisciplinary Studies | 0 | 0.0% |
| Science & Technology | 79 | 13.4% |
| Business | 79 | 13.4% |
| Education | 133 | 22.6% |
| Literature & Languages | 18 | 3.1% |
| Liberal Arts & History | 74 | 12.6% |
| Visual & Performing Arts | 17 | 2.9% |
| Communications | 17 | 2.9% |
| Arts & Humanities | 54 | 9.2% |
| Total | 589 | 100.0% |
Transportation & Commute in Fairfield
Vehicle Availability by Sex in Fairfield
The most prevalent vehicle ownership categories in Fairfield are males with 2 vehicles (693, accounting for 57.3%) and females with 2 vehicles (497, making up 78.9%).
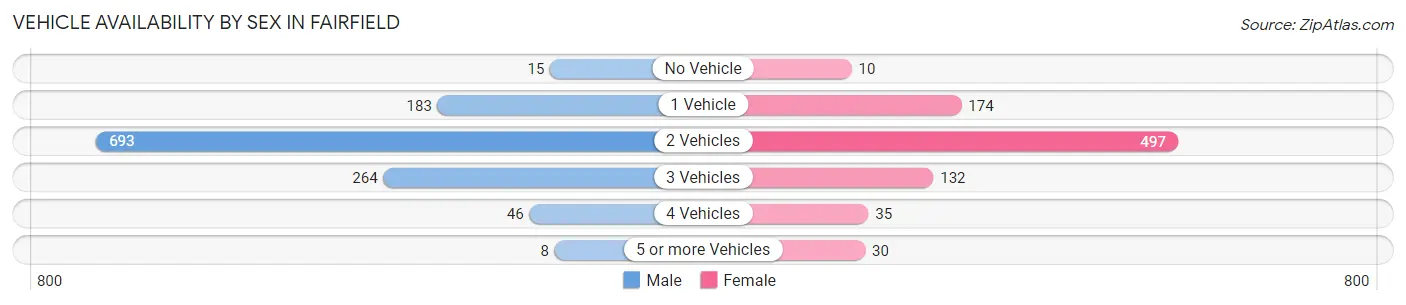
| Vehicles Available | Male | Female |
| No Vehicle | 15 (1.2%) | 10 (1.1%) |
| 1 Vehicle | 183 (15.1%) | 174 (19.8%) |
| 2 Vehicles | 693 (57.3%) | 497 (56.6%) |
| 3 Vehicles | 264 (21.8%) | 132 (15.0%) |
| 4 Vehicles | 46 (3.8%) | 35 (4.0%) |
| 5 or more Vehicles | 8 (0.7%) | 30 (3.4%) |
| Total | 1,209 (100.0%) | 878 (100.0%) |
Commute Time in Fairfield
The most frequently occuring commute durations in Fairfield are 5 to 9 minutes (691 commuters, 33.7%), less than 5 minutes (384 commuters, 18.7%), and 45 to 59 minutes (283 commuters, 13.8%).
| Commute Time | # Commuters | % Commuters |
| Less than 5 Minutes | 384 | 18.7% |
| 5 to 9 Minutes | 691 | 33.7% |
| 10 to 14 Minutes | 174 | 8.5% |
| 15 to 19 Minutes | 42 | 2.1% |
| 20 to 24 Minutes | 146 | 7.1% |
| 25 to 29 Minutes | 52 | 2.5% |
| 30 to 34 Minutes | 87 | 4.2% |
| 35 to 39 Minutes | 58 | 2.8% |
| 40 to 44 Minutes | 61 | 3.0% |
| 45 to 59 Minutes | 283 | 13.8% |
| 60 to 89 Minutes | 75 | 3.6% |
| 90 or more Minutes | 0 | 0.0% |
Commute Time by Sex in Fairfield
The most common commute times in Fairfield are 5 to 9 minutes (354 commuters, 29.3%) for males and 5 to 9 minutes (337 commuters, 39.8%) for females.
| Commute Time | Male | Female |
| Less than 5 Minutes | 224 (18.6%) | 160 (18.9%) |
| 5 to 9 Minutes | 354 (29.3%) | 337 (39.8%) |
| 10 to 14 Minutes | 113 (9.4%) | 61 (7.2%) |
| 15 to 19 Minutes | 19 (1.6%) | 23 (2.7%) |
| 20 to 24 Minutes | 87 (7.2%) | 59 (7.0%) |
| 25 to 29 Minutes | 27 (2.2%) | 25 (2.9%) |
| 30 to 34 Minutes | 43 (3.6%) | 44 (5.2%) |
| 35 to 39 Minutes | 48 (4.0%) | 10 (1.2%) |
| 40 to 44 Minutes | 27 (2.2%) | 34 (4.0%) |
| 45 to 59 Minutes | 210 (17.4%) | 73 (8.6%) |
| 60 to 89 Minutes | 54 (4.5%) | 21 (2.5%) |
| 90 or more Minutes | 0 (0.0%) | 0 (0.0%) |
Time of Departure to Work by Sex in Fairfield
The most frequent times of departure to work in Fairfield are 7:30 AM to 7:59 AM (263, 21.8%) for males and 8:00 AM to 8:29 AM (147, 17.4%) for females.
| Time of Departure | Male | Female |
| 12:00 AM to 4:59 AM | 32 (2.6%) | 0 (0.0%) |
| 5:00 AM to 5:29 AM | 42 (3.5%) | 26 (3.1%) |
| 5:30 AM to 5:59 AM | 38 (3.2%) | 62 (7.3%) |
| 6:00 AM to 6:29 AM | 86 (7.1%) | 46 (5.4%) |
| 6:30 AM to 6:59 AM | 166 (13.8%) | 140 (16.5%) |
| 7:00 AM to 7:29 AM | 56 (4.6%) | 44 (5.2%) |
| 7:30 AM to 7:59 AM | 263 (21.8%) | 88 (10.4%) |
| 8:00 AM to 8:29 AM | 30 (2.5%) | 147 (17.4%) |
| 8:30 AM to 8:59 AM | 28 (2.3%) | 17 (2.0%) |
| 9:00 AM to 9:59 AM | 57 (4.7%) | 60 (7.1%) |
| 10:00 AM to 10:59 AM | 31 (2.6%) | 28 (3.3%) |
| 11:00 AM to 11:59 AM | 0 (0.0%) | 0 (0.0%) |
| 12:00 PM to 3:59 PM | 207 (17.2%) | 103 (12.2%) |
| 4:00 PM to 11:59 PM | 170 (14.1%) | 86 (10.2%) |
| Total | 1,206 (100.0%) | 847 (100.0%) |
Housing Occupancy in Fairfield
Occupancy by Ownership in Fairfield
Of the total 2,319 dwellings in Fairfield, owner-occupied units account for 1,549 (66.8%), while renter-occupied units make up 770 (33.2%).
| Occupancy | # Housing Units | % Housing Units |
| Owner Occupied Housing Units | 1,549 | 66.8% |
| Renter-Occupied Housing Units | 770 | 33.2% |
| Total Occupied Housing Units | 2,319 | 100.0% |
Occupancy by Household Size in Fairfield
| Household Size | # Housing Units | % Housing Units |
| 1-Person Household | 958 | 41.3% |
| 2-Person Household | 651 | 28.1% |
| 3-Person Household | 295 | 12.7% |
| 4+ Person Household | 415 | 17.9% |
| Total Housing Units | 2,319 | 100.0% |
Occupancy by Ownership by Household Size in Fairfield
| Household Size | Owner-occupied | Renter-occupied |
| 1-Person Household | 528 (55.1%) | 430 (44.9%) |
| 2-Person Household | 522 (80.2%) | 129 (19.8%) |
| 3-Person Household | 196 (66.4%) | 99 (33.6%) |
| 4+ Person Household | 303 (73.0%) | 112 (27.0%) |
| Total Housing Units | 1,549 (66.8%) | 770 (33.2%) |
Occupancy by Educational Attainment in Fairfield
| Household Size | Owner-occupied | Renter-occupied |
| Less than High School | 123 (67.6%) | 59 (32.4%) |
| High School Diploma | 469 (58.0%) | 339 (42.0%) |
| College/Associate Degree | 625 (66.3%) | 317 (33.7%) |
| Bachelor's Degree or higher | 332 (85.8%) | 55 (14.2%) |
Occupancy by Age of Householder in Fairfield
| Age Bracket | # Households | % Households |
| Under 35 Years | 451 | 19.5% |
| 35 to 44 Years | 297 | 12.8% |
| 45 to 54 Years | 362 | 15.6% |
| 55 to 64 Years | 391 | 16.9% |
| 65 to 74 Years | 364 | 15.7% |
| 75 to 84 Years | 250 | 10.8% |
| 85 Years and Over | 204 | 8.8% |
| Total | 2,319 | 100.0% |
Housing Finances in Fairfield
Median Income by Occupancy in Fairfield
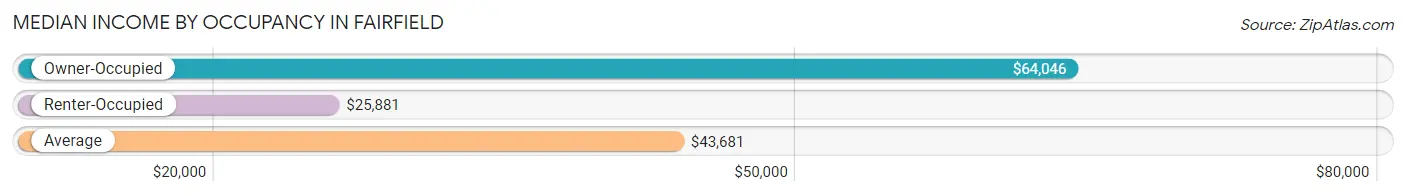
| Occupancy Type | # Households | Median Income |
| Owner-Occupied | 1,549 (66.8%) | $64,046 |
| Renter-Occupied | 770 (33.2%) | $25,881 |
| Average | 2,319 (100.0%) | $43,681 |
Occupancy by Householder Income Bracket in Fairfield
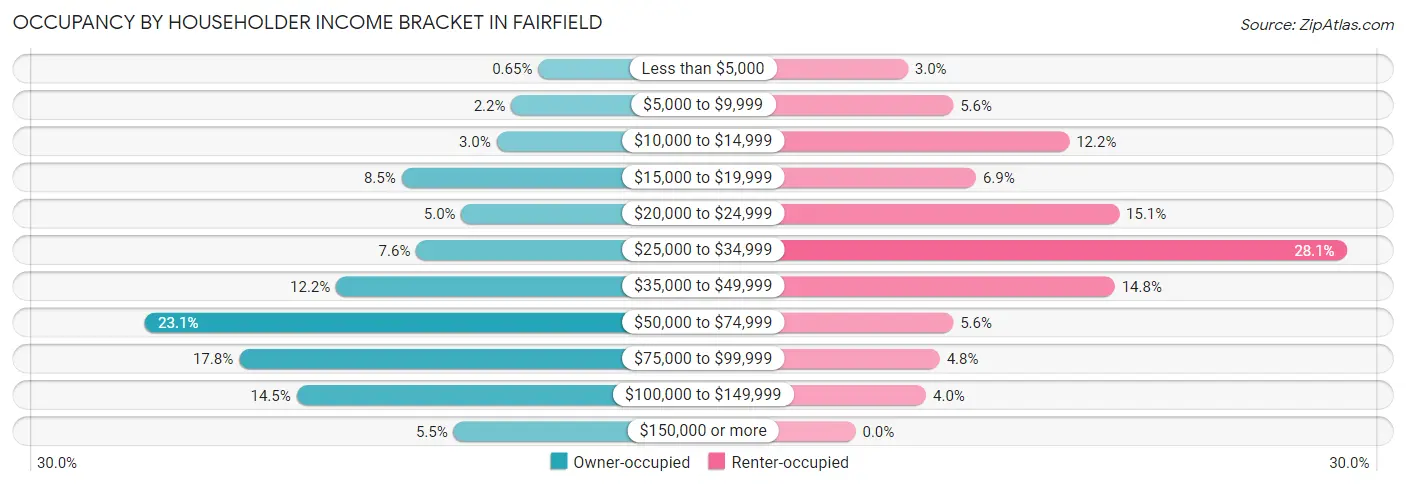
| Income Bracket | Owner-occupied | Renter-occupied |
| Less than $5,000 | 10 (0.6%) | 23 (3.0%) |
| $5,000 to $9,999 | 34 (2.2%) | 43 (5.6%) |
| $10,000 to $14,999 | 47 (3.0%) | 94 (12.2%) |
| $15,000 to $19,999 | 131 (8.5%) | 53 (6.9%) |
| $20,000 to $24,999 | 78 (5.0%) | 116 (15.1%) |
| $25,000 to $34,999 | 118 (7.6%) | 216 (28.1%) |
| $35,000 to $49,999 | 189 (12.2%) | 114 (14.8%) |
| $50,000 to $74,999 | 358 (23.1%) | 43 (5.6%) |
| $75,000 to $99,999 | 275 (17.7%) | 37 (4.8%) |
| $100,000 to $149,999 | 224 (14.5%) | 31 (4.0%) |
| $150,000 or more | 85 (5.5%) | 0 (0.0%) |
| Total | 1,549 (100.0%) | 770 (100.0%) |
Monthly Housing Cost Tiers in Fairfield
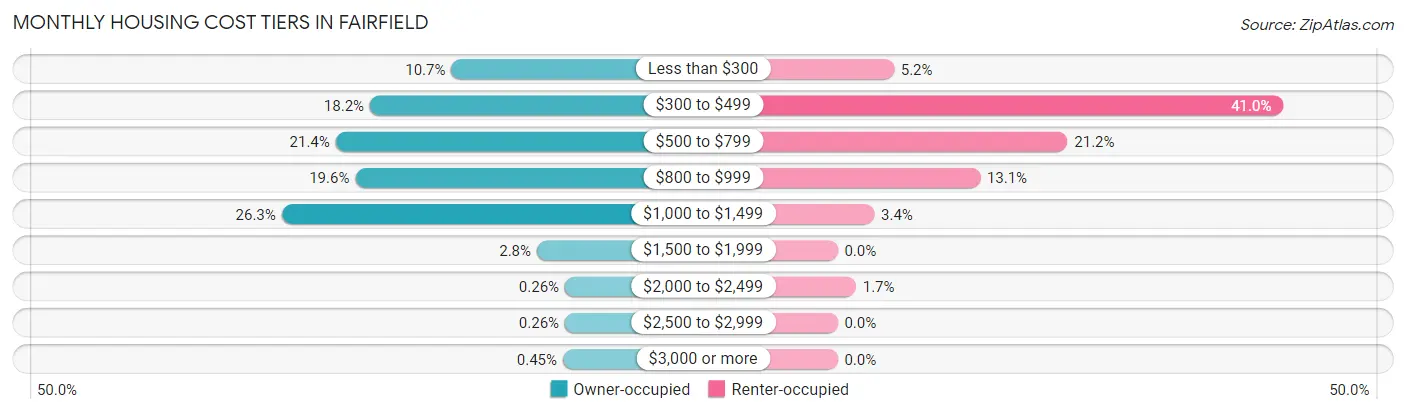
| Monthly Cost | Owner-occupied | Renter-occupied |
| Less than $300 | 166 (10.7%) | 40 (5.2%) |
| $300 to $499 | 282 (18.2%) | 316 (41.0%) |
| $500 to $799 | 331 (21.4%) | 163 (21.2%) |
| $800 to $999 | 303 (19.6%) | 101 (13.1%) |
| $1,000 to $1,499 | 408 (26.3%) | 26 (3.4%) |
| $1,500 to $1,999 | 44 (2.8%) | 0 (0.0%) |
| $2,000 to $2,499 | 4 (0.3%) | 13 (1.7%) |
| $2,500 to $2,999 | 4 (0.3%) | 0 (0.0%) |
| $3,000 or more | 7 (0.4%) | 0 (0.0%) |
| Total | 1,549 (100.0%) | 770 (100.0%) |
Physical Housing Characteristics in Fairfield
Housing Structures in Fairfield
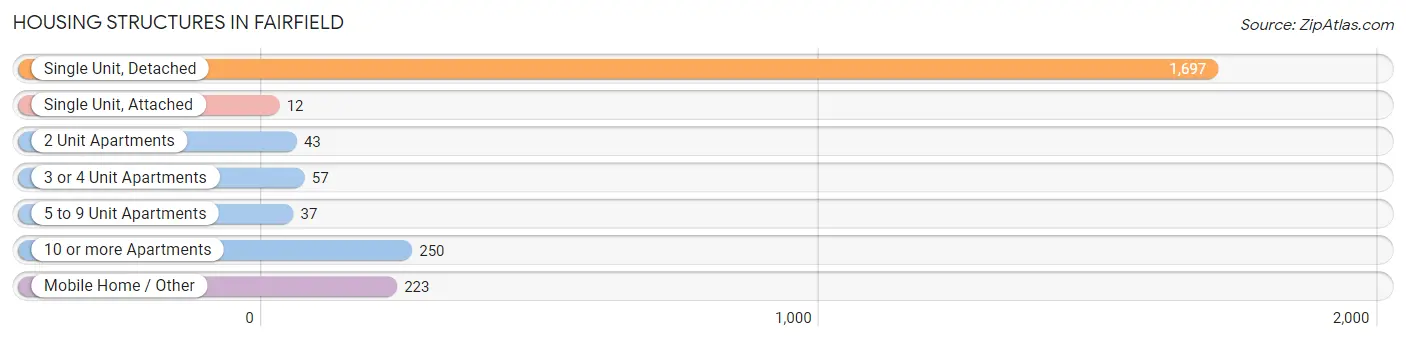
| Structure Type | # Housing Units | % Housing Units |
| Single Unit, Detached | 1,697 | 73.2% |
| Single Unit, Attached | 12 | 0.5% |
| 2 Unit Apartments | 43 | 1.8% |
| 3 or 4 Unit Apartments | 57 | 2.5% |
| 5 to 9 Unit Apartments | 37 | 1.6% |
| 10 or more Apartments | 250 | 10.8% |
| Mobile Home / Other | 223 | 9.6% |
| Total | 2,319 | 100.0% |
Housing Structures by Occupancy in Fairfield
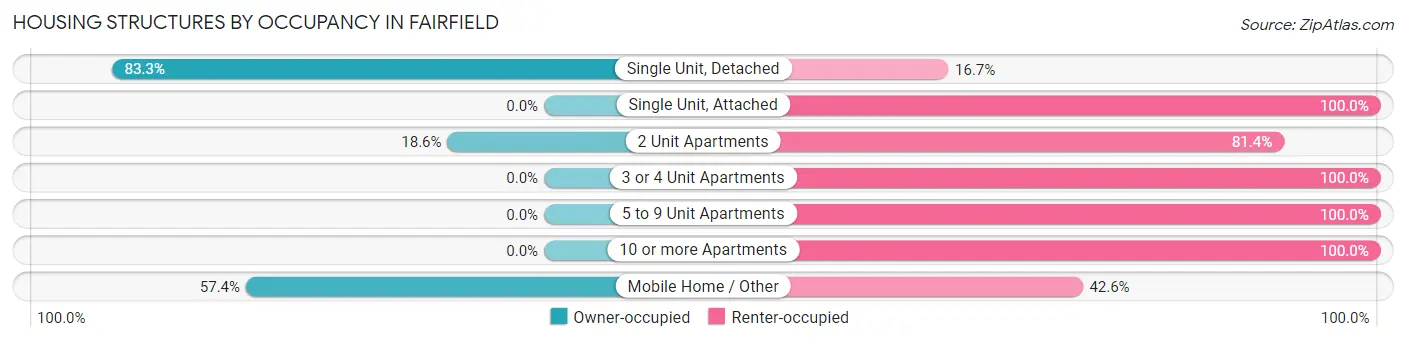
| Structure Type | Owner-occupied | Renter-occupied |
| Single Unit, Detached | 1,413 (83.3%) | 284 (16.7%) |
| Single Unit, Attached | 0 (0.0%) | 12 (100.0%) |
| 2 Unit Apartments | 8 (18.6%) | 35 (81.4%) |
| 3 or 4 Unit Apartments | 0 (0.0%) | 57 (100.0%) |
| 5 to 9 Unit Apartments | 0 (0.0%) | 37 (100.0%) |
| 10 or more Apartments | 0 (0.0%) | 250 (100.0%) |
| Mobile Home / Other | 128 (57.4%) | 95 (42.6%) |
| Total | 1,549 (66.8%) | 770 (33.2%) |
Housing Structures by Number of Rooms in Fairfield
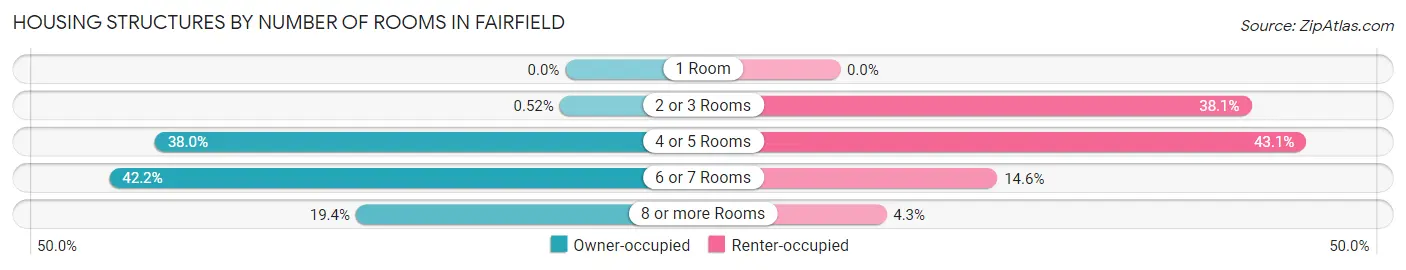
| Number of Rooms | Owner-occupied | Renter-occupied |
| 1 Room | 0 (0.0%) | 0 (0.0%) |
| 2 or 3 Rooms | 8 (0.5%) | 293 (38.1%) |
| 4 or 5 Rooms | 588 (38.0%) | 332 (43.1%) |
| 6 or 7 Rooms | 653 (42.2%) | 112 (14.5%) |
| 8 or more Rooms | 300 (19.4%) | 33 (4.3%) |
| Total | 1,549 (100.0%) | 770 (100.0%) |
Housing Structure by Heating Type in Fairfield
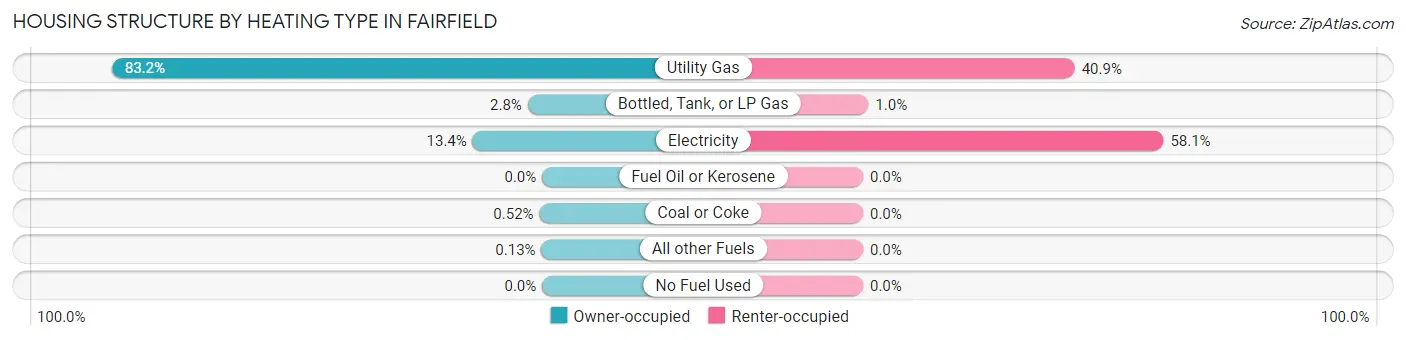
| Heating Type | Owner-occupied | Renter-occupied |
| Utility Gas | 1,288 (83.2%) | 315 (40.9%) |
| Bottled, Tank, or LP Gas | 43 (2.8%) | 8 (1.0%) |
| Electricity | 208 (13.4%) | 447 (58.1%) |
| Fuel Oil or Kerosene | 0 (0.0%) | 0 (0.0%) |
| Coal or Coke | 8 (0.5%) | 0 (0.0%) |
| All other Fuels | 2 (0.1%) | 0 (0.0%) |
| No Fuel Used | 0 (0.0%) | 0 (0.0%) |
| Total | 1,549 (100.0%) | 770 (100.0%) |
Household Vehicle Usage in Fairfield
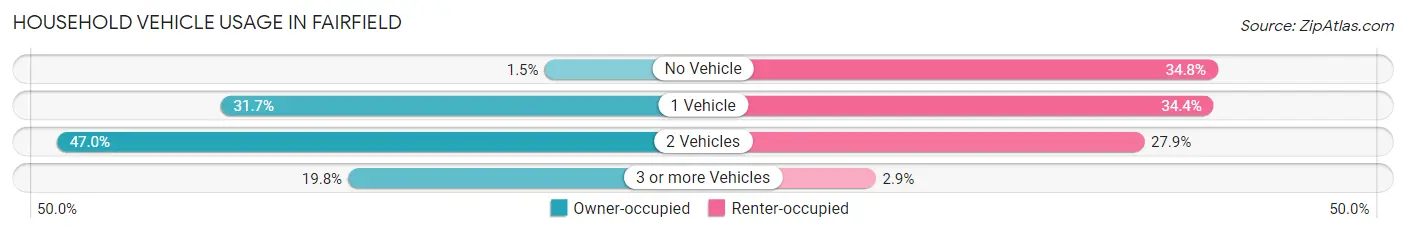
| Vehicles per Household | Owner-occupied | Renter-occupied |
| No Vehicle | 23 (1.5%) | 268 (34.8%) |
| 1 Vehicle | 491 (31.7%) | 265 (34.4%) |
| 2 Vehicles | 728 (47.0%) | 215 (27.9%) |
| 3 or more Vehicles | 307 (19.8%) | 22 (2.9%) |
| Total | 1,549 (100.0%) | 770 (100.0%) |
Real Estate & Mortgages in Fairfield
Real Estate and Mortgage Overview in Fairfield
| Characteristic | Without Mortgage | With Mortgage |
| Housing Units | 732 | 817 |
| Median Property Value | $76,500 | $94,400 |
| Median Household Income | $42,439 | $51 |
| Monthly Housing Costs | $463 | $7 |
| Real Estate Taxes | $1,519 | $41 |
Property Value by Mortgage Status in Fairfield
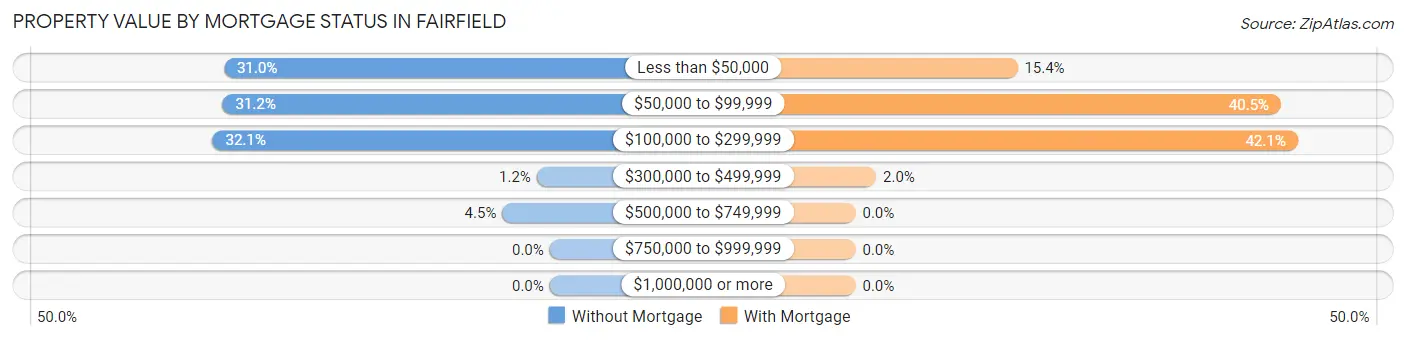
| Property Value | Without Mortgage | With Mortgage |
| Less than $50,000 | 227 (31.0%) | 126 (15.4%) |
| $50,000 to $99,999 | 228 (31.1%) | 331 (40.5%) |
| $100,000 to $299,999 | 235 (32.1%) | 344 (42.1%) |
| $300,000 to $499,999 | 9 (1.2%) | 16 (2.0%) |
| $500,000 to $749,999 | 33 (4.5%) | 0 (0.0%) |
| $750,000 to $999,999 | 0 (0.0%) | 0 (0.0%) |
| $1,000,000 or more | 0 (0.0%) | 0 (0.0%) |
| Total | 732 (100.0%) | 817 (100.0%) |
Household Income by Mortgage Status in Fairfield
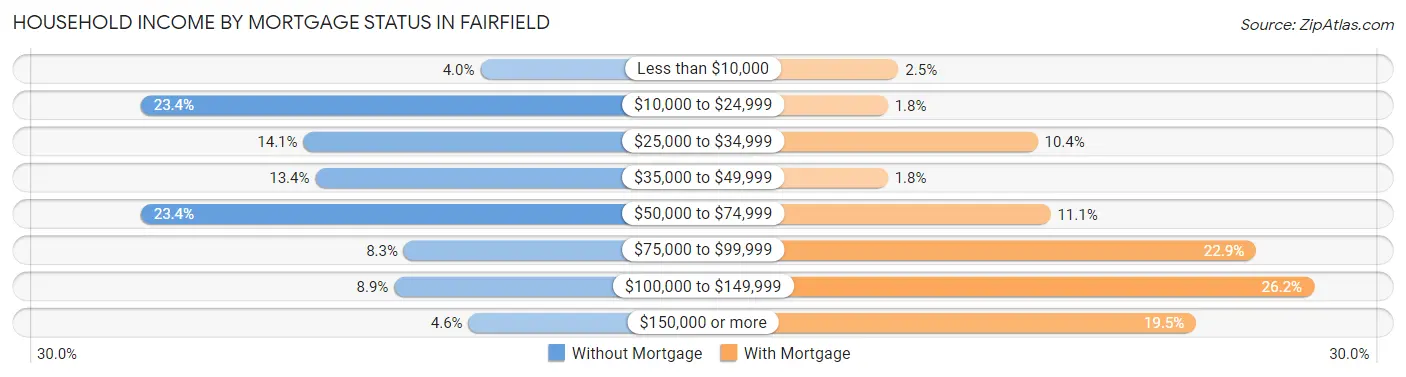
| Household Income | Without Mortgage | With Mortgage |
| Less than $10,000 | 29 (4.0%) | 20 (2.5%) |
| $10,000 to $24,999 | 171 (23.4%) | 15 (1.8%) |
| $25,000 to $34,999 | 103 (14.1%) | 85 (10.4%) |
| $35,000 to $49,999 | 98 (13.4%) | 15 (1.8%) |
| $50,000 to $74,999 | 171 (23.4%) | 91 (11.1%) |
| $75,000 to $99,999 | 61 (8.3%) | 187 (22.9%) |
| $100,000 to $149,999 | 65 (8.9%) | 214 (26.2%) |
| $150,000 or more | 34 (4.6%) | 159 (19.5%) |
| Total | 732 (100.0%) | 817 (100.0%) |
Property Value to Household Income Ratio in Fairfield
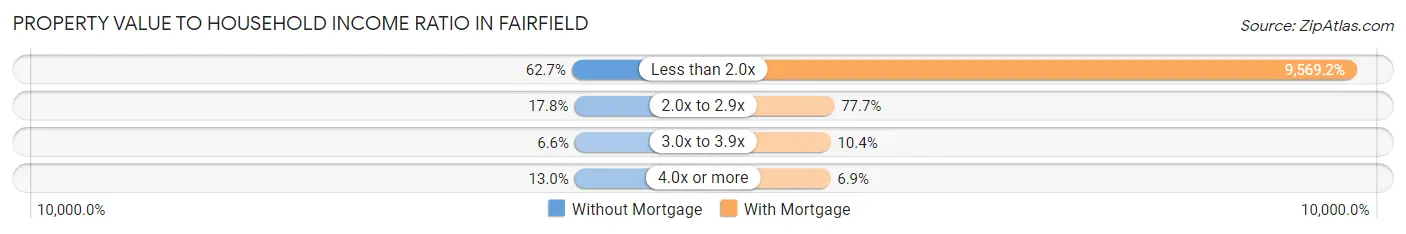
| Value-to-Income Ratio | Without Mortgage | With Mortgage |
| Less than 2.0x | 459 (62.7%) | 78,180 (9,569.2%) |
| 2.0x to 2.9x | 130 (17.8%) | 635 (77.7%) |
| 3.0x to 3.9x | 48 (6.6%) | 85 (10.4%) |
| 4.0x or more | 95 (13.0%) | 56 (6.9%) |
| Total | 732 (100.0%) | 817 (100.0%) |
Real Estate Taxes by Mortgage Status in Fairfield
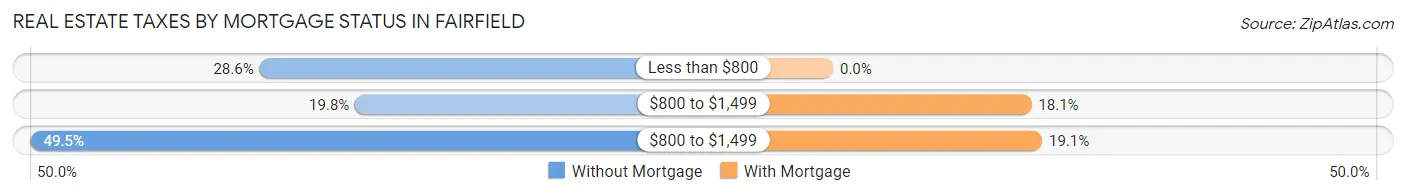
| Property Taxes | Without Mortgage | With Mortgage |
| Less than $800 | 209 (28.5%) | 0 (0.0%) |
| $800 to $1,499 | 145 (19.8%) | 148 (18.1%) |
| $800 to $1,499 | 362 (49.4%) | 156 (19.1%) |
| Total | 732 (100.0%) | 817 (100.0%) |
Health & Disability in Fairfield
Health Insurance Coverage by Age in Fairfield
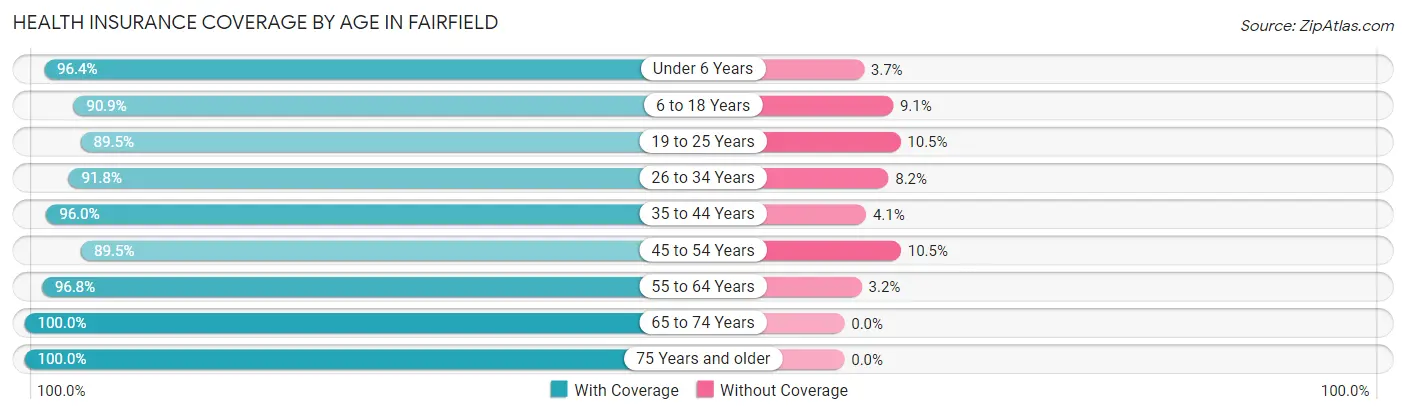
| Age Bracket | With Coverage | Without Coverage |
| Under 6 Years | 343 (96.4%) | 13 (3.6%) |
| 6 to 18 Years | 621 (90.9%) | 62 (9.1%) |
| 19 to 25 Years | 368 (89.5%) | 43 (10.5%) |
| 26 to 34 Years | 470 (91.8%) | 42 (8.2%) |
| 35 to 44 Years | 474 (96.0%) | 20 (4.1%) |
| 45 to 54 Years | 510 (89.5%) | 60 (10.5%) |
| 55 to 64 Years | 632 (96.8%) | 21 (3.2%) |
| 65 to 74 Years | 472 (100.0%) | 0 (0.0%) |
| 75 Years and older | 578 (100.0%) | 0 (0.0%) |
| Total | 4,468 (94.5%) | 261 (5.5%) |
Health Insurance Coverage by Citizenship Status in Fairfield
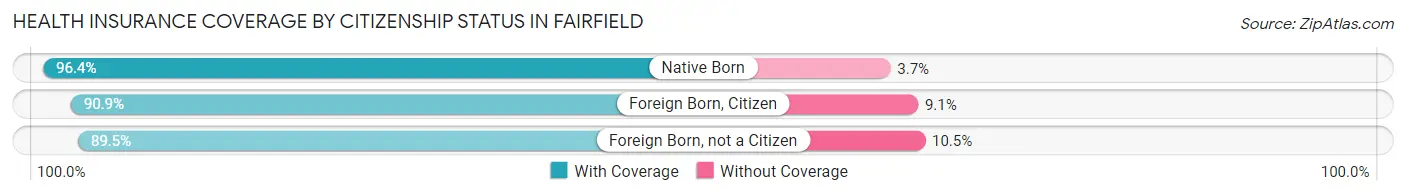
| Citizenship Status | With Coverage | Without Coverage |
| Native Born | 343 (96.4%) | 13 (3.6%) |
| Foreign Born, Citizen | 621 (90.9%) | 62 (9.1%) |
| Foreign Born, not a Citizen | 368 (89.5%) | 43 (10.5%) |
Health Insurance Coverage by Household Income in Fairfield
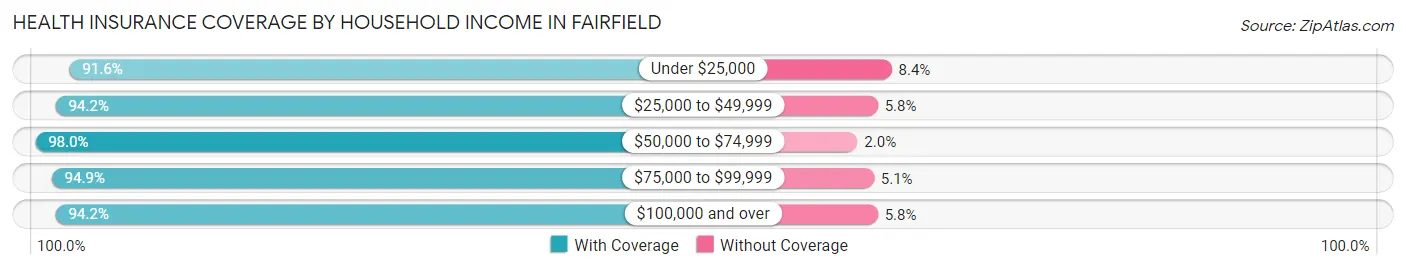
| Household Income | With Coverage | Without Coverage |
| Under $25,000 | 960 (91.6%) | 88 (8.4%) |
| $25,000 to $49,999 | 993 (94.2%) | 61 (5.8%) |
| $50,000 to $74,999 | 838 (98.0%) | 17 (2.0%) |
| $75,000 to $99,999 | 823 (94.9%) | 44 (5.1%) |
| $100,000 and over | 830 (94.2%) | 51 (5.8%) |
Public vs Private Health Insurance Coverage by Age in Fairfield
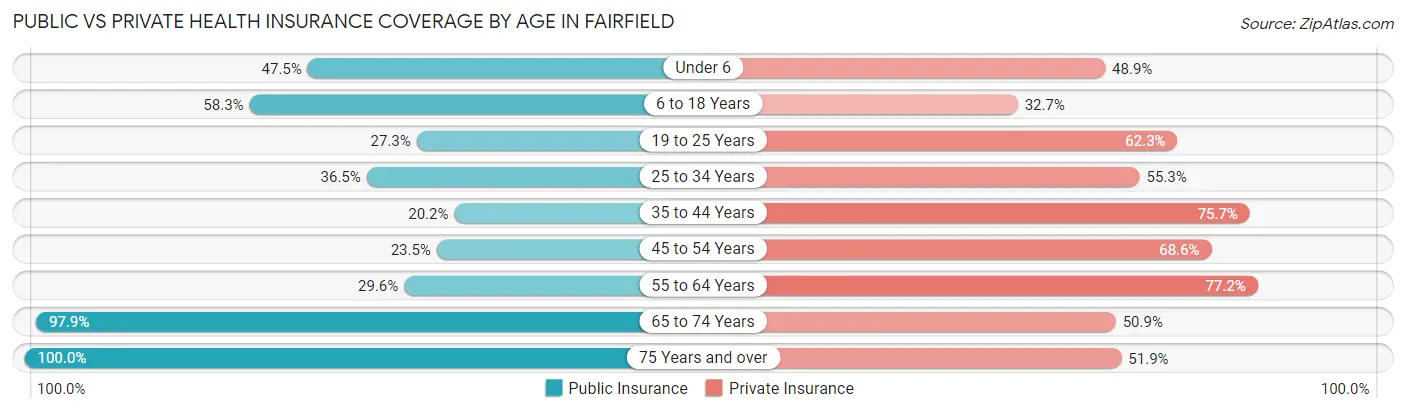
| Age Bracket | Public Insurance | Private Insurance |
| Under 6 | 169 (47.5%) | 174 (48.9%) |
| 6 to 18 Years | 398 (58.3%) | 223 (32.7%) |
| 19 to 25 Years | 112 (27.3%) | 256 (62.3%) |
| 25 to 34 Years | 187 (36.5%) | 283 (55.3%) |
| 35 to 44 Years | 100 (20.2%) | 374 (75.7%) |
| 45 to 54 Years | 134 (23.5%) | 391 (68.6%) |
| 55 to 64 Years | 193 (29.6%) | 504 (77.2%) |
| 65 to 74 Years | 462 (97.9%) | 240 (50.8%) |
| 75 Years and over | 578 (100.0%) | 300 (51.9%) |
| Total | 2,333 (49.3%) | 2,745 (58.1%) |
Disability Status by Sex by Age in Fairfield
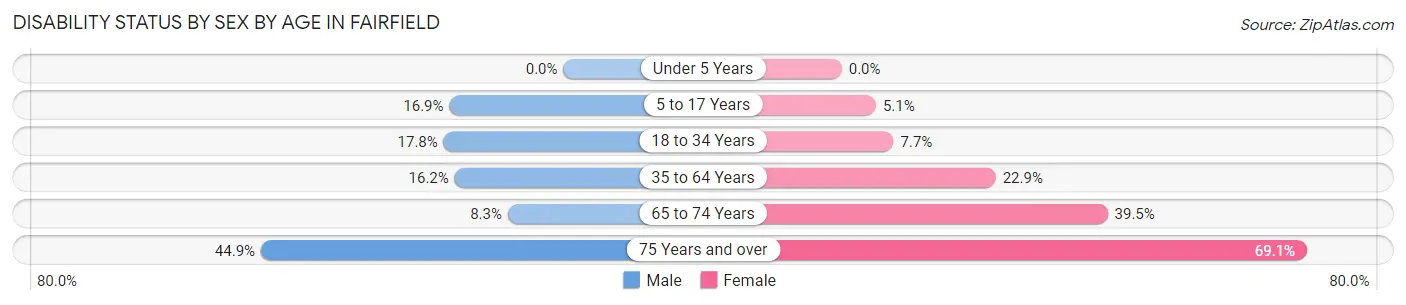
| Age Bracket | Male | Female |
| Under 5 Years | 0 (0.0%) | 0 (0.0%) |
| 5 to 17 Years | 54 (16.9%) | 14 (5.1%) |
| 18 to 34 Years | 112 (17.8%) | 32 (7.7%) |
| 35 to 64 Years | 136 (16.2%) | 200 (22.9%) |
| 65 to 74 Years | 17 (8.3%) | 105 (39.5%) |
| 75 Years and over | 97 (44.9%) | 250 (69.1%) |
Disability Class by Sex by Age in Fairfield
Disability Class: Hearing Difficulty
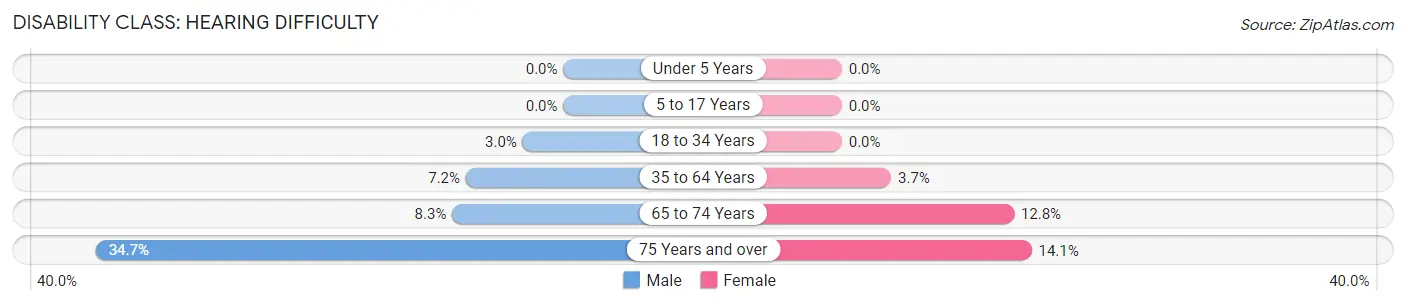
| Age Bracket | Male | Female |
| Under 5 Years | 0 (0.0%) | 0 (0.0%) |
| 5 to 17 Years | 0 (0.0%) | 0 (0.0%) |
| 18 to 34 Years | 19 (3.0%) | 0 (0.0%) |
| 35 to 64 Years | 61 (7.2%) | 32 (3.7%) |
| 65 to 74 Years | 17 (8.3%) | 34 (12.8%) |
| 75 Years and over | 75 (34.7%) | 51 (14.1%) |
Disability Class: Vision Difficulty
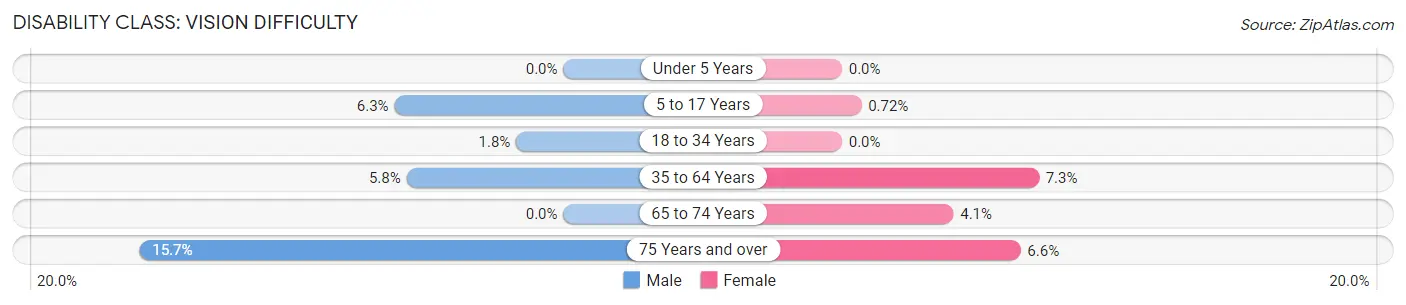
| Age Bracket | Male | Female |
| Under 5 Years | 0 (0.0%) | 0 (0.0%) |
| 5 to 17 Years | 20 (6.3%) | 2 (0.7%) |
| 18 to 34 Years | 11 (1.8%) | 0 (0.0%) |
| 35 to 64 Years | 49 (5.8%) | 64 (7.3%) |
| 65 to 74 Years | 0 (0.0%) | 11 (4.1%) |
| 75 Years and over | 34 (15.7%) | 24 (6.6%) |
Disability Class: Cognitive Difficulty
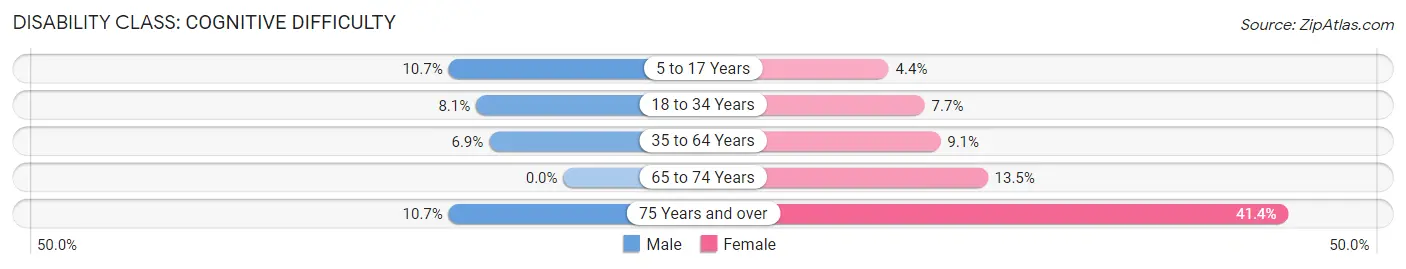
| Age Bracket | Male | Female |
| 5 to 17 Years | 34 (10.7%) | 12 (4.3%) |
| 18 to 34 Years | 51 (8.1%) | 32 (7.7%) |
| 35 to 64 Years | 58 (6.9%) | 80 (9.1%) |
| 65 to 74 Years | 0 (0.0%) | 36 (13.5%) |
| 75 Years and over | 23 (10.6%) | 150 (41.4%) |
Disability Class: Ambulatory Difficulty
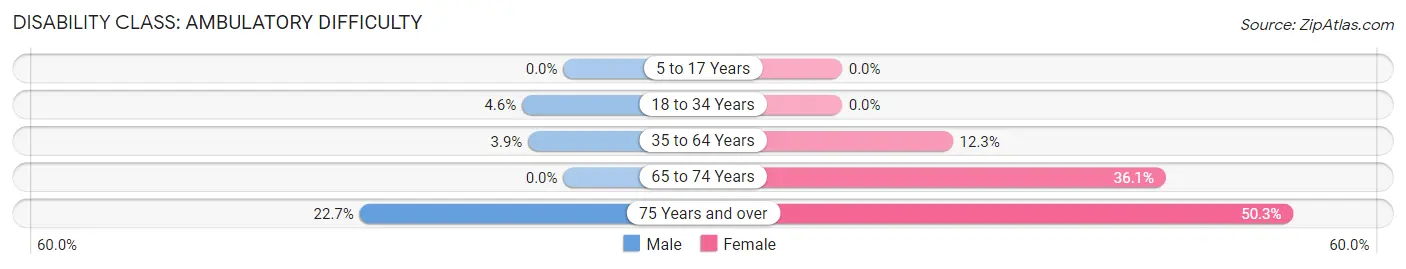
| Age Bracket | Male | Female |
| 5 to 17 Years | 0 (0.0%) | 0 (0.0%) |
| 18 to 34 Years | 29 (4.6%) | 0 (0.0%) |
| 35 to 64 Years | 33 (3.9%) | 108 (12.3%) |
| 65 to 74 Years | 0 (0.0%) | 96 (36.1%) |
| 75 Years and over | 49 (22.7%) | 182 (50.3%) |
Disability Class: Self-Care Difficulty
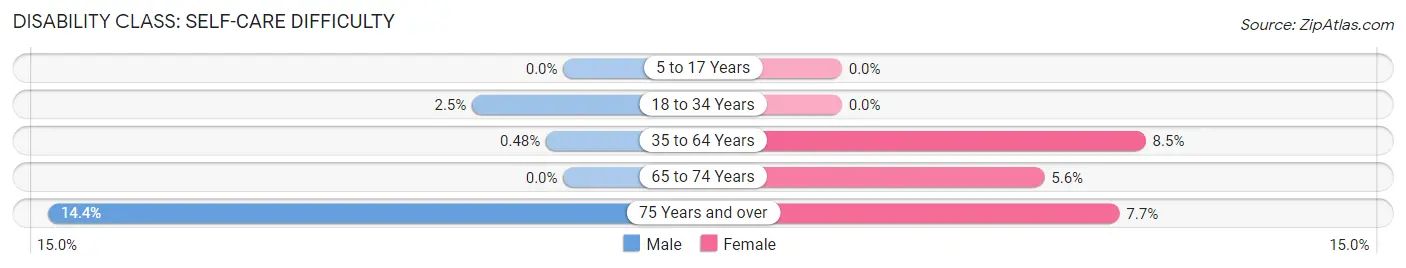
| Age Bracket | Male | Female |
| 5 to 17 Years | 0 (0.0%) | 0 (0.0%) |
| 18 to 34 Years | 16 (2.5%) | 0 (0.0%) |
| 35 to 64 Years | 4 (0.5%) | 74 (8.5%) |
| 65 to 74 Years | 0 (0.0%) | 15 (5.6%) |
| 75 Years and over | 31 (14.3%) | 28 (7.7%) |
Technology Access in Fairfield
Computing Device Access in Fairfield
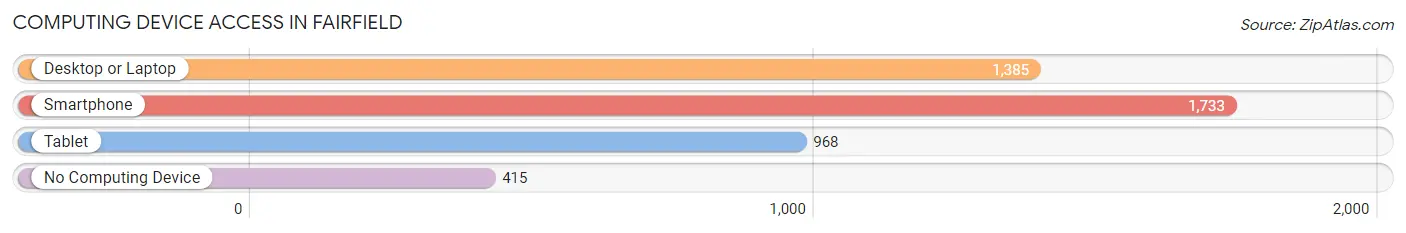
| Device Type | # Households | % Households |
| Desktop or Laptop | 1,385 | 59.7% |
| Smartphone | 1,733 | 74.7% |
| Tablet | 968 | 41.7% |
| No Computing Device | 415 | 17.9% |
| Total | 2,319 | 100.0% |
Internet Access in Fairfield
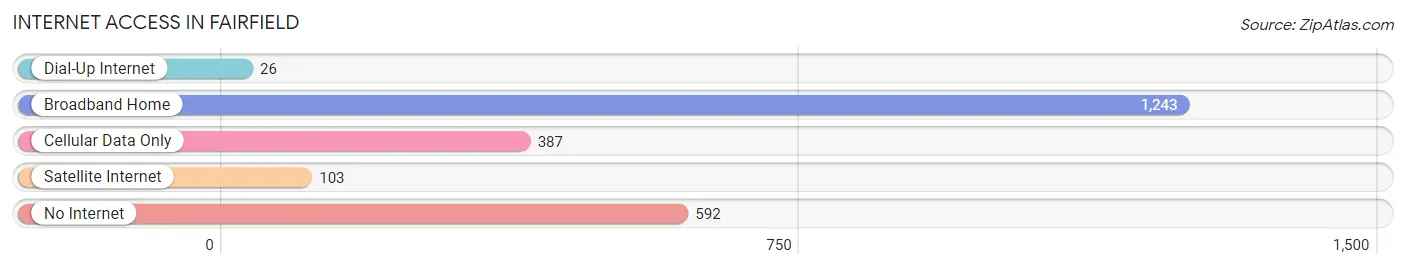
| Internet Type | # Households | % Households |
| Dial-Up Internet | 26 | 1.1% |
| Broadband Home | 1,243 | 53.6% |
| Cellular Data Only | 387 | 16.7% |
| Satellite Internet | 103 | 4.4% |
| No Internet | 592 | 25.5% |
| Total | 2,319 | 100.0% |
Fairfield Summary
Fairfield, Illinois is a small city located in Wayne County, Illinois. It is situated in the southeastern part of the state, about 80 miles east of St. Louis, Missouri. The city has a population of around 5,000 people and is the county seat of Wayne County.
History
Fairfield was founded in 1819 by a group of settlers from North Carolina. The town was named after Fairfield, North Carolina, the hometown of the settlers. The town was originally a farming community, but it soon became a center of commerce and industry. The first industry in Fairfield was a sawmill, which was built in 1820. The town also had a gristmill, a blacksmith shop, and a tannery.
In 1837, the Illinois Central Railroad was built through Fairfield, connecting the town to the rest of the state. This allowed the town to become a major shipping center for the surrounding area. The railroad also brought new businesses and industries to the town, including a brickyard, a flour mill, and a furniture factory.
In the late 19th century, Fairfield became a center of education. The town was home to several colleges, including the Fairfield Female Seminary, the Fairfield Normal School, and the Fairfield Academy. These schools provided educational opportunities for the town’s residents.
Geography
Fairfield is located in the southeastern part of Illinois, about 80 miles east of St. Louis, Missouri. The city is situated in the rolling hills of the Shawnee National Forest. The city is surrounded by farmland and is located near several small lakes and rivers.
The climate in Fairfield is humid continental, with hot summers and cold winters. The average temperature in the summer is around 80 degrees Fahrenheit, and the average temperature in the winter is around 30 degrees Fahrenheit.
Economy
The economy of Fairfield is largely based on agriculture and manufacturing. The town is home to several large farms, which produce corn, soybeans, and other crops. The town also has several manufacturing plants, which produce furniture, clothing, and other products.
The town is also home to several small businesses, including restaurants, shops, and other services. The town also has a small tourism industry, with several attractions, including the Fairfield Museum and the Fairfield Historical Society.
Demographics
As of the 2010 census, the population of Fairfield was 5,000 people. The racial makeup of the town was 95.3% White, 1.2% African American, 0.3% Native American, 0.7% Asian, 0.1% Pacific Islander, and 2.4% from other races. The median household income in Fairfield was $37,000, and the median family income was $45,000.
Conclusion
Fairfield, Illinois is a small city located in Wayne County, Illinois. It is situated in the southeastern part of the state, about 80 miles east of St. Louis, Missouri. The city has a population of around 5,000 people and is the county seat of Wayne County. The town was founded in 1819 by a group of settlers from North Carolina and has since become a center of commerce and industry. The economy of Fairfield is largely based on agriculture and manufacturing, and the town is home to several small businesses. The racial makeup of the town is 95.3% White, 1.2% African American, 0.3% Native American, 0.7% Asian, 0.1% Pacific Islander, and 2.4% from other races. The median household income in Fairfield was $37,000, and the median family income was $45,000.
Common Questions
What is Per Capita Income in Fairfield?
Per Capita income in Fairfield is $28,769.
What is the Median Family Income in Fairfield?
Median Family Income in Fairfield is $69,639.
What is the Median Household income in Fairfield?
Median Household Income in Fairfield is $43,681.
What is Income or Wage Gap in Fairfield?
Income or Wage Gap in Fairfield is 37.5%.
Women in Fairfield earn 62.5 cents for every dollar earned by a man.
What is Family Income Deficit in Fairfield?
Family Income Deficit in Fairfield is $10,809.
Families that are below poverty line in Fairfield earn $10,809 less on average than the poverty threshold level.
What is Inequality or Gini Index in Fairfield?
Inequality or Gini Index in Fairfield is 0.43.
What is the Total Population of Fairfield?
Total Population of Fairfield is 4,773.
What is the Total Male Population of Fairfield?
Total Male Population of Fairfield is 2,452.
What is the Total Female Population of Fairfield?
Total Female Population of Fairfield is 2,321.
What is the Ratio of Males per 100 Females in Fairfield?
There are 105.64 Males per 100 Females in Fairfield.
What is the Ratio of Females per 100 Males in Fairfield?
There are 94.66 Females per 100 Males in Fairfield.
What is the Median Population Age in Fairfield?
Median Population Age in Fairfield is 43.1 Years.
What is the Average Family Size in Fairfield
Average Family Size in Fairfield is 2.7 People.
What is the Average Household Size in Fairfield
Average Household Size in Fairfield is 2.0 People.
How Large is the Labor Force in Fairfield?
There are 2,213 People in the Labor Forcein in Fairfield.
What is the Percentage of People in the Labor Force in Fairfield?
56.4% of People are in the Labor Force in Fairfield.
What is the Unemployment Rate in Fairfield?
Unemployment Rate in Fairfield is 3.6%.